Embed Size (px)
Citation preview

Alcohol and Other Drug Module
For the Driver Education Model Program
Texas Education Agency

Table of Contents Alcohol and Other Drug Module
for the Driver Education Model Program
Topic 1 – Introduction, Nature of the Problem, and Pre-Test ……………………………………………pg. 1-1 Topic 2 – Texas Alcohol and Drug Laws……………………………………………………………………………..pg. 2-1 Topic 3 – Effects of Alcohol on Humans…………………………………………………………………………….pg. 3-1 Topic 4 – Alcohol Effects on Driving and Risk…………………………………………………………………….pg. 4-1 Topic 5 – Young People and Alcohol Abuse………………………………………………………………………pg. 5-1 Topic 6 – Drugs and Driving……………………………………………………………………………………………...pg. 6-1 Topic 7 – Ways to Deal with Alcohol and Drugs, Making Good Decisions, and Post-Test…..pg. 7-1

1-1
Topic 1
Introduction, Nature of the Problem, and Pre-Test
(35 Minutes)
Goal:
• To introduce the Alcohol and Other Drugs topic, describe
the nature of the problems related to young people, and
administer a pre-test to determine the level of knowledge
young people possess about alcohol, drugs, and traffic
safety.
Objectives:
• Become acquainted with all alcohol and drug topics which will be covered in the alcohol and drugs unit.
• Have young drivers identify alcohol, drug, and traffic safety problems which exist in Texas.
• Complete a pre-test to determine their level of pre-instruction knowledge.
• Become familiar with the student study guide.
Content and Student Learning Activities
1. History of Alcohol (PowerPoint 1-2)
Alcohol has been around since recorded history. Using
PowerPoint 1-2, the instructor should briefly explain the history
of alcohol.

1-2
Beer jugs have been found which date back to about 10,000 BC. Evidence of early use of alcohol has been
found in India, Persia, Egypt, China, and Greece, and in North and South America.
The alcohol content of beverages in earlier times was limited because it only occurred by fermentation. This
produced alcohol content of only 15 to 20%. When humans learned the process of distillation in about the
10th Century, beverages with much higher alcohol content (up to 95%) were able to be produced. Boiling a
mixture of alcohol and water allows more alcohol than water to turn into vapor, and this yields a higher
alcohol percentage.
2. Use and Misuse of Alcohol (PowerPoint 1-3)
The instructor should use PowerPoint 1-3 to help explain both
positive and negative uses of alcohol. Initially, only the heading
“Use and Misuse of Alcohol” should be shown. The instructor
should then ask the class for examples of any positive uses of
alcohol. After responses are received, the instructor should
show the positive examples on PowerPoint 1-3. The same procedure should be used for negative uses of
alcohol.
Up to about the 19th Century, beer and wine were the prime beverages humans drank. Water was often
contaminated and produced illness or even death. Wine was and still is used in many religious services.
Unfortunately, both then and now, alcoholic beverages are often misused. Ways alcohol has been misused
(abused) include:

1-3
• To achieve a “high”
• To become intoxicated
• To forget problems
3. Nature of the Problem (PowerPoint 1-4)
While this section makes use of some numbers and statistics, it
is not important that students commit all of them to memory.
They are only used to illustrate the nature of the problem.
Problems in the United States
The instructor should use PowerPoint 1-4 to briefly explain alcohol-related traffic safety problems in the
United States.
Basic data shows:
• More than 3 young people die each day in intoxicated drinking crashes.
• More than 1/3 of drivers between 15 and 20 who die in motor vehicle crashes had alcohol in their
system, and 28% of them were over .08.
• Young male drivers are more likely to be involved in a fatal alcohol-related crash than young female
drivers (27% to 15%) (NHTSA – FARS, 2012).
• At all BAC’s, young people are at a greater risk of being in a fatal crash than older people (Zador,
2000).
• People who begin to drink before age 15 are much more likely to become alcoholics (four times)
than those who wait to drink at age 21, and the risk of alcoholism is decreased by 14% each year a
person waits to begin drinking (Grant and Dawson, 1998).
1-4
Problems in Texas
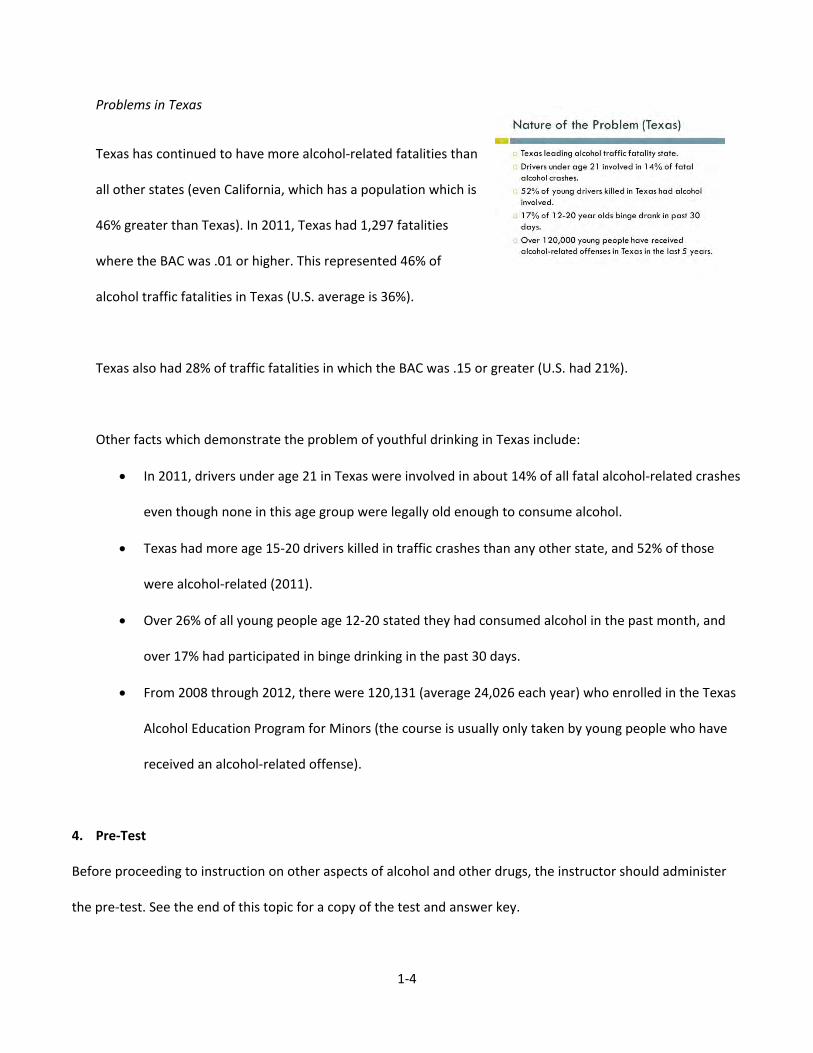
Texas has continued to have more alcohol-related fatalities than
all other states (even California, which has a population which is
46% greater than Texas). In 2011, Texas had 1,297 fatalities
where the BAC was .01 or higher. This represented 46% of
alcohol traffic fatalities in Texas (U.S. average is 36%).
Texas also had 28% of traffic fatalities in which the BAC was .15 or greater (U.S. had 21%).
Other facts which demonstrate the problem of youthful drinking in Texas include:
• In 2011, drivers under age 21 in Texas were involved in about 14% of all fatal alcohol-related crashes
even though none in this age group were legally old enough to consume alcohol.
• Texas had more age 15-20 drivers killed in traffic crashes than any other state, and 52% of those
were alcohol-related (2011).
• Over 26% of all young people age 12-20 stated they had consumed alcohol in the past month, and
over 17% had participated in binge drinking in the past 30 days.
• From 2008 through 2012, there were 120,131 (average 24,026 each year) who enrolled in the Texas
Alcohol Education Program for Minors (the course is usually only taken by young people who have
received an alcohol-related offense).
4. Pre-Test
Before proceeding to instruction on other aspects of alcohol and other drugs, the instructor should administer
the pre-test. See the end of this topic for a copy of the test and answer key.

1-5
Summary
Problems related to alcohol have intensified over time because of the introduction of motor vehicles and the
relative ease with which alcohol can be obtained by people of all ages. The remaining topics address information
which can help young people understand laws, effects of alcohol on humans and driving, and means of dealing
with problems.

1-6
Pre-Test
Name: ______________________________________________ Date: _____________________
True/False – If any part of the statement is false, the entire statement is false.
______1.) Fermentation of grape juice can produce an alcoholic beverage which is up to 50% alcohol.
______2.) There are no positive uses of alcohol.
______3.) Young male drivers are more likely to be in a fatal alcohol-related crash than young females.
______4.) Texas ranks third in the number of alcohol-related fatal traffic crashes.
______5.) One definition of intoxication in Texas is any loss of mental or physical faculties.
______6.) In Texas, persons under 21 can receive a DUI but not a DWI charge.
______7.) ALR relates to failing a breath or blood test.
______8.) A person under age 21 can lose his/her driver’s license if he/she purchases alcohol.
______9.) Public intoxication penalties are the same for persons under and over 21 in Texas.
______10.) One 12 oz. can of regular beer has more pure alcohol than a 1 oz. shot of 80-proof whiskey.
______11.) If a man and woman of equal weight drank the same alcoholic beverage, the woman’s BAC typically would be higher.
______12.) Drinking beer and whiskey together can produce a synergistic effect.
______13.) The majority of alcohol removed from the body is by breath, sweat, and urination.

1-7
______14.) All persons remove alcohol at the rate of 1 drink per hour.
______15.) Very little driving loss occurs until a BAC of .08 is reached.
______16.) The risk of a fatal traffic crash is related to the BAC reached.
______17.) Alcohol is rarely involved in non-traffic accidents.
______18.) Any use of alcohol by persons under 21 in Texas is considered alcohol abuse.
______19.) Thinking you might have a problem with alcohol is a sign of alcoholism.
______20.) Marijuana tends to produce slower driving speeds.
______21.) Barbiturate drugs are depressants.
______22.) Inhalants tend to have shorter duration of effects.
______23.) Drugs can affect driver attention.
______24.) Ignition interlock devices on all vehicles would prevent all cases of alcohol impaired driving.
______25.) Higher prices for alcohol reduce alcohol consumption.

1-8
Pre-Test Key
Name: ______________________________________________ Date: _____________________
True/False – If any part of the statement is false, the entire statement is false.
F 1.) Fermentation of grape juice can produce an alcoholic beverage which is up to 50% alcohol.
F 2.) There are no positive uses of alcohol.
T 3.) Young male drivers are more likely to be in a fatal alcohol-related crash than young females.
F 4.) Texas ranks third in the number of alcohol-related fatal traffic crashes.
F 5.) One definition of intoxication in Texas is any loss of mental or physical faculties.
F 6.) In Texas, persons under 21 can receive a DUI but not a DWI charge.
T 7.) ALR relates to failing a breath or blood test.
T 8.) A person under age 21 can lose his/her driver’s license if he/she purchases alcohol.
F 9.) Public intoxication penalties are the same for persons under and over 21 in Texas.
T 10.) One 12 oz. can of regular beer has more pure alcohol than a 1 oz. shot of 80-proof whiskey.
T 11.) If a man and woman of equal weight drank the same alcoholic beverage, the woman’s BAC typically would be higher.
F 12.) Drinking beer and whiskey together can produce a synergistic effect.
F 13.) The majority of alcohol removed from the body is by breath, sweat, and urination.

1-9
F 14.) All persons remove alcohol at the rate of 1 drink per hour.
F 15.) Very little driving loss occurs until a BAC of .08 is reached.
T 16.) The risk of a fatal traffic crash is related to the BAC reached.
F 17.) Alcohol is rarely involved in non-traffic accidents.
T 18.) Any use of alcohol by persons under 21 in Texas is considered alcohol abuse.
T 19.) Thinking you might have a problem with alcohol is a sign of alcoholism.
T 20.) Marijuana tends to produce slower driving speeds.
T 21.) Barbiturate drugs are depressants.
F 22.) Inhalants tend to have shorter duration of effects.
T 23.) Drugs can affect driver attention.
F 24.) Ignition interlock devices on all vehicles would prevent all cases of alcohol impaired driving.
T 25.) Higher prices for alcohol reduce alcohol consumption.

2-1
Topic 2
Texas Alcohol and Drug Laws
(50 Minutes)
Goal: To have students learn and understand Texas laws related to
alcohol and drugs
Objectives:
• Recognize the difference in “law” and “procedure”
• Learn alcohol and drug law basics and penalties
• Understand how violation of alcohol and drug laws by young people can have severe consequences
beyond legal penalties
Content and Student-Learning Activities
1. Law vs. Procedure
Using PowerPoint 2-2, the instructor should explain the
difference in “law” and “procedure.” Law is statutes passed
by Texas Legislature and enacted. They are contained in the
Texas Traffic Law publications. Procedure is the way police
agencies and courts apply law. This could greatly differ from county to county or city to city.
This unit will focus primarily on “laws” with some reference to procedure.
Note: It is very helpful for the instructor to have a current copy of the Texas Criminal and Traffic Law
Manual to answer any questions which arise.

2-2
2. Definition of Intoxication – (P.C. 49.04)
Using PowerPoint 2-3, the instructor should illustrate that in
Texas, there are two parts to this definition:
A. Having an alcohol concentration of .08% or more.
How should the per se illegal BAC be determined?
• Crash Data – An examination should be made of the BAC levels at which crashes become
more likely, and the illegal level should be set at or below this level.
• Experiments – Research having drivers operate vehicles at varying BACs should be done
to determine the level at which driving ability losses occur.
B. Not having normal use of mental or physical faculties by reason of the introduction of alcohol, a
controlled substance, a drug, a dangerous drug, a combination of two or more of those
substances or any other substance into the body.
The instructor should stress that there are many reasons why a person might not have “normal” use of
mental or physical faculties. The class should be asked for examples. These include:
• Mental – Brain damage, Alzheimer’s Disease, concussions
• Physical – Fatigue, disability, broken limbs
The state must prove the loss was because of alcohol or other
drugs. The instructor should use PowerPoint 2-4 to explain
the types of drugs to which the intoxication definition applies.
The correct answer is “all of the above.” The legality of the
drug is not the issue but rather the effect of the drug.

2-3
3. Driving While Intoxicated
The instructor should use PowerPoint 2-5 to explain that an
individual commits this offense if he/she operates a motor
vehicle in a public place while intoxicated.
• Operate – To drive or be in actual
physical control of a motor vehicle or watercraft [TRC 724.001(8)].
o This usually means behind the wheel while the vehicle is going down the
road. On some occasions, it could apply if the keys were in the driver’s
pocket while he or she was sitting in the vehicle.
• Motor Vehicle – A device in, on, or by which a person or property is or may be
transported or drawn on a highway, except a device used exclusively on stationary
rails or tracks [P.C. 32.34(a)].
o This wording eliminates trains and trollies or other railed vehicles. It could
include a bicycle, however, as the wording says a “device,” not a
“motorized” device.
o An example of a procedure, however, is that a person is likely to be charged
with public intoxication rather than DWI if operating a bicycle.
• Public Place – Any place to which the public or a substantial group of the public has
access and includes, but is not limited to, streets, highways, and the common areas
of schools, hospitals, apartment houses, office buildings, transport facilities, and
shops [P.C. 1.07(a)(40)].
o The instructor should note that the DWI does not have to occur on a street
or highway but could be on a mall parking lot.

2-4
The instructor should use PowerPoint 2-6 to explain the DWI
penalties for minors. It should be noted that age makes a
difference and the penalties are even greater when a person
21 and over is convicted of DWI.
4. Flying or Boating While Intoxicated
A. Flying While Intoxicated [P.C. 49.05] – While it would
seem that no one would attempt to fly an airplane in
an impaired condition, unfortunately, this occurs on
occasion. The instructor should use PowerPoint 2-7 to
explain the penalties for flying while intoxicated.
B. Boating While Intoxicated [P.C. 49.06] – Texas has
many rivers and lakes as well as a large Gulf of Mexico
coastline. Water sports are very popular and many
boaters use alcohol while on the water. Up to 50% of
boating accidents have been shown to involve alcohol.
Using PowerPoint 2-8, the instructor should explain
boating while intoxicated penalties.
5. Driving or Operating Watercraft Under the Influence of
Alcohol by a Minor [ABC 206.041)
It is illegal for a minor (person under age 21) to operate a
motor vehicle or a watercraft if the young person has any
detectable amount of alcohol in their system: “detectable” can
mean smelling alcohol on the minor’s breath or from a breath or blood test.

2-5
The penalties for this offense are:
Offense Fine Community Service Education Jail
1st Up to $500 20-40 hours Required None
2nd Up to $500 40-60 hours Judge’s option None
3rd or more $500-$2,000 40-60 hours Judge’s option Up to 180 days
Deferred Disposition is conviction for enhancement. No Deferred Disposition on 3rd or more.
The instructor should explain that deferred disposition means that the judge has not found the young
person guilty. It should be noted, however, that deferred disposition is a conviction for enhancement. If
there have been three or more offenses, the young person is not eligible for this option.
The instructor should be sure to point out that this charge is much easier to make than a DWI charge, as
there does not have to be any evidence of intoxication, only that the minor has a detectable amount of
alcohol.
6. Intoxication Assault and Intoxication Manslaughter
These are offenses which are even more serious than DWI or DUI.
Using PowerPoint 2-10 and 2-11, the instructor should explain
the nature of the offense and penalties for each.
A. Intoxication Assault [P.C. 49.07] – This stature involves
causing serious injury to someone, either by accident or mistake. It applies to not only motor
vehicles, but to aircraft, watercraft, and amusement rides. The penalty for the offense is:
• 2-10 years in jail and
• Up to $10,000 in fines

2-6
B. Intoxication Manslaughter [P.C. 49.08] – This law
addresses an even more serious offense (killing
someone while in an intoxicated condition). If because
being intoxicated a person causes the death of another
person while operating a motor vehicle in a public
place, an aircraft or watercraft, or while operating or assembling an amusement ride either by
mistake or accident, severe penalties result:
• 2-20 years in jail and
• Up to $10,000 in fines
7. DWI with a Child Passenger [P.C. 49.045]
While it would seem that no one would risk a child passenger’s life
by operating a motor vehicle while intoxicated, this unfortunately
happens. This statute only says “a person” commits an offense
and does not mention age. Thus, a teenager could be charged
with this offense the same as an adult: the statute requires that the passenger be younger than age 15.
Using PowerPoint 2-12 the wording and penalty for the offense should be explained.
8. Possession of Alcoholic Beverage in a Motor Vehicle [P.C.
49.031]
This law relates to the knowing possession of an “open”
container of alcohol in a motor vehicle. The definition of
“open” is:

2-7
• Containers (bottle, can, or other receptacle) contain any amount of an alcoholic
beverage and
• The container is open, has been opened, has a broken seal, or the contents have
been partially removed.
Open containers are allowed in a vehicle if the container is:
• In a glove compartment or similar container which is locked
• In the trunk of a vehicle
• Behind the last upright seat of a vehicle not having a trunk
Persons may have open containers if the vehicle is for hire or in the living quarters of a motor home.
Note: These exceptions do not apply to minors.
The offense has to occur on a public highway. “Public highway” means the entire width between and
immediately adjacent to the boundary lines of any public road, street, highway, interstate, or other
publicly maintained way if any part is open for public use for the purpose of motor vehicle travel. The
term includes the right-of-way of a public highway.
This is not normally a detainable offense unless the offender does not have a written promise to appear
before a magistrate.
9. Administrative License Revocation and Implied Consent
These two laws are designed to remove licenses of DWI and
DUI offenders more quickly than would result from a DWI/DUI
conviction.
2-8
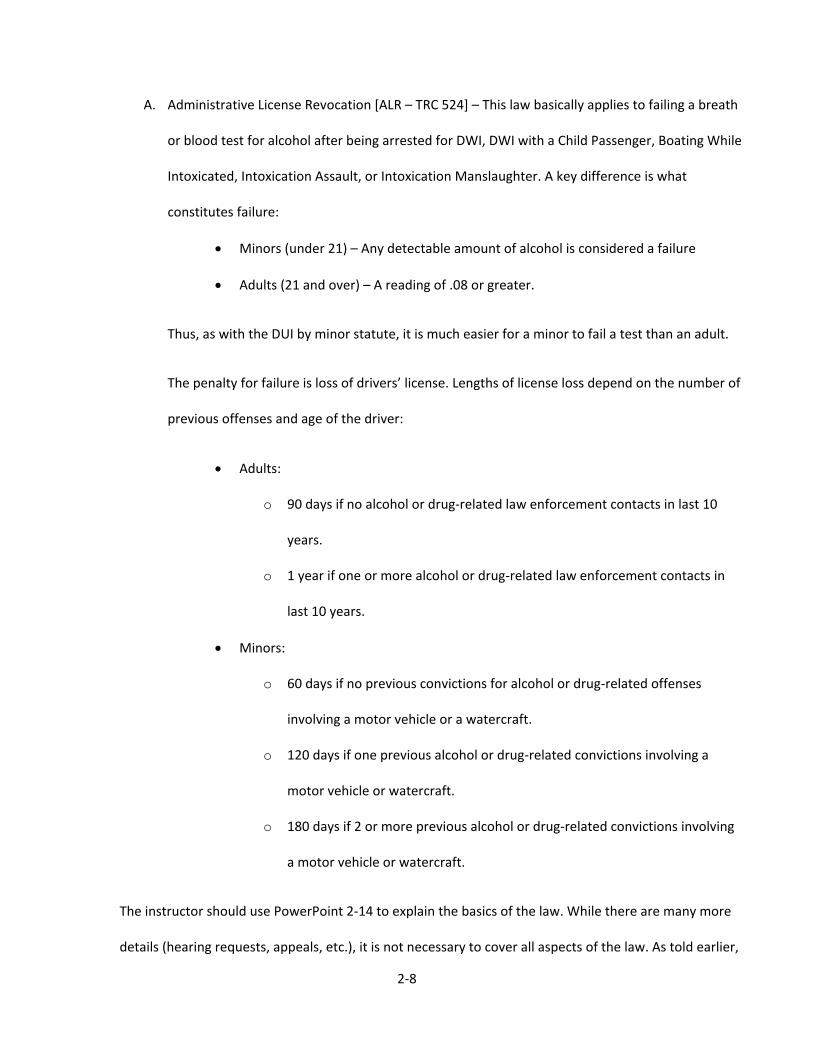
A. Administrative License Revocation [ALR – TRC 524] – This law basically applies to failing a breath
or blood test for alcohol after being arrested for DWI, DWI with a Child Passenger, Boating While
Intoxicated, Intoxication Assault, or Intoxication Manslaughter. A key difference is what
constitutes failure:
• Minors (under 21) – Any detectable amount of alcohol is considered a failure
• Adults (21 and over) – A reading of .08 or greater.
Thus, as with the DUI by minor statute, it is much easier for a minor to fail a test than an adult.
The penalty for failure is loss of drivers’ license. Lengths of license loss depend on the number of
previous offenses and age of the driver:
• Adults:
o 90 days if no alcohol or drug-related law enforcement contacts in last 10
years.
o 1 year if one or more alcohol or drug-related law enforcement contacts in
last 10 years.
• Minors:
o 60 days if no previous convictions for alcohol or drug-related offenses
involving a motor vehicle or a watercraft.
o 120 days if one previous alcohol or drug-related convictions involving a
motor vehicle or watercraft.
o 180 days if 2 or more previous alcohol or drug-related convictions involving
a motor vehicle or watercraft.
The instructor should use PowerPoint 2-14 to explain the basics of the law. While there are many more
details (hearing requests, appeals, etc.), it is not necessary to cover all aspects of the law. As told earlier,
2-9
it is very helpful for the instructor to have a copy of a current TX Criminal and Traffic Law Manual should
more detail be needed.
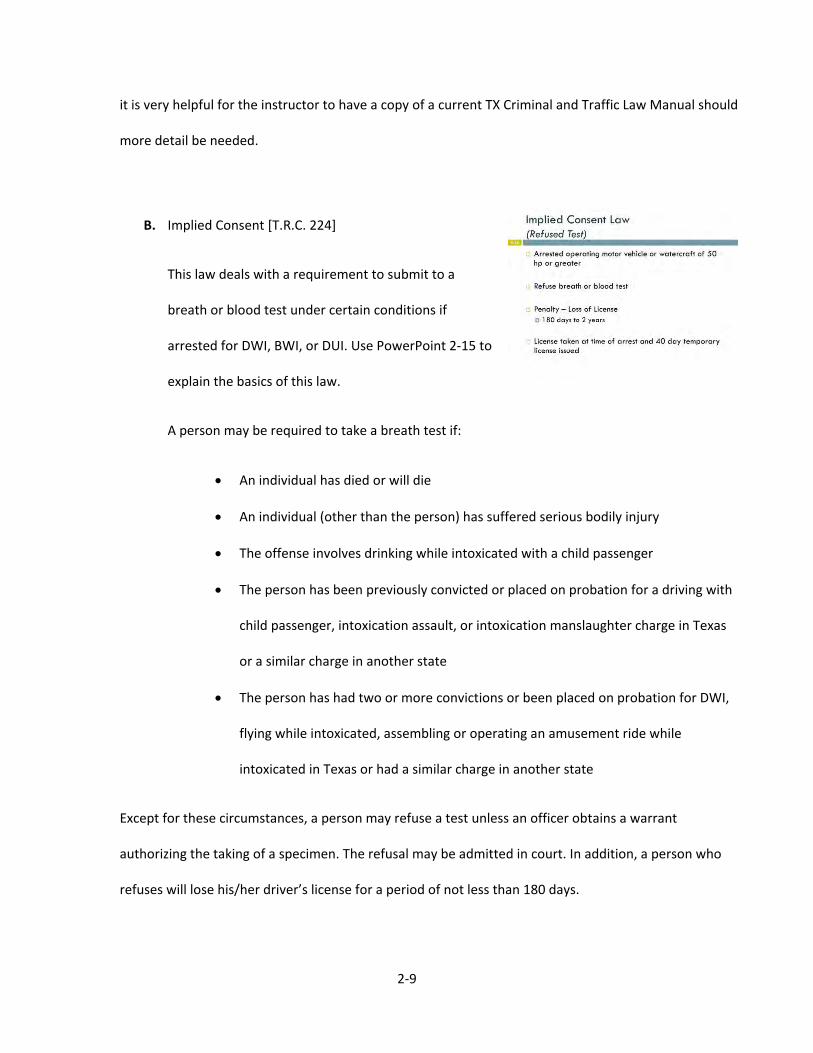
B. Implied Consent [T.R.C. 224]
This law deals with a requirement to submit to a
breath or blood test under certain conditions if
arrested for DWI, BWI, or DUI. Use PowerPoint 2-15 to
explain the basics of this law.
A person may be required to take a breath test if:
• An individual has died or will die
• An individual (other than the person) has suffered serious bodily injury
• The offense involves drinking while intoxicated with a child passenger
• The person has been previously convicted or placed on probation for a driving with
child passenger, intoxication assault, or intoxication manslaughter charge in Texas
or a similar charge in another state
• The person has had two or more convictions or been placed on probation for DWI,
flying while intoxicated, assembling or operating an amusement ride while
intoxicated in Texas or had a similar charge in another state
Except for these circumstances, a person may refuse a test unless an officer obtains a warrant
authorizing the taking of a specimen. The refusal may be admitted in court. In addition, a person who
refuses will lose his/her driver’s license for a period of not less than 180 days.
2-10
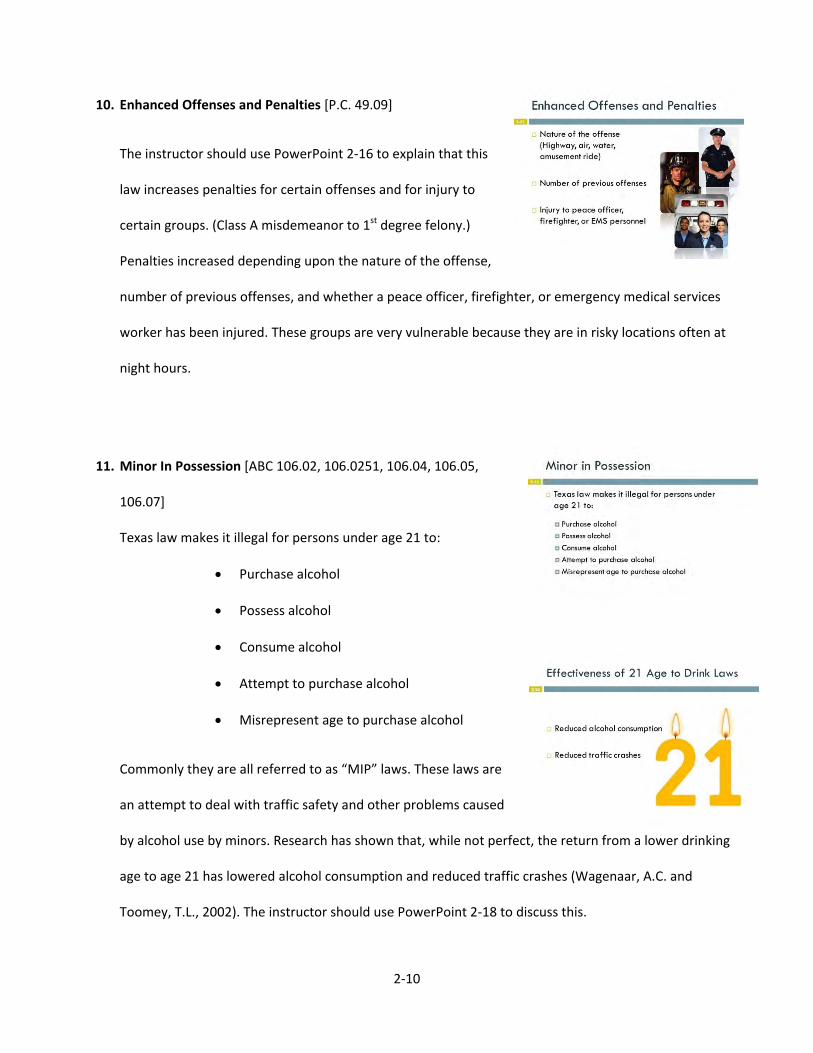
10. Enhanced Offenses and Penalties [P.C. 49.09]
The instructor should use PowerPoint 2-16 to explain that this
law increases penalties for certain offenses and for injury to
certain groups. (Class A misdemeanor to 1st degree felony.)
Penalties increased depending upon the nature of the offense,
number of previous offenses, and whether a peace officer, firefighter, or emergency medical services
worker has been injured. These groups are very vulnerable because they are in risky locations often at
night hours.
11. Minor In Possession [ABC 106.02, 106.0251, 106.04, 106.05,
106.07]
Texas law makes it illegal for persons under age 21 to:
• Purchase alcohol
• Possess alcohol
• Consume alcohol
• Attempt to purchase alcohol
• Misrepresent age to purchase alcohol
Commonly they are all referred to as “MIP” laws. These laws are
an attempt to deal with traffic safety and other problems caused
by alcohol use by minors. Research has shown that, while not perfect, the return from a lower drinking
age to age 21 has lowered alcohol consumption and reduced traffic crashes (Wagenaar, A.C. and
Toomey, T.L., 2002). The instructor should use PowerPoint 2-18 to discuss this.

2-11
Penalties for MIP offenses are:
• Loss of driver’s license
• Community service
• Fines
• Jail
• Education
The instructor should use PowerPoint 2-19 to outline the various penalties.
Using PowerPoint 2-20, the instructor should also point out that there are non-legal problems for MIP
offenses. These include:
• Difficulty in getting a scholarship
• Difficulty being accepted into the military
• Difficulty being accepted into college or
graduate school
• Job application problems
12. Improper License Use [ABC TRC 521.451]
There are several ways a person can improperly use a Texas
driver license. While any age driver can do this, minors are
more likely to be involved in improper license use. Using
PowerPoint 2-21, the instructor should explain these ways and
the penalties involved.
2-12
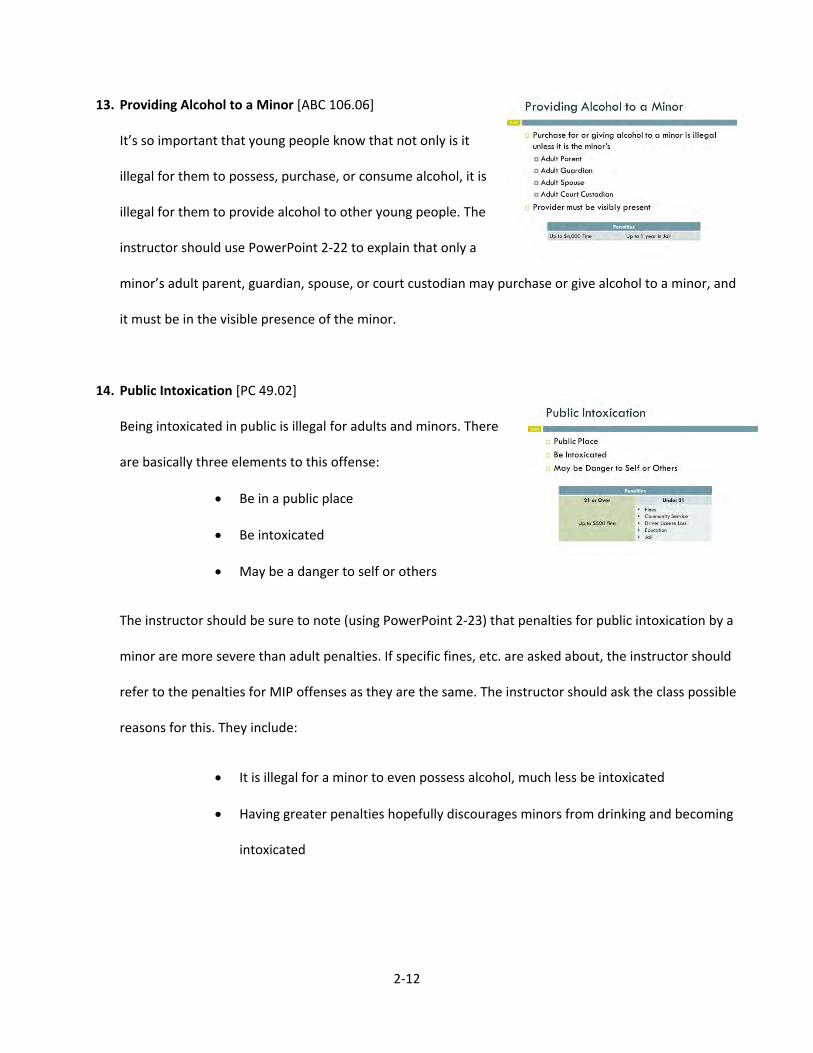
13. Providing Alcohol to a Minor [ABC 106.06]
It’s so important that young people know that not only is it
illegal for them to possess, purchase, or consume alcohol, it is
illegal for them to provide alcohol to other young people. The
instructor should use PowerPoint 2-22 to explain that only a
minor’s adult parent, guardian, spouse, or court custodian may purchase or give alcohol to a minor, and
it must be in the visible presence of the minor.
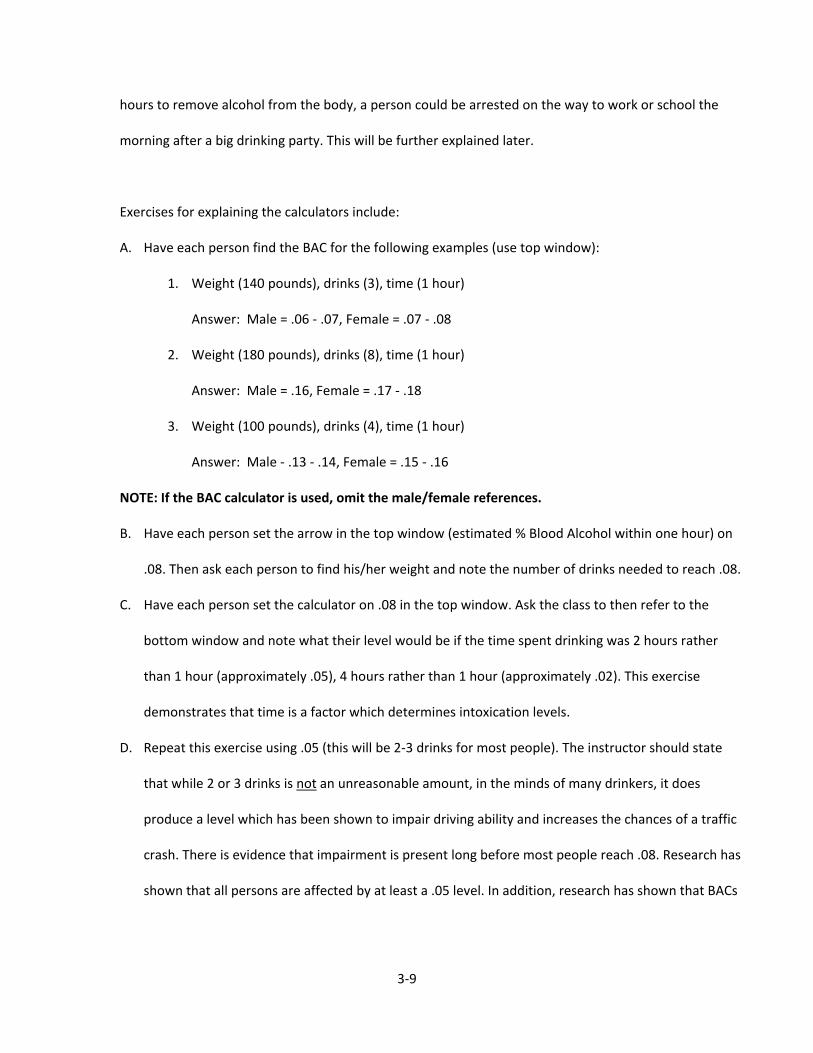
14. Public Intoxication [PC 49.02]
Being intoxicated in public is illegal for adults and minors. There
are basically three elements to this offense:
• Be in a public place
• Be intoxicated
• May be a danger to self or others
The instructor should be sure to note (using PowerPoint 2-23) that penalties for public intoxication by a
minor are more severe than adult penalties. If specific fines, etc. are asked about, the instructor should
refer to the penalties for MIP offenses as they are the same. The instructor should ask the class possible
reasons for this. They include:
• It is illegal for a minor to even possess alcohol, much less be intoxicated
• Having greater penalties hopefully discourages minors from drinking and becoming
intoxicated

2-13
Summary
What it is not vital that students memorize all Texas alcohol-traffic safety laws, it is important that they have a
basic understanding of these laws.

3-1
Topic 3
Effects of Alcohol on Humans
(50 Minutes)
Goal: To have students gain knowledge about the effects of alcohol on
humans
Objectives:
• Learn factors which affect Blood Alcohol Concentration (BAC)
• Understand how alcohol affects the brain
• Understand how alcohol affects vision
• Learn why alcohol affects people differently
• Determine the amount of pure alcohol in various beverages
• Describe alcohol elimination
Content and Student-Learning Activities
1. Ways the Word “Drink” Means “Drink Alcohol” – Using
PowerPoint 3-2, the instructor should ask the class to give a
sentence using the word “drink” (without naming a type of
alcohol drink – beer, whiskey, wine, etc.) which all other class
members will know means an alcohol drink. For example –
“Let’s go out for a drink.”

3-2
After eliciting several answers, show the items on PowerPoint 3-2. The purpose of this exercise is to
demonstrate how the word “drink” oftentimes means drink an alcoholic beverage and then show the
great use of alcohol in Texas and the U.S.
2. True-False Quiz on Alcohol Effects – To help show that many
young people do not know as much about alcohol as they need
to, the instructor should use the material herein and
PowerPoint 3-3 to explain true and false beliefs about alcohol.
A. Alcohol gives a person energy.
False. Since alcohol is a depressant, it does not provide energy but may provide a false sense of
elation.
B. Food before drinking prevents intoxication.
False. Food may slow alcohol absorption some, but enough alcohol produces intoxication
regardless of the amount of food eaten.
C. A 12 oz can of beer has more pure alcohol than a 1 oz shot of whiskey.
True. This will be demonstrated in a later exercise in this topic.
D. Letting an intoxicated person “sleep it off” is a good procedure.
False. The person may have consumed enough alcohol to be fatal.
E. Sobering up can be done in 1-2 hours.
False. Since “sober” means zero alcohol in the body, a great number of hours may be needed.
F. Learning to drink at an early age can help prevent future problems.
False. The opposite is true, and this will be covered in detail in the later topic on alcohol abuse.

3-3
3. Blood Alcohol Concentration Factors
Intoxication is caused by having sufficient alcohol in the blood
stream to impair brain and other body functions: alcohol is not
digested as other foods are, but goes into the blood in an
undigested state. Blood alcohol concentration or BAC is a ratio
between the amount of alcohol and the amount of blood and is expressed in several ways, with the
most common being percent of alcohol to blood. Be sure to point out that the “C” in BAC is not
“content.” The illegal level, previously covered, of .08 means 8 drops of pure alcohol in 9,992 drops of
blood. (8 parts per 10,000.) BAC can be determined by blood or breath tests.
Using PowerPoint 3-4, the instructor should cover factors which cause BAC.
A. Size of the Drink – Larger drinks of the same strengths have more alcohol in them than smaller
drinks. For example, beer is sold in a variety of sizes (7, 8, 12, 16, 20, 24, 32, 40 oz.)
B. Food – Food may slow absorption of alcohol somewhat, but it will not prevent it from going into
the blood stream.
C. Gender – Males have a higher concentration of an enzyme that allows them to break down
alcohol more effectively than a woman. Also, alcohol is water-soluble, and women tend to have
a higher percentage of body fat, which does not absorb alcohol and thus results in a higher
blood alcohol concentration. An additional factor is hormone differences. Research suggests
that the menstrual cycle and the use of any medication containing estrogen may influence the
liver’s ability to metabolize alcohol.

3-4
D. Body Weight – Larger people have more blood and water than smaller people. This produces a
lower BAC on the same amount of alcohol. Using PowerPoint 3-5, an example of 2 cups of coffee
can demonstrate the concept.
• Cup A = 6 oz. of coffee
• Cup B = 12 oz. of coffee
If one teaspoon of sugar is put into each cup and
stirred up, which will taste sweeter? (6 oz. cup, as
the ratio between sugar and coffee is higher in the smaller cup.)
E. Drinking Duration – The amount of time spent drinking can be either a helpful or harmful factor.
The longer the amount of time a person drinks gives the liver more time to process the alcohol.
On the other hand, however, a longer drinking period can result in drinking more alcohol.
Therefore, drinking time is only beneficial if the amount consumed is unchanged.
F. Alcohol Content of the Drink – While many publications
make the claim that all standard drinks have the same
pure alcohol content, this is a dangerous generalization.
Using PowerPoint 3-6, the instructor should explain the
two factors needed to determine the exact amount of
pure alcohol in a beverage.
• Total beverage size in ounces
• Percentage of alcohol in the beverage
This concept is explained in more detail in the next section.

3-5
4. Do All Alcoholic Beverages Have the Same Amount of Pure
Alcohol – Using the two factors shown previously on PowerPoint
3-6, the instructor should display PowerPoint 3-7 to
demonstrate the alcohol content in various beverages.
There are three possible procedures the instructor can use to
teach this concept.
A. Provide the class with the information herein and have them complete the amounts of pure
alcohol.
Information needed to do this is:
• Regular Beer 12 oz. and 4.8% (.576 = .58 oz. pure alcohol)
• Wine 4 oz. and 12% (.48 oz. pure alcohol)
• Wine Cooler 12 oz. and 5% (.60 oz. pure alcohol)
• 80-proof Whiskey 1 oz. and 40% (.40 oz. pure alcohol)
(NOTE: Explain that “proof” means double the percentage of alcohol. Thus, 80 must be divided
by 2 = 40%)
• Margarita:
o Tequila 1.5 oz. and 40% = (60 oz. pure alcohol)
o Triple Sec. .50 oz. and 25% = .125 oz. (.13 oz. pure alcohol)
.60 oz. + .13 oz. = .73 oz. pure alcohol
After students have worked all the examples, ask them which has the most pure alcohol. While the
differences mathematically seem small, the percentage differences can be great.

3-6
For example, the 12 oz. beer has 45% more pure alcohol than does the 1 oz. whiskey.
(.58 - .40 = .18oz; .18oz / .4oz = 45%)
The margarita is 26% stronger than the beer and 83% stronger than the 1 oz. shot of whiskey.
• Beer to Margarita (.73 - .58 / .58 = Margarita is 26% stronger than the beer.)
• Whiskey to Margarita (.73 - .40 / .40 = Margarita is 83% stronger than the whiskey.)
This process can be done to compare any type of alcoholic beverage.
B. If the instructor feels the class lacks the math skills to do the computations in exercise A, use
PowerPoint 3-7 to explain the process.
C. The instructor may wish to do both exercise A and B if it is felt this will help students to better
grasp the concepts.
5. Blood Alcohol Concentration Effects – Much research has been
conducted to determine typical effects on humans of various
BACs. A table produced by the National Highway Traffic Safety
Administration (The ABC’s of BAC: A Guide to Understanding
Blood Alcohol Concentrations) is an excellent tool. The
instructor should use PowerPoint 3-8 to briefly cover these effects.
Later in this topic, students will learn the amount of alcohol needed to achieve these BAC’s, and the
instructor may wish to reuse PowerPoint 3-8 at that time.

3-7
6. Alcohol Effects Upon Young People – There are a number of
negative effects of alcohol on young people which occur as
teenagers and later in life. These include:
• Poorer Performance in School
• Depression
• Social Interaction Problems
• Sleep Difficulty
• Problems Later in Life (job, education, money, marriage)
Use PowerPoint 3-9 to explain these points.
7. Fatigue and Alcohol – Alcohol has a depressant effect which can
be enhanced if a person is tired (mentally or physically). If a
person is fatigued and consumes alcohol, two things are slowing
the person down. Alcohol puts a significant strain on the central
nervous system and this causes general fatigue and tiredness
which is compounded by lack of sleep.
The instructor should use PowerPoint 3-10 to explain this concept.
8. Synergistic Effect – This term refers to an increased intensity
resulting from the combination of alcohol with another drug
(greater effect than either substance alone). This can be
demonstrated by using the formula for sulphuric acid (H2SO4).
Either of the 3 elements alone do not have the same effect as
the 3 in this particular combination. The instructor should use PowerPoint 3-11 to explain this concept.

3-8
Mixing one type of alcohol with another type of alcohol produces an additive rather than a synergistic
effect.
9. Use of BAC Calculators (Optional)
A variety of devices have been developed to enable estimates of BAC to be made. The elements are
typically:
• Body Weight
• Time
• Number of Drinks
More detailed calculators differentiate between types of alcoholic beverages.
If the instructor desires to use this activity, it will be necessary to obtain sufficient devices for each
student. Recommended devices and availability are:
• 1st Choice – Blood Alcohol Concentration Wheel
o This device has separate sides for male and female. It can be ordered from
ALCOPRO – PO Box 10954, Knoxville, TN 37939 – 800-227-9890
• 2nd Choice – Blood Alcohol Concentration Calculators
o This device does not consider gender but is less expensive than choice 1. It is
available from: Datalizer – 501 Westgate Drive, Addison, IL 60101 – (630) 543-6000
and Email: [email protected]
If used, the instructor should carefully explain the use of such devices to make certain that students do
not see them as “foolproof” or “magic number” instruments, but rather as only approximate estimates
of blood alcohol concentration. A variety of factors including individual differences in a person’s alcohol
tolerance, food, medication, and psychological condition may cause a person to be more or less affected
at a given BAC at different times. Moreover, it should be pointed out that since it takes a number of
3-9
hours to remove alcohol from the body, a person could be arrested on the way to work or school the
morning after a big drinking party. This will be further explained later.
Exercises for explaining the calculators include:
A. Have each person find the BAC for the following examples (use top window):
1. Weight (140 pounds), drinks (3), time (1 hour)
Answer: Male = .06 - .07, Female = .07 - .08
2. Weight (180 pounds), drinks (8), time (1 hour)
Answer: Male = .16, Female = .17 - .18
3. Weight (100 pounds), drinks (4), time (1 hour)
Answer: Male - .13 - .14, Female = .15 - .16
NOTE: If the BAC calculator is used, omit the male/female references.
B. Have each person set the arrow in the top window (estimated % Blood Alcohol within one hour) on
.08. Then ask each person to find his/her weight and note the number of drinks needed to reach .08.
C. Have each person set the calculator on .08 in the top window. Ask the class to then refer to the
bottom window and note what their level would be if the time spent drinking was 2 hours rather
than 1 hour (approximately .05), 4 hours rather than 1 hour (approximately .02). This exercise
demonstrates that time is a factor which determines intoxication levels.
D. Repeat this exercise using .05 (this will be 2-3 drinks for most people). The instructor should state
that while 2 or 3 drinks is not an unreasonable amount, in the minds of many drinkers, it does
produce a level which has been shown to impair driving ability and increases the chances of a traffic
crash. There is evidence that impairment is present long before most people reach .08. Research has
shown that all persons are affected by at least a .05 level. In addition, research has shown that BACs

3-10
as low as .02 affect humans in some tests. NOTE: The best and ONLY legal level for minors,
however, is .00 BAC.
E. The instructor should also use a 110 lb. person and 6 drinks in 6 hours to demonstrate why the 1-
drink/1-hour concept does not work for small people. The instructor should point out that not only
is this person’s BAC not zero, as expected if the body removed one drink per hour, but a BAC of .08 -
.09 would have been produced. Why this is true can be demonstrated by next setting one drink and
110 lb. which gives a maximum of .03. Since only .015 is eliminated in one hour, the person has not
completely removed the drink.
NOTE: At the conclusion of this exercise, again stress the importance of NO alcohol for underage
persons, and that this is the best standard for persons of any age when potentially dangerous
activities such as driving, swimming, boating, etc. will be involved.
10. Removal of Alcohol from the Body – The instructor should
discuss with the class the ways alcohol is removed from the
body.
The instructor should explain the following when using
PowerPoint slide 3-12:
A. For the average individual, elimination will reduce the blood alcohol level by .015% BAC per hour.
B. Oxidation taking place in the liver processes 94% of the alcohol consumed by an individual. Breath,
sweat, and urine count for the other 6%.
C. Showers, exercise, and coffee will not speed up the elimination rate.
3-11
The difference between the absorption (drinking) rate and the elimination rate will determine the
sedated level of the brain and central nervous system. BAC is the best universal measure of this sedated
(under the influence) condition.
The simplest way to think of BAC is to compare the drinking process to filling a tub. You can run the tap
as fast or slow as you want, but the bathtub drain (in this case, a very small drain) will allow it to empty
only so fast. The “blood alcohol tub” will drain only at the rate of .015% BAC per hour.
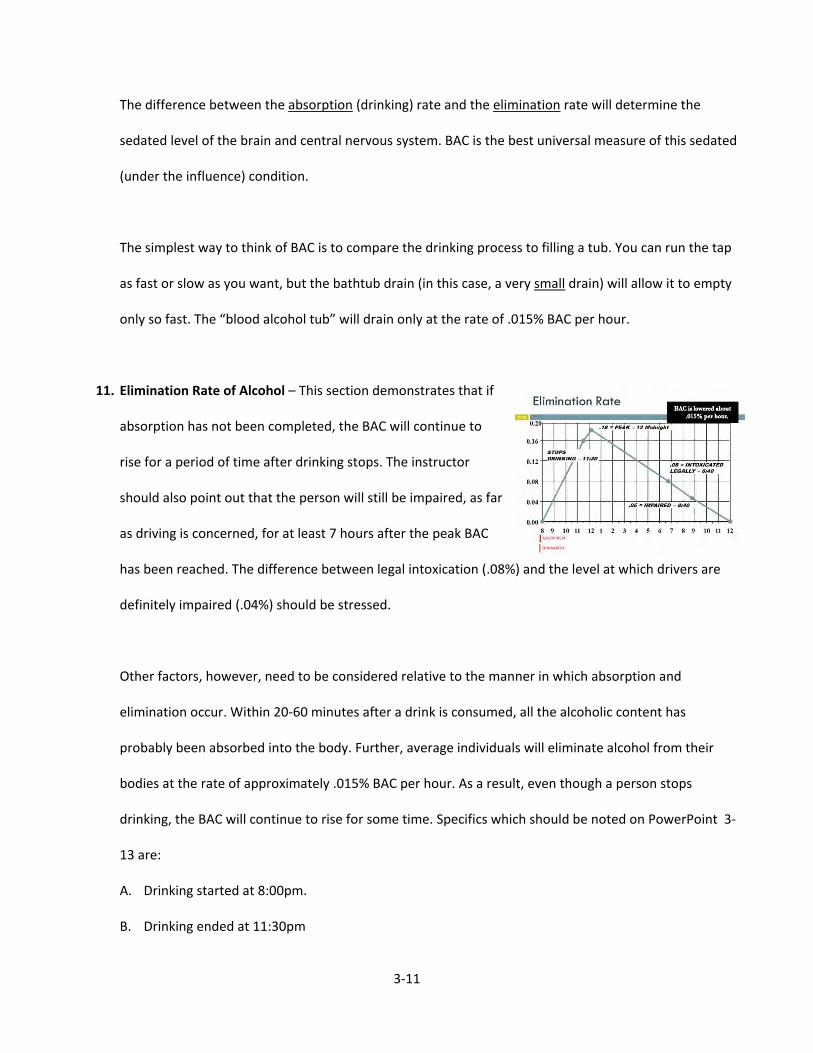
11. Elimination Rate of Alcohol – This section demonstrates that if
absorption has not been completed, the BAC will continue to
rise for a period of time after drinking stops. The instructor
should also point out that the person will still be impaired, as far
as driving is concerned, for at least 7 hours after the peak BAC
has been reached. The difference between legal intoxication (.08%) and the level at which drivers are
definitely impaired (.04%) should be stressed.
Other factors, however, need to be considered relative to the manner in which absorption and
elimination occur. Within 20-60 minutes after a drink is consumed, all the alcoholic content has
probably been absorbed into the body. Further, average individuals will eliminate alcohol from their
bodies at the rate of approximately .015% BAC per hour. As a result, even though a person stops
drinking, the BAC will continue to rise for some time. Specifics which should be noted on PowerPoint 3-
13 are:
A. Drinking started at 8:00pm.
B. Drinking ended at 11:30pm

3-12
C. Peak BAC occurred at 12:00 midnight. (The instructor should discuss why this rose after drinking had
stopped. Answer: Not all alcohol had been absorbed.)
D. The person would not drop back down to around a .08% BAC until 6:40am.
E. The person would still be impaired by alcohol until at least 10:00am and all alcohol would not be
removed until about 12:00 noon.
F. If this person had to drive to work, school, etc. at 7:00 – 8:00am, he or she would still be impaired
by alcohol. A discouraging phenomenon of alcohol is that once the blood alcohol level has peaked
and starts to diminish, individuals who have been drinking feel they are much more sober than is the
real case. This condition exists due to the fact that their frame of reference is their worst level of
intoxication and not a comparison with their abilities prior to drinking.
12. Alcohol and Decision-Making – As a person’s BAC climbs,
his/her ability to make sound decisions decreases. Examples of
this include (see PowerPoint 3-14):
A. Enhanced risk-taking, such as the decision to drive at all,
walk safely, speed, pass another vehicle, and flee police.
B. Reduced inhibitions – Inhibitions are self-imposed restraints. People’s behavior may change (usually
for the worst) after drinking, and they may do something that they would not do when sober.
13. Reasons for Differing Effects of Alcohol – The instructor shall
use PowerPoint 3-15 and the accompanying support material to
explain reasons alcohol has different effects on humans.
A. Tolerance – Tolerance is the ability to adapt to the presence
of alcohol or other drugs so that larger quantities are

3-13
required to produce the same given effect. This means that if a person needs to drink more to
achieve the same effect, he/she formerly achieves with less alcohol then a tolerance has been
acquired. Tolerance is the term given to describe the fact that with consistent drinking over a
prolonged period of time an individual can learn to accommodate ever-increasing amounts of
alcohol without the accompanying rise in observable signs of intoxication. Research on tolerance has
shown that most persons will not demonstrate “visible” effects of .15 or greater or reached (Brick &
Erickson, 2009).
B. Medication – When humans combine alcohol and other types of drugs in their bodies, the effects
are unpredictable.
C. Mood – Most people who drink regularly know that the mood they are in at the time tends to
influence the way alcohol affects them. This is just one of the factors which may influence a person’s
response to alcohol. As drinking progresses, an individual’s mood may change. Some people tend to
anger easily while others appear to become happy. No one can predict exactly how alcohol will
affect a given individual’s mood.
D. Individual Differences – Age, sex, and experience in use of alcohol and other drugs may all be factors
which explain why people are affected differently by alcohol.
Summary: Hopefully study and understanding of the material covered in this section will help young people to
have ammunition to not consume alcohol until at least age 21, and if they consume them to significantly limit
their intake. This section also sets the stage for the next section, which deals with driving tasks effects and risks.
4-1
Topic 4
Alcohol Effects on Driving and Risk
(55 Minutes)
Goal: To have students understand how alcohol causes reduced driving
ability and increases risk of crashes
Objectives:
• BAC and risk of death in a traffic crash
• Learn the effects of alcohol on divided attention, perception, and reaction time
• Review the likelihood of dying in a crash as BAC rises
• Examine BAC and crash responsibility
Content and Student-Learning Activities
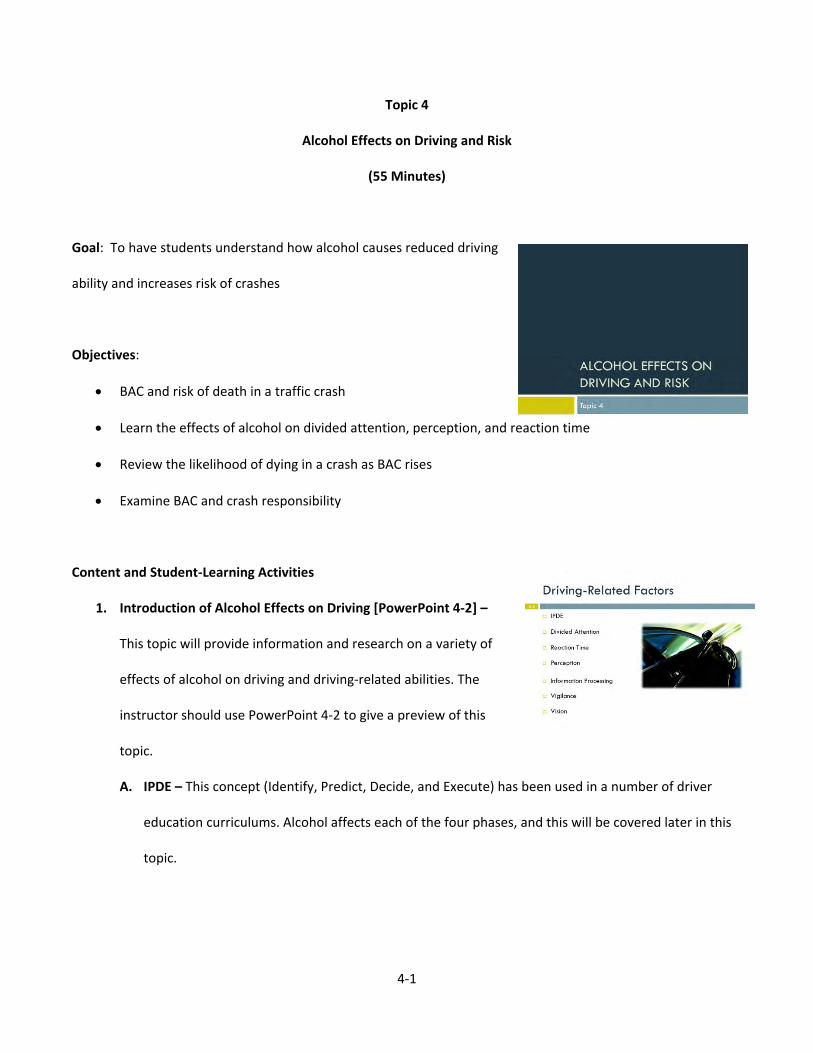
1. Introduction of Alcohol Effects on Driving [PowerPoint 4-2] –
This topic will provide information and research on a variety of
effects of alcohol on driving and driving-related abilities. The
instructor should use PowerPoint 4-2 to give a preview of this
topic.
A. IPDE – This concept (Identify, Predict, Decide, and Execute) has been used in a number of driver
education curriculums. Alcohol affects each of the four phases, and this will be covered later in this
topic.

4-2
B. Divided Attention [PowerPoint 4-3]– Use the example on
PowerPoint 4-3 and ask the class for other things which
drivers must divide their attention between and among.
After the class has provided their answers, show the
remaining items on PowerPoint 4-3. The effects of alcohol
on them will be covered later.
PowerPoint 4-4 gives a potential example of the variety of
things with which a driver must divide attention. The
instructor should describe all 6 things on the PowerPoint.
a) You are driving the vehicle approaching an open
intersection (no traffic control device)
b) Woman talking on a cell phone headed East
c) Teenager texting headed North
d) Motorcycle headed South
e) Teenager listening to music with earphones headed South
f) Empty parked police car
After identifying all 6 elements, ask the class which one thing they would most likely focus on (as
driver of Car A). Ask why each thing was selected. While there is no “best” answer, many will choose
the police car, which is the worst answer. (It is empty and parked.) The instructor should also ask if
correctly choosing which things upon which to focus would be impacted by their use of cell phone,
texting, etc. Later in the unit, the BAC at which divided attention is affected will be discussed.

4-3
C. Reaction Time [PowerPoint 4-5] – Using PowerPoint 4-5,
explain that there are 2 types of reaction time – simple and
complex.
• Simple – 1 stimulus and 1 response
• Complex – More than 1 stimulus and more than
1 possible response
To demonstrate this, cut 2 pieces of paper about the size of a dollar bill. Have a student hold their
thumb and index fingers about 2 inches apart (both left and right hand). The instructor should hold
both sheets of paper so the bottom is between the student’s thumb and finger, and he/she should
instruct the student to seek to catch the paper when it is released. The student can only close 1 set
of thumb and fingers. Drop either the left or right paper and repeat several times varying which
paper is dropped. Usually the student will not or barely catch the paper. Repeat the process but
have the students only use 1 hand (of their choice). Usually, they will be able to catch the paper
every time. When there are two things to possibly catch, the brain must identify the correct action
quickly.
D. Perception [PowerPoint 4-6 and 4-7] – This is giving meaning
to our senses. We see with our eyes but perceive with our
brain. To demonstrate this, use PowerPoint 4-6. Ask the class
what they see in the picture (most will say an old, craggy,
long-haired, bearded man.) By looking closer, they should see
a man and woman embracing and kissing. This shows that, even when sober, we often do not detect
less obvious things. Alcohol affects this ability adversely.

4-4
The instructor should also use PowerPoint 4-7 as a
perceptual exercise. Ask the class to count the number of
“F’s” in the top sentence. Most people see 3 “F’s,” but there
are 6. Typically people miss the “F’s” in the word “of.” This
relates to alcohol in that if we have trouble sober seeing
some things, we will have even greater trouble if our vision and brain are impaired by alcohol.
After completing the “F” exercise, have the class count the “T’s” in the bottom sentence. Usually,
they will get all 6. This is because they now know what to look for. Alcohol will greatly reduce such
thinking.
E. Information Processing – Drivers must take in information through their senses (primarily with
vision and hearing). This information is transferred to the brain. This ability is slowed and distorted
by alcohol.
F. Vigilance – Remaining vigilant is difficult under the best of conditions. Alcohol reduces this ability as
BAC increases. Examples of this will be given later in the topic.
G. Vision – This is the most important driving-related sense, and any loss increases greatly crash risk.
2. Effects of Low BACs on Driving [PowerPoint 4-8] – While Texas
law defines the per se BAC for intoxication as .08, research has
shown that driver impairment begins below .08. The instructor
should use PowerPoint 4-8 to demonstrate that on many
abilities 1-2 drinks can produce impairment. The BACs shown
are the lowest levels where impairment has been identified.
A. Vigilance – (0.03) – Drivers need to stay consistently alert as the driving scene is constantly
changing.
4-5
B. Visual Function – (0.02) – Vision (especially motion related) is the most important sense related to
driving, and impairment occurs at very low levels.
C. Divided Attention – (.01) – As discussed previously, the driving task requires that attention be
directed to a variety of things in the driving task. As was demonstrated, this is difficult when sober.
D. Perception – (.03) – Understanding what is seen is vital to making good driving decisions.
E. Complex Reaction Time [PowerPoint 4-9] – (.02) – While it is important for a driver to react quickly,
it is more important that the correct reaction is made. Reacting fast and making a wrong decision
usually leads to a crash.
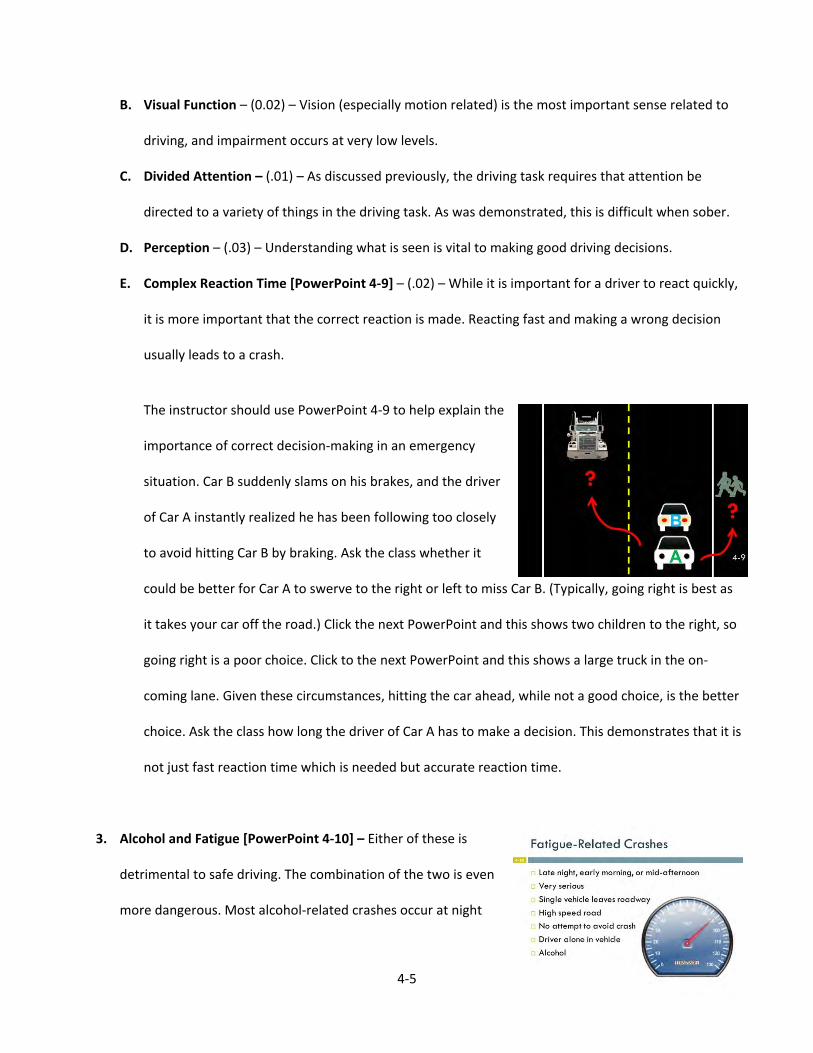
The instructor should use PowerPoint 4-9 to help explain the
importance of correct decision-making in an emergency
situation. Car B suddenly slams on his brakes, and the driver
of Car A instantly realized he has been following too closely
to avoid hitting Car B by braking. Ask the class whether it
could be better for Car A to swerve to the right or left to miss Car B. (Typically, going right is best as
it takes your car off the road.) Click the next PowerPoint and this shows two children to the right, so
going right is a poor choice. Click to the next PowerPoint and this shows a large truck in the on-
coming lane. Given these circumstances, hitting the car ahead, while not a good choice, is the better
choice. Ask the class how long the driver of Car A has to make a decision. This demonstrates that it is
not just fast reaction time which is needed but accurate reaction time.
3. Alcohol and Fatigue [PowerPoint 4-10] – Either of these is
detrimental to safe driving. The combination of the two is even
more dangerous. Most alcohol-related crashes occur at night

4-6
when fatigue is more likely, and this is the time when a high percentage of drinking occurs. Drowsiness
has been found with BACs of as low as .02. The instructor should use PowerPoint 4-10 to illustrate
common crash factors which may be related to alcohol.
4. Video of the Effects of Alcohol on Driving (Drinking and Driving:
Is .08 Too Late?) [PowerPoint 4-11] – Much research has been
done to determine not only if various driving-related abilities
(divided attention, perception, complex reaction times, etc.) are
affected by alcohol, but if actual driving performance is reduced
as BAC rises. The video “Drinking and Driving: Is .08 Too Late?” is an example of this. This video is of an
experiment conducted by the Center for Alcohol and Drug Education Studies at Texas A&M University. A
group of volunteers (male and female; age 20, 30, 40, and 50s; and black, Hispanic, and white) were
trained to handle a variety of driving situations. After receiving training, they were tested in a sober
condition to determine their baseline ability on 6 tasks:
• Blocked Lanes
• Slalom
• T-turn
• Skid Control
• Crash Simulators
• Handling a vehicle with rear wheels which would turn 360 degrees (automatically controlled
vehicle)
These exercises required steering, braking, judgment, reaction time, tracking, and general vehicle
control.
4-7
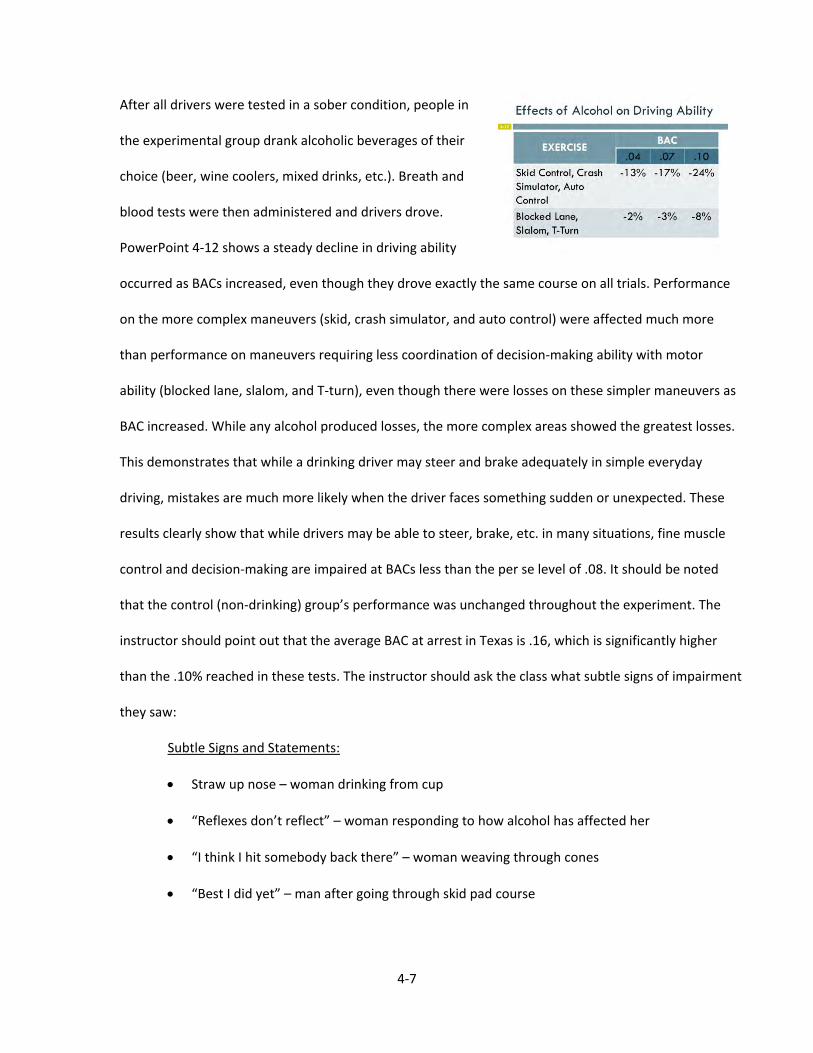
After all drivers were tested in a sober condition, people in
the experimental group drank alcoholic beverages of their
choice (beer, wine coolers, mixed drinks, etc.). Breath and
blood tests were then administered and drivers drove.
PowerPoint 4-12 shows a steady decline in driving ability
occurred as BACs increased, even though they drove exactly the same course on all trials. Performance
on the more complex maneuvers (skid, crash simulator, and auto control) were affected much more
than performance on maneuvers requiring less coordination of decision-making ability with motor
ability (blocked lane, slalom, and T-turn), even though there were losses on these simpler maneuvers as
BAC increased. While any alcohol produced losses, the more complex areas showed the greatest losses.
This demonstrates that while a drinking driver may steer and brake adequately in simple everyday
driving, mistakes are much more likely when the driver faces something sudden or unexpected. These
results clearly show that while drivers may be able to steer, brake, etc. in many situations, fine muscle
control and decision-making are impaired at BACs less than the per se level of .08. It should be noted
that the control (non-drinking) group’s performance was unchanged throughout the experiment. The
instructor should point out that the average BAC at arrest in Texas is .16, which is significantly higher
than the .10% reached in these tests. The instructor should ask the class what subtle signs of impairment
they saw:
Subtle Signs and Statements:
• Straw up nose – woman drinking from cup
• “Reflexes don’t reflect” – woman responding to how alcohol has affected her
• “I think I hit somebody back there” – woman weaving through cones
• “Best I did yet” – man after going through skid pad course
4-8
At this point, the instructor should discuss the decline in performance.
• .04% average BAC (.03 - .05) – There was an average of 13% drop in complex performance
compared to the sober level.
• .07% average BAC (.06 - .08) – There was an average of 17% drop in complex performance
compared to the sober level.
• 10% average BAC (.09 - .11) – There was an average of 24% drop in complex performance
compared to the sober level.
NOTE: There was no performance loss by the non-drinking group.
Limitations:
• Location – Off street area
• Day
• Low Speeds
• Practice
• Knew what would happen and when
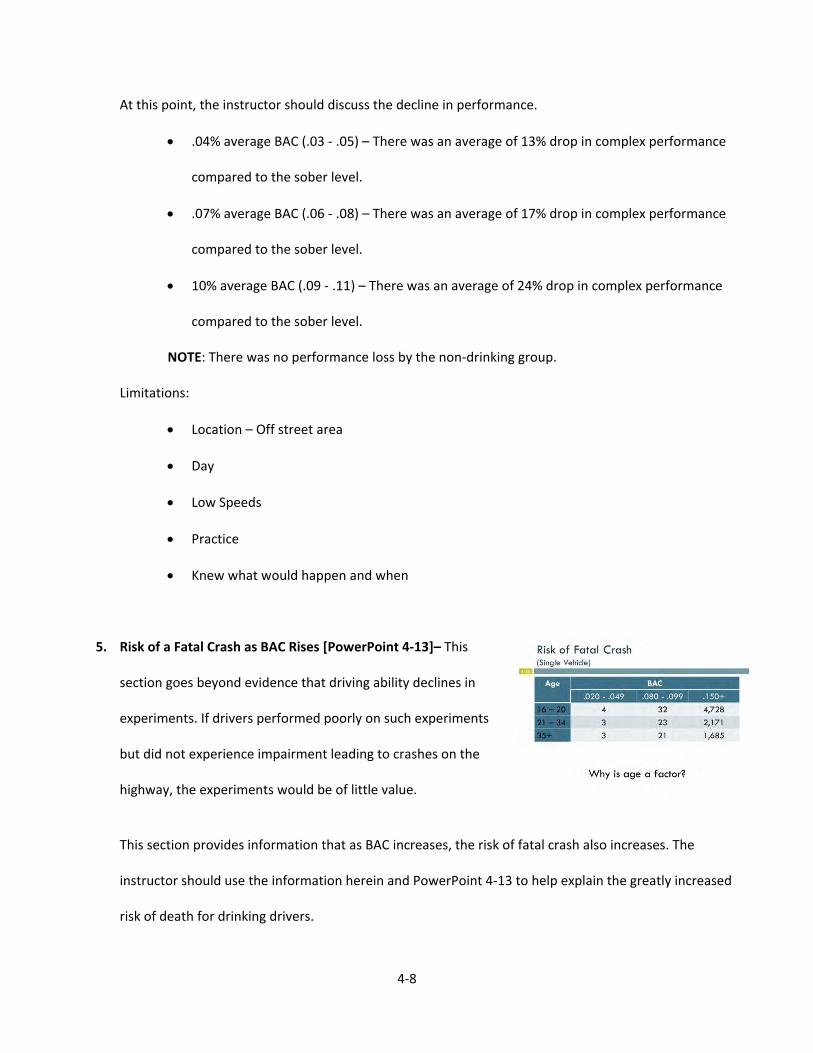
5. Risk of a Fatal Crash as BAC Rises [PowerPoint 4-13]– This
section goes beyond evidence that driving ability declines in
experiments. If drivers performed poorly on such experiments
but did not experience impairment leading to crashes on the
highway, the experiments would be of little value.
This section provides information that as BAC increases, the risk of fatal crash also increases. The
instructor should use the information herein and PowerPoint 4-13 to help explain the greatly increased
risk of death for drinking drivers.

4-9
For example, at .08% - .10% BAC, drivers ages 16-26 and over are 32 times more likely to be in a fatal
single-vehicle crash than compared to sober and are 4,728 times more likely at BAC of .15 and greater.
While drivers of all ages are more at risk as BAC rises, young drivers have the greatest risk. The
instructor should ask the class why young drivers are at greater risks than older drivers (at the same
BAC). Possible reasons are:
• Inexperienced as drivers
• Inexperienced as drinkers
• Take more risks than older people
• Drive more late at night
The instructor should again remind the class that most people arrested for DWI in Texas who take
breath or blood tests have BACs over the .15% figure. Thus, they are at a much higher risk of being
involved in a fatal crash than when sober.
The instructor should note that a sober driver’s chance of being involved in a fatal accident with an
intoxicated driver is about 50 times as great during the 1:00 – 3:00am period as compared to the
7:00am – 12:00 noon period.
6. Risk of Death in a Crash [PowerPoint 4-14] – There is a feeling
by many that people under the influence of alcohol are less
likely to be killed in a crash than non-drinkers. This is
supposedly because the drinker is more “loose and limber.”
Research has not shown this to be the case, however. Study of
the effect on fatality risk at various BACs has demonstrated that as BAC rises, the chance of being killed
rises.

4-10
NOTE: This finding is not in conflict with the information presented on the previous PowerPoint 4-13.
Reasons for this include: failure to secure safety belt, head injury produces swelling in the brain (as does
alcohol), and medical attention is more difficult. Such studies compare drinking and non-drinking drivers
in crashes of similar severity. The previous PowerPoint examined only alcohol-involved crashes and
compared them with ratios of drivers using comparable roadways with comparable BACs. The instructor
should use PowerPoint 4-14 to show this increase. This research can be used by the instructor to
demonstrate that the drinking driver not only has a greater risk of causing death to others but also to
him/herself. This dispels the myth that intoxication provides protection against injury for the drinker.
7. BAC and Crash Responsibility [PowerPoint 4-15] - While it is
possible that a driver could have a high BAC and not be
responsible for a crash in which he/she was involved, research
has demonstrated the opposite. As BAC increases, it is much
more likely that not only will a driver be in a crash but that
he/she will be the cause of the crash. The instructor should use PowerPoint 4-15 to demonstrate this.
The instructor should note that this is from injury accidents and not just fatal accidents.
8. Summary of Alcohol Effects on Driving [PowerPoint 4-16] – As
a wrap-up to this very important topic, the instructor should
briefly summarize the effects of alcohol on humans and
specifically how these relate to driving a vehicle.
A. Driving Ability – Driving abilities are affected even at low
BACs. Areas affected include divided attention, tracking, risk-taking, reaction time, and other areas.
In addition, actual driving tests in vehicles have shown significant declines in ability as BAC increases.
4-11
B. Risk of Fatal Crash – Research has found that the chance of being involved in a fatal motor vehicle
crash goes up sharply as BAC rises, and that young people are particularly at risk.
C. Chance of Drinking Driver Fatality – Drinking drivers are more likely rather than less likely to die in a
crash.
D. Crash Responsibility – Not only are people more likely to be in crash as BAC increases, but they are
more likely to be responsible for the crash.
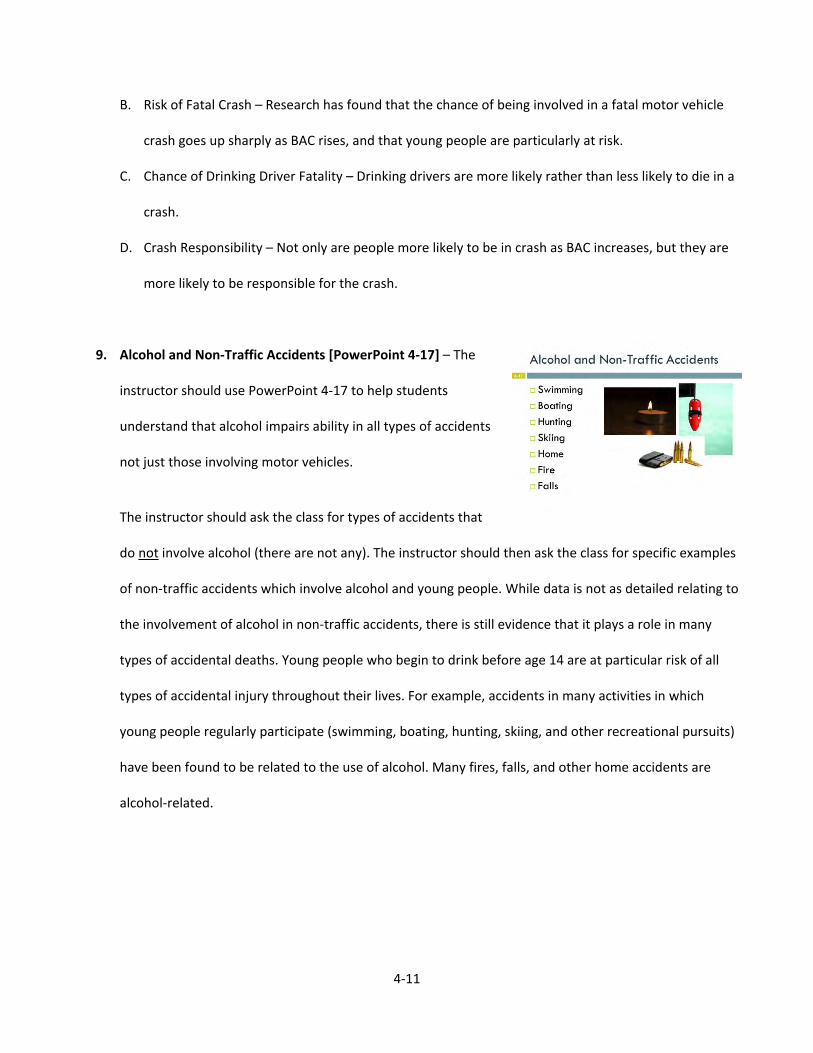
9. Alcohol and Non-Traffic Accidents [PowerPoint 4-17] – The
instructor should use PowerPoint 4-17 to help students
understand that alcohol impairs ability in all types of accidents
not just those involving motor vehicles.
The instructor should ask the class for types of accidents that
do not involve alcohol (there are not any). The instructor should then ask the class for specific examples
of non-traffic accidents which involve alcohol and young people. While data is not as detailed relating to
the involvement of alcohol in non-traffic accidents, there is still evidence that it plays a role in many
types of accidental deaths. Young people who begin to drink before age 14 are at particular risk of all
types of accidental injury throughout their lives. For example, accidents in many activities in which
young people regularly participate (swimming, boating, hunting, skiing, and other recreational pursuits)
have been found to be related to the use of alcohol. Many fires, falls, and other home accidents are
alcohol-related.
4-12
10. Alcohol and Crime [PowerPoint 4-18] – Crimes are often
committed while under the influence of alcohol. For example,
studies have found that significant percentages of young
people who had committed a serious crime, such as aggravated
assault, arson, robbery, and fighting were under the influence
of alcohol. Approximately 40% of young people in adult correctional facilities had been drinking before
they committed the crime for which they are incarcerated. In addition, gun possession is much more
likely for students who binge drink.
Summary: It is not important that students memorize all the numbers and statistics found in this topic, but it is
important that they recognize that even small amounts of alcohol greatly reduce their driving ability and greatly
increase the likelihood of a crash.

5-1
Topic 5
Young People and Alcohol Abuse
(45 Minutes)
Goal: To have students learn the definition and symptoms of alcohol
abuse and alcoholism.
Objectives:
• Be able to define alcohol abuse
• Be able to define alcoholism
• List signs of alcohol abuse and alcoholism
• Identify resources to deal with alcohol abuse and alcoholism
Content and Student-Learning Activities
1. Unfortunately, young people are not immune to problems with alcohol which go beyond legal and
accident problems. This section will help young people better understand concepts of abuse and
addiction and know resources available to them and their friends.
2. Alcohol Abuse – The root word in “abuse” is “use.” Abuse means improper or abnormal use. While
for persons under age 21 in Texas, any “use” can be considered abuse since it is illegal for them to
not only use, but attempt to purchase, purchase, or possess alcohol. This section will deal with
identifiable signs of abuse.
5-2
Criteria for Alcohol Abuse [PowerPoint 5-2]:
• Recurrent alcohol use resulting in failure to fulfill major
role obligations at work, school, or home (e.g., repeated
absences or poor work performance related to
substance use; substance-related absences,
suspensions or expulsions from school; or neglect of children or household).
• Recurrent alcohol use in situations in which it is physically hazardous (e.g., driving an automobile
or operating a machine).
• Recurrent alcohol-related legal problems (e.g., arrests for alcohol-related disorderly conduct).
• Continued alcohol use despite persistent or recurrent social or interpersonal problems caused or
exacerbated by the effects of the alcohol (e.g., arguments with spouse about consequences of
intoxication or physical fights).
* 1 or more of these in a 12-month period
3. Alcohol Dependence / Alcoholism [PowerPoint 5-3] – For
the purpose of this curriculum, dependence and alcoholism
will be used synonymously.
A maladaptive pattern of alcohol use, leading to clinically
significant impairment or distress, as manifested by three or
more of the following seven criteria, occurring at any time in the same 12-month period:

5-3
A. Tolerance, as defined by either of the following:
• A need for markedly increased amounts of alcohol to achieve intoxication or desired
effect.
• Markedly diminished effect with continued use of the same amount of alcohol.
B. Withdrawal, as defined by either of the following:
• The characteristic withdrawal syndrome for alcohol.
• Alcohol is taken to relieve or avoid withdrawal symptoms.
C. Alcohol is often taken in larger amounts or over a longer period than was intended.
D. There is a persistent desire or there are unsuccessful efforts to cut down or control alcohol use.
E. A great deal of time is spent in activities necessary to obtain alcohol, use alcohol or recover from
its effects.
F. Important social, occupational, or recreational activities are given up or reduced because of
alcohol use.
G. Alcohol use is continued despite knowledge of having a persistent or recurrent physical or
psychological problem that is likely to have been caused or exacerbated by the alcohol (e.g.,
continued drinking despite recognition that an ulcer was made worse by alcohol consumption).
DSM-IV Criteria for Alcohol Abuse. American Psychiatric Association. 2000. Diagnostic and Statistical
manual of Mental Disorders (4th ed.) (DSM-IV). Washington, DC.: APA.
4. Signs of Cancer [PowerPoint 5-4] – The instructor should
explain that a person could have the “signs” of a disease
without having the disease. An example of this is cancer.
Some warning signs are:

5-4
• Unexplained weight loss
• Fever
• Fatigue
• Pain
• Sores that do not heal
• Trouble swallowing
• Hoarseness
Ask the class if a person having all these signs definitely has cancer. While the answer is no, the
more signs present the more likely cancer is present. The same is true for signs of alcoholism.
The instructor should use the accompanying material and
PowerPoint 5-5 and 5-6 to cover signs of alcoholism which
especially relate to young people.
• Losing time from classes due to drinking
• Drinking because uncomfortable in social situations
• Drinking is affecting your relationships with friends
• Feeling guilty or depressed after drinking
• Financial troubles over buying alcohol
• Losing friends since having started drinking
• Drinking more than most of your friends
• Having a complete loss of memory from drinking
• Having been hospitalized or arrested due to alcohol use
• Thinking you have a problem with alcohol

5-5
• Denial
• Drinking to escape from pressure or to solve life’s problems
• Getting intoxicated even when intending to stay sober
• Significantly increased tolerance to alcohol
• Getting intoxicated frequently
5. Sources of Help for Alcohol Problems [PowerPoint 5-7] –
There are many educational and social agencies which
provide help for people who are concerned that they may
have a drinking problem. These include:
• Mental Health Agents
• Councils on Alcoholism
• Alcoholics Anonymous
• Alateen
• Private Counselors
The instructor should seek to obtain a list of local resources. If a handout of these is used, give a
copy to all students, not just those who may ask for one.
Summary: While gaining knowledge about alcohol laws, effects on humans and driving is helpful, if a
young person has the type of problems described herein, a purely educational program is not sufficient
to change behavior. Self-recognition that a problem exists is the first step toward solution of the
problem.

6-1
Topic 6
Drugs and Driving
(65 Minutes)
Goal: To have students understand the effects of non-alcoholic drugs on
driving and refrain from any illegal or unsafe use
Objectives:
• Learn psychological effects of drugs on driving-related skills
• Learn physiological effects of drugs on driving-related skills
• Identify increased risk of traffic crashes caused by drug use
Content and Student-Learning Activities
NOTE: The recommended procedure is for the instructor to use the video “Curiosity: Your Body on
Drugs” and then follow up with the content material contained in “Effects of Drugs on Driving.” If the
video is not used, the section “Drugs and Humans” followed by “Effects of Drugs and Driving” should
be used.
This DVD is available as follows:
School Media Associates
5815 Live Oak Parkway, Suite 2-B
Norcross, GA 30093-1700
Cost = $59.95
Time = 43 Minutes
Website: www.schoolmediaassociates.com
Item number: DCS DC024782

6-2
Summary: Follows Robin Williams and a team of medical experts as they take a scientific look at
the true effects of drugs on the body. The program profiles four of the most widely used drugs
in America: heroin, cocaine, meth, and marijuana. Witness what happens as drug addicts are
faced with a variety of physical and mental challenges. NOTE: This program contains content
that may be inappropriate for some viewers. Please preview before showing in class.
1. Determining the effects of non-alcoholic drugs on humans and specific effects on driving is much
more difficult than with alcohol. Reasons for this include:
• The great variety of drug compounds versus concept that alcohol (ethanol) is the same
regardless of the alcoholic beverage
• Testing is more difficult (no uniform breath test for drugs)
• Approval to do research on the effects of non-alcoholic drugs on humans is difficult to
obtain
This section will, however, include available data on drug efforts and their relationships to driving.
Two procedures can be used to teach this session:
A. Use PowerPoint 6-2 to show the four drugs to be studied,
and then show the DVD “Curiosity: Your Body on Drugs.”
Suggestions and Questions for “Curiosity: Your Body on
Drugs.”
1. Section 1 – Introduction
This video will show the effects of marijuana, methamphetamines, heroin, and
cocaine on human performance.

6-3
2. Driving Task –
a) How difficult were the driving tasks they performed? Compare to the
complex driving tasks used in the alcohol video they previously saw. (The
tasks used in the drug video are much easier). Ask the class how they think
the people would have done on the skid pad, crash simulator, or
automatically controlled vehicle exercises. (Probably a lot worse.)
b) How did they do on the various drugs?
1. Marijuana -- Could not remember where to start the course, much
slower (7 mph), took 3+ minutes on parallel parking and 1 minute
when sober.
2. Methamphetamines – Went faster, erratic, parallel parking, and hit
cones.
3. Heroin – Had trouble with stop sign, took twice as long to parallel
park
4. Cocaine – Drove faster than anyone else and 30% faster than when
sober, hit stop sign, poor job parallel parking.
3. Book Case
a) Marijuana – Trouble following and concentrating, did not finish task.
b) Methamphetamines – Heavy sweating and over-heated.
c) Cocaine – Did not use instructions, left out some parts.
d) Heroin – No noticeable effect.
4. Stress (smoked-filled house)
a) All had trouble both with and without drugs in their systems.

6-4
5. Strength:
a) Methamphetamines – Did not increase strength, but he got over-heated.
b) Cocaine – Made stronger, but heart rate went to a dangerous level.
6. How did the results of the experiment seem to affect the four people? (Most not
willing to change.) Why didn’t the medical results make all of them want to stop
drug use? (Addictions.)
B. If the DVD “Curiosity: Your Body on Drugs” is not available, the instructor should use the
following material to teach drug and driving concepts:
Drugs and Humans
1. Drugs in the Human Body [PowerPoint 6-3] – The instructor
should begin this section by defining what a drug is. To do this,
the instructor should use PowerPoint 6-3, “What is a Drug?”
For the purpose of this course a drug is any substance that
when taken into the human body can impair the ability to
operate a motor vehicle safely. This is the same definition of drug that can be found in the
National Highway Traffic Safety Administration approved Drug Evaluation and Classification
Program curriculum.
Drug “action” refers to specific molecular changes that are produced when a drug binds to a
particular body site or receptor. These changes lead to a widespread alteration in physiological
or psychological functioning. It is these changes in the two aforementioned areas of functioning
which are considered the drug “effects.”

6-5
• The circulatory system also transports the drugs to the liver and other organs, where the
drugs are metabolized into other components called metabolites. Metabolites are
chemical substances derived from a drug.
2. Six Drug Categories [PowerPoint 6-4] –These drug categories
are based on the observable signs and symptoms that they can
produce. Using PowerPoint 6-4, the instructor should discuss
the following descriptions of each category:
A. Central Nervous System (CNS) Depressants
[PowerPoint 6-5] – CNS depressants include a large number
of different drugs. Historically, alcohol is the most used and
abused psychoactive depressant drug. CNS depressants
slow down the operation of the brain and other parts of the
central nervous system.
In order for a drug to be classified as a depressant, it must depress the activity of an
individual’s brain and the central nervous system. CNS depressants (e.g., tranquilizers,
sedatives) are medications that slow normal brain function. The depressant category
includes alcohol, anti-anxiety, tranquilizers, anti-psychotic tranquilizers, antidepressants,
barbiturates, non-barbiturates, or combination drugs, and gamma hydroxyl butyrate (GHB).
The CNS depressant category initially affects functions such as speech, coordination, and
mobility. As the dosage increases, impairment of the body’s autonomic nervous system,
such as heartbeat, body temperature, and breathing may be affected and observed.
• Effects of Depressants (PowerPoint 6-5) – People under the influence of CNS
depressants may look and act very much like people under the influence of alcohol.
6-6
Individuals may be encountered that appear to be “drunk,” but lack any breath odor of
an intoxicating beverage. Subjects taking a therapeutic dose (amounts typically
prescribed by a physician) may not exhibit observable signs of impairment, especially
after the acclimation period has surpassed.
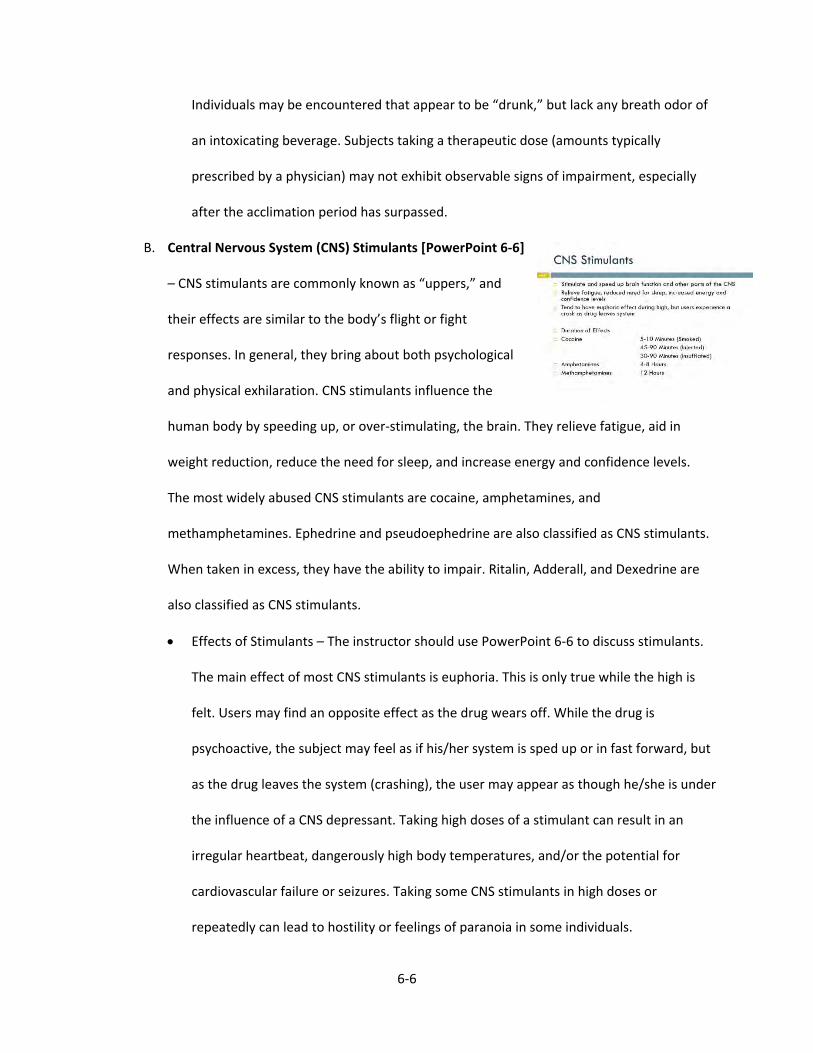
B. Central Nervous System (CNS) Stimulants [PowerPoint 6-6]
– CNS stimulants are commonly known as “uppers,” and
their effects are similar to the body’s flight or fight
responses. In general, they bring about both psychological
and physical exhilaration. CNS stimulants influence the
human body by speeding up, or over-stimulating, the brain. They relieve fatigue, aid in
weight reduction, reduce the need for sleep, and increase energy and confidence levels.
The most widely abused CNS stimulants are cocaine, amphetamines, and
methamphetamines. Ephedrine and pseudoephedrine are also classified as CNS stimulants.
When taken in excess, they have the ability to impair. Ritalin, Adderall, and Dexedrine are
also classified as CNS stimulants.
• Effects of Stimulants – The instructor should use PowerPoint 6-6 to discuss stimulants.
The main effect of most CNS stimulants is euphoria. This is only true while the high is
felt. Users may find an opposite effect as the drug wears off. While the drug is
psychoactive, the subject may feel as if his/her system is sped up or in fast forward, but
as the drug leaves the system (crashing), the user may appear as though he/she is under
the influence of a CNS depressant. Taking high doses of a stimulant can result in an
irregular heartbeat, dangerously high body temperatures, and/or the potential for
cardiovascular failure or seizures. Taking some CNS stimulants in high doses or
repeatedly can lead to hostility or feelings of paranoia in some individuals.
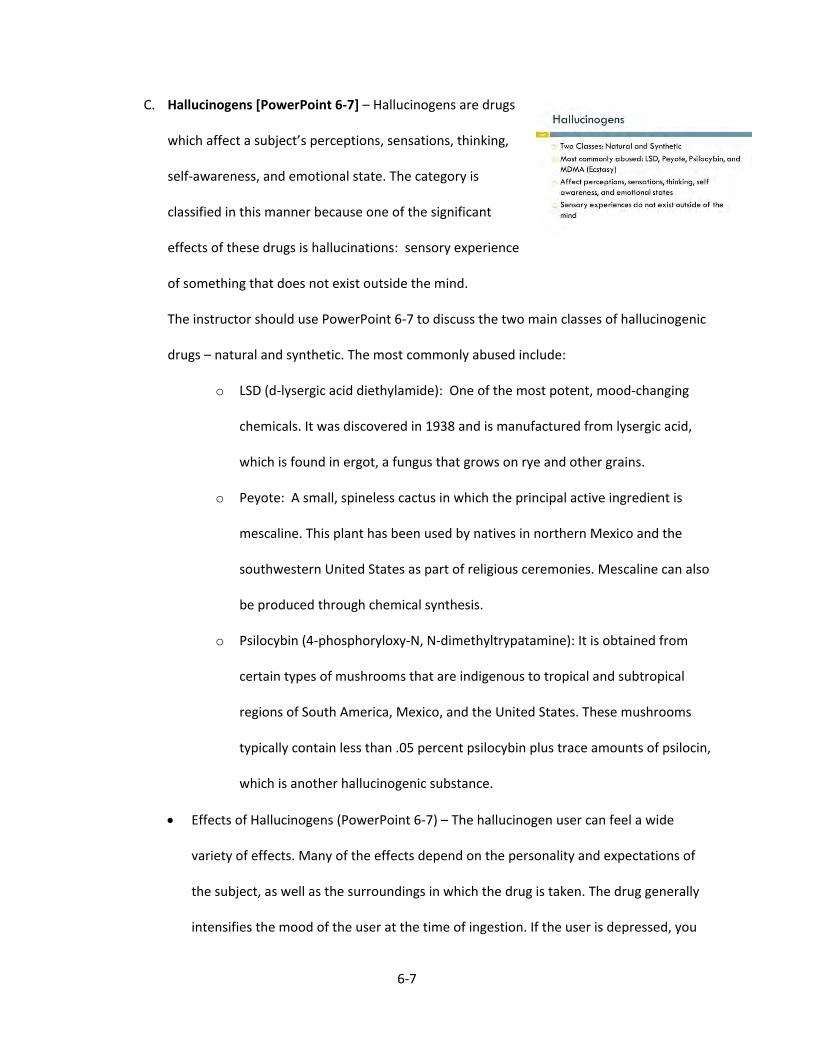
6-7
C. Hallucinogens [PowerPoint 6-7] – Hallucinogens are drugs
which affect a subject’s perceptions, sensations, thinking,
self-awareness, and emotional state. The category is
classified in this manner because one of the significant
effects of these drugs is hallucinations: sensory experience
of something that does not exist outside the mind.
The instructor should use PowerPoint 6-7 to discuss the two main classes of hallucinogenic
drugs – natural and synthetic. The most commonly abused include:
o LSD (d-lysergic acid diethylamide): One of the most potent, mood-changing
chemicals. It was discovered in 1938 and is manufactured from lysergic acid,
which is found in ergot, a fungus that grows on rye and other grains.
o Peyote: A small, spineless cactus in which the principal active ingredient is
mescaline. This plant has been used by natives in northern Mexico and the
southwestern United States as part of religious ceremonies. Mescaline can also
be produced through chemical synthesis.
o Psilocybin (4-phosphoryloxy-N, N-dimethyltrypatamine): It is obtained from
certain types of mushrooms that are indigenous to tropical and subtropical
regions of South America, Mexico, and the United States. These mushrooms
typically contain less than .05 percent psilocybin plus trace amounts of psilocin,
which is another hallucinogenic substance.
• Effects of Hallucinogens (PowerPoint 6-7) – The hallucinogen user can feel a wide
variety of effects. Many of the effects depend on the personality and expectations of
the subject, as well as the surroundings in which the drug is taken. The drug generally
intensifies the mood of the user at the time of ingestion. If the user is depressed, you
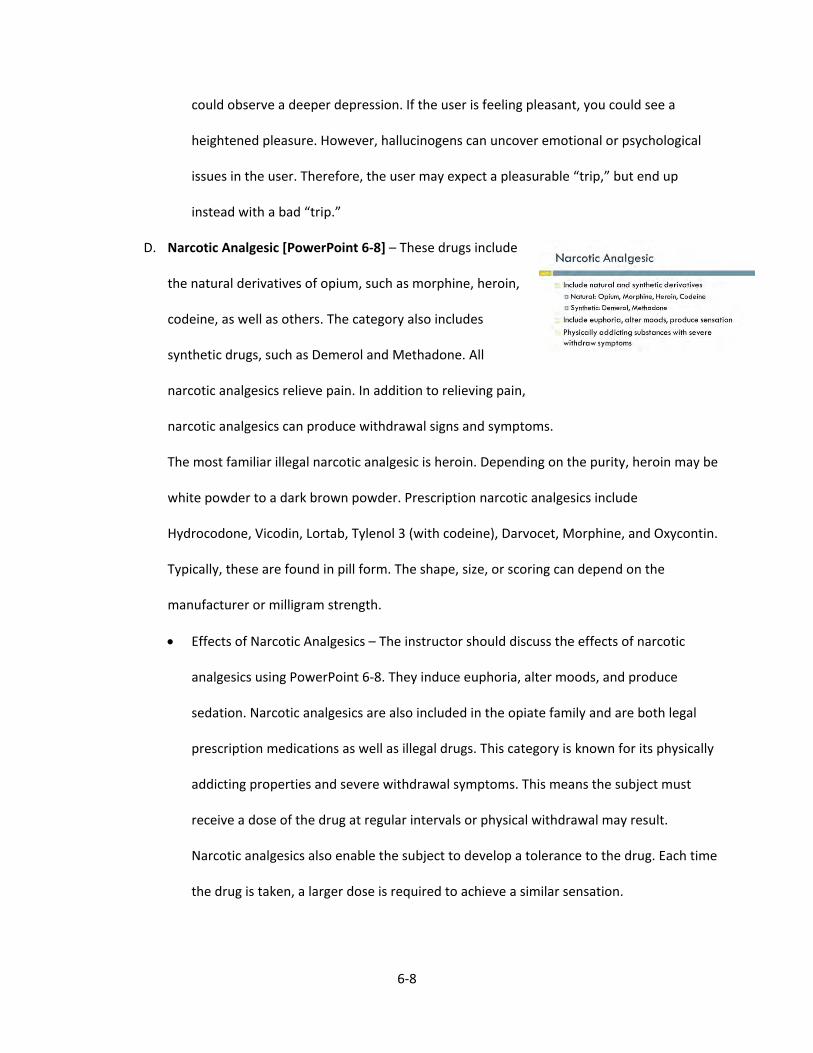
6-8
could observe a deeper depression. If the user is feeling pleasant, you could see a
heightened pleasure. However, hallucinogens can uncover emotional or psychological
issues in the user. Therefore, the user may expect a pleasurable “trip,” but end up
instead with a bad “trip.”
D. Narcotic Analgesic [PowerPoint 6-8] – These drugs include
the natural derivatives of opium, such as morphine, heroin,
codeine, as well as others. The category also includes
synthetic drugs, such as Demerol and Methadone. All
narcotic analgesics relieve pain. In addition to relieving pain,
narcotic analgesics can produce withdrawal signs and symptoms.
The most familiar illegal narcotic analgesic is heroin. Depending on the purity, heroin may be
white powder to a dark brown powder. Prescription narcotic analgesics include
Hydrocodone, Vicodin, Lortab, Tylenol 3 (with codeine), Darvocet, Morphine, and Oxycontin.
Typically, these are found in pill form. The shape, size, or scoring can depend on the
manufacturer or milligram strength.
• Effects of Narcotic Analgesics – The instructor should discuss the effects of narcotic
analgesics using PowerPoint 6-8. They induce euphoria, alter moods, and produce
sedation. Narcotic analgesics are also included in the opiate family and are both legal
prescription medications as well as illegal drugs. This category is known for its physically
addicting properties and severe withdrawal symptoms. This means the subject must
receive a dose of the drug at regular intervals or physical withdrawal may result.
Narcotic analgesics also enable the subject to develop a tolerance to the drug. Each time
the drug is taken, a larger dose is required to achieve a similar sensation.
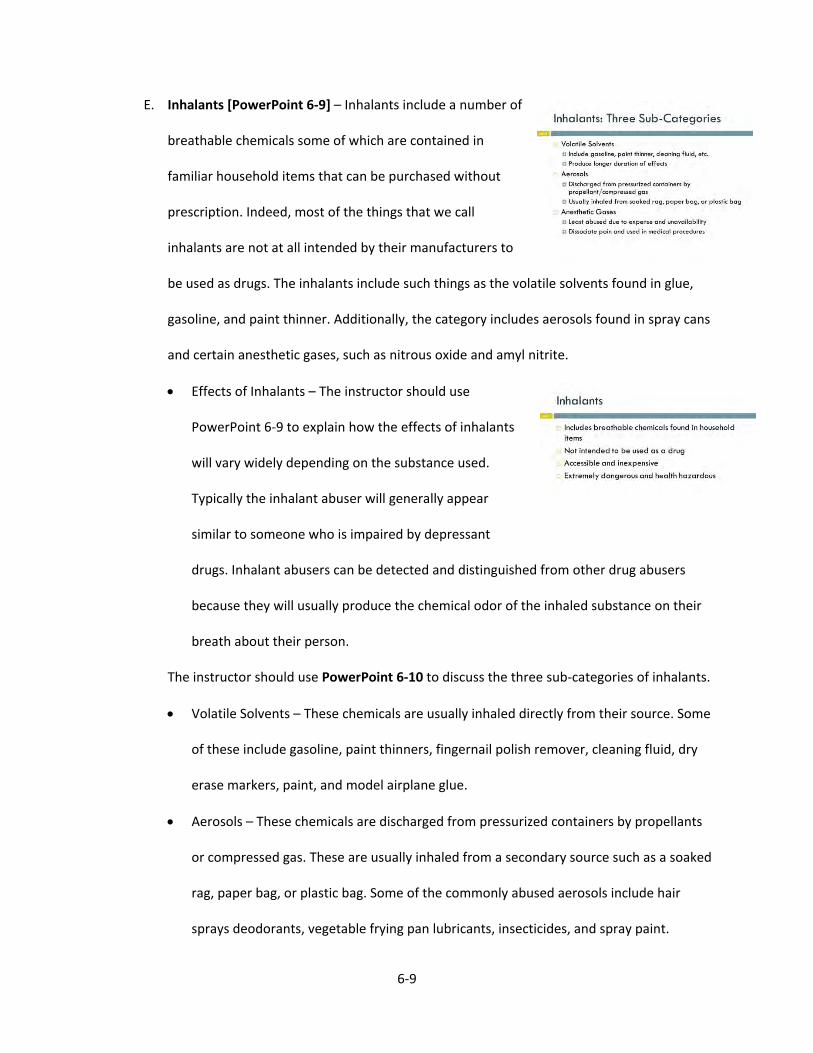
6-9
E. Inhalants [PowerPoint 6-9] – Inhalants include a number of
breathable chemicals some of which are contained in
familiar household items that can be purchased without
prescription. Indeed, most of the things that we call
inhalants are not at all intended by their manufacturers to
be used as drugs. The inhalants include such things as the volatile solvents found in glue,
gasoline, and paint thinner. Additionally, the category includes aerosols found in spray cans
and certain anesthetic gases, such as nitrous oxide and amyl nitrite.
• Effects of Inhalants – The instructor should use
PowerPoint 6-9 to explain how the effects of inhalants
will vary widely depending on the substance used.
Typically the inhalant abuser will generally appear
similar to someone who is impaired by depressant
drugs. Inhalant abusers can be detected and distinguished from other drug abusers
because they will usually produce the chemical odor of the inhaled substance on their
breath about their person.
The instructor should use PowerPoint 6-10 to discuss the three sub-categories of inhalants.
• Volatile Solvents – These chemicals are usually inhaled directly from their source. Some
of these include gasoline, paint thinners, fingernail polish remover, cleaning fluid, dry
erase markers, paint, and model airplane glue.
• Aerosols – These chemicals are discharged from pressurized containers by propellants
or compressed gas. These are usually inhaled from a secondary source such as a soaked
rag, paper bag, or plastic bag. Some of the commonly abused aerosols include hair
sprays deodorants, vegetable frying pan lubricants, insecticides, and spray paint.

6-10
• Anesthetic Gases – This sub-category is the least abused of the three, mainly because of
the expense and unavailability. Anesthetic gases are drugs which allow the user to
disassociate pain and are generally used for medical produces involving surgery. These
can be inhaled from the source directly. Some of the anesthetic gases include
chloroform, amyl nitrite, butyl nitrite, isobutyl nitrite, and nitrous oxide (whip cream
propellant).
F. Cannabis [PowerPoint 6-11] – Cannabis is likely the most
well-known of the seven categories since it includes
marijuana and hashish. The primary psychoactive ingredient
in cannabis is Delta-9-Tetrahydrocannabinol (THC). THC is
found primarily in the leaves and flower of the marijuana
plant. Different varieties of cannabis contain various concentrations of THC.
Cannabis includes marijuana, hash, hash oil, and the synthetic drugs Marinol (Dronabinol).
Marijuana is the most common and well-known of the drugs in this category, but there are
other forms as well. Marinol (Dronabinol) is a synthetic form of THC and has legitimate
medical use as an anti-vomiting agent, commonly associated with cancer chemotherapy.
Additional uses include treatment for glaucoma patients or as appetite enhancers for
anorexia disorders.
• Effects of Cannabis (PowerPoint 6-11) – The instructor should cover the effects of
cannabis and discuss how they depend on the strength of the THC in the dose
consumed. THC concentrations decades ago peaked at relatively low levels (3-6%);
however, current levels are being reported at more than 30%. The increase in THC levels
is due to hybridization and better cultivation techniques used by producers.

6-11
o Subjects impaired by cannabis have a very brief attention span and are not able
to divide mental and physical tasks well. The subjective effects can vary
considerably but they will exhibit disorientation in tasks requiring time and
distance perception and may also display paranoia.
Effects of Drugs on Driving
1. What is Drugged Driving? [PowerPoint 6-12] - The
instructor should begin the section by defining drugged
driving using PowerPoint 6-12. The principal concern
regarding drugged driving is that driving under the
influence of any drug that acts on the brain could impair
one’s motor skills, reaction time, and judgment. Drugged driving is a public health concern
because it puts not only the driver risk, but also passengers and others who share the road.
2. Why is Drugged Driving Hazardous? [PowerPoint 6-13] –
Drugs acting on the brain can alter perception, cognition,
attention, balance, coordination, reaction time, and other
faculties required for safe driving. The effects of specific
drugs of abuse differ depending on their mechanisms of
action, the amount consumed, the history of the user, and other factors.

6-12
The instructor should use PowerPoint 6-13 and 6-14 to discuss the common effects of drugs on
driving, which include:
Coordination
• Effect on nerves/muscles
• Steering
• Braking
• Acceleration
• Manipulation
Reaction Time
• Insufficient response
• Reaction
Judgment
• Cognitive effects
• Risk reduction
• Avoiding potential hazards
• Risk-taking behavior increased
• Inattention
• Decreased fear
• Exhilaration
• Loss of control
Tracking
• Staying in lane
• Maintaining distance

6-13
Attention [PowerPoint 6-14]
• Divided attention affected negatively
• Not focused
• Time shared task with high demand for
information processing
Perception
• 90% of information processed while driving is visual
• Glare resistance
• Recovery
• Dark and light adaptation
• Dynamic visual acuity
3. Specific Drug Effects on Driving [PowerPoint 6-15] – This
section focuses primarily on specific drug effects on driving.
Several categories will be briefly discussed and explored, but
the instructor should note that there is a large amount of
drugs that will not be able to be properly discussed or
explored during this session. Using PowerPoint 6-15, 6-16, and 6-17, the instructor should
discuss the below information.
A. Cocaine – Cocaine is classified as a stimulant. Observed signs of impairment in driving
performance have included subjects speeding, losing control of their vehicle, causing
collisions, turning in front of other vehicles, high-risk behavior, inattentive driving and poor
impulse control. As the effects of cocaine wear off subjects may suffer from fatigue,
depression, sleepiness, and inattention.
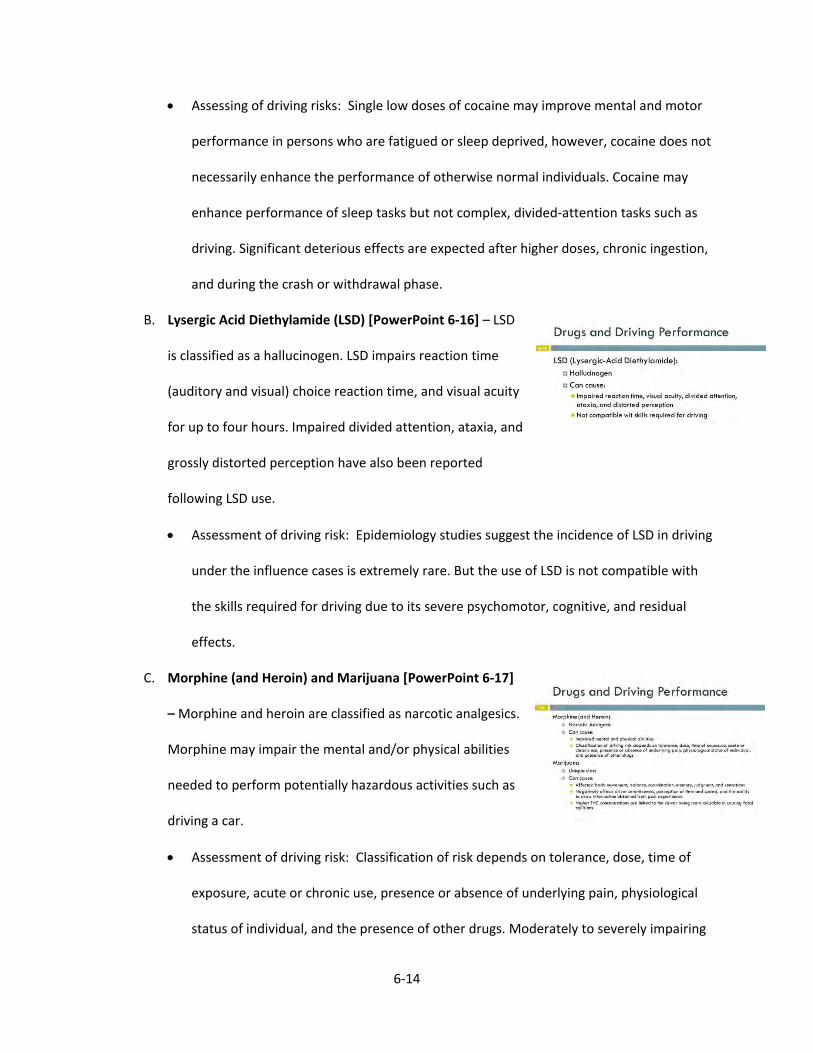
6-14
• Assessing of driving risks: Single low doses of cocaine may improve mental and motor
performance in persons who are fatigued or sleep deprived, however, cocaine does not
necessarily enhance the performance of otherwise normal individuals. Cocaine may
enhance performance of sleep tasks but not complex, divided-attention tasks such as
driving. Significant deterious effects are expected after higher doses, chronic ingestion,
and during the crash or withdrawal phase.
B. Lysergic Acid Diethylamide (LSD) [PowerPoint 6-16] – LSD
is classified as a hallucinogen. LSD impairs reaction time
(auditory and visual) choice reaction time, and visual acuity
for up to four hours. Impaired divided attention, ataxia, and
grossly distorted perception have also been reported
following LSD use.
• Assessment of driving risk: Epidemiology studies suggest the incidence of LSD in driving
under the influence cases is extremely rare. But the use of LSD is not compatible with
the skills required for driving due to its severe psychomotor, cognitive, and residual
effects.
C. Morphine (and Heroin) and Marijuana [PowerPoint 6-17]
– Morphine and heroin are classified as narcotic analgesics.
Morphine may impair the mental and/or physical abilities
needed to perform potentially hazardous activities such as
driving a car.
• Assessment of driving risk: Classification of risk depends on tolerance, dose, time of
exposure, acute or chronic use, presence or absence of underlying pain, physiological
status of individual, and the presence of other drugs. Moderately to severely impairing
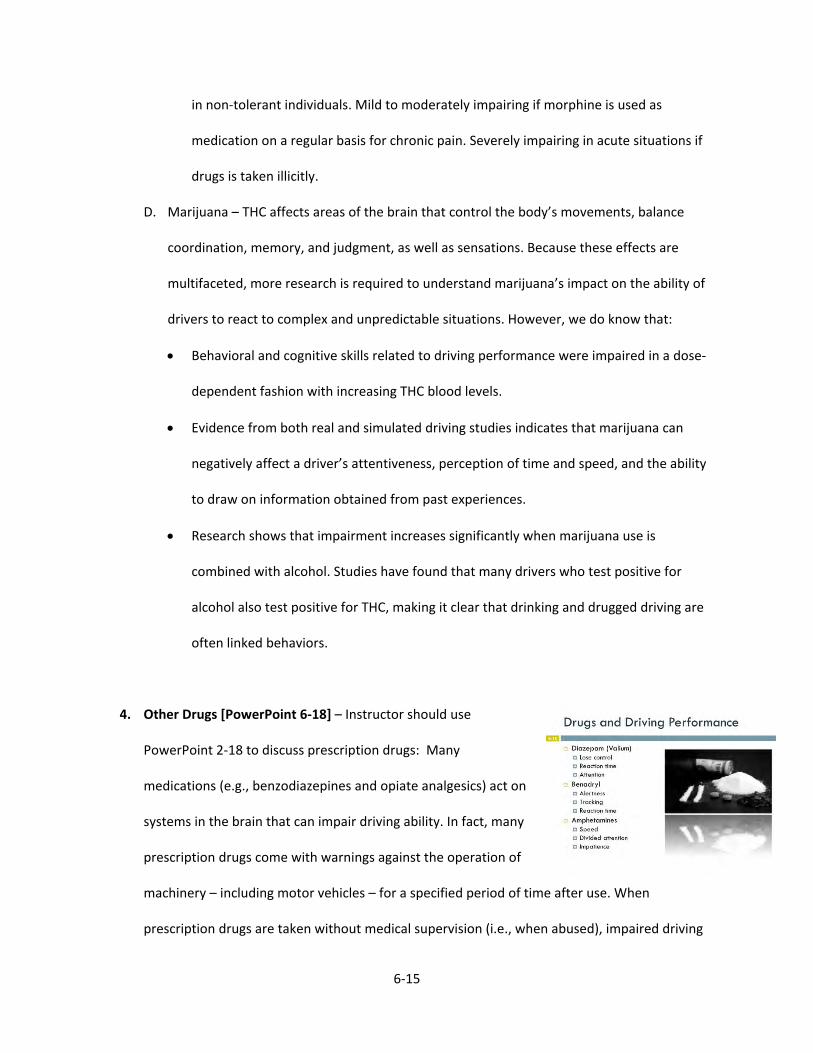
6-15
in non-tolerant individuals. Mild to moderately impairing if morphine is used as
medication on a regular basis for chronic pain. Severely impairing in acute situations if
drugs is taken illicitly.
D. Marijuana – THC affects areas of the brain that control the body’s movements, balance
coordination, memory, and judgment, as well as sensations. Because these effects are
multifaceted, more research is required to understand marijuana’s impact on the ability of
drivers to react to complex and unpredictable situations. However, we do know that:
• Behavioral and cognitive skills related to driving performance were impaired in a dose-
dependent fashion with increasing THC blood levels.
• Evidence from both real and simulated driving studies indicates that marijuana can
negatively affect a driver’s attentiveness, perception of time and speed, and the ability
to draw on information obtained from past experiences.
• Research shows that impairment increases significantly when marijuana use is
combined with alcohol. Studies have found that many drivers who test positive for
alcohol also test positive for THC, making it clear that drinking and drugged driving are
often linked behaviors.
4. Other Drugs [PowerPoint 6-18] – Instructor should use
PowerPoint 2-18 to discuss prescription drugs: Many
medications (e.g., benzodiazepines and opiate analgesics) act on
systems in the brain that can impair driving ability. In fact, many
prescription drugs come with warnings against the operation of
machinery – including motor vehicles – for a specified period of time after use. When
prescription drugs are taken without medical supervision (i.e., when abused), impaired driving

6-16
and other harmful reactions can also result. In short, drugged driving is a dangerous activity that
puts all drivers at risk.
Summary – While far less about the effects of non-alcoholic drugs on driving is known than about the
effects of alcohol on driving, the information covered in this topic should help students make good
decisions about using drugs and especially driving after using any type of drug (legal or illegal).

7-1
Topic 7
Ways to Deal with Alcohol/Drug Problems, Making Good Decisions, and Post-Test
(20 Minutes)
Goal: Have students apply what has been learned in the curriculum to
prevent poor choices about alcohol, drugs, and driving
Objectives:
• Identify and evaluate ways to deal with alcohol, drugs, and traffic safety problems
• Analyze and complete decision-making tasks
Content and Student Learning Activities
1. This topic is probably the most important one in the curriculum as knowing alcohol, drug, and
traffic safety laws, effects of alcohol and other drugs on drivers, learning alcoholism signs, etc.
are of little value unless such knowledge is personally applied on a consistent basis. This topic
will provide exercises and activities which will assist students to make and carry out responsible
alcohol, drugs, and traffic safety decisions.
2. Possible Corrective Measures to Present and Deal with
Inappropriate Alcohol and Drug Driving Situations
[PowerPoint 7-2] – Using PowerPoint 7-2 (title only), ask the
class what they think are possible solutions to alcohol, drug,
and driving situations and problems. After all ideas have

7-2
been provided, use the items in PowerPoint 7-2 to discuss any items not brought out by
students.
3. The instructor should use the handout found at the end of the topic to have students formulate
a plan to present future problems with alcohol and other drugs. After all students complete this,
ask any who wish to share their ideas with the class to do so.
4. The instructor should administer the post-test after completion of the content in Topic 7 (found
at the end of the topic.)
7-3
Plan to Prevent Alcohol and Drug Problems
To prevent problems with alcohol and other drugs, I will…
1. Personal Related
2. Driving Related
3. Other

7-4
Topic 8 Post-Test10 Minutes
Name: ______________________________________________ Date: _____________________
True/False – If any part of the statement is false, the entire statement is false.
______1.) Fermentation of grape juice can produce an alcoholic beverage which is up to 50% alcohol.
______2.) There are no positive uses of alcohol.
______3.) Young male drivers are more likely to be in a fatal alcohol-related crash than young females.
______4.) Texas ranks third in the number of alcohol-related fatal traffic crashes.
______5.) One definition of intoxication in Texas is any loss of mental or physical faculties.
______6.) In Texas, persons under 21 can receive a DUI but not a DWI charge.
______7.) ALR relates to failing a breath or blood test.
______8.) A person under age 21 can lose his/her driver’s license if he/she purchases alcohol.
______9.) Public intoxication penalties are the same for persons under and over 21 in Texas.
______10.) One 12 oz. can of regular beer has more pure alcohol than a 1 oz. shot of 80-proof whiskey.
______11.) If a man and woman of equal weight drank the same alcoholic beverage, the woman’s BAC typically would be higher.
______12.) Drinking beer and whiskey together can produce a synergistic effect.
______13.) The majority of alcohol removed from the body is by breath, sweat, and urination.

7-5
______14.) All persons remove alcohol at the rate of 1 drink per hour.
______15.) Very little driving loss occurs until a BAC of .08 is reached.
______16.) The risk of a fatal traffic crash is related to the BAC reached.
______17.) Alcohol is rarely involved in non-traffic accidents.
______18.) Any use of alcohol by persons under 21 in Texas is considered alcohol abuse.
______19.) Thinking you might have a problem with alcohol is a sign of alcoholism.
______20.) Marijuana tends to produce slower driving speeds.
______21.) Barbiturate drugs are depressants.
______22.) Inhalants tend to have shorter duration of effects.
______23.) Drugs can affect driver attention.
______24.) Ignition interlock devices on all vehicles would prevent all cases of alcohol impaired driving.
______25.) Higher prices for alcohol reduce alcohol consumption.

7-6
Post-Test Key
Name: ______________________________________________ Date: _____________________
True/False – If any part of the statement is false, the entire statement is false.
F 1.) Fermentation of grape juice can produce an alcoholic beverage which is up to 50% alcohol.
F 2.) There are no positive uses of alcohol.
T 3.) Young male drivers are more likely to be in a fatal alcohol-related crash than young females.
F 4.) Texas ranks third in the number of alcohol-related fatal traffic crashes.
F 5.) One definition of intoxication in Texas is any loss of mental or physical faculties.
F 6.) In Texas, persons under 21 can receive a DUI but not a DWI charge.
T 7.) ALR relates to failing a breath or blood test.
T 8.) A person under age 21 can lose his/her driver’s license if he/she purchases alcohol.
F 9.) Public intoxication penalties are the same for persons under and over 21 in Texas.
T 10.) One 12 oz. can of regular beer has more pure alcohol than a 1 oz. shot of 80-proof whiskey.
T 11.) If a man and woman of equal weight drank the same alcoholic beverage, the woman’s BAC typically would be higher.
F 12.) Drinking beer and whiskey together can produce a synergistic effect.
F 13.) The majority of alcohol removed from the body is by breath, sweat, and urination.

7-7
F 14.) All persons remove alcohol at the rate of 1 drink per hour.
F 15.) Very little driving loss occurs until a BAC of .08 is reached.
T 16.) The risk of a fatal traffic crash is related to the BAC reached.
F 17.) Alcohol is rarely involved in non-traffic accidents.
T 18.) Any use of alcohol by persons under 21 in Texas is considered alcohol abuse.
T 19.) Thinking you might have a problem with alcohol is a sign of alcoholism.
T 20.) Marijuana tends to produce slower driving speeds.
T 21.) Barbiturate drugs are depressants.
F 22.) Inhalants tend to have shorter duration of effects.
T 23.) Drugs can affect driver attention.
F 24.) Ignition interlock devices on all vehicles would prevent all cases of alcohol impaired driving.
T 25.) Higher prices for alcohol reduce alcohol consumption.