Embed Size (px)
Citation preview
Texas Radiation Texas Radiation Protection Program Protection Program Outcomes Outcomes
Robert Emery, DrPH, CHP, CIH, CSP, RBP, CHMM, CPP, ARMVice President for Safety, Health, Environment & Risk ManagementThe University of Texas Heath Science Center at Houston
Associate Professor of Occupational HealthThe University of Texas School of Public Health 1851 Crosspoint Drive OCB 1.330Houston, Texas(713) 500-8100
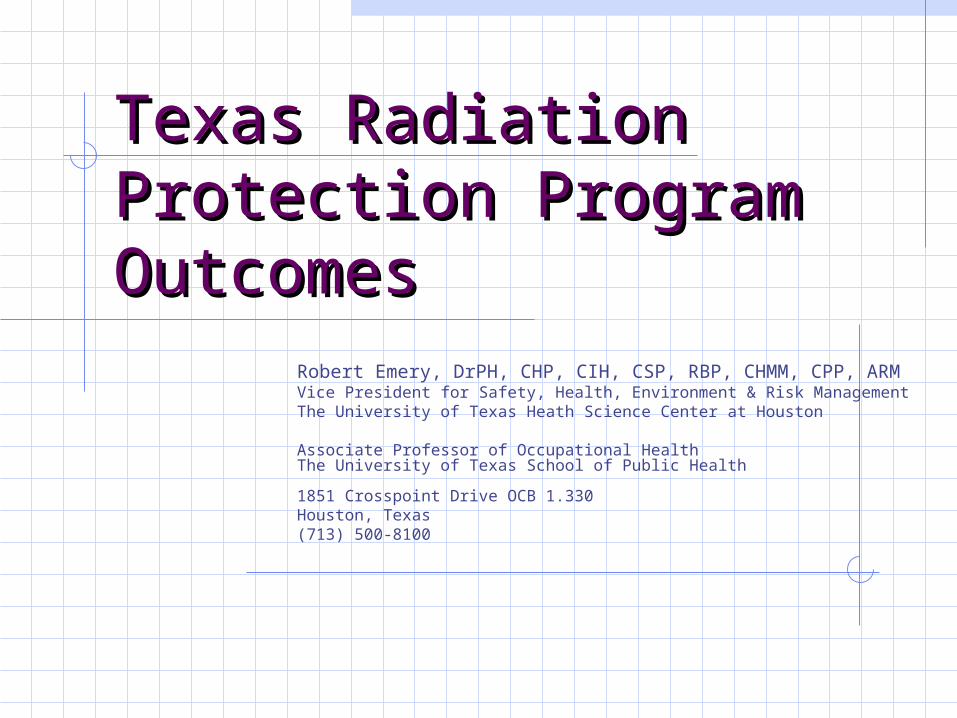
Radiation Protection Program Radiation Protection Program OutcomesOutcomes
Ideally, a public health regulatory control program would rely on health outcome data as its “systemic” outcome measure of performance
But since acute radiation injuries are rare, and latent illnesses possibly not recognized as radiation-related, other “organic” outcome indicators must be relied upon, such as:
Inspection results (violations) Reported incidents Reported complaints Specific events
Misadministration/dose irregularities Overexposures Stolen sources
Scope of Texas Operations
Approximately 15,000 registrants of radiation producing devices
Approximately 1,500 licensees of radioactive materials
All permit holders are inspected on a pre-determined schedule
Outcome Data
DSHS maintains extensive records on Violations Incidents, complaints
UTHSCH students accessed this data from as far back as 1956 Format varied from paper, floppy disk, CD Entered into standardized electronic format
Represents the most comprehensive radiation protection outcome dataset in the nationWhat can we learn from the data….
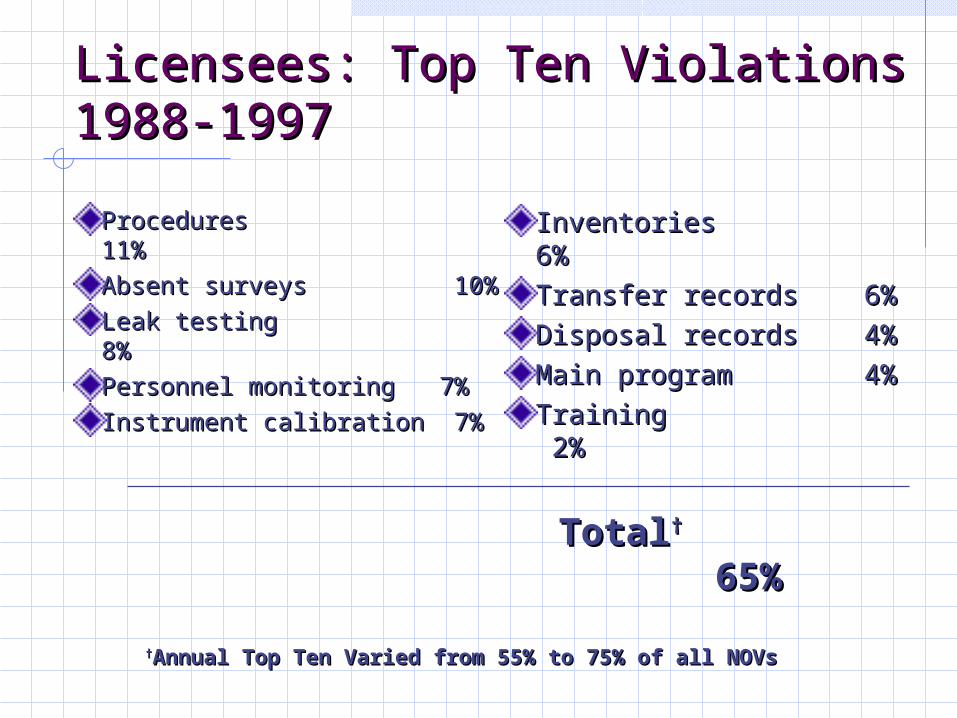
Licensees: Top Ten Violations Licensees: Top Ten Violations 1988-19971988-1997
Procedures 11%Procedures 11%
Absent surveys 10%Absent surveys 10%
Leak testing 8%Leak testing 8%
Personnel monitoring 7%Personnel monitoring 7%
Instrument calibration 7%Instrument calibration 7%
Inventories 6%Inventories 6%
Transfer records 6%Transfer records 6%
Disposal records 4%Disposal records 4%
Main program 4%Main program 4%
Training 2%Training 2%
TotalTotal†† 65% 65%
††Annual Top Ten Varied from 55% to 75% of all NOVsAnnual Top Ten Varied from 55% to 75% of all NOVs
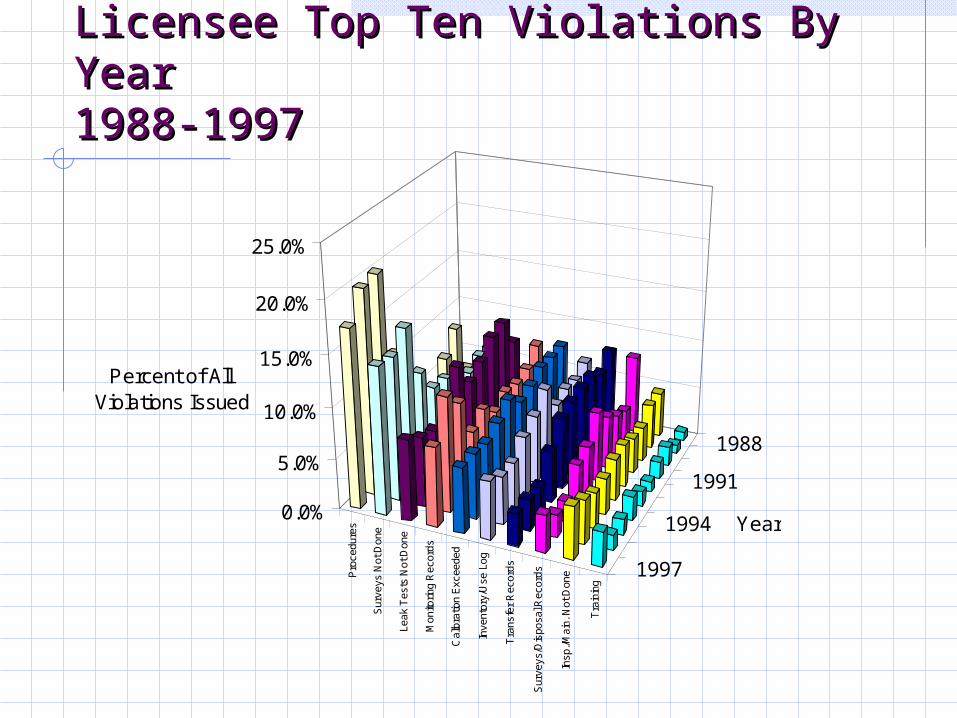
Licensee Top Ten Violations By YearLicensee Top Ten Violations By Year1988-19971988-1997
1988
1991
1994
1997Pro
cedu
res
Sur
veys
Not
Don
e
Leak
Tes
ts N
ot D
one
Mon
itorin
g R
ecor
ds
Cal
ibra
tion
Exc
eede
d
Inve
ntor
y/U
se L
og
Tra
nsfe
r R
ecor
ds
Sur
veys
/Dis
posa
l Rec
ords
Insp
./Mai
n. N
ot D
one
Tra
inin
g
0.0%
5.0%
10.0%
15.0%
20.0%
25.0%
Percent of All Violations Issued
Year
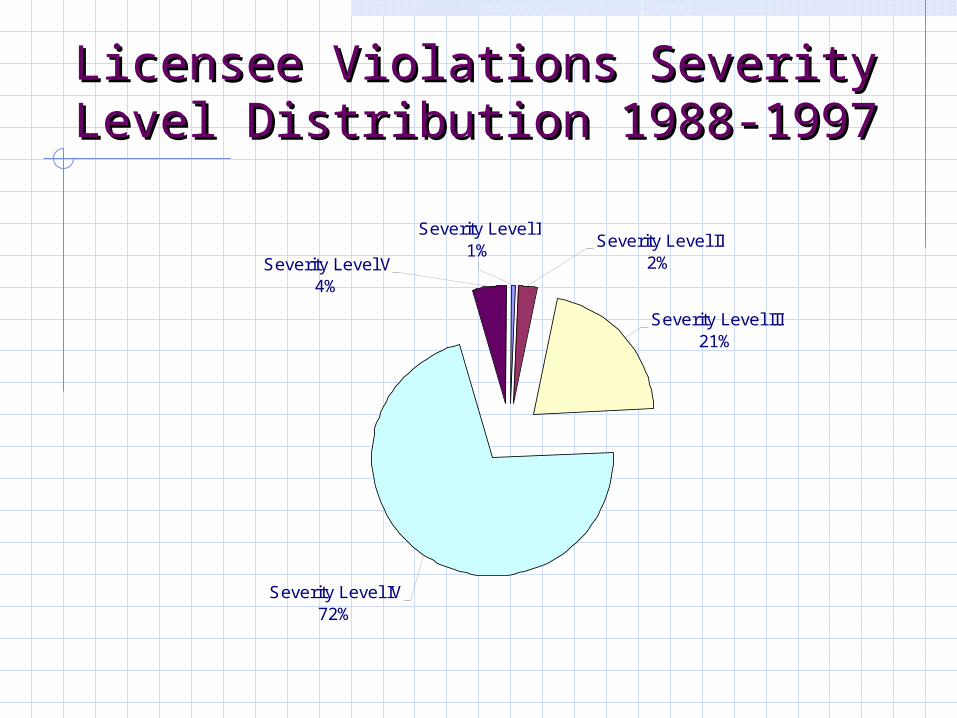
Licensee Violations Severity Level Licensee Violations Severity Level Distribution 1988-1997Distribution 1988-1997
Severity Level IV72%
Severity Level III21%
Severity Level I1%
Severity Level V4%
Severity Level II2%

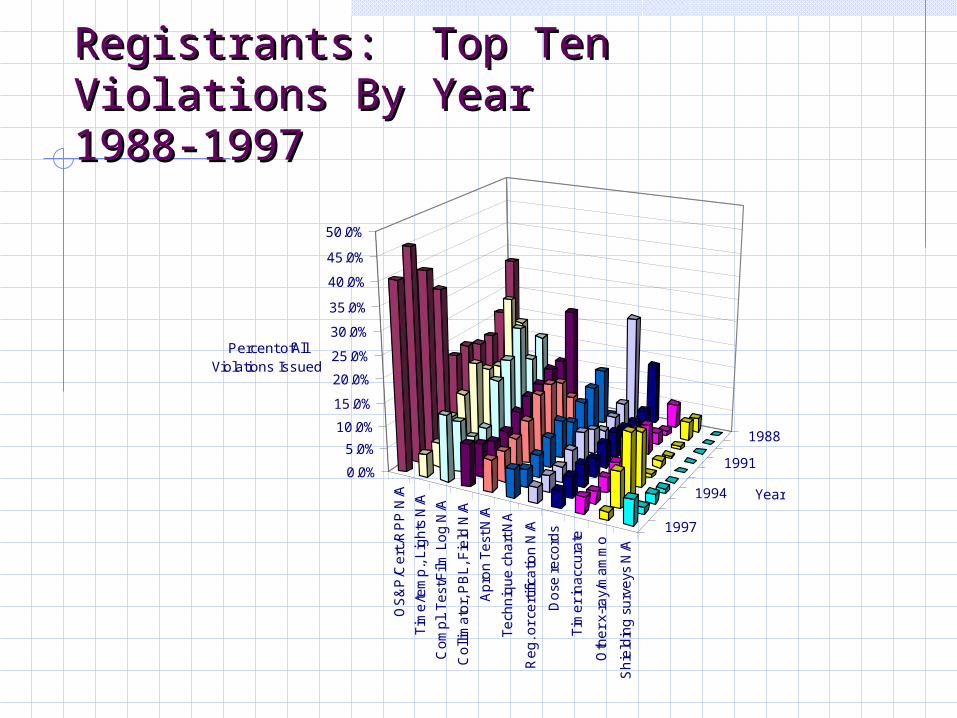
Registrants: Top Ten Registrants: Top Ten Violations 1988-1997Violations 1988-1997
OS&P NC/NA 20%OS&P NC/NA 20%
Time/temp chart 11%Time/temp chart 11%
No QC 10%No QC 10%
Alignment 7%Alignment 7%
Annual PE tests 6%Annual PE tests 6%
Technique chart 5%Technique chart 5%
Reg not current 4%Reg not current 4%
Dosimetry 4%Dosimetry 4%
Timer 3%Timer 3%
““Other x-ray” Other x-ray” 3%3%
TotalTotal†† 73% 73%
††Annual Top Ten Varied from 61% to 78% of all NOVsAnnual Top Ten Varied from 61% to 78% of all NOVs
1988
1991
1994
1997
OS
&P
/Ce
rt./R
PP
N/A
Tim
e/te
mp
., L
igh
ts N
/A
Co
mp
l. T
est
/Film
Lo
g N
/A
Co
llim
ato
r, P
BL
, Fie
ld N
/A
Ap
ron
Te
st N
/A
Te
chn
iqu
e c
ha
rt N
A
Re
g. o
r ce
rtifi
catio
n N
/A
Do
se r
eco
rds
Tim
er
ina
ccu
rate
Oth
er
x-ra
y/m
am
mo
Sh
ield
ing
su
rve
ys N
/A
0.0%
5.0%
10.0%
15.0%
20.0%
25.0%
30.0%
35.0%
40.0%
45.0%
50.0%
Percent ofAll Violations Issued
Year
Registrants: Top Ten Violations By Registrants: Top Ten Violations By YearYear1988-19971988-1997
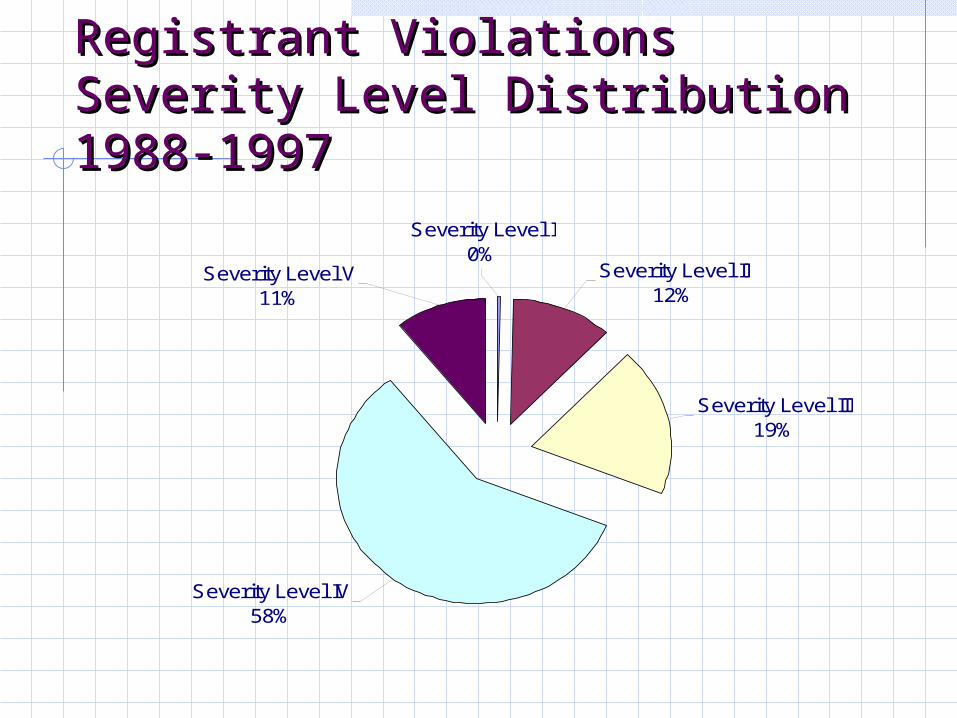
Registrant Violations Severity Registrant Violations Severity Level Distribution 1988-1997Level Distribution 1988-1997
Severity Level IV58%
Severity Level III19%
Severity Level II12%
Severity Level I0%
Severity Level V11%
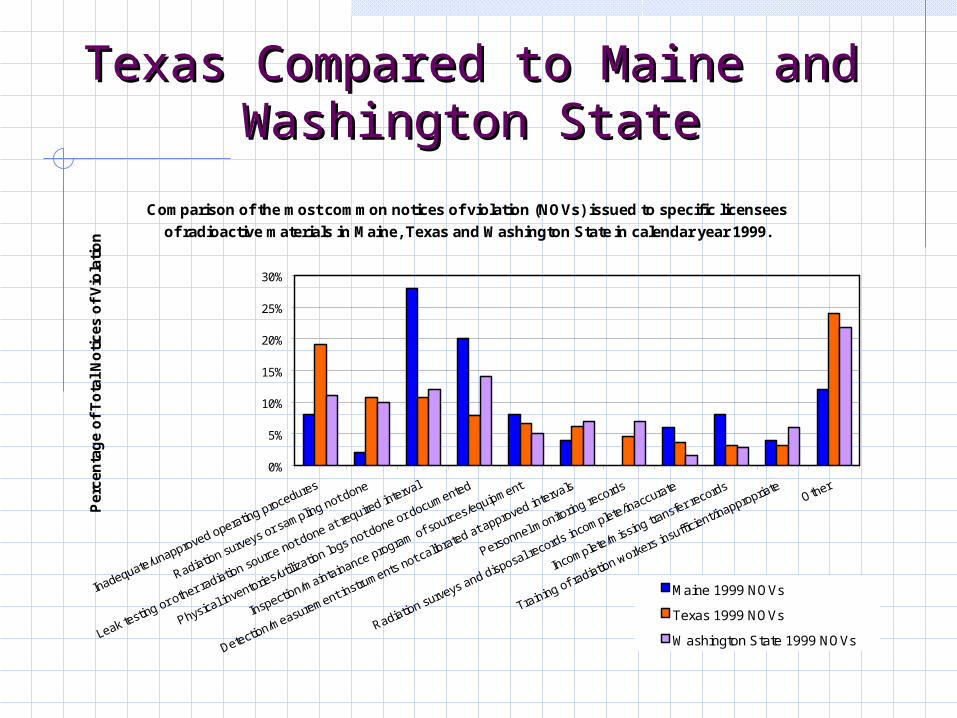
Texas Compared to Maine and Texas Compared to Maine and Washington StateWashington State
Comparison of the most common notices of violation (NOVs) issued to specific licensees
of radioactive materials in Maine, Texas and Washington State in calendar year 1999.
0%
5%
10%
15%
20%
25%
30%
Inadequate/unapproved operating procedures
Radiation surveys or sampling not done
Leak testing or other radiation source not done at re
quired interval
Physical inventories/utilization logs not done or documented
Inspection/maintainance program of sources/equipment
Detection/measurement instruments not calibrated at approved intervals
Personnel monitoring records
Radiation surveys and disposal records incomplete/inaccurate
Incomplete/missing transfer re
cords
Training of radiation workers insufficient/in
appropriateOther
Pe
rce
nta
ge
of
To
tal
No
tic
es o
f V
iola
tio
n
Maine 1999 NOVs
Texas 1999 NOVs
Washington State 1999 NOVs
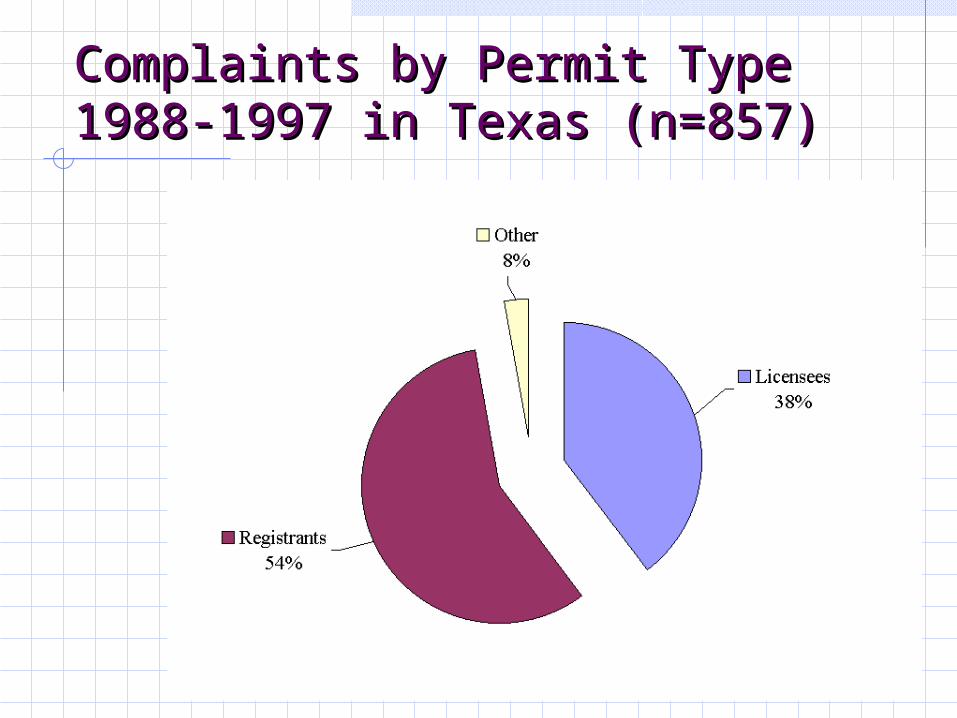
Complaints by Permit TypeComplaints by Permit Type1988-1997 in Texas (n=857)1988-1997 in Texas (n=857)
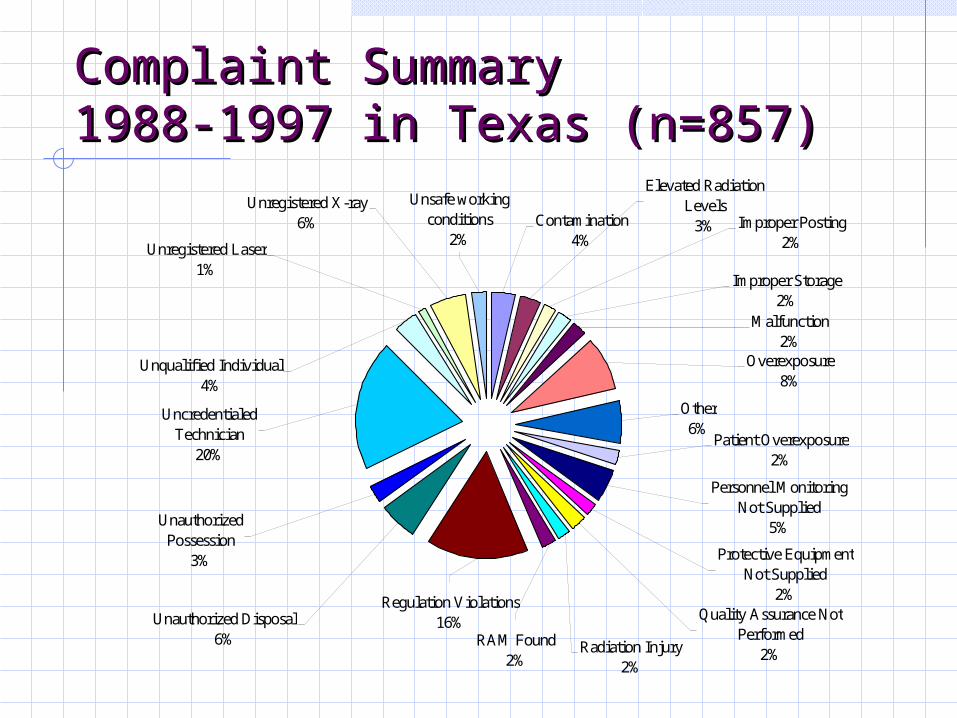
Uncredentialed Technician
20%
Unauthorized Possession
3%
Unauthorized Disposal6%
Regulation Violations16%
Radiation Injury2%
RAM Found2%
Quality Assurance Not Performed
2%
Protective Equipment Not Supplied
2%
Personnel Monitoring Not Supplied
5%
Patient Overexposure2%
Other6%
Overexposure8%
Malfunction2%
Improper Storage2%
Improper Posting2%
Elevated Radiation Levels
3%Contamination4%
Unsafe working conditions
2%
Unregistered X-ray6%
Unregistered Laser1%
Unqualified Individual4%
Complaint SummaryComplaint Summary1988-1997 in Texas (n=857)1988-1997 in Texas (n=857)

Incidents by Permit Type Incidents by Permit Type 1988-1997 in Texas (n=2,126)1988-1997 in Texas (n=2,126)
Other8%
Registrants23%
Licensees69%
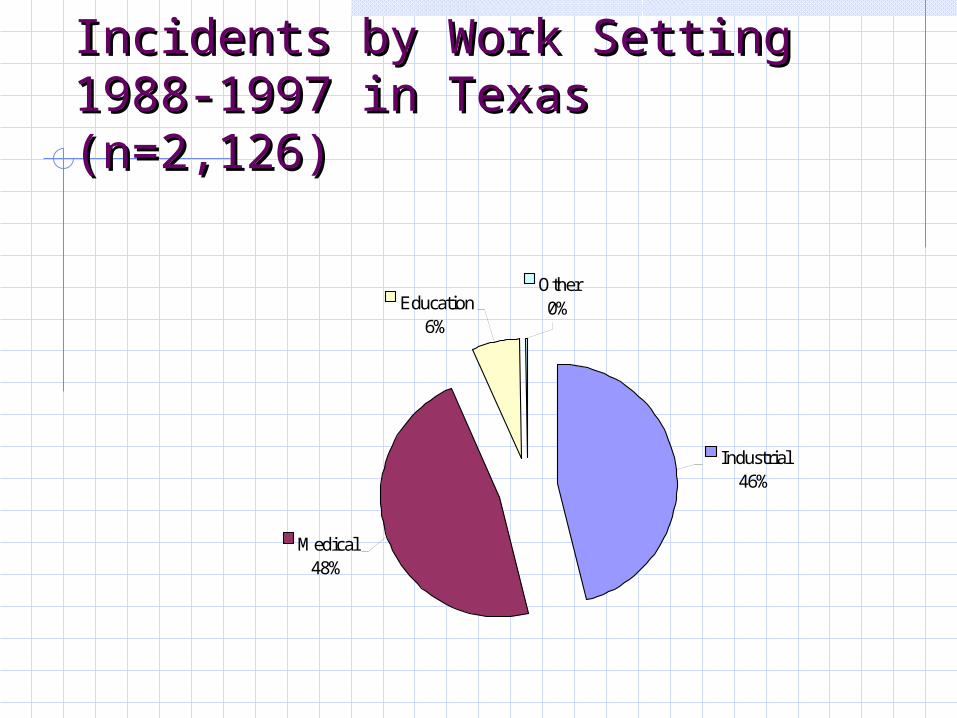
Incidents by Work Setting Incidents by Work Setting 1988-1997 in Texas (n=2,126)1988-1997 in Texas (n=2,126)
Industrial46%
Medical48%
Education6%
Other0%
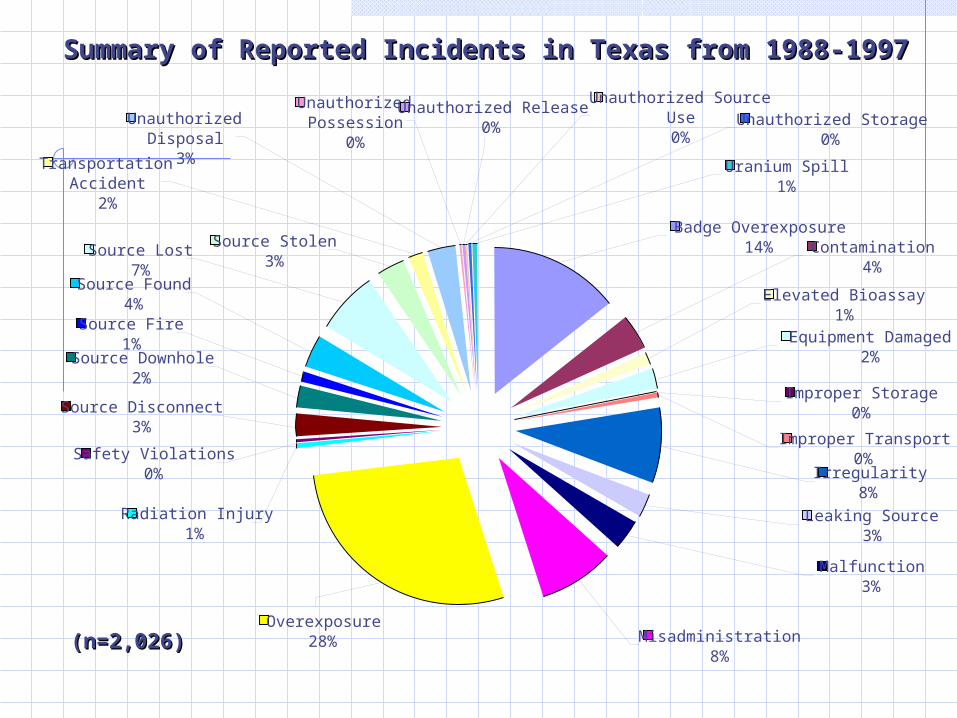
Summary of Reported Incidents in Texas from 1988-1997Summary of Reported Incidents in Texas from 1988-1997
Overexposure28% Misadministration
8%
Malfunction3%
Leaking Source3%
Irregularity8%
Improper Storage0%
Improper Transport0%
Equipment Damaged2%
Elevated Bioassay1%
Contamination4%
Badge Overexposure14%Source Stolen
3%
Unauthorized Possession
0%
Unauthorized Release0%
Unauthorized Source Use0%
Unauthorized Storage0%
Uranium Spill1%
Unauthorized Disposal
3%Transportation Accident
2%
Source Lost7%
Source Fire1%
Source Found4%
Source Downhole2%
Radiation Injury1%
Safety Violations0%
Source Disconnect3%
(n=2,026)(n=2,026)
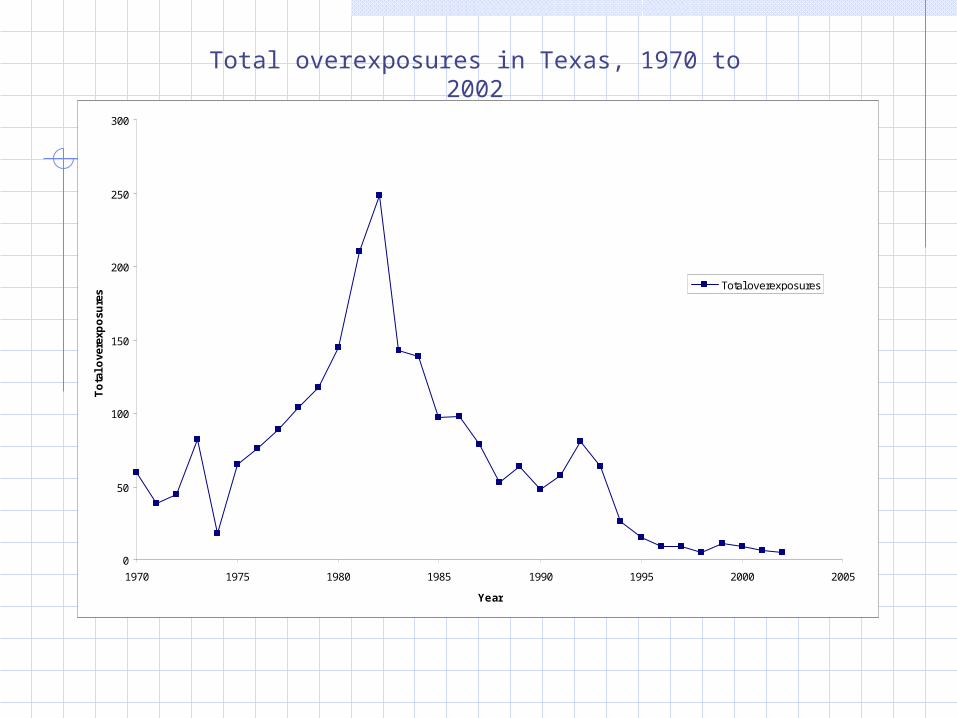
Total overexposures in Texas, 1970 to 2002
0
50
100
150
200
250
300
1970 1975 1980 1985 1990 1995 2000 2005
Year
To
tal o
vere
xpo
sure
s
Total overexposures
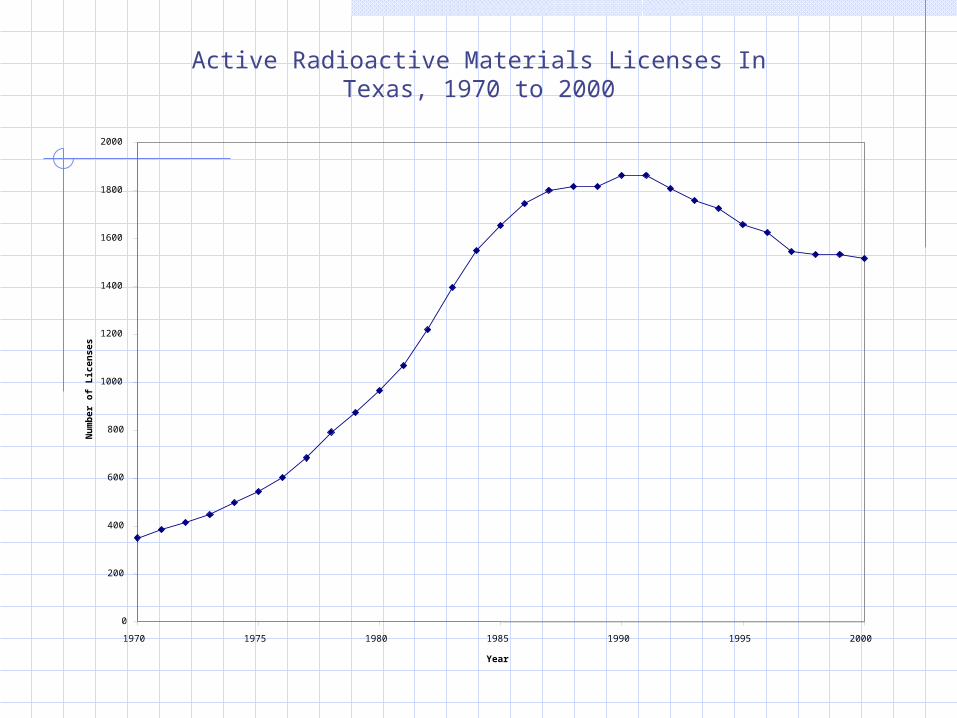
Active Radioactive Materials Licenses In Texas, 1970 to 2000
0
200
400
600
800
1000
1200
1400
1600
1800
2000
1970 1975 1980 1985 1990 1995 2000
Year
Nu
mb
er o
f L
icen
ses
0
50
100
150
200
250
300
1970 1975 1980 1985 1990 1995 2000
Year
Ove
rexp
osur
e
0
200
400
600
800
1000
1200
1400
1600
1800
2000
Rad
ioac
tive
licen
ses
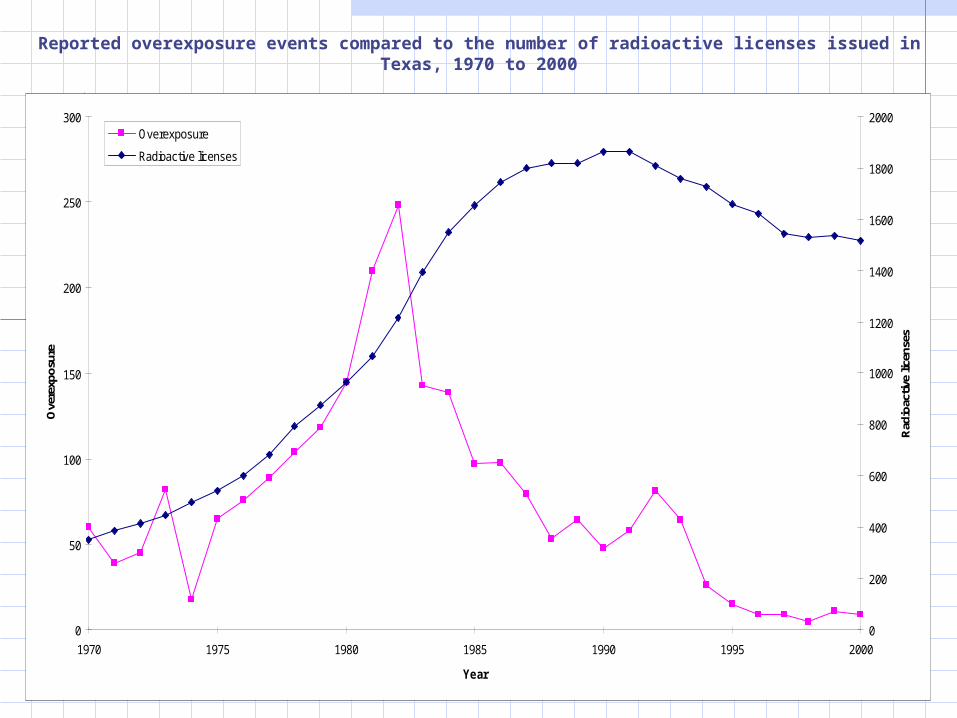
Overexposure
Radioactive licenses
Reported overexposure events compared to the number of radioactive licenses issued in Texas, 1970 to 2000
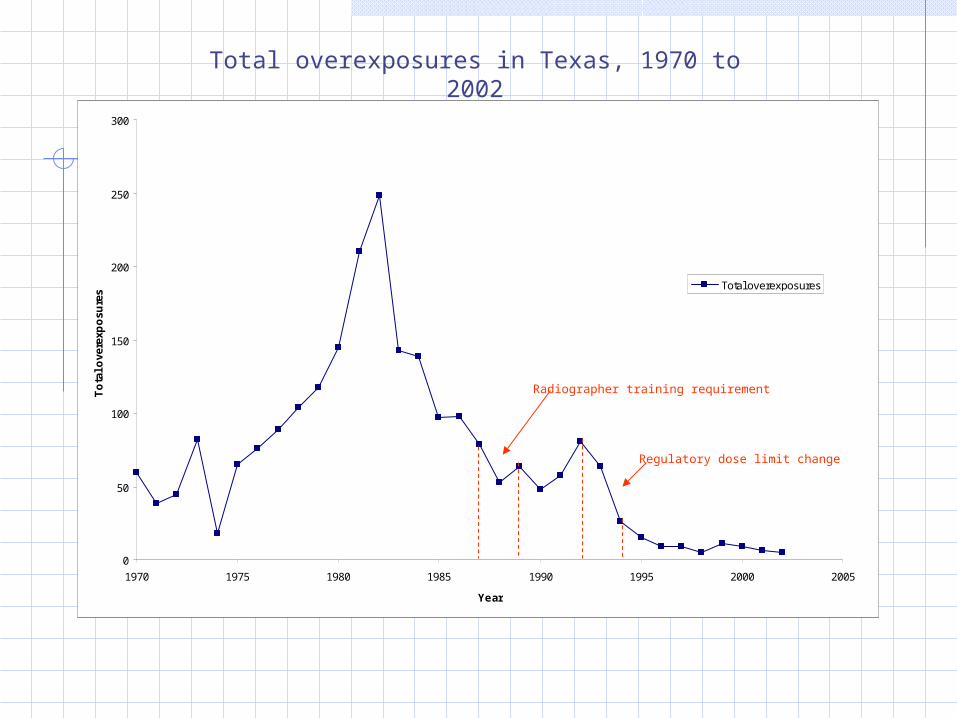
Total overexposures in Texas, 1970 to 2002
0
50
100
150
200
250
300
1970 1975 1980 1985 1990 1995 2000 2005
Year
To
tal o
vere
xpo
sure
s
Total overexposures
Radiographer training requirement
Regulatory dose limit change
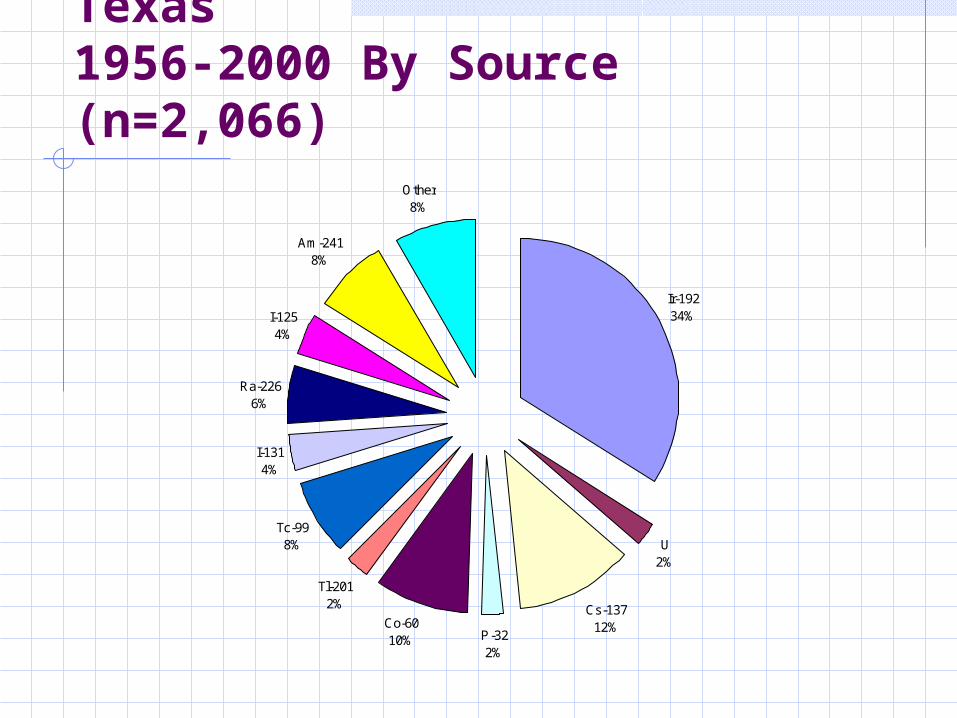
Ir-19234%
U2%
Cs-13712%
P-322%
Co-6010%
Tl-2012%
Tc-998%
I-1314%
Ra-2266%
I-1254%
Am-2418%
Other8%
Overexposure Incidents in Texas 1956-2000 By Source (n=2,066)
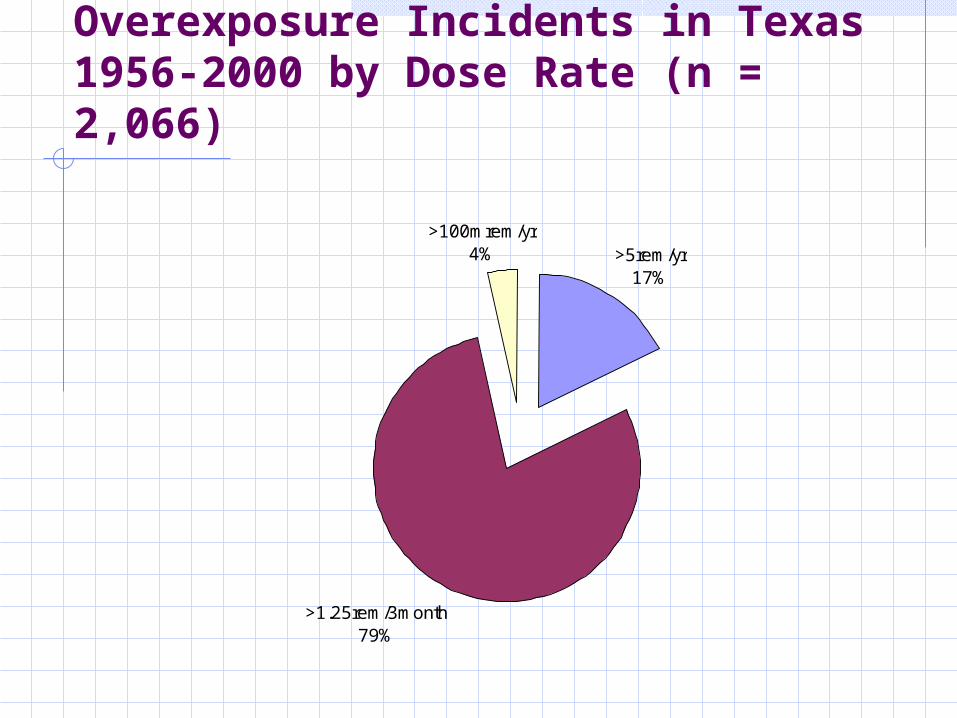
>5rem/yr17%
>1.25rem/3month79%
>100mrem/yr4%
Overexposure Incidents in Texas 1956-2000 by Dose Rate (n = 2,066)
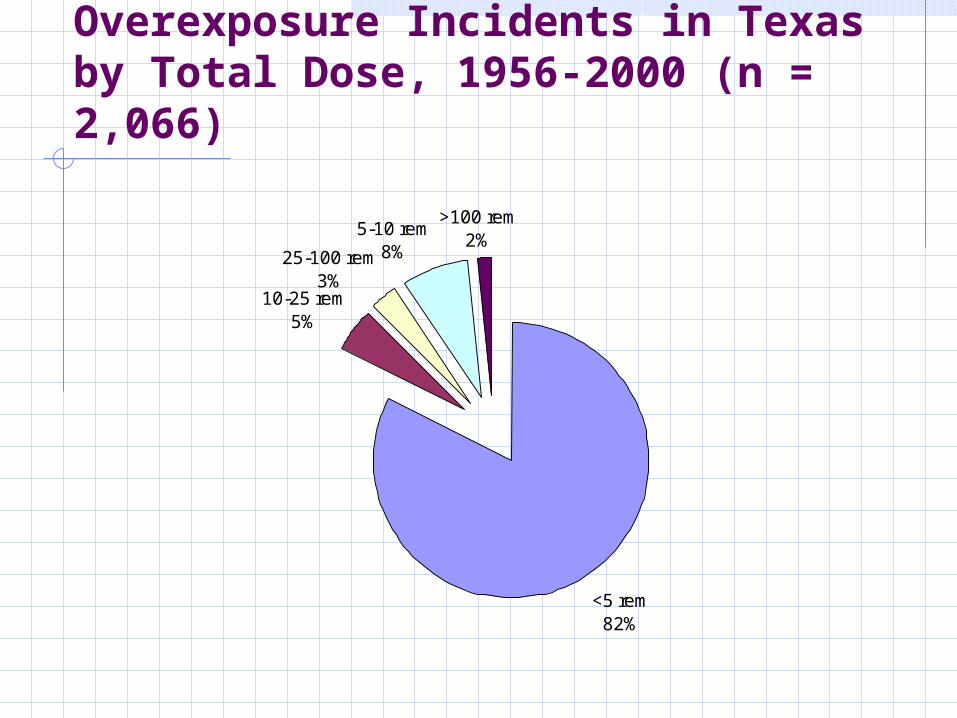
<5 rem82%
10-25 rem5%
25-100 rem3%
5-10 rem8%
>100 rem2%
Overexposure Incidents in Texas by Total Dose, 1956-2000 (n = 2,066)
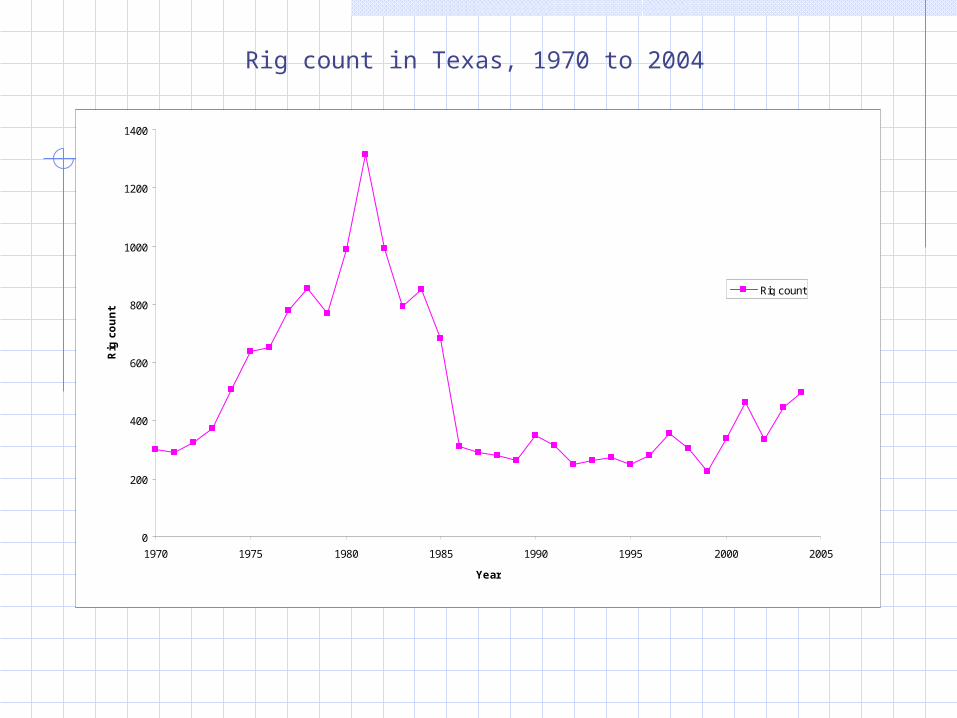
Rig count in Texas, 1970 to 2004
0
200
400
600
800
1000
1200
1400
1970 1975 1980 1985 1990 1995 2000 2005
Year
Rig
co
un
t
Rig count
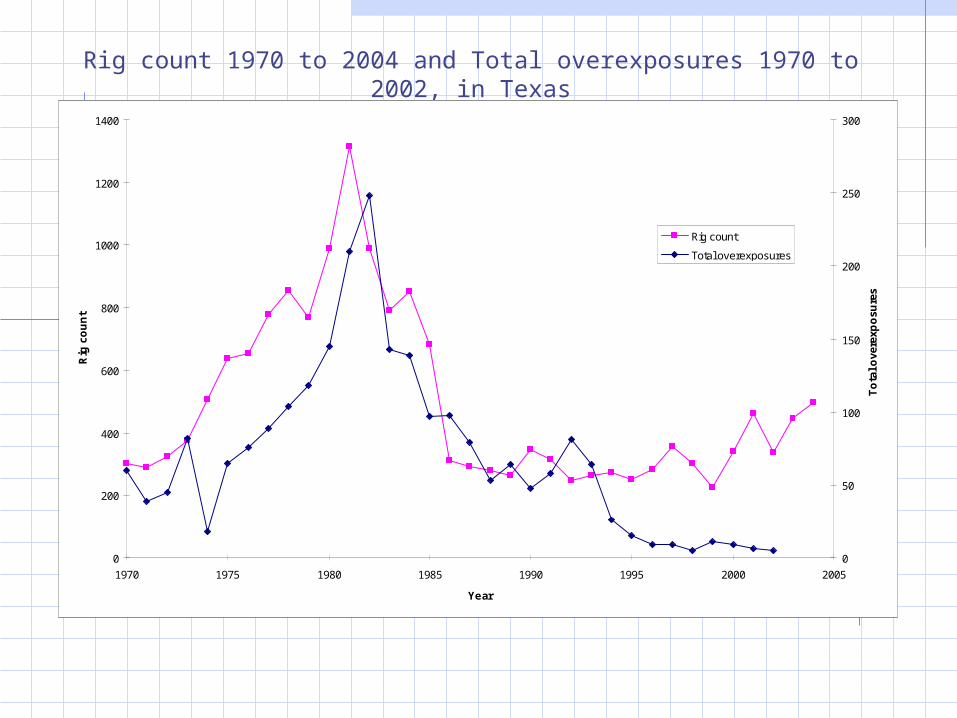
Rig count 1970 to 2004 and Total overexposures 1970 to 2002, in Texas
0
200
400
600
800
1000
1200
1400
1970 1975 1980 1985 1990 1995 2000 2005
Year
Rig
co
un
t
0
50
100
150
200
250
300
To
tal o
vere
xpo
sure
s
Rig count
Total overexposures
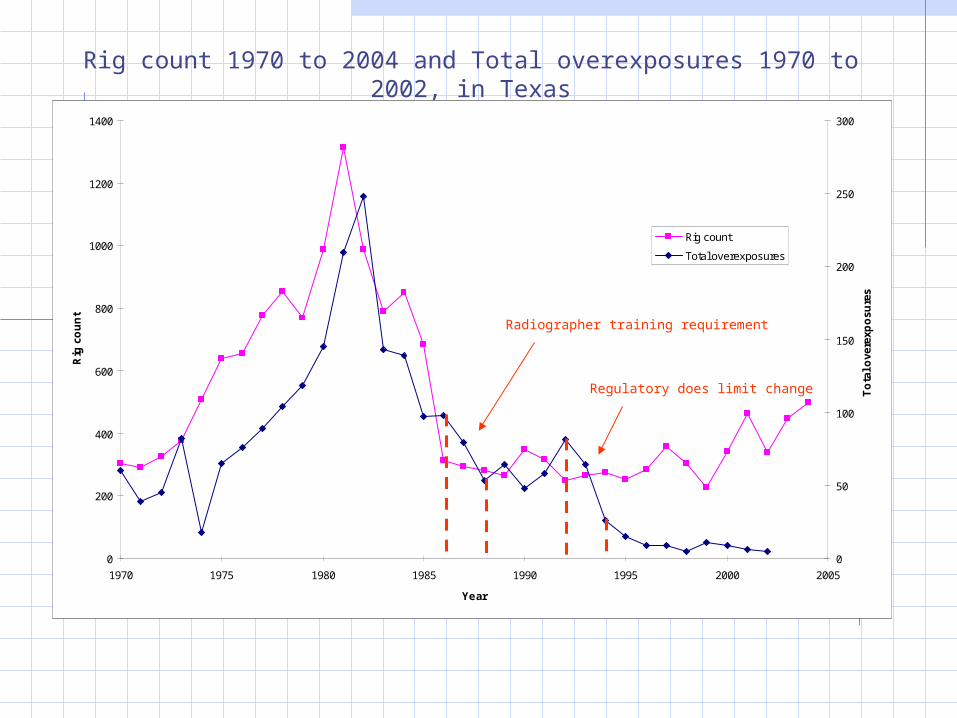
Rig count 1970 to 2004 and Total overexposures 1970 to 2002, in Texas
0
200
400
600
800
1000
1200
1400
1970 1975 1980 1985 1990 1995 2000 2005
Year
Rig
co
un
t
0
50
100
150
200
250
300
To
tal o
vere
xpo
sure
s
Rig count
Total overexposures
Radiographer training requirement
Regulatory does limit change
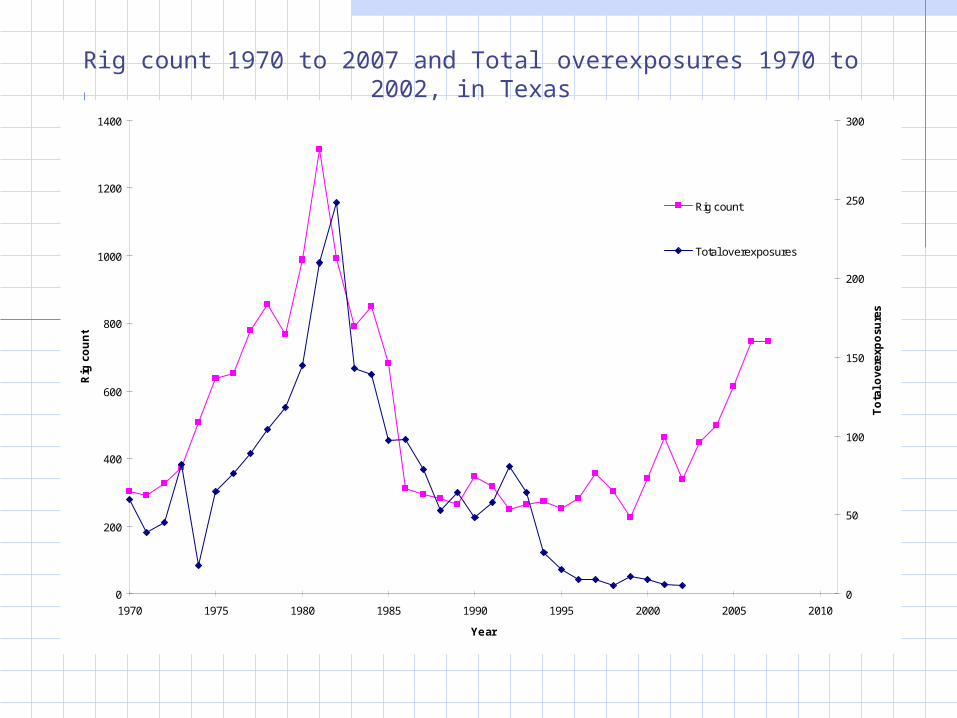
Rig count 1970 to 2007 and Total overexposures 1970 to 2002, in Texas
0
200
400
600
800
1000
1200
1400
1970 1975 1980 1985 1990 1995 2000 2005 2010
Year
Rig
co
un
t
0
50
100
150
200
250
300
To
tal o
vere
xpo
sure
s
Rig count
Total overexposures
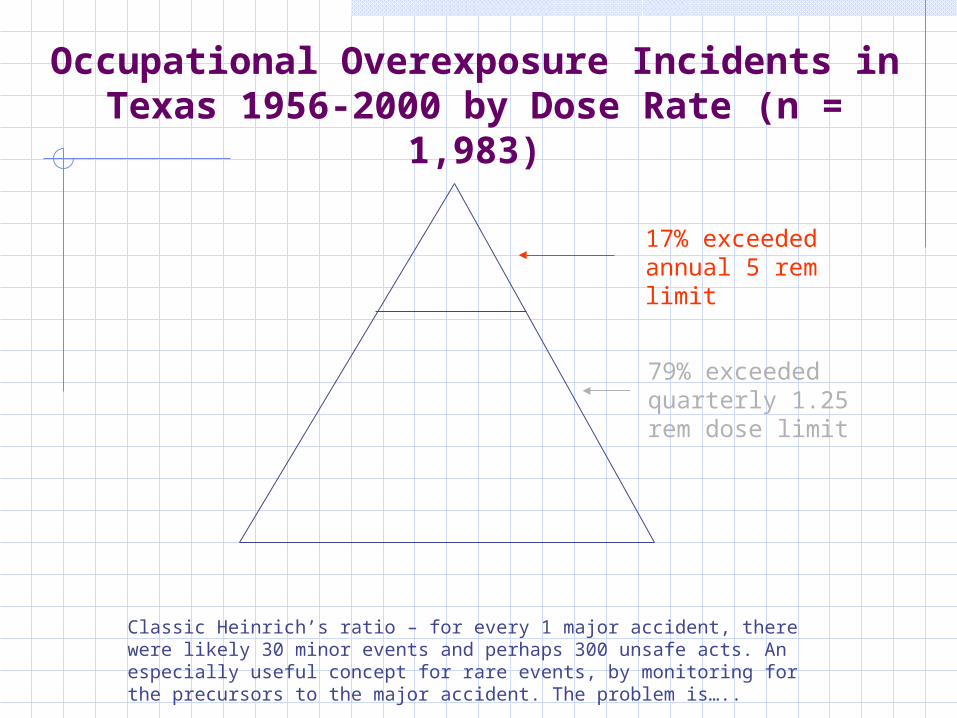
79% exceeded quarterly 1.25 rem dose limit
17% exceeded annual 5 rem limit
Occupational Overexposure Incidents in Texas 1956-2000 by Dose Rate (n = 1,983)
Classic Heinrich’s ratio – for every 1 major accident, there were likely 30 minor events and perhaps 300 unsafe acts. An especially useful concept for rare events, by monitoring for the precursors to the major accident. The problem is…..
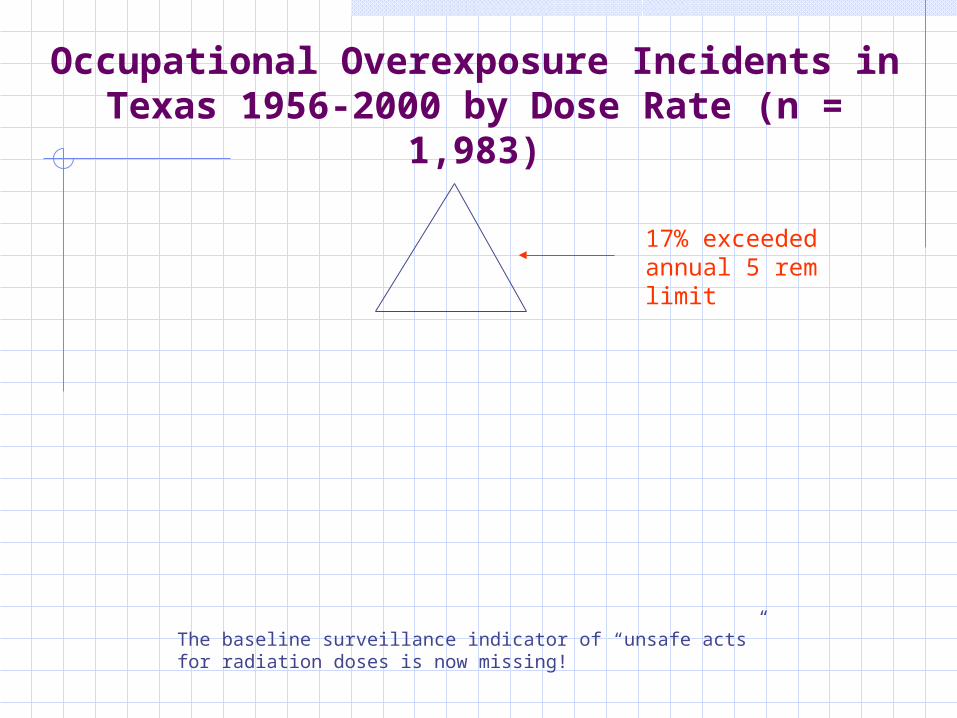
17% exceeded annual 5 rem limit
Occupational Overexposure Incidents in Texas 1956-2000 by Dose Rate (n = 1,983)
The baseline surveillance indicator of “unsafe acts” for radiation doses is now missing!
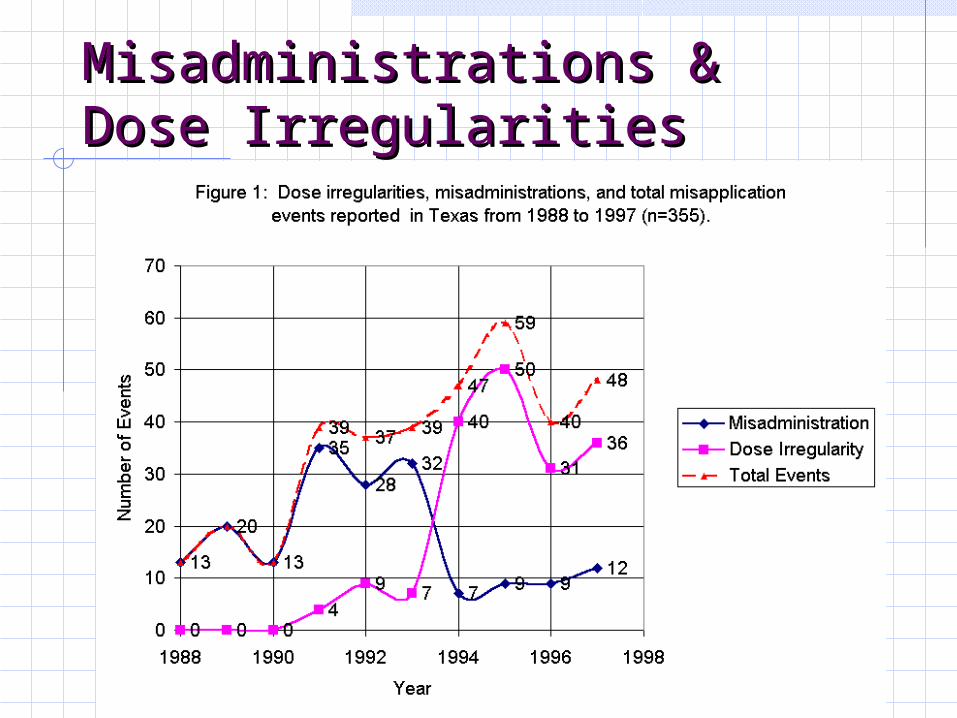
Misadministrations & Dose Misadministrations & Dose IrregularitiesIrregularities
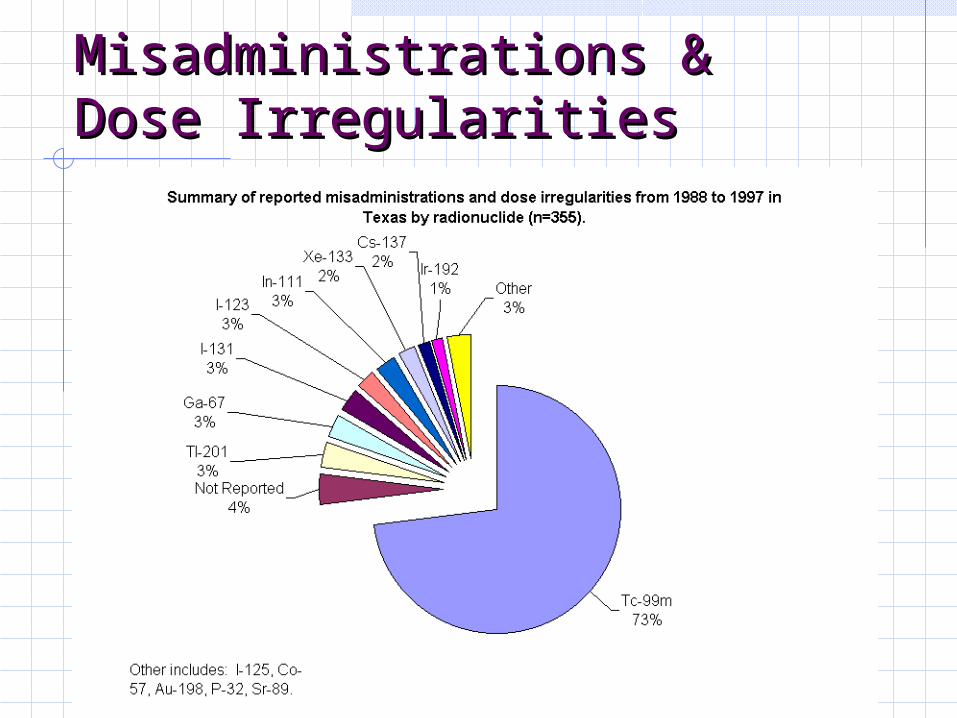
Misadministrations & Dose Misadministrations & Dose IrregularitiesIrregularities
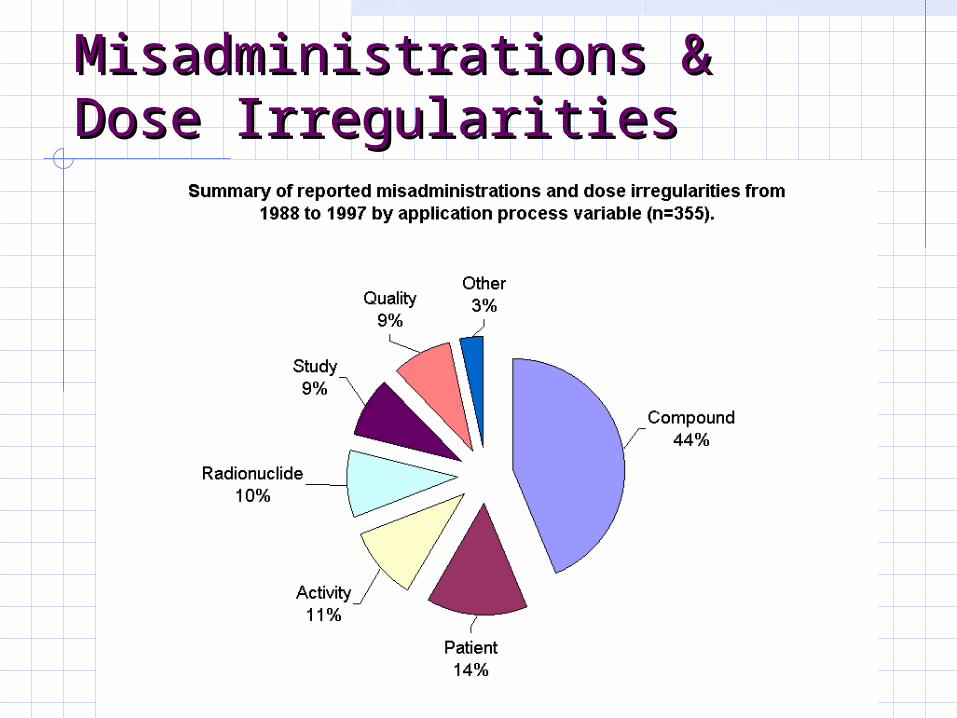
Misadministrations & Dose Misadministrations & Dose IrregularitiesIrregularities
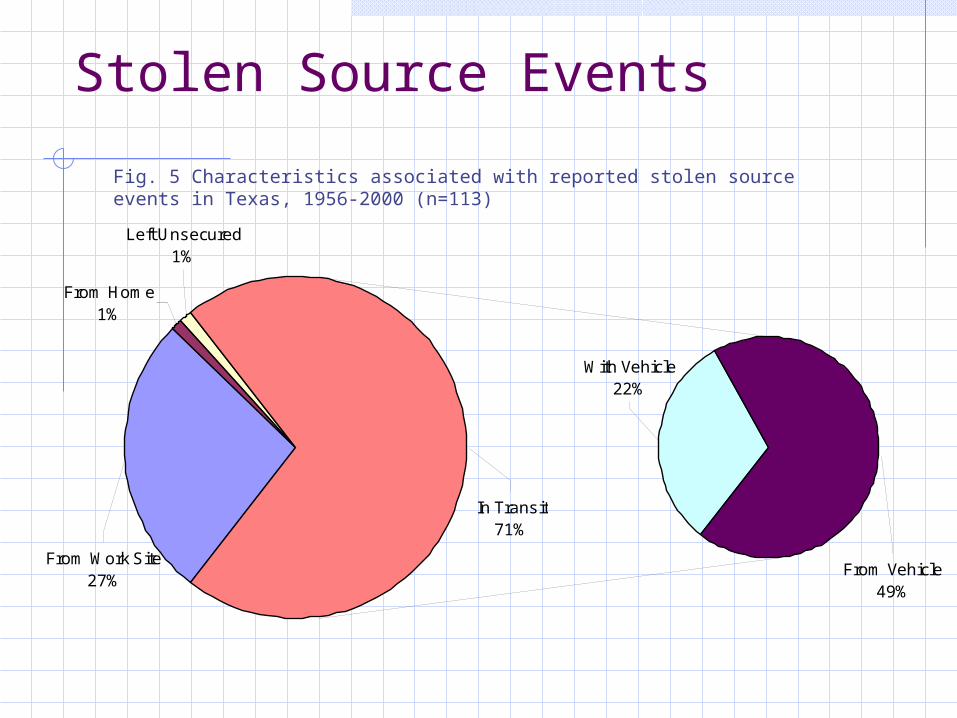
Stolen Source Events
From Home1%
Left Unsecured1%
From Vehicle49%
With Vehicle22%
In Transit71%
From Work Site27%
Fig. 5 Characteristics associated with reported stolen source events in Texas, 1956-2000 (n=113)
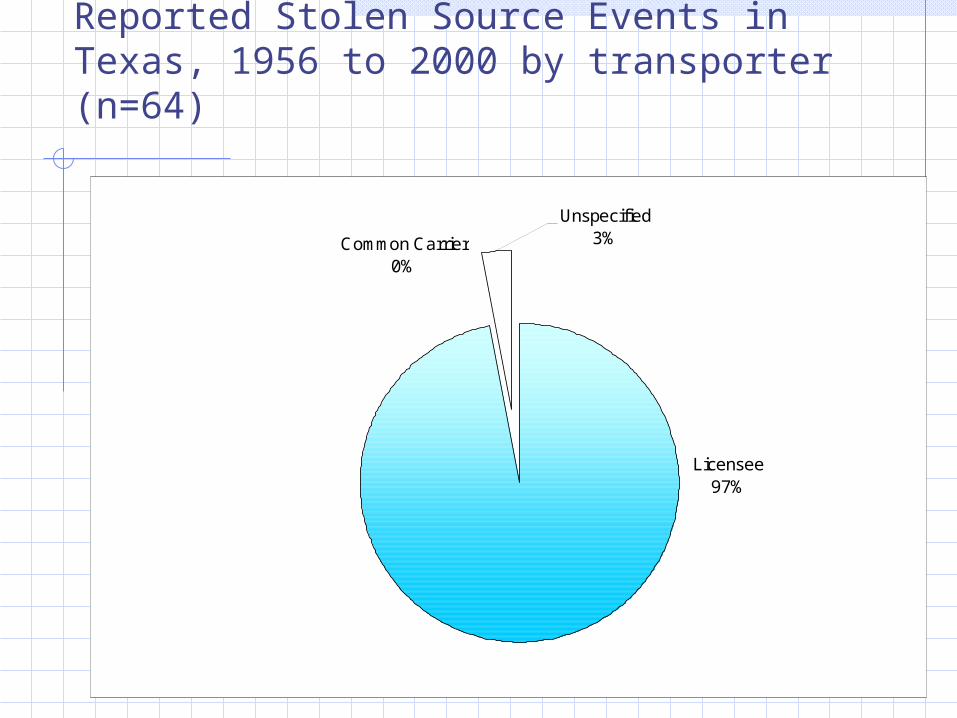
Reported Stolen Source Events in Texas, 1956 to 2000 by transporter (n=64)
Licensee97%
Common Carrier0%
Unspecified3%
Summary Observations
The collective performance of the radiation safety profession (inclusive of regulators and permitted community) has been very good, and should be considered a model for other public health efforts.
The ultimate outcome, overexposures, has dramatically decreased as a rate over time.
Longitudinal data analysis affords the identification of some interesting trends and commonalties that can be used to further improve the process
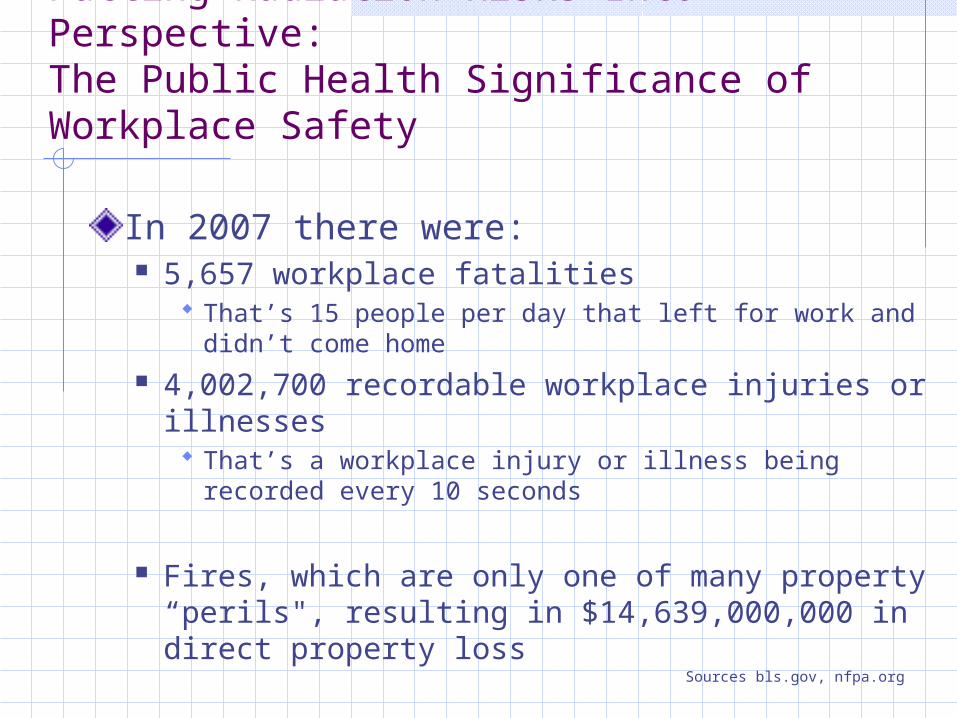
Putting Radiation Risks Into Perspective: The Public Health Significance of Workplace Safety
In 2007 there were: 5,657 workplace fatalities
That’s 15 people per day that left for work and didn’t come home
4,002,700 recordable workplace injuries or illnesses That’s a workplace injury or illness being recorded
every 10 seconds
Fires, which are only one of many property “perils", resulting in $14,639,000,000 in direct property loss
Sources bls.gov, nfpa.org
Special UT SPH Student Acknowledgment
Special thanks goes to the students who collectively worked on the assembly of this data for the benefit of their academic pursuits and the State of Texas
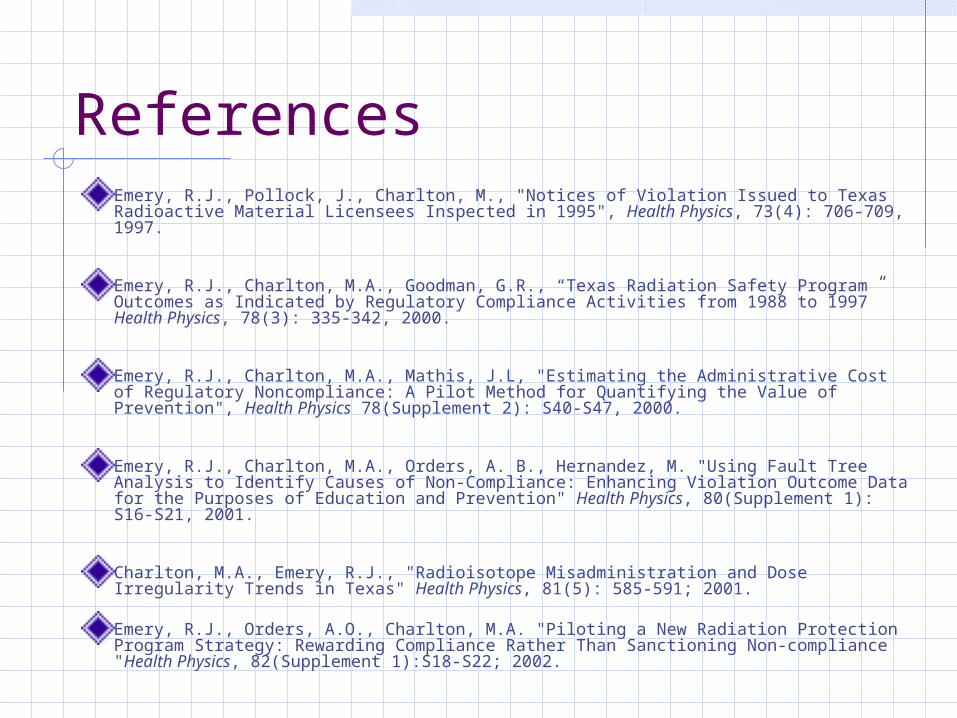
ReferencesEmery, R.J., Pollock, J., Charlton, M., "Notices of Violation Issued to Texas Radioactive Material Licensees Inspected in 1995", Health Physics, 73(4): 706-709, 1997.
Emery, R.J., Charlton, M.A., Goodman, G.R., “Texas Radiation Safety Program Outcomes as Indicated by Regulatory Compliance Activities from 1988 to 1997” Health Physics, 78(3): 335-342, 2000.
Emery, R.J., Charlton, M.A., Mathis, J.L, "Estimating the Administrative Cost of Regulatory Noncompliance: A Pilot Method for Quantifying the Value of Prevention", Health Physics 78(Supplement 2): S40-S47, 2000.
Emery, R.J., Charlton, M.A., Orders, A. B., Hernandez, M. "Using Fault Tree Analysis to Identify Causes of Non-Compliance: Enhancing Violation Outcome Data for the Purposes of Education and Prevention" Health Physics, 80(Supplement 1): S16-S21, 2001.
Charlton, M.A., Emery, R.J., "Radioisotope Misadministration and Dose Irregularity Trends in Texas" Health Physics, 81(5): 585-591; 2001.
Emery, R.J., Orders, A.O., Charlton, M.A. "Piloting a New Radiation Protection Program Strategy: Rewarding Compliance Rather Than Sanctioning Non-compliance "Health Physics, 82(Supplement 1):S18-S22; 2002.
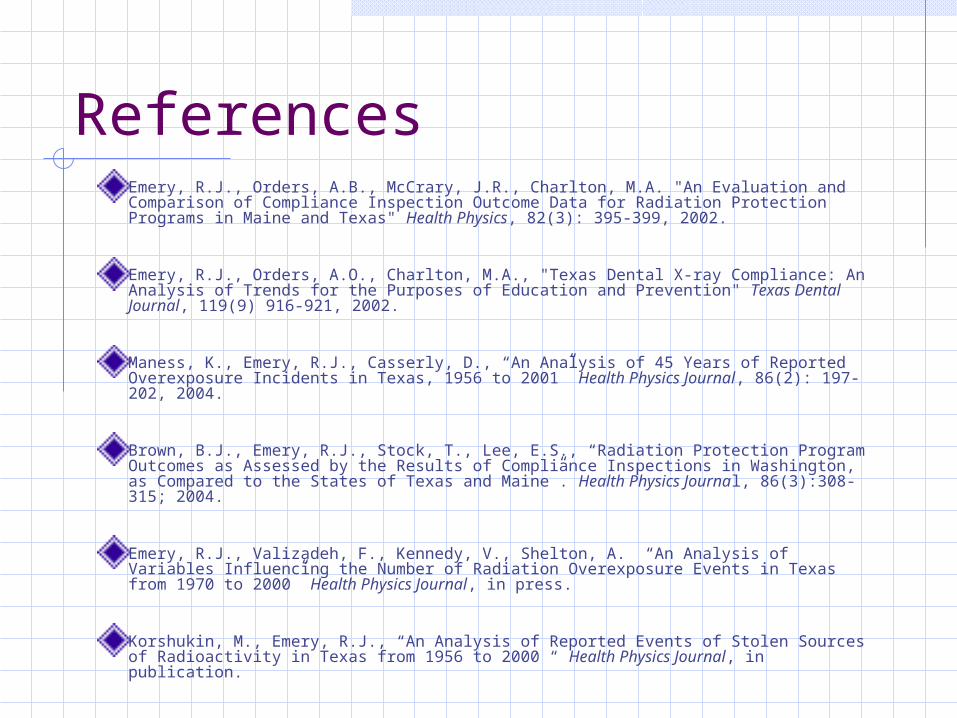
ReferencesEmery, R.J., Orders, A.B., McCrary, J.R., Charlton, M.A. "An Evaluation and Comparison of Compliance Inspection Outcome Data for Radiation Protection Programs in Maine and Texas" Health Physics, 82(3): 395-399, 2002.
Emery, R.J., Orders, A.O., Charlton, M.A., "Texas Dental X-ray Compliance: An Analysis of Trends for the Purposes of Education and Prevention" Texas Dental Journal, 119(9) 916-921, 2002.
Maness, K., Emery, R.J., Casserly, D., “An Analysis of 45 Years of Reported Overexposure Incidents in Texas, 1956 to 2001” Health Physics Journal, 86(2): 197-202, 2004.
Brown, B.J., Emery, R.J., Stock, T., Lee, E.S., “Radiation Protection Program Outcomes as Assessed by the Results of Compliance Inspections in Washington, as Compared to the States of Texas and Maine”. Health Physics Journal, 86(3):308-315; 2004.
Emery, R.J., Valizadeh, F., Kennedy, V., Shelton, A. “An Analysis of Variables Influencing the Number of Radiation Overexposure Events in Texas from 1970 to 2000” Health Physics Journal, in press.
Korshukin, M., Emery, R.J., “An Analysis of Reported Events of Stolen Sources of Radioactivity in Texas from 1956 to 2000 “ Health Physics Journal, in publication.