Embed Size (px)
Citation preview

Page 1 of 15 TRE PUBLIC
Texas Reliability Entity
Event Analysis
Event: July 30, 2012 DCS Event
Category 3 Event
Texas Reliability Entity October 26, 2012
Page 2 of 15 TRE PUBLIC
Table of Contents Executive Summary ................................................................................................................ 3
I. Event Overview ........................................................................................................ 3 II. Forecasts and Initial System Conditions Prior to Event ............................................. 5 III. Sequence of Events on 7/30/2012 ............................................................................ 6 IV. Analysis of Initial Unit Trips ....................................................................................... 8 V. Response Analysis ................................................................................................... 9 VI. Conclusions .............................................................................................................14
Page 3 of 15 TRE PUBLIC
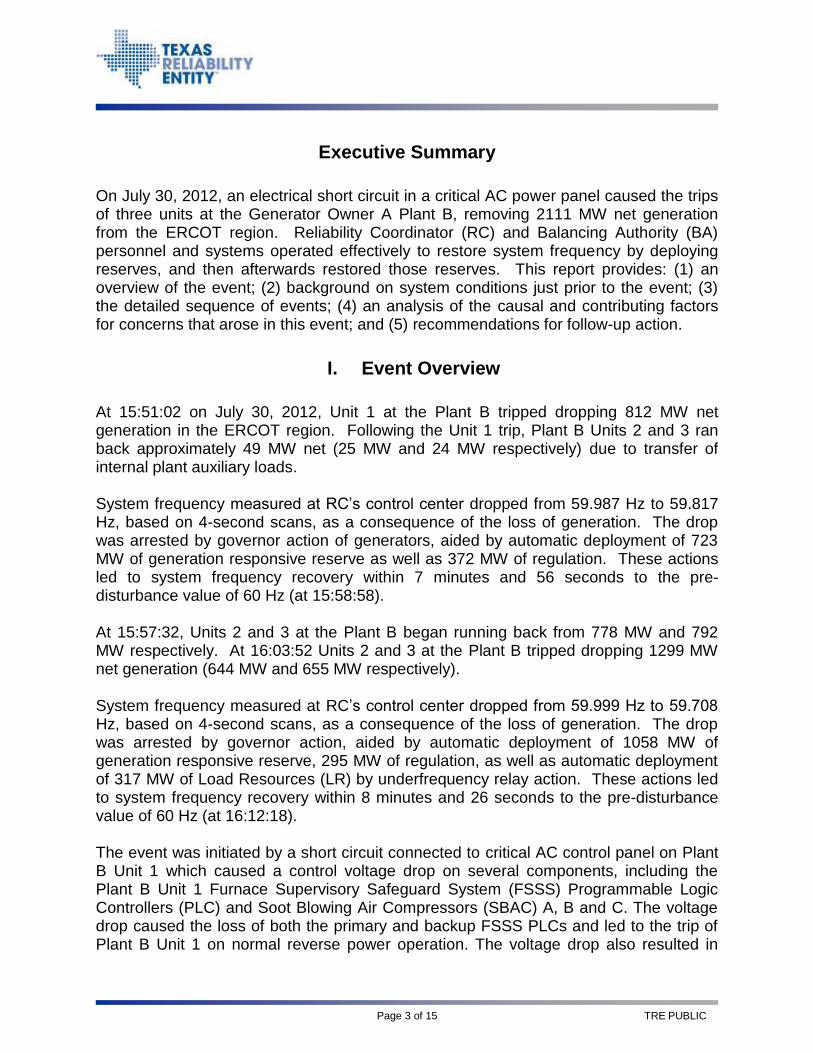
Executive Summary
On July 30, 2012, an electrical short circuit in a critical AC power panel caused the trips of three units at the Generator Owner A Plant B, removing 2111 MW net generation from the ERCOT region. Reliability Coordinator (RC) and Balancing Authority (BA) personnel and systems operated effectively to restore system frequency by deploying reserves, and then afterwards restored those reserves. This report provides: (1) an overview of the event; (2) background on system conditions just prior to the event; (3) the detailed sequence of events; (4) an analysis of the causal and contributing factors for concerns that arose in this event; and (5) recommendations for follow-up action.
I. Event Overview
At 15:51:02 on July 30, 2012, Unit 1 at the Plant B tripped dropping 812 MW net generation in the ERCOT region. Following the Unit 1 trip, Plant B Units 2 and 3 ran back approximately 49 MW net (25 MW and 24 MW respectively) due to transfer of internal plant auxiliary loads. System frequency measured at RC‟s control center dropped from 59.987 Hz to 59.817 Hz, based on 4-second scans, as a consequence of the loss of generation. The drop was arrested by governor action of generators, aided by automatic deployment of 723 MW of generation responsive reserve as well as 372 MW of regulation. These actions led to system frequency recovery within 7 minutes and 56 seconds to the pre-disturbance value of 60 Hz (at 15:58:58). At 15:57:32, Units 2 and 3 at the Plant B began running back from 778 MW and 792 MW respectively. At 16:03:52 Units 2 and 3 at the Plant B tripped dropping 1299 MW net generation (644 MW and 655 MW respectively). System frequency measured at RC‟s control center dropped from 59.999 Hz to 59.708 Hz, based on 4-second scans, as a consequence of the loss of generation. The drop was arrested by governor action, aided by automatic deployment of 1058 MW of generation responsive reserve, 295 MW of regulation, as well as automatic deployment of 317 MW of Load Resources (LR) by underfrequency relay action. These actions led to system frequency recovery within 8 minutes and 26 seconds to the pre-disturbance value of 60 Hz (at 16:12:18). The event was initiated by a short circuit connected to critical AC control panel on Plant B Unit 1 which caused a control voltage drop on several components, including the Plant B Unit 1 Furnace Supervisory Safeguard System (FSSS) Programmable Logic Controllers (PLC) and Soot Blowing Air Compressors (SBAC) A, B and C. The voltage drop caused the loss of both the primary and backup FSSS PLCs and led to the trip of Plant B Unit 1 on normal reverse power operation. The voltage drop also resulted in
Page 4 of 15 TRE PUBLIC
tripping SBACs A, B, and C and led to the rapid degradation of plant service air supply and plant instrument air pressure on Plant B Unit 2 and Plant B Unit 3. All plant service and instrument air is provided by SBACs. Plant service air and plant instrument air are fed from a common SBAC header for all three units. Both Plant B Unit 2 and Plant B Unit 3 tripped when the instrument air pressure dropped too low to keep the discharge dampers open on the Primary Air (PA) fans. The RC responded to the second event as a NERC Disturbance Control Standard (DCS) event due to the loss of generation above 1100 MW in the RC region. The event also met the definition of a Category 3a event (loss of load or generation of 1400 MW or more in the RC region) under NERC‟s Event Analysis Working Group (EAWG) procedure.
Page 5 of 15 TRE PUBLIC
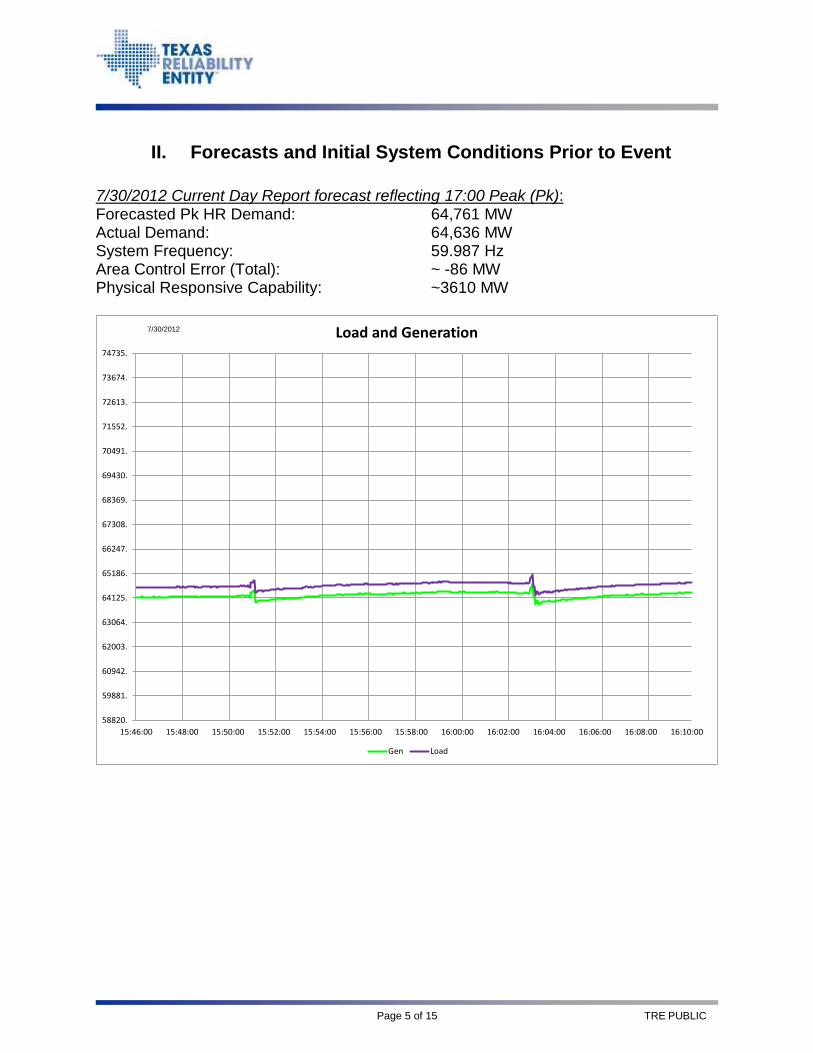
II. Forecasts and Initial System Conditions Prior to Event
7/30/2012 Current Day Report forecast reflecting 17:00 Peak (Pk): Forecasted Pk HR Demand: 64,761 MW Actual Demand: 64,636 MW System Frequency: 59.987 Hz Area Control Error (Total): ~ -86 MW Physical Responsive Capability: ~3610 MW
58820.
59881.
60942.
62003.
63064.
64125.
65186.
66247.
67308.
68369.
69430.
70491.
71552.
72613.
73674.
74735.
15:46:00 15:48:00 15:50:00 15:52:00 15:54:00 15:56:00 15:58:00 16:00:00 16:02:00 16:04:00 16:06:00 16:08:00 16:10:00
Load and Generation
Gen Load
7/30/2012
Page 6 of 15 TRE PUBLIC
III. Sequence of Events on 7/30/2012
SOE provided by RC
15:50:56 ERCOT region frequency prior to disturbance was 59.987 Hz
15:51:02 Unit 1 tripped approximately 811MW off line. Unit 2 & 3 indicated a drop of about 25MW each
15:51:44 System Frequency dipped to 59.817 Hz
15:58:20 Unit 2 and Unit 3 began to decline in output; dropping 148 MW and 131 MW respectively over roughly the next 5minutes before the units tripped
15:58:58 System Frequency returned to 60.002 Hz
16:03:35 System Frequency at 59.999 Hz
16:03:50 1405 MW of Responsive Reserve deployed
16:03:52 Unit 3 tripped with 662 MW net
16:03:54 Unit 2 tripped with 636 MW net
16:03:54 323.8 MW of Load Resources on High Set relays automatically deployed
16:12:18 Frequency restored to 60 Hz
16:17:00 Load Resources recalled
16:28:28 Responsive Reserve Service Recalled
SOE provided by Generator Owner A (time stamps vary from RC SOE)
15:51:22 Voltage at critical 120 volt AC power panel for Plant B Unit #1, drops Plant B Unit #1 FSSS primary PLC attempted to transfer to the backup PLC and Plant B Unit #1 pulverizer feeders tripped
15:51:22 Plant B Unit #1 SBACs A, B and C Trip
15:51:22 Other PLCs with power feed from critical AC power panel reboot: A Auxiliary Boiler, Plant B Unit #1 and 2 common lignite system and the Plant B Unit #1 intake PLC.
15:51:22 Plant B Unit #1 Boiler Trips Plant B Unit #1 Boiler Feed Pumps A and B trip Plant B Unit #1 Main Turbine Trips
15:51:24 Plant B Unit #1 FSSS backup PLC takes control
15:51:28 Reverse Power on the Plant B Unit #1 Main Generator is indicated Plant B Unit #1 East and West Generator Breakers open
15:51:31 SBAC common header air pressure begins to decay (common to all three units)
15:51:41 SBAC header air pressure drops below 200 PSIG and operators override SBAC auto discharge valve close command
15:51:56 Instrument air header pressure (fed from SBAC air header) begins dropping
15:58:52 SBAC G trips
16:00:56 Instrument Air Header pressure falls below 20 PSIG
Page 7 of 15 TRE PUBLIC
16:03:52 Plant B Unit #3 Primary Air Fans outlet dampers close
16:03:59 Plant B Unit #2 Primary Air Fans outlet dampers close
16:04:01 Plant B Unit #3 Boiler Trips on Low Primary Air Pressure
16:04:07 Plant B Unit #3 Generator Breaker Opens
16:04:11 Plant B Unit #2 Boiler Trips on Low Primary Air Pressure
16:04:17 Plant B Unit #2 Generator Breaker Opens
7/31/2012 03:36 Plant B Unit #2 on-line
7/31/2012 08:15 Plant B Unit #1 unit on-line
8/01/2012 22:50 Plant B Unit #3 unit on-line
Page 8 of 15 TRE PUBLIC
IV. Analysis of Initial Unit Trips
A. Generator Owner A Plant B
Plant B Unit #1 Trip Cause Summary The Plant B Unit #1 trip was caused by a voltage drop in a critical AC power panel due to a short circuit. The source of the short circuit is still under investigation at this time. However, the August 18, 2012 trip of Plant B Unit #1 indicates the short circuit is originating from the FSSS racks 2 and 3 electrical circuit. The voltage drop caused the PLCs power supplies to sense low control power voltage of less than 97 volts for at least 13.6 milliseconds, when the PLCs went to a “safe” condition and shut down the systems they control. Following are the key causes of the Plant B Unit #1 trip:
Initiating Cause – A short circuit connected to Plant B Unit #1 critical AC power panel initiated the trip of the unit. The cause of the short circuit has not been identified.
Contributing Cause - Control power for both the primary and backup Plant B Unit #1 FSSS PLCs was supplied from the same critical AC control panel.
Contributing Cause – Fusing in critical AC power panel was not appropriately sized.
Contributing Cause - Out of service circuits and non-critical circuits were connected to the critical AC power panel.
Plant B Unit #2 and Plant B Unit #3 Initial Trip Analysis SBACs A, B and C also tripped at the same time as Plant B Unit #1 from momentary loss of control power from critical AC power panel. Prior to the start of the event, SBACs A, B, C, D and G were operating and three tripped off (SBACs A, B and C), causing the loss of approximately 60% of plant air supply capacity. All air pressures dropped sharply, demonstrating that the current air usage is too great to be supported by only two SBACs. Plant personnel began identifying and manually isolating air to as many non-essential areas in the plant as possible but air pressure continued to decay. To further exacerbate the condition SBAC G tripped off about 9 minutes after SBACs A, B and C tripped, leaving only SBAC D running. The SBAC G tripped due to high air temperature. The Plant B Unit # plant air systems are solely dependent on the SBACs which supply air through common headers for the soot blowing air (at approximately 280 psi), service air (at approximately 120 psi), and instrument air (at approximately 120 psi). After evaluating the usage on all the monitored branches, if the non-essential air could have been shut off promptly, Plant B Unit #2 and Plant B Unit #3 would have maintained sufficient Instrument air pressure to continue operation. Both Plant B Unit #2 and Plant B Unit #3 tripped when the instrument air pressure dropped too low to keep the discharge dampers on the PA fans open. Low PA pressure caused the FSSS to trip all the pulverizers, resulting in a unit trip caused by a loss of all boiler fuel.
Page 9 of 15 TRE PUBLIC
Following are the key causes of the Plant B Unit #2 and Plant B Unit #3 trips:
Initiating cause – The units tripped due to low instrument air pressure caused by insufficient plant air supply.
Contributing Cause - Control power for the three SBACs on Plant B Unit #1 was supplied from a common critical AC power panel.
Contributing Cause - Non-critical plant compressed air usage could not be quickly shut off as air pressure began to degrade.
The breakers and protection system operated properly as designed. There were no personnel injuries.
V. Response Analysis
A. Initial Response
The loss of 2111 MW of net generation in the ERCOT Region during the afternoon of July 30, 2012 constituted a significant disturbance to grid. The Balancing Authority used the Region‟s resources and reserves to balance resources and demand and return system frequency to pre-disturbance frequency well within the 15 minute target set by NERC Standards. ERCOT region frequency was at 59.987 Hz immediately prior to the disturbance. Immediately after the disturbance, system frequency dropped to 59.708 Hz, based on 4-second scans. The following are among the actions that registered entities initially took to stabilize the system:
Page 10 of 15 TRE PUBLIC
59.8
59.82
59.84
59.86
59.88
59.9
59.92
59.94
59.96
59.98
60
60.02
07/30/12 15:51:24 07/30/12 15:51:33 07/30/12 15:51:42 07/30/12 15:51:50 07/30/12 15:51:59 07/30/12 15:52:08 07/30/12 15:52:16 07/30/12 15:52:25 07/30/12 15:52:34 07/30/12 15:52:42 07/30/12 15:52:51
Fre
qu
en
cy (
Hz)
Date and Time (mm/dd/yy hh:mm:ss)
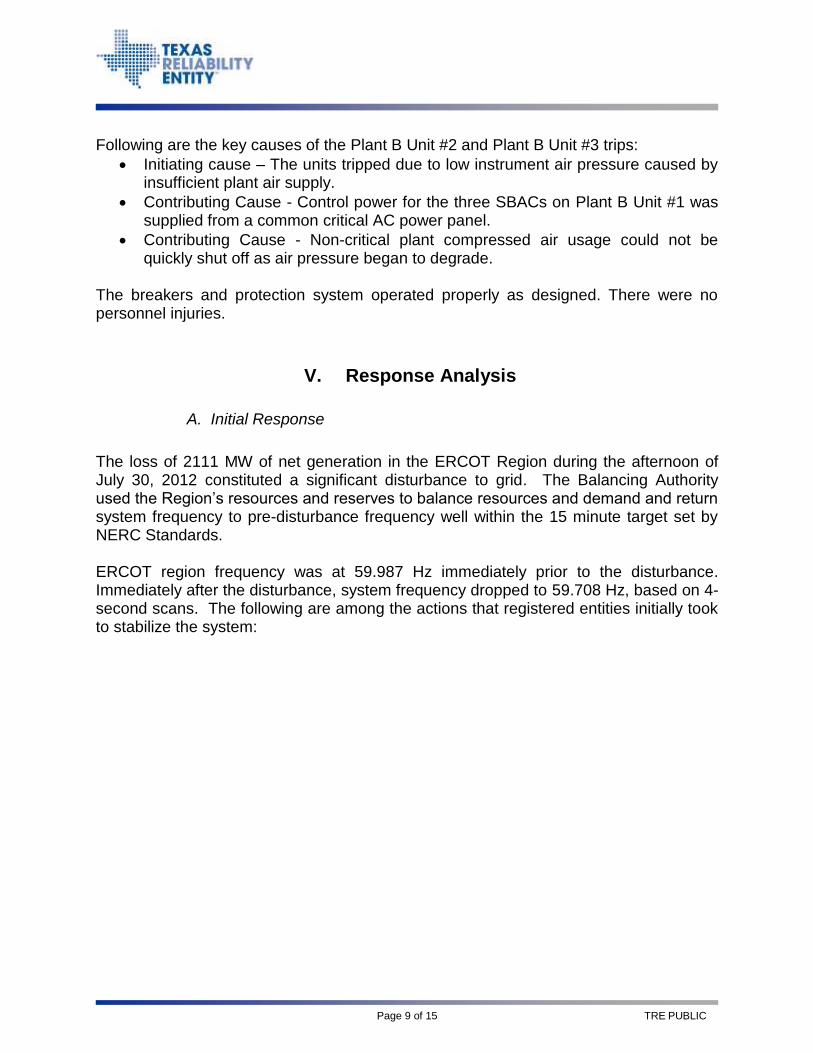
High-Speed Frequency Recorder Data
High-Speed Frequency Recorder Data for Unit Unit 1 Trip on July 30, 2012.
Generator governor response arrested the frequency decline, as analyzed by the Performance, Disturbance, Compliance Working Group (PDCWG) in its draft report. The initial calculated system frequency response, termed the “B” point, was 418.22 MW/0.1 Hz, which failed to meet the target of 420 established in RC Protocols 5.9.2. The second calculated response point, termed “B+30” to denote that it measures how well response is sustained 30 seconds after the event, was 331.09 MW/0.1 Hz, which also failed to meet the minimum response level. The response was due to a combination of governor action from the on-line generation resources as well as the response from Load Resources which tripped automatically due to the low frequency condition. The PDCWG also noted that 158 out of 229 units (units running that were not excluded) (70.0%) sustained governor response for this event.
For the initial Plant B Unit 1 trip, RC made a step deployment of 372 MW of generation regulation, within 10 seconds of the frequency bottom, modifying the setpoint sent to QSEs to accomplish this deployment. Similarly, 723 MW of Responsive Reserve Service (RRS) from generators was deployed 12 seconds after the event.
For the Plant B Unit 2 and 3 trips, RC operators made a step deployment of 295 MW of generation regulation, within 10 seconds of the frequency bottom, modifying the setpoint sent to QSEs to accomplish this deployment. Similarly, 1058 MW of Responsive Reserve Service (RRS) from generators was deployed 12 seconds after the event.
Automatic deployment of 317 MW of LR by underfrequency relay action aided the frequency recovery.
Page 11 of 15 TRE PUBLIC
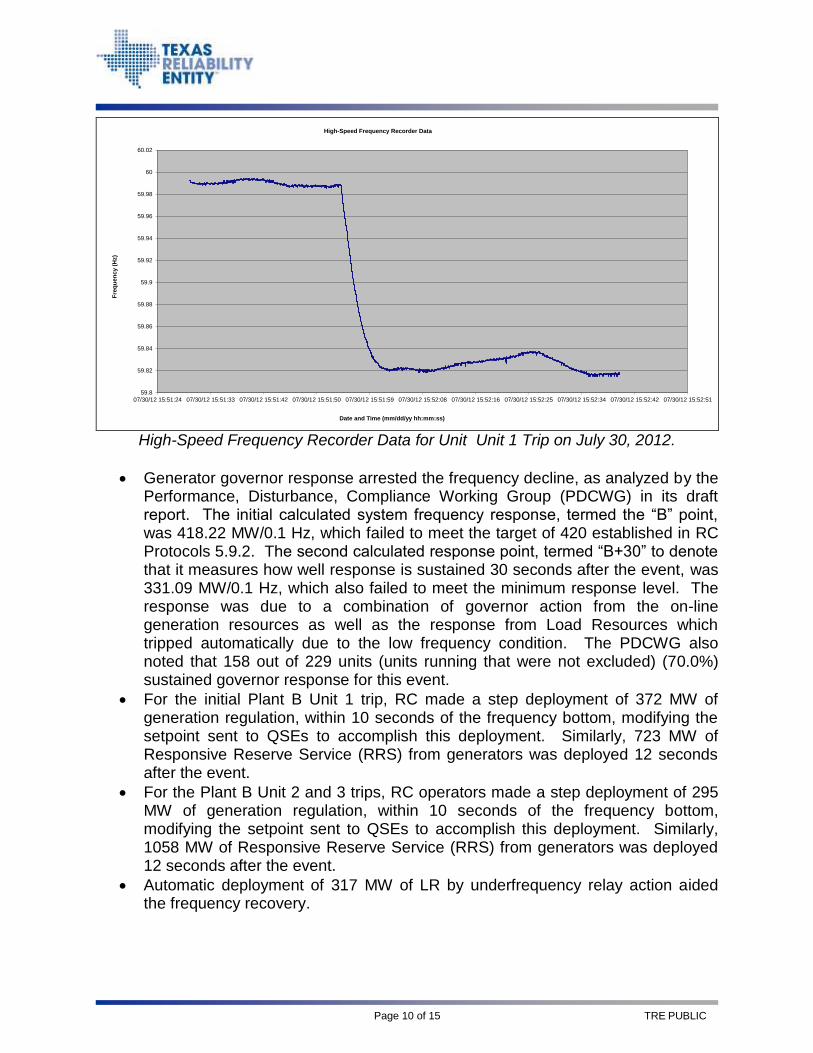
The result of these actions was that system frequency returned to its pre-disturbance value of 60 Hz within 7 minutes and 56 seconds for the Plant B Unit 1 trip and within 8 minutes and 26 seconds for the Plant B Unit 2 and 3 trips.
0
200
400
600
800
1000
1200
1400
1600
1800
15
:48
:00
15
:49
:52
15
:51
:44
15
:53
:36
15
:55
:28
15
:57
:20
15
:59
:12
16
:01
:04
16
:02
:56
16
:04
:48
16
:06
:40
16
:08
:32
16
:10
:24
16
:12
:16
16
:14
:08
16
:16
:00
16
:17
:52
16
:19
:44
16
:21
:36
16
:23
:28
16
:25
:20
16
:27
:12
16
:29
:04
16
:30
:56
16
:32
:48
16
:34
:40
16
:36
:32
16
:38
:24
16
:40
:16
16
:42
:08
16
:44
:00
16
:45
:52
16
:47
:44
RRS Gen RRS Load Up-Reg
Page 12 of 15 TRE PUBLIC
0.
107.
214.
321.
428.
535.
642.
749.
856.
963.
1070.
1177.
1284.
1391.
1498.
1605.
59.70
59.72
59.74
59.76
59.78
59.80
59.82
59.84
59.86
59.88
59.90
59.92
59.94
59.96
59.98
60.00
60.02
60.04
60.06
60.08
60.10
15:46:00 15:48:05 15:50:10 15:52:15 15:54:20 15:56:25 15:58:30 16:00:35 16:02:40 16:04:45 16:06:50 16:08:55
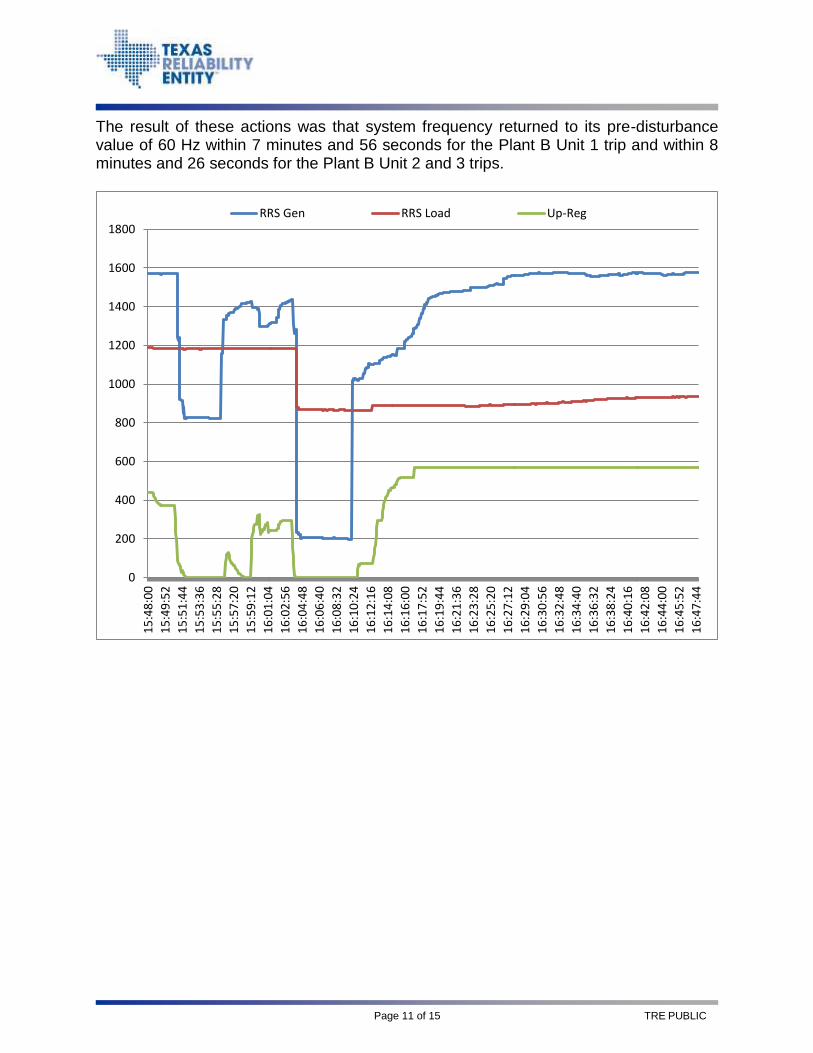
Regulation And Reserve
Hz Total Regulation Deployed RRS Deployed
7/30/2012
Page 13 of 15 TRE PUBLIC
0.
301.
602.
903.
1204.
1505.
1806.
2107.
2408.
2709.
3010.
3311.
3612.
3913.
4214.
4515.
59.70
59.72
59.74
59.76
59.78
59.80
59.82
59.84
59.86
59.88
59.90
59.92
59.94
59.96
59.98
60.00
60.02
60.04
60.06
60.08
60.10
15:46:00 15:48:05 15:50:10 15:52:15 15:54:20 15:56:25 15:58:30 16:00:35 16:02:40 16:04:45 16:06:50 16:08:55
Spinning and PRC
Hz Total Spinning Total PRC
7/30/2012
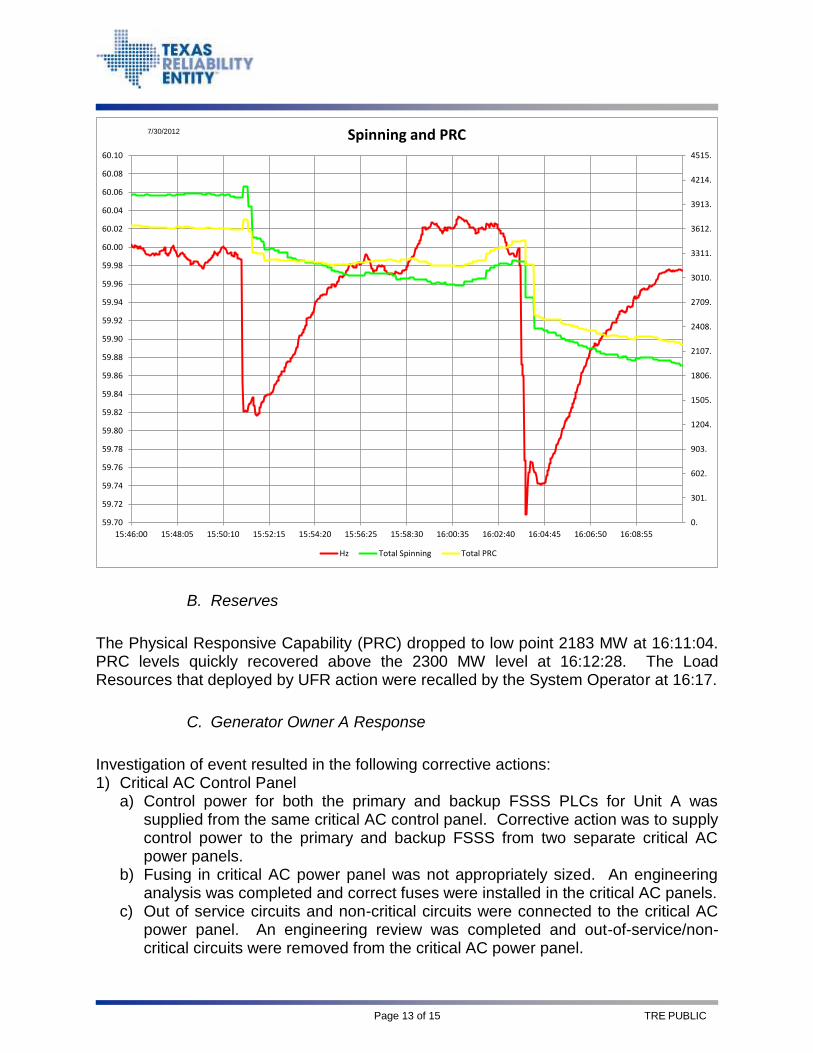
B. Reserves
The Physical Responsive Capability (PRC) dropped to low point 2183 MW at 16:11:04. PRC levels quickly recovered above the 2300 MW level at 16:12:28. The Load Resources that deployed by UFR action were recalled by the System Operator at 16:17.
C. Generator Owner A Response
Investigation of event resulted in the following corrective actions: 1) Critical AC Control Panel
a) Control power for both the primary and backup FSSS PLCs for Unit A was supplied from the same critical AC control panel. Corrective action was to supply control power to the primary and backup FSSS from two separate critical AC power panels.
b) Fusing in critical AC power panel was not appropriately sized. An engineering analysis was completed and correct fuses were installed in the critical AC panels.
c) Out of service circuits and non-critical circuits were connected to the critical AC power panel. An engineering review was completed and out-of-service/non-critical circuits were removed from the critical AC power panel.
Page 14 of 15 TRE PUBLIC
d) Data loggers were installed to help identify the area of the short circuit. 2) Plant B Air Supply System: Control power for the three SBACs was supplied from a
common critical AC control panel. The power supply was re-configured to supply control power to no more than two SBACs from the same critical AC control panel.
3) Non-critical plant air usage could not be quickly shut off as air pressure began to degrade. After evaluating the usage on all the monitored branches, if the non-essential air could have been shut off promptly, Unit B and C would have maintained sufficient instrument air pressure to continue operation. Appropriate methods and isolation points were identified to isolate and remove non-critical air usage during an emergency.
Generator Owner A also provided the following lessons learned from this event. 1) Control power for critical primary and backup systems, such as the FSSS and plant
air supply, should be supplied from separate critical AC power panels where appropriate.
2) Critical AC power panels should be maintained with proper fusing and connected only to necessary circuits to reduce the probability and impact of an equipment failure such as a short circuit.
3) Technical and procedural controls should be applied to the air supply system to reduce non-critical air usage during air short supply situations.
D. Demand Side Resource Response
Approximately 317 MW of demand side resources tripped automatically due to the action of underfrequency relays. The BA may base up to 1400 MW of its 2800 MW of RRS on such demand side resources, termed Load Resources (LRs) at the time of this event, although less than that amount were awarded during this event. LR‟s providing RRS are expected to have this capability set to 59.7 Hz within 20 cycles. Data collected data from ten high resolution frequency recorders in the Region show that frequency did not go below 59.7 HZ. The recorders indicate slightly different readings across the grid which is typical for events such as this. Based on previous event experience, the partial automatic activation of underfrequency relays can be attributed to the close proximity of the dip in frequency to the relay set-point at which these resources should be activated and slight variations in the frequency sensed at different locations.
VI. Conclusions
In general, the steps taken in the recovery from this event achieved the desired results. System Operators handled the situation effectively. Last, frequency response from generators and LR performed to effectively address the initial frequency response and met the minimum levels on the “B” and “B+30” calculation of system frequency response. 158 out of 229 units evaluated during this event (i.e.
Page 15 of 15 TRE PUBLIC
units running that were capable of providing governor response) provided the „sustained‟ governor response for this event. Demand side resources contributed significantly to the recovery from this event. Subtle differences in relay setting sensitivity and the frequency at different points of the grid resulted in a partial deployment that was still effective.