Embed Size (px)
Citation preview
A member of The Texas State University System
by Dr. Denise M. Trauth, President
January 2012
Texas State University’s Transition to an
Emerging Research University

An Overview of
Texas State University Today
2

Texas State University is the 36th Largest Public University in the Nation
U.S. Public Research, Doctoral, Master's, and Baccalaureate Institutions Ranked by Fall 2010 Enrollment
Rank Institution Name Fall 2010
Enrollment Rank Institution Name Fall 2010
Enrollment
1 Arizona State University 70,440 20 University of Arizona 39,086
2 University of Central Florida 56,106 21 Rutgers University-New Brunswick 38,912
3 Ohio State University-Main Campus 56,064 22 University of Houston 38,752
4 University of Minnesota-Twin Cities 51,721 23 University of California-Los Angeles 38,157
5 The University of Texas at Austin 51,195 24 University of Maryland-College Park 37,641
6 University of Florida 49,827 25 Temple University 37,367
7 Texas A & M University 49,129 26 University of North Texas 36,305
8 Michigan State University 46,985 27 University of California-Berkeley 35,833
9 Pennsylvania State University-Main Campus 45,233 28 California State University-Fullerton 35,590
10 University of Illinois at Urbana-Champaign 43,862 29 California State University-Northridge 35,272
11 Indiana University-Bloomington 42,464 30 University of Georgia 34,677
12 University of Washington-Seattle Campus 42,451 31 North Carolina State University at Raleigh 34,376
13 Florida International University 42,197 32 California State University-Long Beach 33,416
14 University of Wisconsin-Madison 42,180 33 The University of Texas at Arlington 32,975
15 University of Michigan-Ann Arbor 41,924 34 University of Colorado Boulder 32,697
16 Purdue University-Main Campus 41,063 35 Utah Valley University 32,670
17 University of South Florida-Main Campus 40,431 36 Texas State University-San Marcos 32,572
18 Florida State University 40,416 37 George Mason University 32,562 19 University of Maryland-University College 39,577 38 University of Missouri-Columbia 32,341
Source: Integrated Postsecondary Education Data System (IPEDS) Database, U.S. Department of Education. 3
Fall 2011 is 34,113
• Thirty-two states have no public university as large as Texas State!

Total Enrollment (Preliminary) Texas Public Universities, Fall 2011
Institution Number Institution Number
UT-Austin 51,145 Tarleton 9,885
Texas A&M 49,861 Prairie View A&M 8,623
Houston 39,824 UT-Brownsville 8,539
North Texas 35,722 Houston-Clear Lake 8,188
Texas State 34,113 West Texas A&M 7,902
UT-Arlington 33,421 TAMU-International 7,176
Texas Tech 32,327 Angelo State 6,860
UT-San Antonio 30,968 TAMU-Kingsville 6,737
UT-El Paso 22,640 UT-Tyler 6,650
UT-Pan American 19,041 Midwestern State 6,182
UT-Dallas 18,854 Houston-Victoria 4,331
Sam Houston 17,950 UT-Permian Basin 3,824
Texas Woman’s University 14,459 TAMU-San Antonio 3,547
Lamar 14,021 TAMU-Central Texas 2,100
Houston-Downtown 12,918 North Texas-Dallas 2,037
Stephen F. Austin 12,903 Sul Ross 2,035
TAMU-Commerce 11,152 TAMU-Galveston 2,034
TAMU-Corpus Christi 10,192 TAMU-Texarkana 1,942
Texas Southern 10,026 Sul Ross-Rio Grande College 970
Source: Texas Higher Education Coordinating Board (THECB) Preliminary Fall Enrollment Report. 4
Degrees Awarded to Hispanic Students
§ In Fall 2010, Texas State reached its goal of becoming a Hispanic Serving Institution (enrolling at least 25 percent Hispanic full-time equivalent undergraduate students). In Fall 2011, our Hispanic enrollment grew to 27 percent.
§ Hispanic Outlook in Higher Education magazine ranks Texas State 14th in the nation for the number of bachelor’s degrees awarded to Hispanic students and 30th in the nation for the number of master’s degrees awarded to Hispanic students.
§ In 2010-2011, Texas State awarded more than 1,490 Hispanic students these degrees.
5

Texas State and the Criteria for an Emerging Research University
6
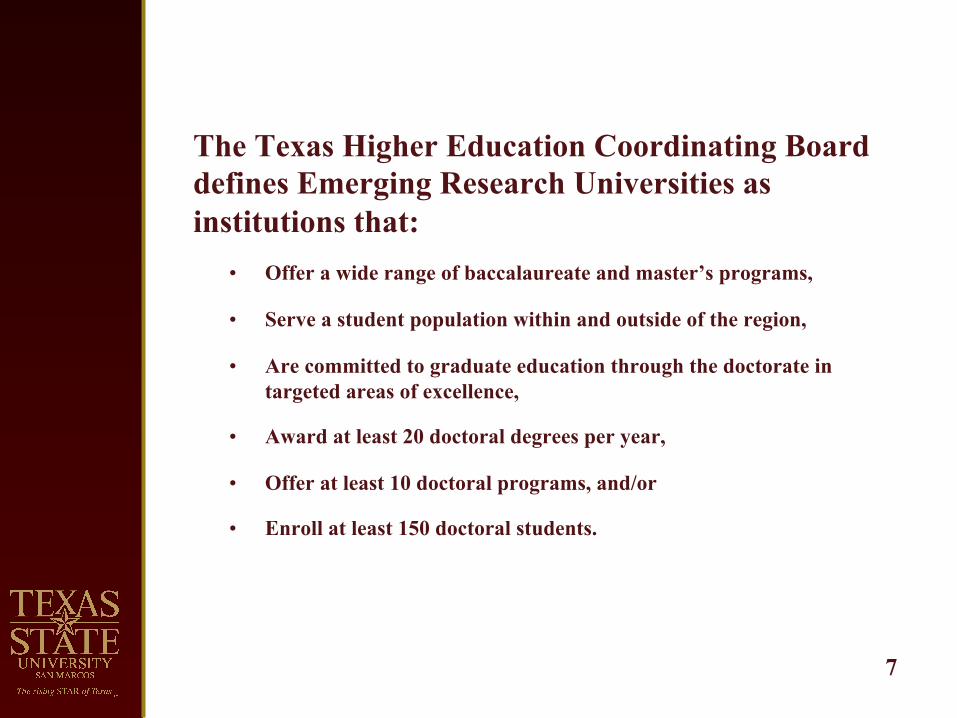
The Texas Higher Education Coordinating Board defines Emerging Research Universities as institutions that:
• Offer a wide range of baccalaureate and master’s programs,
• Serve a student population within and outside of the region,
• Are committed to graduate education through the doctorate in targeted areas of excellence,
• Award at least 20 doctoral degrees per year,
• Offer at least 10 doctoral programs, and/or
• Enroll at least 150 doctoral students.
7
When these criteria are applied to Texas State University-San Marcos:
8
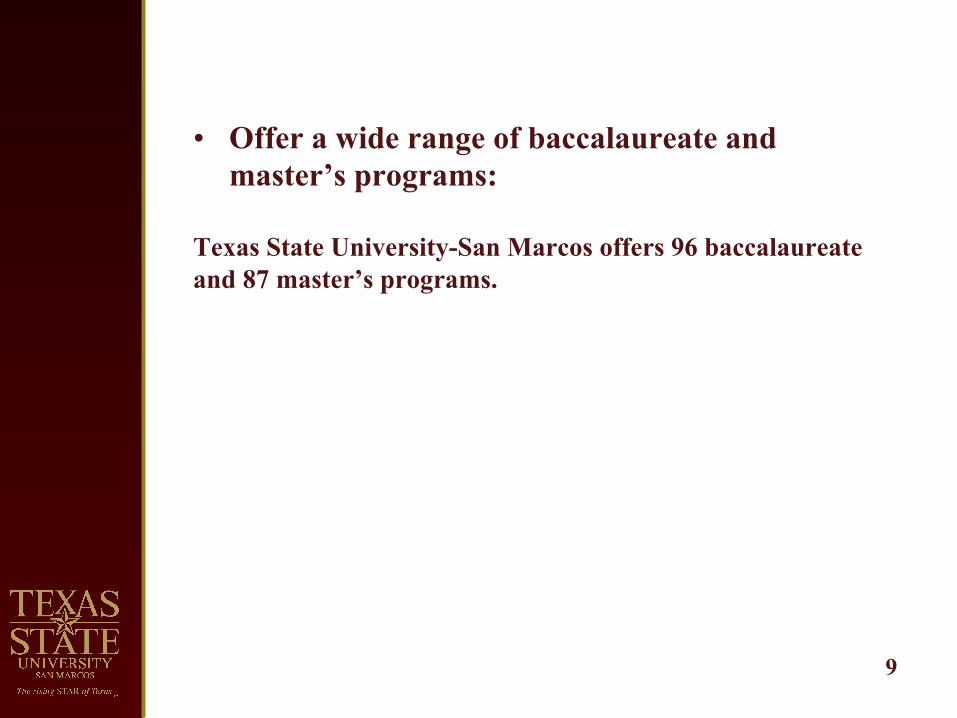
• Offer a wide range of baccalaureate and master’s programs:
Texas State University-San Marcos offers 96 baccalaureate and 87 master’s programs.
9
10
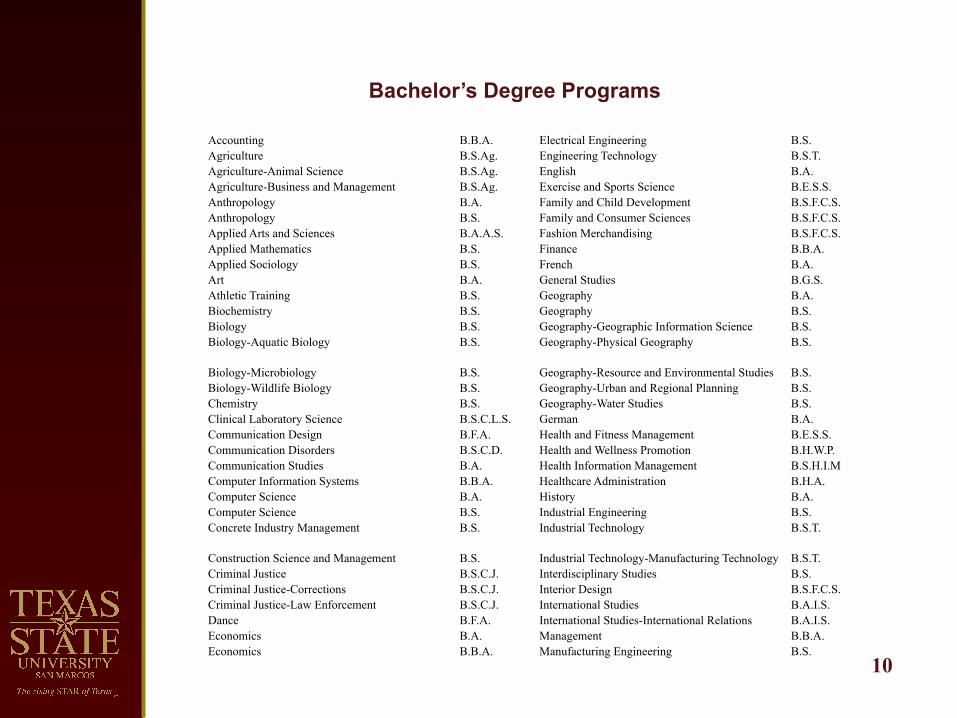
Accounting B.B.A. Electrical Engineering B.S. Agriculture B.S.Ag. Engineering Technology B.S.T. Agriculture-Animal Science B.S.Ag. English B.A. Agriculture-Business and Management B.S.Ag. Exercise and Sports Science B.E.S.S. Anthropology B.A. Family and Child Development B.S.F.C.S. Anthropology B.S. Family and Consumer Sciences B.S.F.C.S. Applied Arts and Sciences B.A.A.S. Fashion Merchandising B.S.F.C.S. Applied Mathematics B.S. Finance B.B.A. Applied Sociology B.S. French B.A. Art B.A. General Studies B.G.S. Athletic Training B.S. Geography B.A. Biochemistry B.S. Geography B.S. Biology B.S. Geography-Geographic Information Science B.S. Biology-Aquatic Biology B.S. Geography-Physical Geography B.S.
Biology-Microbiology B.S. Geography-Resource and Environmental Studies B.S. Biology-Wildlife Biology B.S. Geography-Urban and Regional Planning B.S. Chemistry B.S. Geography-Water Studies B.S. Clinical Laboratory Science B.S.C.L.S. German B.A. Communication Design B.F.A. Health and Fitness Management B.E.S.S. Communication Disorders B.S.C.D. Health and Wellness Promotion B.H.W.P. Communication Studies B.A. Health Information Management B.S.H.I.M Computer Information Systems B.B.A. Healthcare Administration B.H.A. Computer Science B.A. History B.A. Computer Science B.S. Industrial Engineering B.S. Concrete Industry Management B.S. Industrial Technology B.S.T.
Construction Science and Management B.S. Industrial Technology-Manufacturing Technology B.S.T. Criminal Justice B.S.C.J. Interdisciplinary Studies B.S. Criminal Justice-Corrections B.S.C.J. Interior Design B.S.F.C.S. Criminal Justice-Law Enforcement B.S.C.J. International Studies B.A.I.S. Dance B.F.A. International Studies-International Relations B.A.I.S. Economics B.A. Management B.B.A. Economics B.B.A. Manufacturing Engineering B.S.
Bachelor’s Degree Programs

11
Bachelor’s Degree Programs (continued)
Marketing B.B.A. Mass Communication B.A. Mass Communication-Advertising B.A. Mass Communication-Electronic Media B.A. Mass Communication-Journalism B.A. Mass Communication-Public Relations B.A. Mathematics B.A. Mathematics B.S. Music B.A. Music Studies B.M. Musical Theatre B.F.A. Nursing B.S.N. Nutrition and Foods B.S.F.C.S. Performance B.M. Philosophy B.A. Photography B.F.A. Physics B.A. Physics B.S. Political Science B.A. Psychology B.A. Psychology B.S. Public Administration B.P.A. Radiation Therapy B.S.R.T. Recreational Administration B.S.R.A. Respiratory Care B.S.R.C. Social Work B.S.W. Sociology B.A. Sound Recording Technology B.S. Spanish B.A. Studio Art B.F.A. Theatre B.A. Theatre B.F.A.
12
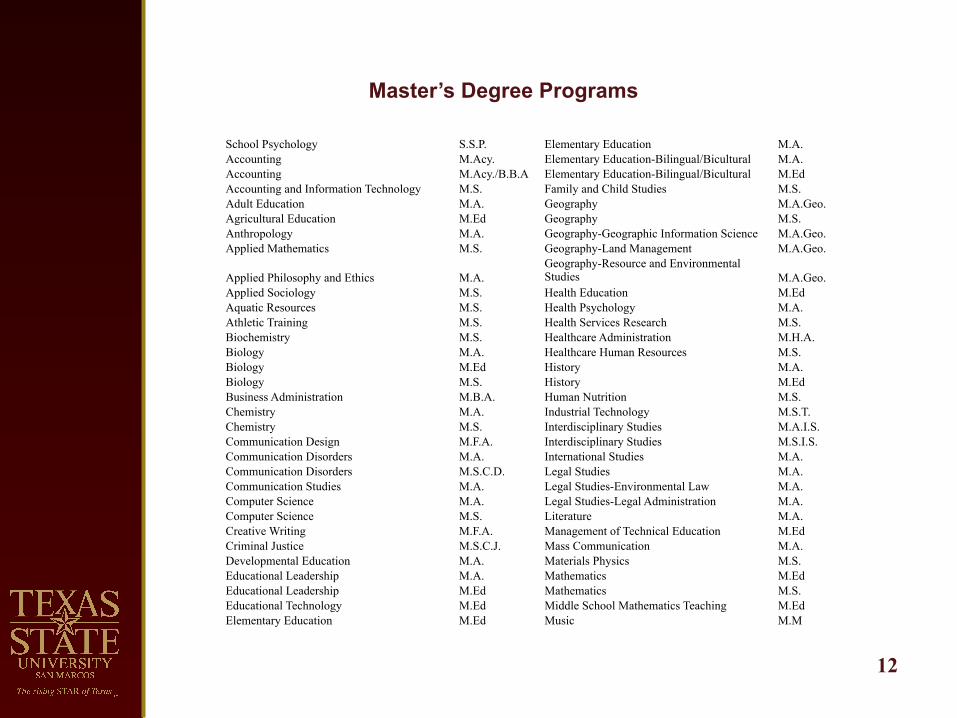
Master’s Degree Programs
School Psychology S.S.P. Elementary Education M.A. Accounting M.Acy. Elementary Education-Bilingual/Bicultural M.A. Accounting M.Acy./B.B.A Elementary Education-Bilingual/Bicultural M.Ed Accounting and Information Technology M.S. Family and Child Studies M.S. Adult Education M.A. Geography M.A.Geo. Agricultural Education M.Ed Geography M.S. Anthropology M.A. Geography-Geographic Information Science M.A.Geo. Applied Mathematics M.S. Geography-Land Management M.A.Geo.
Applied Philosophy and Ethics M.A. Geography-Resource and Environmental Studies M.A.Geo.
Applied Sociology M.S. Health Education M.Ed Aquatic Resources M.S. Health Psychology M.A. Athletic Training M.S. Health Services Research M.S. Biochemistry M.S. Healthcare Administration M.H.A. Biology M.A. Healthcare Human Resources M.S. Biology M.Ed History M.A. Biology M.S. History M.Ed Business Administration M.B.A. Human Nutrition M.S. Chemistry M.A. Industrial Technology M.S.T. Chemistry M.S. Interdisciplinary Studies M.A.I.S. Communication Design M.F.A. Interdisciplinary Studies M.S.I.S. Communication Disorders M.A. International Studies M.A. Communication Disorders M.S.C.D. Legal Studies M.A. Communication Studies M.A. Legal Studies-Environmental Law M.A. Computer Science M.A. Legal Studies-Legal Administration M.A. Computer Science M.S. Literature M.A. Creative Writing M.F.A. Management of Technical Education M.Ed Criminal Justice M.S.C.J. Mass Communication M.A. Developmental Education M.A. Materials Physics M.S. Educational Leadership M.A. Mathematics M.Ed Educational Leadership M.Ed Mathematics M.S. Educational Technology M.Ed Middle School Mathematics Teaching M.Ed Elementary Education M.Ed Music M.M

13
Master’s Degree Programs (continued)
Music Education M.M Physical Education M.Ed Physics M.S. Political Science M.A. Population and Conservation Biology M.S. Professional Counseling M.A. Public Administration M.P.A. Reading Education M.Ed Recreation and Leisure Services-Recreation Management M.S.R.L.S. Recreation and Leisure Services-Therapeutic Recreation M.S.R.L.S. Rhetoric and Composition M.A. Secondary Education M.A. Secondary Education M.Ed Social Work-Administration/Supervision Practice M.S.W. Social Work-Direct Practice M.S.W Sociology M.A. Software Engineering M.S. Spanish M.A. Special Education M.Ed Student Affairs in Higher Education M.Ed Technical Communication M.A. Theatre M.A. Wildlife Ecology M.S.
• Serve a student population within and outside of the region:
Texas State University-San Marcos serves over 34,000 students with students representing 233 of 254 Texas counties, 48 of 50 states, and 71 of 196 countries.
14
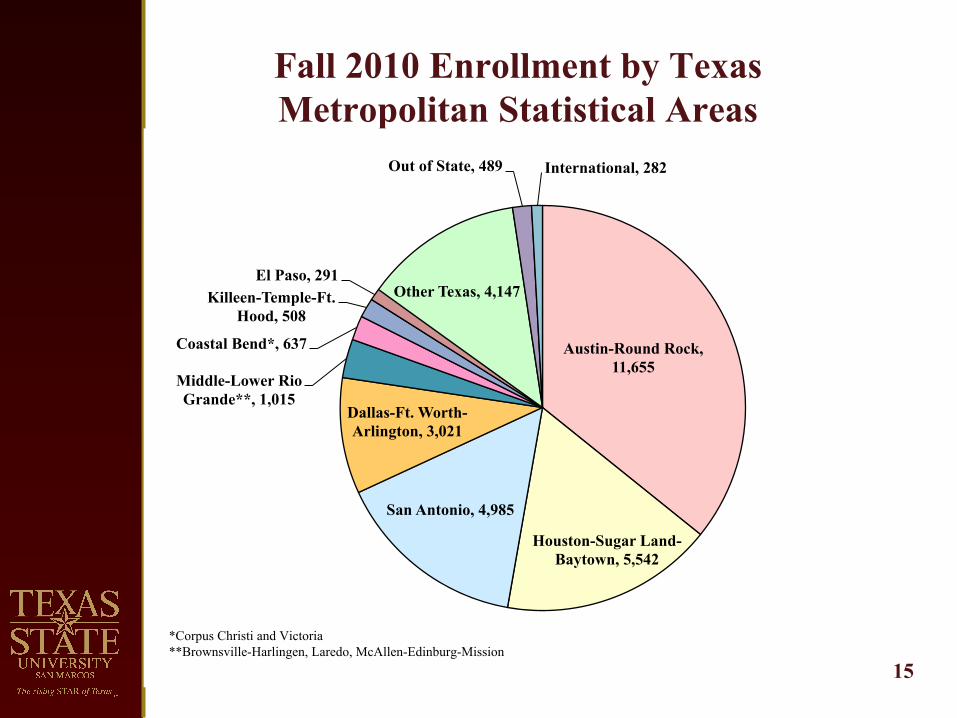
Fall 2010 Enrollment by Texas Metropolitan Statistical Areas
Austin-Round Rock, 11,655
Houston-Sugar Land-Baytown, 5,542
San Antonio, 4,985
Dallas-Ft. Worth-Arlington, 3,021
Middle-Lower Rio Grande**, 1,015
Coastal Bend*, 637
Killeen-Temple-Ft. Hood, 508
El Paso, 291 Other Texas, 4,147
Out of State, 489 International, 282
*Corpus Christi and Victoria **Brownsville-Harlingen, Laredo, McAllen-Edinburg-Mission
15
• Are committed to graduate education through the doctorate in targeted areas of excellence:
Texas State University-San Marcos is committed to graduate education through the doctorate in targeted areas of excellence. Texas State’s commitment to graduate education is university-wide:
• Texas State’s average master’s graduation rate of 62 percent is higher than three of the universities currently classified as Emerging Research Universities,
• Texas State’s doctoral graduation rate of 53 percent is higher than all except one of the universities originally classified as Emerging Research Universities, and
• Texas State ranks 30th in the nation for the number of master’s degrees awarded to Hispanic students.
16

Master’s and Doctoral Graduation Rates at Other Emerging Research Universities and
Texas State University-San Marcos
17
Master's Graduation Rate at Emerging Research Universities Including Texas State University-San Marcos by Fiscal Year*
2006 2007 2008 2009 2010 2011* 5-Yr Ave
The University of Texas at Dallas 74.4% 73.7% 69.6% 72.7% 69.2% 71.9% Texas Tech University 66.0% 65.9% 68.8% 69.9% 67.6% 67.6% University of Houston 65.8% 65.3% 62.0% 63.4% 69.4% 65.2% University of North Texas 61.2% 62.0% 62.5% 65.1% 66.0% 63.4% Texas State University-San Marcos 58.4% 58.4% 64.7% 61.1% 66.6% 70.5% 61.8% The University of Texas at Arlington 60.2% 60.1% 59.6% 53.8% 54.8% 57.7% The University of Texas at San Antonio 55.3% 52.6% 53.7% 51.7% 57.0% 54.1% The University of Texas at El Paso 47.3% 47.0% 50.6% 53.4% 51.6% 50.0% * 2011 data are preliminary.
Doctoral Graduation Rate at Emerging Research Universities Including Texas State University-San Marcos by Fiscal Year*
2006 2007 2008 2009 2010 2011 5-Yr Ave
Texas Tech University 51.1% 52.8% 57.4% 60.2% 67.5% 57.8% Texas State University-San Marcos 50.0% 50.0% 66.7% 71.4% 33.3% 44.4% 52.6% The University of Texas at San Antonio 37.5% 70.0% 30.8% 47.6% 80.0% 53.2% The University of Texas at El Paso 56.4% 40.6% 53.8% 44.9% 60.4% 51.2% University of Houston 37.0% 50.4% 54.6% 50.8% 52.8% 49.1% University of North Texas 48.5% 46.7% 47.4% 53.3% 42.6% 47.7% The University of Texas at Arlington 38.4% 36.7% 39.8% 51.0% 55.1% 44.2% The University of Texas at Dallas 36.5% 38.8% 34.6% 51.8% 40.0% 40.3% * 2011 data are preliminary.
Source: Accountability System and Graduation Report, Tx Higher Ed Coordinating Board. Updated by Institutional Research on 26-Oct-2011.
• Award at least 20 doctoral degrees per year:
In 2010-2011, 64 doctoral degrees were awarded, 25 of which were Ph.Ds.
18

Doctoral Degrees Awarded at Other Emerging Research Universities
and Texas State University-San Marcos
19
Doctoral Degrees Awarded at Emerging Research Universities
Including Texas State University-San Marcos in Fiscal Years
2006 2007 2008 2009 2010 2011
Texas Tech University 213 199 221 201 243
University of Houston 241 248 262 235 233
University of North Texas 152 214 211 175 219
The University of Texas at Dallas 116 131 111 117 195
The University of Texas at Arlington 104 123 153 113 127
The University of Texas at San Antonio 29 48 61 46 60
The University of Texas at El Paso 34 42 35 59 54
Texas State University-San Marcos 15 24 9 17 26 64
Source: Accountability System, Texas Higher Education Coordinating Board and Institutional Research.
Compiled by Institutional Research on 3-Oct-2011.
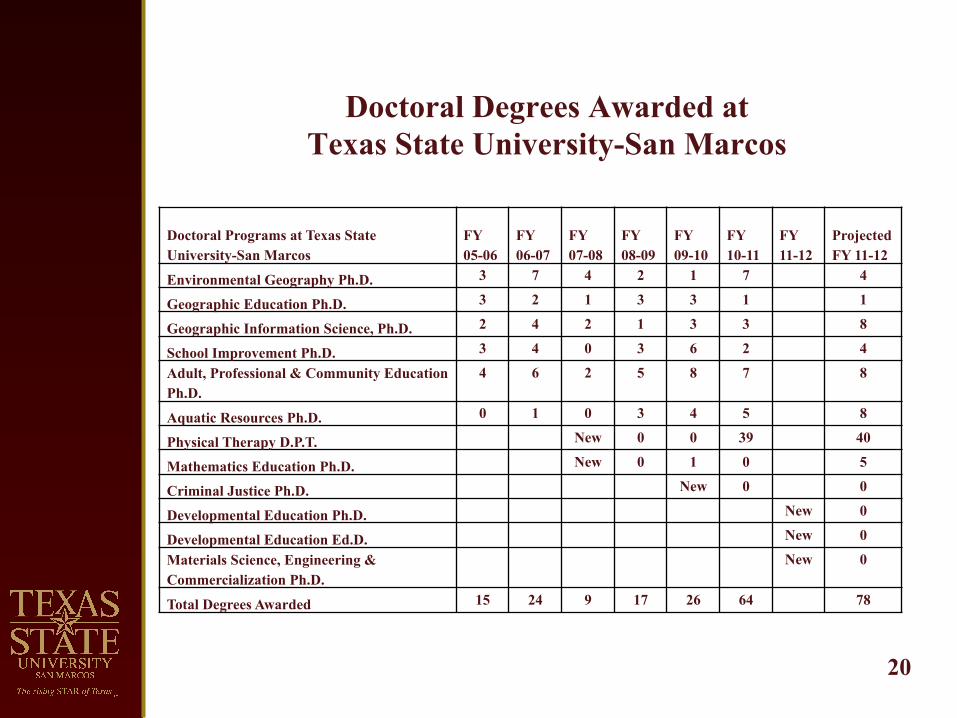
Doctoral Degrees Awarded at Texas State University-San Marcos
20
Doctoral Programs at Texas State University-San Marcos
FY 05-06
FY 06-07
FY 07-08
FY 08-09
FY 09-10
FY 10-11
FY 11-12
Projected FY 11-12
Environmental Geography Ph.D. 3 7 4 2 1 7 4
Geographic Education Ph.D. 3 2 1 3 3 1 1
Geographic Information Science, Ph.D. 2 4 2 1 3 3 8
School Improvement Ph.D. 3 4 0 3 6 2 4
Adult, Professional & Community Education Ph.D.
4 6 2 5 8 7 8
Aquatic Resources Ph.D. 0 1 0 3 4 5 8
Physical Therapy D.P.T. New 0 0 39 40
Mathematics Education Ph.D. New 0 1 0 5
Criminal Justice Ph.D. New 0 0
Developmental Education Ph.D. New 0
Developmental Education Ed.D. New 0
Materials Science, Engineering & Commercialization Ph.D.
New 0
Total Degrees Awarded 15 24 9 17 26 64 78

• Offer at least 10 doctoral programs:
Texas State University-San Marcos offers 12 doctoral programs in targeted areas of excellence.
21

Doctoral Programs Degree Program Degree
Aquatic Resources Ph.D.
Criminal Justice Ph.D.
Developmental Education* Ph.D.
Developmental Education* Ed.D.
Ed-Adult, Professional and Community Ed Ph.D.
Ed-School Improvement Ph.D.
Geog-Environmental Geography Ph.D.
Geog-Geographic Information Science Ph.D.
Geog-Geographic Education Ph.D.
Materials Science, Engineering & Commercialization** Ph.D.
Mathematics Education Ph.D.
Physical Therapy D.P.T.
*Approved in July 2011. **Approved in October 2011.
Sources: Texas State University Degree Program Inventory. 22

• Enroll at least 150 doctoral students.
Texas State University-San Marcos enrolled 404 doctoral students in Fall 2011.
23
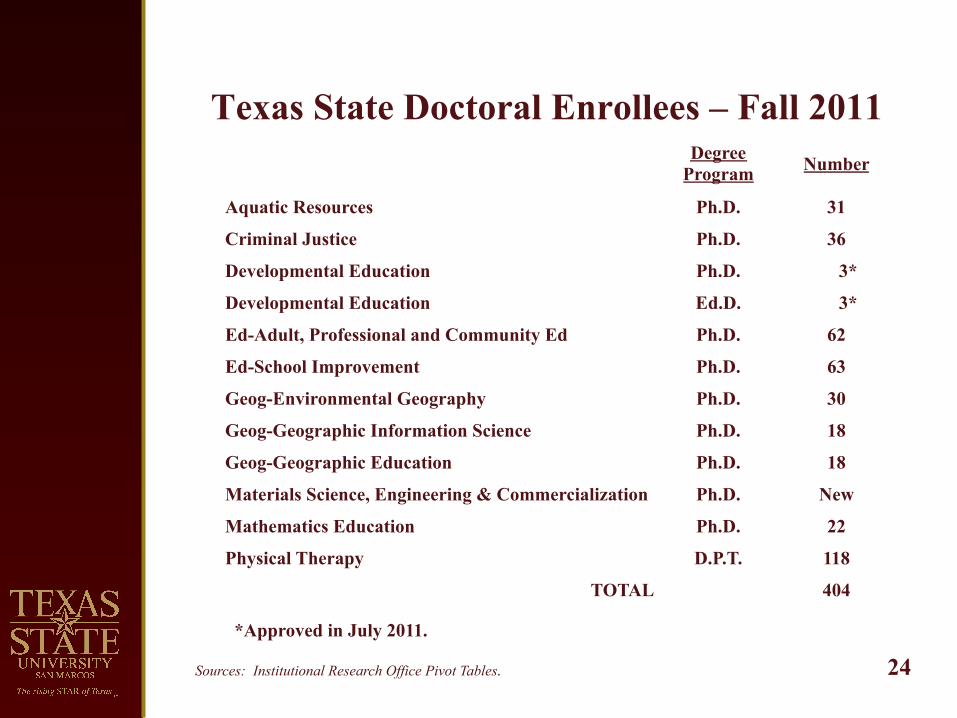
Texas State Doctoral Enrollees – Fall 2011 Degree
Program Number
Aquatic Resources Ph.D. 31
Criminal Justice Ph.D. 36
Developmental Education Ph.D. 3*
Developmental Education Ed.D. 3*
Ed-Adult, Professional and Community Ed Ph.D. 62
Ed-School Improvement Ph.D. 63
Geog-Environmental Geography Ph.D. 30
Geog-Geographic Information Science Ph.D. 18
Geog-Geographic Education Ph.D. 18
Materials Science, Engineering & Commercialization Ph.D. New
Mathematics Education Ph.D. 22
Physical Therapy D.P.T. 118
TOTAL 404
*Approved in July 2011.
Sources: Institutional Research Office Pivot Tables. 24
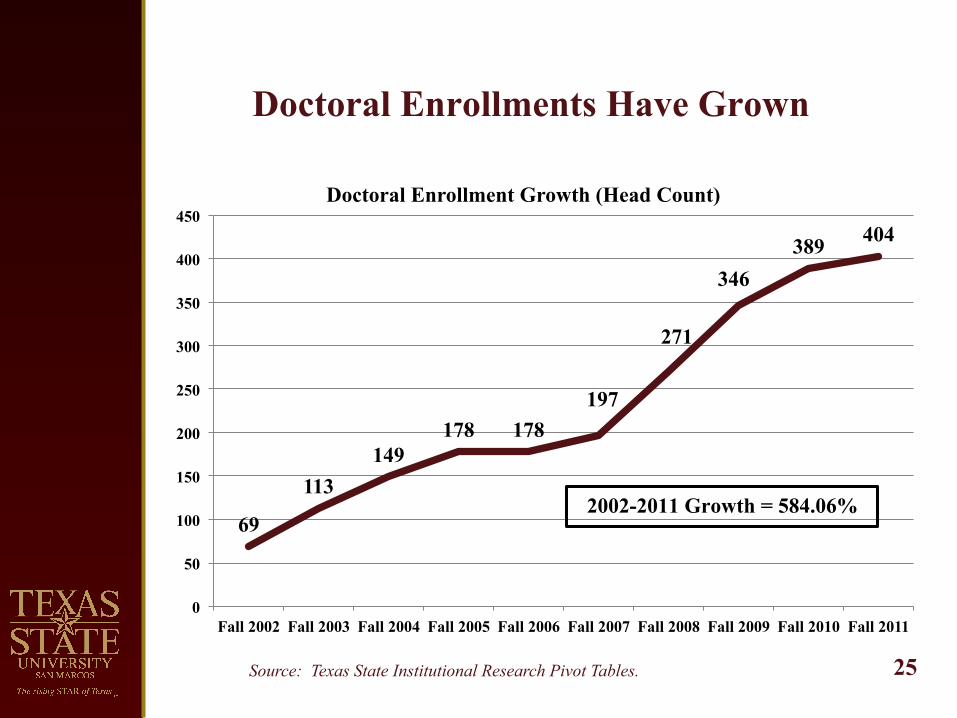
Doctoral Enrollments Have Grown
Source: Texas State Institutional Research Pivot Tables. 25
69
113 149
178 178 197
271
346 389 404
0
50
100
150
200
250
300
350
400
450
Fall 2002 Fall 2003 Fall 2004 Fall 2005 Fall 2006 Fall 2007 Fall 2008 Fall 2009 Fall 2010 Fall 2011
Doctoral Enrollment Growth (Head Count)
2002-2011 Growth = 584.06%

Additionally, Texas State University-San Marcos’ research expenditures have grown dramatically, and now far exceed the $14 million threshold cited in the Coordinating Board’s “Accountability in Higher Education: Promoting Excellence in Texas Public Universities through Institutional Groupings, Peers, and Benchmarks.”
26

Research Expenditures Have Increased Significantly at Texas State
Source: THECB Accountability System. *FY 2011 is unofficial as reported to the THECB. 27
$8,897,766 $9,497,545 $10,319,657
$19,309,464
$24,494,208
$30,560,431 $33,486,997
$0
$5,000,000
$10,000,000
$15,000,000
$20,000,000
$25,000,000
$30,000,000
$35,000,000
$40,000,000
FY 2005 FY 2006 FY 2007 FY 2008 FY 2009 FY 2010 FY 2011*
Total Expenditures for Research and Other Research-Related Sponsored Programs - FY 2005-FY 2011
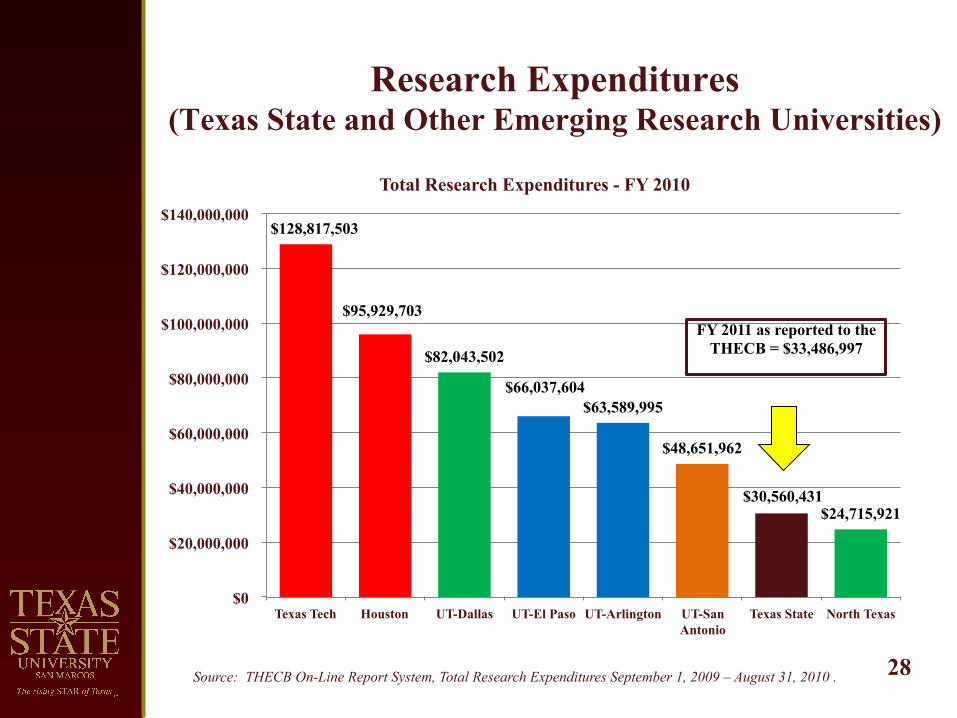
Research Expenditures (Texas State and Other Emerging Research Universities)
Source: THECB On-Line Report System, Total Research Expenditures September 1, 2009 – August 31, 2010 . 28
$128,817,503
$95,929,703
$82,043,502
$66,037,604 $63,589,995
$48,651,962
$30,560,431 $24,715,921
$0
$20,000,000
$40,000,000
$60,000,000
$80,000,000
$100,000,000
$120,000,000
$140,000,000
Texas Tech Houston UT-Dallas UT-El Paso UT-Arlington UT-San Antonio
Texas State North Texas
Total Research Expenditures - FY 2010
FY 2011 as reported to the THECB = $33,486,997

Even with this dramatic increase in research, Texas State retains a firm commitment to undergraduate education. As President Trauth wrote to Commissioner Paredes in September of 2011:
. . . Texas State is deeply committed to undergraduate student success even as we broaden our mission to include doctoral programs and an expanded research agenda. Indeed, if you look at our undergraduate success metrics -- our retention and graduation rates -- since we awarded our first Ph.D. degree in 2000, you will note that both metrics have gone up -- and the graduation rate dramatically so -- since that date. . . . In addition to these accomplishments, Texas State has become a Hispanic Serving Institution (HSI) and claims the highest first-year persistence rates and six-year graduation rates of any of Texas’s Emerging Research or Doctoral Universities currently classified as Hispanic Serving Institutions.
29

Comparisons of Texas State with Other Emerging Research Universities
30
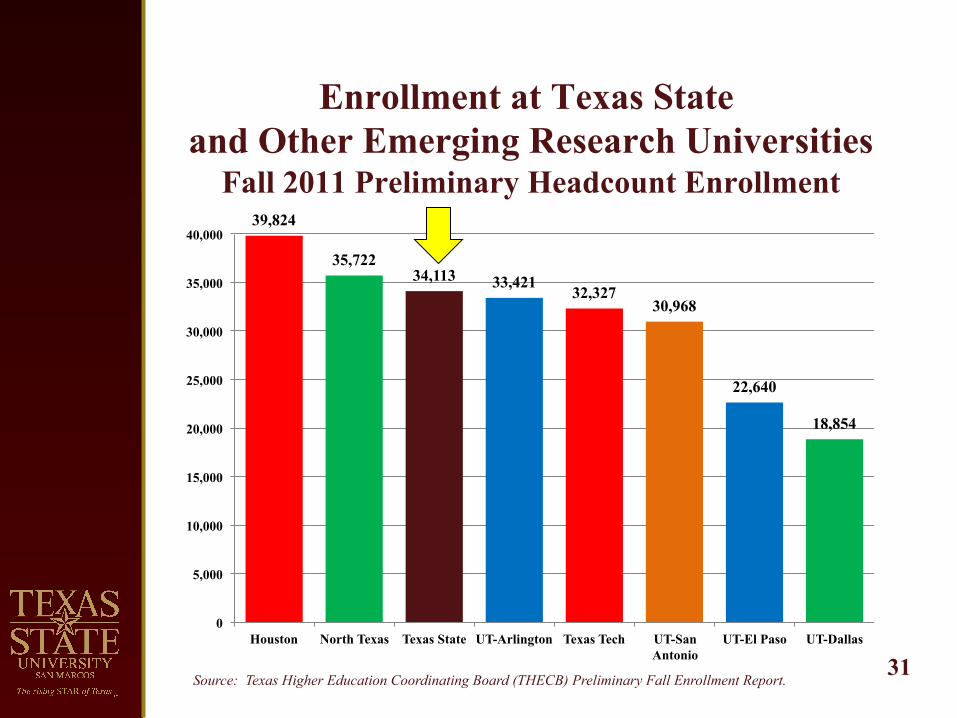
Enrollment at Texas State and Other Emerging Research Universities
Fall 2011 Preliminary Headcount Enrollment
31
39,824
35,722 34,113 33,421 32,327
30,968
22,640
18,854
0
5,000
10,000
15,000
20,000
25,000
30,000
35,000
40,000
Houston North Texas Texas State UT-Arlington Texas Tech UT-San Antonio
UT-El Paso UT-Dallas
Source: Texas Higher Education Coordinating Board (THECB) Preliminary Fall Enrollment Report.

First-Time Freshmen in Top Quarter of High School Class - Fall 2010
Texas State and Other Emerging Research Universities
Source: THECB First-Time Undergraduate Applicant, Acceptance, and Enrollment Information for Summer/Fall 2010. 32
61% 57%
52% 51% 50%
40% 36% 35%
0%
10%
20%
30%
40%
50%
60%
70%
UT-Arlington UT-Dallas Texas Tech North Texas Texas State UT-San Antonio
Houston UT-El Paso
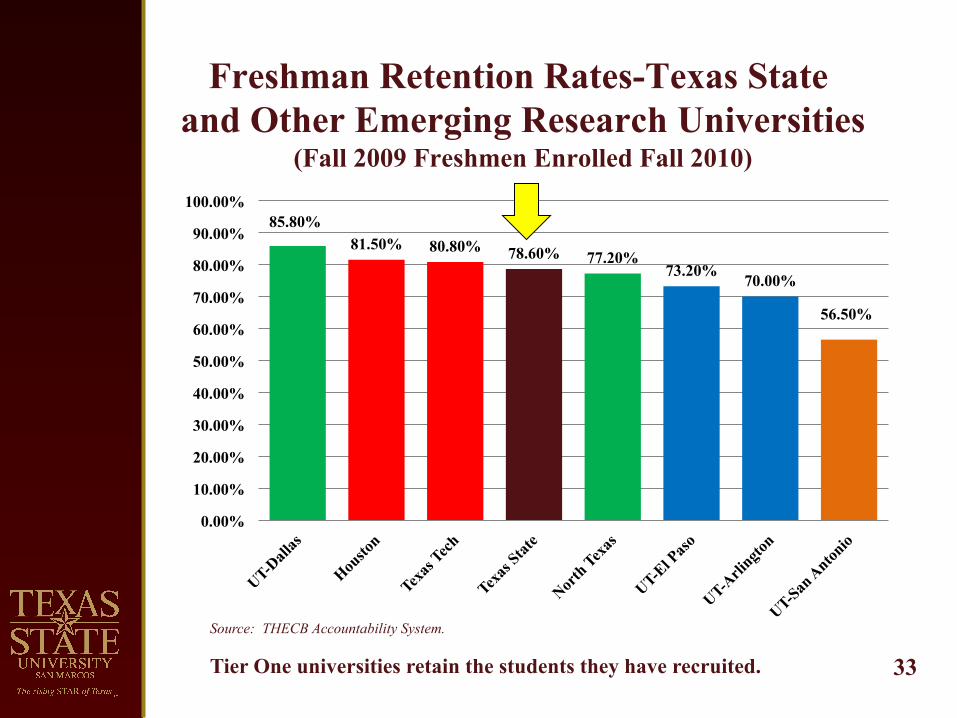
Freshman Retention Rates-Texas State and Other Emerging Research Universities
(Fall 2009 Freshmen Enrolled Fall 2010)
Source: THECB Accountability System.
Tier One universities retain the students they have recruited.
33
85.80% 81.50% 80.80% 78.60% 77.20%
73.20% 70.00%
56.50%
0.00%
10.00%
20.00%
30.00%
40.00%
50.00%
60.00%
70.00%
80.00%
90.00%
100.00%

Six-Year Graduation Rates-Texas State and Other Emerging Research Universities
(Fall 2004 Cohort Graduated through August 2010)
Source: THECB Report, Baccalaureate Graduation Rates – First Time Entering Undergraduates.
One of the most important metrics because Tier One universities have high graduation rates. 34
62.9% 62.2%
54.2% 48.3%
45.3% 41.5%
35.1%
26.3%
0.0%
10.0%
20.0%
30.0%
40.0%
50.0%
60.0%
70.0%
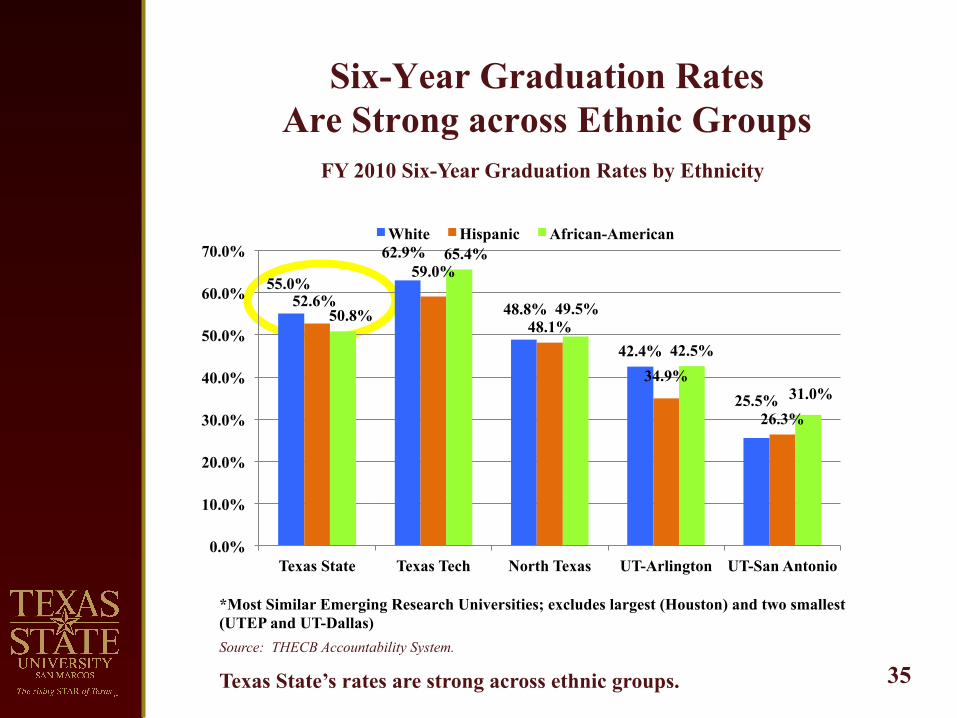
Six-Year Graduation Rates Are Strong across Ethnic Groups
Source: THECB Accountability System.
Texas State’s rates are strong across ethnic groups.
FY 2010 Six-Year Graduation Rates by Ethnicity
*Most Similar Emerging Research Universities; excludes largest (Houston) and two smallest (UTEP and UT-Dallas)
35
55.0%
62.9%
48.8%
42.4%
25.5%
52.6%
59.0%
48.1%
34.9%
26.3%
50.8%
65.4%
49.5%
42.5%
31.0%
0.0%
10.0%
20.0%
30.0%
40.0%
50.0%
60.0%
70.0%
Texas State Texas Tech North Texas UT-Arlington UT-San Antonio
White Hispanic African-American