Embed Size (px)
Citation preview
Texas v. the U.S.:Texas v. the U.S.:How do our kids fare?How do our kids fare?
Frances Deviney, PhDTexas KIDS COUNT Director
Center for Public Policy Priorities
Austin, TXJuly 27, 2010

Nearly 74 Million Kids in U.S.
Source: 2008, KIDS COUNT Data Center, Annie E. Casey Foundation
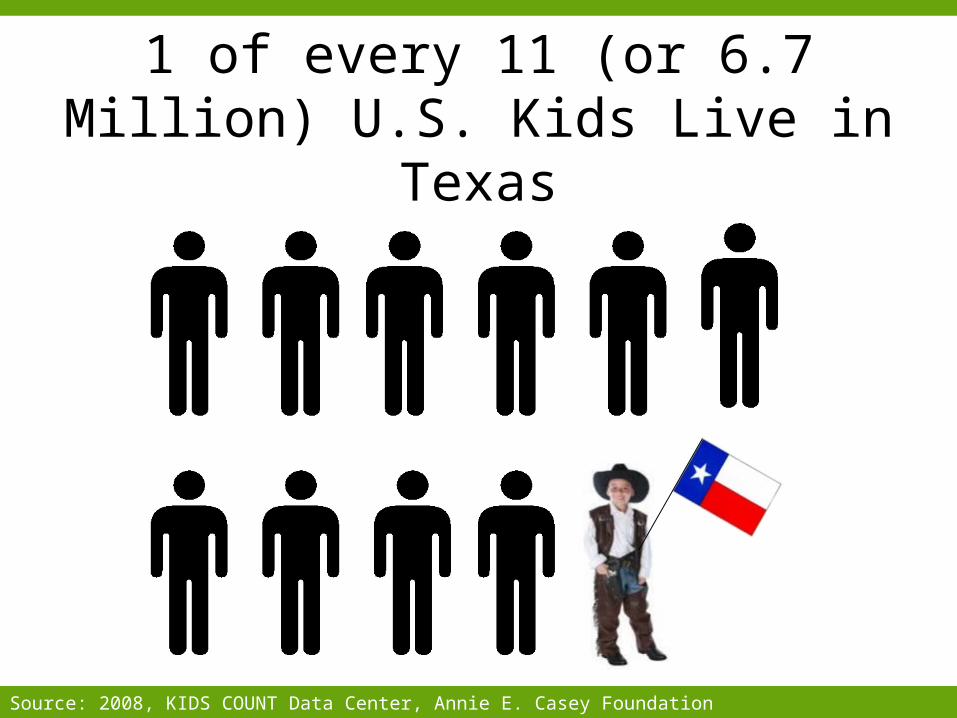
1 of every 11 (or 6.7 Million) U.S. Kids Live in Texas
Source: 2008, KIDS COUNT Data Center, Annie E. Casey Foundation
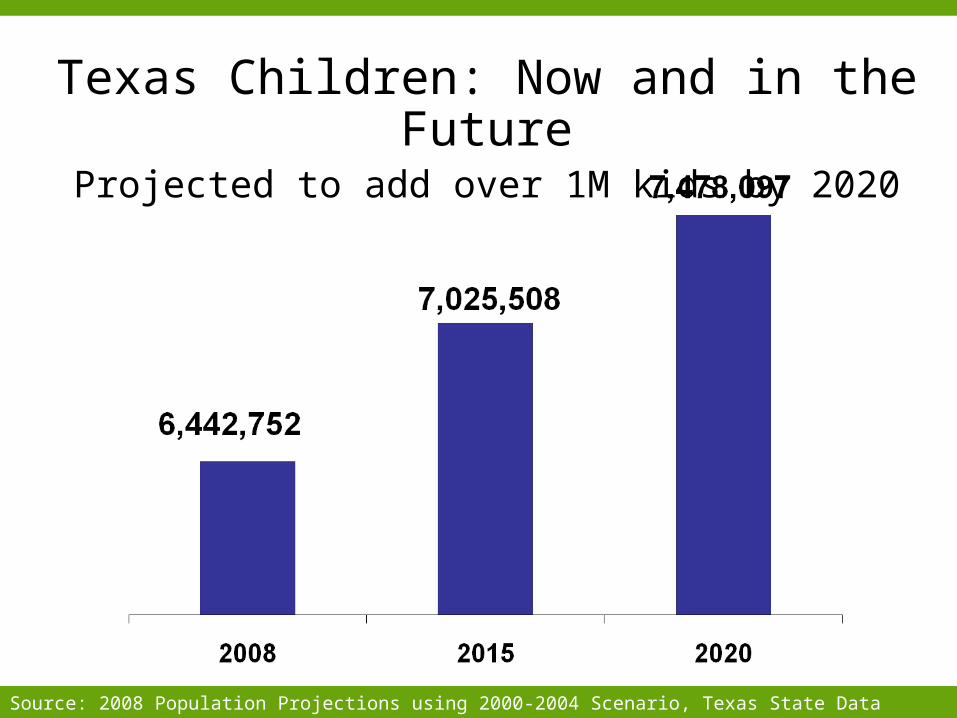
Texas Children: Now and in the FutureProjected to add over 1M kids by 2020
Source: 2008 Population Projections using 2000-2004 Scenario, Texas State Data Center
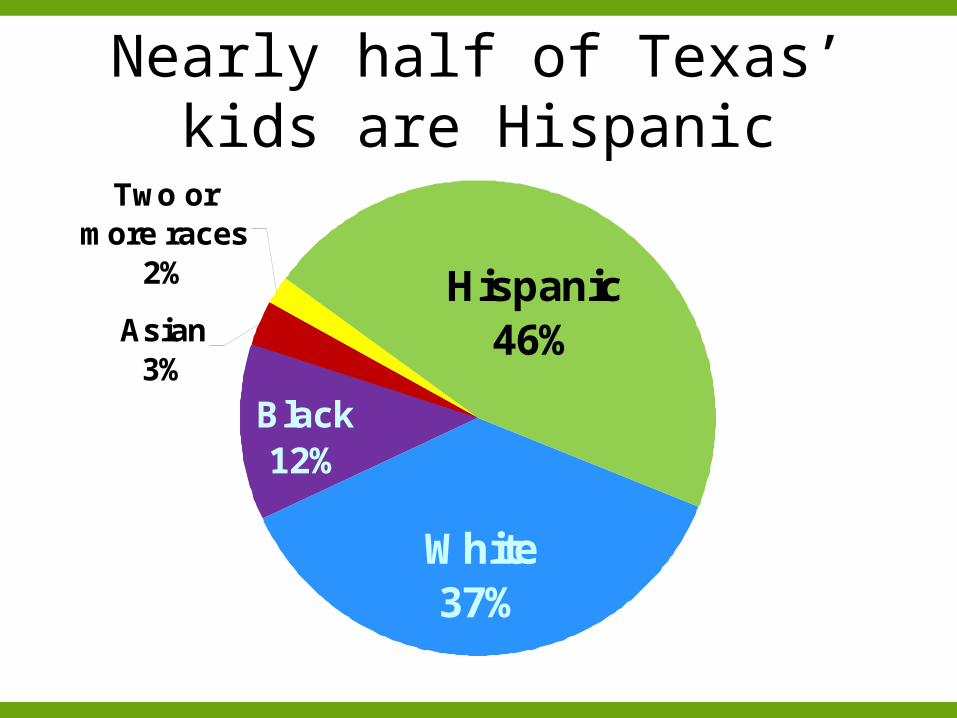
Nearly half of Texas’ kids are Hispanic
White37%
Black12%
Asian3%
Two or more races
2% Hispanic46%
One of every three TX Kids Lives in Single-parent Home
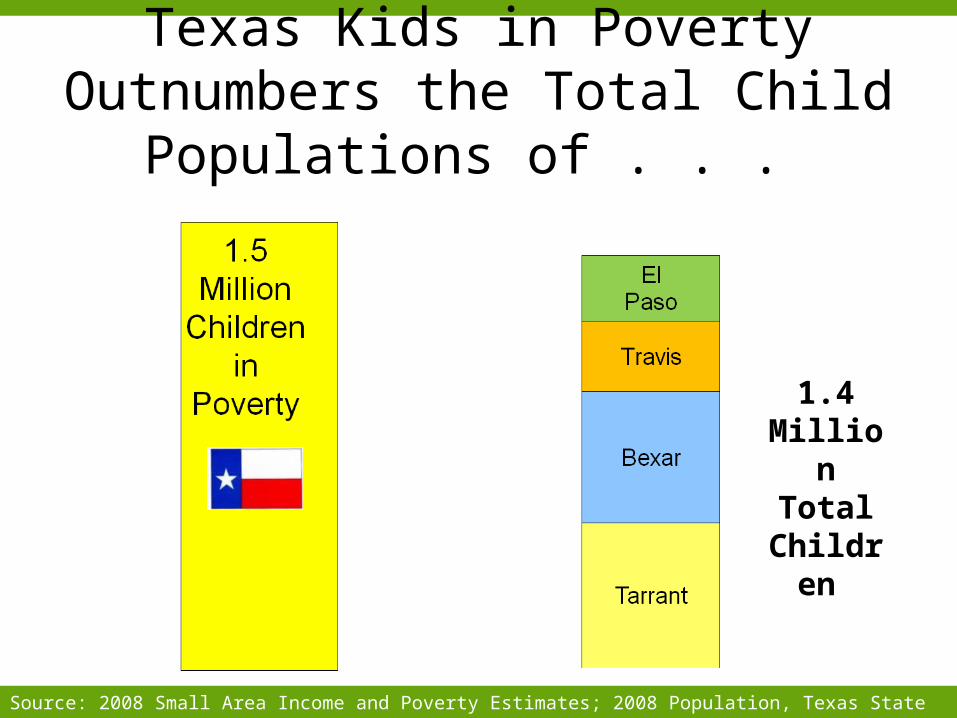
Texas Kids in Poverty Outnumbers the Total Child Populations of . . .
1.4 Million Total
Children
Source: 2008 Small Area Income and Poverty Estimates; 2008 Population, Texas State Data Center
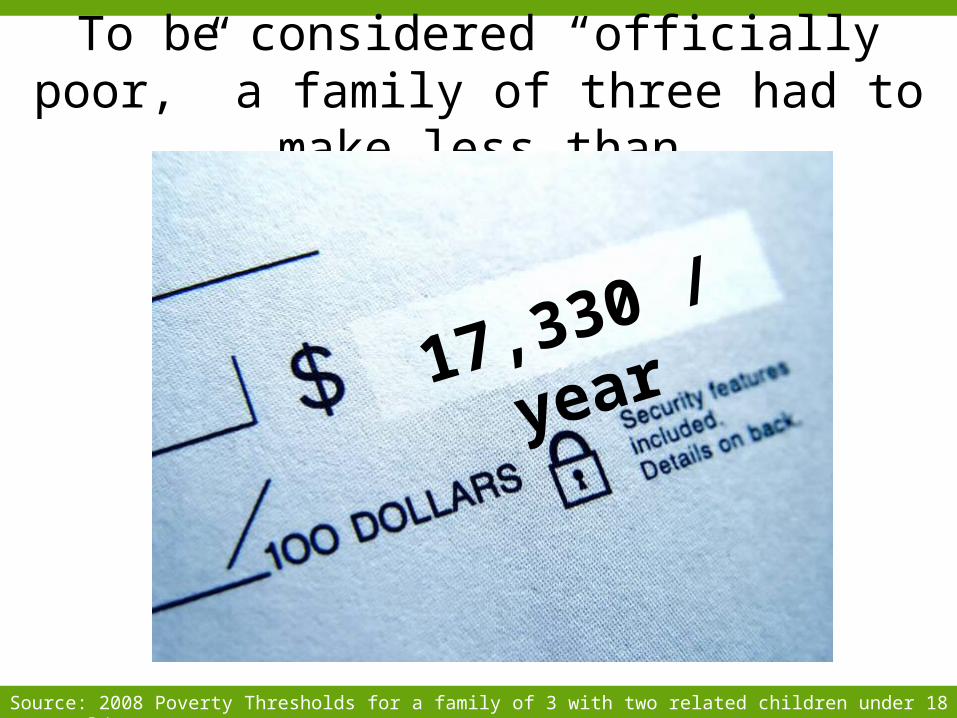
To be considered “officially poor,” a family of three had to make less than
17,330 / year
Source: 2008 Poverty Thresholds for a family of 3 with two related children under 18 years old
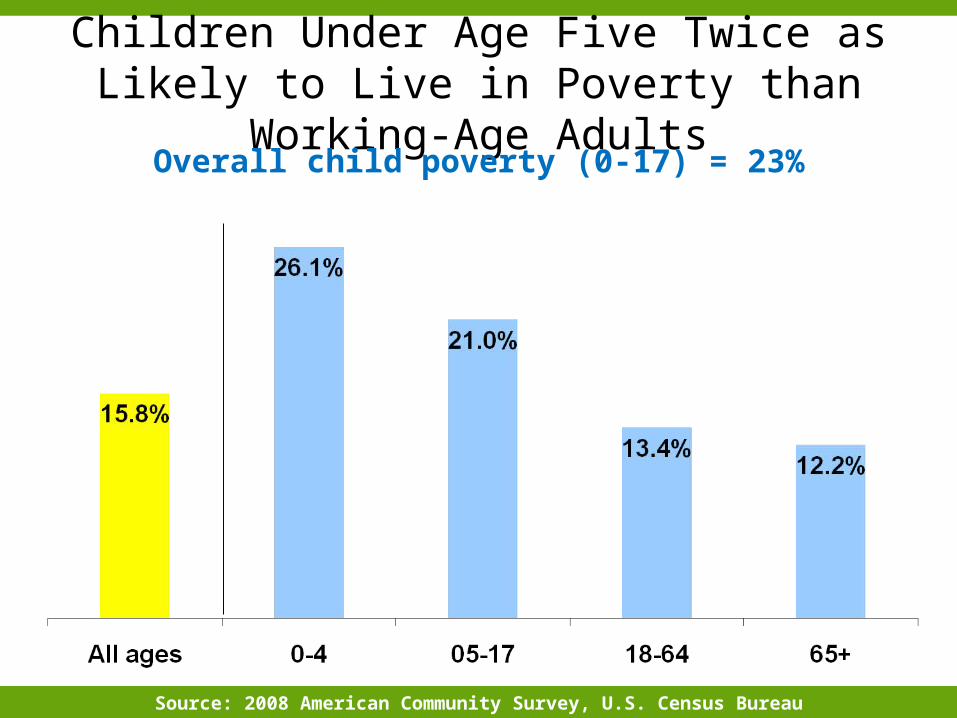
Children Under Age Five Twice as Likely to Live in Poverty than Working-Age Adults
Source: 2008 American Community Survey, U.S. Census BureauSource: 2008 American Community Survey, U.S. Census Bureau
Overall child poverty (0-17) = 23%
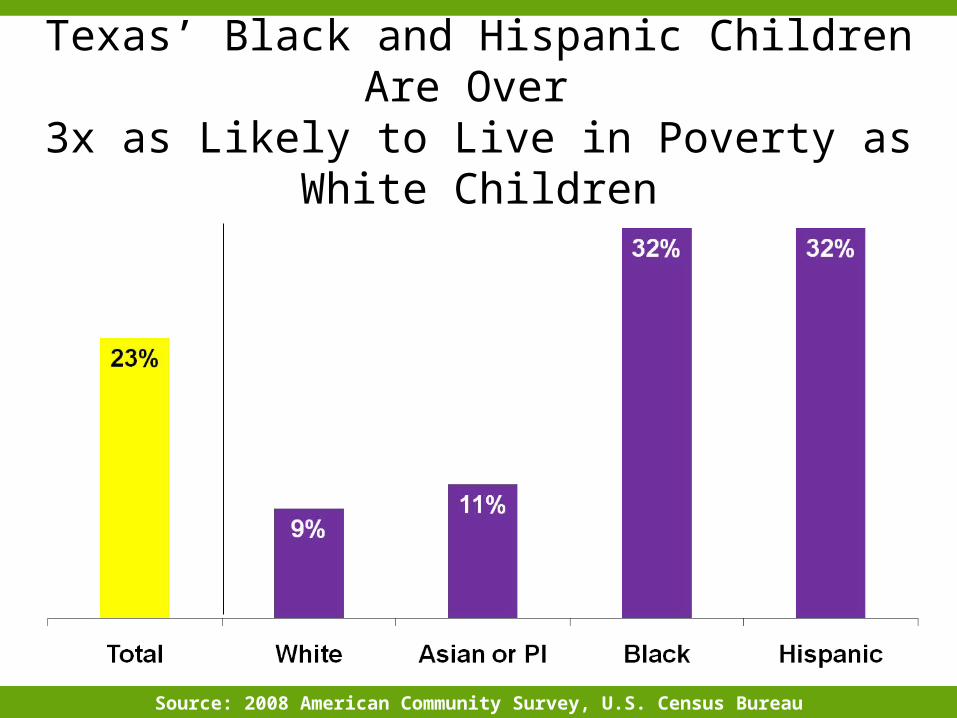
Texas’ Black and Hispanic Children Are Over 3x as Likely to Live in Poverty as White Children
Source: 2008 American Community Survey, U.S. Census BureauSource: 2008 American Community Survey, U.S. Census Bureau

Thrive
Grow
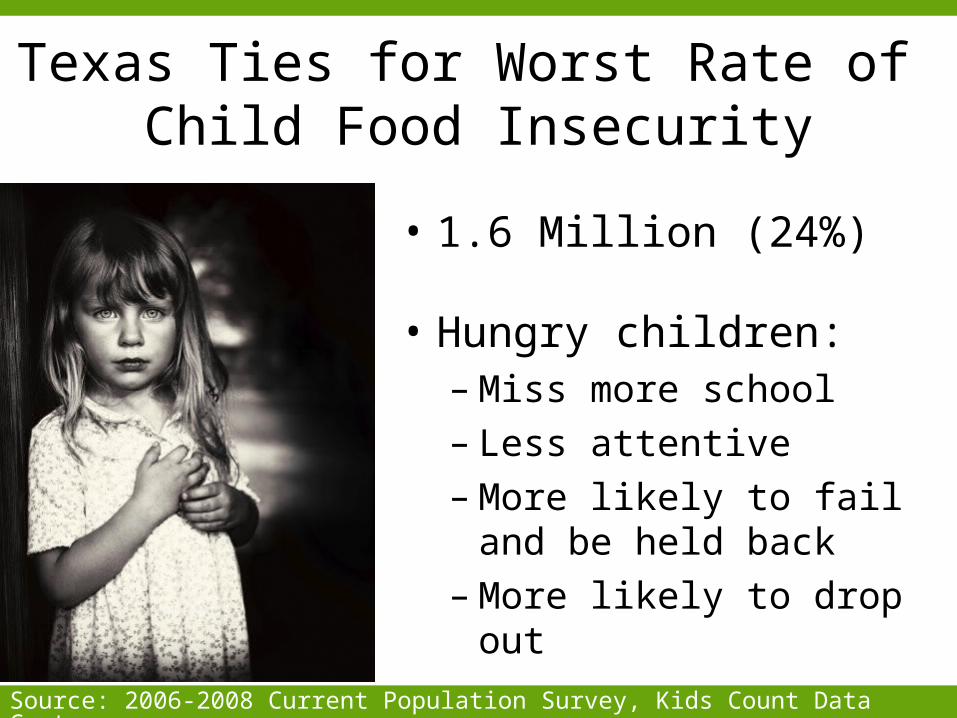
Texas Ties for Worst Rate of Child Food Insecurity
Source: 2006-2008 Current Population Survey, Kids Count Data Center
• 1.6 Million (24%)
• Hungry children:– Miss more school– Less attentive– More likely to fail and be
held back– More likely to drop out
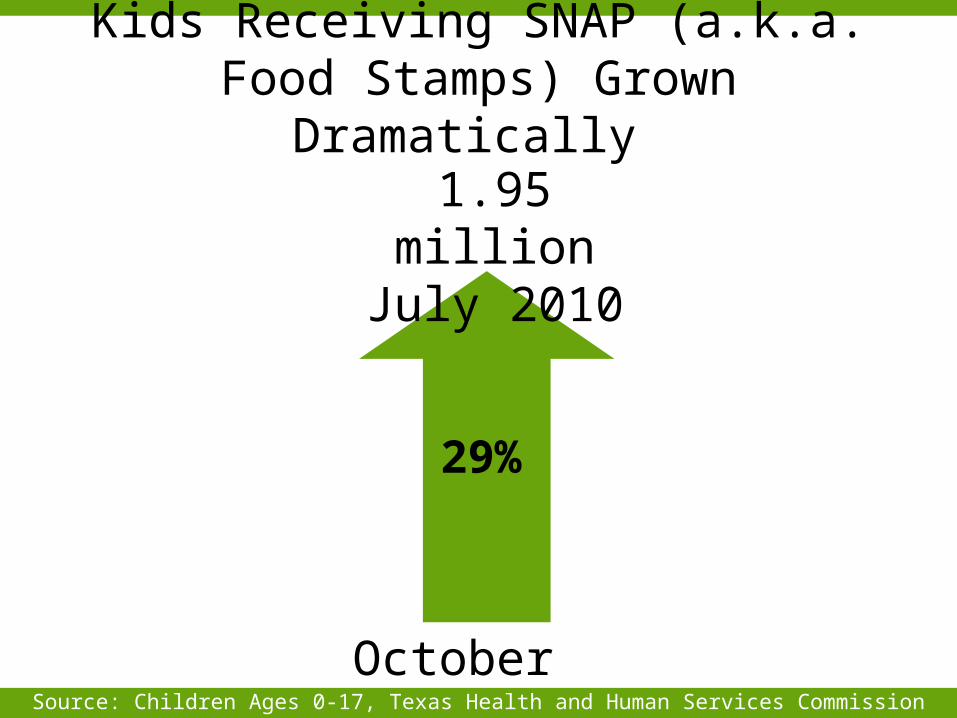
Kids Receiving SNAP (a.k.a. Food Stamps) Grown Dramatically
29%
October 2008Source: Children Ages 0-17, Texas Health and Human Services Commission
1.95 million July 2010

Health Care Coverage and GapsHealth Care Coverage and Gaps
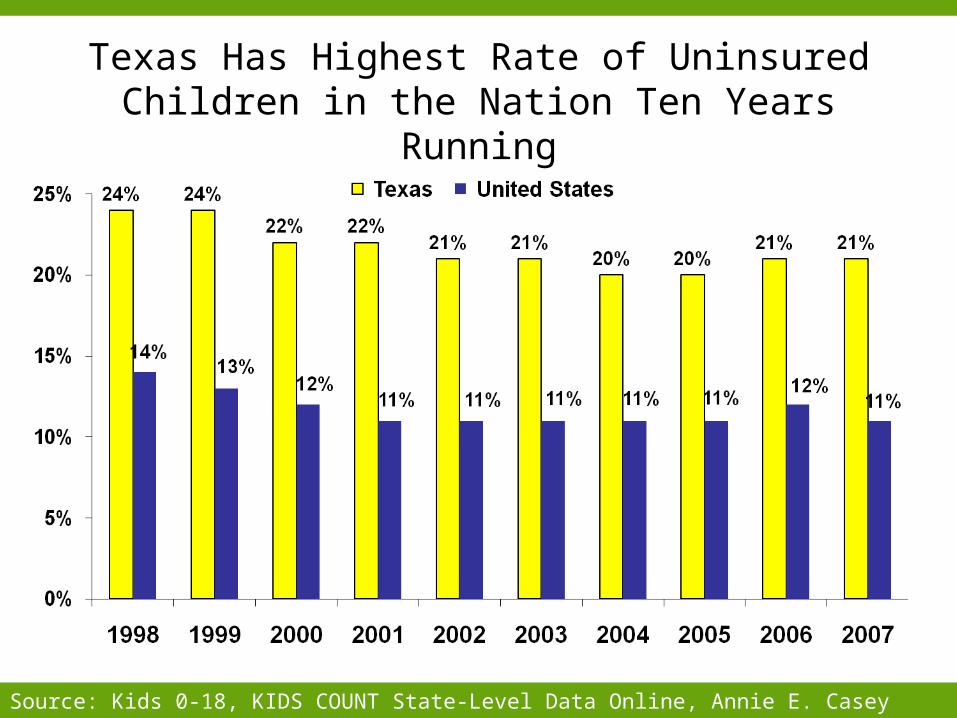
Texas Has Highest Rate of Uninsured Children in the Nation Ten Years Running
Source: Kids 0-18, KIDS COUNT State-Level Data Online, Annie E. Casey Foundation
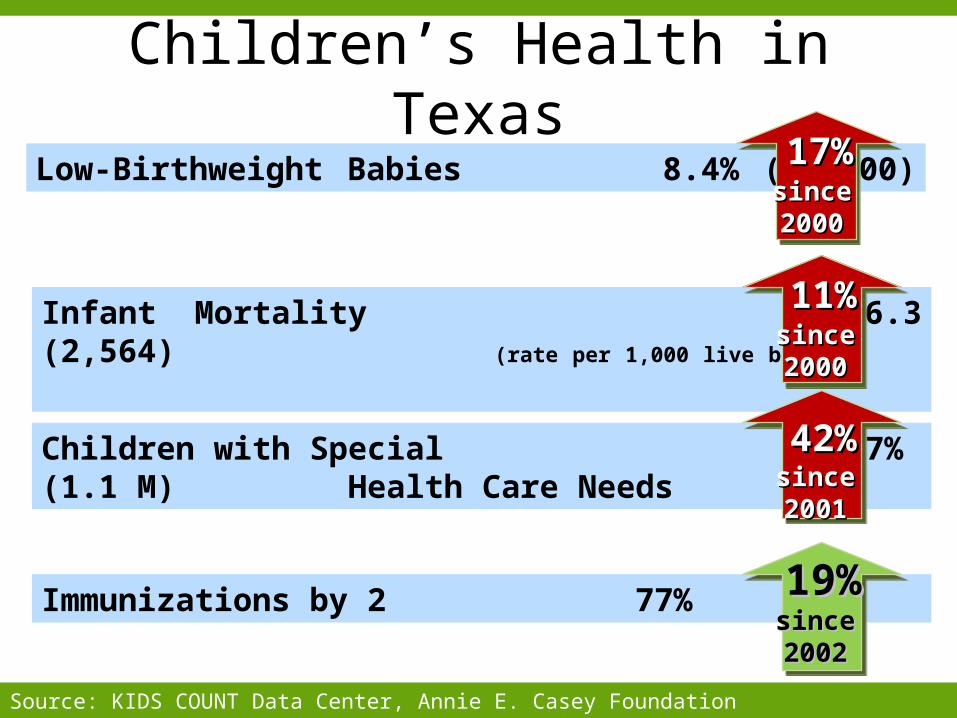
Children’s Health in Texas
Infant Mortality 6.3 (2,564) (rate per 1,000 live births)
11%11% since since 2000 2000
Immunizations by 2 77% 19% 19% since since 2002 2002
Children with Special 17% (1.1 M) Health Care Needs
42%42% since since 2001 2001
Low-Birthweight Babies 8.4% (34,000) 17%17% since since 2000 2000
Source: KIDS COUNT Data Center, Annie E. Casey Foundation

State of Texas Families’ Economic Security?
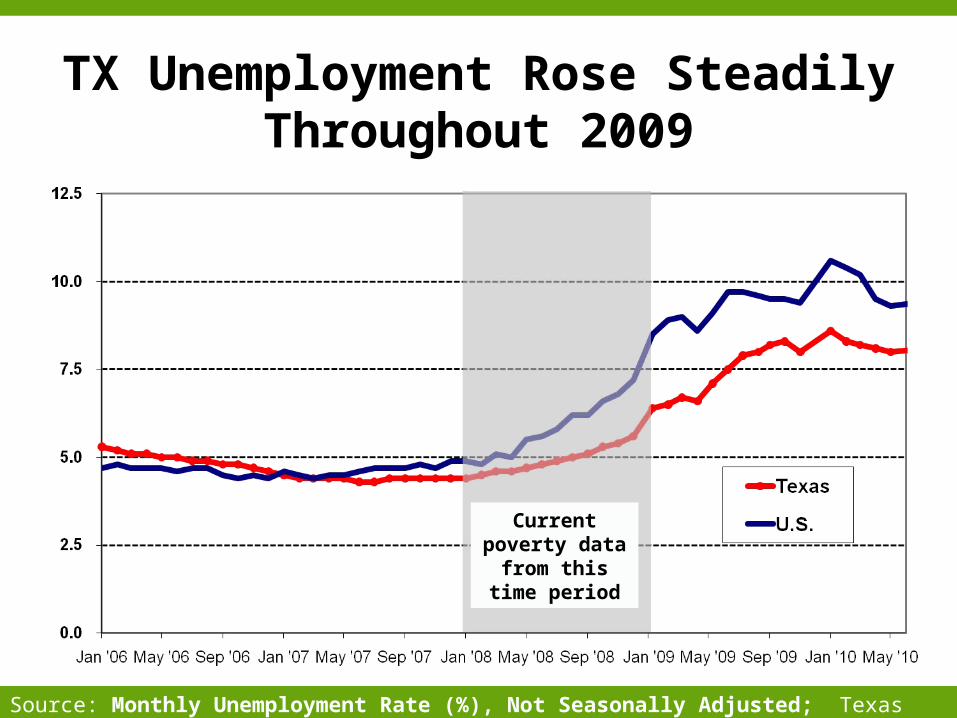
TX Unemployment Rose Steadily Throughout 2009
Current poverty data from this
time period
Source: Monthly Unemployment Rate (%), Not Seasonally Adjusted; Texas Workforce Commission

Education = Economic Competitiveness
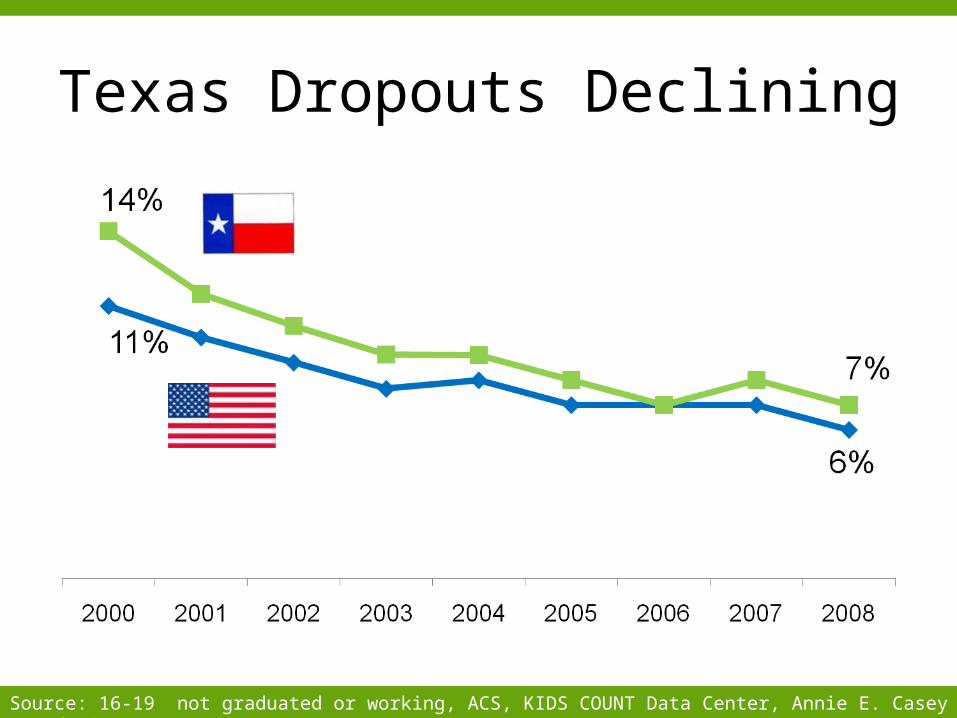
Texas Dropouts Declining
Source: 16-19 not graduated or working, ACS, KIDS COUNT Data Center, Annie E. Casey Foundation
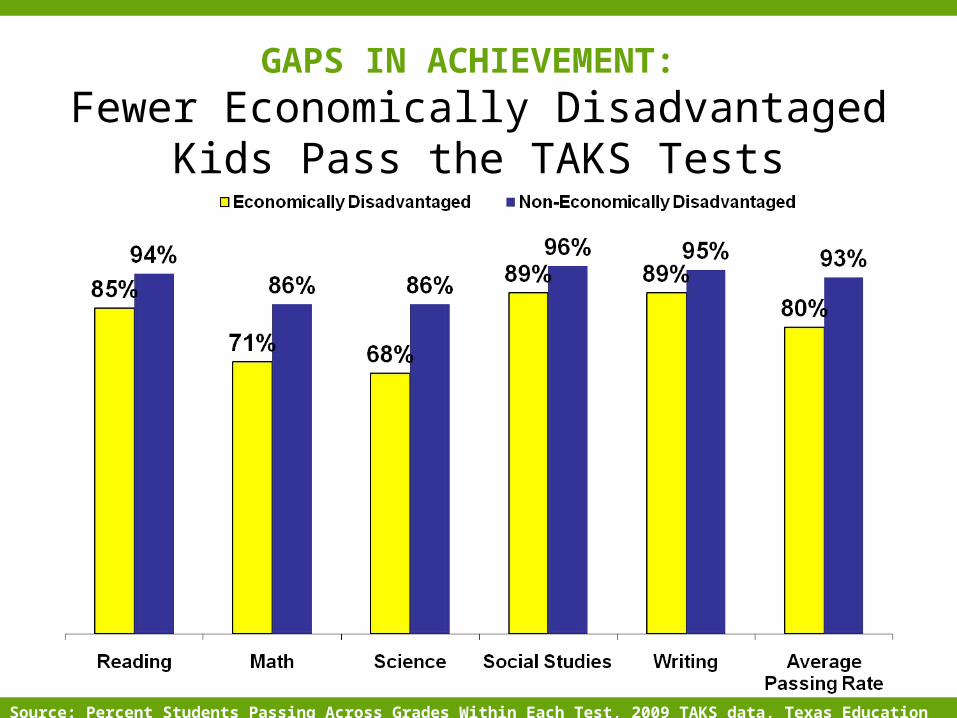
GAPS IN ACHIEVEMENT:
Fewer Economically Disadvantaged Kids Pass the TAKS Tests
Source: Percent Students Passing Across Grades Within Each Test, 2009 TAKS data, Texas Education Agency
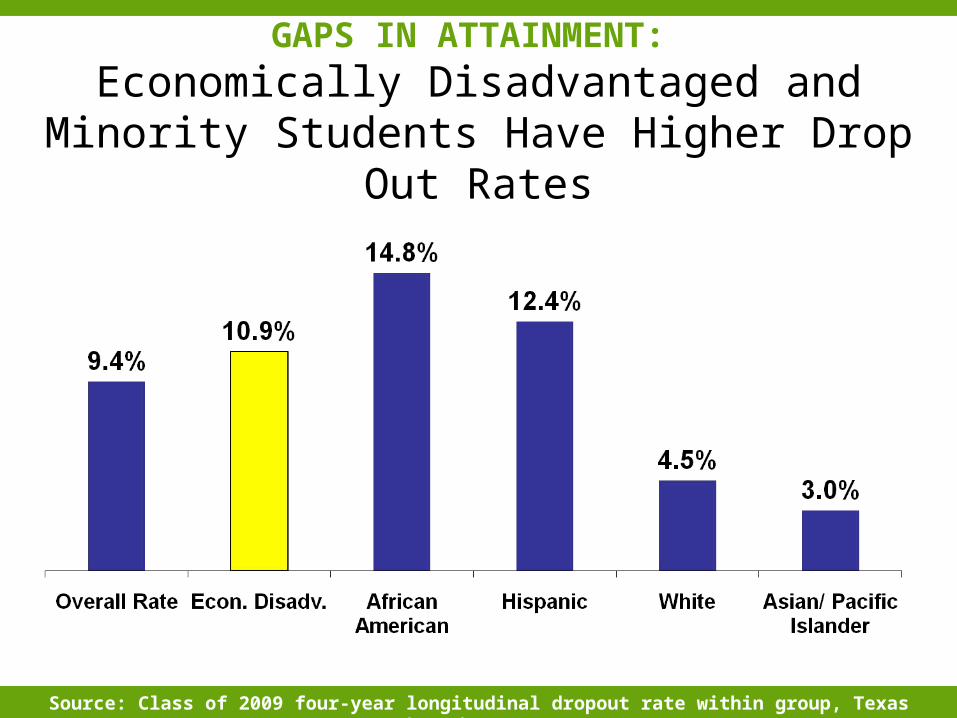
GAPS IN ATTAINMENT:
Economically Disadvantaged and Minority Students Have Higher Drop Out Rates
Source: Class of 2009 four-year longitudinal dropout rate within group, Texas Education Agency
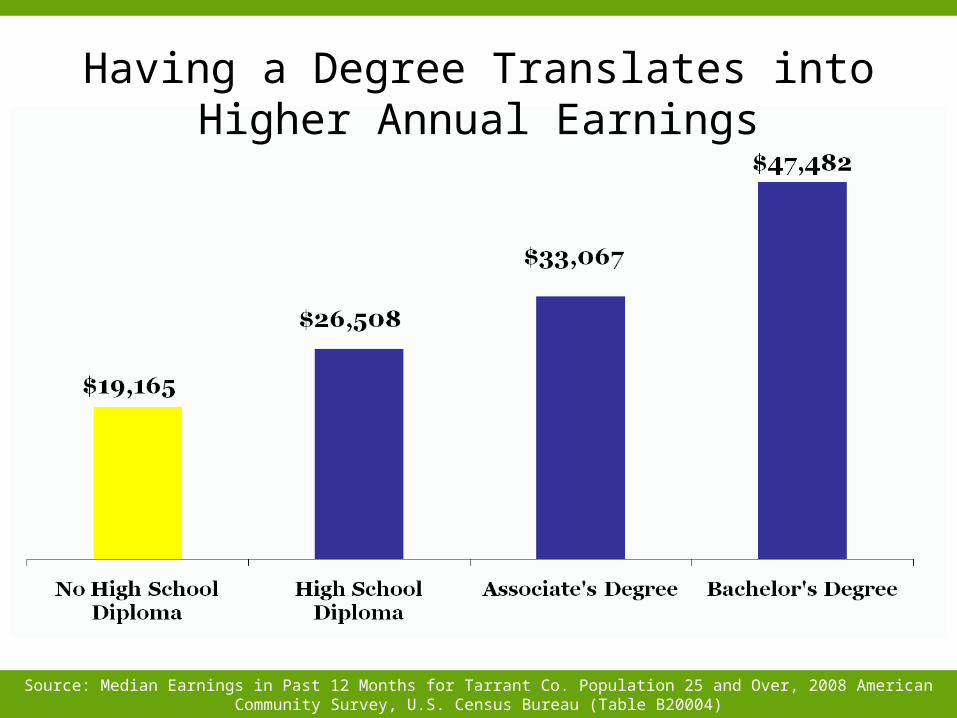
Source: Median Earnings in Past 12 Months for Tarrant Co. Population 25 and Over, 2008 American Community Survey, U.S. Census Bureau (Table B20004)
Having a Degree Translates into Higher Annual Earnings
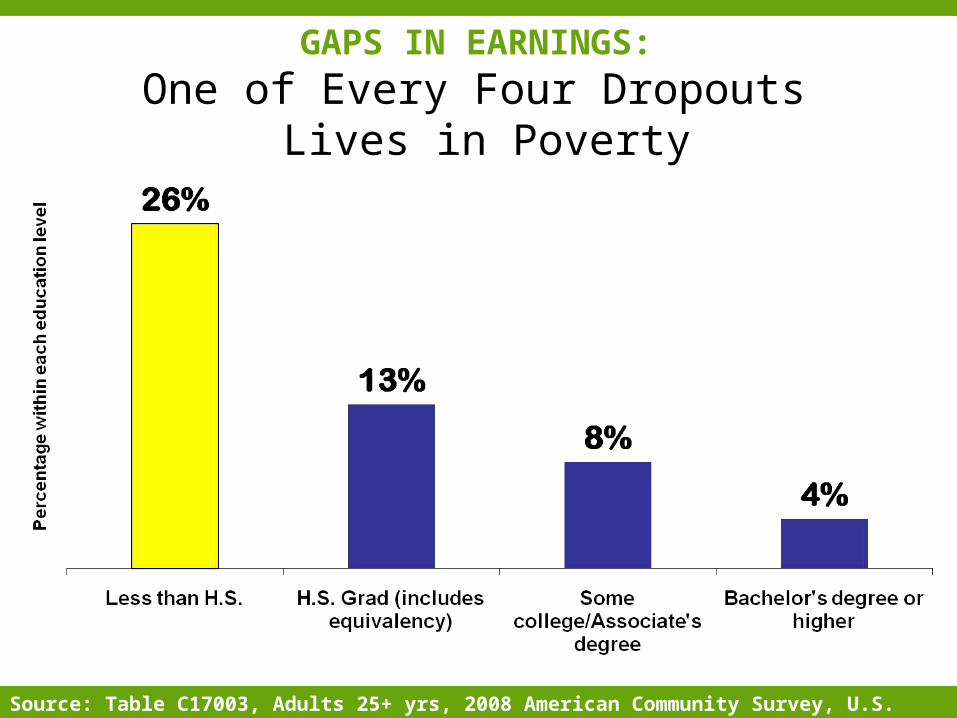
GAPS IN EARNINGS:
One of Every Four Dropouts Lives in Poverty
Source: Table C17003, Adults 25+ yrs, 2008 American Community Survey, U.S. Census Bureau
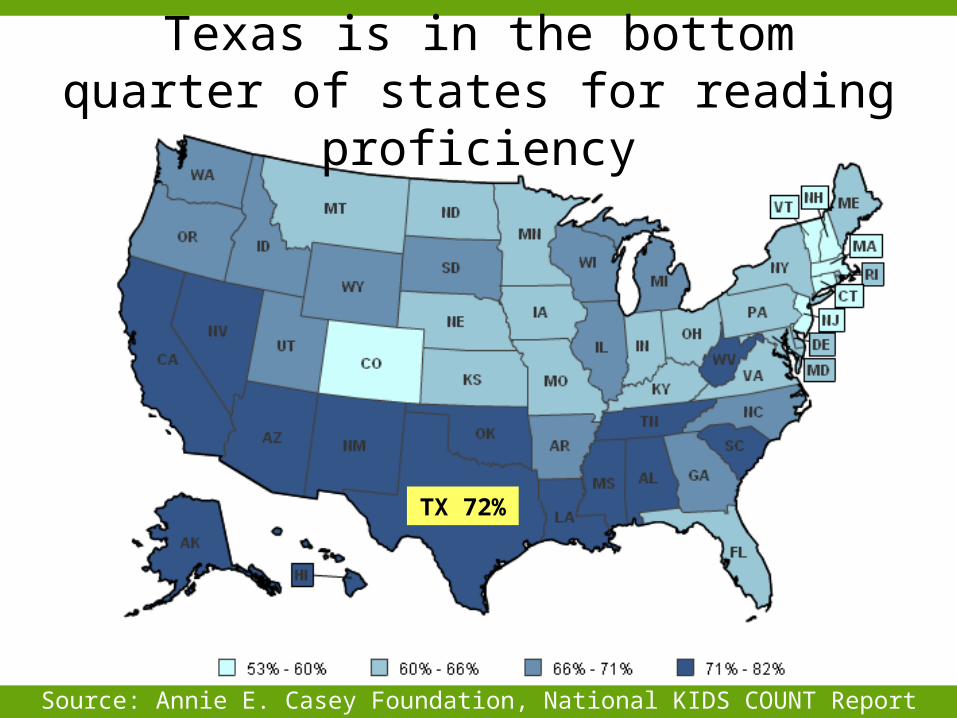
Source: Annie E. Casey Foundation, National KIDS COUNT Report
Texas is in the bottom quarter of states for reading proficiency
TX 72%
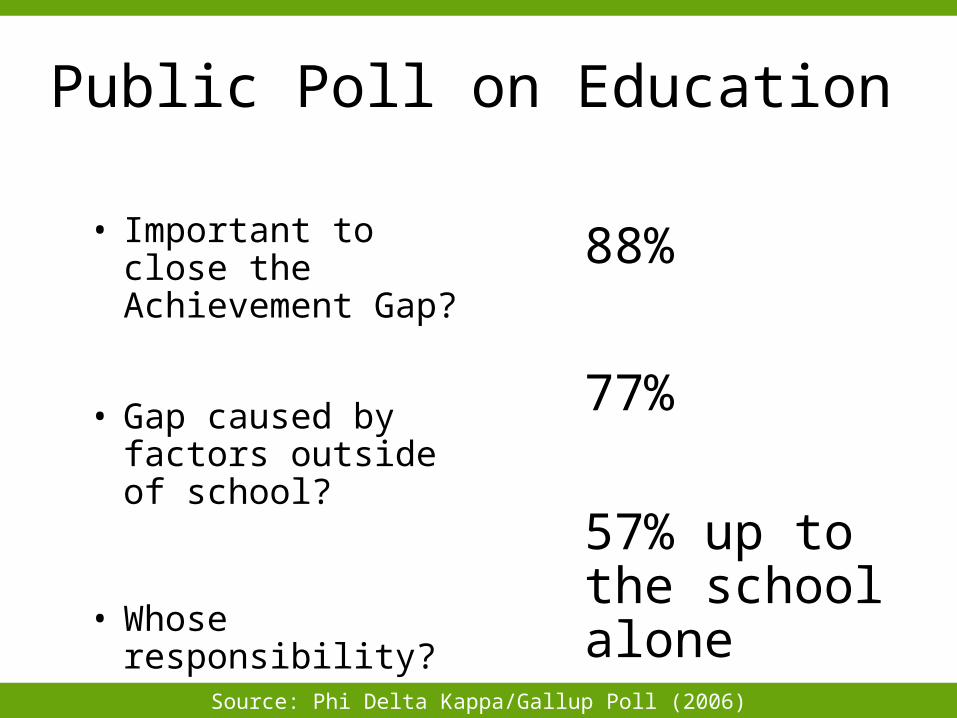
• Important to close the Achievement Gap?
• Gap caused by factors outside of school?
• Whose responsibility?
88%
77%
57% up to the school alone
Public Poll on Education
Source: Phi Delta Kappa/Gallup Poll (2006)

Early Care & EducationEarly Care & Education
“Early disadvantage, if leftuntouched, leads to academic and social difficulties later in life. Early
advantages accumulate, just as early disadvantages do.”
Heckman & Masterov, as cited in “Early Childhood Education for All: A Wise Investment”
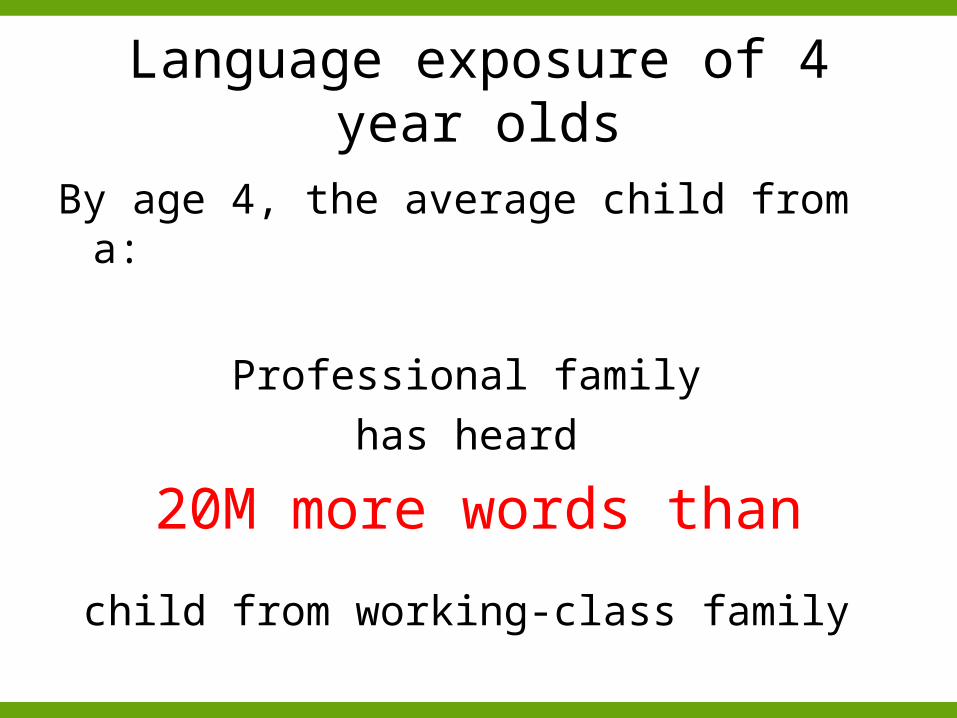
Language exposure of 4 year olds
By age 4, the average child from a:
Professional family
has heard
20M more words than
child from working-class family
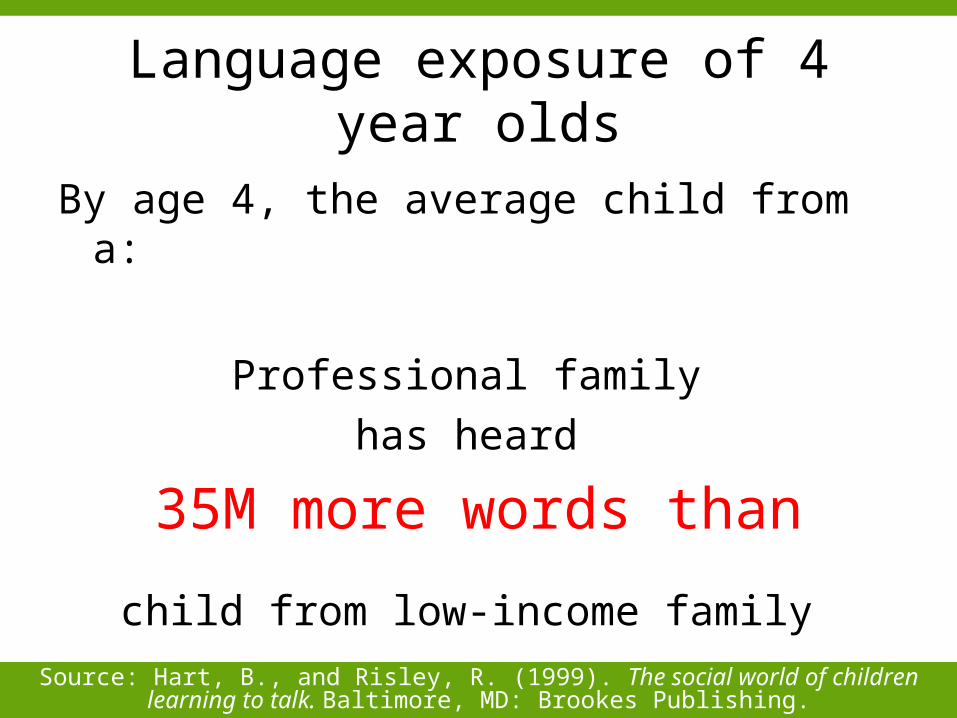
Language exposure of 4 year olds
By age 4, the average child from a:
Professional family
has heard
35M more words than
child from low-income family
Source: Hart, B., and Risley, R. (1999). The social world of children learning to talk. Baltimore, MD: Brookes Publishing.
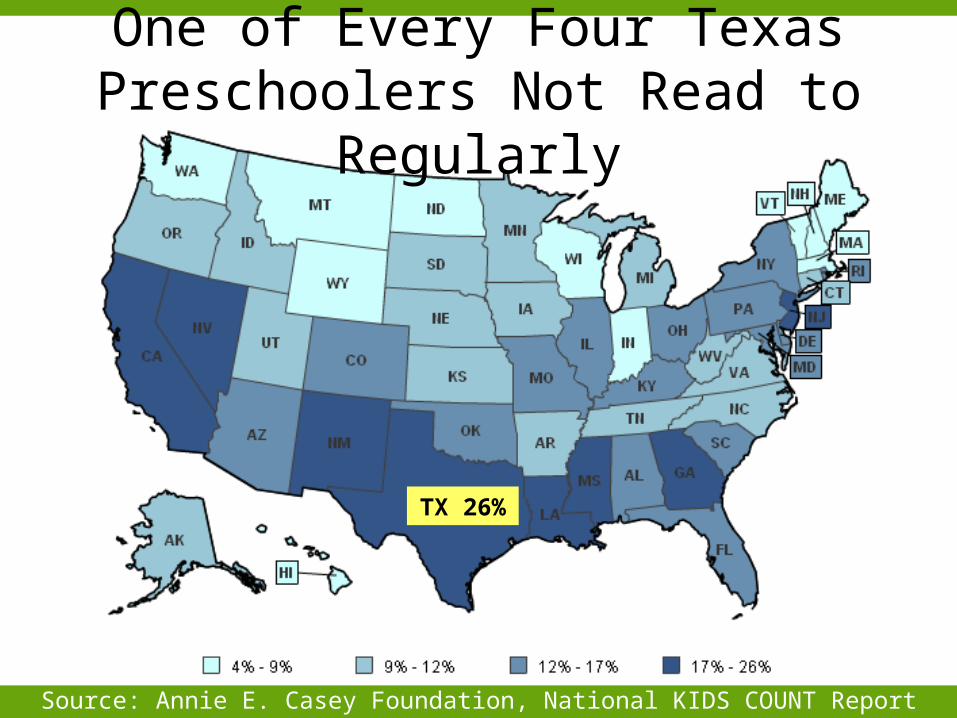
One of Every Four Texas Preschoolers Not Read to Regularly
Source: Annie E. Casey Foundation, National KIDS COUNT Report
TX 26%
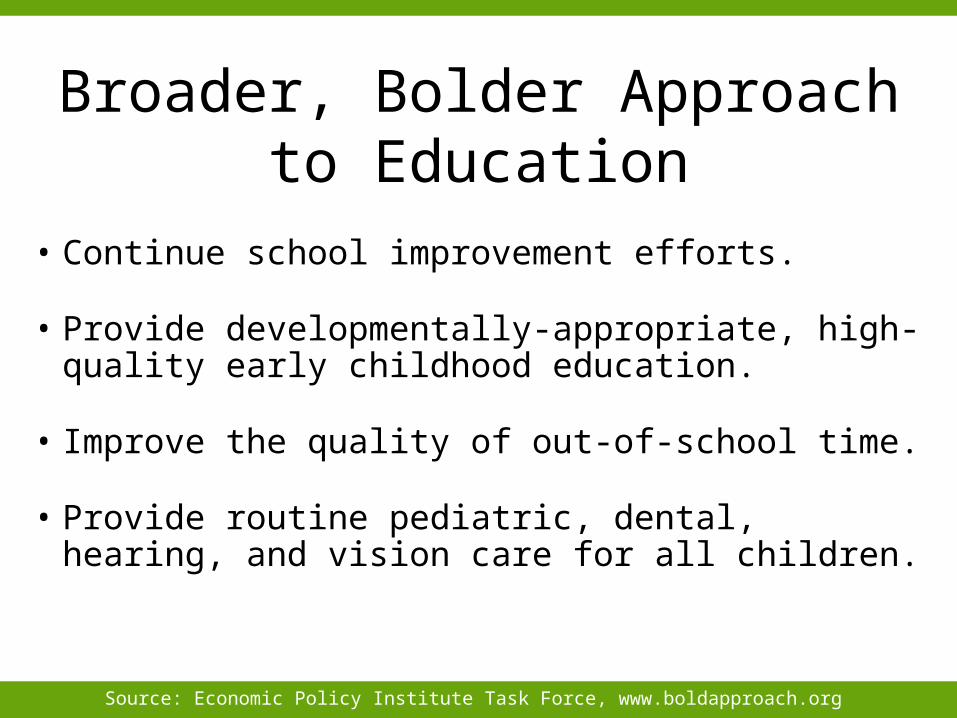
Broader, Bolder Approach to Education
• Continue school improvement efforts.
• Provide developmentally-appropriate, high-quality early childhood education.
• Improve the quality of out-of-school time.
• Provide routine pediatric, dental, hearing, and vision care for all children.
Source: Economic Policy Institute Task Force, www.boldapproach.org
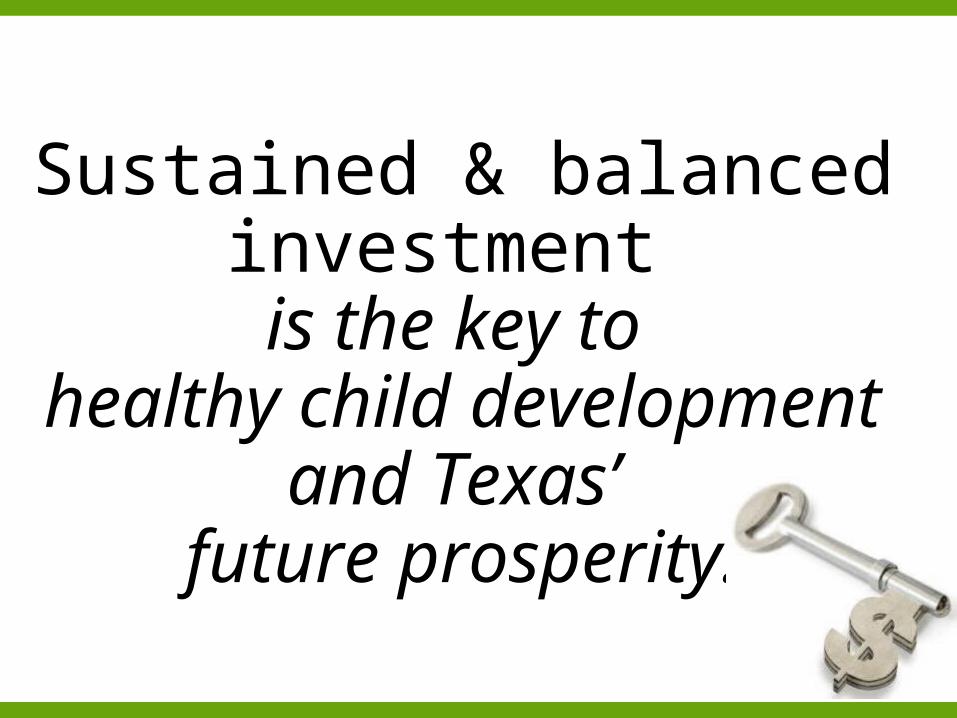
Sustained & balanced investment is the key to
healthy child development and Texas’
future prosperity.

INSTEAD…Texas Leadership
calling for 10% cuts for 2012-13 state
budget!
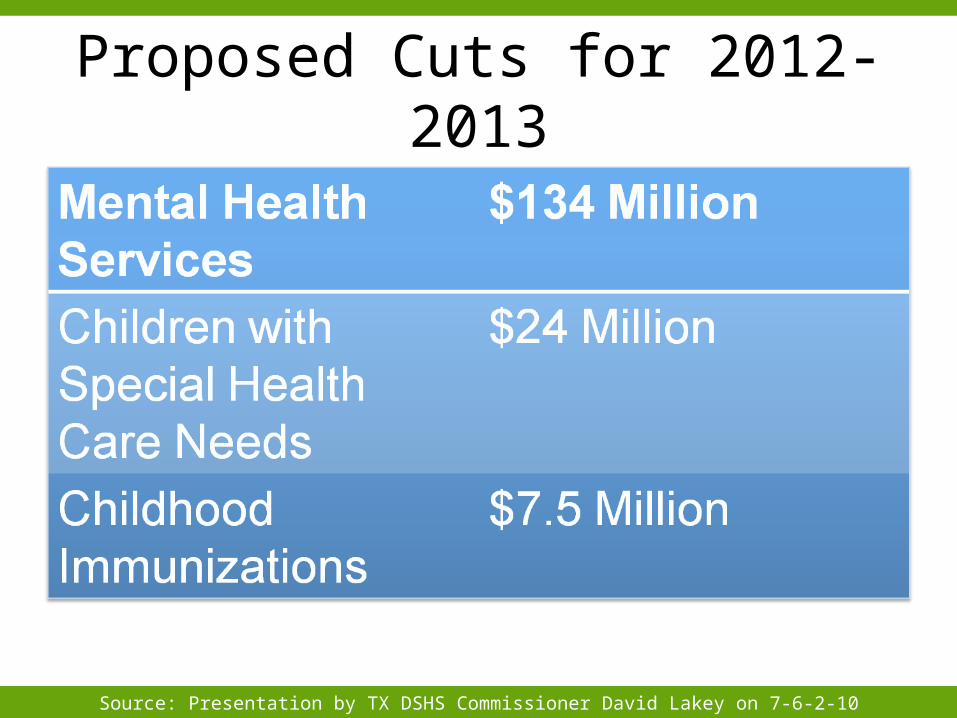
Proposed Cuts for 2012-2013
Source: Presentation by TX DSHS Commissioner David Lakey on 7-6-2-10

“Is it good for kids?”
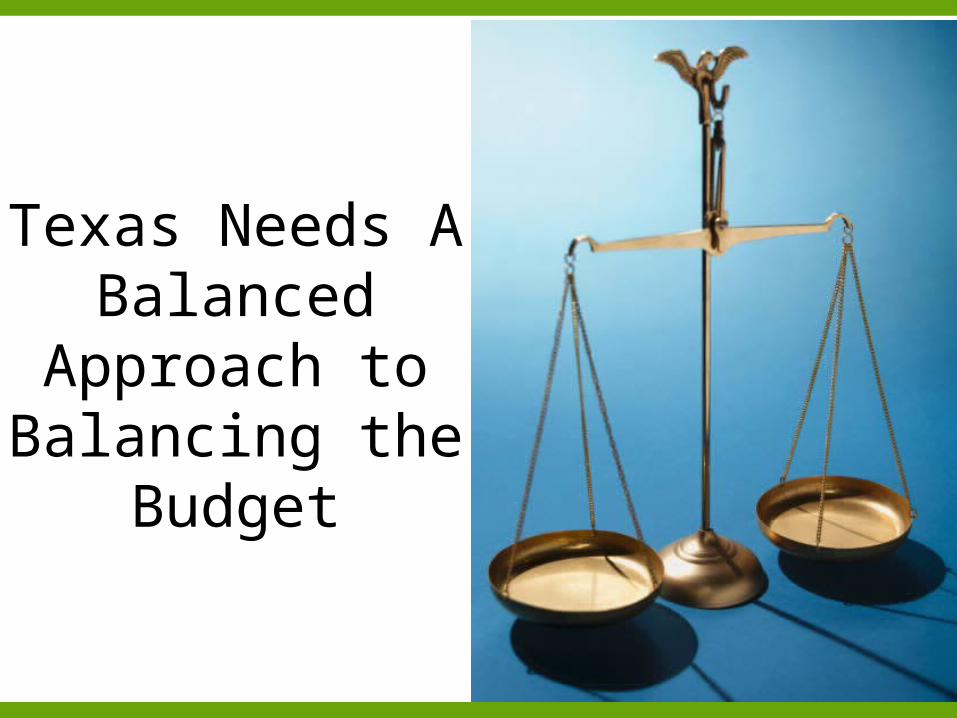
Texas Needs A Balanced
Approach to Balancing the
Budget
New 3 R’s
Reserves
Relief
Revenue
How Texas Can Close
the Revenue Gap in 2011?
•Use the Rainy Day Fund
•Utilize All Federal Funds Available to Us
How Texas Can Close
the Revenue Gap in 2011?
•Use the Rainy Day Fund
•Utilize All Federal Funds Available to Us
•Find New Sources of Revenue

Let’s make sure Texas’ story is NOT about shortchanging our kids.

Contact InformationContact Information
Frances Deviney, PhD
Texas KIDS COUNT Director
(512) 320-0222 ext. 106

Use of This PresentationThe Center for Public Policy Priorities encourages you to reproduce and distribute these slides,
which were developed for use in making public presentations.
If you reproduce these slides, please give appropriate credit to CPPP.
The data presented here may become outdated.
For the most recent information or to sign up for our free E-Mail Updates, visit www.cppp.org.
© CPPP
Center for Public Policy Priorities900 Lydia StreetAustin, TX 78702
Phone 512-320-0222 Fax 512-320-0227