Embed Size (px)
DESCRIPTION
Texas Wind Energy. American Meteorological Society Summer Community Meeting – Norman Oklahoma Henry Durrwachter, P.E. August 12, 2009. Installed Wind Capacity. Electric Reliability Council of Texas (ERCOT). The only intra-state electric grid in the U.S. - PowerPoint PPT Presentation
Citation preview

Texas Wind Energy
American Meteorological SocietySummer Community Meeting – Norman Oklahoma
Henry Durrwachter, P.E.August 12, 2009
2
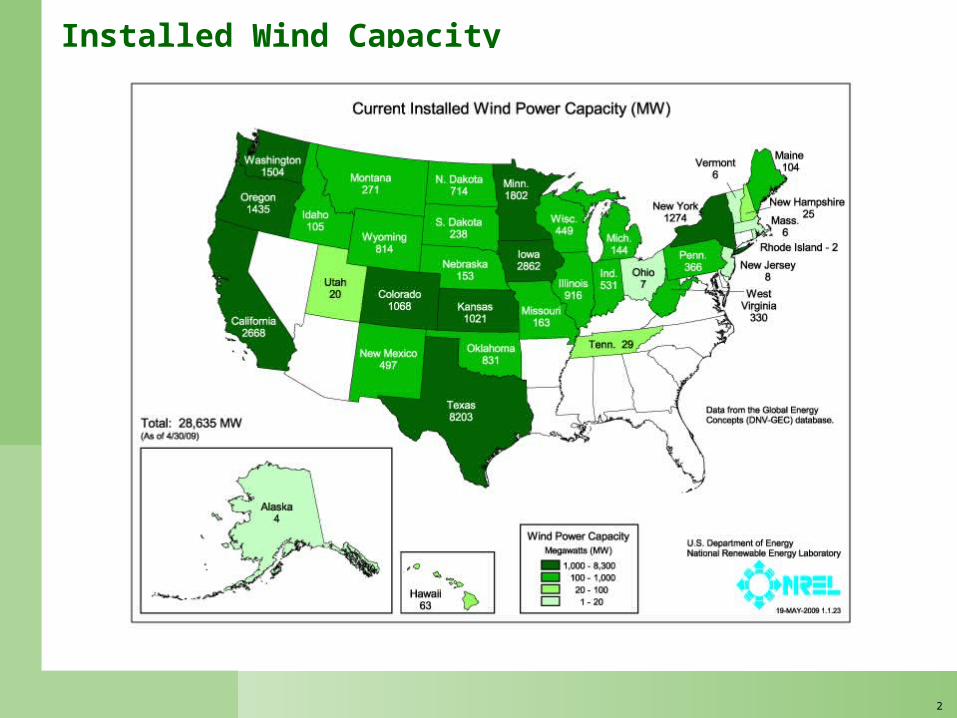
Installed Wind Capacity
3
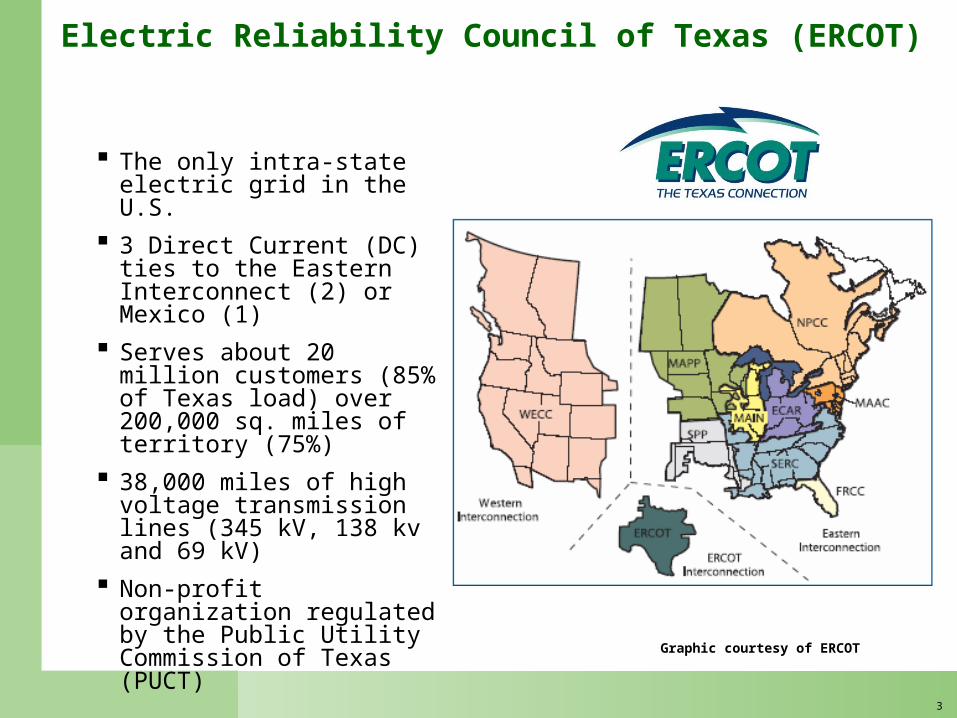
The only intra-state electric grid in the U.S.
3 Direct Current (DC) ties to the Eastern Interconnect (2) or Mexico (1)
Serves about 20 million customers (85% of Texas load) over 200,000 sq. miles of territory (75%)
38,000 miles of high voltage transmission lines (345 kV, 138 kv and 69 kV)
Non-profit organization regulated by the Public Utility Commission of Texas (PUCT)
Graphic courtesy of ERCOT
Electric Reliability Council of Texas (ERCOT)
4
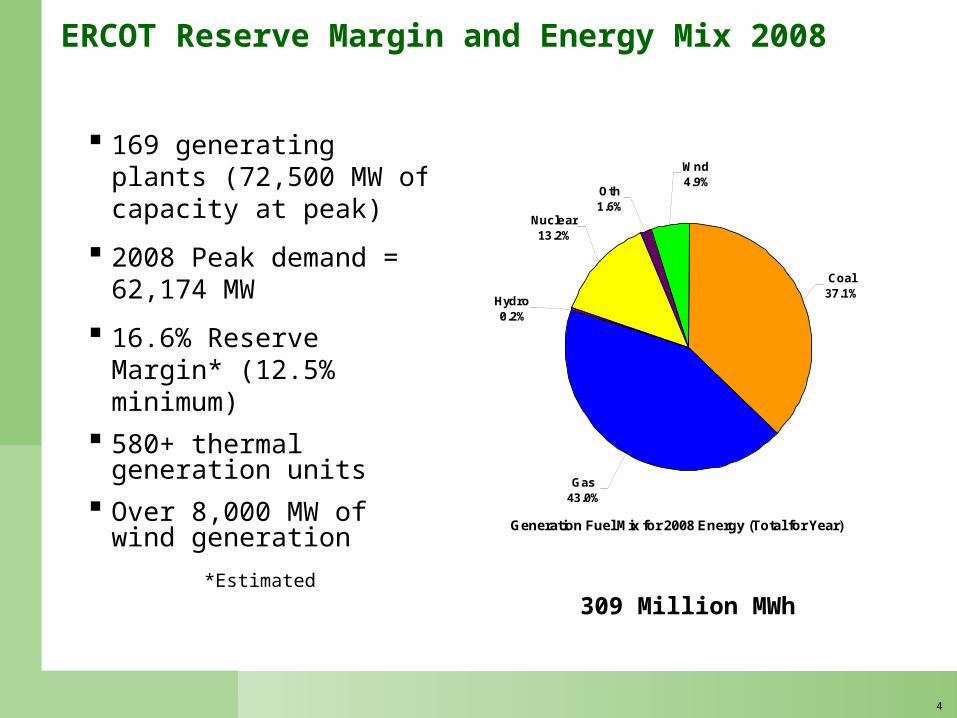
ERCOT Reserve Margin and Energy Mix 2008
169 generating plants (72,500 MW of capacity at peak)
2008 Peak demand = 62,174 MW
16.6% Reserve Margin* (12.5% minimum)
580+ thermal generation units
Over 8,000 MW of wind generation
*Estimated
309 Million MWh
Generation Fuel Mix for 2008 Energy (Total for Year)
Oth1.6%
Wnd4.9%
Nuclear13.2%
Hydro0.2%
Gas43.0%
Coal37.1%
5
33
31
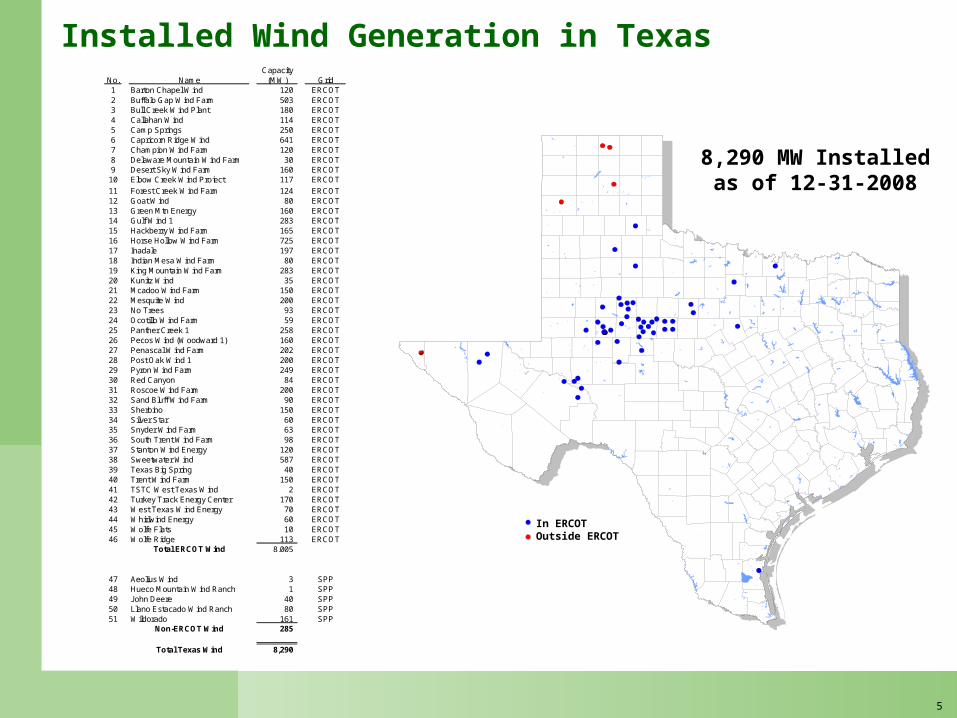
8,290 MW Installed as of 12-31-2008
In ERCOTOutside ERCOT
Installed Wind Generation in TexasCapacity
No. Name (MW) Grid1 Barton Chapel Wind 120 ERCOT2 Buffalo Gap Wind Farm 503 ERCOT3 Bull Creek Wind Plant 180 ERCOT4 Callahan Wind 114 ERCOT5 Camp Springs 250 ERCOT6 Capricorn Ridge Wind 641 ERCOT7 Champion Wind Farm 120 ERCOT8 Delaware Mountain Wind Farm 30 ERCOT9 Desert Sky Wind Farm 160 ERCOT
10 Elbow Creek Wind Project 117 ERCOT
11 Forest Creek Wind Farm 124 ERCOT12 Goat Wind 80 ERCOT13 Green Mtn Energy 160 ERCOT14 Gulf Wind 1 283 ERCOT15 Hackberry Wind Farm 165 ERCOT16 Horse Hollow Wind Farm 725 ERCOT17 Inadale 197 ERCOT18 Indian Mesa Wind Farm 80 ERCOT19 King Mountain Wind Farm 283 ERCOT20 Kunitz Wind 35 ERCOT21 Mcadoo Wind Farm 150 ERCOT22 Mesquite Wind 200 ERCOT23 No Trees 93 ERCOT24 Ocotillo Wind Farm 59 ERCOT25 Panther Creek 1 258 ERCOT26 Pecos Wind (Woodward 1) 160 ERCOT27 Penascal Wind Farm 202 ERCOT28 Post Oak Wind 1 200 ERCOT29 Pyron Wind Farm 249 ERCOT30 Red Canyon 84 ERCOT31 Roscoe Wind Farm 200 ERCOT32 Sand Bluff Wind Farm 90 ERCOT33 Sherbino 150 ERCOT34 Silver Star 60 ERCOT35 Snyder Wind Farm 63 ERCOT36 South Trent Wind Farm 98 ERCOT37 Stanton Wind Energy 120 ERCOT38 Sweetwater Wind 587 ERCOT39 Texas Big Spring 40 ERCOT40 Trent Wind Farm 150 ERCOT41 TSTC West Texas Wind 2 ERCOT42 Turkey Track Energy Center 170 ERCOT43 West Texas Wind Energy 70 ERCOT44 Whirlwind Energy 60 ERCOT45 Wolfe Flats 10 ERCOT46 Wolfe Ridge 113 ERCOT
Total ERCOT Wind 8,005
47 Aeolius Wind 3 SPP48 Hueco Mountain Wind Ranch 1 SPP49 John Deere 40 SPP50 Llano Estacado Wind Ranch 80 SPP51 Wildorado 161 SPP
Non-ERCOT Wind 285
Total Texas Wind 8,290
6
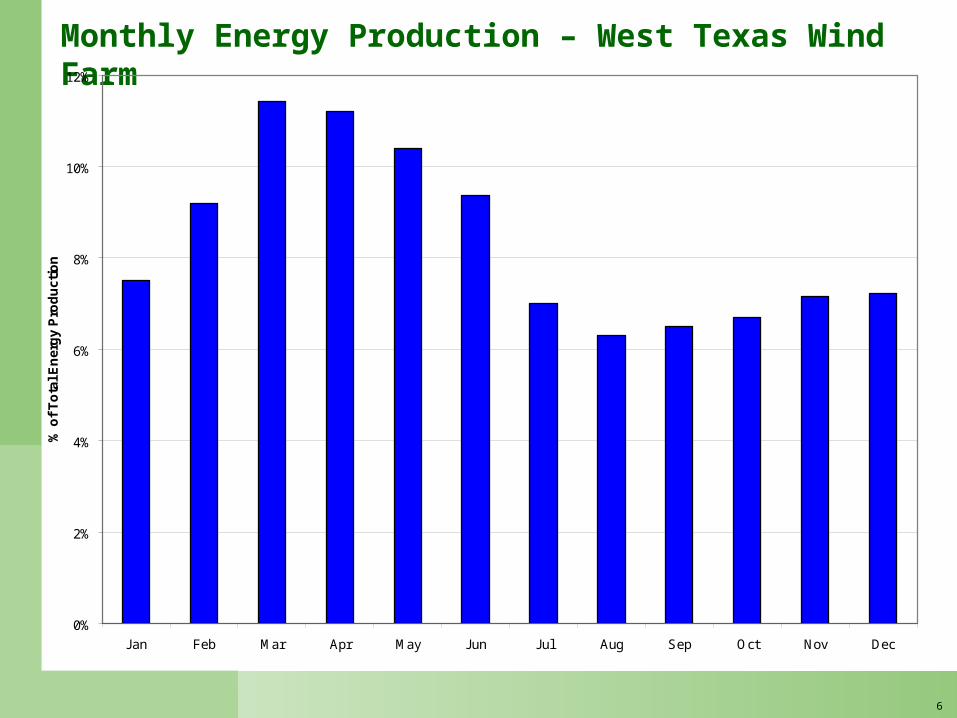
Monthly Energy Production – West Texas Wind Farm
0%
2%
4%
6%
8%
10%
12%
Jan Feb Mar Apr May Jun Jul Aug Sep Oct Nov Dec
% o
f T
ota
l En
erg
y P
rod
uct
ion
7
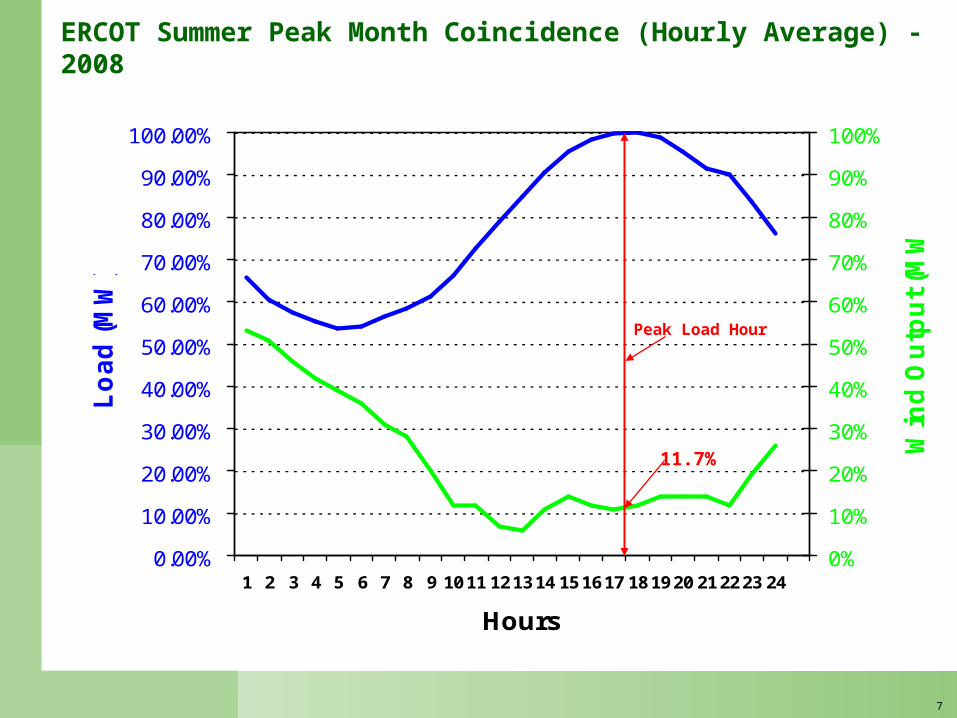
ERCOT Summer Peak Month Coincidence (Hourly Average) - 2008
0.00%
10.00%
20.00%
30.00%
40.00%
50.00%
60.00%
70.00%
80.00%
90.00%
100.00%
1 2 3 4 5 6 7 8 9 10 11 12 13 14 15 16 17 18 19 20 21 22 23 24
Hours
Lo
ad
(M
W)
0%
10%
20%
30%
40%
50%
60%
70%
80%
90%
100%
Win
d O
utp
ut
(MW
)
11.7%
Peak Load Hour
8
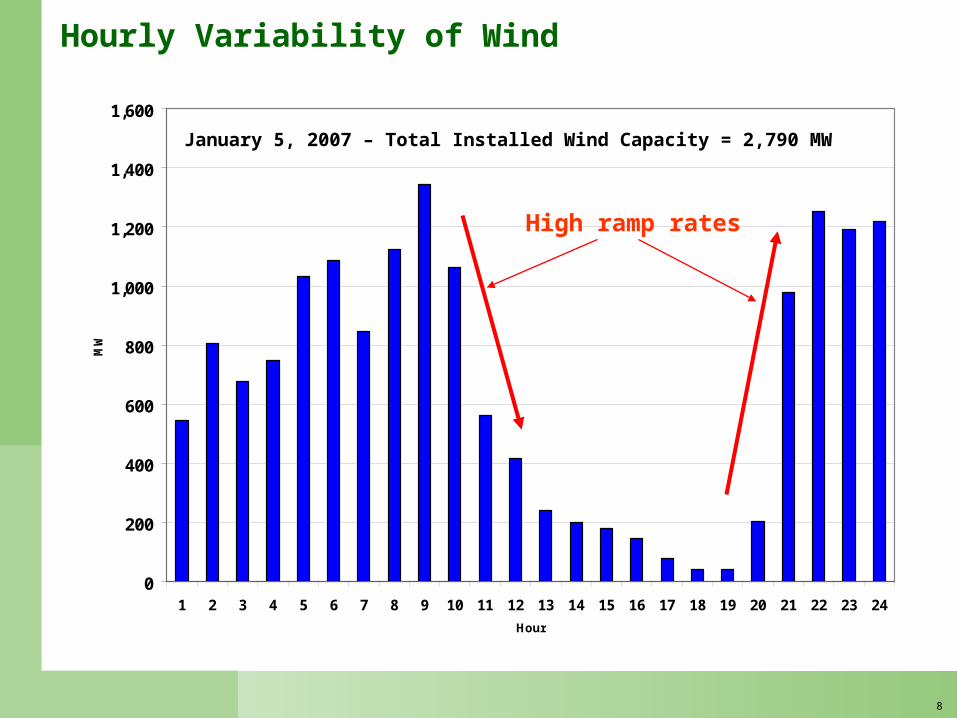
0
200
400
600
800
1,000
1,200
1,400
1,600
1 2 3 4 5 6 7 8 9 10 11 12 13 14 15 16 17 18 19 20 21 22 23 24
Hour
MW
High ramp rates
January 5, 2007 – Total Installed Wind Capacity = 2,790 MW
Hourly Variability of Wind
9
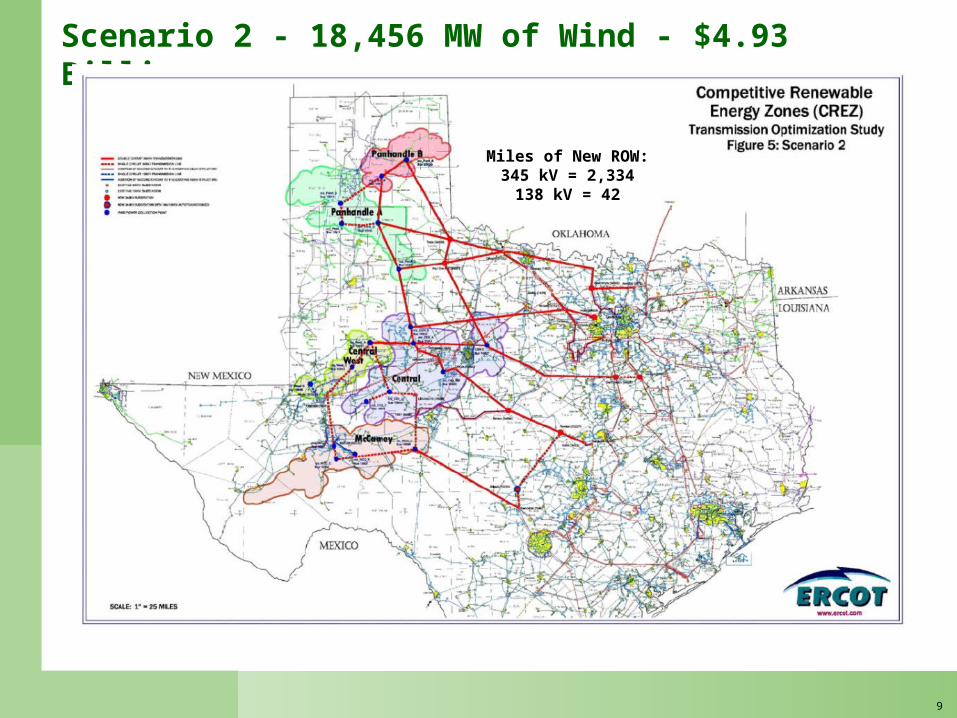
Scenario 2 - 18,456 MW of Wind - $4.93 Billion
Miles of New ROW:345 kV = 2,334
138 kV = 42
10
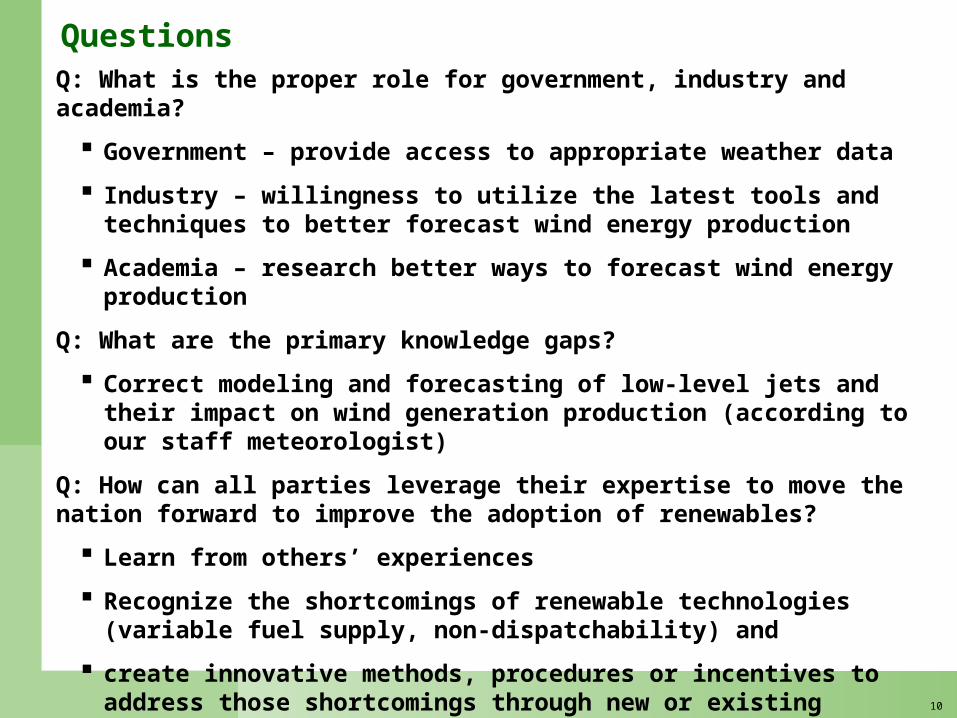
QuestionsQ: What is the proper role for government, industry and academia?
Government – provide access to appropriate weather data
Industry – willingness to utilize the latest tools and techniques to better forecast wind energy production
Academia – research better ways to forecast wind energy production
Q: What are the primary knowledge gaps?
Correct modeling and forecasting of low-level jets and their impact on wind generation production (according to our staff meteorologist)
Q: How can all parties leverage their expertise to move the nation forward to improve the adoption of renewables?
Learn from others’ experiences
Recognize the shortcomings of renewable technologies (variable fuel supply, non-dispatchability) and
create innovative methods, procedures or incentives to address those shortcomings through new or existing generating technologies or control systems.