Embed Size (px)
Citation preview
Textiles – An Overview
September 2012
Textile – Some Facts
Importance of Textile in Pakistan
World Textile –Demand &
Supply Dynamics
Performance Competitiveness Outlook on the Sector
p
Snapshotp1. Profile
T il S fTextile – Some factsImportance of Textile in Pakistan
2. RisksWorld Textile – Demand and Supply DynamicsPerformanceCompetitiveness
Textile – Some Facts
Importance of Textile in Pakistan
World Textile –Demand &
Supply Dynamics
Performance Competitiveness Outlook on the Sector
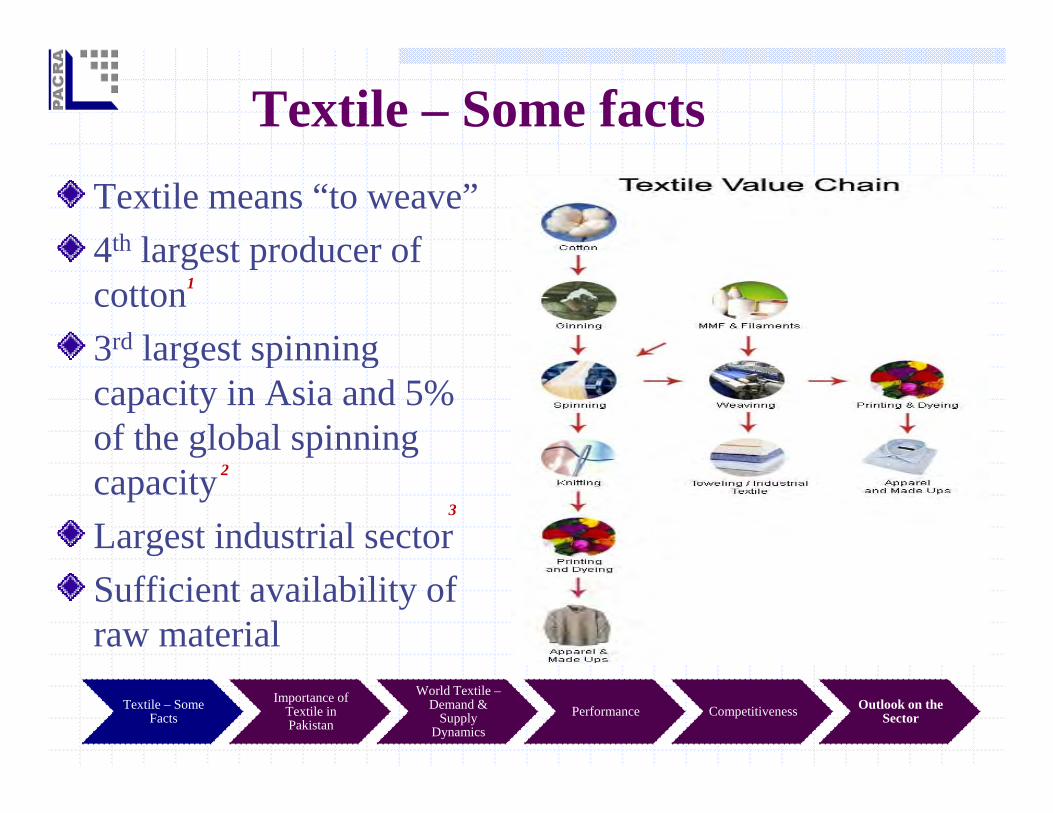
Textile – Some factsTextile means “to weave”4th largest producer of4 largest producer of cotton 3rd largest spinning
1
3 largest spinning capacity in Asia and 5% of the global spinning capacity Largest industrial sector
2
3
Sufficient availability of raw material
Textile – Some Facts
Importance of Textile in Pakistan
World Textile –Demand &
Supply Dynamics
Performance Competitiveness Outlook on the Sector
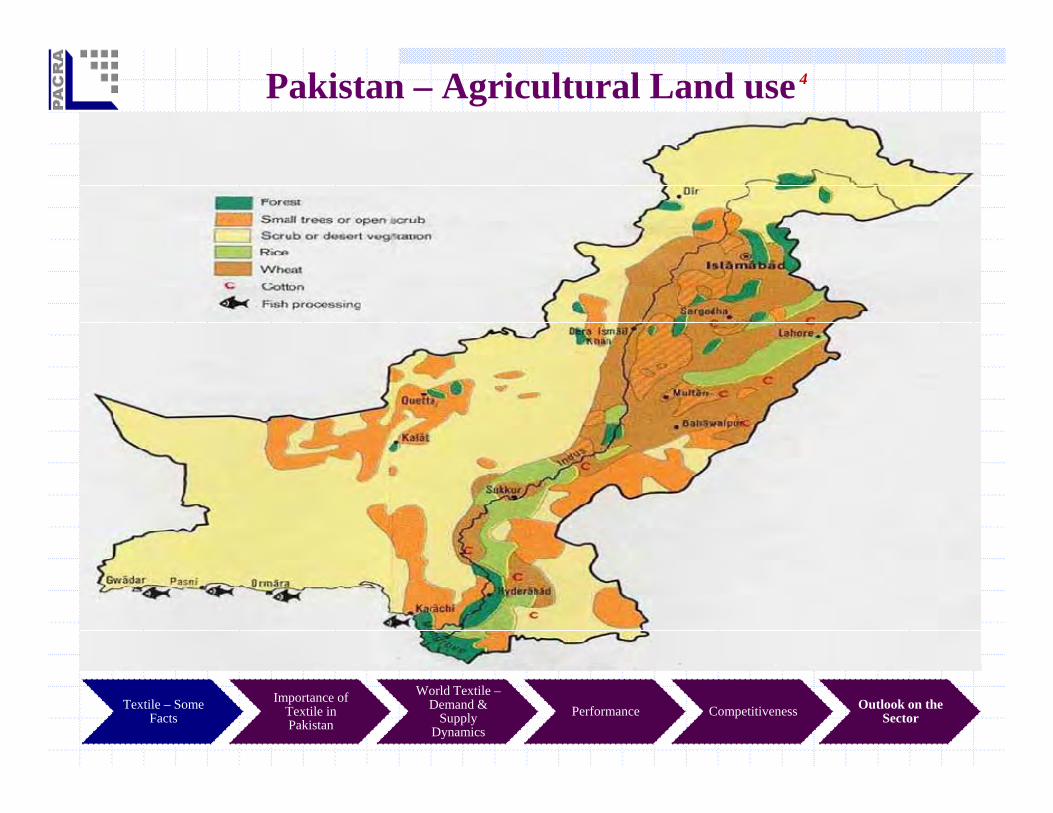
Pakistan – Agricultural Land use 4
Textile – Some Facts
Importance of Textile in Pakistan
World Textile –Demand &
Supply Dynamics
Performance Competitiveness Outlook on the Sector
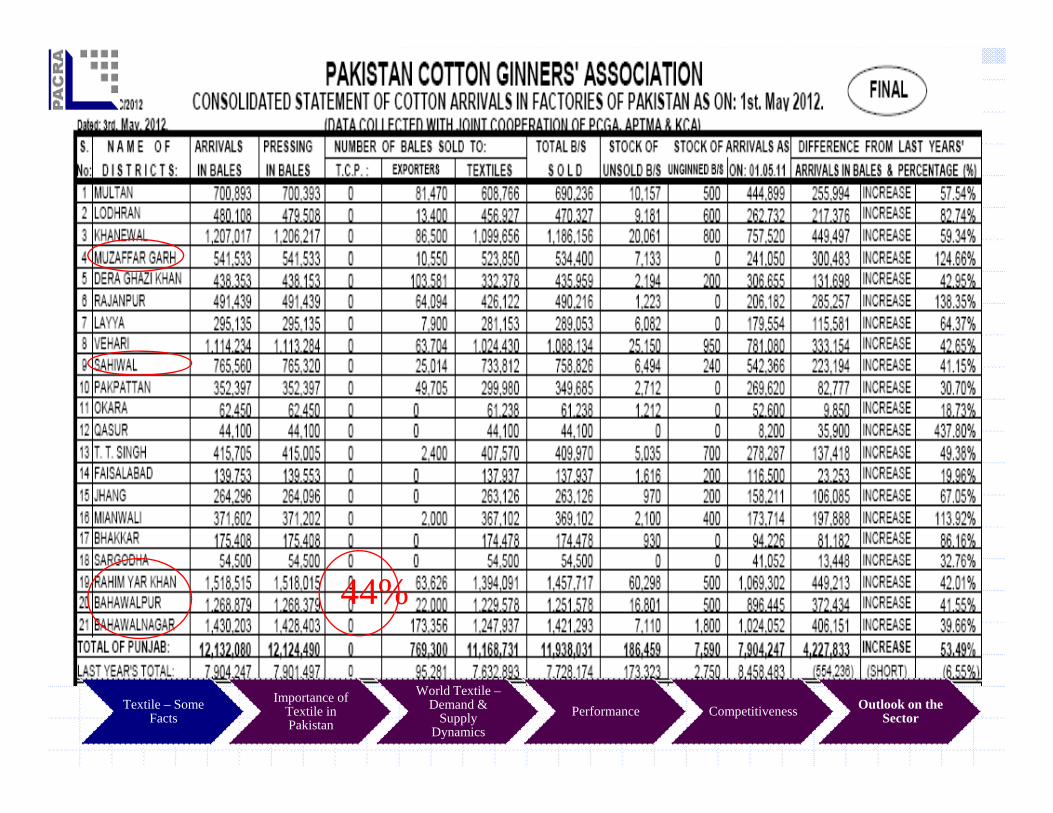
44%
Textile – Some Facts
Importance of Textile in Pakistan
World Textile –Demand &
Supply Dynamics
Performance Competitiveness Outlook on the Sector
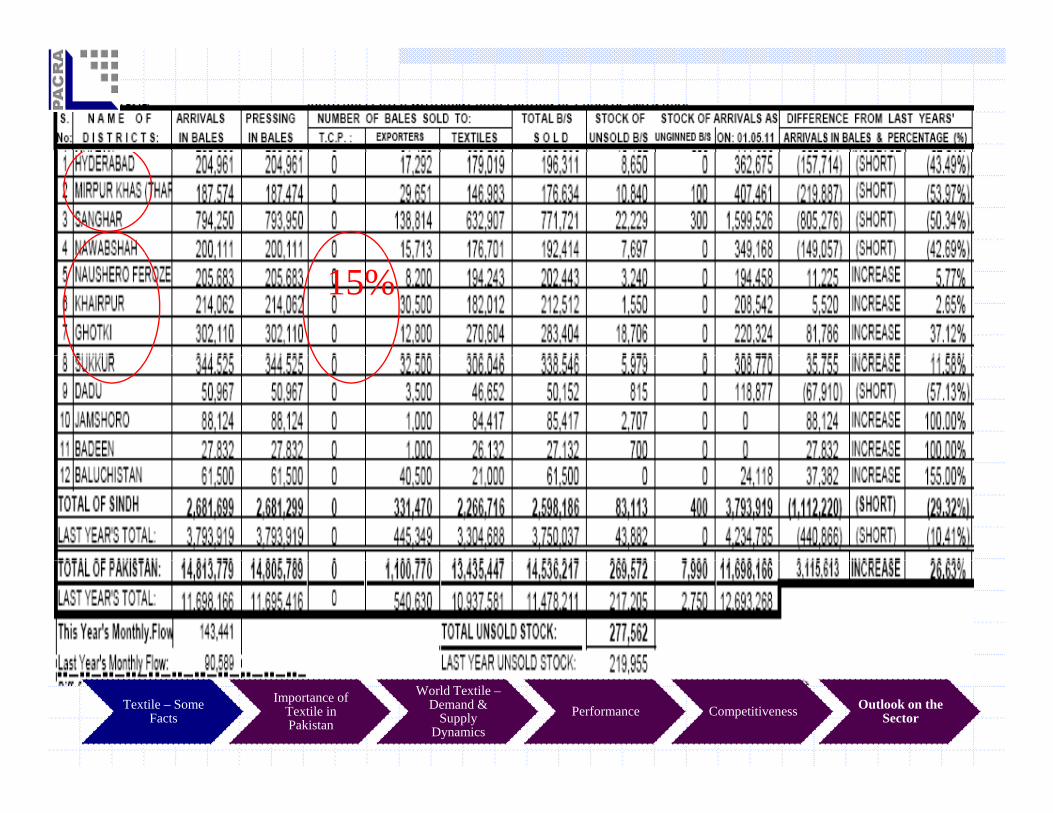
15%
Textile – Some Facts
Importance of Textile in Pakistan
World Textile –Demand &
Supply Dynamics
Performance Competitiveness Outlook on the Sector
Textile – Some Facts
Importance of Textile in Pakistan
World Textile –Demand &
Supply Dynamics
Performance Competitiveness Outlook on the Sector
Textile – Some Facts
Importance of Textile in Pakistan
World Textile –Demand &
Supply Dynamics
Performance Competitiveness Outlook on the Sector
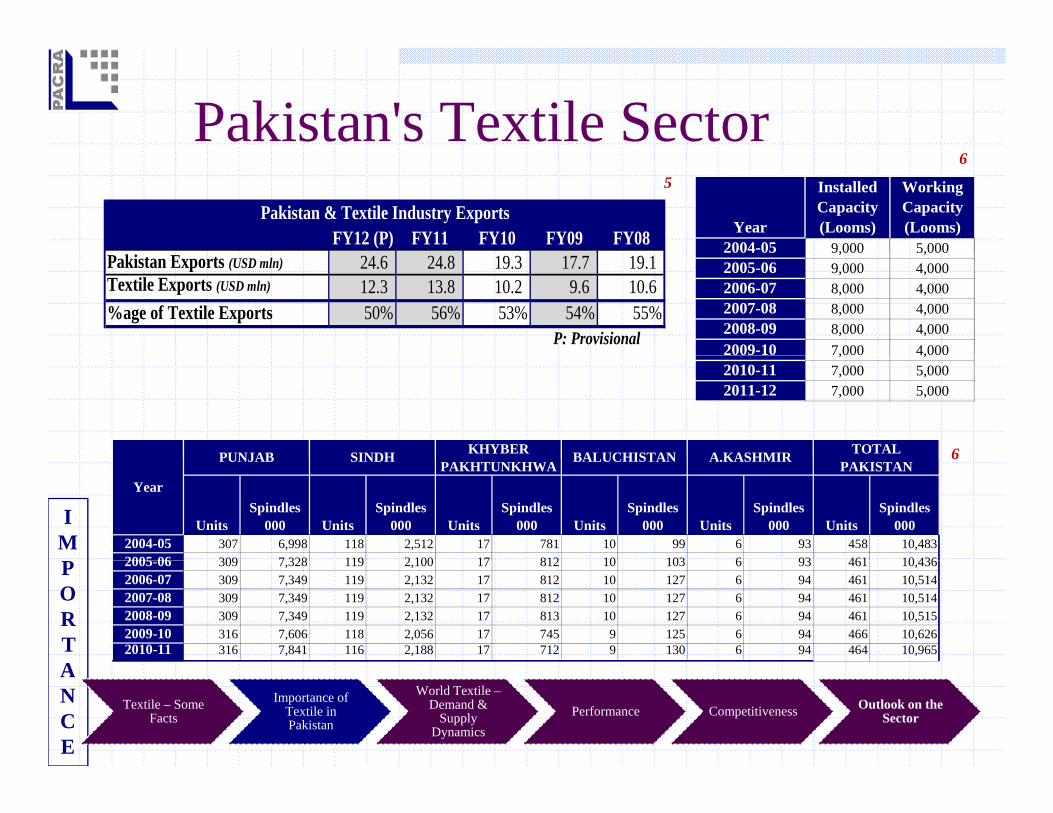
Pakistan's Textile Sector Year
Installed Capacity (Looms)
Working Capacity (Looms)
2004-05 9,000 5,000FY12 (P) FY11 FY10 FY09 FY08Pakistan & Textile Industry Exports
56
9,000 5,0002005-06 9,000 4,0002006-07 8,000 4,0002007-08 8,000 4,0002008-09 8,000 4,0002009-10 7,000 4,000
Pakistan Exports (USD mln) 24.6 24.8 19.3 17.7 19.1 Textile Exports (USD mln) 12.3 13.8 10.2 9.6 10.6 %age of Textile Exports 50% 56% 53% 54% 55%
P: Provisional, ,
2010-11 7,000 5,0002011-12 7,000 5,000
6PUNJAB KHYBER TOTAL SINDH BALUCHISTAN A KASHMIR
IM
6
Units Spindles
000 Units Spindles
000 Units Spindles
000 Units Spindles
000 Units Spindles
000 Units Spindles
000 2004-05 307 6,998 118 2,512 17 781 10 99 6 93 458 10,4832005 06 309 7 328 119 2 100 17 812 10 103 6 93 461 10 436
PUNJABPAKHTUNKHWA PAKISTAN
Year
SINDH BALUCHISTAN A.KASHMIR
PORTA
2005-06 309 7,328 119 2,100 17 812 10 103 6 93 461 10,4362006-07 309 7,349 119 2,132 17 812 10 127 6 94 461 10,5142007-08 309 7,349 119 2,132 17 812 10 127 6 94 461 10,5142008-09 309 7,349 119 2,132 17 813 10 127 6 94 461 10,5152009-10 316 7,606 118 2,056 17 745 9 125 6 94 466 10,6262010-11 316 7,841 116 2,188 17 712 9 130 6 94 464 10,965
ANCE
Textile – Some Facts
Importance of Textile in Pakistan
World Textile –Demand &
Supply Dynamics
Performance Competitiveness Outlook on the Sector
Pakistan’s Textile Sector CompositionPakistan’s textile industry consists of large scale organized sector and highly fragmented cottage/medium and small units Organized sector : Large number of spinning units (464) d ll b f i i (60)(464) and a small number of weaving units (60) The rest of the downstream industry chain – finishing,
d t t l d h i h i t
7
madeups, garments, towel and hosiery – having a great export potential, is largely segmented in un-organized sectorsector.
Textile – Some Facts
Importance of Textile in Pakistan
World Textile –Demand &
Supply Dynamics
Performance Competitiveness Outlook on the Sector
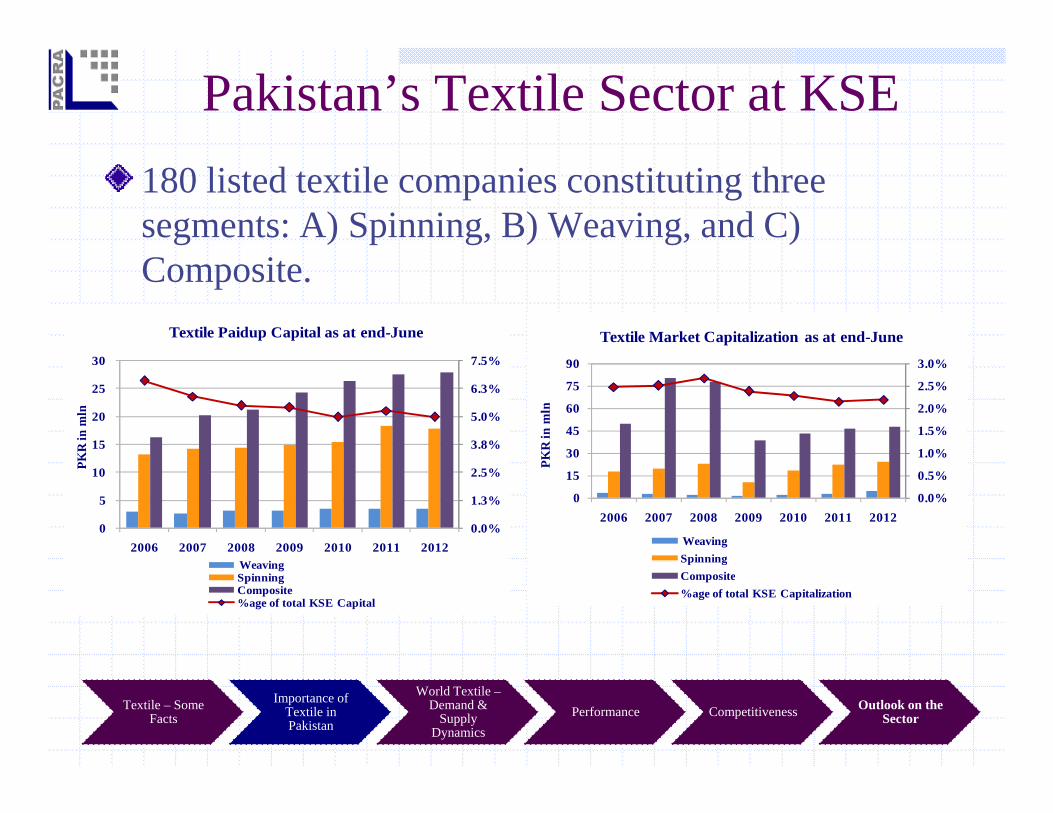
Pakistan’s Textile Sector at KSE180 listed textile companies constituting three segments: A) Spinning, B) Weaving, and C) Composite.
Textile Paidup Capital as at end-June Textile Market Capitalization as at end-June
3.8%
5.0%
6.3%
7.5%
15
20
25
30
KR
in m
ln
1.0%
1.5%
2.0%
2.5%
3.0%
30
45
60
75
90
KR
in m
ln0.0%
1.3%
2.5%
0
5
10
2006 2007 2008 2009 2010 2011 2012
PK
0.0%
0.5%
0
15
2006 2007 2008 2009 2010 2011 2012
PKWeavingSpinningWeaving
SpinningComposite%age of total KSE Capital
SpinningComposite%age of total KSE Capitalization
Textile – Some Facts
Importance of Textile in Pakistan
World Textile –Demand &
Supply Dynamics
Performance Competitiveness Outlook on the Sector
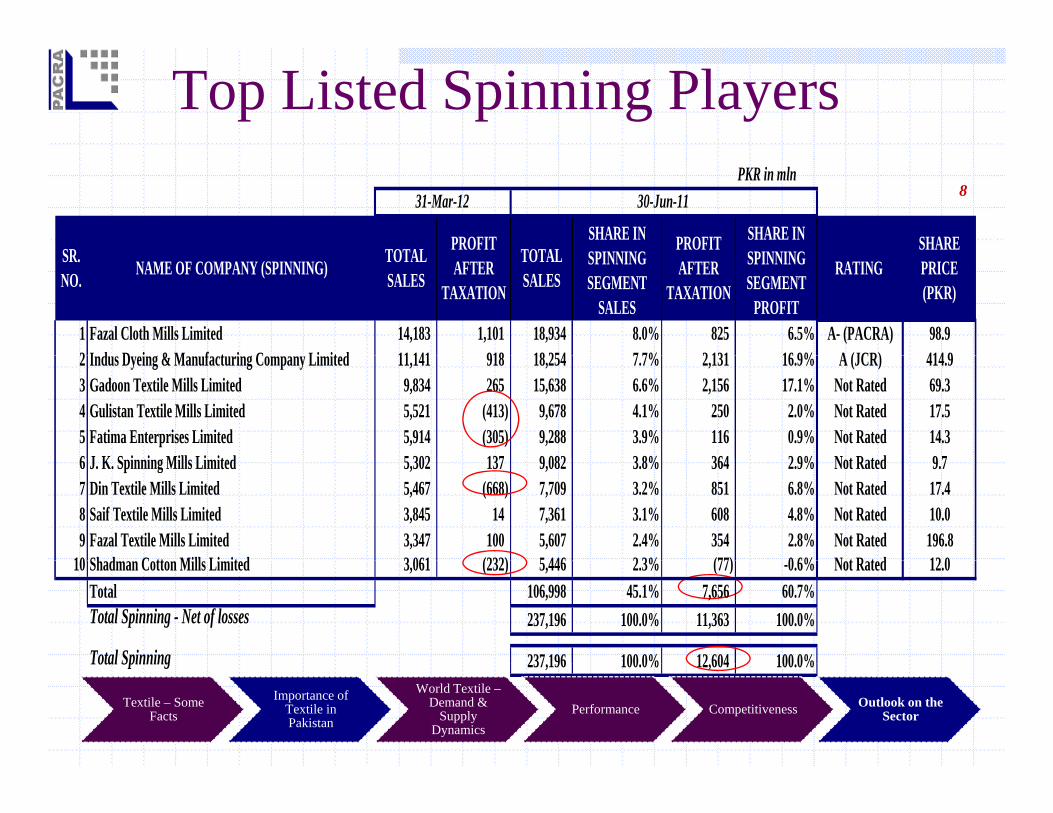
Top Listed Spinning Players PKR in mln
31-Mar-12 30-Jun-11
TOTALSR PROFIT TOTAL SHARE SHARE IN SPINNING
SHARE IN SPINNING
PROFIT
8
1 Fazal Cloth Mills Limited 14,183 1,101 18,934 8.0% 825 6.5% A- (PACRA) 98.92 I d D i & M f t i C Li it d 11 141 918 18 254 7 7% 2 131 16 9% A (JCR) 414 9
TOTAL SALES
SR. NO. AFTER
TAXATION
TOTAL SALES RATING PRICE
(PKR)
SPINNING SEGMENT
SALES
SPINNING SEGMENT
PROFIT
NAME OF COMPANY (SPINNING) AFTER TAXATION
2 Indus Dyeing & Manufacturing Company Limited 11,141 918 18,254 7.7% 2,131 16.9% A (JCR) 414.93 Gadoon Textile Mills Limited 9,834 265 15,638 6.6% 2,156 17.1% Not Rated 69.34 Gulistan Textile Mills Limited 5,521 (413) 9,678 4.1% 250 2.0% Not Rated 17.55 Fatima Enterprises Limited 5,914 (305) 9,288 3.9% 116 0.9% Not Rated 14.36 J K S i i Mill Li it d 5 302 137 9 082 3 8% 364 2 9% N t R t d 9 76 J. K. Spinning Mills Limited 5,302 137 9,082 3.8% 364 2.9% Not Rated 9.77 Din Textile Mills Limited 5,467 (668) 7,709 3.2% 851 6.8% Not Rated 17.48 Saif Textile Mills Limited 3,845 14 7,361 3.1% 608 4.8% Not Rated 10.09 Fazal Textile Mills Limited 3,347 100 5,607 2.4% 354 2.8% Not Rated 196.8
10 Sh d C tt Mill Li it d 3 061 (232) 5 446 2 3% (77) 0 6% N t R t d 12 010 Shadman Cotton Mills Limited 3,061 (232) 5,446 2.3% (77) -0.6% Not Rated 12.0Total 106,998 45.1% 7,656 60.7%Total Spinning - Net of losses 237,196 100.0% 11,363 100.0%
Total Spinning 237 196 100 0% 12 604 100 0%Total Spinning 237,196 100.0% 12,604 100.0%Source: KSE
Textile – Some Facts
Importance of Textile in Pakistan
World Textile –Demand &
Supply Dynamics
Performance Competitiveness Outlook on the Sector

Top Listed Weaving Playersc PKR in mln 30-Jun-1131-Mar-12
SHARE INSHARE INPROFIT PROFIT8
C
1 Prosperity Weaving Mills Limited 4,024 7 5,952 22.3% 139 19.3% A- (PACRA) 10.4
TOTAL SALES
SHARE IN WEAVING SEGMENT
RATING SHARE PRICE
SHARE IN WEAVING SEGMENT
SR. NO. NAME OF COMPANY (WEAVING)
PROFIT AFTER
TAXATION
TOTAL SALES
PROFIT AFTER
TAXATION
2 Shahtaj Textile Limited 3,017 69 4,040 15.1% 205 28.5% Not Rated 30.03 Yousaf Weaving Mills Limited 1,790 (140) 3,829 14.3% 61 8.4% Not Rated 1.74 Zephyr Textiles Limited 2,347 37 3,574 13.4% 89 12.3% Not Rated 3.75 Samin Te tiles Limited 1 820 (84) 3 096 11 6% 46 6 4% Not Rated 6 55 Samin Textiles Limited 1,820 (84) 3,096 11.6% 46 6.4% Not Rated 6.56 Feroze1888 Mills Limited * 2,246 167 2,913 10.9% 151 21.0% Not Rated 36.17 ICC Textiles Limited 1,380 (66) 2,246 8.4% (99) -13.8% Not Rated 2.18 Ashfaq Textile Mills Limited 729 54 1,036 3.9% 30 4.1% Not Rated 10.5
*Formerly Nakshbandi Industries Limited
Total Weaving 26,687 100.0% 720 100.0%Total Weaving - Net of losses 26,687 100.0% 621 100.0%
Source: KSETextile – Some
FactsImportance of
Textile in Pakistan
World Textile –Demand &
Supply Dynamics
Performance Competitiveness Outlook on the Sector
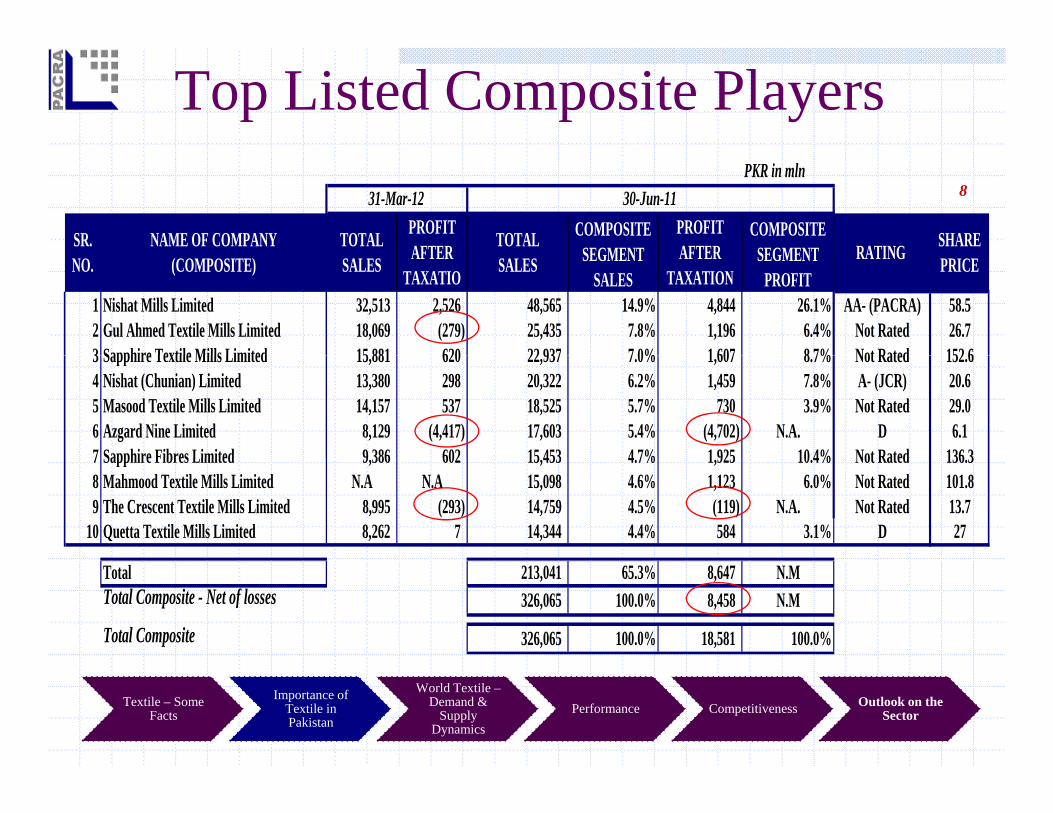
Top Listed Composite Players PKR in mln
30-Jun-11PROFIT AFTER
31-Mar-12
RATING SHARE SR. NAME OF COMPANY TOTAL TOTAL PROFIT AFTER
COMPOSITE SEGMENT
COMPOSITE SEGMENT
8
1 Nishat Mills Limited 32,513 2,526 48,565 14.9% 4,844 26.1% AA- (PACRA) 58.52 Gul Ahmed Textile Mills Limited 18,069 (279) 25,435 7.8% 1,196 6.4% Not Rated 26.73 Sapphire Textile Mills Limited 15 881 620 22 937 7 0% 1 607 8 7% Not Rated 152 6
AFTER TAXATIO
RATING PRICE NO. (COMPOSITE) SALES SALES AFTER TAXATION
SEGMENT PROFIT
SEGMENT SALES
3 Sapphire Textile Mills Limited 15,881 620 22,937 7.0% 1,607 8.7% Not Rated 152.64 Nishat (Chunian) Limited 13,380 298 20,322 6.2% 1,459 7.8% A- (JCR) 20.65 Masood Textile Mills Limited 14,157 537 18,525 5.7% 730 3.9% Not Rated 29.06 Azgard Nine Limited 8,129 (4,417) 17,603 5.4% (4,702) N.A. D 6.17 Sapphire Fibres Limited 9 386 602 15 453 4 7% 1 925 10 4% Not Rated 136 37 Sapphire Fibres Limited 9,386 602 15,453 4.7% 1,925 10.4% Not Rated 136.38 Mahmood Textile Mills Limited N.A N.A 15,098 4.6% 1,123 6.0% Not Rated 101.89 The Crescent Textile Mills Limited 8,995 (293) 14,759 4.5% (119) N.A. Not Rated 13.7
10 Quetta Textile Mills Limited 8,262 7 14,344 4.4% 584 3.1% D 27
Total 213,041 65.3% 8,647 N.MTotal Composite - Net of losses 326,065 100.0% 8,458 N.M
Total Composite 326,065 100.0% 18,581 100.0%
Textile – Some Facts
Importance of Textile in Pakistan
World Textile –Demand &
Supply Dynamics
Performance Competitiveness Outlook on the Sector
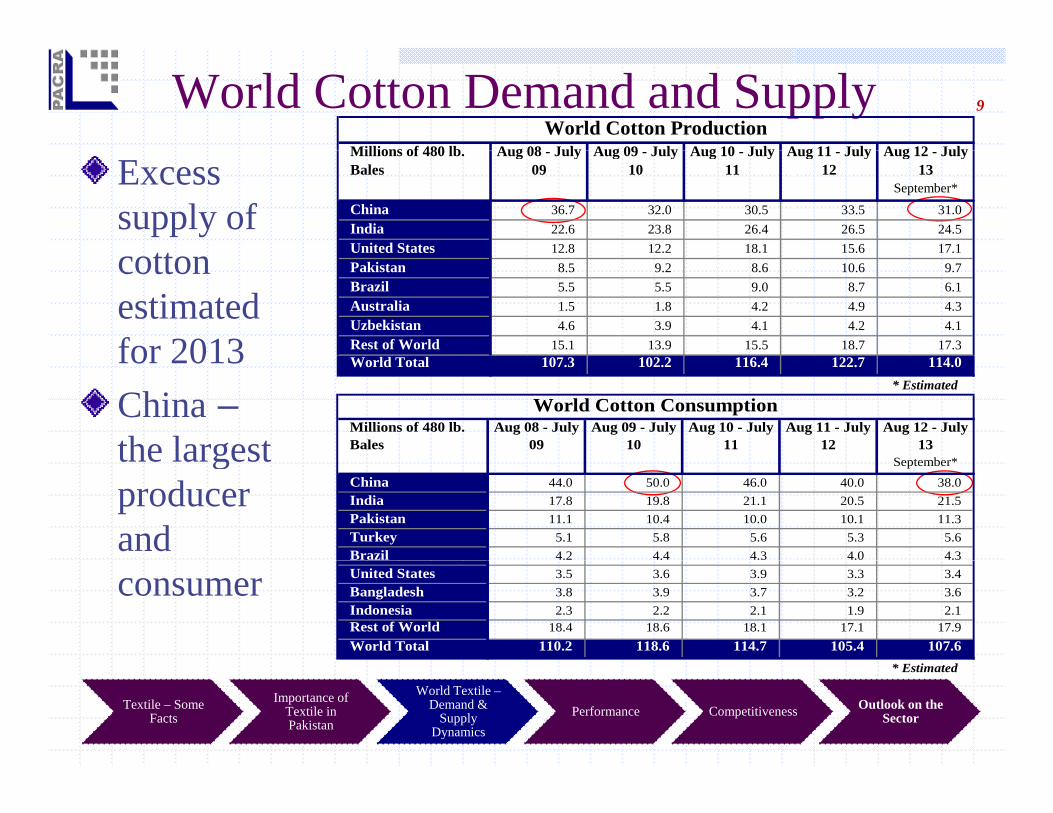
World Cotton Demand and Supply 9
Millions of 480 lb Aug 08 July Aug 09 July Aug 10 July Aug 11 July Aug 12 JulyWorld Cotton Production
Excess supply of
tt
Millions of 480 lb. Bales
Aug 08 - July 09
Aug 09 - July 10
Aug 10 - July 11
Aug 11 - July 12
Aug 12 - July 13
September*
China 36.7 32.0 30.5 33.5 31.0 India 22.6 23.8 26.4 26.5 24.5 United States 12.8 12.2 18.1 15.6 17.1 cotton
estimated for 2013
U ed S es . . . . 7.Pakistan 8.5 9.2 8.6 10.6 9.7 Brazil 5.5 5.5 9.0 8.7 6.1 Australia 1.5 1.8 4.2 4.9 4.3 Uzbekistan 4.6 3.9 4.1 4.2 4.1 Rest of World 15.1 13.9 15.5 18.7 17.3 for 2013
China –the largest
World Total 107.3 102.2 116.4 122.7 114.0 * Estimated
Millions of 480 lb. Bales
Aug 08 - July 09
Aug 09 - July 10
Aug 10 - July 11
Aug 11 - July 12
Aug 12 - July 13
S b *
World Cotton Consumption
the largest producer and
September*
China 44.0 50.0 46.0 40.0 38.0 India 17.8 19.8 21.1 20.5 21.5 Pakistan 11.1 10.4 10.0 10.1 11.3 Turkey 5.1 5.8 5.6 5.3 5.6 Brazil 4.2 4.4 4.3 4.0 4.3
consumer United States 3.5 3.6 3.9 3.3 3.4 Bangladesh 3.8 3.9 3.7 3.2 3.6 Indonesia 2.3 2.2 2.1 1.9 2.1 Rest of World 18.4 18.6 18.1 17.1 17.9 World Total 110.2 118.6 114.7 105.4 107.6
Textile – Some Facts
Importance of Textile in Pakistan
World Textile –Demand &
Supply Dynamics
Performance Competitiveness Outlook on the Sector
* Estimated
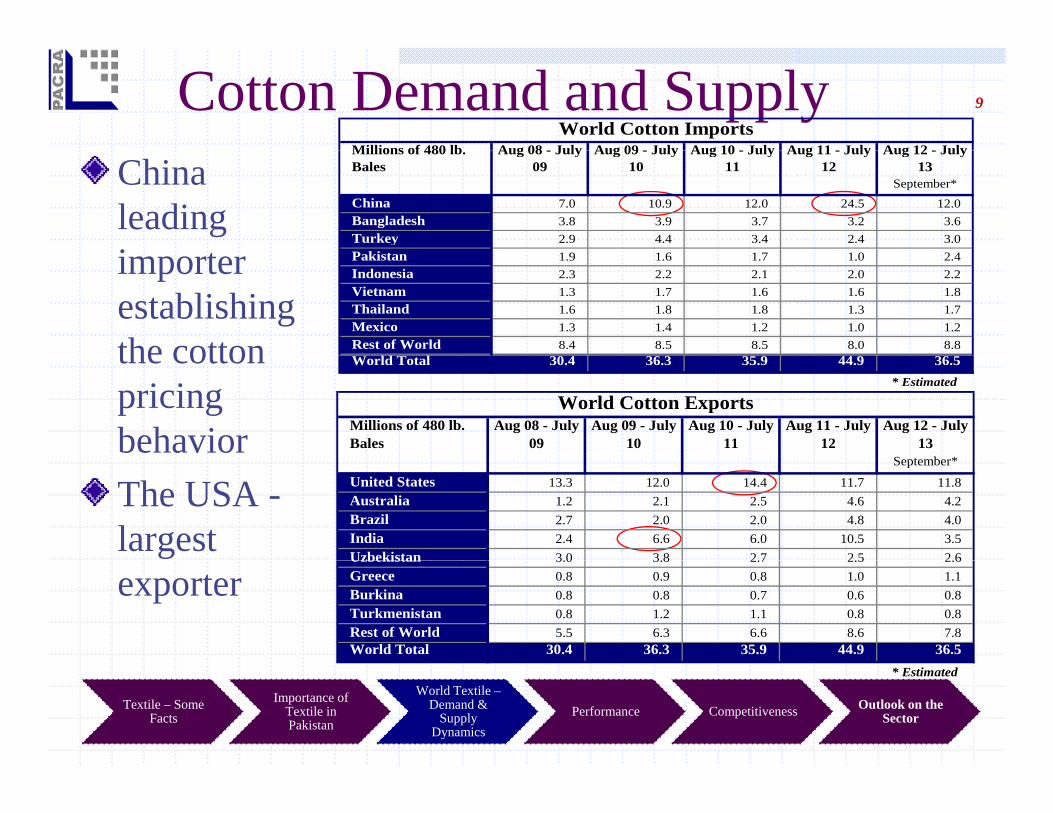
Cotton Demand and Supply 9
Millions of 480 lb Aug 08 July Aug 09 July Aug 10 July Aug 11 July Aug 12 JulyWorld Cotton Imports
Chinaleading i t
Millions of 480 lb. Bales
Aug 08 - July 09
Aug 09 - July 10
Aug 10 - July 11
Aug 11 - July 12
Aug 12 - July 13
September*China 7.0 10.9 12.0 24.5 12.0 Bangladesh 3.8 3.9 3.7 3.2 3.6 Turkey 2.9 4.4 3.4 2.4 3.0 P ki t 1 9 1 6 1 7 1 0 2 4importer
establishing the cotton
Pakistan 1.9 1.6 1.7 1.0 2.4 Indonesia 2.3 2.2 2.1 2.0 2.2 Vietnam 1.3 1.7 1.6 1.6 1.8 Thailand 1.6 1.8 1.8 1.3 1.7 Mexico 1.3 1.4 1.2 1.0 1.2 Rest of World 8.4 8.5 8.5 8.0 8.8 the cotton
pricing behavior
World Total 30.4 36.3 35.9 44.9 36.5 * Estimated
Millions of 480 lb. Bales
Aug 08 - July 09
Aug 09 - July 10
Aug 10 - July 11
Aug 11 - July 12
Aug 12 - July 13
S t b *
World Cotton Exports
The USA -largest
September*
United States 13.3 12.0 14.4 11.7 11.8 Australia 1.2 2.1 2.5 4.6 4.2 Brazil 2.7 2.0 2.0 4.8 4.0 India 2.4 6.6 6.0 10.5 3.5 Uzbekistan 3.0 3.8 2.7 2.5 2.6
exporterUzbekistan 3.0 3.8 2.7 2.5 2.6 Greece 0.8 0.9 0.8 1.0 1.1 Burkina 0.8 0.8 0.7 0.6 0.8 Turkmenistan 0.8 1.2 1.1 0.8 0.8 Rest of World 5.5 6.3 6.6 8.6 7.8 World Total 30.4 36.3 35.9 44.9 36.5
Textile – Some Facts
Importance of Textile in Pakistan
World Textile –Demand &
Supply Dynamics
Performance Competitiveness Outlook on the Sector
* Estimated
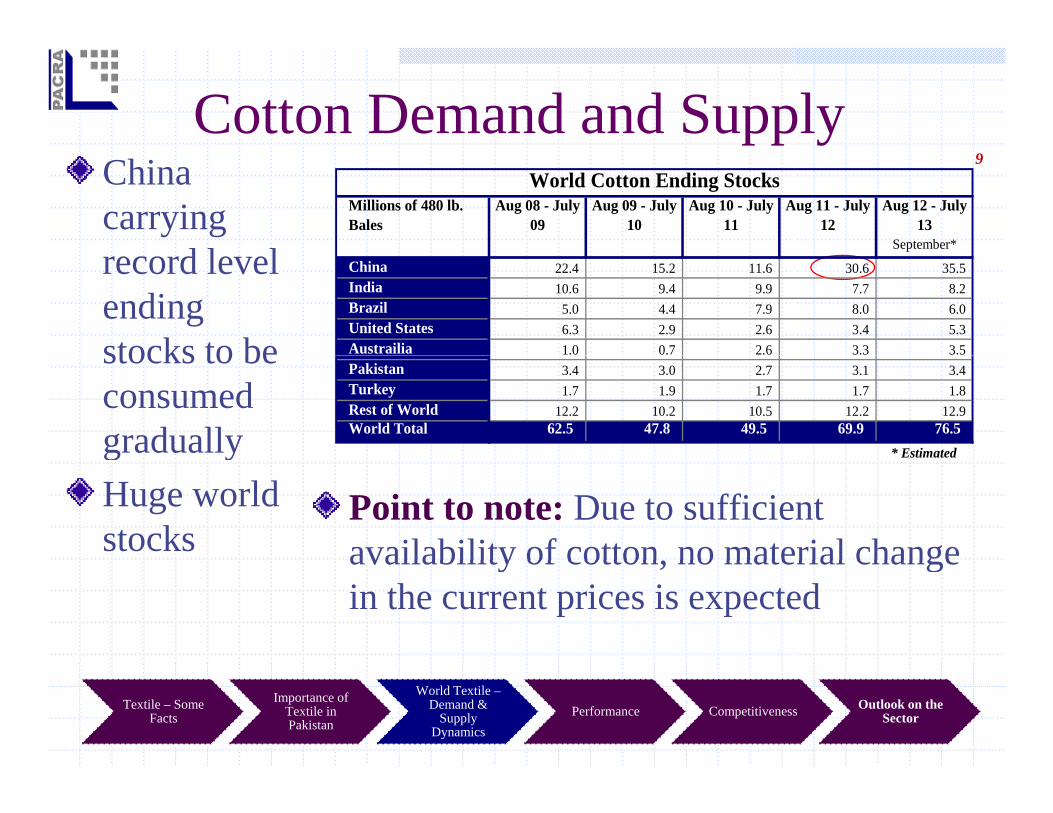
Cotton Demand and Supply9China
carrying d l l
Millions of 480 lb. Bales
Aug 08 - July 09
Aug 09 - July 10
Aug 10 - July 11
Aug 11 - July 12
Aug 12 - July 13
September*
World Cotton Ending Stocks
record level ending stocks to be
China 22.4 15.2 11.6 30.6 35.5 India 10.6 9.4 9.9 7.7 8.2 Brazil 5.0 4.4 7.9 8.0 6.0 United States 6.3 2.9 2.6 3.4 5.3 Austrailia 1.0 0.7 2.6 3.3 3.5 stocks to be
consumed gradually
Pakistan 3.4 3.0 2.7 3.1 3.4 Turkey 1.7 1.9 1.7 1.7 1.8 Rest of World 12.2 10.2 10.5 12.2 12.9 World Total 62.5 47.8 49.5 69.9 76.5
* Estimatedg yHuge world stocks
Point to note: Due to sufficient availability of cotton no material changeavailability of cotton, no material change in the current prices is expected
Textile – Some Facts
Importance of Textile in Pakistan
World Textile –Demand &
Supply Dynamics
Performance Competitiveness Outlook on the Sector
10
300
350
12,000
14,000
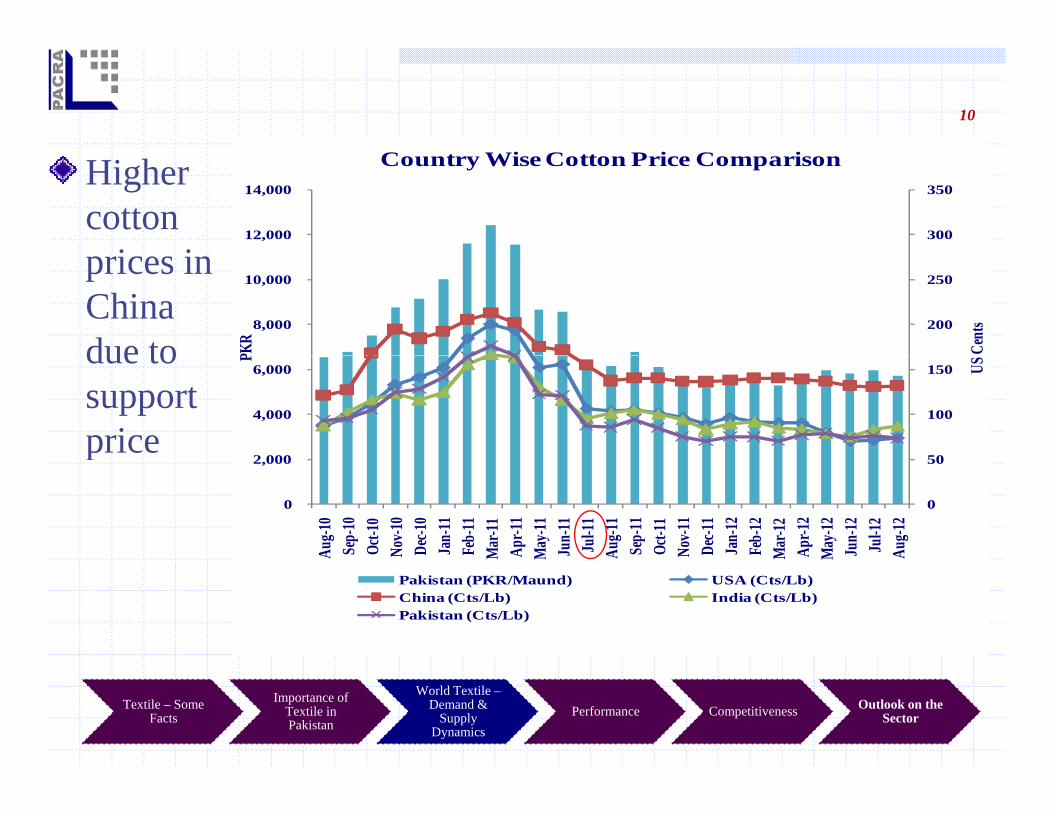
Country Wise Cotton Price ComparisonHigher cotton
i i200
250
8,000
10,000
Cent
s
PKR
prices in China due to
50
100
150
2 000
4,000
6,000 US Pdue to
support price
0
50
0
2,000
Aug-1
0Se
p-10
Oct-1
0No
v-10
Dec-1
0Ja
n-11
Feb-
11M
ar-11
Apr-1
1M
ay-11
Jun-
11Ju
l-11
Aug-1
1Se
p-11
Oct-1
1No
v-11
Dec-1
1Ja
n-12
Feb-
12M
ar-12
Apr-1
2M
ay-12
Jun-
12Ju
l-12
Aug-1
2
p
Pakistan (PKR/Maund) USA (Cts/Lb)China (Cts/Lb) India (Cts/Lb)Pakistan (Cts/Lb)
Textile – Some Facts
Importance of Textile in Pakistan
World Textile –Demand &
Supply Dynamics
Performance Competitiveness Outlook on the Sector
Textile and Clothing Supply11
Sr. #2006 2007 2008 2009 2010
World Textile (USD bln) 220.4 240.4 250.2 209.9 250.7
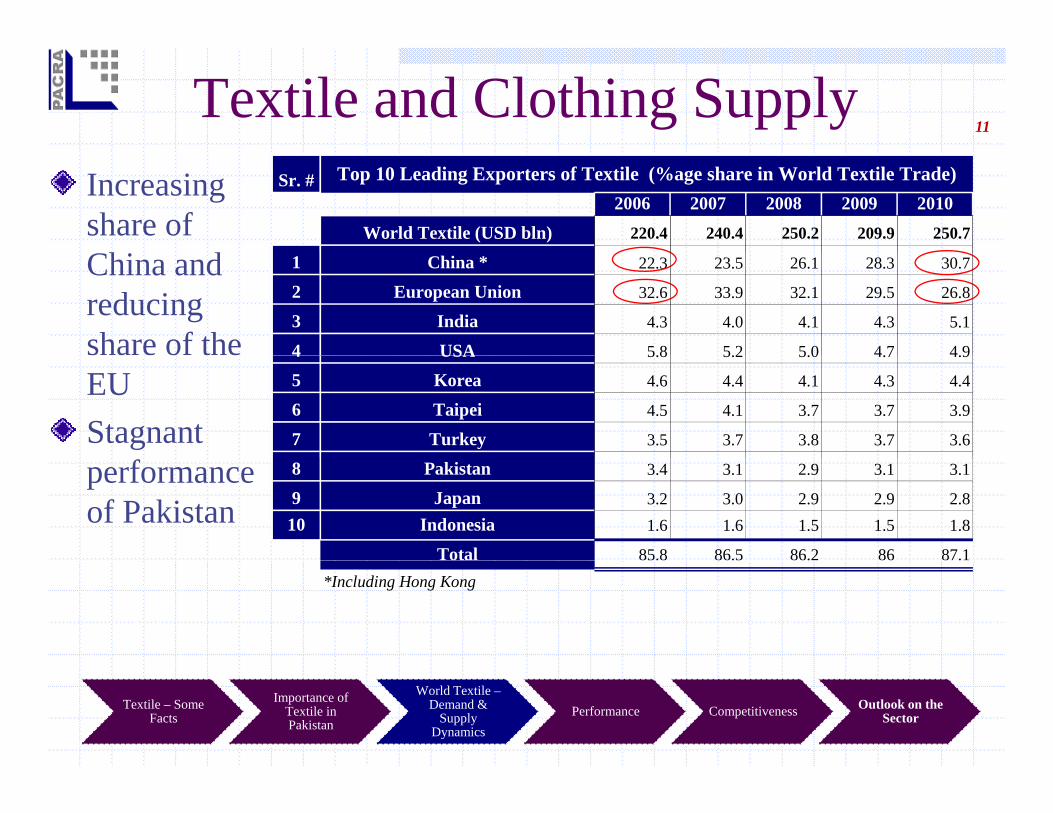
Top 10 Leading Exporters of Textile (%age share in World Textile Trade)Increasing share of Chi d 1 China * 22.3 23.5 26.1 28.3 30.7
2 European Union 32.6 33.9 32.1 29.5 26.8
3 India 4.3 4.0 4.1 4.3 5.1
4 USA 5.8 5.2 5.0 4.7 4.9
China and reducing share of the 4 USA 5.8 5.2 5.0 4.7 4.9
5 Korea 4.6 4.4 4.1 4.3 4.4
6 Taipei 4.5 4.1 3.7 3.7 3.9
7 Turkey 3.5 3.7 3.8 3.7 3.6
EU Stagnant
8 Pakistan 3.4 3.1 2.9 3.1 3.1
9 Japan 3.2 3.0 2.9 2.9 2.810 Indonesia 1.6 1.6 1.5 1.5 1.8
Total 85.8 86.5 86.2 86 87.1
performance of Pakistan
*Including Hong Kong
Textile – Some Facts
Importance of Textile in Pakistan
World Textile –Demand &
Supply Dynamics
Performance Competitiveness Outlook on the Sector
Textile and Clothing Supply11Chi th 11
Sr. #2006 2007 2008 2009 2010
W ld T til (USD bl ) 309 1 345 8 361 9 315 1 351 5
Top 10 Leading Exporters of Clothing (%age share in World Clothing Trade)
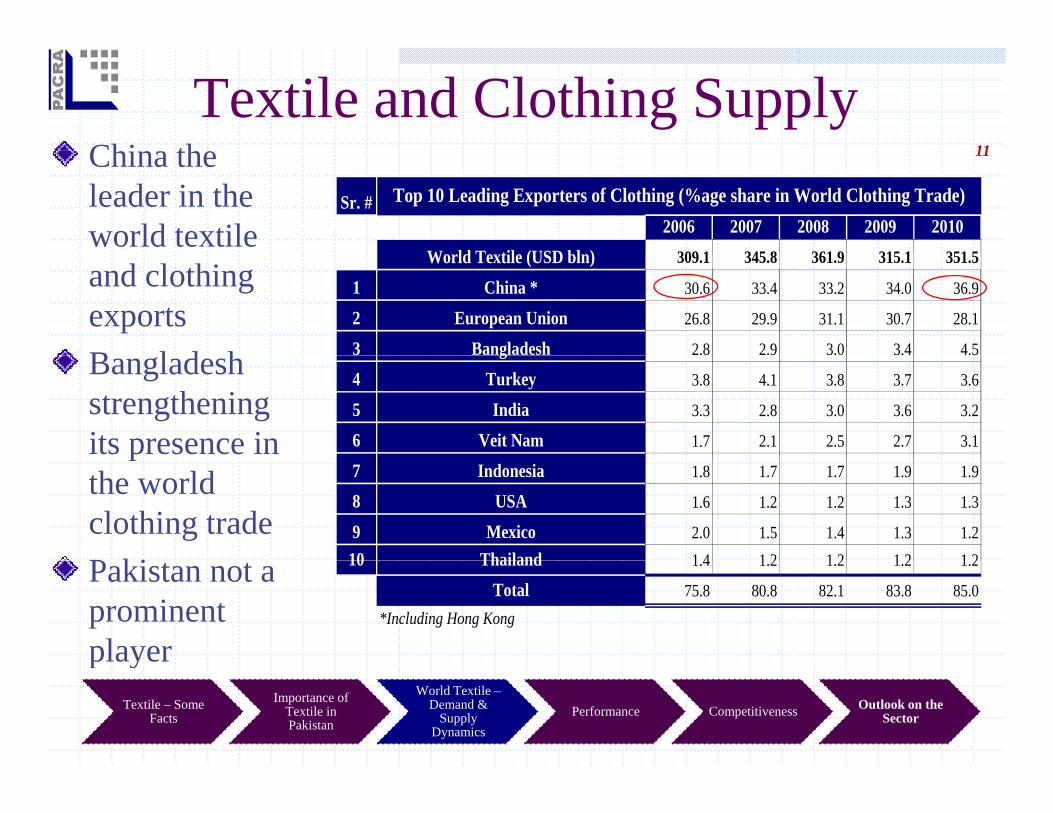
China the leader in the world textile
World Textile (USD bln) 309.1 345.8 361.9 315.1 351.5
1 China * 30.6 33.4 33.2 34.0 36.9
2 European Union 26.8 29.9 31.1 30.7 28.1
3 Bangladesh 2.8 2.9 3.0 3.4 4.5
and clothing exportsB l d h g
4 Turkey 3.8 4.1 3.8 3.7 3.6
5 India 3.3 2.8 3.0 3.6 3.2
6 Veit Nam 1.7 2.1 2.5 2.7 3.1
Bangladesh strengthening its presence in
7 Indonesia 1.8 1.7 1.7 1.9 1.9
8 USA 1.6 1.2 1.2 1.3 1.3
9 Mexico 2.0 1.5 1.4 1.3 1.210 Thailand 1 4 1 2 1 2 1 2 1 2
pthe world clothing trade P ki 10 Thailand 1.4 1.2 1.2 1.2 1.2
Total 75.8 80.8 82.1 83.8 85.0*Including Hong Kong
Pakistan not a prominent player
Textile – Some Facts
Importance of Textile in Pakistan
World Textile –Demand &
Supply Dynamics
Performance Competitiveness Outlook on the Sector
p y
Textile and Clothing Demand1111
Sr. #2006 2007 2008 2009 2010
1 European Union 30 7 33 7 31 9 29 7 27 5
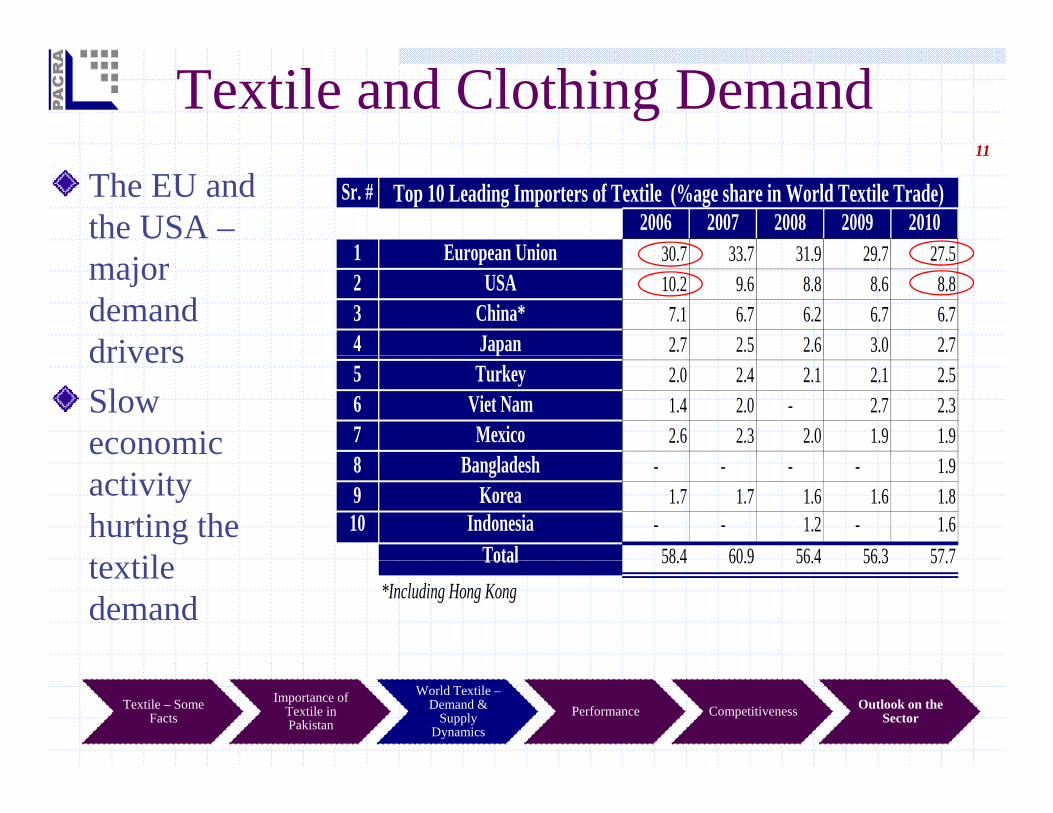
Top 10 Leading Importers of Textile (%age share in World Textile Trade)The EU and the USA –
1 European Union 30.7 33.7 31.9 29.7 27.52 USA 10.2 9.6 8.8 8.6 8.83 China* 7.1 6.7 6.2 6.7 6.74 Japan 2.7 2.5 2.6 3.0 2.7
major demand drivers p
5 Turkey 2.0 2.4 2.1 2.1 2.56 Viet Nam 1.4 2.0 - 2.7 2.37 Mexico 2.6 2.3 2.0 1.9 1.98 B l d h
driversSlow economic
8 Bangladesh - - - - 1.99 Korea 1.7 1.7 1.6 1.6 1.810 Indonesia - - 1.2 - 1.6
Total 58 4 60 9 56 4 56 3 57 7
activity hurting the t til Total 58.4 60.9 56.4 56.3 57.7
*Including Hong Kongtextile demand
Textile – Some Facts
Importance of Textile in Pakistan
World Textile –Demand &
Supply Dynamics
Performance Competitiveness Outlook on the Sector
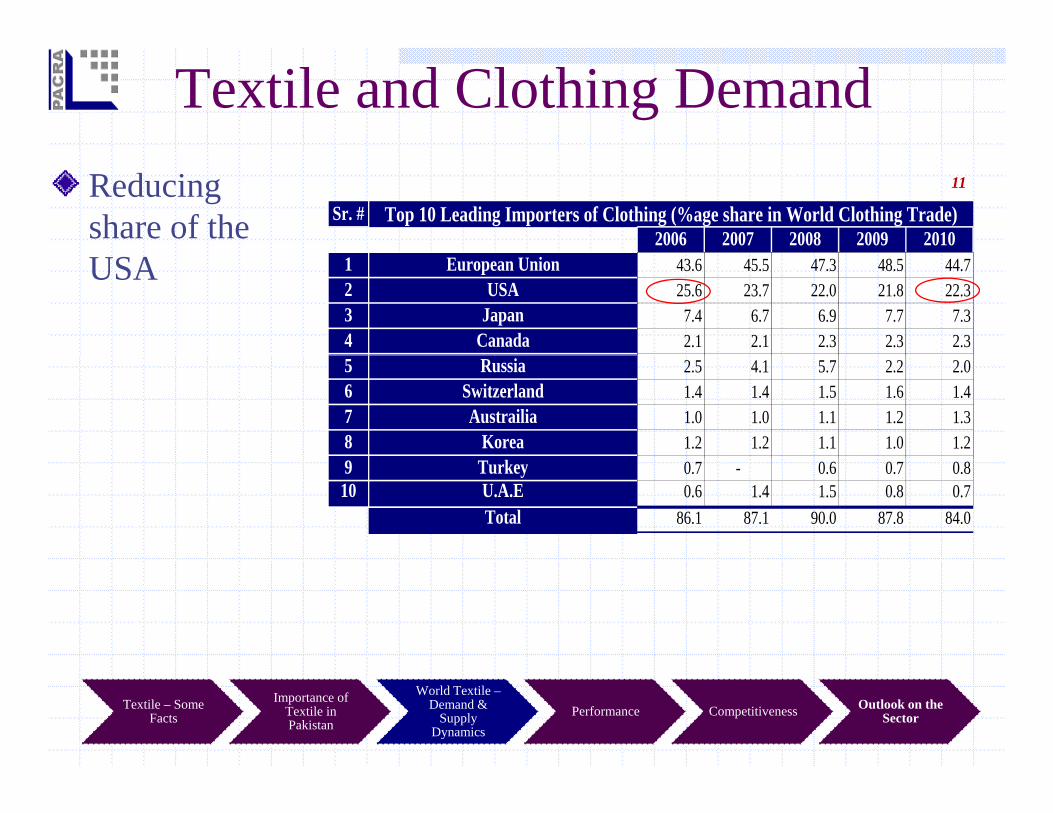
Textile and Clothing Demand11
Sr. #2006 2007 2008 2009 2010
Top 10 Leading Importers of Clothing (%age share in World Clothing Trade)Reducing share of the
1 European Union 43.6 45.5 47.3 48.5 44.72 USA 25.6 23.7 22.0 21.8 22.33 Japan 7.4 6.7 6.9 7.7 7.34 Canada 2.1 2.1 2.3 2.3 2.3
USA
5 Russia 2.5 4.1 5.7 2.2 2.06 Switzerland 1.4 1.4 1.5 1.6 1.47 Austrailia 1.0 1.0 1.1 1.2 1.38 Korea 1.2 1.2 1.1 1.0 1.29 Turkey 0.7 - 0.6 0.7 0.810 U.A.E 0.6 1.4 1.5 0.8 0.7
Total 86.1 87.1 90.0 87.8 84.0
Textile – Some Facts
Importance of Textile in Pakistan
World Textile –Demand &
Supply Dynamics
Performance Competitiveness Outlook on the Sector
12
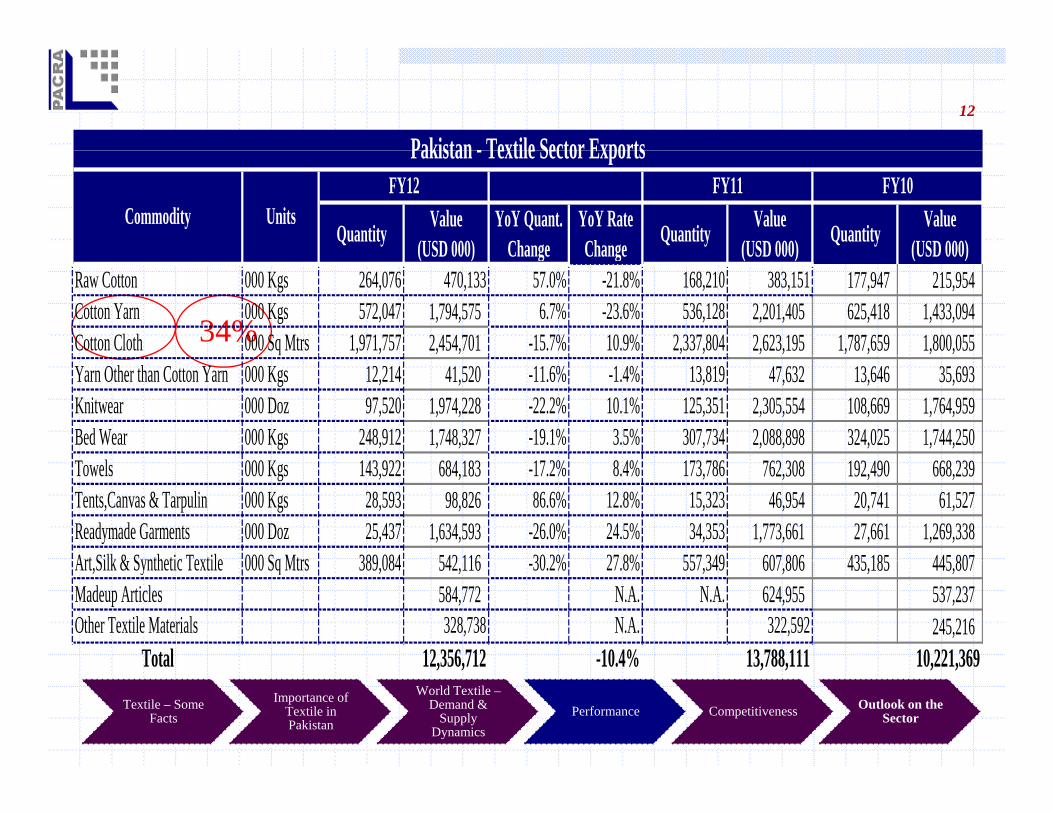
Pakistan - Textile Sector Exports
Quantity Value (USD 000)
YoY Quant. Change
YoY Rate Change Quantity Value
(USD 000) Quantity Value (USD 000)
Pakistan - Textile Sector Exports
Commodity UnitsFY12 FY11 FY10
34%
(USD 000) Change Change (USD 000) (USD 000)Raw Cotton 000 Kgs 264,076 470,133 57.0% -21.8% 168,210 383,151 177,947 215,954 Cotton Yarn 000 Kgs 572,047 1,794,575 6.7% -23.6% 536,128 2,201,405 625,418 1,433,094 Cotton Cloth 000 Sq Mtrs 1,971,757 2,454,701 -15.7% 10.9% 2,337,804 2,623,195 1,787,659 1,800,055 Yarn Other than Cotton Yarn 000 Kgs 12,214 41,520 -11.6% -1.4% 13,819 47,632 13,646 35,693 Knitwear 000 Doz 97,520 1,974,228 -22.2% 10.1% 125,351 2,305,554 108,669 1,764,959 Bed Wear 000 Kgs 248,912 1,748,327 -19.1% 3.5% 307,734 2,088,898 324,025 1,744,250 Towels 000 Kgs 143,922 684,183 -17.2% 8.4% 173,786 762,308 192,490 668,239 Tents,Canvas & Tarpulin 000 Kgs 28,593 98,826 86.6% 12.8% 15,323 46,954 20,741 61,527 Readymade Garments 000 Doz 25,437 1,634,593 -26.0% 24.5% 34,353 1,773,661 27,661 1,269,338 Art Silk & Synthetic Textile 000 Sq Mtrs 389 084 542 116 30 2% 27 8% 557 349 607 806 435 185 445 807Art,Silk & Synthetic Textile 000 Sq Mtrs 389,084 542,116 -30.2% 27.8% 557,349 607,806 435,185 445,807 Madeup Articles 584,772 N.A. N.A. 624,955 537,237 Other Textile Materials 328,738 N.A. 322,592 245,216
Total 12,356,712 -10.4% 13,788,111 10,221,369Textile – Some
FactsImportance of
Textile in Pakistan
World Textile –Demand &
Supply Dynamics
Performance Competitiveness Outlook on the Sector
Total 12,356,712 10.4% 13,788,111 10,221,369
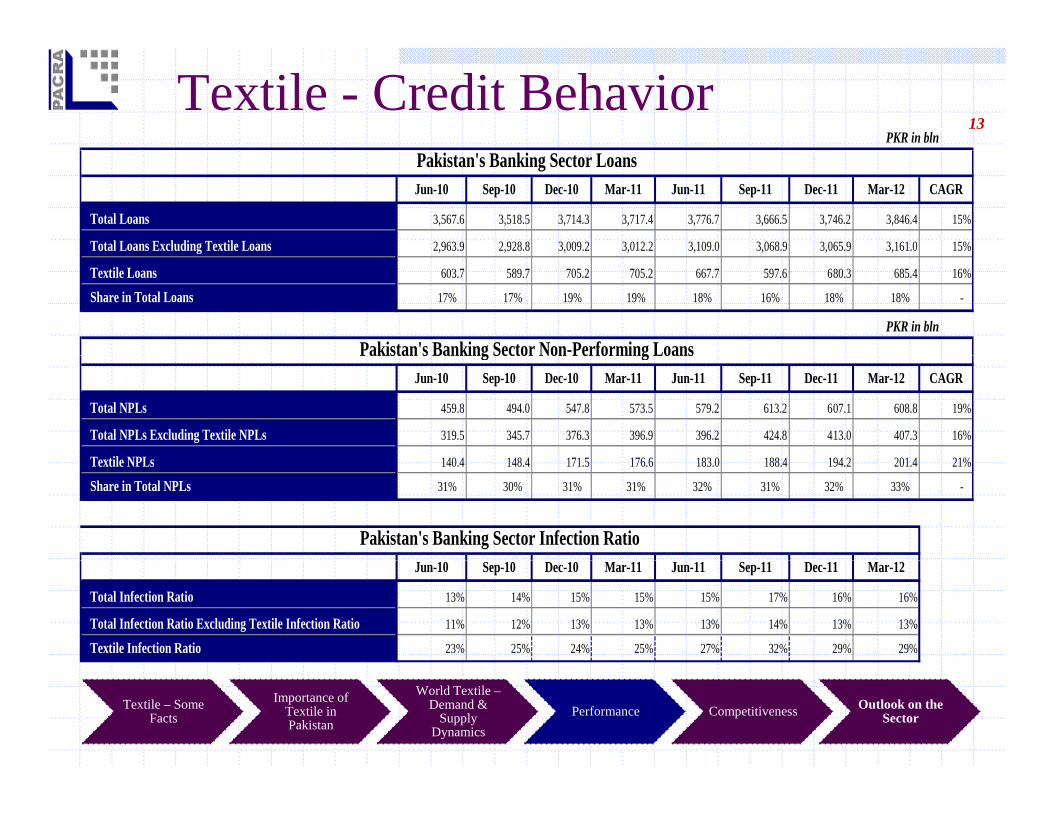
Textile - Credit Behavior13
PKR in bln
Jun-10 Sep-10 Dec-10 Mar-11 Jun-11 Sep-11 Dec-11 Mar-12 CAGR
Total Loans 3,567.6 3,518.5 3,714.3 3,717.4 3,776.7 3,666.5 3,746.2 3,846.4 15%
Total Loans Excluding Textile Loans 2,963.9 2,928.8 3,009.2 3,012.2 3,109.0 3,068.9 3,065.9 3,161.0 15%
Pakistan's Banking Sector Loans
g , , , , , , , ,
Textile Loans 603.7 589.7 705.2 705.2 667.7 597.6 680.3 685.4 16%
Share in Total Loans 17% 17% 19% 19% 18% 16% 18% 18% -
PKR in blnPakistan's Banking Sector Non-Performing Loans
Jun-10 Sep-10 Dec-10 Mar-11 Jun-11 Sep-11 Dec-11 Mar-12 CAGR
Total NPLs 459.8 494.0 547.8 573.5 579.2 613.2 607.1 608.8 19%
Total NPLs Excluding Textile NPLs 319.5 345.7 376.3 396.9 396.2 424.8 413.0 407.3 16%
T til NPL 140 4 148 4 171 5 176 6 183 0 188 4 194 2 201 4 21%
Pakistan s Banking Sector Non Performing Loans
Textile NPLs 140.4 148.4 171.5 176.6 183.0 188.4 194.2 201.4 21%
Share in Total NPLs 31% 30% 31% 31% 32% 31% 32% 33% -
Pakistan's Banking Sector Infection RatioJun-10 Sep-10 Dec-10 Mar-11 Jun-11 Sep-11 Dec-11 Mar-12
Total Infection Ratio 13% 14% 15% 15% 15% 17% 16% 16%
Total Infection Ratio Excluding Textile Infection Ratio 11% 12% 13% 13% 13% 14% 13% 13%
Textile Infection Ratio 23% 25% 24% 25% 27% 32% 29% 29%
Textile – Some Facts
Importance of Textile in Pakistan
World Textile –Demand &
Supply Dynamics
Performance Competitiveness Outlook on the Sector
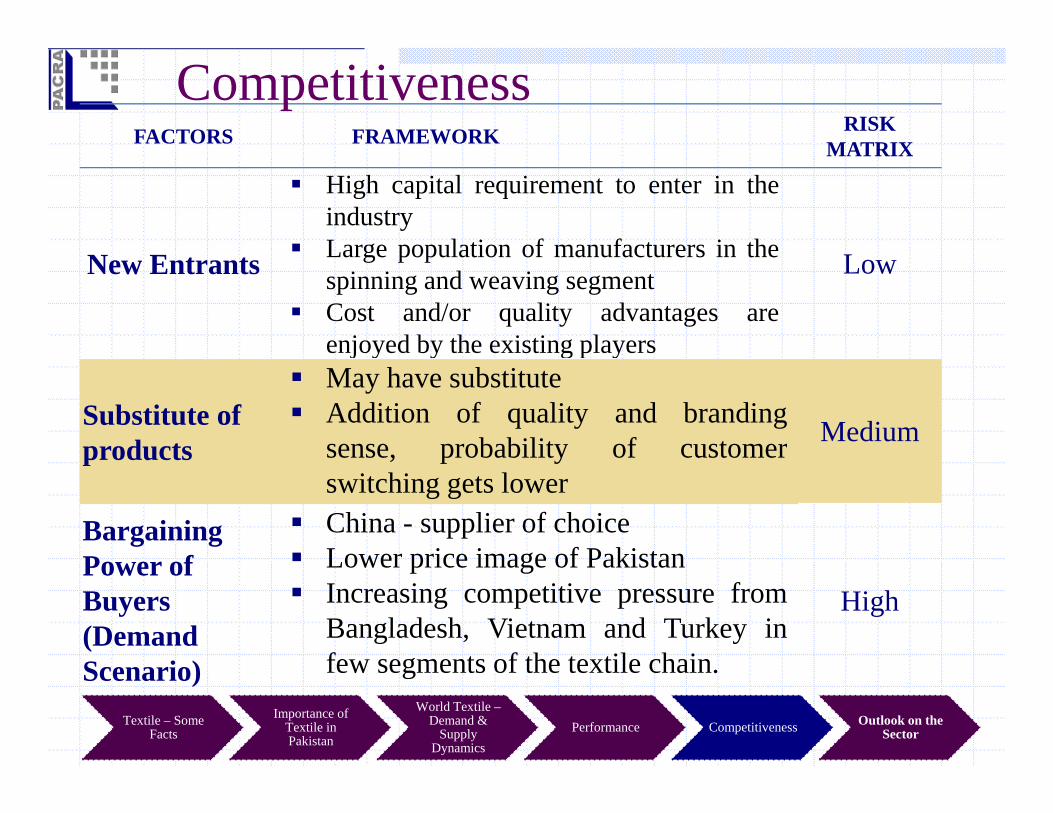
FACTORS FRAMEWORK RISK MATRIX
Competitiveness
High capital requirement to enter in theindustryLarge population of manufacturers in the
MATRIX
New Entrants Large population of manufacturers in thespinning and weaving segmentCost and/or quality advantages areenjoyed by the existing players
Low
j y y g p y
Substitute of products
May have substituteAddition of quality and brandingsense, probability of customer Mediumproducts , p yswitching gets lower
Bargaining P f
China - supplier of choiceLower price image of PakistanPower of
Buyers (Demand S i )
Lower price image of PakistanIncreasing competitive pressure fromBangladesh, Vietnam and Turkey infew segments of the textile chain
High
Scenario) few segments of the textile chain.
Textile – Some Facts
Importance of Textile in Pakistan
World Textile –Demand &
Supply Dynamics
Performance Competitiveness Outlook on the Sector
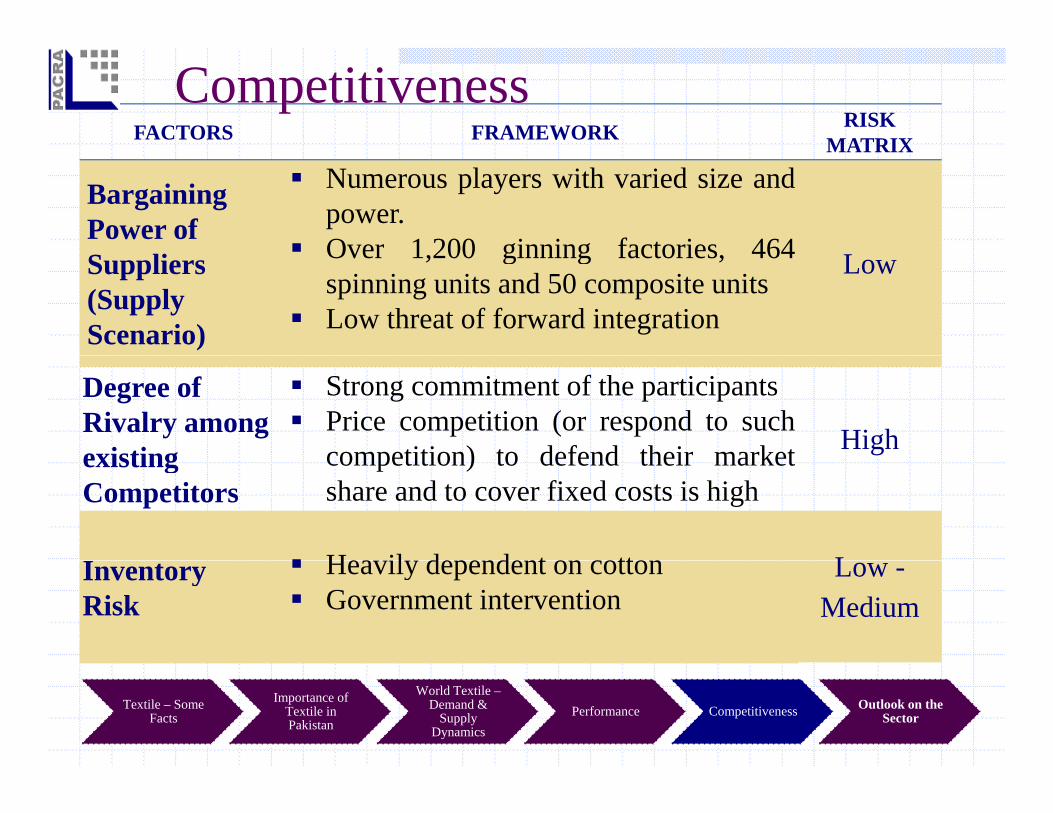
FACTORS FRAMEWORK RISK MATRIX
Competitiveness
Bargaining Power of
Numerous players with varied size andpower.Over 1 200 ginning factories 464
MATRIX
Suppliers (Supply Scenario)
Over 1,200 ginning factories, 464spinning units and 50 composite unitsLow threat of forward integration
Low
Degree of Rivalry among existing
Strong commitment of the participantsPrice competition (or respond to suchcompetition) to defend their market Highexisting
Competitors competition) to defend their marketshare and to cover fixed costs is high
He il de e de t tt LInventory Risk
Heavily dependent on cottonGovernment intervention
Low -Medium
Textile – Some Facts
Importance of Textile in Pakistan
World Textile –Demand &
Supply Dynamics
Performance Competitiveness Outlook on the Sector
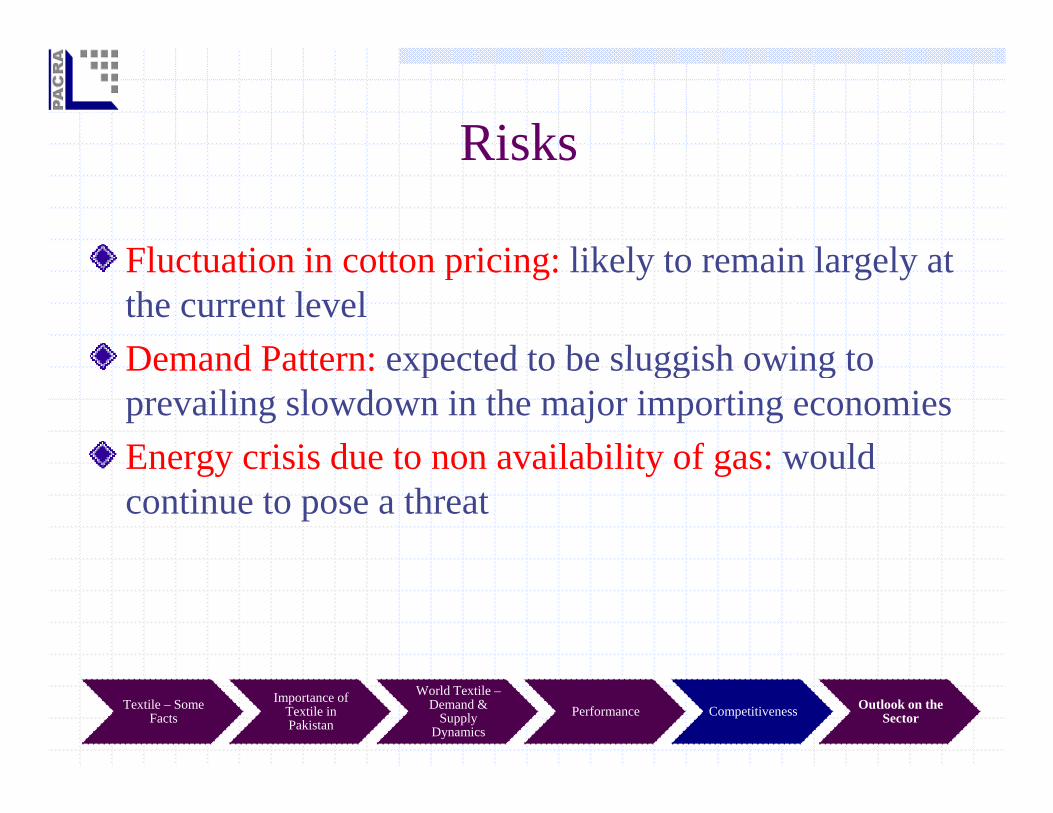
RisksRisks
Fl t ti i tt i i lik l t i l l tFluctuation in cotton pricing: likely to remain largely at the current levelDemand Pattern: expected to be sluggish owing toDemand Pattern: expected to be sluggish owing to prevailing slowdown in the major importing economiesEnergy crisis due to non availability of gas: wouldEnergy crisis due to non availability of gas: would continue to pose a threat
Textile – Some Facts
Importance of Textile in Pakistan
World Textile –Demand &
Supply Dynamics
Performance Competitiveness Outlook on the Sector
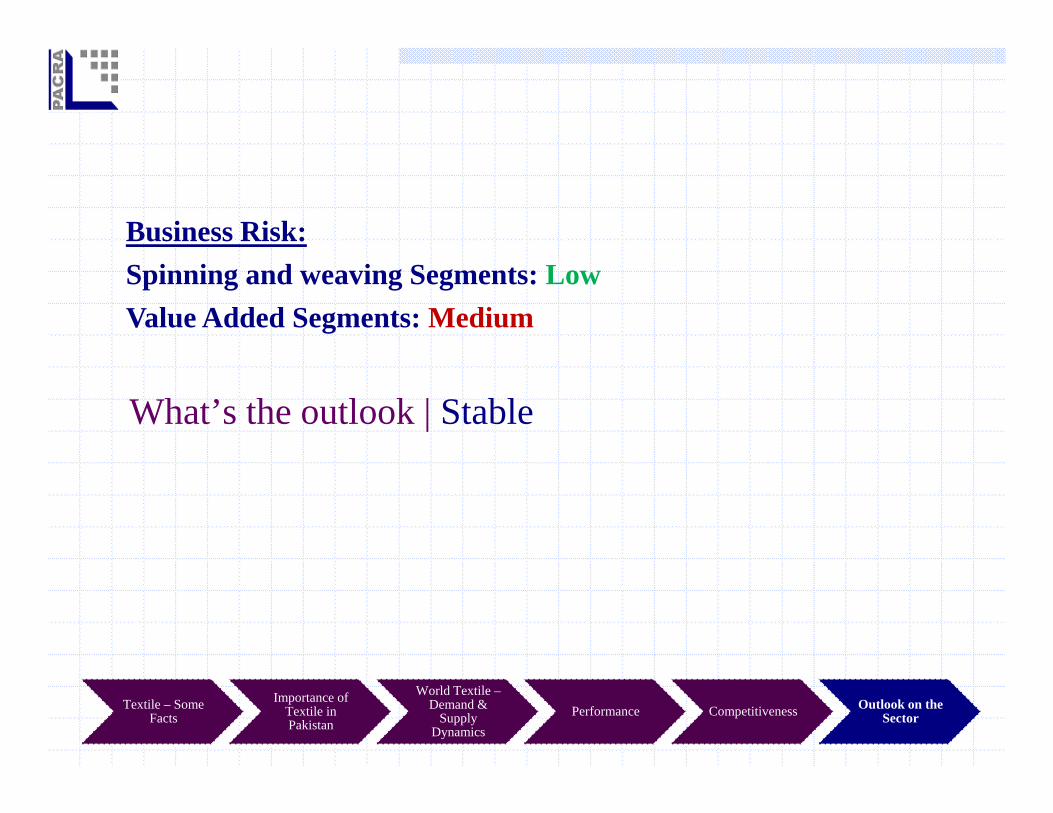
Business Risk:Spinning and weaving Segments: LowValue Added Segments: Medium
What’s the outlook | Stable
Textile – Some Facts
Importance of Textile in Pakistan
World Textile –Demand &
Supply Dynamics
Performance Competitiveness Outlook on the Sector
Bibliography1. Pakistan Economic Survey 2010-11: Manufacturing and Mining | Section 3.22. Pakistan Textile Journal | February - 2010 | Pakistan: The third largest spinner country in Asia by Dr.
Noor Ahmed Memon3. Contributes 46% of the total manufacturing: Pakistan Economic Survey | 2011-12|Manufacturing and
Mining | Section 3.24. Pakistanpaedia : http://www.pakistanpaedia.com/maps/maps-of-pakistan.html5. State Bank of Pakistan : Economic Data | Export Receipts by Commodity | Archive Monthly6. All Pakistan Textile Mills Association: http://www.aptma.org.pk/Pak_Textile_Statistics/Gctipw.asp7. All Pakistan Textile Mills Association: Member Directory8. Karachi Stock Exchange: Downloads | Analysis Reports9. United States Department of Agriculture: http://www.fas.usda.gov/cotton/Current/10. All Pakistan Textile Mills Association11. World Trade Organization : International Trade Statistics – 2011, 2010, 2009, 2008, 200712. All Pakistan Textile Mills Association13. State Bank of Pakistan: Statistics of the Banking System | editions: Sep10, Sep11, Dec11 and Mar12g y | p , p ,
Analysts Aisha Khalid+92 42 3586 9504
Omaira Amjad+92 42 3586 9504
M. Shahnawaz A. Khanzada+92 42 3586 9504+92 42 3586 9504
[email protected]+92 42 3586 [email protected]
+92 42 3586 [email protected]
DISCLAIMERSCPACRA has used due care in preparation of this document. Our information has been obtainedfrom sources we consider to be reliable but its accuracy or completeness is not guaranteed.The information in this document may be copied or otherwise reproduced, in whole or in part,
id d th i d l k l d d Th t ti h ld t b li dprovided the source is duly acknowledged. The presentation should not be relied upon asprofessional advice.