Embed Size (px)
Citation preview

TEXTILES AND CLOTHING EXPORTING SECTORS INPORTUGAL – RECENT TRENDS*
João Amador**
Luca David Opromolla**
1. INTRODUCTION
Textiles and clothing sectors are a relevant part of the Portuguese manufacturing structure and foreign
trade. Taken together, these two sectors represented 2.0 per cent of gross value added, 4.3 per cent of
employment and 11.8 per cent of total manufacturing exports of the Portuguese economy in 2006.
Nevertheless, these sectors have suffered strong shocks in the last two decades and have become
relatively less important.
Textiles and clothing are distinct sectors with their own specificities but they are closely related both
technologically and in terms of trade policy. The two sectors are naturally vertically linked since textiles
are the major input for clothing products. However these linkages also involve distribution and sales
activities since retailers in the clothing sector increasingly manage the supply chain of both clothing
and textiles sectors (see Nordäs (2004)). In addition, up to 2005, international trade of textiles and
clothing was internationally regulated by the World Trade Organization Agreement on Textiles and
Clothing (ATC). As described by Hanzl-Wei� (2004), textiles and clothing are labour-intensive sectors
where production is mostly carried out in small and medium-sized firms. Nonetheless, it should be
noted that textiles and clothing are not homogeneous in terms of the sophistication of production, as
low and high value-added segments coexist within the same sectors or even within the same industry.1
In high value-added segments, research and development is an important competitive factor: in the
fashion industry or in sportswear, for example, materials, design and marketing play a crucial role.
In the last two decades, these sectors experienced several structural shocks with significant conse-
quences on their relative size in the economy and on characteristics of the firms (see OECD, 2004). As
for the Portuguese experience in textiles and clothing sectors, it should be noted that there is a long re-
cord of participation and competition in international markets, dating back to the accession to the Euro-
pean Free Trade Association (EFTA) in 1960. In fact, the trade liberalization resulting from EFTA
strongly contributed to the expansion of the Portuguese textiles and clothing sectors, since its rela-
tively labour-intensive nature matched the relatively labour-abundant factor endowment of the econ-
omy. As a result, the classical Balassa indexes for Portugal show a revealed comparative advantage in
Economic Bulletin | Banco de Portugal
Articles | Spring 2009
145
* The authors thank Sónia Cabral and José António Machado for their comments. The analysis, opinions and findings represent the views of the authors, they
are not necessarily those of the Banco de Portugal or the Eurosystem.
** Banco de Portugal, Economics and Research Department.
(1) Schott (2004), using product-level U.S. import data shows that, although this country increasingly sources the same products from both high- and low-wage
countries, unit values within products vary systematically with exporter relative factor endowments and production techniques. The existence of
within-product specialization is an important consideration for understanding the impact of globalization on firms and workers.111111111111111111111111111111111

these sectors since the sixties (see Amador et al. (2007)). Portuguese accession to the European Eco-
nomic Community (EEC) in 1986 and the implementation of the European Single Market in 1993
brought further liberalization in these sectors. Nevertheless, the EEC market was itself protected by
the import quotas imposed under the Multi-Fibre Arrangement (MFA), giving the Portuguese exporters
a competitive advantage in the European market. A progressive elimination of the quantitative restric-
tions took place under the ATC, to be phased in from 1995 until 2005. The consequences of this liberal-
ization at the European and world levels were widely studied. In this respect see, for example, OECD
(2004), Nordäs (2004), Francois et al. (2007) and Fox et al. (2008). One common result is that these
changes were beneficial for the large scale quota constrained producers, notably China, who joined
the WTO in 2001, after 15 years of negotiations.2
Recent events, like the 2007 enlargement of the Eu-
ropean Union to Romania and Bulgaria, countries with relatively lower labor costs and important tex-
tiles and clothing sectors, will pose further challenges to Portuguese exporters in what concerns the
relocation of production. Overall, the background points to significant challenges and the existing data
reveals a significant loss of Portuguese market share in the textile and clothing industries in the period
1997-2006 (see Amador and Cabral (2008)).
This article takes a descriptive approach of the evolution of the textiles and clothing sectors in Portugal
adopting two complementary perspectives. Firstly, we look at aggregate data and analyze the main
trends in the two sectors since the beginning of the eighties. Secondly, we use firm-level data on textile
and clothing producers and exporters to examine more in detail the changes occurred in the two sec-
tors from 1996 to 2005. In this context, we report the distribution of firms according to size, number of
varieties exported and markets covered and we identify changes in the distribution of the unit values of
textile and clothing products exported by Portugal-based firms to their main destination markets rela-
tive to the average unit values traded in those same markets. Two other interesting dimensions cov-
ered in this article are the demography of firms in these sectors and the decomposition of the observed
annual nominal export growth rates according to the firm, product and destination margins. Data con-
straints make it impossible to aggregate the firm-based information to perform a compatible
longer-term analysis.
The article is organized as follows. The next section describes the set of databases and classifications
used. Section three reports an aggregate analysis of the main trends observed in the textile and cloth-
ing sectors in the last two decades. Section four describes the characteristics of textile and clothing
producers and exporters with a particular emphasis on their products and destinations mix. Finally,
Section five concludes.
2. DATA
The analysis carried out in this article combines several datasets containing information ranging from
aggregate-level to firm-level. We use the STAN-OECD database for the period 1980-1994, comple-
mented with national accounts from Statistics Portugal (INE) for the period 1995-2006, to obtain the
Banco de Portugal | Economic Bulletin
Spring 2009 | Articles
146
(2) For a paper on the impact of Chinese competition on the Belgium textiles industry see Monforte et al. (2008).222222222222222222222222222222222
share of textiles and clothing in gross value added (GVA). The total number of firms, establishments
and employees operating in textiles and clothing industries for the period 1982-2006 is obtained by ag-
gregating firm-level data from Quadros de Pessoal, a comprehensive database maintained by the Por-
tuguese Ministry of Social Security and Labour. We identify producers of textiles and clothing by
selecting firms according to the classification of economic activity (CAE).3
We use the CEPII-Chelem
international trade database to compute the share of exports of textiles and clothing relative to total
manufacturing exports for Portugal and other countries. This database contains information based on
the International Standard Industrial Classification of all Economic Activities (ISIC rev.3), which has a
correspondence with NACE. The recently available CEPII-BACI database was used to obtain unit val-
ues of exports and imports of textiles and clothing for Portugal and its main export markets from 1995
to 2004, using a 6-digits breakdown level of the 1992 version of the Harmonized System (HS) nomen-
clature (see Gaulier and Zignaro (2008) for a detailed description of this database).4
Our firm-based analysis is made possible by the use of a new database that combines detailed and
comprehensive information on the trading behaviour of firms. The database includes all export trans-
actions by firms that are located in Portugal, on a monthly basis, from 1996 to 2005. A transaction re-
cord includes the firm’s tax identification, an 8 digits Combined Nomenclature product code, the value
of the transaction, the quantity of exported goods (expressed in kilos), the destination country, an
incoterm code describing how transportation cost, risks an insurance are allocated between the buyer
and the seller (FOB, CIF, etc.) and a variable indicating the type of transaction (transfer of ownership
after payment, return of a product, etc.).
The data used comes from customs forms in the case of extra-EU trade and from the Intrastat form in
the case of intra-EU trade and it aggregates to total Portuguese exports as reported by Statistics Por-
tugal (INE). In the analysis, we consider only transactions of goods from mainland Portugal that are
worth more than 100 euro. Still, our data covers, on average, more than 99 per cent of total exports and
about 75 per cent of the exporters. In our analysis, the data is aggregated at the annual level, all values
are expressed in current euro and we restrict the product classification to HS at 6 digits.5
In the appen-
dix, for illustrative purposes, we show an example of a HS 6-digits product.6
Since many datasets are used in this study one clarifying remark about which source is used in the
firm-level analysis is needed. Initially (Tables 1 to 3) we consider all the firms in the trade dataset that
export textiles or clothing products. Later on (Tables 4 to 6 and Charts 4 to 7), when additional informa-
tion on firms’ characteristics are needed we consider firms that are included both in Quadros de Pes-
soal and in the firbases is not equal. Twenty per cent of the firms that export textiles and clothing are
Economic Bulletin | Banco de Portugal
Articles | Spring 2009
147
(3) The classification of economic activities used by Statistics Portugal (INE) associates firms to industries on the base of the firm’s most relevant activity in
terms of production and utilization of inputs. In the period under analysis there were two revisions in CAE (from CAE rev.1 to CAE rev.2 and then to CAE
rev.2.1), which required the use of correspondence tables. This classification is very close to the Statistical Classification of Economic Activities in the
European Community (NACE).333333333333333333333333333333333
(4) The Harmonized System (HS) is run by the World Customs Organization (WCO). This classification of commodities is used by most trading nations and in
international trade negotiations. The Harmonized System, came into force in 1988, was updated on January 1st 1992, 1996, 2002 and 2007.444444444444444444444444444444444
(5) The only exception to this is Chart5 where we convert values from 1995 to 2004 euros.555555555555555555555555555555555
(6) Therefore, the product codes in the raw data follow HS 1996 for the period 1996-2001 and HS 2002 for the period 2002-2005.The Combined Nomenclature
system is comprised of the HS nomenclature with further European Community subdivisions. The first six digits of the Combined Nomenclature system
approximately coincide with the HS classification.777777777777777776666666666666666
not present in Quadros de Pessoal, representing 10 per cent of total exports of these products. There-
fore, the set of firms considered after Table 3 is different from the one used before. In addition, some ef-
fort was needed to make the aggregate part of the analysis that uses the ISIC rev.3 classification of the
CEPII-Chelem database consistent with the firm-level part of the analysis that uses data expressed ac-
cording to the HS nomenclatures. We used a correspondence table (from the documentation of the
CEPII-BACI database) to match ISIC codes with HS 1992 codes. Then HS 1992 codes for textiles and
clothing were matched with HS 1996 and HS 2002 codes.
3. AGGREGATE ANALYSIS (1982-2006)
Textiles and clothing represent a relevant share of the Portuguese economy, though their importance
has declined significantly in the last two decades. The evolution over time of these two sectors has
been substantially different. Chart 1 plots the evolution over time of textiles and clothing as a share in
GVA, total employees, and total manufacturing exports in panels (a), (b) and (d) respectively. Panel (c)
of Chart 1 instead reports the evolution over time of the number of textiles and clothing firms and estab-
lishments. In the beginning of the eighties the textile sector represented about 2.5 per cent of total GVA
while the clothing sector represented about 1 per cent. Until EEC accession in 1986 both sectors in-
creased their share in GVA, but they evolved quite differently afterwards. The relative importance of
the textiles sector declined continuously after 1986, reaching a share of total GVA slightly above 1 in
2006. On the contrary, the clothing sector increased its importance until 1992, when it reached a share
of 1.5 per cent of total GVA, progressively declining afterwards to a share slightly below 1 per cent in
2006.
The evolution of these sectors in terms of share in total employees is similar to that in terms of share in
GVA. The share of textiles in total employees was more than double that of clothing in the beginning of
the eighties but this relationship was reversed in recent years. In addition, the share of employees op-
erating in clothing increased until 1991, but declined to 3.1 per cent in 2007. The share of the textiles
sector in total employment declined continuously since 1985 to around 2.3 per cent in 2006. Taken to-
gether the share of textiles and clothing sectors in total employees dropped from 11.6 per cent in 1982
to 5.4 per cent in 2006.
The number of firms (with one or more employees) and establishments whose main activity was classi-
fied in the textiles or clothing sectors (CAE 321 and 322 in rev.1, CAE 17 and 18 in rev.2 and 2.1, re-
spectively) was similar in the beginning of the eighties, around 2000 firms. The number of firms and
establishments increased until 2000, but at a much faster rate in the clothing industry. In 2000, the
number of firms classified as clothing is 6.697, more than three times the number of firms two decades
earlier. From 2000 to 2006, the number of firms and establishments declined by 1000 units in the cloth-
ing industry and became fairly stable in the textile industry. The different path of the number of firms
when compared with the shares in GVA and employment is explained by the fact that this is an abso-
lute measure and there have been some changes in the size distribution of firms, as reported in
Subsection 4.3.
Banco de Portugal | Economic Bulletin
Spring 2009 | Articles
148
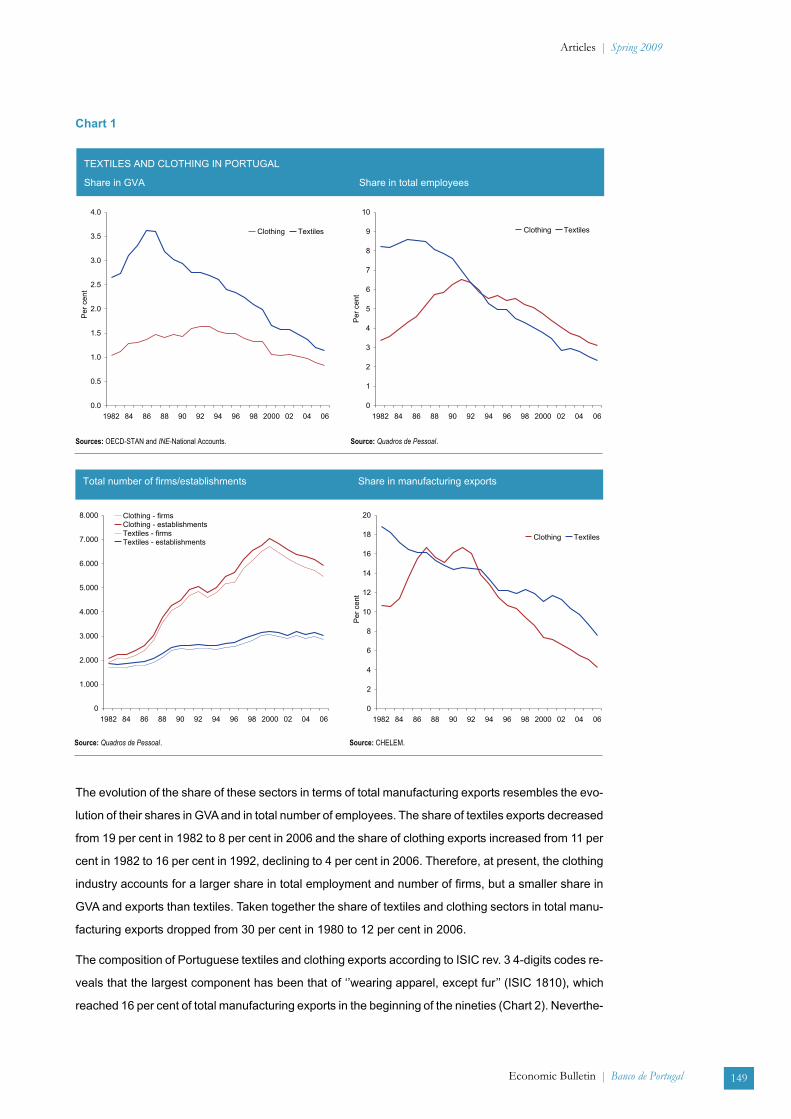
The evolution of the share of these sectors in terms of total manufacturing exports resembles the evo-
lution of their shares in GVA and in total number of employees. The share of textiles exports decreased
from 19 per cent in 1982 to 8 per cent in 2006 and the share of clothing exports increased from 11 per
cent in 1982 to 16 per cent in 1992, declining to 4 per cent in 2006. Therefore, at present, the clothing
industry accounts for a larger share in total employment and number of firms, but a smaller share in
GVA and exports than textiles. Taken together the share of textiles and clothing sectors in total manu-
facturing exports dropped from 30 per cent in 1980 to 12 per cent in 2006.
The composition of Portuguese textiles and clothing exports according to ISIC rev. 3 4-digits codes re-
veals that the largest component has been that of ‘’wearing apparel, except fur’’ (ISIC 1810), which
reached 16 per cent of total manufacturing exports in the beginning of the nineties (Chart 2). Neverthe-
Economic Bulletin | Banco de Portugal
Articles | Spring 2009
149
Chart 1
TEXTILES AND CLOTHING IN PORTUGAL
Share in GVA Share in total employees
0.0
0.5
1.0
1.5
2.0
2.5
3.0
3.5
4.0
1982 84 86 88 90 92 94 96 98 2000 02 04 06
Per
cent
Clothing Textiles
0
1
2
3
4
5
6
7
8
9
10
1982 84 86 88 90 92 94 96 98 2000 02 04 06
Per
cent
Clothing Textiles
Sources: OECD-STAN and INE-National Accounts. Source: Quadros de Pessoal.
0
1.000
2.000
3.000
4.000
5.000
6.000
7.000
8.000
1982 84 86 88 90 92 94 96 98 2000 02 04 06
Clothing - firmsClothing - establishmentsTextiles - firmsTextiles - establishments
Total number of firms/establishments Share in manufacturing exports
0
2
4
6
8
10
12
14
16
18
20
1982 84 86 88 90 92 94 96 98 2000 02 04 06
Per
cent
Clothing Textiles
Source: Quadros de Pessoal. Source: CHELEM.
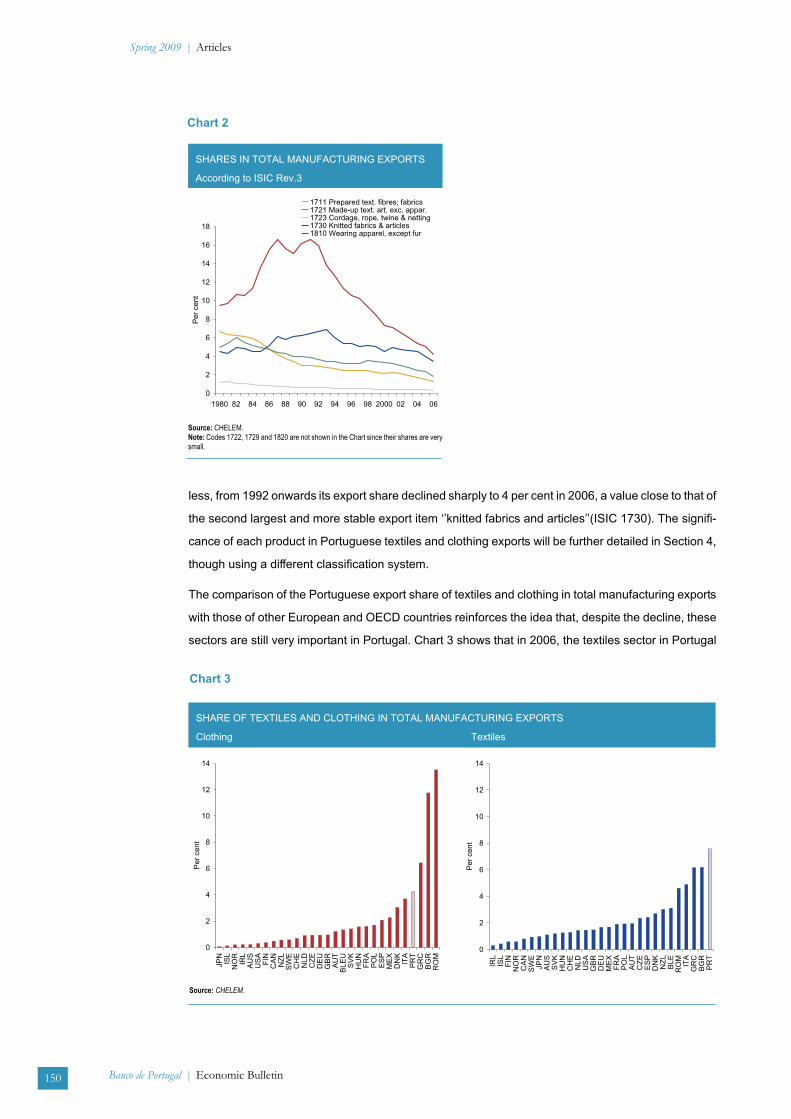
less, from 1992 onwards its export share declined sharply to 4 per cent in 2006, a value close to that of
the second largest and more stable export item ‘’knitted fabrics and articles’’(ISIC 1730). The signifi-
cance of each product in Portuguese textiles and clothing exports will be further detailed in Section 4,
though using a different classification system.
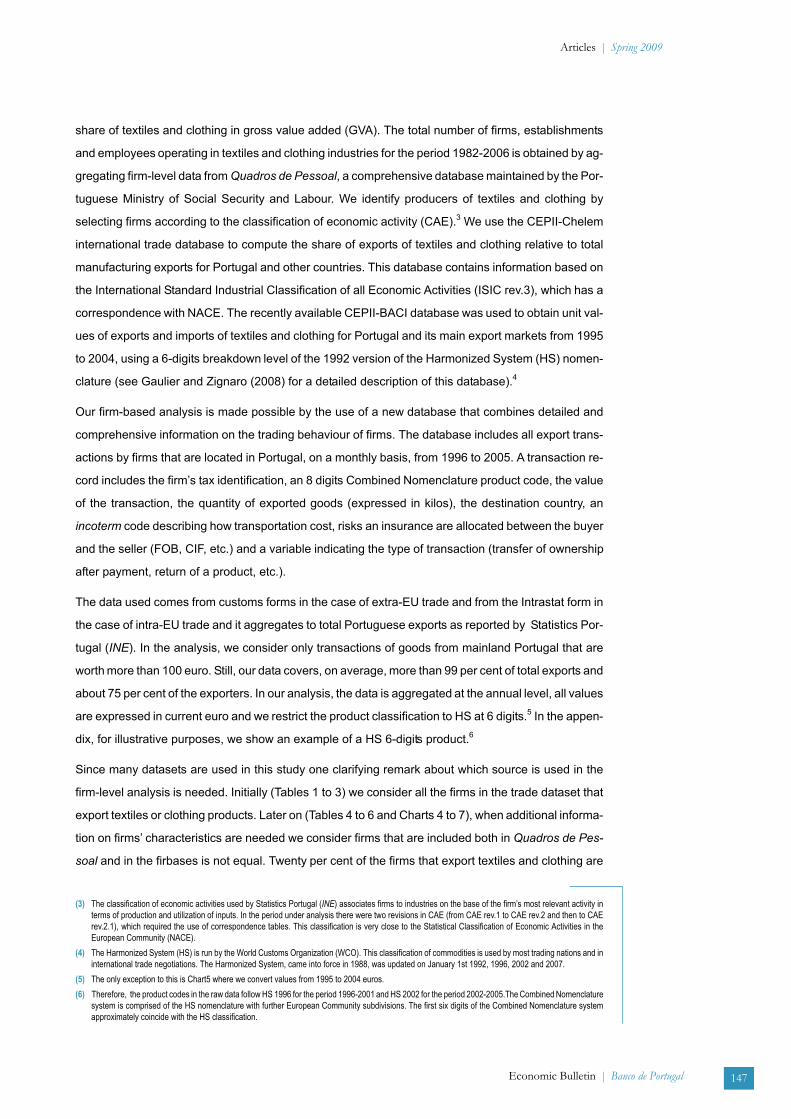
The comparison of the Portuguese export share of textiles and clothing in total manufacturing exports
with those of other European and OECD countries reinforces the idea that, despite the decline, these
sectors are still very important in Portugal. Chart 3 shows that in 2006, the textiles sector in Portugal
Banco de Portugal | Economic Bulletin
Spring 2009 | Articles
150
SHARE OF TEXTILES AND CLOTHING IN TOTAL MANUFACTURING EXPORTS
Clothing Textiles
0
2
4
6
8
10
12
14
JP
NIS
LN
OR
IRL
AU
SU
SA
FIN
CA
NN
ZL
SW
EC
HE
NL
DC
ZE
DE
UG
BR
AU
TB
LE
US
VK
HU
NF
RA
PO
LE
SP
ME
XD
NK
ITA
PR
TG
RC
BG
RR
OM
Per
cent
0
2
4
6
8
10
12
14
IRL
ISL
FIN
NO
RC
AN
SW
EJP
NA
US
SV
KH
UN
CH
EN
LD
US
AG
BR
DE
UM
EX
FR
AP
OL
AU
TC
ZE
ES
PD
NK
NZ
LB
LE
RO
MIT
AG
RC
BG
RP
RT
Per
cent
Source: CHELEM.
Chart 2
SHARES IN TOTAL MANUFACTURING EXPORTS
According to ISIC Rev.3
0
2
4
6
8
10
12
14
16
18
1980 82 84 86 88 90 92 94 96 98 2000 02 04 06
Per
cent
1711 Prepared text. fibres; fabrics1721 Made-up text. art. exc. appar.1723 Cordage, rope, twine & netting1730 Knitted fabrics & articles1810 Wearing apparel, except fur
Source: CHELEM.
Note: Codes 1722, 1729 and 1820 are not shown in the Chart since their shares are very
small.
Chart 3

had the highest share among the set of countries considered. As far as the clothing industry is consid-
ered, only three countries - Greece and, in particular, Bulgaria and Romania - had export shares higher
than those of Portugal.
4. FIRM-BASED ANALYSIS (1996-2005)
4.1. A portrait of textiles and clothing exporters
In this section we proceed with a description of the Portuguese textiles and clothing sectors using
firm-level data. In the first part of the section we adopt a product-focused analysis based on the HS no-
menclature used in the trade data. In the second part of the section instead we focus on the nature of
the firm, distinguishing in particular between producers and distributors on the basis of the CAE code
available in Quadros de Pessoal. Table 1 lists the 14 chapters of the HS 2002 classification related to
Section XI,’’Textiles and textile articles’’. It also reports, in parentheses, for each chapter, the number
of sub-headings (6-digits level) for which Portuguese exports are positive in 2005. Note that we refer to
chapters as ‘’industries’’ and to sub-headings as ‘’products’’. The table shows that Portuguese firms
export products belonging to all 14 ‘’Textiles and textile articles’’ industries. The highest number of ex-
ported products belongs to chapters ‘’52, cotton’’ (125 products), ‘’55, man-made staple fibres’’ (104
products), ‘’61, articles of apparel and clothing accessories, knitted or crocheted’’ (113 products) and
‘’62, articles of apparel and clothing accessories, not knitted or crocheted’’ (118 products). In the
appendix we describe more in detail the degree of disaggregation associated to each classification
level.
Table 2 reports some indicators of the relative importance of these industries. The second column
shows the share of each industry in total textiles and clothing exports. The three most important indus-
Economic Bulletin | Banco de Portugal
Articles | Spring 2009
151
Table 1
HARMONIZED SYSTEM 2-DIGITS INDUSTRIES AND NUMBER OF PRODUCTS EXPORTED IN 2005
HS 2-digits
code
Description No. of 6-digits
codes
50 Silk 5
51 Wool, fine or coarse animal hair; horsehair yarn and woven fabric 27
52 Cotton 125
53 Other vegetable textile fibres; paper yarn and woven fabrics of paper yarn 18
54 Man-made filaments 63
55 Man-made staple fibres 104
56 Wadding, felt and non-wovens; special yarns; twine, cordade, ropes and cables and articles thereof 32
57 Carpets and other textile floor coverings 22
58 Special woven fabrics; tufted textile fabrics; lace; tapestries; trimmings; embroidery 38
59 Impregnated, coated, covered or laminated textile fabrics; textile articles of a kind suitable for industrial use 18
60 Knitted or crocheted fabrics 18
61 Articles of apparel and clothing accessories, knitted or crocheted 113
62 Articles of apparel and clothing accessories, not knitted or crocheted 118
63 Other made-up textile articles; sets; worn clothing and worn textile article; rags 53
Sources: Trade data from INE. Classification: Harmonized System 1996 and 2002, authors ’ correspondence.

tries are ‘’61, articles of apparel and clothing accessories, knitted or crocheted’’, ‘’62, articles of apparel
and clothing accessories, not knitted or crocheted’’, and ‘’63, other made-up textile articles; sets; worn
clothing and worn textile articles; rags’’, accounting for about 42 per cent, 21 per cent and 16 per cent,
respectively of total textiles and textile articles exports in 2005. These three industries have always ac-
counted for the highest shares since 1996. In 1996, the share of chapter 62, ‘’not knitted or crocheted’’
products, was about 30 per cent, much higher than the current level, it declined steadily until 2002 and
stayed constant thereafter. The share of ‘’knitted or crocheted products’’ instead was stable at a level
below 40 per cent until 2002 and increased in the last 3 years. The third industry has remained more
stable throughout the sample period around a share of 15 per cent.
Column three of Table 2 lists, by industry, the number of firms that export at least one product in that in-
dustry. Some of these firms might be exporting a diversified range of textile products, spanning more
than one industry while others might export textile products that belong to one industry only. We call
‘’industry exporters’’ (see column four of Table 2) those whose exports of products belonging to the in-
dustry account for more than 30 per cent of their combined textiles and textile articles exports. These
are firms whose textile exports are considerably concentrated in the particular industry under consider-
ation. We call ‘’core exporters’’ those whose exports of products belonging to the industry account for
more than 30 per cent of their total exports. These are firms whose total exports are considerably con-
centrated in that specific textile industry. Column five of table 2 shows that while the majority of the
firms exporting products belonging to the two main industries (61 and 62) are ‘’core exporters’’ only
Banco de Portugal | Economic Bulletin
Spring 2009 | Articles
152
Table 2
SUMMARY STATISTICS, BY 2-DIGITS INDUSTRIES, 2005
Industry %
T&C export
No. of firms %
industry
exporters
%
core exporters
No. of
destinations
per industry firm
No. of products
per industry firm
50 0.02 28 0.25 0.18 1.4 1.3
51 2.15 106 0.27 0.23 4.1 3.2
52 4.07 407 0.34 0.26 3.1 4.3
53 0.1 94 0.17 0.00 2.0 1.3
54 1.48 288 0.3 0.18 2.1 1.8
55 3.53 281 0.35 0.21 2.8 2.6
56 3.56 279 0.55 0.14 2.4 1.7
57 1.61 310 0.56 0.23 1.7 1.6
58 1.39 425 0.26 0.15 2.2 1.6
59 2.27 226 0.56 0.11 2.2 1.4
60 1.13 268 0.21 0.17 1.9 1.7
61 41.73 1 734 0.77 0.66 3.2 5.7
62 21.24 1 362 0.63 0.50 2.4 7.1
63 15.72 1 098 0.69 0.38 2.6 2.9
Total/average 100 6 906 0.42 0.24 2.4 2.7
Sources: Trade data from INE. Classification: Harmonized System 1996 and 2002, authors ’ correspondence.
Notes: The second column shows industry export as a share of total export in the textiles and clothing sectors; the third column reports the number of firms that export at least one product
in the corresponding 2-digits sector; the fourth column shows the percentage of firms (in column three) whose exports of products in the corresponding 2-digits sector represent at least 30
percent of firm’s textile and clothing exports (industry exporters); the fifth column shows the percentage of firms (in column three) whose exports of products in the corresponding 2-digits
sector represent at least 30 percent of firm’s total exports (core exporters); the sixth column reports the average number of destinations reached by industry firms when selling products
within the corresponding 2-digits sector; similarly, column seven shows the average number of products exported. The last row reports totals for columns one and two and averages for
the other columns.

about one quarter of the firms exporting products in all textile industries are so. Finally, columns six and
seven of Table 2 show that, on average, firms export 2.7 products to 2.4 destinations in 2005.
Table 3 reports the top five destination markets for each industry and, in parentheses, the share of total
industry exports reaching each destination. The main export markets for textiles and clothing products
(especially when considering the three main export industries 61, 62 and 63) broadly correspond to the
main Portuguese overall export destinations: Spain, Germany, France, UK and US.
We complement the previous product-focused analysis with some information on the nature of export-
ing firms. There is a difference between the set of firms that report textiles and clothing exports and
those where such productions represent the core activity as defined by its CAE. Table 4 presents the
breakdown of textiles and clothing exporters according to its CAE in 1996, 1999, 2002 and 2005. The
relevant point to note is that, over this period, more than 20 per cent of textiles and clothing exporters
are firms whose main activity is retail or wholesale trade, representing nearly 10 per cent of total ex-
ports of these products. This is understandable as many firms recur to commercial agents to export
and, in some cases, exports might be re-exports of products manufactured in third countries. In addi-
tion, another 20 per cent of textiles and clothing exporters are firms whose main activity is not related
either with those activities or with retail-wholesale. However, the exports carried out by this group of
firms represent a small share of exports of textiles and clothing.
4.2 Participation in export markets and export intensity
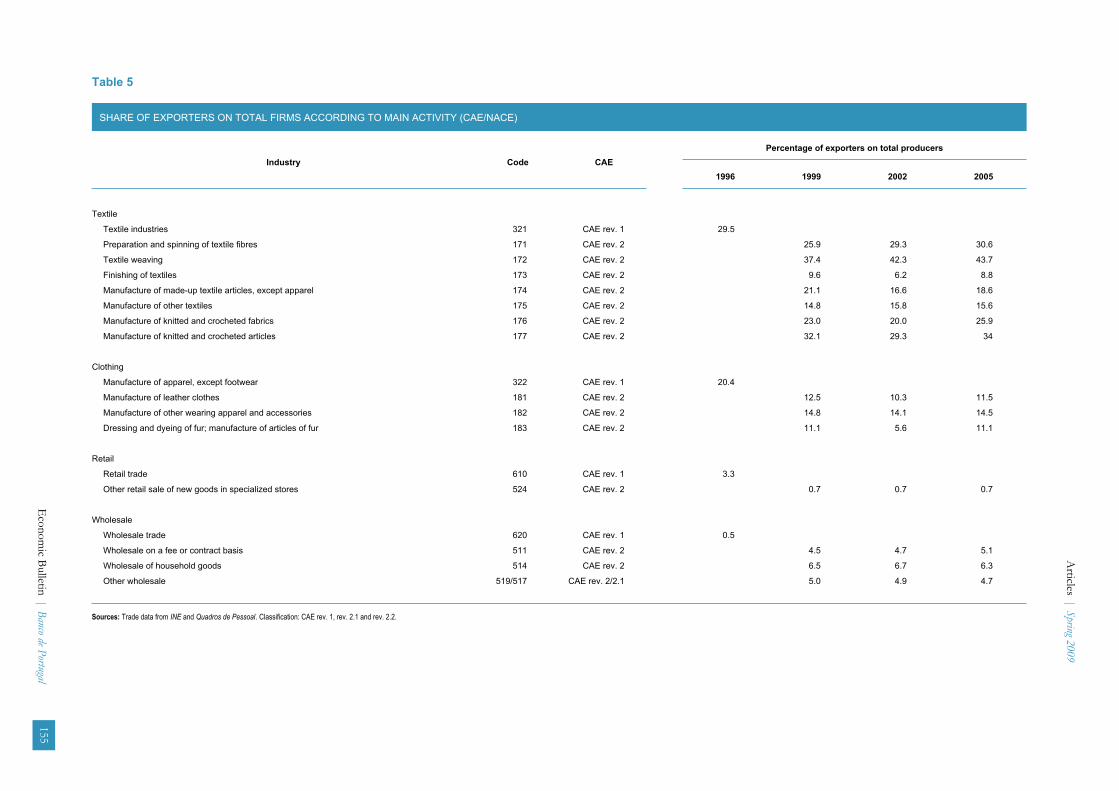
Table 5 reports the fraction of firms that export with respect to the total number of firms whose main ac-
tivity relates to textiles and clothing. The latter were identified by the CAE in Quadros de Pessoal while
the former were identified employing the firm-based trade dataset. The data reveals that the proportion
Economic Bulletin | Banco de Portugal
Articles | Spring 2009
153
Table 3
TOP 5 DESTINATIONS, BY 2 DIGITS INDUSTRIES, 2005
First Second Third Fourth Fifth
50 Spain (65.4) Germany (17.1) Angola (3.7) India (3.2) Hong Kong (2.2)
51 Germany (42.8) Spain (16.1) UK (9.4) Sweden (4.9) France (4.5)
52 Spain (20.4) Italy (12.7) France (10.5) Germany (10.3) USA (3.8)
53 Spain (21.1) Netherlands (16.2) Italy (15.2) Cape Verde (10.1) Germany (4.2)
54 Spain (30.1) Germany (12.7) France (12.4) UK (5.9) Netherlands (4.4)
55 Germany (20.2) Italy (15.5) Spain (12.7) France (8.0) UK (6.0)
56 Spain (16.1) France (13.9) Netherlands (11.6) UK (8.9) Germany (7.3)
57 UK (35.5) USA (17.5) Germany (11.2) Spain (9.4) France (6.8)
58 Spain (25.7) Czech Republic (11.4) UK (8.3) France (7.6) Sweden (6.9)
59 Germany (39.4) Spain (13.9) France (5.7) Czech Republic (4.2) Belgium+Luxembourg (4.1)
60 Spain (25.7) France (16.1) Finland (9.8) Belgium+Luxembourg (8.2) UK (7.5)
61 Spain (27.1) France (15.5) UK (15.4) Germany (12.2) Italy (5.6)
62 Spain (36.5) UK (16.4) France (13.4) Germany (6.3) Italy (3.4)
63 USA (25.2) Spain (16.8) UK (13.9) France (13.6) Germany (5.3)
Sources: Trade data from INE. Classification: Harmonized System 1996 and 2002, authors ’ correspondence.

154
Spring2009
|A
rticle
s
Banco
dePortugal|
Eco
no
mic
Bulle
tin
Table 4
DISTRIBUTION OF EXPORTERS OF TEXTILES AND CLOTHING ACCORDING TO MAIN ACTIVITY (CAE/NACE)
1996 1999 2002 2005
Industry Code CAE Number of
firms
% of
firms
% of total
exports
Number of
firms
% of
firms
% of total
exports
Number of
firms
% of
firms
% of total
exports
Number of
firms
% of
firms
% of total
exports
Textile
Textile industries 321 CAE rev. 1 619 24.3 44.8
Preparation and spinning of textile fibres 171 CAE rev. 2 57 2.0 4.3 46 1.6 2.1 30 0.9 2.1
Textile weaving 172 CAE rev. 2 91 3.2 12.1 83 2.9 12.7 100 3.2 12.8
Finishing of textiles 173 CAE rev. 2 26 0.9 1.3 17 0.6 1.6 26 0.8 1.4
Manufacture of made-up textile articles, except apparel 174 CAE rev. 2 92 3.3 7.1 84 2.9 5.9 115 3.6 7.5
Manufacture of other textiles 175 CAE rev. 2 127 4.5 7.2 131 4.5 8.7 131 4.1 9.8
Manufacture of knitted and crocheted fabrics 176 CAE rev. 2 63 2.2 3.6 54 1.9 2.4 66 2.1 4.5
Manufacture of knitted and crocheted articles 177 CAE rev. 2 223 7.9 9.1 191 6.6 8.7 213 6.7 11.1
Clothing
Manufacture of apparel, except footwear 322 CAE rev. 1 774 30.4 39.8
Manufacture of leather clothes 181 CAE rev. 2 6 0.2 0.0 6 0.2 0.0 6 0.2 0.0
Manufacture of other wearing apparel and accessories 182 CAE rev. 2 946 33.6 41.3 855 29.5 41.2 820 25.8 38.1
Dressing and dyeing of fur; manufacture of articles of fur 183 CAE rev. 2 3 0.1 0.2 2 0.1 0.4 3 0.1 0.3
Retail
Retail trade 610 CAE rev. 1 437 17.2 7.7
Other retail sale of new goods in specialized stores 524 CAE rev. 2 188 6.7 1.6 220 7.6 0.6 234 7.4 0.6
Wholesale
Wholesale trade 620 CAE rev. 1 180 7.1 2.0
Wholesale on a fee or contract basis 511 CAE rev. 2 67 2.4 0.7 80 2.8 1.7 141 4.4 2.4
Wholesale of household goods 514 CAE rev. 2 328 11.7 7.2 400 13.8 7.3 448 14.1 7.6
Other wholesale 519/517 CAE rev. 2/2.1 88 3.1 0.4 110 3.8 0.3 109 3.4 0.3
Other sectors 537 21.1 5.7 511 18.1 3.8 616 21.3 6.4 733 23.1 1.6
Total 2 547 100.0 100.0 2 816 100.0 100.0 2 895 100.0 100.0 3 175 100.0 100.0
Sources: Trade data from INE and Quadros de Pessoal. Classification: CAE rev. 1, rev. 2.1 and rev. 2.2.
Artic
les
|Spring
2009
Eco
no
mic
Bulle
tin|
Banco
dePortugal155
Table 5
SHARE OF EXPORTERS ON TOTAL FIRMS ACCORDING TO MAIN ACTIVITY (CAE/NACE)
Industry Code CAE
Percentage of exporters on total producers
1996 1999 2002 2005
Textile
Textile industries 321 CAE rev. 1 29.5
Preparation and spinning of textile fibres 171 CAE rev. 2 25.9 29.3 30.6
Textile weaving 172 CAE rev. 2 37.4 42.3 43.7
Finishing of textiles 173 CAE rev. 2 9.6 6.2 8.8
Manufacture of made-up textile articles, except apparel 174 CAE rev. 2 21.1 16.6 18.6
Manufacture of other textiles 175 CAE rev. 2 14.8 15.8 15.6
Manufacture of knitted and crocheted fabrics 176 CAE rev. 2 23.0 20.0 25.9
Manufacture of knitted and crocheted articles 177 CAE rev. 2 32.1 29.3 34
Clothing
Manufacture of apparel, except footwear 322 CAE rev. 1 20.4
Manufacture of leather clothes 181 CAE rev. 2 12.5 10.3 11.5
Manufacture of other wearing apparel and accessories 182 CAE rev. 2 14.8 14.1 14.5
Dressing and dyeing of fur; manufacture of articles of fur 183 CAE rev. 2 11.1 5.6 11.1
Retail
Retail trade 610 CAE rev. 1 3.3
Other retail sale of new goods in specialized stores 524 CAE rev. 2 0.7 0.7 0.7
Wholesale
Wholesale trade 620 CAE rev. 1 0.5
Wholesale on a fee or contract basis 511 CAE rev. 2 4.5 4.7 5.1
Wholesale of household goods 514 CAE rev. 2 6.5 6.7 6.3
Other wholesale 519/517 CAE rev. 2/2.1 5.0 4.9 4.7
Sources: Trade data from INE and Quadros de Pessoal. Classification: CAE rev. 1, rev. 2.1 and rev. 2.2.

of exporters is relatively low.7
‘’Textile weaving’’ and ‘’Manufacture of knitted and crocheted articles’’ re-
cord the highest shares of exporters with average figures around 40 and 30 per cent, respectively, in
the years 1999, 2002 and 2005. In general, low shares of exporters do not necessarily mean that only a
minority of firms contribute to the value of textiles and clothing exports. Many firms may produce inter-
mediate goods that are posteriorly incorporated in other domestic industries (including, naturally, tex-
tiles and clothing), whose final goods are exported. In addition, some firms may recur to trade agents to
export, while others may be subsidiaries and suppliers of exporting firms.
Exporters are quite heterogeneous in terms of the fraction of production sold in foreign markets.8
Chart
4 plots the Epanechnikov estimated kernel density of the export intensity (the ratio between firm’s ex-
ports and total sales) for 1996 and 2004 for textiles and clothing producers.9
The shape of the export
intensity probability density is similar in the two sectors. In both sectors the density is bimodal. In the
clothing sector, a substantial share of the density is associated to export intensities between 60 and
100 per cent, meaning that many firms are strongly export oriented. However, from 1996 to 2004, the
distribution clearly shifted to the left implying an increase in the share of firms with low export intensity.
In the textile sector a high share of the density is also associated to firms with high export intensity,
even though it is substantially lower than in clothing. Nevertheless, in 2004 relatively more firms pres-
ent lower export intensities. Overall, the distributions reveal that, both in textiles and clothing, there is
more density in lower export intensities in 2004 relatively to 1996.
Banco de Portugal | Economic Bulletin
Spring 2009 | Articles
156
Chart 4
EXPORT INTENSITY OF PORTUGUESE EXPORTERS
Clothing Textiles
Source: Authors’ calculations.
Note: In these (and the following) estimated kernel densities, the integral is lower than one because the method attributes some density to values outside the relevant interval presented in
the figure. Overall results are not qualitatively affected by the use of this methodology.
(7) Other studies (e.g., Bernard et al. (2003)) have shown that the fraction of firms that export is generally low.888888888888888877777777777777
(8) See, among others, Bernard et al.(2003).999999999999999988888888888888
(9) In Quadros de Pessoal firm’s total sales refer to the previous year, thus the last year available in our sample is 2004.1010101010101010101010101010101099999999999999
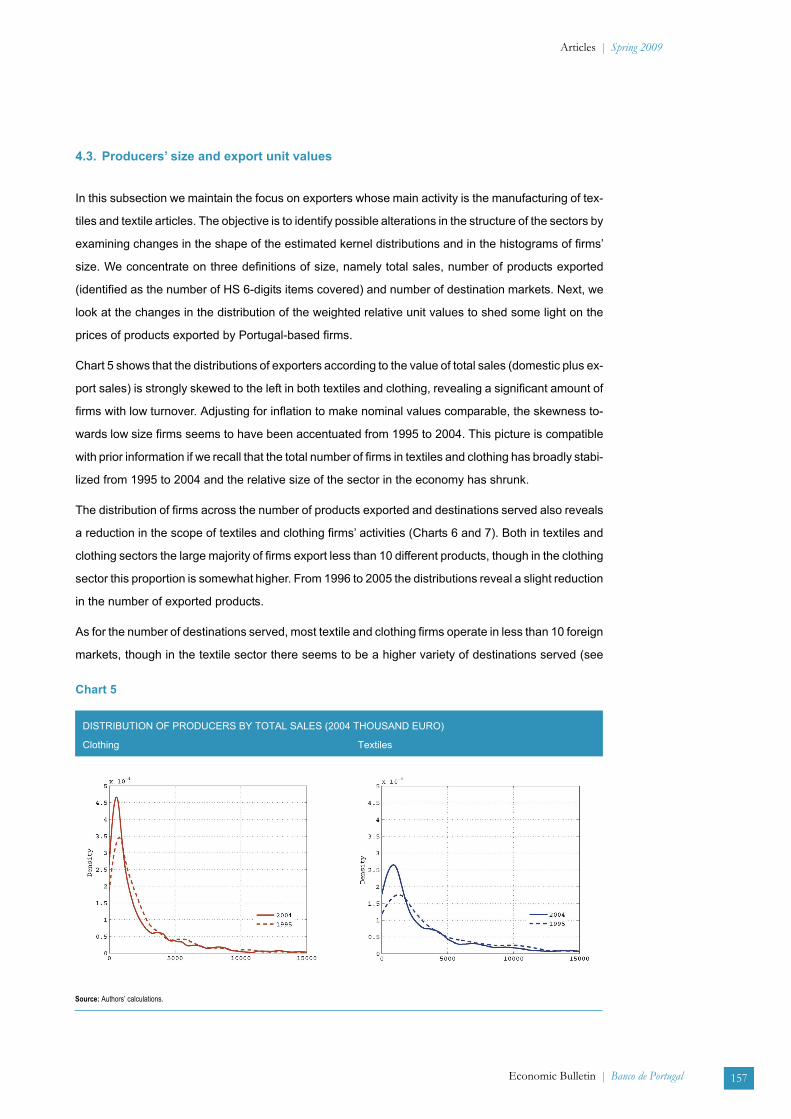
4.3. Producers’ size and export unit values
In this subsection we maintain the focus on exporters whose main activity is the manufacturing of tex-
tiles and textile articles. The objective is to identify possible alterations in the structure of the sectors by
examining changes in the shape of the estimated kernel distributions and in the histograms of firms’
size. We concentrate on three definitions of size, namely total sales, number of products exported
(identified as the number of HS 6-digits items covered) and number of destination markets. Next, we
look at the changes in the distribution of the weighted relative unit values to shed some light on the
prices of products exported by Portugal-based firms.
Chart 5 shows that the distributions of exporters according to the value of total sales (domestic plus ex-
port sales) is strongly skewed to the left in both textiles and clothing, revealing a significant amount of
firms with low turnover. Adjusting for inflation to make nominal values comparable, the skewness to-
wards low size firms seems to have been accentuated from 1995 to 2004. This picture is compatible
with prior information if we recall that the total number of firms in textiles and clothing has broadly stabi-
lized from 1995 to 2004 and the relative size of the sector in the economy has shrunk.
The distribution of firms across the number of products exported and destinations served also reveals
a reduction in the scope of textiles and clothing firms’ activities (Charts 6 and 7). Both in textiles and
clothing sectors the large majority of firms export less than 10 different products, though in the clothing
sector this proportion is somewhat higher. From 1996 to 2005 the distributions reveal a slight reduction
in the number of exported products.
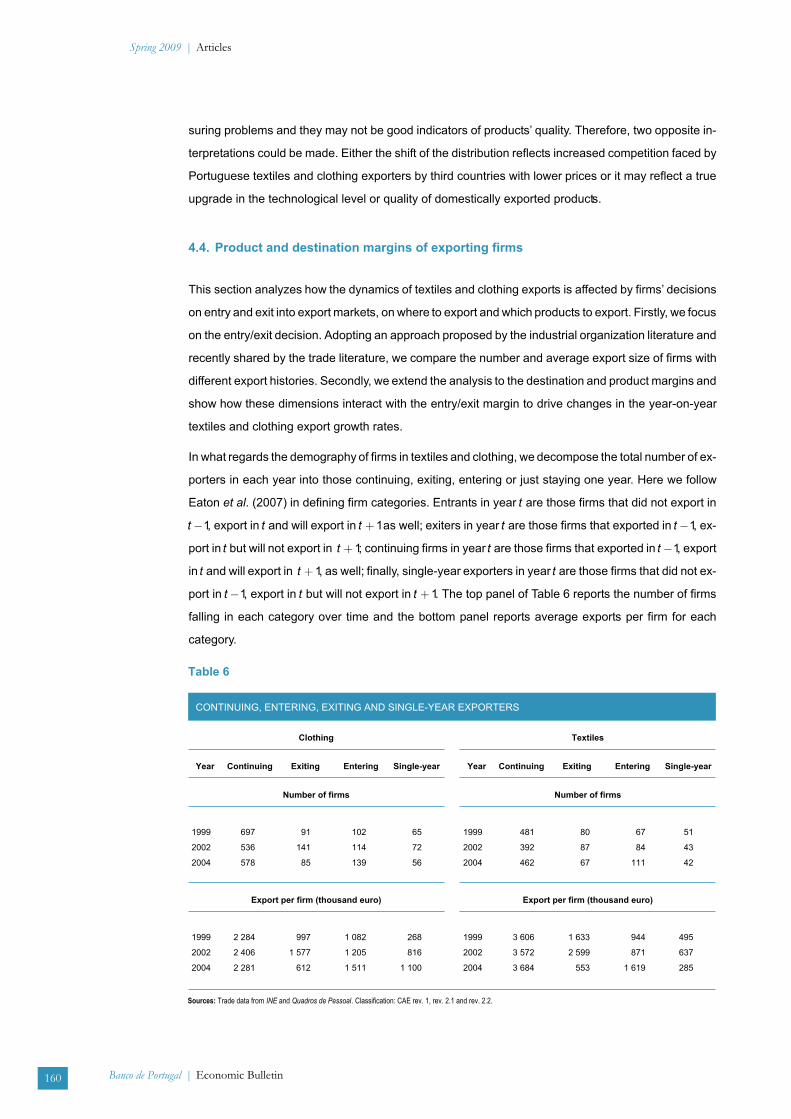
As for the number of destinations served, most textile and clothing firms operate in less than 10 foreign
markets, though in the textile sector there seems to be a higher variety of destinations served (see
Economic Bulletin | Banco de Portugal
Articles | Spring 2009
157
Chart 5
DISTRIBUTION OF PRODUCERS BY TOTAL SALES (2004 THOUSAND EURO)
Clothing Textiles
Source: Authors’ calculations.
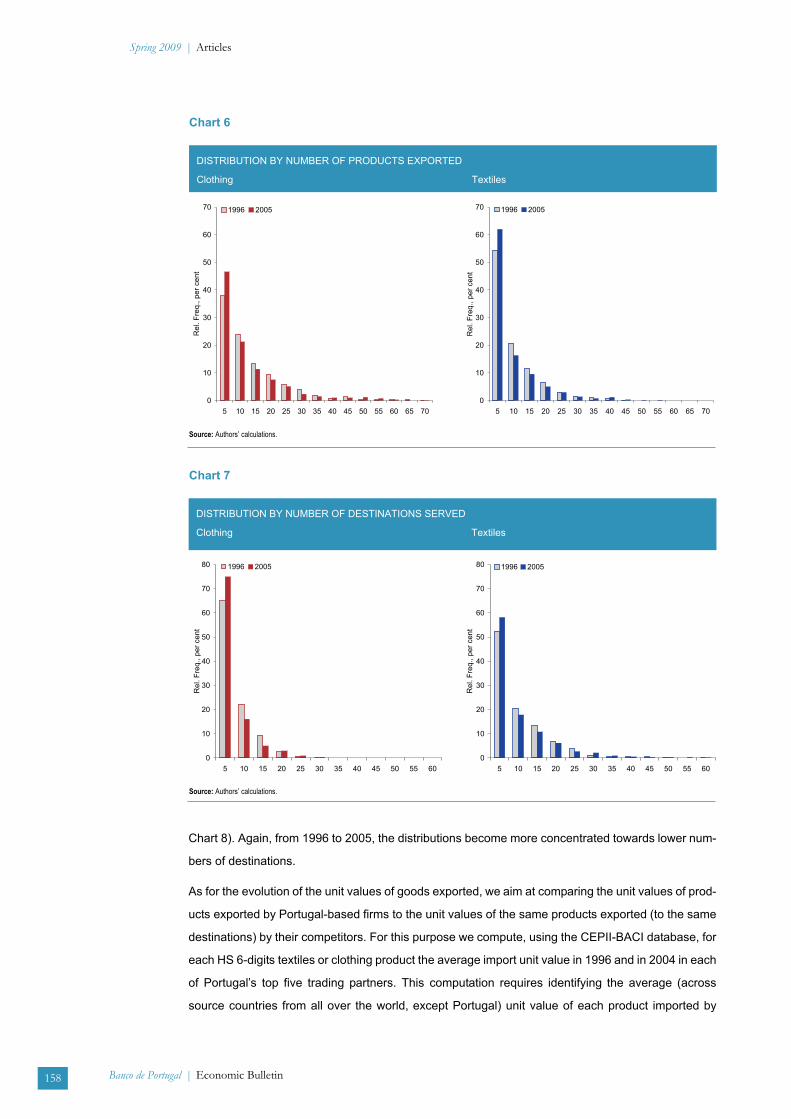
Chart 8). Again, from 1996 to 2005, the distributions become more concentrated towards lower num-
bers of destinations.
As for the evolution of the unit values of goods exported, we aim at comparing the unit values of prod-
ucts exported by Portugal-based firms to the unit values of the same products exported (to the same
destinations) by their competitors. For this purpose we compute, using the CEPII-BACI database, for
each HS 6-digits textiles or clothing product the average import unit value in 1996 and in 2004 in each
of Portugal’s top five trading partners. This computation requires identifying the average (across
source countries from all over the world, except Portugal) unit value of each product imported by
Banco de Portugal | Economic Bulletin
Spring 2009 | Articles
158
Chart 6
DISTRIBUTION BY NUMBER OF PRODUCTS EXPORTED
Clothing Textiles
0
10
20
30
40
50
60
70
5 10 15 20 25 30 35 40 45 50 55 60 65 70
Re
l.F
req
.,p
er
ce
nt
1996 2005
0
10
20
30
40
50
60
70
5 10 15 20 25 30 35 40 45 50 55 60 65 70
Re
l.F
req
.,p
er
ce
nt
1996 2005
Source: Authors’ calculations.
Chart 7
DISTRIBUTION BY NUMBER OF DESTINATIONS SERVED
Clothing Textiles
Source: Authors’ calculations.
0
10
20
30
40
50
60
70
80
5 10 15 20 25 30 35 40 45 50 55 60
Re
l.F
req
.,p
er
ce
nt
1996 2005
0
10
20
30
40
50
60
70
80
5 10 15 20 25 30 35 40 45 50 55 60
Re
l.F
req
.,p
er
ce
nt
1996 2005

Spain, Germany, France, United Kingdom and the United States of America. Then, this weighted prod-
uct (FOB) import unit value for each Portuguese main partner is compared with the corresponding Por-
tuguese product (FOB) export unit value. Finally, for each product, the relative unit value is averaged
across the five main partners considered using as weights their shares in Portugal’s textiles and cloth-
ing exports. We now describe more formally the procedure used to construct this relative price.
Consider exports of productk by country i to country j in year t . Let � �u k tij , be the average unit value
charged in this trade flow. Let � �w i k tIj , , be the share of country i in total imports of productk made by
country j in year t and � �w j k tE PT, , , be the share of country j in total exports of product k made by
Portugal in year t. The weighted unit value of product k imported in market j at time t, excluding
Portugal, is:
� � � � � �� �u k t u k t w i k tj ij Ij
i PT
, , . , ,��
�(1)
where j J ES DE FR UK US� � , , , , . The second step consists in dividing the unit value charged by
Portuguese exporters for productk to destination j u k tPTj, ( , ), by the average unit value in destination
j as above and taking a weighted average across the five main partners:
� �� �
� �� �u k t
u k t
u k tw j k t
PTj
j
E PT
j J
,,
,. , , .,�
�
���
�
�
����
� (2)
Chart 8 shows the distribution (alongk) of the relative unit value index � �u k t, in equation 2 for t � 1996
and t � 2004. In both years, the mode of the distribution is around one both in textiles and clothing,
meaning that the unit value of Portuguese exports is generally close to the unit values of their competi-
tors. Nevertheless, from 1996 to 2004, there appears to be a shift towards higher relative unit values,
especially in the clothing sector. It is acknowledged that unit values are plagued by statistical and mea-
Economic Bulletin | Banco de Portugal
Articles | Spring 2009
159
Chart 8
DISTRIBUTION OF EXPORT RELATIVE UNIT VALUES
ClothingTextiles
Source: Authors’ calculations.
suring problems and they may not be good indicators of products’ quality. Therefore, two opposite in-
terpretations could be made. Either the shift of the distribution reflects increased competition faced by
Portuguese textiles and clothing exporters by third countries with lower prices or it may reflect a true
upgrade in the technological level or quality of domestically exported products.
4.4. Product and destination margins of exporting firms
This section analyzes how the dynamics of textiles and clothing exports is affected by firms’ decisions
on entry and exit into export markets, on where to export and which products to export. Firstly, we focus
on the entry/exit decision. Adopting an approach proposed by the industrial organization literature and
recently shared by the trade literature, we compare the number and average export size of firms with
different export histories. Secondly, we extend the analysis to the destination and product margins and
show how these dimensions interact with the entry/exit margin to drive changes in the year-on-year
textiles and clothing export growth rates.
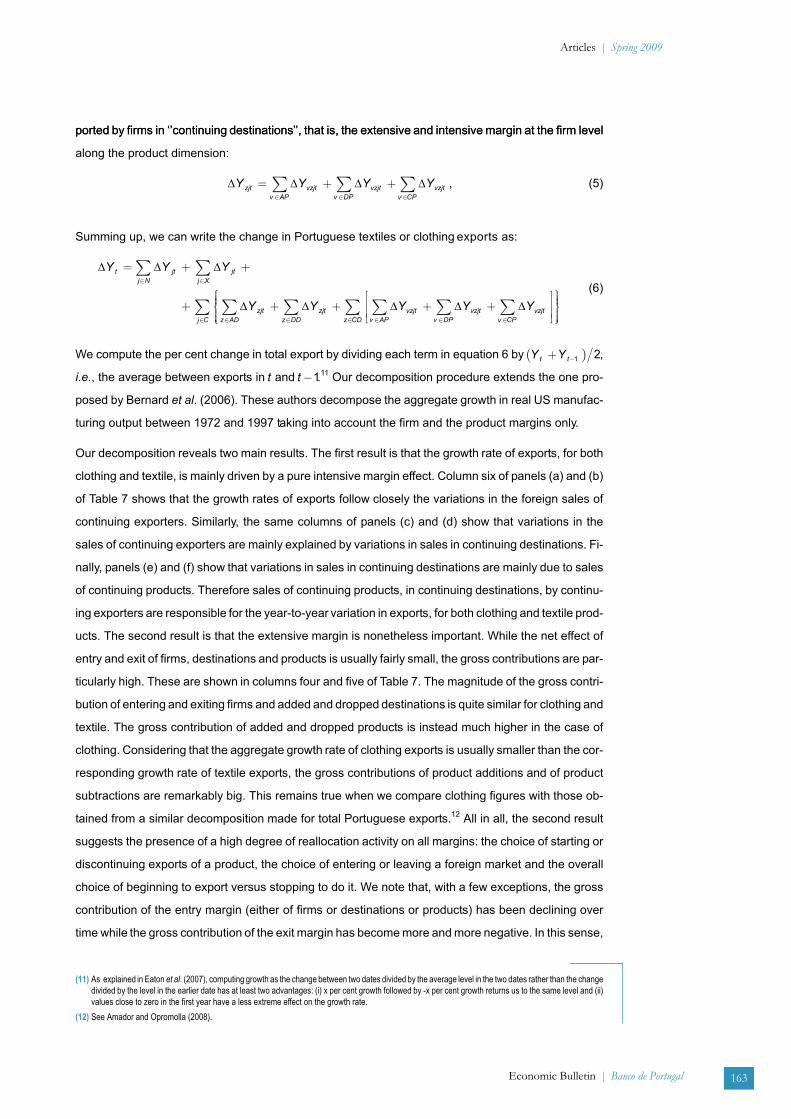
In what regards the demography of firms in textiles and clothing, we decompose the total number of ex-
porters in each year into those continuing, exiting, entering or just staying one year. Here we follow
Eaton et al. (2007) in defining firm categories. Entrants in year t are those firms that did not export in
t �1, export in t and will export in t � 1as well; exiters in year t are those firms that exported in t �1, ex-
port in t but will not export in t � 1; continuing firms in year t are those firms that exported in t �1, export
in t and will export in t � 1, as well; finally, single-year exporters in year t are those firms that did not ex-
port in t �1, export in t but will not export in t � 1. The top panel of Table 6 reports the number of firms
falling in each category over time and the bottom panel reports average exports per firm for each
category.
Banco de Portugal | Economic Bulletin
Spring 2009 | Articles
160
Table 6
CONTINUING, ENTERING, EXITING AND SINGLE-YEAR EXPORTERS
Clothing Textiles
Year Continuing Exiting Entering Single-year Year Continuing Exiting Entering Single-year
Number of firms Number of firms
1999 697 91 102 65 1999 481 80 67 51
2002 536 141 114 72 2002 392 87 84 43
2004 578 85 139 56 2004 462 67 111 42
Export per firm (thousand euro) Export per firm (thousand euro)
1999 2 284 997 1 082 268 1999 3 606 1 633 944 495
2002 2 406 1 577 1 205 816 2002 3 572 2 599 871 637
2004 2 281 612 1 511 1 100 2004 3 684 553 1 619 285
Sources: Trade data from INE and Quadros de Pessoal. Classification: CAE rev. 1, rev. 2.1 and rev. 2.2.

Results show that more than two thirds of the firms are continuing exporters, single year firms repre-
sent less than 10 per cent of the total and the gross number of entering and exiting exporters is slightly
higher than 10 per cent. Continuing exporters account for about 90 per cent of total exports in the cloth-
ing and textiles sectors. In contrast, to what happens in the total economy (see Amador and Opromolla
(2008)) there are relatively less single year exporters but their relative size is bigger, especially in cloth-
ing where there is a clear upward trend. Entering and exiting firms in these sectors, like in the overall
economy, are on average smaller, in terms of exports per firm, than incumbents.10
In the remaining part of this section we study more in detail the evolution of textiles and clothing exports
over time, considering the firm, destination and product margins. In Section 3, panel (d) of Chart 1
shows the evolution of textile and clothing exports as a share of total manufacturing exports. The cloth-
ing share has been decreasing continuously since 1992, while the textile share remained fairly stable
from 1994 to 2001, but then declined sharply. Column two of panel (a) of Table 7 reveals that the drop
in clothing exports as a share of Portuguese manufacturing exports is due, in part, to an actual de-
crease in the exports of clothing products. In fact, the value of exports has been decreasing at progres-
sively higher rates throughout the 1997-2005 period. Column two of panel (b) of Table 7 shows that
textiles’ exports as a share of Portuguese total manufacturing exports were fairly stable in the
1997-2002 period thanks to an actual rise in the exports of textile products. The decline that occurs
later on is due, in part, to an actual drop in the exports of these products. In the remaining columns of
Table 7 we decompose the nominal growth rate of exports of clothing and textile into three dimensions:
firms, destinations and products. More specifically, we consider three types of firms’ decisions: the de-
cision to entry/stay/exit in export markets, the decision of where to export and the decision of what to
export. We start by decomposing the total nominal export growth in the contribution of ‘’entering’’, ‘’exit-
ing’’ and ‘’continuing’’ exporters, that is, in the extensive and intensive margins at the aggregate level
along the firm dimension (firms indexed by j ):
� � � �Y Y Y Yt jt
j N
jt
j X
jt
j C
� � �� � �
� � � , (3)
where �Y t is the change in exports from year t �1to year t, N is the set of entering exporters, X is the
set of exiting exporters and C is the set of continuing exporters. The next step is to break down the
change in exports of continuing exporters into ‘’added destinations’’ ( )AD , ‘’dropped destinations’’
( )DD and ‘’continuing destinations’’( )CD , that is, in the extensive and intensive margin at the firm level
along the destination dimension. At each continuing exporter, export growth can be further
decomposed as:
� � � �Y Y Y Yjt zjt
z AD
zjt
z DD
zjt
z CD
� � �� � �
� � � , (4)
Finally, we consider the product that firms choose to export in ‘’continuing’’ destinations. We distin-
guish among ‘’added products’’ ( )AP , ‘’dropped products’’ ( )DP and ‘’continuing products’’ ( )CP ex-
Economic Bulletin | Banco de Portugal
Articles | Spring 2009
161
(10) Nevertheless, the size of exiters in the textiles sector in 2002 was quite high.1111111111111111111111111111111010101010101010101010101010

162
Spring2009
|A
rticle
s
Banco
dePortugal|
Eco
no
mic
Bulle
tin
Table 7
DECOMPOSING AGGREGATE NOMINAL EXPORT GROWTH
(a) Aggregate and Firms (b) Aggregate and Firms
Year Aggregate Exit+Entry Exit Entry Continuing Year Aggregate Exit+Entry Exit Entry Continuing
1997-1999 -1.6 0.4 -1.9 2.2 -1.9 1997-1999 7.1 1.4 -1.2 2.6 5.7
2000-2002 -4.6 -0.4 -2.7 2.3 -4.1 2000-2002 5.0 0.8 -1.6 2.4 4.2
2003-2005 -6.6 1.3 -3.5 4.8 -7.9 2003-2005 -8.9 0.6 -1.9 2.5 -9.4
(c) Destinations (d) Destinations
Year cont. (a) Dropped+Added Dropped Added Continuing Year cont. (b) Dropped+Added Dropped Added Continuing
1997-1999 -1.9 -0.1 -2.8 2.7 -1.8 1997-1999 5.7 0.3 -2.8 3.2 5.3
2000-2002 -4.1 -0.1 -3.0 2.9 -3.9 2000-2002 4.2 0.5 -2.8 3.3 3.7
2003-2005 -7.9 -1.8 -4.0 2.2 -6.1 2003-2005 -9.4 -2.7 -5.5 2.7 -6.7
(e) Products (f) Products
Year cont. (c) Dropped+Added Dropped Added Continuing Year cont. (c) Dropped+Added Dropped Added Continuing
1997-1999 -1.8 -0.1 -9.0 9.0 -1.8 1997-1999 5.3 0.9 -4.4 5.3 4.5
2000-2002 -3.9 -0.5 -9.0 8.5 -3.6 2000-2002 3.7 0.5 -4.1 4.6 3.2
2003-2005 -6.1 0.0 -9.0 8.9 -6.0 2003-2005 -6.7 0.0 -4.7 4.7 -6.6
Clothing Textiles
Sources: Trade data from INE. Classification: Harmonized System 1996 and 2002, authors ’ correspondence.
ported by firms in ‘’continuing destinations’’, that is, the extensive and intensive margin at the firm levelported by firms in ‘’continuing destinations’’, that is, the extensive and intensive margin at the firm level
along the product dimension:
� � � �Y Y Y Yzjt vzjt
v AP
vzjt
v DP
vzjt
v CP
� � �� � �
� � � , (5)
Summing up, we can write the change in Portuguese textiles or clothing exports as:
� � �
� � �
Y Y Y
Y Y Y
t jt
j N
jt
j X
zjt
z AD
zjt
z DD
vzj
� � �
� � �
� �
� �
� �
� � t
v AP
vzjt
v DP
vzjt
v CPz CD
Y Y� � ��
� � �� � �
���
�
���
����
���� �
����
����
�j C
(6)
We compute the per cent change in total export by dividing each term in equation 6 by � �Y Yt t� �1 2,
i.e., the average between exports in t and t �1.11
Our decomposition procedure extends the one pro-
posed by Bernard et al. (2006). These authors decompose the aggregate growth in real US manufac-
turing output between 1972 and 1997 taking into account the firm and the product margins only.
Our decomposition reveals two main results. The first result is that the growth rate of exports, for both
clothing and textile, is mainly driven by a pure intensive margin effect. Column six of panels (a) and (b)
of Table 7 shows that the growth rates of exports follow closely the variations in the foreign sales of
continuing exporters. Similarly, the same columns of panels (c) and (d) show that variations in the
sales of continuing exporters are mainly explained by variations in sales in continuing destinations. Fi-
nally, panels (e) and (f) show that variations in sales in continuing destinations are mainly due to sales
of continuing products. Therefore sales of continuing products, in continuing destinations, by continu-
ing exporters are responsible for the year-to-year variation in exports, for both clothing and textile prod-
ucts. The second result is that the extensive margin is nonetheless important. While the net effect of
entry and exit of firms, destinations and products is usually fairly small, the gross contributions are par-
ticularly high. These are shown in columns four and five of Table 7. The magnitude of the gross contri-
bution of entering and exiting firms and added and dropped destinations is quite similar for clothing and
textile. The gross contribution of added and dropped products is instead much higher in the case of
clothing. Considering that the aggregate growth rate of clothing exports is usually smaller than the cor-
responding growth rate of textile exports, the gross contributions of product additions and of product
subtractions are remarkably big. This remains true when we compare clothing figures with those ob-
tained from a similar decomposition made for total Portuguese exports.12
All in all, the second result
suggests the presence of a high degree of reallocation activity on all margins: the choice of starting or
discontinuing exports of a product, the choice of entering or leaving a foreign market and the overall
choice of beginning to export versus stopping to do it. We note that, with a few exceptions, the gross
contribution of the entry margin (either of firms or destinations or products) has been declining over
time while the gross contribution of the exit margin has become more and more negative. In this sense,
Economic Bulletin | Banco de Portugal
Articles | Spring 2009
163
(11) As explained in Eaton et al. (2007), computing growth as the change between two dates divided by the average level in the two dates rather than the change
divided by the level in the earlier date has at least two advantages: (i) x per cent growth followed by -x per cent growth returns us to the same level and (ii)
values close to zero in the first year have a less extreme effect on the growth rate.12121212121212121212121212121111111111111111111111111111
(12) See Amador and Opromolla (2008).13131313131313131313131313131212121212121212121212121212
the extensive margin, even if less substantially than the intensive margin, has also contributed to the
overall decline of textile and clothing export sales.
5. CONCLUDING REMARKS
Textiles and clothing have been sectors subject to significant shocks in the last two decades, mainly
associated with increased international trade liberalization. In this context, Portugal has been identi-
fied as one of the most affected countries in the European Union. An aggregate analysis of the main in-
dicators in the last two decades reveals that the relative importance of these sectors has been
decreasing in the Portuguese economy. Although there was an expansion of the clothing industry until
the beginning of the nineties, a sharp decline followed until recently. The textiles sector instead
presented a progressive decline since the eighties.
The structure of the Portuguese textiles and clothing sectors is based on small-medium firms, the
share of exporters is relatively small and its average export intensity is medium. The analysis of
firm-level data reveals some reduction in its average dimension from 1996 to 2005. This reduction is
visible along several dimensions, namely sales, number of products and number of destinations
served.
As for the evolution of product export unit values, considering the five main Portuguese textiles and
clothing destination markets in 1996 and 2004, we observe an increase in the proportion of national
products whose export unit value is higher than the corresponding average import unit value in the re-
ferred markets, particularly in the clothing sector.
Finally, the breakdown of the growth rate of nominal exports of textiles and clothing reveals that the
change in exports due to the net entry of exporters (the firm extensive margin) is much smaller than the
change due to the variation in the sales of continuing exporters (firm intensive margin). In addition, the
gross contributions of entry and exit of firms, destinations and products are relatively large, especially
in the clothing sector. This suggests the presence of a high degree of reallocation activity along all
margins: firms, destinations and products.
Banco de Portugal | Economic Bulletin
Spring 2009 | Articles
164
REFERENCES
Amador, J. and Cabral, S. (2008), “O desempenho das exportações portuguesas em perspectiva:
uma análise de quota de mercado constante”, Boletim económico - Outono.
Amador, J., Cabral, S. and Maria, J. R. (2007), “International trade patterns in the last four decades:
How does Portugal compare with other cohesion countries?”, Banco de Portugal, Working
Paper 14-2007.
Amador, J. and Opromolla, L. D. (2008), “Product and destination mix in export markets”, Banco de
Portugal, Working Paper 17-2008.
Bernard, A. B., Eaton, J., Jensen, J. B. and Kortum, S. (2003), “Plants and productivity in international
trade”, American Economic Review 93(4), pp. 1268–1290.
Bernard, A. B., Redding, S. J. and Schott, P. K. (2006), “Multi-product firms and product switching”,
NBER Working Paper 12293, National Bureau of Economic Research.
Eaton, J., Eslava, M., Kugler, M. and Tybout, J. (2007), Export dynamics in Colombia: Firm-level
evidence, NBER Working Paper 13531, National Bureau of Economic Research.
Fox, A., Powers, W. and Winston, A. (2008), “The happy few: The internationalisation of European
firms”, Journal of Economic Integration 23(3), 656–684.
Francois, J., Manchin, M., Norberg, H. and Spinanger, D. (2007), “Impacts of textiles and clothing
sectors liberalization on prices”, Report, The Kiel Institute for the World Economy, Germany.
Gaulier, G. and Zignago, S. (2008), “BACI: A world database of international trade at the
product-level”, Working papers, CEPII Research Centre.
Hanzl-Wei�, D. (2004), “Enlargement and the textiles, clothing and footwear industry”, World
Economy 27(6), 923–945.
Monfort, P., Vandenbussche, H. and Forlani, E. (2008), “Chinese competition and skillupgrading in
european textiles: firm-level evidence”, Discussion Paper 198-2008, LICOS Centre for
Institutions and Economic Performance.
Nordäs, H. K. (2004), “The global textile and clothing industry post the Agreement on Textiles and
Clothing”, Discussion Paper 5-2004, World Trade Organization.
OECD (2004), A New World Map in Textiles and Clothing: Adjusting to Change, OECD.22.
Schott, P. K. (2004), “Across-product versus within-product specialization in international trade”, The
Quarterly Journal of Economics 119(2), 646–677.
Economic Bulletin | Banco de Portugal
Articles | Spring 2009
165
A APPENDIX: DATABASE
A.1. Product Definition
Banco de Portugal | Economic Bulletin
Spring 2009 | Articles
166
The following is an illustration of the HS classification. Chapter 61 “Articles of apparel and clothing
accessories, knitted or crocheted’’ includes 17 headings at the 4-digits level:
6101 Men’s or boys’ overcoats, car-coats, capes, cloaks, anoraks (including ski-jackets),
wind-cheaters, wind-jackets and similar articles, knitted or crocheted, other than those
of heading No 6103,
6102 Women’s or girls’ overcoats, car-coats, capes, cloaks, anoraks (including ski-jackets),
wind-cheaters, wind-jackets and similar articles, knitted or crocheted, other than those of
heading 6104,
6103 Men’s or boys’ suits, ensembles, jackets, blazers, trousers, bib and brace overalls,
breeches and shorts (other than swimwear), knitted or crocheted,
6104 Women’s or girls’ suits, ensembles, jackets, blazers, dresses, skirts, divided skirts,
trousers, bib and brace overalls, breeches and shorts (other than swimwear), knitted or
crocheted,
6105 Men’s or boys’ shirts, knitted or crocheted,
6106 Women’s or girls’ blouses, shirts and shirt-blouses, knitted or crocheted,
6107 Men’s or boys’ underpants, briefs, nightshirts, pyjamas, bathrobes, dressing gowns and
similar articles, knitted or crocheted,
6108 Women’s or girls’ slips, petticoats, briefs, panties, nightdresses, pyjamas, negligees,
bathrobes, dressing gowns and similar articles, knitted or crocheted,
6109 T-shirts, singlets and other vests, knitted or crocheted,
6110 Jerseys, pullovers, cardigans, waistcoats and similar articles, knitted or crocheted,
6111 Babies’ garments and clothing accessories, knitted or crocheted,
6112 Track suits, ski suits and swimwear, knitted or crocheted,
6113 Garments, made-up of knitted or crocheted fabrics of heading No 5903, 5906, or 5907,
6114 Other garments, knitted or crocheted,
6115 Panty hose, tights, stockings, socks and other hosiery, including stockings for varicose
veins and footwear without applied soles, knitted or crocheted,
6116 Gloves, mittens and mitts, knitted or crocheted,
6117 Other made-up clothing accessories, knitted or crocheted; knitted or crocheted parts of
garments or of clothing accessories
Heading 6106, “Women’s or girls’ blouses, shirts and shirt-blouses, knitted or crocheted” further
divides into the following subheadings at the 6-digits level
6106 10 Of cotton
6106 20 Of man-made fibres
6106 90 Of other textile materials
which is the disaggregation level that corresponds to the definition of products used in the article.


![[1907] Watson, Kate Heintz - Textiles and Clothing](https://img.pdfslide.net/doc/110x75/577ce0951a28ab9e78b3a680/1907-watson-kate-heintz-textiles-and-clothing.jpg)