Embed Size (px)
Citation preview
Textual Entailment Using Univariate Density Model and Maximizing
Discriminant Function
“Third Recognizing Textual Entailment Challenge 2007 Submission”
Scott SettembreUniversity at Buffalo, SNePS Research Group
Third Recognizing Textual Entailment Challenge (RTE3)
• The task is to develop a system to determine if a given pair of sentences has the first sentence “entail” the second sentence
• The pair of sentences is called the Text-Hypothesis pair (or T-H pair)
• Participants are provided with 800 sample T-H pairs annotated with the correct entailment answers
• The final testing set consists of 800 non-annotated samples
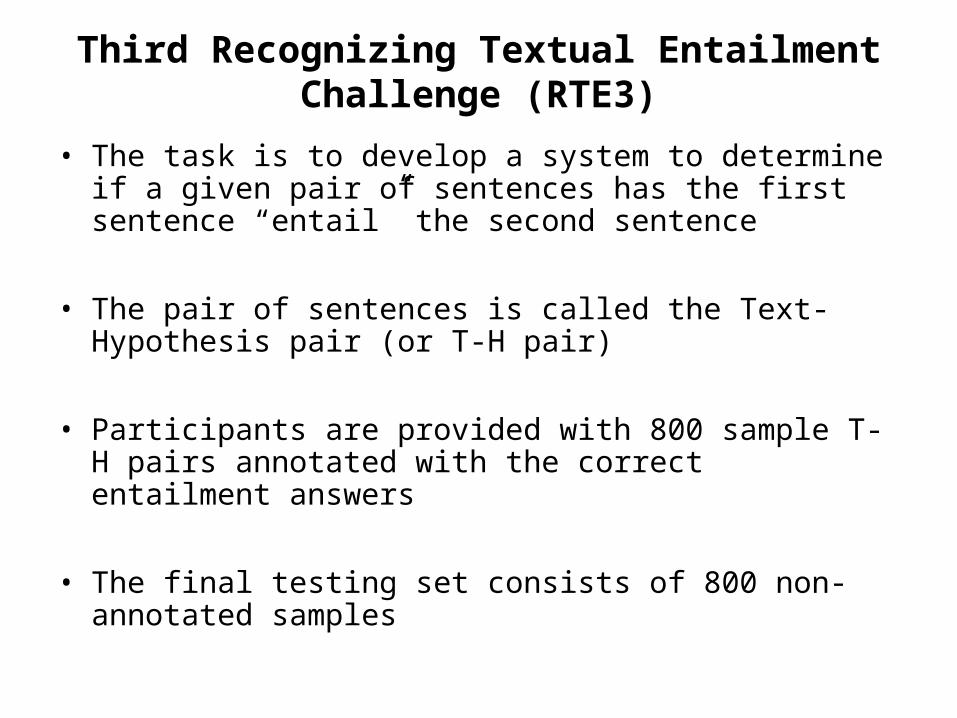
Development set examples
• Example of a YES result
<pair id=“28" entailment="YES" task="IE" length="short"> <t>As much as 200 mm of rain have been recorded in portions of British
Columbia , on the west coast of Canada since Monday.</t> <h>British Columbia is located in Canada.</h> </pair>
• Example of a NO result
<pair id="20" entailment="NO" task="IE" length="short"> <t>Blue Mountain Lumber is a subsidiary of Malaysian forestry
transnational corporation, Ernslaw One.</t> <h>Blue Mountain Lumber owns Ernslaw One.</h> </pair>
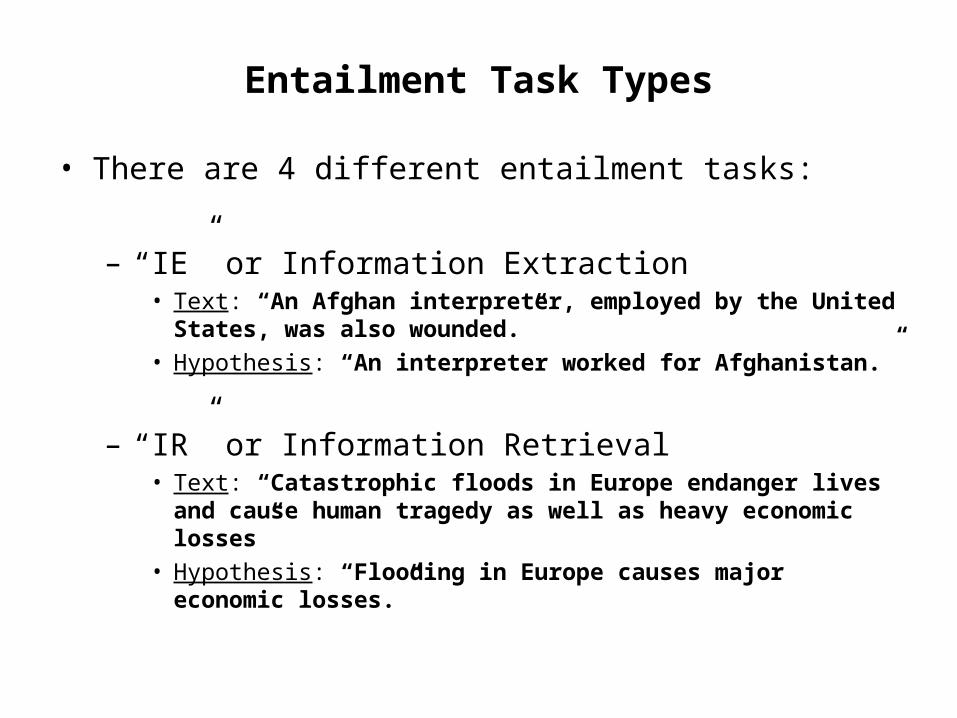
Entailment Task Types
• There are 4 different entailment tasks:
– “IE” or Information Extraction• Text: “An Afghan interpreter, employed by the United States,
was also wounded.”
• Hypothesis: “An interpreter worked for Afghanistan.”
– “IR” or Information Retrieval• Text: “Catastrophic floods in Europe endanger lives and cause
human tragedy as well as heavy economic losses”
• Hypothesis: “Flooding in Europe causes major economic losses.”
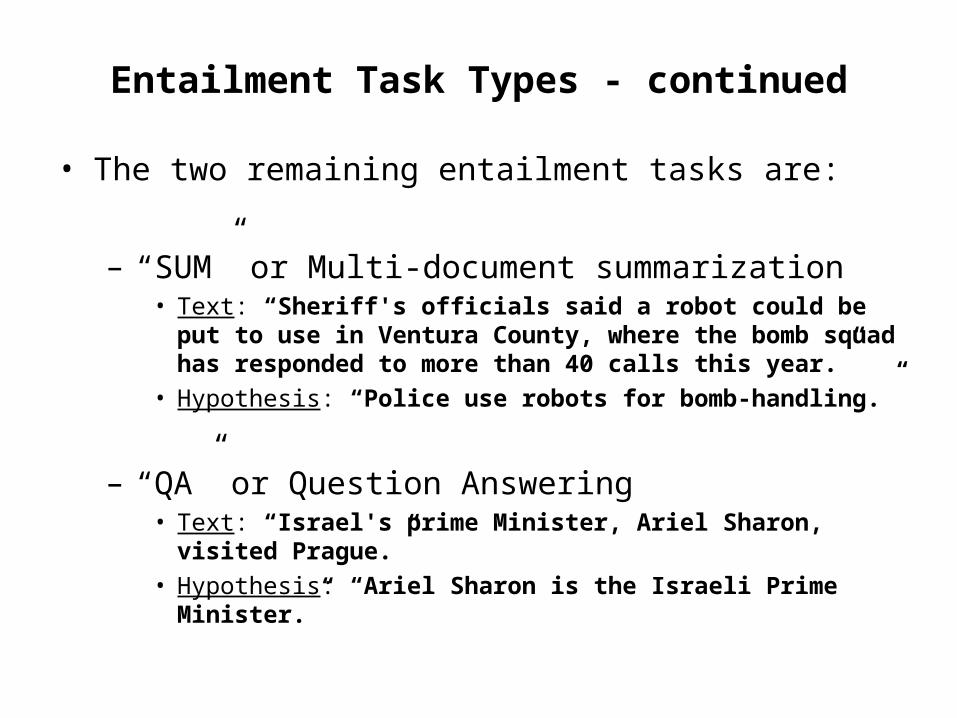
Entailment Task Types - continued
• The two remaining entailment tasks are:
– “SUM” or Multi-document summarization• Text: “Sheriff's officials said a robot could be put to use in
Ventura County, where the bomb squad has responded to more than 40 calls this year.”
• Hypothesis: “Police use robots for bomb-handling.”
– “QA” or Question Answering• Text: “Israel's prime Minister, Ariel Sharon, visited Prague.”
• Hypothesis: “Ariel Sharon is the Israeli Prime Minister.”
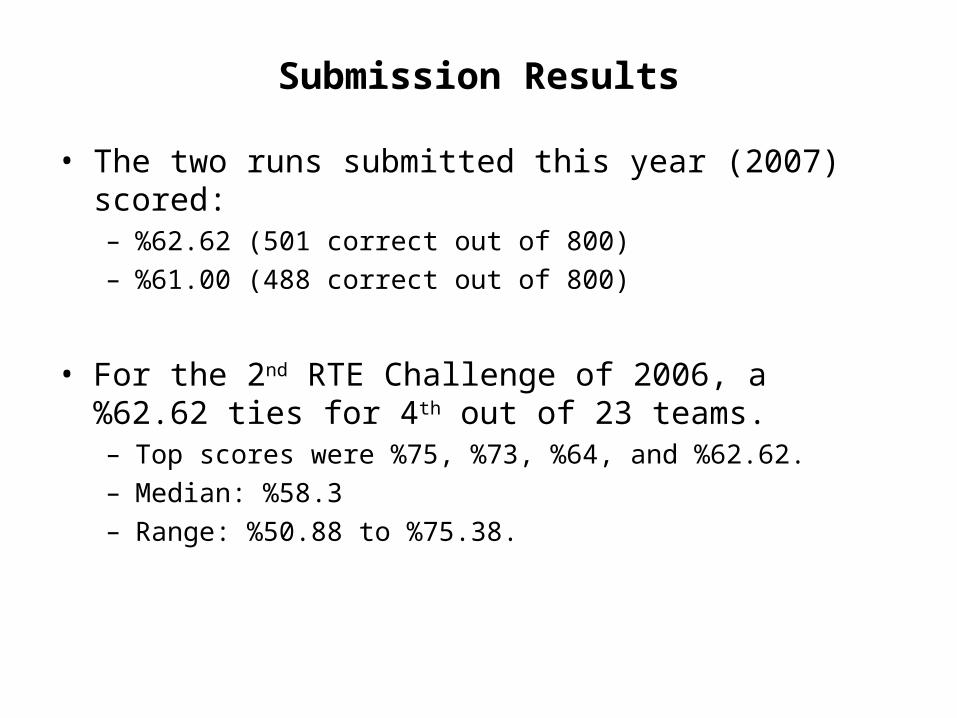
Submission Results
• The two runs submitted this year (2007) scored:– %62.62 (501 correct out of 800)– %61.00 (488 correct out of 800)
• For the 2nd RTE Challenge of 2006, a %62.62 ties for 4th out of 23 teams.– Top scores were %75, %73, %64, and %62.62.– Median: %58.3– Range: %50.88 to %75.38.
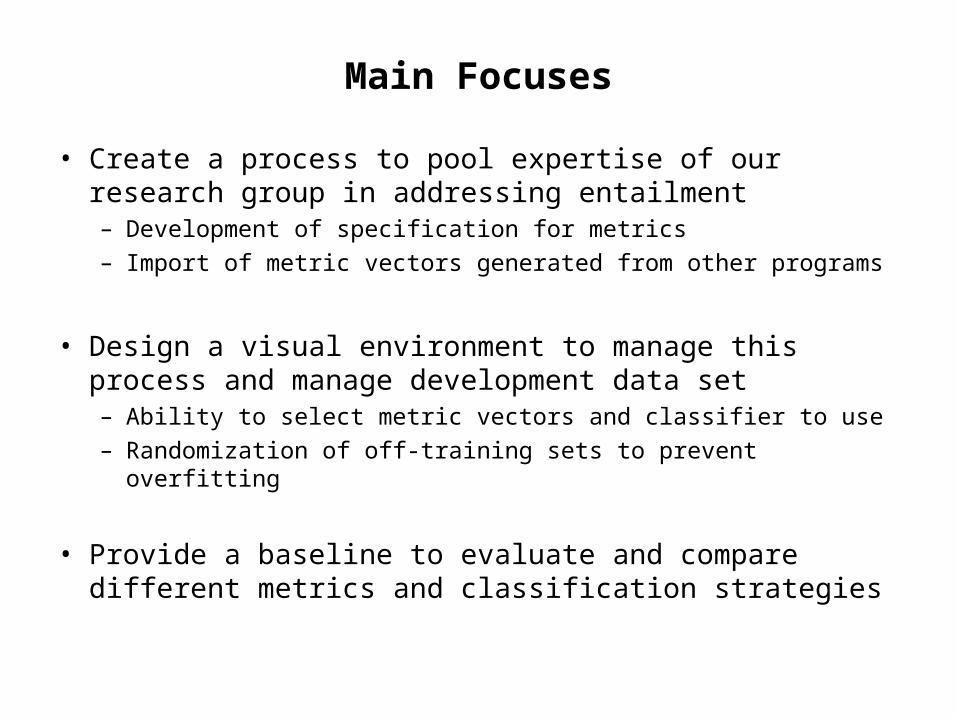
Main Focuses
• Create a process to pool expertise of our research group in addressing entailment– Development of specification for metrics– Import of metric vectors generated from other programs
• Design a visual environment to manage this process and manage development data set– Ability to select metric vectors and classifier to use– Randomization of off-training sets to prevent overfitting
• Provide a baseline to evaluate and compare different metrics and classification strategies
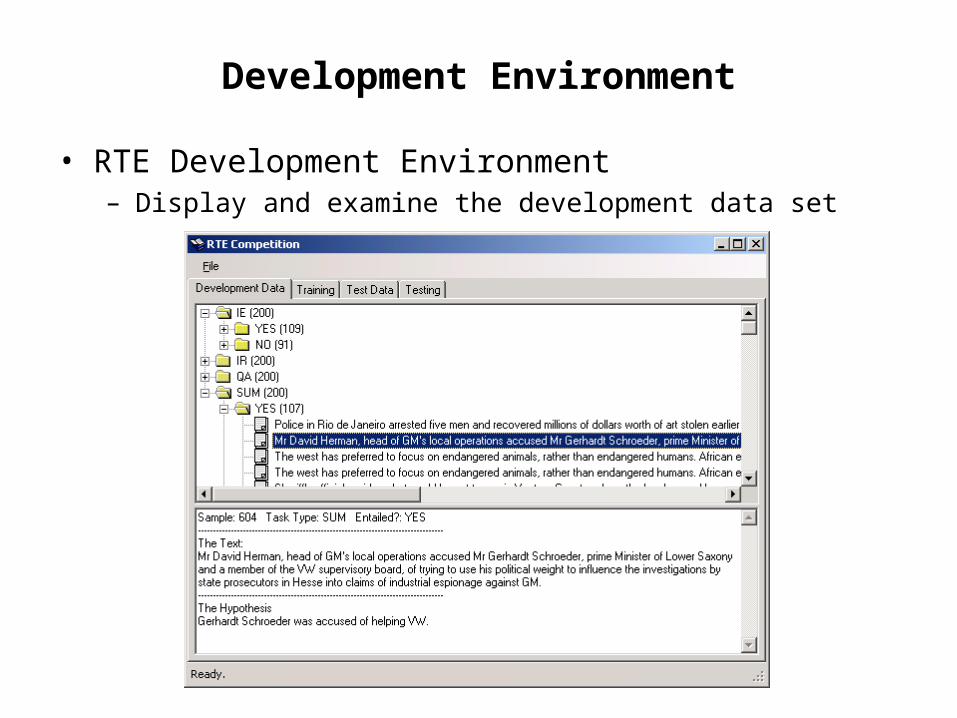
Development Environment
• RTE Development Environment– Display and examine the development data set

Development Environment - continued
– Select off-training set from development data
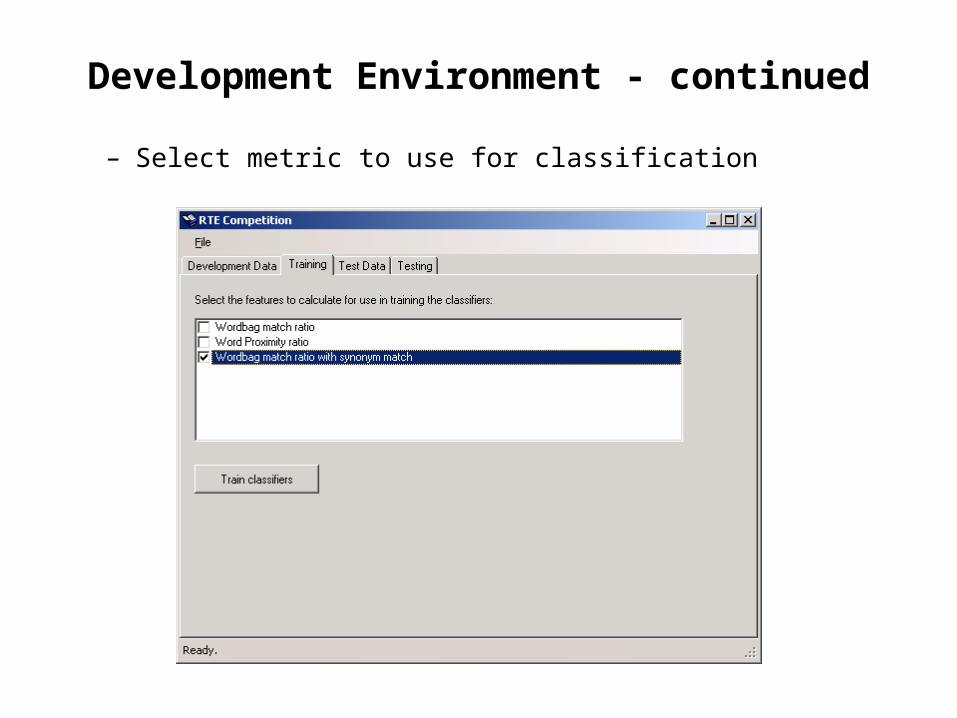
Development Environment - continued
– Select metric to use for classification
Metrics
• Metric specification– Continuous value and normalized between 0 and 1 (inclusive)
• Allows future use of nearest-neighbor classification techniques
• Prevents scaling issues
– Preferably in a Gaussian distribution (bell curve)
• Metrics developed for our submission– Lexical similarity ratio (word bag)– Average Matched word displacement– Lexical similarity with synonym and antonym replacement
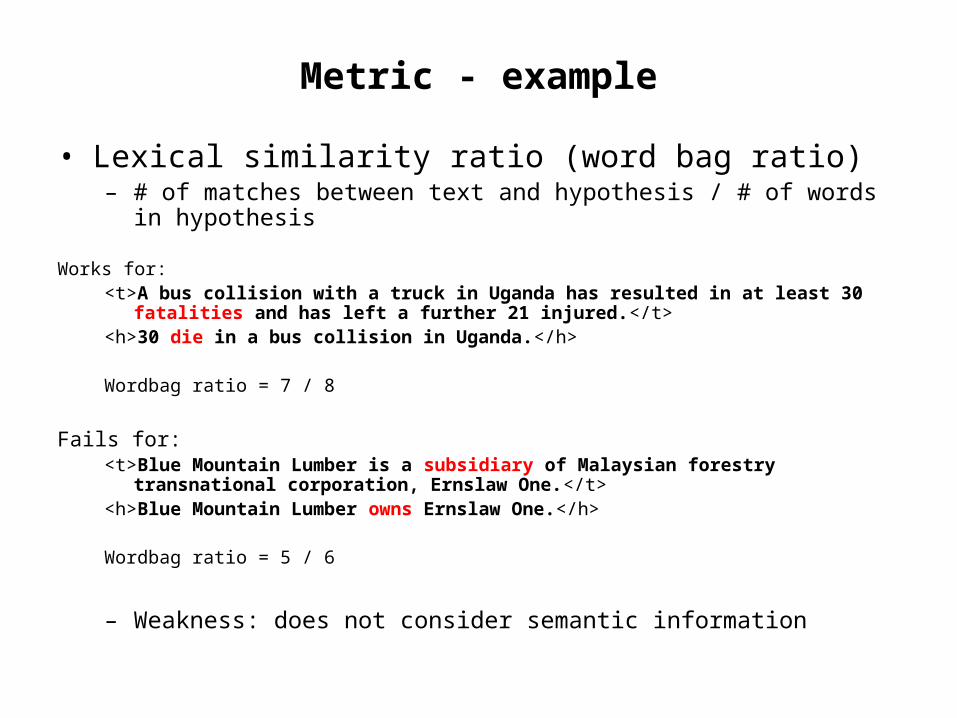
Metric - example
• Lexical similarity ratio (word bag ratio)– # of matches between text and hypothesis / # of words in hypothesis
Works for:<t>A bus collision with a truck in Uganda has resulted in at least 30 fatalities and has left
a further 21 injured.</t> <h>30 die in a bus collision in Uganda.</h>
Wordbag ratio = 7 / 8
Fails for:<t>Blue Mountain Lumber is a subsidiary of Malaysian forestry transnational corporation,
Ernslaw One.</t> <h>Blue Mountain Lumber owns Ernslaw One.</h>
Wordbag ratio = 5 / 6
– Weakness: does not consider semantic information
Development Environment - continued
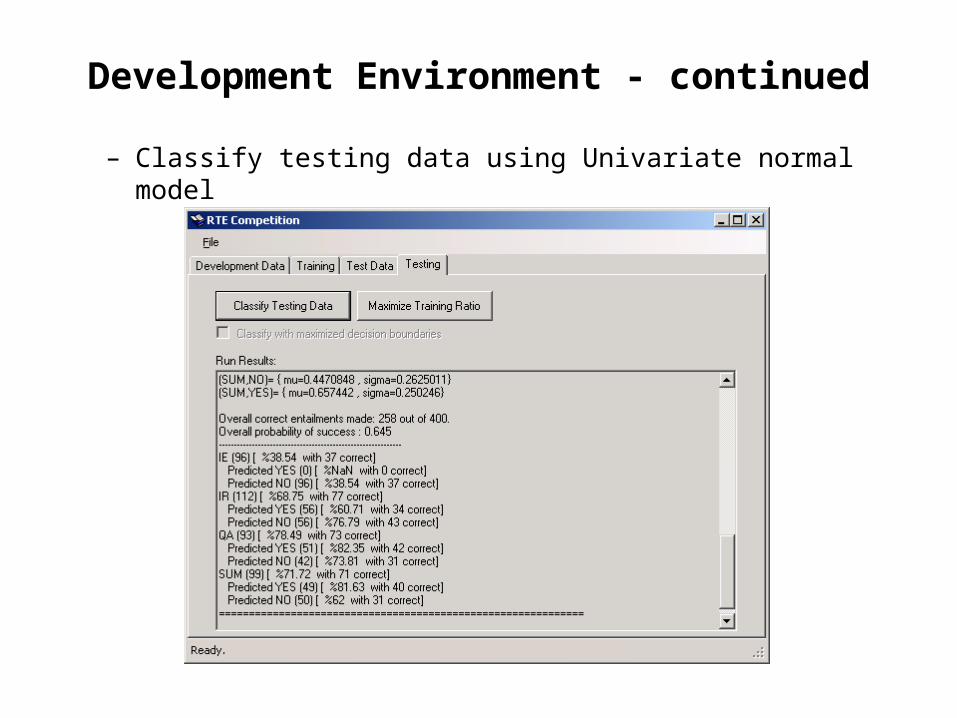
– Classify testing data using Univariate normal model
Classifiers
• Two classification techniques were used– Univariate normal model (Gaussian density)– Linear discriminant function
• Univariate normal model– One classifier for each entailment type and value– 8 classifiers are developed– Results from the “YES” and “NO” classifiers are compared
• Linear discriminant function– One classifier for each entailment type– 4 classifiers are developed– Result based on which side of the boundary the metric is on
Classifiers - Univariate
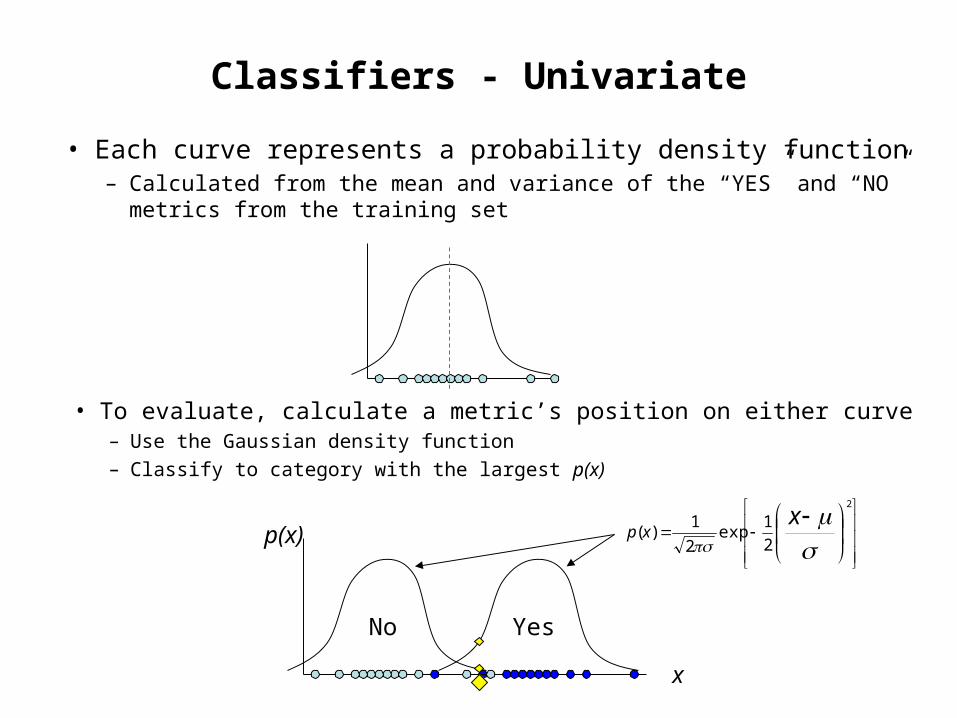
• Each curve represents a probability density function– Calculated from the mean and variance of the “YES” and “NO”
metrics from the training set
• To evaluate, calculate a metric’s position on either curve– Use the Gaussian density function
– Classify to category with the largest p(x)
xxp
2
2
1exp
2
1)(
x
p(x)
No Yes
Classifiers - Simple Linear Discriminant
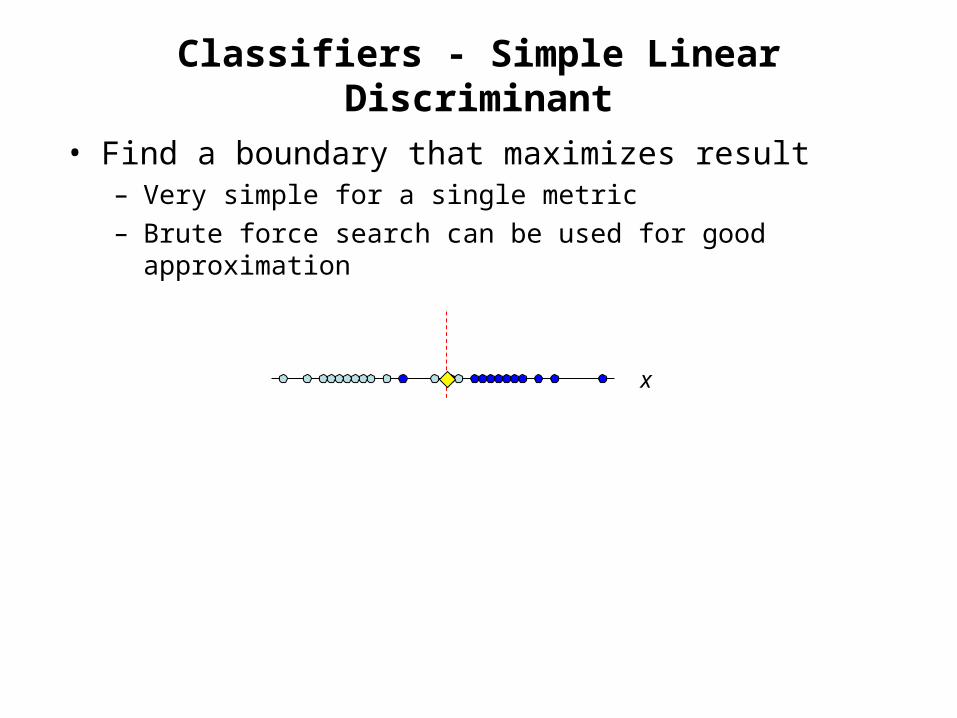
• Find a boundary that maximizes result– Very simple for a single metric– Brute force search can be used for good approximation
x
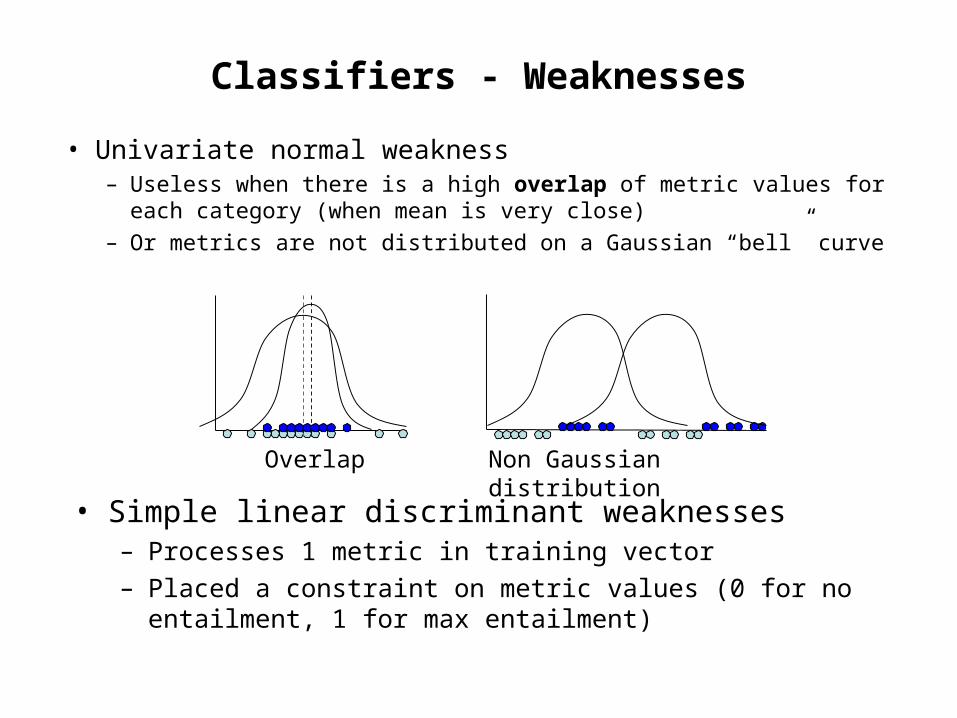
Classifiers - Weaknesses
• Univariate normal weakness– Useless when there is a high overlap of metric values for each
category (when mean is very close)– Or metrics are not distributed on a Gaussian “bell” curve
• Simple linear discriminant weaknesses– Processes 1 metric in training vector– Placed a constraint on metric values (0 for no entailment, 1 for
max entailment)
Overlap Non Gaussian distribution
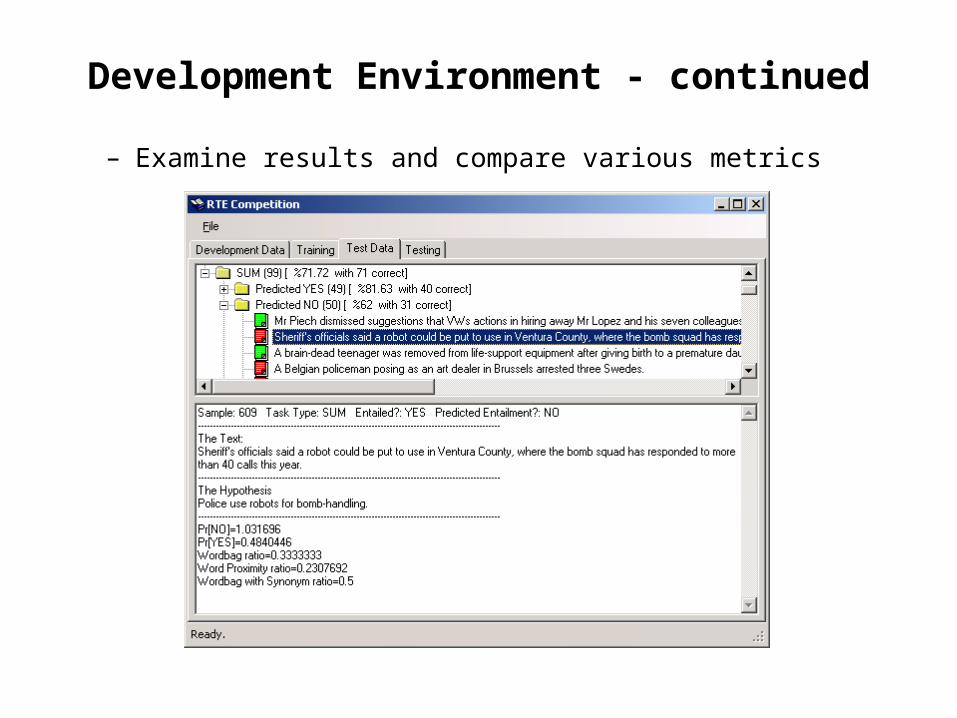
Development Environment - continued
– Examine results and compare various metrics
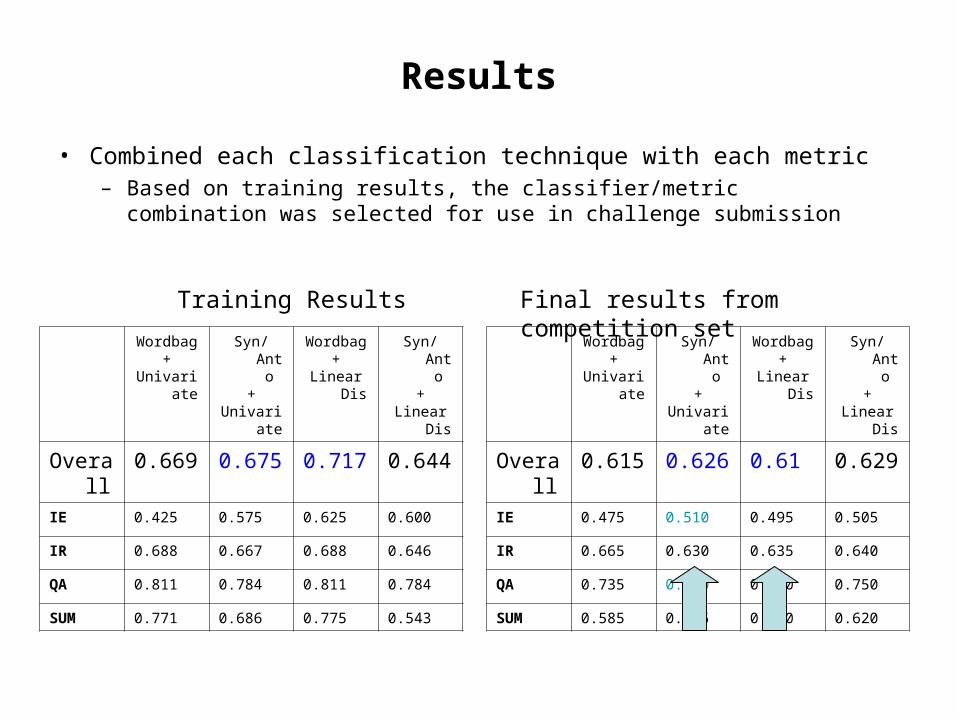
Results
• Combined each classification technique with each metric– Based on training results, the classifier/metric combination was
selected for use in challenge submission
Wordbag+
Univariate
Syn/Anto+
Univariate
Wordbag+
Linear Dis
Syn/Anto+
Linear Dis
Overall 0.669 0.675 0.717 0.644IE 0.425 0.575 0.625 0.600
IR 0.688 0.667 0.688 0.646
QA 0.811 0.784 0.811 0.784
SUM 0.771 0.686 0.775 0.543
Training Results
Wordbag+
Univariate
Syn/Anto+
Univariate
Wordbag+
Linear Dis
Syn/Anto+
Linear Dis
Overall 0.615 0.626 0.61 0.629 IE 0.475 0.510 0.495 0.505
IR 0.665 0.630 0.635 0.640
QA 0.735 0.750 0.750 0.750
SUM 0.585 0.615 0.560 0.620
Final results from competition set
Future Enhancements
• Use of multivariate model to process metric vector– Ability to use more than one metric at a time to classify
• Add more metrics that consider semantics– Examination of incorrect answers show that a modest effort to
process semantic information would yield better results– Current metrics only use lexical similarity
• Increase ability for tool to interface in other ways– Currently we can process metrics from Matlab, COM and .NET
objects, and pre-processed metric vector files
RTE Challenge - Final Notes
• See our progress at:
http://www.cse.buffalo.edu/~ss424/rte3_challenge.html
• RTE Web Site:
http://www.pascal-network.org/Challenges/RTE3/
• Textual Entailment resource pool:
http://aclweb.org/aclwiki/index.php?title=Textual_Entailment_Resource_Pool
• Actual ranking released in June 2007 at:
http://www.pascal-network.org/Challenges/RTE3/Results/
April 13, 2007 CSEGSA Conference Scott Settembre