Embed Size (px)
Citation preview

8/2/2018
1
TG126 PET/CT Acceptance Testing and
Quality Assurance
Osama Mawlawi PhD, DABR, DABSNM, FAAPM, FACR
on behalf of TG126 members
Disclosures
• GE research grant
• SIEMENS research grant
Background/motivation• Lack of standards for testing PET/CT scanners.
• NEMA NU2-2012: For acceptance testing of scanners. (newest: V.2018)• Describes absolute system performance• Very time consuming• Requires various phantoms/costly• Requires specialized software for analysis (costly)
• ACR: For accreditation of scanners • Primarily visual evaluation• Does not evaluate all system performance characteristics• Very simple and easy to perform• Requires specialized phantoms
• Requirements of accrediting bodies (joint commission) for testing reports

8/2/2018
2
Required• Image uniformity/system uniformity
• High-contrast resolution/system spatial resolution
• Low-contrast resolution or detectability
• Artifact evaluation
Recommended• Sensitivity • Energy resolution• Count-rate performance.
For the first time, the Joint Commission is requiring phantom-based PET/CT scanner performance testing
“At least annually, a diagnostic medical physicist conducts a performance evaluation of all positron emission tomography (PET) imaging equipment. The evaluation results, along with recommendations for correcting any problems identified, are documented”
Background
• TG126 formalized in 2006!!
• Leadership of Dr. Jon Anderson – UT southwestern
• Transitioned to Dr. Osama Mawlawi – UT MD Anderson.
• Several committee members over the years.• Current committee:
Jon Anderson UT Southwest
Ishtiaq Bercha WellSpan York Hospital
Janice Campbell Beaumont HospitalGeorges El Fakhri MGH
James Halama Loyola University
David Jordan University Hospitals Clevland
Brad Kemp mayo Clinic
Paul Kinahan University of Washington
Osama Mawlawi MDACC
Charles Schmidtlein MSKCCJon Shepard Fusion Physics – constlt.
Dimitris Visvikis Insern; Brest - France
John Wolodzko Consultant
Wesley Wooten Consultant
Evolution of the TG126 strategy
• Develop code to analyze data as per the NEMA standard• Adhere to the rigor of NEMA
• Is that really needed for annual testing vs. acceptance testing
• Who will maintain the software once developed
• Are there any liabilities
• Requires specialized phantoms (costly & difficult to move around – consultant)
• Develop testing procedures similar to the NEMA standard (NEMA-lite) that do not require specialized phantoms or software.• Practical and useful tests
• Based on images rather than raw data
8/2/2018
3
Evolution of TG126 strategy
• The purpose of Task Group 126, PET/CT Acceptance Testing and Quality Assurance, is to provide a standardized set of acceptance and periodic tests that can be easily implemented in a QA program for various PET/CT system platforms from different manufacturers.
• The intent of the Task Group members was to develop procedures that adhere to the spirit of the NEMA document
• Do not require the purchase of specialized equipment to perform the experiments (beyond standard, inexpensive and easily obtainable phantoms and those supplied by the manufacturer) or specific software to analyze the acquired data.
Evolution of TG126 strategy
• Philosophy: The proposed tests are to be performed following installation as well as for annual testing.
• When performed following installation of a system they represent the baseline standard.
• When performed for annual testing they represent the system performance for that year and the results are compared with the baseline values.• In this regard the annual testing assesses the variation from baseline rather
than the absolute system performance.
Evolution of TG126 strategy
• NEMA NU2 standard:• Resolution
• Sensitivity
• Count rate performance
• Image quality
• Accuracy
• Added:• Alignment
• ACR (Image Quality)
• Uniformity
• Removed• Image quality (replaced by ACR)
Note that there are no tests identified for timing resolution, energy resolution, gating accuracy etc.
8/2/2018
4
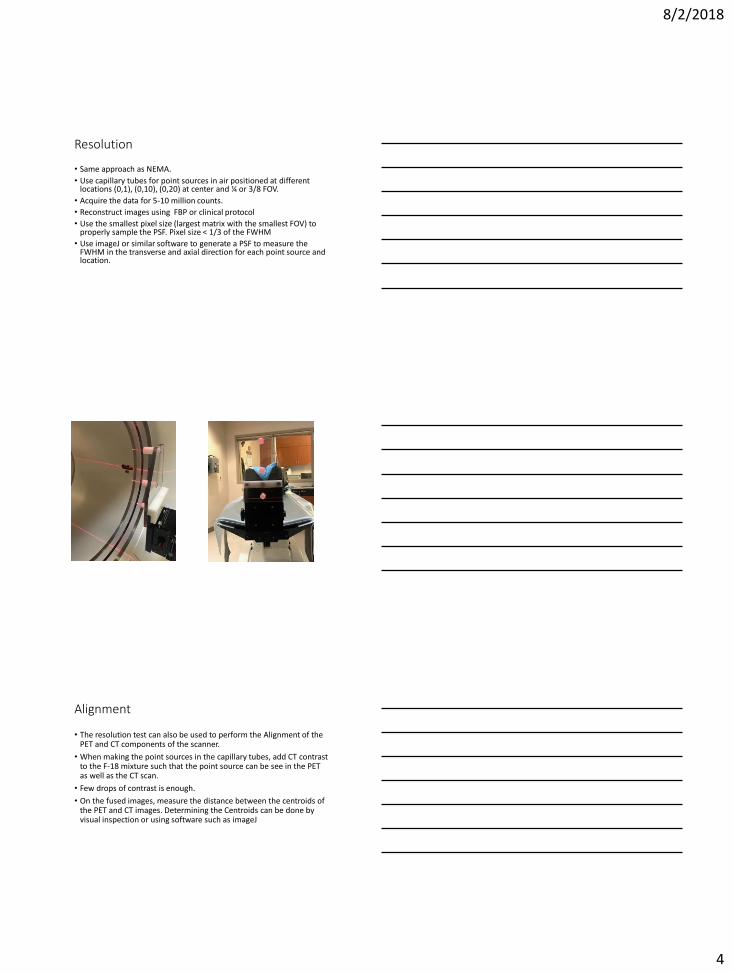
Resolution
• Same approach as NEMA.
• Use capillary tubes for point sources in air positioned at different locations (0,1), (0,10), (0,20) at center and ¼ or 3/8 FOV.
• Acquire the data for 5-10 million counts.
• Reconstruct images using FBP or clinical protocol
• Use the smallest pixel size (largest matrix with the smallest FOV) to properly sample the PSF. Pixel size < 1/3 of the FWHM
• Use imageJ or similar software to generate a PSF to measure the FWHM in the transverse and axial direction for each point source and location.
Alignment
• The resolution test can also be used to perform the Alignment of the PET and CT components of the scanner.
• When making the point sources in the capillary tubes, add CT contrast to the F-18 mixture such that the point source can be see in the PET as well as the CT scan.
• Few drops of contrast is enough.
• On the fused images, measure the distance between the centroids of the PET and CT images. Determining the Centroids can be done by visual inspection or using software such as imageJ
8/2/2018
5
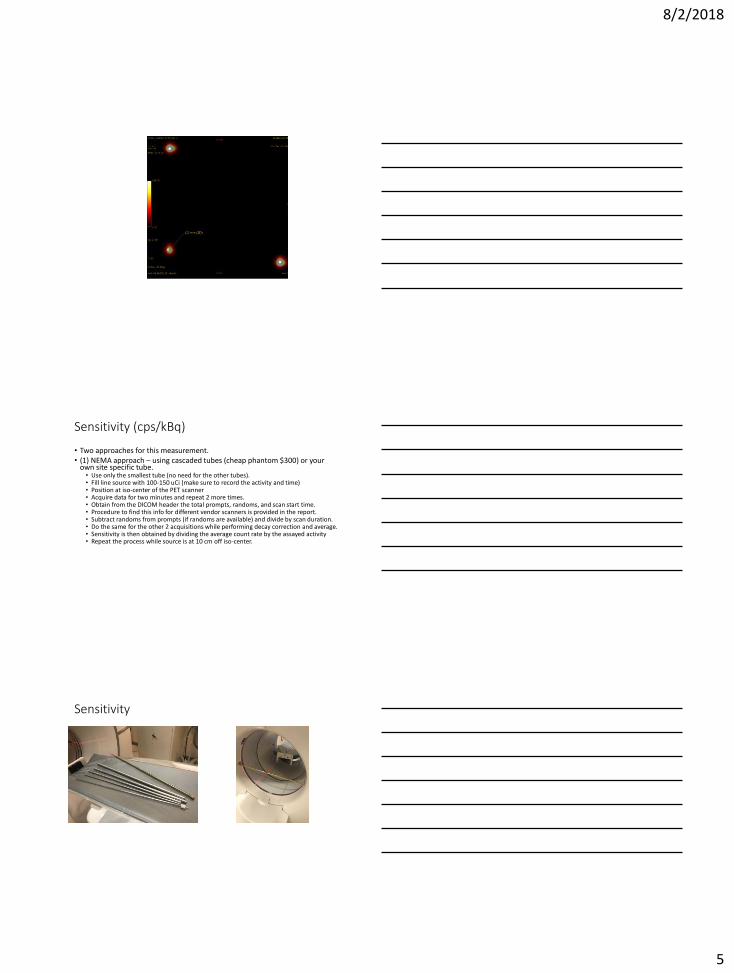
Sensitivity (cps/kBq)
• Two approaches for this measurement.• (1) NEMA approach – using cascaded tubes (cheap phantom $300) or your
own site specific tube.• Use only the smallest tube (no need for the other tubes).• Fill line source with 100-150 uCi (make sure to record the activity and time)• Position at iso-center of the PET scanner• Acquire data for two minutes and repeat 2 more times.• Obtain from the DICOM header the total prompts, randoms, and scan start time.• Procedure to find this info for different vendor scanners is provided in the report.• Subtract randoms from prompts (if randoms are available) and divide by scan duration.• Do the same for the other 2 acquisitions while performing decay correction and average.• Sensitivity is then obtained by dividing the average count rate by the assayed activity• Repeat the process while source is at 10 cm off iso-center.
Sensitivity

8/2/2018
6
Sensitivity
• (2) use the calibration factor as a measure of sensitivity• For GE systems this is called the WCC factor
• For SIEMENS systems this is called the ECF
• Procedures for obtaining this value for different vendor systems is available in the TG report.
• Tracking this value over time shows the variability of the system sensitivity performance.
Count rate performance
• Done using the same method as NEMA but using a standard 20cm phantom.
• Fill the phantom with 15-20 mCi and position it at iso-center in the PET FOV.
• For baseline testing: Image the phantom over 6-7 halflives, each scan of 15 min duration with 15 min delay. Reconstruct the images with all corrections.
• For annual testing: Image the phantom 2-3 times at different activity levels. Each scan with 15 min duration and reconstruct the images with all corrections.
• For each scan obtain the total prompts and total delays from the DICOM header
8/2/2018
7
Count rate performance
• RNEC = RT2
RT + RS + k f RR• f is the fraction of the FOV subtended by the phantom
• k is a factor that depends on the Randoms correction technique (k = 1 for noiseless randomsestimate and k = 2 for noisy randoms estimate).
• Given that scatter or scatter fraction might not be readily available, the above equation can be
modified to:
• RPNEC = ሺ𝑅𝑃 − ሻ𝑅𝐷
2
𝑅𝑃 +𝑘
2−1 𝑅𝐷
Where RPNEC is the psduo NECR
Count rate performance
Where RPNEC is the psduo NECR
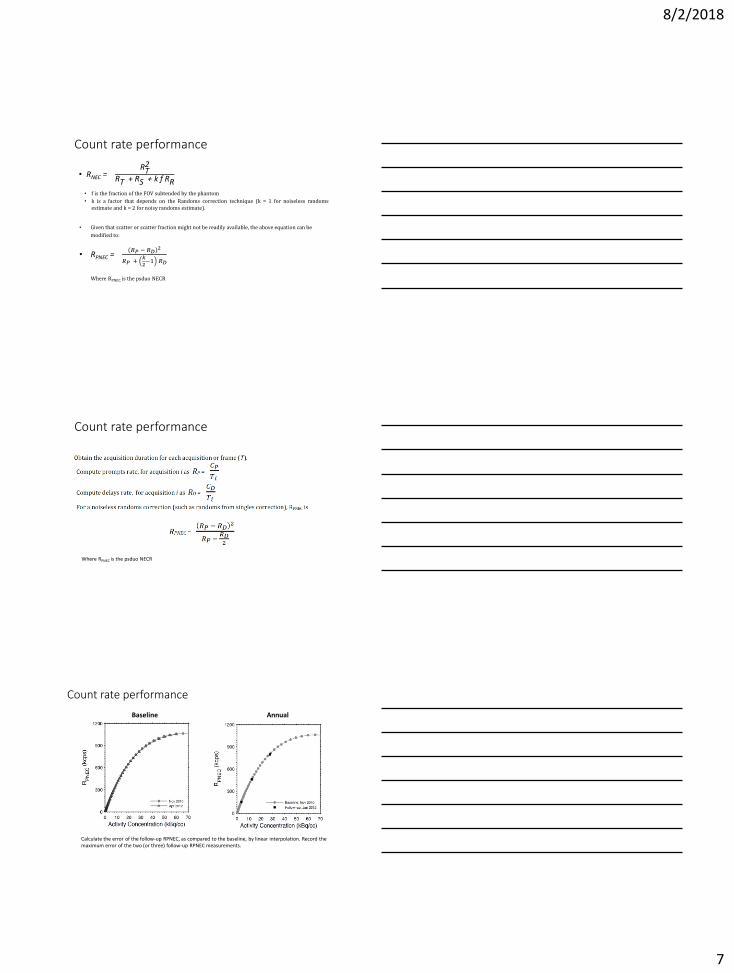
Count rate performance
Baseline Annual
Calculate the error of the follow-up RPNEC, as compared to the baseline, by linear interpolation. Record the maximum error of the two (or three) follow-up RPNEC measurements.

8/2/2018
8
Accuracy of corrections
• From the images of the count rate measurement, draw an ROI that is 75% of the diameter of the phantom
• Calculate the SUV in that ROI
• Plot the results for the different acquisitions.
• Calculate the error of the follow-up SUV, as compared to the baseline, by linear interpolation.
ACR – Image quality
• Uses the ACR phantom and follows a similar process of ACR testing
• Doubles as ACR testing for accreditation
Table 10. Phantom Dose Chart
Patient Dose (mCi) Dose A (mCi) Dose B (mCi)
4 0.14 0.33
6 0.21 0.50
8 0.28 0.66
10 0.35 0.83
12 0.42 0.99
14 0.49 1.15
16 0.56 1.32
18 0.63 1.48
20 0.70 1.65
ACR – Image quality
• Image the phantom using the standard clinical protocol.
• Make sure the scan time post dose assay is the same (+/- 5-10 min) between the baseline and annual testing scans.
• Reconstruct the images using the standard clinical protocol and reformat the images to 1 cm thick slices.
• Measure and record the SUVmax and SUVmin for the various cylinders
• Measure the SUVmean in a 6-7 cm ROI in the background.
• Calculate the contrast ratio for the hot cylinders

8/2/2018
9
ACR – image quality data reporting
CylinderMin
SUV
Allowable
Range
Mean
SUV
Allowable
Range
Max
SUV
Allowable
Range
Contrast
Ratio
Allowable
Range
25 mm “hot”
Measurement not required16 mm “hot”
12 mm “hot”
8 mm “hot”
25 mm Teflon
Measurement not required25 mm Water
25 mm Air
Background
Contrast Ratio = 𝑀𝑎𝑥 𝑆𝑈𝑉 𝑜𝑓 𝐻𝑜𝑡 𝐶𝑦𝑙𝑖𝑛𝑑𝑒𝑟 𝑅𝑂𝐼
𝑀𝑒𝑎𝑛 𝑆𝑈𝑉 𝑜𝑓 𝐵𝑎𝑐𝑘𝑔𝑟𝑜𝑢𝑛𝑑 𝑅𝑂𝐼
Image Uniformity
• The purpose of this test is to provide a measure of the deviation in the activity concentration within a slice as well as across slices of a uniform phantom.
• Uses data that was acquired as part of the count rate test.
• Draw 5 ROIs with 3 cm diameter at 3, 6, 9, 12 and center.
• Copy ROIs to all slices
• Record mean, min and max ROI activity concentration
Image Uniformity
• Uniformity within the slice:• The integral uniformity within a slice is based on the mean values for the 5
circular ROIs
• IUi=ROImax−ROIminROImax+ROImin
• ROImax is the maximum of the 5 mean values in that slice, and ROImin is the minimum of the 5 mean values within the slice.
• Uniformity across slices:• For each ROI location, determine the largest ROI mean value, 𝑅𝑂𝐼𝑗 from slice
j, and the smallest ROI mean value, 𝑅𝑂𝐼𝑘 from slice k.
• Integral axial uniformity is given by: IUaxial=ROIj−ROIkROIj+ROIk
.

8/2/2018
10
Image Uniformity ROI Mean
Slice ROI1 ROI2 ROI3 ROI4 ROI5
Integral Uniformity
within Slice 𝑰𝑼𝒊
2
3
4
5
6
7
8
9
10
11
12
13
14
15
16
17
18
19
Axial Uniformity
(Between Slices)
𝑰𝑼𝒂𝒙𝒊𝒂𝒍
Exclude the front and end slices from this calculation due to noise in edge slices
Additional component of the report
• PET quality control program elements
• CT quality control program elements.
• Described for the major 3 manufacturers (GE, SIEMENS, PHILIPS).
• Table showing the frequency of these testing.

8/2/2018
11
SNMMI & JC : effort towards standardization
• Uniformity, resolution, contrast
Uniform Phantom imaged at a slightly oblique angle
Imaged at high statistics (15 minute/bed position)
Imaged using standard clinical acquisition.
Reconstructed using standard clinical reconstruction.
Courtesy of John Sunderland
Step 4
Export DICOM image data and meta data to cloud-based folder
Implementation Schema
LeftRight Center
Posterior
Anterior
Site scans two phantoms
Step 1
Imaging Site
Step 2
Site uploads DICOM data to SNMM/CTNI Server
Step 3
QC on supplied Image data and phantom fill quality.
5-10 minute manual task
SNMMI/CTN
Step 5
New Data --> download data to cloud based tools.
A. Recognize phantom
B. Tools automatically analyze phantom
Cloud-Based Software Tools
Step 6Automated analysis of phantom data and report draft generation
JSON file (Javascript Object Notation): DICOM Header Data, Fill Data, VOI data, Pixel data for
all VOIs, Analysis Data, Site Data…
Plots and Graphics.
Step 7
Web Interface HTML Scanner
Report
Step 8 Physicist Review & comment
Final, Signed, JC .pdf compliance
Report
Step 9Report generation and distribution
Courtesy of John Sunderland

8/2/2018
12
TG 126 Report
• Draft finalized
• Reviewed and approved by the NMSC
• Currently under review with IPC
• Next steps:• Implement corrections/comments of IPC
• Send to SC for approval
• Transition to a WG to generate look up tables for different systems
• Submit as a JACMP paper
Thank you