Embed Size (px)
Citation preview

TGA-FTIR study of the vapours released
by volatile corrosion inhibitor model
systems
by
Nontete Suzan Nhlapo
A thesis submitted in partial fulfilment
of the requirements for the degree
Doctor of Philosophy
in the
Department of Chemical Engineering
Faculty of Engineering, the Built Environment and Information Technology
University of Pretoria
Pretoria
July 2013
©© UUnniivveerrssiittyy ooff PPrreettoorriiaa

i
TGA-FTIR study of the vapours released by volatile corrosion inhibitor
model systems
Author: Nontete Suzan Nhlapo
Supervisor: Prof. Walter W. Focke
Co-supervisor: Dr Eino Vuorinen
Degree: PhD (Chemical Technology)
Department: Chemical Engineering
ABSTRACT
Proprietary mixtures of amines and carboxylic acids are used as volatile corrosion inhibitors
(VCIs) for the protection of steel and iron components against atmospheric corrosion during
storage and transportation. Interactions between amines and carboxylic acids have been
comprehensively reported in the literature. However, little is known about the nature of the
vapours these mixtures emit. The present study focused on the development of the evolved
gas analysis method which will help in the characterisation of the vapours released by VCIs.
In the method, the evaporation of various amine-carboxylic acid binary mixtures was
monitored by thermogravimetric analysis (TGA). The nature and the composition of the
released vapours was followed by Fourier transform infrared (FTIR) spectroscopy. Mixtures
consisting of triethylamine (TEA) and acetic acid were studied as a model compound using
TGA-FTIR at 50 °C to validate the TGA-FTIR method. As vaporisation progressed, the
composition of the remaining liquid and the emitted vapour converged to a fixed amine
content of ca. 27 mol %. This is just above the composition expected for the 1:3 amine:
carboxylic acid complex. Mixtures close to this composition also featured the lowest
volatility. TGA-FTIR proved to be a convenient method for studying the evaporation of
TEA-acetic acid mixtures, and the nature and composition of the released vapours.
Amine addition leads to the dissociation of carboxylic acid dimers in favour salt formation.
The formation of an ion pair between the amine and carboxylic acid was confirmed by the
©© UUnniivveerrssiittyy ooff PPrreettoorriiaa

ii
FTIR spectra of the liquid phase. The resulting amine-carboxylic acid mixtures showed a
slow mass loss rate on TGA when compared with the pure amines and pure carboxylic acids.
This indicated that the mixtures have low volatility, hence low vapour pressure compared
with the pure components. The low vapour pressure of the mixtures was confirmed by the
calculated gas permeability values. These values were much higher for the pure amines and
the pure carboxylic acids. However, they dropped significantly on amine addition. The strong
amine-carboxylic acid interaction is responsible for the suppressed volatility of the mixtures.
No interaction is observed between amine and carboxylic acid molecules in the vapour phase
at 230 °C.
The method developed was applied to characterise the model compounds simulating the
amine-carboxylic acid-based volatile corrosion inhibitors. These model systems contained the
primary, secondary and tertiary amines (hexylamine, morpholine and triethylamine), as well
as carboxylic acids with different chain lengths (acetic, propanoic, hexanoic and octanoic).
These systems are usually employed as equimolar mixtures to protect ferrous metals against
atmospheric corrosion. The key finding of the study was that the vapours released by such
equimolar mixtures initially contain almost exclusively free amine. After prolonged
vaporisation, a steady-state “azeotrope”-like composition is approached. It contains excess
acid and features impaired corrosion-inhibition efficiencies according to the Skinner test. In
part, this behaviour can be attributed to the mismatch between the volatilities of the amine
and carboxylic acid constituents.
Keywords: Amines, carboxylic acids, VCIs, atmospheric corrosion, evaporation, vapour
pressure, gas permeability, corrosion efficiency, TGA-FTIR
©© UUnniivveerrssiittyy ooff PPrreettoorriiaa

iii
DEDICATION
This dissertation is dedicated to my late father Nopagatha Daniel Nhlapo, my mom Ntsoaki
Lizbeth Moshoadiba (Masephoso), and my brother Molendazo Simon Nhlapo for their
understanding and encouragement, and for being my great source of inspiration and
motivation during all these years of study. Most of all, for believing in me …!
“In the confrontation between the river and the rock, the river always wins...not by
strength, but by perseverance.”-Unknown
©© UUnniivveerrssiittyy ooff PPrreettoorriiaa

iv
ACKNOWLEDGEMENTS
Financial support for this research, from the National Metrology Institute of South Africa
(NMISA), the Institutional Research Development Programme (IRDP) of the National
Research Foundation of South Africa, the University of Pretoria and Xyris Technology CC, is
gratefully acknowledged.
I am greatly indebted to the following people since without their support this study would not
have been possible:
o Prof Walter W. Focke for his great supervision, guidance and encouragement
throughout the study.
o Dr Eino Vuorinen from NMISA for his mentorship, valuable suggestions and
encouragement throughout the study, and the organic chemistry group of NMISA for
their support (Dr Maria Fernandes-Whaley, thank you).
o Ollie del Fabbro and Isbe van der Westerhuizen from the Institute of Applied
Materials (IAM) for their patience during experimental setups and TGA runs.
o Dr Liezel van der Merwe for giving me time on the DSC instrument.
o Suzette Seymore for ordering the reagents, among others – thank you very much
Suzette.
o My colleagues at IAM, University of Pretoria: Shepherd Tichapondwa, Washington
Mhike, Mthokozisi Sibanda, Herminio Muiambo and Hendrik Oosthuizen for their
valuable inputs.
o My dearest friends: Lumbidzani Moyo, Jabu Mabena, Sibusiso Jozela and Sechaba
Masiteng for their inputs, constant support, and for being my great source of
motivation during my down-times.
o My family: My sisters (Nozika, Nomthemba and Nonhlupheko, Mpolokeng
Makhanya) and brothers (Mphikeleli and Mfokazana) for being there for me
throughout the duration of the study.
Last but not least, God Almighty for his strength and protection … Most of all for bringing
me this far...(To Him be the Glory Forever: Romans: 11:33-37)
©© UUnniivveerrssiittyy ooff PPrreettoorriiaa

v
DECLARATION
I, the undersigned, declare that the dissertation, which I hereby submit for the PhD degree at
the University of Pretoria, is my own work and has not previously been submitted by me for
the degree at this or any other tertiary institution.
…………………………
Nontete Suzan Nhlapo
©© UUnniivveerrssiittyy ooff PPrreettoorriiaa

vi
Contents
Abstract ...................................................................................................................................... i
Dedication ............................................................................................................................... iii
Acknowledgements ................................................................................................................. iv
Declaration................................................................................................................................ v
List of Figures .......................................................................................................................... ix
List of Tables ......................................................................................................................... xiv
List of Schemes ....................................................................................................................... xv
List of Abbreviations ............................................................................................................ xvi
List of Symbols ................................................................................................................... xviii
1 Introduction and Aim of Study ............................................................................... 1
1.1 Introduction ................................................................................................................ 1
1.2 Brief history of VCIs ................................................................................................. 3
1.3 Problem statement ...................................................................................................... 4
1.4 Aims and objectives ................................................................................................... 5
1.5 Dissertation outline .................................................................................................... 7
2 Literature review ..................................................................................................... 8
2.1 VCI formulations ..................................................................................................... 11
2.2 VCI mechanism of action ........................................................................................ 12
2.3 Compounds used as VCIs ........................................................................................ 13
2.4 Review of the methods used to test the effectiveness of VCIs ................................ 14
2.4.1 Skinner’s test method ........................................................................................... 14
2.4.2 Conical flask method ........................................................................................... 16
2.4.3 Electrochemical measurement methods ............................................................... 16
2.4.4 Eschke’s test method............................................................................................ 17
2.4.5 Other corrosion inhibition test methods ............................................................... 17
2.5 Factors affecting the effectiveness of VCIs ............................................................. 17
2.5.1 pH of the system .................................................................................................. 18
2.5.2 Concentration of an inhibitor ............................................................................... 18
©© UUnniivveerrssiittyy ooff PPrreettoorriiaa
vii
2.5.3 Temperature and humidity ................................................................................... 19
2.5.4 Vapour pressure ................................................................................................... 19
2.5.5 Other factors......................................................................................................... 20
2.6 Amine-carboxylic acid interactions ......................................................................... 21
2.7 The effect of water ................................................................................................... 26
2.8 Review of amine-carboxylic acid characterisation methods ................................... 27
2.8.1 Ultraviolet visible (UV-Vis) spectroscopy .......................................................... 28
2.8.2 Nuclear magnetic resonance (NMR) spectroscopy .............................................. 28
2.8.3 Fourier transform infrared (FTIR) spectroscopy ................................................. 28
2.8.4 Thermo-gravimetric analysis (TGA) ................................................................... 30
2.8.5 Coupling TGA with FTIR .................................................................................... 31
3 Experimental .......................................................................................................... 34
3.1 Reagents and suppliers ............................................................................................. 34
3.2 Experimental methods ............................................................................................. 35
3.3 Instrumentation ........................................................................................................ 37
4 Results ..................................................................................................................... 40
Part 1: Method Development ................................................................................................ 40
4.1 Liquid phase FTIR ................................................................................................... 41
4.2 DSC .......................................................................................................................... 43
4.3 TGA-FTIR ............................................................................................................... 44
Part 2: Method Application .................................................................................................. 54
4.4 Liquid phase FTIR and refractive index .................................................................. 54
4.5 Liquid phase DSC .................................................................................................... 58
4.6 TGA ......................................................................................................................... 62
4.7 Vapour phase FTIR .................................................................................................. 71
4.8 Corrosion tests ......................................................................................................... 79
5 Discussion ................................................................................................................ 81
6 Conclusion .............................................................................................................. 89
References ............................................................................................................................... 91
Publications .......................................................................................................................... 101
©© UUnniivveerrssiittyy ooff PPrreettoorriiaa

viii
Appendices ............................................................................................................................ 102
Appendix A: The refractive index values of the pure components and the mixtures
determined at 20 °C ............................................................................................... 102
Appendix B: Liquid phase FTIR spectra ........................................................................... 103
Appendix C: Time evolution FTIR spectra of binary amine-carboxylic acids .................. 108
Appendix D: Calibration curves ........................................................................................ 111
Appendix E: Shape functions ............................................................................................. 113
Appendix F: PiDAi profiles of pure amines, pure carboxylic acids and their mixtures ..... 115
©© UUnniivveerrssiittyy ooff PPrreettoorriiaa

ix
LIST OF FIGURES
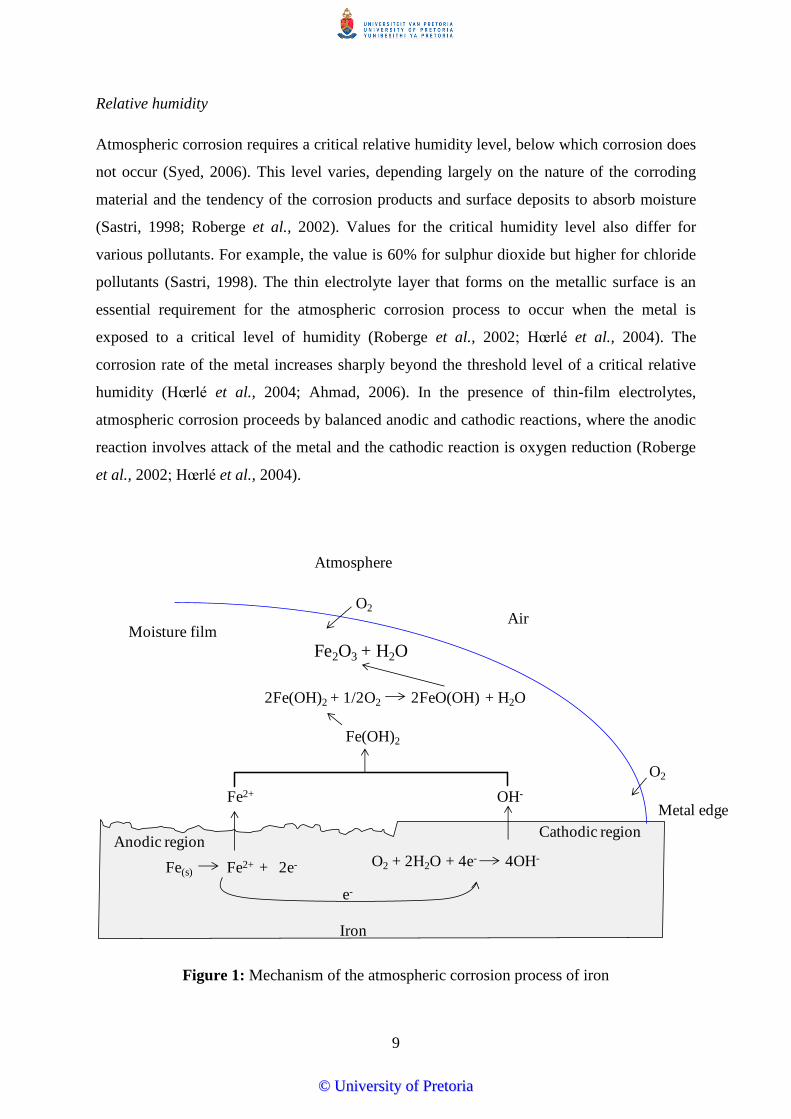
Figure 1: Mechanism of the atmospheric corrosion process of iron ......................................... 9
Figure 2: Corrosion test method developed by Skinner (1993) (diagram adopted from
Skinner, 1993) ................................................................................................................ 15
Figure 3: TGA pan dimensions (where d refers to the diameter and h the height) ................ 38
Figure 4: Phase diagram of TEA-acetic acid binary mixtures; ◊ indicates LLE data obtained
by Kohler et al. (1972), ○ indicates LLE data, ♦ and ∆ VLE data obtained by Van
Klooster & Douglas (1945) at atmospheric pressure, and ● LLE data obtained in the
present study ................................................................................................................... 40
Figure 5: Liquid phase and vapour phase spectra of (a) pure acetic acid and (b) pure TEA .. 42
Figure 6: Liquid phase FTIR spectra of binary acetic acid-TEA mixtures in comparison with
pure acetic acid and pure TEA ....................................................................................... 43
Figure 7: DSC profiles of acetic acid-TEA binary mixtures in comparison with pure acetic
acid and pure TEA .......................................................................................................... 44
Figure 8: TGA-FTIR data for heating sodium bicarbonate from 25 C to 400 C at a scan
rate of 20 °C min-1
in nitrogen gas flowing at a rate of 50 mL min-1
. The maximum
absorbance of the band located near 2300 wavenumbers in the FTIR spectrum (□) and
the TGA derivative mass signal shifted by a time interval of 0.56 min (▲) are shown 45
Figure 9: TGA evaporation profiles of selected acetic acid-TEA binary mixtures compared
with pure acetic acid and pure TEA ............................................................................... 45
Figure 10: Time evolution of the gas phase FTIR spectra for a mixture with initial
composition zA = 0.33 (a) and zA = 0.20 (b) as a function of mass fraction evaporated.
The arrows indicating the time direction and the spectra for pure TEA and pure acetic
acid are shown for comparison ....................................................................................... 46
Figure 11: TEA and acetic acid calibration curves used for the determination of the
proportionality constants ................................................................................................ 47
©© UUnniivveerrssiittyy ooff PPrreettoorriiaa

x
Figure 12: Shape function profiles for pure acetic acid, pure TEA and experimental data
() for a vapour mixture. The solid line for the mixture was generated using Equation
(7) with the mix = 0.638 value determined via a least squares curve fit. According to
calculations using Equations (8) and (9), this indicates that the mixture contained
approximately 25 mol % amine ...................................................................................... 48
Figure 13: Time dependence of the mole fraction of TEA present in the released vapour. The
indicated TEA concentrations refer to the initial TEA content of the liquid phase ....... 50
Figure 14: Mole fraction of TEA released into the vapour phase as a function of the fraction
of VCI released. The indicated TEA concentrations refer to the initial TEA content of
the liquid phase ............................................................................................................... 51
Figure 15: Evaporation trend obtained for TEA-acetic acid binary mixtures ........................ 52
Figure 16: Calculated mole fractions of TEA in the liquid phase as a function of the initial
mixture composition and the fraction of VCI released. The indicated TEA
concentrations refer to the initial content of the liquid phase ........................................ 53
Figure 17: Liquid phase FTIR spectra of binary mixtures of triethylamine and hexanoic acid.
The absorption maximum at ca. 1560 cm-1
is attained at a composition corresponding to
the A1C3 complex, i.e. zA = 0.25 ..................................................................................... 54
Figure 18: The effect of amine addition on the position of the FTIR absorption bands due to
carboxylic acid (C=O), carboxylate ion (COO-) and the protonated amine in the
mixtures with amines (hexylamine and TEA) with octanoic acid ................................. 55
Figure 19: The effect of amine addition on the position of the FTIR absorption bands due to
carboxylic acid (C=O), carboxylate ion (COO-) and the protonated amine in the
mixtures of morpholine with octanoic acid .................................................................... 56
Figure 20: The effect of liquid phase composition on the absorbance maximum near
1560 cm-1
in the FTIR spectra of binary mixtures of the various amines with octanoic
acid. The absorption maximum at ca. 1560 cm-1
is attained at a composition
corresponding to the A1C3 complex for TEA, but for the other two amines it
corresponds to the A2C2 complex, i.e. zA = 0.50 ............................................................ 57
©© UUnniivveerrssiittyy ooff PPrreettoorriiaa

xi
Figure 21: The effect of liquid phase composition on the refractive index of amine-propanoic
(A) and amine-hexanoic acid (B) mixtures at 20 °C. The 1:1 and 2:1 (mole basis)
mixtures of hexanoic acid and the 1:1 mixture of propanoic acid with morpholine are
not reported because they were solids at this temperature ............................................. 57
Figure 22: DSC traces of pure amines (A) and pure carboxylic acids (B) ............................. 58
Figure 23: DSC traces of binary hexylamine and (A) acetic, (B) propanoic, (C), hexanoic
and (D) octanoic acid mixtures in comparison with pure hexylamine and pure
carboxylic acids .............................................................................................................. 59
Figure 24: DSC traces of secondary amine, morpholine, with octanoic acid mixtures .......... 60
Figure 25: DSC scans of binary TEA systems with (a) hexanoic and (b) octanoic acid
mixtures .......................................................................................................................... 61
Figure 26: DSC results for liquid mixtures: DSC melting peak temperatures for
hexylamine-octanoic acid mixtures; vaporisation enthalpies; and
vaporisation peak temperatures for triethylamine-octanoic acid mixtures ..................... 61
Figure 27: TGA evaporation rates for the neat amines and carboxylic acids measured at
50 C ............................................................................................................................... 62
Figure 28: TGA evaporation profiles of hexylamine and (A) acetic, (B) propanoic,
(C) hexanoic and (D) octanoic acid binary mixtures compared with those of pure
hexylamine and pure carboxylic acids ........................................................................... 63
Figure 29: Time it takes to reach the selected fractional mass loss values as a function of
composition of the mixtures for (A) hexylamine-acetic, (B) hexylamine-propanoic,
(C) hexylamine-hexanoic and (D) hexylamine-octanoic acid ........................................ 64
Figure 30: TGA evaporation profiles of morpholine and (A) acetic, (B) propanoic, (C)
hexanoic and (D) octanoic acid binary mixture compared to pure morpholine and pure
carboxylic acids .............................................................................................................. 66
Figure 31: Time it takes to reach the selected fractional mass loss values as a function of
composition of the mixture for (A) morpholine-acetic, (B) morpholine-propanoic,
(C) morpholine-hexanoic and (D) morpholine-octanoic acid ........................................ 67
©© UUnniivveerrssiittyy ooff PPrreettoorriiaa

xii
Figure 32: TGA evaporation profiles of TEA and the (A) acetic, (B) propanoic, (C) hexanoic
and (D) octanoic acid binary mixtures compared with pure morpholine and pure
carboxylic acids .............................................................................................................. 69
Figure 33: Time it takes to reach the selected fractional mass loss values as a function of the
composition of the mixture for (A) TEA-acetic, (B) TEA-propanoic, (C) TEA-hexanoic
and (D) TEA-octanoic acid ............................................................................................ 70
Figure 34: Time evolution of the vapour phase FTIR spectra for binary TEA-propanoic acid
mixtures with initial composition (A) zA = 0.20, (B) 0.25, (C) 0.50 and (D) 0.75 as a
function of mass fraction evaporated. The arrows indicate the time direction. The
spectra for pure TEA and pure propanoic acid are shown for comparison .................... 72
Figure 35: Time evolution of the vapour phase FTIR spectra for (A) binary morpholine-
hexanoic acid mixtures with initial composition zA = 0.67 and (B) binary morpholine-
octanoic acid mixtures with initial composition zA = .0.50 as a function of mass fraction
evaporated. The arrows indicate the time direction. The spectra for pure morpholine
and pure carboxylic acids are shown for comparison .................................................... 74
Figure 36: Mole fraction of TEA released into the vapour phase as a function of the
percentage weight fraction released by the TEA-formic acid binary mixture with an
initial composition of 33.3 mol % TEA ......................................................................... 76
Figure 37: Mole fraction of amine in the released vapour (yA) and the calculated amine mole
fraction in the liquid phase (xA) for the TEA-propanoic acid mixture with an initial
composition (a) 33.3 and (b) 50 mol % TEA ................................................................. 77
Figure 38: Mole fraction of TEA released into the vapour phase as a function of the
percentage weight fraction released by the TEA-propanoic acid binary mixture with an
initial composition of 80 mol % TEA ............................................................................ 78
Figure 39: Vapour-liquid “equilibrium” at 50 C in the TEA-propanoic acid and morpholine-
propanoic acid systems ................................................................................................... 78
Figure 40: Skinner corrosion test results on copper and mild steel for the amine-octanoic acid
mixtures with amine contents of zA = 0.25 and 0.50 ...................................................... 79
©© UUnniivveerrssiittyy ooff PPrreettoorriiaa

xiii
Figure 41: Product of vapour pressure and diffusion coefficient of the morpholine-propanoic
acid binary mixture compared with pure morpholine and pure propanoic acid ............. 84
©© UUnniivveerrssiittyy ooff PPrreettoorriiaa

xiv
LIST OF TABLES
Table 1: Reagents, molecular mass, melting and boiling points, and the suppliers ................ 34
Table 2: Experimentally determined proportionality constants for the neat amines and the
neat carboxylic acids ...................................................................................................... 75
Table 3: Experimental densities (ρ) of the neat amines, the neat carboxylic acids and the least
volatile binary mixtures in the amine-carboxylic acid systems at 50 °C. The number in
brackets indicates the concentration of the amine in the mixture in mol % ................... 83
Table 4: Gas permeability (Si = PiDAi) of the neat amines, the neat carboxylic acids and the
least volatile binary mixtures in the amine-carboxylic acid systems at 50 °C. The
number in brackets indicates the concentration of the amine in the mixture in mol % . 85
Table 5: The experimental pH values for 5 wt.% solutions, in deionised water, of 1:1 and 1:3
mixtures of the amines with octanoic acid. .................................................................... 88
©© UUnniivveerrssiittyy ooff PPrreettoorriiaa

xv
LIST OF SCHEMES
Scheme I: Schematic presentation of acetic acid dimer ring .................................................. 22
Scheme II: Schematic presentation of (A) molecular and (B) ionic amine-carboxylic acid
(A1C1) complex (Tamada & King, 1990) ....................................................................... 22
Scheme III: Schematic presentation of the 1:3 amine-carboxylic acid complex (Tamada &
King, 1990) ..................................................................................................................... 24
Scheme IV: Schematic presentation of the 1:2 amine-carboxylic acid complex (Tamada &
King, 1990) ..................................................................................................................... 24
Scheme V: Schematic presentation of an amine-carboxylic acid mixture. A and C represent
an amine and a carboxylic acid, while C···C and A+C
- represent a hydrogen bonded
carboxylic acid dimer and an amine-carboxylic acid salt respectively. ......................... 86
©© UUnniivveerrssiittyy ooff PPrreettoorriiaa

xvi
LIST OF ABBREVIATIONS
13C-NMR carbon-13-nuclear magnetic resonance spectroscopy
1H-NMR hydrogen-1-nuclear magnetic resonance spectroscopy
A amine
C carboxylic acid
DAHC diaminohexane cinnamate
DAHM diaminohexane maleate
DAHN diaminohexane nitrobenzene
DAHO diaminohexane orthophosphate
DAHP diaminohexane phthalate
DEAP 1,3-bis-diethylamino-propan-2-ol
DICHAN dicyclohexylammonium nitrite
DMP 1,3-di-morpholin-4-yl-propan-2-ol
DSC differential scanning calorimetry
DTG derivative thermogravimetry
EGA evolved gas analysis
FTIR Fourier transform infrared spectroscopy
FT-Raman Fourier transform Raman spectroscopy
LLE liquid-liquid equilibrium
Near-IR near infrared spectroscopy
NMR nuclear magnetic resonance spectroscopy
TEA triethylamine
TGA thermogravimetric analysis
UV ultraviolet radiation
UV-Vis ultraviolet visible spectroscopy
VCI(s) volatile corrosion inhibitor(s)
©© UUnniivveerrssiittyy ooff PPrreettoorriiaa

xvii
VLE vapour-liquid equilibrium
VpCI(s) vapour phase corrosion inhibitors
©© UUnniivveerrssiittyy ooff PPrreettoorriiaa

xviii
LIST OF SYMBOLS
Beer’s law equation
A absorbance [-]
T transmittance [-]
absorptivity [-]
wavelength [m]
Integrated area equation
A dimensionless absorbance [-]
ai integrated area under the absorbance curve [cm-1
]
ki characteristic constant for component i [min mg-1
cm-1
]
l layer thickness [m]
Mi molecular mass of component i [kmol kg-1
]
mi mass of component i in liquid phase [kg]
i TGA mass flux (i.e. dmi/dt) of component i entering gas phase [mg min-1
]
wi mass fraction component i in the vapour phase [-]
t time [s]
xi mole fraction of component i in the liquid phase [-]
yi mole fraction of component i in the vapour phase [-]
z distance from top of pan to liquid meniscus [m]
zi initial mole fraction of component i [-]
αi shape function for component i [-]
αmix shape function for a mixture [-]
i characteristic measure of the mixture composition, equation 7 [-]
wavenumber [cm-1
]
Corrosion efficiency equation
CR corrosion rate [μm year-1
]
©© UUnniivveerrssiittyy ooff PPrreettoorriiaa

xix
Vapour pressure and diffusion coefficient equation
A vaporisation surface area [m2]
DAi diffusion coefficient of component i in air [m2 s
-1]
M molecular mass [kg mol-1
]
Pi vapour pressure of component i [Pa]
R universal gas constant [J mol-1
K-1
]
S gas permeability [Pa m2 s
-1]
T temperature [K] or [°C]
ρ density of the liquid [kg m-3
]
Subscripts
A Amine
C Carboxylic acid
mix mixture
©© UUnniivveerrssiittyy ooff PPrreettoorriiaa

1
1 INTRODUCTION AND AIM OF STUDY
1.1 Introduction
Atmospheric corrosion is defined as a natural process resulting from the individual or
combined action of oxygen, moisture and contaminants (e.g. acid rain, hydrogen sulphide,
chlorides) present in air with the metallic surface (Rozenfeld, 1981; Sastri, 1998; Roberge et
al., 2002; Andreev & Kuznetsov, 2005). Protection of metals against atmospheric corrosion
with corrosion inhibitors is an intensively developing method. Corrosion inhibitors are
compounds that when added to corrosive environments in relatively small quantities,
drastically reduce the corrosion rate (Sastri, 1998; Vuorinen et al., 2004). Corrosion
inhibitors find application in a wide variety of industries such as petroleum, gas and water
systems, engine coolants, construction and packaging (Sanyal, 1981; Ahmad, 2006).
The present study focuses on volatile corrosion inhibitors (VCIs), also referred to as vapour
phase corrosion inhibitors (VpCIs) (Estevão & Nacimento, 2001; Bastidas et al., 2005;
Andreev & Kuznetsov, 2005). This subclass of VCIs is used to protect metal substrates
against atmospheric corrosion during storage and transportation (Skinner, 1993; Roberge,
2000; Estevão & Nacimento, 2001; Vuorinen et al., 2004; Andreev & Kuznetsov, 2005;
Bastidas et al., 2005; Choi et al., 2012). The inhibitive mechanism comprises adsorption on
the metal surface, followed by the formation of a passive film or a protective barrier layer
which limits the penetration of corrosion-causing contaminants (Vuorinen et al., 2004;
Bastidas et al., 2005; Andreev & Kuznetsov, 2005). The protective barrier layer does not alter
the bulk properties of the metal (Bastidas et al., 2005).
For an inhibitor to be classified as a VCI it must be sufficiently volatile to allow fast
migration to the metal surface and rapid development of the protective layer (Vuorinen et al.,
2004; Bastidas et al., 2005). The vapour must also be able to retard the corrosion rate
(Ramachandran et al., 1996; Bastidas et al., 2005). Thus volatility is the main property of
VCIs that distinguishes them from other corrosion inhibitors (Vuorinen & Skinner, 2002;
Vuorinen et al., 2004; Bastidas et al., 2005). VCIs provide an effective, simple and reliable
way of controlling corrosion in closed systems and environments (Skinner, 1993; Vuorinen et
al., 2004; Andreev & Kuznetsov, 2005). They volatilise at temperatures typical of tropical
climates. They should be non-toxic and safe to use (Skinner, 1993; Vuorinen & Skinner,
2002). Proper use of VCIs considerably lengthens the service life of machinery without
©© UUnniivveerrssiittyy ooff PPrreettoorriiaa

2
promoting any other forms of corrosion, such as pitting (a localised form of corrosion that
results in excessive metal loss or holes in the metal (Skinner, 1993).
The efficiency of VCIs is affected by the ambient temperature and humidity, the
concentration of the inhibitor and the method of application. It is also influenced by the
presence of corrosive contaminants. Generally, VCIs prevent atmospheric corrosion, as long
as the chemicals remain active (Dutton, 2004; Bastidas et al., 2005). Metal packaging
materials should therefore be chosen carefully to retain the VCIs and to prevent deactivation
due to ultraviolet (UV) exposure (Badran et al., 1982; Hassan et al., 1990; Skinner et al.,
1999; Vuorinen & Skinner, 2002; Vuorinen et al., 2004; Bastidas et al., 2005; Cano et al.,
2005; Vuorinen & Focke, 2006).
A wide range of chemical compounds have been proposed as VCIs (Vuorinen & Skinner,
2002; Quraishi & Jamal, 2002; Andreev & Kuznetsov, 2005; Bastidas et al., 2005; Rammelt
et al., 2011). Amines, carboxylic acids and, in particular, their mixtures are used as VCIs to
protect steel and ferrous metals against atmospheric corrosion during storage and
transportation (Vuorinen & Skinner, 2002; Bastidas et al., 2005; Vuorinen & Focke, 2006;
Kondo, 2008; Rammelt et al., 2009). Suitable combinations show a synergistic effect that is
attributed to the development of a thicker barrier layer on the metal surface, which limits the
penetration of corrosion-causing contaminants (Bommersbach et al., 2005). The interactions
between amines (A) and carboxylic acids (C) are therefore particularly relevant to this class
of VCIs. These interactions have been comprehensively investigated in many studies (Kohler
et al., 1972; Kohler & Hyskens, 1976; Hyskens et al., 1980; Kohler et al., 1981a & b;
Karlsson et al., 2001; Orzechowski et al., 2000). Carboxylic acids have a strong tendency to
dimerise as each pair can form two hydrogen bonds in a planar ring formation (Kohler et al.,
1981a & b). Amines and carboxylic acids can also interact strongly via Brønsted-Lowry acid-
base reactions and hydrogen bonding interactions to form a series of ACn complexes, with n
ranging from 1 to 3 (Kohler et al., 1972; Kohler & Hyskens, 1976; Bobik, 1977; Kubilda &
Schreiber, 1978; Kohler et al., 1981a; Pajdowska & Sobczyk, 1982; Wiezejewska-Hnat et al.,
1980; Friberg et al., 1990; Karlsson et al., 2001; Päivärinta et al., 2001). The A1C1 ionic
complex requires stabilisation. Ab initio calculations have shown that, at equimolar mixing
ratios, the formation of an A2C2 complex is more likely (Kohler et al., 1981a; Päivärinta et
al., 2001; Karlsson et al., 2001). In the absence of water and in the presence of excess
carboxylic acid, the A1C1 complex of tertiary amines is stabilised by reacting with the cyclic
dimers of the carboxylic acid, forming the A1C3 complex (Kohler & Hyskens, 1976; Bobik,
©© UUnniivveerrssiittyy ooff PPrreettoorriiaa

3
1977; Päivärinta et al., 2001). However, when the tertiary amine is replaced with a secondary
or a primary amine, the situation changes and the 1:1 complex becomes increasingly
important. In the case of primary amines, there is a tendency for these to form large clusters
(Kohler et al., 1981a & b).
In commercial practice amine-carboxylic acid-based VCIs are generally incorporated into
polymeric films, coatings, greases, functional fluids, cleaning systems, hydro-testing
solutions and concrete, and in capsules. In some instances VCIs have also been adsorbed onto
diatomaceous earth and zeolites for controlled release (Estevão & Nacimento, 2001;
Vuorinen & Skinner, 2002; Boyle, 2004; Vuorinen & Focke, 2006; Rammelt et al., 2009;
Choi et al., 2012). The VCI-containing film is then used to wrap metallic equipment during
storage and transportation (Vuorinen & Skinner, 2002; Bastidas et al., 2005; Rammelt et al.,
2009). The efficiency of amine-based corrosion inhibitors results from their ability to form a
hydrophobic adsorption layer to shield the metal surface from corrosive contaminants
(Rammelt et al., 2011).
1.2 Brief history of VCIs
In the past a protective oil coating was utilised to protect metallic equipment from
atmospheric corrosion during storage and transportation (Vuorinen et al., 2004; Vuorinen &
Focke, 2006). The problem with this was that it was necessary to remove the oily coating
from the surface of the metal before applying paint or welding. This extra step increases costs
and the method was also not practical enough (Pereira & Tavares, 2004; Vuorinen & Focke,
2006).
The discovery of VCIs dates back to the early 1900s. During this period VCIs were
developed for the protection of ferrous metals in tropical environments (Miksic, 1975). Shell
patented the use of VCIs for corrosion inhibition in the 1940s (Andreev & Kuznetsov, 2005).
The first VCI chemical to be discovered was dicyclohexylammonium nitrite, abbreviated to
DICHAN. Following this discovery, DICHAN was then utilised to protect military
equipment in the Second World War. However, the approach proved limiting because of the
incompatibility of these VCIs with non-ferrous metals (Miksic, 1975). The use of VCIs was
later adopted and modified by other companies as a powder and paper coating to protect other
metallic parts from corrosion as well. The main challenge at the time was that the nitrite only
protects iron and aluminium, but attacks copper and bronze. The disposal of nitrites was also
©© UUnniivveerrssiittyy ooff PPrreettoorriiaa

4
causing environmental problems and it was difficult to calculate the exact application dose
(VCI-2000).
Solutions to some of these problems were devised in the 1950s (VCI-2000). Continued
research provided new methods and new products with improved inhibition efficiencies.
Nitrites are still acceptable in most countries, e.g. the United States, and Japan and Germany
continue to produce sodium nitrite products because they are inexpensive. In addition,
sodium nitrites have performed well in number of tests. The result is that the environmental
implications are largely ignored. From the 1970s to date research into alternative VCIs for
different metallic surfaces has received considerable attention. New methods have been
developed and alternative VCIs are now commercially available in a wide variety of forms.
Recent investigations revealed that the active ingredient in VCIs includes products of the
reaction between a volatile amine (or amine derivative) and an organic acid. These VCI
products are referred to as ‘amine carboxylates’. Widely used amines in VCIs include
cyclohexylamine, dicyclohexylamine, guanidine and other primary, secondary and tertiary
amines (Kuznetsov et al., 2007).
1.3 Problem statement
Corrosion products may form away from the surface of the corroding metal, resulting in an
uneven surface. This makes it difficult to control the atmospheric corrosion process and later
results in metals developing holes and even in metal failure. When this happens, problems
such as fires, explosions, leakages, factory blasts, collapse of bridges, pollution and
environmental catastrophe may occur (Bastidas et al., 2005; Hays, 2010). The direct cost of
corrosion worldwide is estimated to be between 1.3 and 1.4 trillion Euros, i.e. approximately
3.1 to 3.5% of annual worldwide gross domestic product (GDP) (Hays, 2010). This figure
does not include environmental damage, waste of resources, loss of production and personal
injuries caused by corrosion (Hays, 2010). A study conducted by the University of the
Witwatersrand estimated that the direct cost of corrosion to the South African economy was
R154 billion in 2005. The metals most affected are iron and steel (Hays, 2010).
A sound knowledge and study of the corrosion process will help in choosing the design and
materials necessary for maintaining high standards in the metals industry. In order to produce
metals from their ores, an input energy is required (Myles & Associates, 1995) and energy is
an expensive commodity (Hays, 2010). Corrosion prevention will increase the service life of
the metal, reduce the unnecessary costs caused by corrosion and result in energy saving. The
©© UUnniivveerrssiittyy ooff PPrreettoorriiaa

5
VCIs method of protection provides a reliable way of controlling atmospheric corrosion in a
closed system/environment.
By definition, a VCI is a volatile compound (or mixture of such compounds) capable of
forming a relatively stable bond at the metal interface, thus limiting atmospheric corrosion
(Bastidas et al., 2006). Vapour pressure is an important parameter in determining the
effectiveness of VCIs. A vapour pressure that is too low leads to the slow establishment of
corrosion protection, which may result in it being insufficient. On the other hand, if the
vapour pressure is too high, the effectiveness of VCIs will be limited to a short period of
action due to high consumption rates. Therefore the VCIs must have enough vapour pressure
in order to ensure rapid protection of metals because too high a volatility may lead to an early
loss of and inhibitor’s activity (Estevão & Nacimento, 2001; Bastidas et al., 2005; Andreev &
Kuznetsov, 2005; Pieterse et al., 2006).
Amines and carboxylic acid mixtures are used as VCIs to protect metals such as iron and
steel from atmospheric corrosion, as already mentioned. The vapour pressure of amine-
carboxylic acid mixtures at ambient temperature is very low (Pieterse et al., 2006). Therefore
studies in the gas phase pose many difficulties because the experiments have to be carried out
at high temperatures. A solution to some of these problems was devised by using the infrared
matrix isolation technique (Wiezejewska-Hnat et al., 1980). However, it is difficult to avoid
the adsorption of carboxylic acids on the surface of the needle valves during the deposition of
the gas mixture when using the matrix isolation technique. This makes determining the actual
mixture composition in the gas phase complicated. Kubilda & Schreiber (1978) used Fourier
transform infrared spectroscopy (FTIR) to study trimethylamine mixtures with acetic acid
and trifluoroacetic acid at high temperatures. However, they did not disclose how the gaseous
spectra were collected. Due to the complications encountered, excess amine was used
frequently to prevent formation of carboxylic acid dimer and to avoid contamination, making
it possible to study only the A1C1 complex.
1.4 Aims and objectives
The study of the vaporisation of amine-carboxylic acid-based VCI model systems may
provide a solution to some of the problems encountered when using VCIs. It is therefore of
importance to understand the nature, the mechanism of action and the implications of volatile
actives. The considerable work done in the area of amine carboxylic acid has focused mainly
on determining the density, viscosity and melting and boiling points, on volumetric
©© UUnniivveerrssiittyy ooff PPrreettoorriiaa

6
measurements, ultrasonic relaxation and on the Raman, nuclear magnetic resonance (NMR)
and FTIR spectra (Kohler et al., 1972; 1974; Bobik, 1977; Kohler et al., 1981a & b; Hafaiedh
et al., 2009).
The literature on the characterisation of the vapours released by VCIs is limited. The aim of
the present study is to develop a thermo-gravimetric analysis (TGA) method that will help in
the characterisation of the composition of the vapours released by VCIs. This characterisation
method may provide reasons for the strange behavioural reports that corrosion is enhanced
when non-stoichiometric amounts or too little are used. In spite of the fact that VCIs have
been used for many years for inhibiting atmospheric corrosion, their mechanism of action is
still not completely clear and this study may also help to clarify the mechanism of action of
VCIs.
The present study is divided into two parts. The first part introduces the proposed VCI
characterisation method. In this part triethylamine (TEA)-acetic acid mixtures were used as
the model compound to validate the method because much data was available on this system.
The method involved studying the evaporation of amine-carboxylic acid binary mixtures
using TGA, and examining the nature of the vapours released by FTIR. In addition, the
released vapours were quantified in order to find out how much of each component was
present in the vapour phase. The TGA-FTIR method was selected in this study because of the
relatively low costs of the instrumentation, and the simplicity of these two techniques. The
thesis also provides information on the individual layers of liquid-liquid phase-separated
amine-carboxylic acid binary mixtures.
The second part of this study focuses on the application of the developed TGA-FTIR method
of analysis to a series of VCI model systems containing primary, secondary and tertiary
amines (hexylamine, morpholine and triethylamine) and aliphatic carboxylic acids with
different chain lengths (acetic, propanoic, hexanoic and octanoic). Corrosion tests were also
performed on these model systems to determine their effectiveness as VCIs on mild steel,
galvanised steel and copper metals. As mentioned earlier, vapour pressure is an important
parameter in the effectiveness of the VCI. Therefore the study also involved determining the
products of vapour pressure and the diffusion coefficient of the model systems.
©© UUnniivveerrssiittyy ooff PPrreettoorriiaa
7
1.5 Dissertation outline
This dissertation is divided into five chapters. Chapter 1 gives a general overview of
atmospheric corrosion, a brief introduction to corrosion inhibition, as well as the range of
industries where corrosion inhibitors are used. This is followed by the classification of
corrosion inhibitors and a brief background on volatile corrosion inhibitors. The chapter also
discusses the problems encountered when corrosion is not controlled. This is followed by the
aims and objectives of the present study.
Chapter 2 is the literature review. It starts by giving a detailed explanation of the corrosion
process. This is followed by information on the commercially available forms of VCI, with
the advantages and disadvantages of using a particular form. The mechanism of action of
VCIs is also discussed. The chapter also reviews the different methods that are used to test
the efficiency of VCIs, the factors affecting their effectiveness, amine carboxylic acid
mixtures, and the effect of water on mixtures of amines and carboxylic acids. A brief review
of the techniques used to characterise amine-carboxylic acid mixtures is presented. The
chapter concludes by briefly discussing the coupling of thermo-gravimetric analysis (TGA)
with Fourier transform infrared spectroscopy (FTIR).
Chapter 3 gives the information on all the experimental work carried out in the study,
including the reagents and their properties. This chapter also gives the details on how the
mixtures were prepared for the present study, the experimental conditions and the
instrumentation used for characterisation.
Chapter 4 presents the results. This chapter is divided into two parts. The first part gives
information on the development of the TGA-FTIR method using TEA (triethylamine)-acetic
acid as the model compound. This chapter gives the liquid phase FTIR and DSC (differential
scanning calorimetry) results, after which the results of the TGA study on the evaporation of
mixtures and on following the emitted vapours by FTIR, are presented. The quantification
procedure is fully described. The second part of the chapter focuses on the application of the
developed TGA-FTIR method to the series of amine-carboxylic acid mixtures and also
provides information on the corrosion tests that were performed.
Chapter 5 presents the discussion of the results. This chapter gives detailed discussions of all
the results presented in Chapter 4.
This is followed by the conclusions in Chapter 6, the references and the appendices.
©© UUnniivveerrssiittyy ooff PPrreettoorriiaa

8
2 LITERATURE REVIEW
Atmospheric corrosion is an electrochemical process that involves acid-base interactions
between the metal ions formed and other species present in the electrolyte (Ramachandran et
al., 1996; Roberge et al., 2002). (An electrolyte is a solution containing free ions capable of
conducting electrical current, such as moisture.) The rate of any given electrochemical
corrosion process depends largely on the rate of an anodic and a cathodic reaction at the
metal surface (Rozenfeld, 1981). Anodic reactions entail oxidation and consist of transferring
a metal ion from the lattice to the solution, with the liberation of electrons (Rozenfeld, 1981).
Atmospheric corrosion is divided into two types: dry and wet corrosion (Du Preez, 1998).
Dry atmospheric corrosion is a result of the direct chemical reaction of the metal with the
environment, thereby forming the oxide layer on the surface of the metal. Wet corrosion is an
electrochemical process and it takes place in neutral or acidic environments (Myles &
Associates, 1995). The presence of an electrolyte is essential in wet corrosion (Du Preez,
1998).
Atmospheric corrosion occurs due to the high concentrations of oxygen in air, water or
moisture droplets (from air) and of dissolved ions present on the surface of the metal (Kui et
al., 2008). If one considers metallic iron as an example (see Figure 1), iron is oxidised in the
anodic region, resulting in the formation of soluble ferrous ions (Fe2+
), while the dissolved
oxygen is reduced in the cathodic region to form OH- ions. The ferrous ions and OH
- ions
then combine to form a solid deposit Fe(OH)2 on the metal surface. As the solubility of this
solid deposit is relatively high, the dissolved Fe(OH)2 can be further oxidised by access to
dissolved atmospheric oxygen to form ferric ions (Fe3+
). These unstable ferric ions later
convert to form an insoluble ferric oxide (Fe2O3) layer on the surface of the corroding iron
metal (Roberge et al, 2002; Kui et al., 2008; Tamura, 2008). This layer is commonly known
as rust. The ferric ions in rust can be further reduced in the cathodic region to form FeO-
Fe2O3 product, which contains both ferrous and ferric ions. The reduction of ferric ions is a
cyclical process that can be speeded up by variations in the temperature and in the moisture
coverage (Roberge et al., 2002; Kui et al., 2008). This results in the metal having an uneven
surface and holes, which makes it difficult to stop the atmospheric corrosion process. The
main factors that accelerate the atmospheric corrosion of metals are relative humidity, acid
rain and trace volatile contaminants (pollutants), such as hydrochloric acid (Roberge et al.,
2002).
©© UUnniivveerrssiittyy ooff PPrreettoorriiaa
9
Relative humidity
Atmospheric corrosion requires a critical relative humidity level, below which corrosion does
not occur (Syed, 2006). This level varies, depending largely on the nature of the corroding
material and the tendency of the corrosion products and surface deposits to absorb moisture
(Sastri, 1998; Roberge et al., 2002). Values for the critical humidity level also differ for
various pollutants. For example, the value is 60% for sulphur dioxide but higher for chloride
pollutants (Sastri, 1998). The thin electrolyte layer that forms on the metallic surface is an
essential requirement for the atmospheric corrosion process to occur when the metal is
exposed to a critical level of humidity (Roberge et al., 2002; Hœrlé et al., 2004). The
corrosion rate of the metal increases sharply beyond the threshold level of a critical relative
humidity (Hœrlé et al., 2004; Ahmad, 2006). In the presence of thin-film electrolytes,
atmospheric corrosion proceeds by balanced anodic and cathodic reactions, where the anodic
reaction involves attack of the metal and the cathodic reaction is oxygen reduction (Roberge
et al., 2002; Hœrlé et al., 2004).
Figure 1: Mechanism of the atmospheric corrosion process of iron
Anodic regionCathodic region
Iron
Atmosphere
O2
O2
Moisture film
Fe(s) Fe2+ + 2e-
Fe2+
O2 + 2H2O + 4e- 4OH-
e-
OH-
Fe(OH)2
2Fe(OH)2 + 1/2O2 2FeO(OH) + H2O
Fe2O3 + H2O
Air
Metal edge
©© UUnniivveerrssiittyy ooff PPrreettoorriiaa
10
Acid rain
Acid rain is a rain that possesses elevated levels of hydrogen ions (has low pH values). In the
presence of atmospheric gaseous pollutants such as sulphur dioxide, atmospheric corrosion
increases considerably. Atmospheric pollutants such as sulphur dioxide dissolve in water and
upon oxidation it produces sulphuric acid by the following reaction sequence (Sastri, 1998;
Du Preez, 1998; Kui et al., 2008):
SO2 + H2O H2SO3 (sulphurous acid)
SO2 + 2Fe2O3 FeSO4 + Fe3O4
The acids that form further facilitate the atmospheric corrosion process of the metal; this
phenomenon is known as the acid-rain effect (Sastri, 1998). Acid rain increases the rate of
atmospheric corrosion of metals considerably because it promotes the formation of a thicker
electrolyte layer on the metal surface (Ahmad, 2006).
Contaminants (pollutants)
Among the various contaminants present in salt, chloride has the greatest effect on
atmospheric corrosion. Once chloride is adsorbed, tenacity of adherence is so great that it
cannot be desorbed by using only simple surface-cleaning techniques (Sastri, 1998).
Chlorides accelerate atmospheric corrosion by being oxidised in the metallic anode region
due to the presence of atmospheric oxygen in air (Tamura, 2008):
Fe + 2HCl FeCl2 + H2O
FeCl2 + (1/4)O2 + (5/2)H2O Fe(OH)3(s) + 2HCl
In general, a combination of high relative humidity, high temperature and high levels of
pollutants increases the rate of atmospheric corrosion of metals.
Atmospheric corrosion can be prevented by using VCIs, as mentioned in the previous
chapter. VCIs function by changing the kinetics of the electrochemical reactions causing the
corrosion process (Rozenfeld, 1981). In general, corrosion inhibitors restrict the anodic and
or cathodic processes by blocking the active sites on the metal surface. Alternatively, an
inhibitor may work by increasing the potential of the metal surface so that the metal enters
the passivation region where a protective oxide film forms. Some corrosion inhibitors inhibit
©© UUnniivveerrssiittyy ooff PPrreettoorriiaa

11
corrosion by contributing to the formation of a thin protective film on the metallic surface. In
summary, the performance of corrosion inhibitors is often related to (Sanyal, 1981):
The chemical structure and physicochemical properties of the compound that is used
as an inhibitor
The adsorption of molecules or their ions on anodic and or cathodic sites
An increase in cathodic and/or anodic over-voltage
The formation of protective barrier films, consisting of complexes or films produced
as a result of the interaction between the metal, its ions and ions available in the
surroundings.
2.1 VCI formulations
VCIs are commercially available in different forms, i.e. liquids, powders, sachets, tablets,
films and emitters (Bastidas et al., 2005). Some available VCI forms are briefly summarised
below:
VCI powders
Powders are the cheapest form of VCI among all the available forms. The powder forms of
VCIs are easily transported. The disadvantage of some VCI powders is that they are
flammable and the suspension of flammable powder in air during usage can be explosive
(Myles & Associates, 1995). While the vapours preventing corrosion may be non-toxic,
powders may be toxic when inhaled in dust form. Difficulties are also experienced with the
removal of VCI dust after usage.
VCI tablets
VCI tablets are made by compressing the VCI powder together with a polymer binder
material (Myles & Associates, 1995). The use of a polymer binder is reported to add strength
and form a thin-walled matrix in the tablet to regulate the evaporation of a volatile corrosion
inhibitor (Goldade et al., 2005). Unlike powder, tablets do not generate any dust and can be
easily removed after usage (Myles & Associates, 1995).
©© UUnniivveerrssiittyy ooff PPrreettoorriiaa

12
VCI plastic film and VCI paper
There are two types of impregnated wrapping that are mainly used: the cellulose paper type
and the polyethylene plastic type (Myles & Associates, 1995; Vuorinen & Skinner, 2002;
Pieterse et al., 2006; Rammelt et al., 2009). These VCI-containing plastics and/or papers are
generally used to wrap the metallic parts during storage and transportation (Vuorinen &
Skinner, 2002; Rammelt et al., 2009). VCI-impregnated polymeric materials are economical,
easy to use, reliable and do not pose any health hazard. Despite the considerable differences
in the physical and chemical parameters, films modified by VCIs are able to retain their
critical characteristics (Goldade et al., 2005). This method of applying VCIs is therefore a
promising type of corrosion inhibition process in the packaging industries.
VCI foam pads
A large variety of VCI foam pads are available commercially. The foam pad generally used
consists of a piece of polyurethane or polyethylene impregnated with the VCI. These pads are
normally found stuck to the inside surface of the container. However, they are only effective
for a certain period of time and they are only used for small metallic parts (Myles &
Associates, 1995).
VCI paint
This method of application involves incorporating the VCI in a paint mixture. The method is
used to protect components that are too large to be wrapped or boxed, such as vehicles. VCI
paints are generally clear varnishes that dry to form a clear film of approximately 5 µm
thickness on the metal surface. On application, the VCI diffuses through the film to reach the
targeted metal surface (Myles & Associates, 1995).
The commercially available VCIs differ in respect of volatility and the pH of the aqueous
solution (Shreir et al., 1994). The common characteristic of VCIs, despite the different forms
that they are in, is that they are intended to provide protection from atmospheric corrosion in
closed environments (Skinner, 1993; Myles & Associates, 1995; Vuorinen & Skinner, 2002;
Pieterse et al., 2006).
2.2 VCI mechanism of action
VCIs are transported to the metal surface that is to be protected via the gas phase at ambient
temperatures (Vuorinen et al., 2004). The VCI is transported to the metal surface by means of
©© UUnniivveerrssiittyy ooff PPrreettoorriiaa

13
evaporation or sublimation, diffusion and adsorption (Vuorinen & Focke, 2006; Pieterse et
al., 2006). The VCIs’ mechanism of action is not clearly understood, although the literature
suggests that the transportation can take place in two ways (Cano et al., 2005; Bastidas et al.,
2005; Rawat & Quraishi, 2003):
The inhibitor is dissociated before arriving at the metallic surface and saturates the air
in contact with the metal with the protective groups, or
The molecules are volatilised intact, without dissociating, and are only dissociated
when they reach the metallic surface
The inhibition process starts when the VCI vapour comes in contact with the metal surface.
The vapours distribute themselves within an enclosed space until equilibrium is reached
(Boyle, 2004). The equilibrium is determined by the vapour pressure of the VCI compound.
In the presence of moisture, the released non-dissociated molecules undergo hydrolysis of the
salts into carboxylate anions and organic cations (Rawat & Quraishi, 2003). The VCI
protective ions are then adsorbed onto the metal surface. During the adsorption process, the
anions are adsorbed on the anodic site of a metal to inhibit anodic reaction, while the organic
cations are adsorbed on the cathodic site, thereby preventing the cathodic reaction. It is
claimed that the presence of π-electrons and a lone pair of electrons on the nitrogen and
oxygen atoms facilitates the adsorption of an inhibitor onto the metal surface (Quraishi &
Jamal, 2002; Rawat & Quraishi, 2003; Quraishi et al., 2005). This results in the interruption
of the electrochemical process as the ions create a protective barrier that limits the diffusion
of corrosion-causing contaminants, such as oxygen, chlorides, water and others (Boyle,
2004).
2.3 Compounds used as VCIs
A wide range of chemical compounds has been proposed for use as VCIs:
Amines: Octylamine is a good inhibitor for carbon steel, copper and brass (Subramanian et
al., 2002) and 1,3-di-morpholin-4-yl-propan-2-ol (DMP) and 1,3-bis-diethylamino-propan-2-
ol (DEAP) are good inhibitors for carbon steel (Cano et al., 2005; Gao et al., 2007).
Organic nitrites: This includes the nitrites of dicyclohexylamine (DICHAN),
cyclohexylamine, isopropylamine, disiobutylamine, triethylamine, octylamine, hexylamine
©© UUnniivveerrssiittyy ooff PPrreettoorriiaa

14
and dibenzylamine (Shreir et al., 1994; Bastidas et al., 2005; Cano et al., 2005). DICHAN is
an excellent inhibitor for carbon steel (Cano et al., 2005; Gao et al., 2007).
Organic carbonates: Carbonates of cyclohexylamine, ethylamine, guanidine and
dibutylamine are good inhibitors for steel (Fiaud, 1994).
Organic carboxylates: Benzoates of cyclohexylamine, diethylamine, triethylamine,
dibutylamine, dibenzylamine and ethylamine and the acetate of cyclohexylamine are good
inhibitors for mild steel and iron (Rammelt et al., 2011). Diaminohexane nitrobenzoate
(DAHN) is a good corrosion inhibitor for zinc, aluminium and mild steel (Quraishi & Jamal,
2002). Skinner et al. (1999) and Vuorinen & Skinner (2002) list many others.
Organic chromates: This group has certain environmental limitations, but some chromates
are good VCIs, e.g. cyclohexylamine chromate is a VCI for brass (Shreir et al., 1994).
Organic phosphates: Phosphates of alkyl and hexymethylamine are good inhibitors for
aluminium; diaminohexane phthalate (DAHP) and diaminohexane orthophosphate (DAHO)
have been found to be good corrosion inhibitors for aluminium, zinc and mild steel (Quraishi
& Jamal, 2002).
2.4 Review of the methods used to test the effectiveness of VCIs
Numerous laboratory techniques have been described in the literature for evaluating the
effectiveness of VCIs. These include, but are not limited to, Skinner’s test method, the
conical flask method, Eschke’s test method and various electrochemical measurement
methods (Duprat et al., 1981; Hassan et al., 1990). Some of these methods are described in
Sections 2.4.1 to 2.4.5.
2.4.1 Skinner’s test method
Skinner (1993) developed a quantitative method for the evaluation of VCIs. The method
involves placing a known quantity of VCI in a glass and then placing the glass in a jar (see
Figure 2). Metal specimens are mounted on the inside lids of the jar. The jar is then closed,
with the lid containing the metal specimen attached on the upper inner surface or mounted as
shown in Figure 2. This is followed by placing the jar in a heated water bath at a known
temperature and humidity. After an appropriate inhibitor film-forming period, an electrolyte
is added to the system. In this method condensation occurs at the upper inner surface of the
metal specimens. After the required duration of the test, the metal specimens are removed for
©© UUnniivveerrssiittyy ooff PPrreettoorriiaa

15
evaluation by visual inspection and weight loss determination. The corrosion rate (CR) is
then determined as (Skinner, 1993, Quraishi & Jamal, 2002; Vuorinen & Skinner, 2002;
Vuorinen et al., 2004; Quraishi et al., 2005):
The effectiveness of the VCI is then determined by measuring the improvement (Skinner,
1993):
where CR0 and CRI are the corrosion rates in µm per year determined in the absence of and in
the presence of the inhibitor respectively.
Figure 2: Corrosion test method developed by Skinner (1993) (diagram adopted from
Skinner, 1993)
©© UUnniivveerrssiittyy ooff PPrreettoorriiaa

16
Skinner’s test method was recently used to evaluate the effectiveness of VCIs using the metal
specimens zinc, copper, iron and mild steel (Skinner, 1999; Vuorinen & Skinner, 2002;
Vuorinen et al., 2004; Vuorinen & Focke, 2006). Accurate and reproducible results were
obtained using this method. The success is attributed to the fact that the method completely
eliminates equipment contamination (Skinner, 1999; Vuorinen & Skinner, 2002).
2.4.2 Conical flask method
In this method the metal specimens to be tested are suspended in conical flasks using nylon
tags (Quraishi & Jamal, 2002). The weighed amount of VCI is placed below the suspended
metals in a glass container, avoiding contact with the liquid inside the conical flask. The
concentration of the VCI used in this method depends on the size of the conical flask
(Quraishi et al., 2005). The conical flask is kept at the required temperature and relative
humidity. The samples are removed at night to allow condensation of moisture on the metals.
The cycle can be repeated for the required duration of the test. When the cycle is complete,
the metal specimens are placed in an acid bath to remove oxides. They are then weighed and
the effectiveness is calculated by using Equations (1) and (2) (Quraishi & Jamal, 2002;
Quraishi et al., 2005).
2.4.3 Electrochemical measurement methods
In this type of method the polarisation cell set up consists of an electrolyte solution, a
reference electrode, a counter-electrode and a working electrode (metal sample). The
electrodes are connected to a potentiostat (Quraishi & Jamal, 2002). The working, reference
and counter-electrodes are placed in the electrolyte solution. This solution must resemble the
actual application environment of the material undergoing testing (Quraishi et al., 2005).
Thereafter the electrochemical potential between the various electrodes in the solution is
generated. Corrosion potential is measured by the potentiostat as the energy difference
between the working and reference electrodes. In potentiometric measurements the current
remains constant while the potential is increased. In electrochemical measurements both the
potential and the current of the oxidation or reduction reactions are measured (Quraishi &
Jamal, 2002; Cano et al., 2005).
Cano et al. (2005) used both the electrochemical and potentiometric measurement methods to
evaluate the protection of carbon steel with nitrite and carboxylic acid-based VCIs. They
©© UUnniivveerrssiittyy ooff PPrreettoorriiaa

17
found that there were large inconsistencies in the inhibitive effectiveness values obtained
using the electrochemical measurement method. Several other authors obtained uneven
results with the potentiometric measurement method as well (Quraishi & Jamal, 2002;
Quraishi et al., 2005; Cano et al., 2005). Duprat et al. (1981) attributes these discrepancies in
the inhibition efficiency values to the differences in the actual principles of the methods and
the hydrodynamic conditions involved. The presence of such discrepancies indicates that the
electrochemical methods do not provide reliable and/or reproducible results. This is attributed
to the fact that the atmospheric conditions are not accurately represented in the
electrochemical measurement method (Du Preez, 1998).
2.4.4 Eschke’s test method
This corrosion inhibition test method is applicable mainly when the VCI is impregnated in
plastic films. It involves polishing known sizes of metal strips, followed by wrapping them
with a single layer of VCI-containing plastic film. The wrapped metals are then placed in a
climatic test cabinet at a known relative humidity and temperature for the required test period
(Quraishi & Jamal, 2002; Rawat & Quraishi, 2003; Quraishi et al., 2005). Similarly to the
potentiometric measurements, the Eschke test method also yielded a large spread of results
(Quraishi & Jamal, 2002).
2.4.5 Other corrosion inhibition test methods
Other reported corrosion inhibition test methods include: sulphur dioxide and salt inoculation
test methods (Quraishi et al., 2005); continuous condensation; impedance measurements; salt
spray test; Stevenson chamber; biocide action; and polarisation resistance (Duprat et al.,
1981; Submaranian et al., 2002; Rammelt et al., 2011). Among these methods mentioned in
this section, the reasonable corrosion rate and inhibitor efficiency were obtained using the
sulphur dioxide and salt inoculation test methods (Quraishi et al., 2005).
2.5 Factors affecting the effectiveness of VCIs
Corrosion is usually prevented as long as the chemicals remain active (Dutton, 2004). The
effectiveness of VCIs depends mainly on factors such as packaging material and porosity,
temperature, humidity, acidity, UV exposure and the method of application (Dutton, 2004).
Some of these factors are discussed in Sections 2.5.1 to 2.5.5.
©© UUnniivveerrssiittyy ooff PPrreettoorriiaa

18
2.5.1 pH of the system
All corrosion inhibitors have a pH range in which they are most effective. Adequate metal
protection is only reached when the pH value is in the range 5.5–8.5 (Bastidas et al., 2005).
The effective solution pH for adequate corrosion inhibition for mild steel was found to be in a
wide pH near-neutral range of 6.5–8.5 for benzoate, acetate and carbonate-based VCIs
(Rammelt et al., 2011). Nitrite-based corrosion inhibitors were found to lose their
effectiveness below a pH of 5.5–6.0. Polyphosphates were found to be effective only in the
range 6.5–7.5, while chromates are generally used at a pH of 8.5 (Shreir et al., 1994). In some
instances the effective solution pH was found to be strongly alkaline (pH ≥ 10.4). It was
found to be in the range of 9–10.3 for weak carboxylate anions such as benzoate, acetate and
carbonate, and in strong carboxylate anions it was found to be ≥ 11.4 (Rammelt et al., 2011).
This implies that effective corrosion-prevention pH is only achieved in a basic environment.
It also suggests that amine has to be present in excess in the vapour for adequate protection,
otherwise the mixtures may be corrosive. The value of the pH on the metallic surface is
influenced largely by the volatility of the VCI components (Rammelt et al., 2009).
2.5.2 Concentration of an inhibitor
It is difficult to ascertain the effect of an inhibitor concentration in the absorbed moisture film
in atmospheric corrosion. However, the performance of inhibitors used in aqueous media
clearly shows that concentration is an important factor. This is discussed further in this
section.
The efficiency of a corrosion inhibitor depends largely on the concentration of the inhibitor
(Roberge, 2000). To be fully effective, inhibitors are required to be present in a certain
minimum concentration in aqueous media. Therefore both the initial concentration and the
concentration during application are important (Shreir et al., 1994). Typically, a good
inhibitor would give >95% protection at a concentration of 0.008%, and >90% protection at a
concentration of 0.004% (Roberge, 2000). It was reported in a study of VCIs in packaging
materials that the decrease in nitrite VCI concentration in foil resulted in the corrosion
inhibitor failing to provide adequate metal protection (Eibl & Reiner, 2011). The inhibition
performance of 1,3-bis-diethylamino-propan-2-ol (DEAP) and 1,3-di-morpholin-4-yl-propan-
2-ol (DMP) for carbon steel was found to increase with an increase in concentration of the
inhibitor. Submaranian et al. (2002) also reported an increase in the inhibitor’s efficiency
with an increase in concentration of the octylamine-based VCI.
©© UUnniivveerrssiittyy ooff PPrreettoorriiaa

19
2.5.3 Temperature and humidity
The corrosion rate of metals increases with variations in temperature and humidity during
storage and transportation. The effectiveness of some inhibitors decreases with increases in
temperature and humidity (Sanyal, 1981). When inhibitors are used at higher temperatures,
higher inhibitor concentrations are required for some inhibitors to maintain their effectiveness
(Shreir et al., 1994). However, other corrosion inhibitors can lose their effectiveness
completely with an increase in temperature. A typical example is polyphosphate, which is
effective below 40 °C, but loses its effectiveness at higher temperatures because reversion to
orthophosphates is then possible (Shreir et al., 1994).
Bommersbach et al. (2005) studied the influence of temperature on the amine and carboxylic
acid-based VCIs. The study revealed that at a temperature higher than 60 °C there was low
protective efficiency for iron metal, less than 30% efficiency being obtained. This was
attributed to the iron-dissolution kinetics, which disturbs the formation of the protective layer
at high temperatures. The decreased effectiveness of corrosion inhibition at higher
temperatures is reported to be the result of desorption of the adsorbed inhibitors and the
depletion of oxygen, in the absence of which some inhibitors such as benzoate have no
protective action (Sanyal, 1981). Temperatures below 50 °C were found to conserve the
protective film on the metal surface (Bommersbach et al., 2005).
Humidity is another major factor that affects the effectiveness of VCIs. It affects the
corrosion rate of metals directly because moisture provides electrolytes, which are required
for corrosion reactions to take place. In general, an increase in humidity also results in an
increase in the corrosion rate of the metal (McConnel, 2008).
2.5.4 Vapour pressure
Vapour pressure is an important parameter for controlling effective VCI transportation
(Pieterse et al., 2006). The vapour pressure of the VCI is determined using a variety of
methods, such as the Knudsen effusion, Regnault dynamic, torsion effusion and microbalance
methods (Bastidas & Mora, 1998; Bastidas et al., 2005). The available vapour pressure
values in literature have some inconsistencies. Therefore the reproducibility of the data
depends largely on the experimental parameters and the method used to determine the vapour
pressure (Bastidas & Mora, 1998; Bastidas et al., 2005). For effective VCI transportation, the
vapour pressure should be in the range of 0.002–1 Pa at 20 °C (Skinner et al., 1999; Vuorinen
©© UUnniivveerrssiittyy ooff PPrreettoorriiaa

20
& Skinner, 2002; Vuorinen et al., 2004; Bastidas et al., 2005; Vuorinen & Focke, 2006).
A vapour pressure that is too low leads to slow establishment of protection, which may result
in insufficient corrosion protection. When the vapour pressure is too high, the effectiveness
of VCIs may be limited to a short period of action due to high consumption rates (Bastidas et
al., 2005; Pieterse et al., 2005). Therefore the volatility of VCIs should be just sufficient to
render optimum metal protection (Pieterse et al., 2006).
2.5.5 Other factors
A systems approach should be applied when considering the effectiveness of VCIs. The
corrosive environments, the type of metal, the state of the exposed surfaces, and the chemical
structure of the inhibitor all play a role. For VCIs the environment includes the presence of
water vapour but other corrosive gases, e.g. CO2 or SO2, might also be present.
The nature of the metal is important as an inhibitor that is effective for one metal may not be
effective for another (Sanyal, 1981; Shreir et al., 1994). For example, cyclohexylamine and
dicyclohexylamine corrosion inhibitors were found to be more effective for mild steel and
zinc than for copper in an SO2 environment (Subramanian et al., 1999).
The state of the metal surface has an effect. Clean, smooth metal surfaces require lower
inhibitor concentrations and full protection can be easily attained, whereas dirty or rough
metal surfaces require higher concentrations of an inhibitor with full metal protection still not
being guaranteed.
The chemical structure of the inhibitor clearly is important. Badran et al. (1982) claim that
the electron density of the nitrogen atom also plays an important role in the efficiency of the
inhibitors: an increase in electron density was reported to lead to an increase in the inhibition
efficiency. In amine carboxylates, the carboxylic acid chain length is another factor plays a
significant role in the effectiveness of VCIs. The effectiveness of ammonium monocarboxylic
acids as VCIs was found to decrease in the following order (Vuorinen & Skinner, 2002):
Ammonium caprylate > Ammonium laurate > ammonium oleate ≈ ammonium stearate
The longer the carboxylic acid chain length constituent of ammonium, the less effective the
inhibitor was found to be (Vuorinen & Skinner, 2002).
Hassan et al. (1990) studied the effect of molecular structure on the efficiency of corrosion
inhibition of aluminium metal using a series of aromatic acid derivatives. Their paper claims
©© UUnniivveerrssiittyy ooff PPrreettoorriiaa

21
that the benzene ring attached to carboxylic acid contributes to the efficiency of corrosion
inhibitors. The efficiency of the inhibitors studied was found to decrease in the following
order in alkaline and acidic environments:
Benzophenone (100%) > benzoic acid > acetophenone > benzaldehyde > benzamide
The reason for the high corrosion protection efficiency of benzophenone was attributed to its
large size which imparts better surface-coverage properties (Hassan et al., 1990). However,
due to the inductive effect of the hydrogen atom attached, carbonyl carbon benzamide was
found to be less effective than benzaldehyde.
The nature of the VCI carrier material, e.g. polymers, also plays a significant role in the
inhibitor’s effectiveness. Some VCIs lose their efficiency rapidly, resulting in an increase in
the corrosion rate and a change in the colour of some plastic carriers. However, this problem
is addressed by using a close packaging to prevent rapid loss of inhibitor (Cano et al., 2005).
Paper impregnated with sodium benzoate prevents loss of shine in carbon steel, while paper
impregnated with benzotriazole was found to be a good corrosion inhibitor for copper and its
alloys (Cano et al., 2005).
2.6 Amine-carboxylic acid interactions
Amines are organic compounds containing a basic nitrogen atom with a lone pair of
electrons. They are ammonia derivatives with one hydrogen atom being replaced by a
substituent, such as an alkyl group. Amines are divided into primary, secondary and tertiary.
They are referred to as primary when one of the three hydrogen atoms in ammonia is
replaced by an alkyl substituent; secondary when two substituents are bound to the nitrogen
atom together with one hydrogen atom, and tertiary when all three hydrogen atoms are
replaced by the alkyl group (MacMurry, 2000).
Carboxylic acids have attracted much attention due to their ability to form two hydrogen
bonds with each other (see Scheme I). The existence of these hydrogen bonds has been
previously confirmed by spectroscopy (Meyer et al., 1975; Maréchal, 1987). The interactions
of carboxylic acids with other organic solvents have been of interest for over 70 years.
Carboxylic acids are characterised by their tendency to withdraw electrons from the hydroxyl
group and by so doing weakening the OH bond, resulting in an increase in polarity
(MacMurry, 2000).
©© UUnniivveerrssiittyy ooff PPrreettoorriiaa

22
Scheme I: Schematic presentation of acetic acid dimer ring
The interactions between amines (A) and carboxylic acids (C) have been comprehensively
studied (Kohler at al., 1972; Kohler & Hyskens, 1976; Hyskens et al., 1980; Kohler et al.,
1981a & b; Orzechowski et al., 2000; Karlsson et al., 2001). Mixtures of amines and
carboxylic acids interact strongly via hydrogen bonding (Kohler at al., 1972; 1981a & b). In
1:1 mixtures they form either A1C1 molecular complexes in the vapour phase (Barrow &
Yerger, 1954; Gough & Price, 1968; DeTar & Novak, 1970; Nakanishi et al., 1977; Kubilda
& Shreiber, 1978; Wierzejewska-Hnat et al., 1980; Padjowska & Sobczyk , 1982; Friberg et
al., 1990; Liljefors & Norby, 1997; Päivärinta et al., 2001; Orzechowski et al., 2003 & 2007)
or ionic complexes in the liquid phase via Brønsted-Lowry acid-base reactions, as shown in
Scheme II (Karlsson et al. 2001; Päivärinta et al., 2001). The A1C1 ionic complex requires
stabilisation and ab initio calculations have shown that, at equimolar mixing ratios, the
formation of the A2C2 complex is more likely (Karlsson et al., 2001). Friberg et al. (1990)
also tried stabilising the A1C1 complex in a triethylamine-formic acid system by addition of
water. They claim that stability was reached in the presence of water. However, in the
presence of water it is also that a monomer-water complex may be formed, as previously
reported and confirmed by Fourier transform Raman spectroscopy (FT-Raman) for a ternary
system of heptanoic acid and heptylamine in water (Karlsson et al., 2001). The A1C1 complex
is highly polar owing to the polar nature of the carboxylic acid (Pajdowski & Sobczyk, 1982;
Päivärinta et al., 2001).
A
B
Scheme II: Schematic presentation of (A) molecular and (B) ionic amine-carboxylic acid
(A1C1) complex (Tamada & King, 1990)
R C
O
OH O
HO
C RR C
O
OH
2
CH3C
O
OH NR3 H+ NR3O
C-
O
H3C
©© UUnniivveerrssiittyy ooff PPrreettoorriiaa

23
The above-mentioned A1C1 complex is formed when the basic nitrogen of the amine and the
acidic proton interact. The carboxylic acid interacts directly with the nitrogen from the amine
in the initial stage (Tamada & King, 1990). At this stage the amine-carboxylic acid
interaction results in the formation of an ion pair (Tamada & King, 1990). The ionic nature of
this complex was confirmed by:
heat evolution and slight volume contraction during addition of an amine to the acid
(Kohler et al., 1972; Van Klooster & Douglas, 1945)
FTIR (Orzechowski et al., 2000; Päivärinta et al., 2001; Orzechowski et al., 2003 & 2007)
1H-NMR and
13C-NMR (Kohler et al., 1981a; Hafaiedh et al., 2009)
dielectric spectroscopy and conductivity measurements (Orzechowski et al., 2000 & 2003)
melting and boiling point measurements (Kohler et al., 1972; 1981a & b)
ultrasound absorption and relaxation spectroscopy (Bobik, 1977; Orzechowski et al.,
2000)
combinations of different measurement techniques, including density, optical refractive
index and shear viscosity (Orzechowski et al., 2003).
The nature of the interaction depends mainly upon the strength of the acid and the type of the
solvent used (Tamada & King, 1990).
In the absence of water and in the presence of excess carboxylic acid, the A1C1 complex is
stabilised by the cyclic dimers of the carboxylic acid, forming the A1C3 complex (Kohler et
al., 1972; Friberg et al., 1990; Orzechowski et al., 2000; Karlsson et al., 2001; Päivärinta et
al,. 2001; Orzechowski et al., 2003 & 2007). The formation of the A1C3 complex in
triethylamine-acetic acid and tri-n-butylamine-propanoic acid mixtures is supported by the
sharp viscosity maximum observed at the 1:3 amine to acid mole ratio (Kohler et al., 1981b;
Pajdowska & Sobczyk, 1982). The existence of these 1:3 amine-carboxylic acids (see
Scheme III) has also been confirmed in triethylamine-formic acid (Hyskens et al.,1980),
heptylamine-heptanoic acid (Kalsson et al. 2001), octylamine-octanoic acid (Friberg et al.,
1990), triethylamine-propanoic acid (Bobik, 1977) and propylamine-propanoic acid mixtures
(Päivarinta et al., 2001). The 1:3 amine carboxylic acid complex is accompanied by a
negative Gibbs free energy and a comparatively small, yet negative, TΔS term in the
©© UUnniivveerrssiittyy ooff PPrreettoorriiaa

24
triethylamine-acetic acid system (Kohler et al., 1972, 1981a & 1b). This is attributed to the
indefinite orientation of the constituent molecules and the relative dimer concentration, which
is higher in mixtures than in pure carboxylic acids (Miksch et al., 1969; Kohler et al., 1974).
Scheme III: Schematic presentation of the 1:3 amine-carboxylic acid complex (Tamada &
King, 1990)
The existence of a A1C2 complex has also been reported (see Scheme IV) (Kohler et al.,
1972; Orzechowski et al., 2000; 2003 & 2007). There is one oxygen atom in complexes A2C2
and A1C3 that accepts only a small number of electrons. In the ionised acid this oxygen is not
involved in the formation of hydrogen bonding with the ionic amine (Päivärinta et al., 2001).
On addition of carboxylic acid, the OH of the carboxyl of the second acid forms a hydrogen
bond with the conjugated CO of the carboxylate of the first acid to form a 1:2 amine acid
complex (Tamada & King, 1990). The 1:3 amine acid complex is formed when the additional
acid is hydrogen bonded to the 1:2 complex. The complexes are formed with either free
amine or free acid as the by-products, depending on the initial mole fraction of each
component in the mixture (Kohler et al., 1981a; Tamada & King, 1990; Päivärinta et al.,
2001).
Scheme IV: Schematic presentation of the 1:2 amine-carboxylic acid complex (Tamada &
King, 1990)
H+ NR3O
C-
O
H3C
H
O
C
CH3
O
H
O
C CH3
O
H+ NR3O
C-
O H O
C
O
CH3
H3C
©© UUnniivveerrssiittyy ooff PPrreettoorriiaa

25
Kohler et al. (1981b) indicated that the methyl protons of triethylamine are not completely
attached to the nitrogen, as confirmed by NMR spectroscopy. This finding disagrees with the
suggestion by Hyskens et al. (1980) that at excess acid almost all amine is in the ammonium
form. Kohler et al. (1981a) suggest that the orientationally ill-defined aggregate is closely
connected to the polarisation of hydrogen bonds, which can be influenced by ions.
When the tertiary amine is replaced with a secondary or a primary amine, the situation
changes dramatically. The A1C1 complex becomes increasingly important and in the case of
primary amines, there is a tendency for these to form large clusters (Kohler et al., 1981a).
Similar results were also obtained in a study of the octylamine-octanoic acid (Friberg et al.,
1990) and heptylamine-heptanoic acid systems (Karlsson et al., 2000).
Hyskens et al. (1980) and Kohler et al. (1981a) suggest that in systems containing carboxylic
acids with two or more carbon atoms, or containing primary amines, the degree of ionisation
of amine in the presence of an excess acid is markedly lower than one. This is contrary to
ternary amines and formic acid systems. With FTIR the continuous ionisation of added amine
is observed at an excess in the system of octylamine-octanoic acid (Friberg et al., 1990).
However, the system precipitates with equimolecular compounds and therefore it was not
studied for all proportions. Similar results were obtained by Karlsson et al. (2000) in the
system of heptanoic acid and heptylamine. In their study the acid and amine mixture was
miscible in all proportions. However, the 1:3 complex did not form at excess acid; only 1:1
amine acid stoichiometry was present. The absence of the 1:3 complex is also reported in
excess tri-n-butylamine in the presence of benzene (Pajdowska & Sobczyk, 1982).
In a static permittivity and dielectric relaxation time study by Orzechowski et al. (2007), the
questionable 1:9 triethylamine-propanoic acid complex (A1C9) was mentioned at a mole
fraction 0.1 of the base. However, this complex was not discussed.
Päivärinta et al. (2001) explored the possibility of forming an AxC complex (where x > 1) in
the presence of excess amine for a binary mixture of propanoic acid and propylamine. The
results revealed the non-existence of such a complex, confirmed by 13
C-NMR, Raman, FTIR
and ab initio calculations (Karlsson et al., 2000; Päivärinta et al., 2001). In excess octylamine
only, precipitation of the ammonium carboxylate was reported (Friberg et al., 1990).
The possibility of proton transfer via electrostatic interaction when the amine is mixed with
the carboxylic acid during A1C1 complex formation has been addressed (Pajdowska &
©© UUnniivveerrssiittyy ooff PPrreettoorriiaa

26
Sobcyzyk, 1982; Friberg et al., 1990; Liljefors & Norby, 1997; Päivärinta et al., 2001). The
existence of proton transfer was confirmed in a ternary mixture of octanoic acid and
octylamine in formamide (Friberg et al., 1990). Near infrared spectroscopy (near-IR) studies
also indicated that there was proton transfer from the carboxylic acid to the amine
(Orzechowski et al., 2007). This was also theoretically predicted by ab initio calculations for
the trimethylamine-formic acid and propylamine-propanoic acid systems (Liljefors & Norby,
1997; Päivärinta et al., 2001). The results indicated that at low base content, the propanoic
acid exists mainly as hydrogen-bonded linear and cyclic dimers. Päivärinta et al. (2000)
claim that proton transfer from an acid to an amine takes place only in strong acids.
Orzechowski et al. (2003) suggested that the dissociation of proton transfer complexes takes
place at a mole fraction of base zA > 0.25 for a triethylamine-propanoic acid binary mixture.
Ternary systems comprising amines and carboxylic acids dissolved in non-ionising or non-
dissociating solvents, such as chloroform, carbon tetrachloride and benzene, have been
studied as well (Barrow & Yerger, 1954; Gough & Price, 1968; DeTar & Novak, 1970;
Pajdowska & Sobczyk, 1982).
Nakanishi et al. (1977) studied the charge transfer of hydrogen-bonded ternary mixtures of
acetic acid with a series of aliphatic amines in different solvents, such as n-heptane and
acetonitrile, using vacuum ultraviolet (UV) absorption. In their paper they deny the
possibility that acetic acid amines exist as ion pairs (R3N+H….CH3COO
-). This is based on
the fact that the absorption bands of (diethyl) ammonium ion and the acetate ion are located
in a shorter wavelength region than the new bands of the system. The charge transfer band of
the ion pair was expected to shift to lower wavelengths with increasing polarity. However,
the reverse tendency was observed. This behaviour was attributed to the transition to the first
excited state, which can also be regarded as charge transfer from the amine to the acetic acid
band, which is characteristic of the hydrogen bond. The existence of an ion pair was reported
for the mixture of triethylamine and benzoic acid in chloroform (DeTar & Novak, 1979).
2.7 The effect of water
The effect of water on mixtures of amines and carboxylic acids has also been studied
(Buckland et al., 1997; Karlsson et al., 2001a & b). Raman studies indicated that when water
is added to pure carboxylic acid, it breaks the cyclic acid dimers and forms an acid monomer-
water complex. However, in amine-carboxylic acid mixtures complexation in the presence of
small amount of water molecules proceeds in the same way as without water (Karlsson et al.,
©© UUnniivveerrssiittyy ooff PPrreettoorriiaa

27
2001). On amine addition, the A1C1 complex binds predominantly to excess acid instead of to
water. The A1C3 complex also exists together with the acid monomer-water complex
(Karlsson et al., 2001). The study by Buckland et al. (1997) revealed no possibility of water
hydrogen bonding with an amine. In contrast, Hafaiedh et al. (2009) reported the hydrogen-
bonded complex between triethylamine and water. This complex breaks down with an
increase in temperature, confirmed by the decrease in the volume of contraction in the
volumetric measurements (Hafaiedh et al., 2009).
In the VCI corrosion inhibition process, moisture also plays a significant role in the formation
of the protective layer on the metal surface. Mixtures of amines with OH ions were found to
show protection synergism. This synergism can be used to create effective binary amine
based-inhibitors. In these inhibitors one component inhibits corrosion and generates the OH-
ions, while the other one improves the protective effect of the mixture (Andreev &
Goncharova, 2004).
2.8 Review of amine-carboxylic acid characterisation methods
Amine carboxylic acid binary mixtures are characterised by a variety of techniques. These
include: visible and ultraviolet (UV-Vis) spectroscopy; the ultrasonic relaxation method;
FTIR; 1H-NMR; and
13C-NMR.
Other reported methods of characterising the amine-carboxylic acid mixtures include:
viscosity, density, thermodynamic, melting and boiling point measurements; ultrasound
absorption and relaxation spectroscopy; and conductivity and dielectric relaxation studies
(Van Klooster & Douglas, 1945; Kohler et al., 1972, 1974, 1981a & b; Kohler & Hyskens,
1976a; Bobik, 1977; Hyskens et al., 1980; Saeten et al., 1991; Orzechwski et al., 2000, 2003
& 2007). In the viscosity measurements the existence of 1:3 amine-carboxylic acid complex
was inferred from the position of the maximum viscosity in binary systems. Of the
characterisation techniques listed, dielectric and conductivity measurements are the most
frequently used. However, due to the high direct current conductivity of the mixtures, it is
difficult to eliminate systematic and experimental errors arising from unnoticed or
incompletely considered electrode polarisation. A solution to this problem was devised by
combining different methods of measurement, including density, optical refractive index and
shear viscosity (Orzechowski et al., 2003).
©© UUnniivveerrssiittyy ooff PPrreettoorriiaa

28
2.8.1 Ultraviolet visible (UV-Vis) spectroscopy
The analysis of amine carboxylic acid mixtures with the (UV-Vis) technique has also been
reported (Nakanishi et al., 1977; DeTar & Novak, 1979). UV-Vis measures the transition in
the electronic energy levels of the molecular bonds from the ground to the excited state. The
wavelength of the absorption peak can be correlated with the types of bond a molecule has
and is also used for determining the functional groups within the molecule. UV-Vis was used
to study the amine-carboxylic acid interactions in such a mixture. The existence of hydrogen
bonding (Nakanishi et al., 1977) and of proton transfer from acid to amine (DeTar & Novak,
1979) was confirmed using this technique. The polarity of a 1:1 complex was also indicated
by the shift in maximum wavelength in UV-Vis (Nakanishi et al., 1977).
2.8.2 Nuclear magnetic resonance (NMR) spectroscopy
1H-NMR and
13C-NMR are structural elucidation techniques that are used to give information
about the number and position of hydrogen and carbon atoms respectively in a molecule.
Kohler et al. (1981b) used 1H-NMR to investigate the existence of amine acid complexes in
ratios of 1:1, 1:2 and 1:3. These techniques also revealed, using chemical shift, that the A1C1
complex is strongly ionised, with the Et3NH+ ion having a lifetime of 10
-3s in the
magnetically excited state (Kohler et al., 1972). 13
C-NMR has also been used to characterise
the amine carboxylic acid binary mixtures (Päivärinta et al., 2001; Karlsson et al., 2001).
2.8.3 Fourier transform infrared (FTIR) spectroscopy
Among molecular vibrational spectroscopic techniques, FTIR is one of the most frequently
used for the identification of organic functional groups and also for structural elucidation.
The infrared band is found in the wavenumber region 1.3 x 10⁴ to 3.3 x 10
1 (between
microwave and UV visible light) in the electromagnetic spectrum (Socrates, 1980; Skoog et
al., 1996). The different functional groups absorb characteristic frequencies of IR radiation.
When a material is infrared irradiated, the absorbed IR radiation excites molecules into a
higher vibrational state. The wavelength of the light absorbed by a particular molecule is a
function of the energy difference between the at-rest and the excited vibrational states.
Therefore the wavelengths that are absorbed by a particular molecule or functional group are
characteristic of its molecular structure (Günzler & Gremlich, 2002).
The infrared spectrum is produced as a result of the absorption of an electromagnetic
radiation at frequencies that correlate to the vibration sets of chemical bonds from within a
©© UUnniivveerrssiittyy ooff PPrreettoorriiaa

29
molecule (Coates, 2000). The primary requirement for the molecule to absorb infrared
radiation is that there must be a net charge in dipole moment during the vibration of the
molecules or functional groups under investigation (Socrates, 1980; Coates, 2000). The
absorption frequency depends on the vibrational frequency of the molecules, while the
absorption intensity depends on how effectively the infrared photon energy can be transferred
to the molecule. This depends on the change in the dipole moment which occurs as a result of
molecular vibration (Åmand & Tullin, 2012).
The FTIR method of analysis is both a qualitative and a quantitative analytical method. In
qualitative analysis the IR spectrum of the material under investigation is collected and
compared against that of the standard or reference sample. The specificity of the FTIR
absorption bands allows computerised data searches within reference libraries to identify the
material (Socrates, 1980; Coates, 2000).
In the quantitative method the concentration of the compound is determined from the area
under the FTIR absorption bands for the selected spectrum region (Åmond & Tullin, 2012).
The concentration is obtained by establishing a standard curve from the spectra for known
concentrations using the Beer-Lambert law. This law states that for a given layer thickness
(l), the transmittance, T(), (i.e. ratio of the transmitted and the incident radiation) is directly
proportional to the concentration (c) as given below:
where A() is the absorbance and () is the absorptivity at wavelength .
For multi-component mixtures the equation becomes
The important FTIR spectral region for carboxylic acids and amines is between 1800 cm-1
and 1500 cm-1
, and between 1000 cm-1
and 850 cm-1
(Karlsson et al., 2000). The ionic nature
of the complexes formed between amines and carboxylic acids has been confirmed by both
mid-infrared and near-infrared methods (Barrow & Yerger, 1954; Wiezejewska-Hnat et al.
1980; Friberg et al., 1990; Orzechowski et al., 2007). The presence of the carboxylic acid
dimer form has been confirmed by the presence of the OH out-of-plane deformation mode at
935 cm-1
. This peak is a characteristic dimeric acid form (Karlsson et al., 2000). The broad
©© UUnniivveerrssiittyy ooff PPrreettoorriiaa

30
multiple NH2 amine wagging and twisting vibrations are found between 850 cm-1
and
750 cm-1
. Increasing the amine concentration causes the dimeric acid form peak at 935 cm-1
to disappear or decrease in intensity, confirming the decrease in acid dimers. This is
understood as the amine-acid complexation (Karlsson et al., 2000).
In carboxylic acids the undissociated acid C=O peak is expected at 1700 ± 50 cm-1
(Coates,
2000). The absorbance of this peak is high with low amine amounts and it is expected to be
reduced or to disappear with high amine content. The proton transfer results in the formation
of strong asymmetric COO- bands at 1650 cm
-1 and 1550 cm
-1 (Päivärinta et al., 2001). The
protonated amine is expected at approximately 1400 cm-1
(Whitehead, 1967). The OH
stretching vibration of the acid is observed at 3000 cm-1
. In the complex this peak is found in
the range from 3257 cm-1
to 3315 cm-1
. The stretching vibration due to the N-H bond is found
at 2895 cm-1
. This bond is involved in the hydrogen bond and it is sometimes covered under
the broad N-H band (Päivärinta et al., 2000). FT-Raman has also been used to characterise
amine-acid mixtures (Karlsson et al., 2000 & 2001; Päivärinta et al., 2001).
2.8.4 Thermo-gravimetric analysis (TGA)
Literature on the analysis of amine-carboxylic acid mixtures using TGA is limited. TGA is a
thermal analytical technique in which the change in mass of a substance is measured as a
function of temperature while the substance is subjected to a controlled-temperature
programme (Heal, 2002). The mass loss may be the result of loss of the volatile components
present in the substance (Beverley et al., 1999). TGA is used to study physical processes,
such as evaporation of a liquid, sublimation of solids and desorption of gas from the surface
of solids, for compositional analysis, and for kinetic and oxidation studies. The derivative
TGA (DTG) (dm/dt or dm.dT) signal is used for guidance if there are overlapping reactions
on TGA (Heal, 2002).
Evaporation rate studies are of interest in assessing the release of volatile active components
from commercial products (Beverley et al., 1999). The TGA method has been proposed for
estimating the volatility and/or vapour pressure of liquid mixtures (Beverley et al., 1999;
Pieterse & Focke, 2003; Pieterse et al., 2006). Beverley et al. (1999) described a TGA
method in which the sample is held in a partially filled container through which a gas flows
in vertically. The evaporation rate is determined as the slope from a linear relationship
between mass loss and time (Beverley et al., 1999).
©© UUnniivveerrssiittyy ooff PPrreettoorriiaa
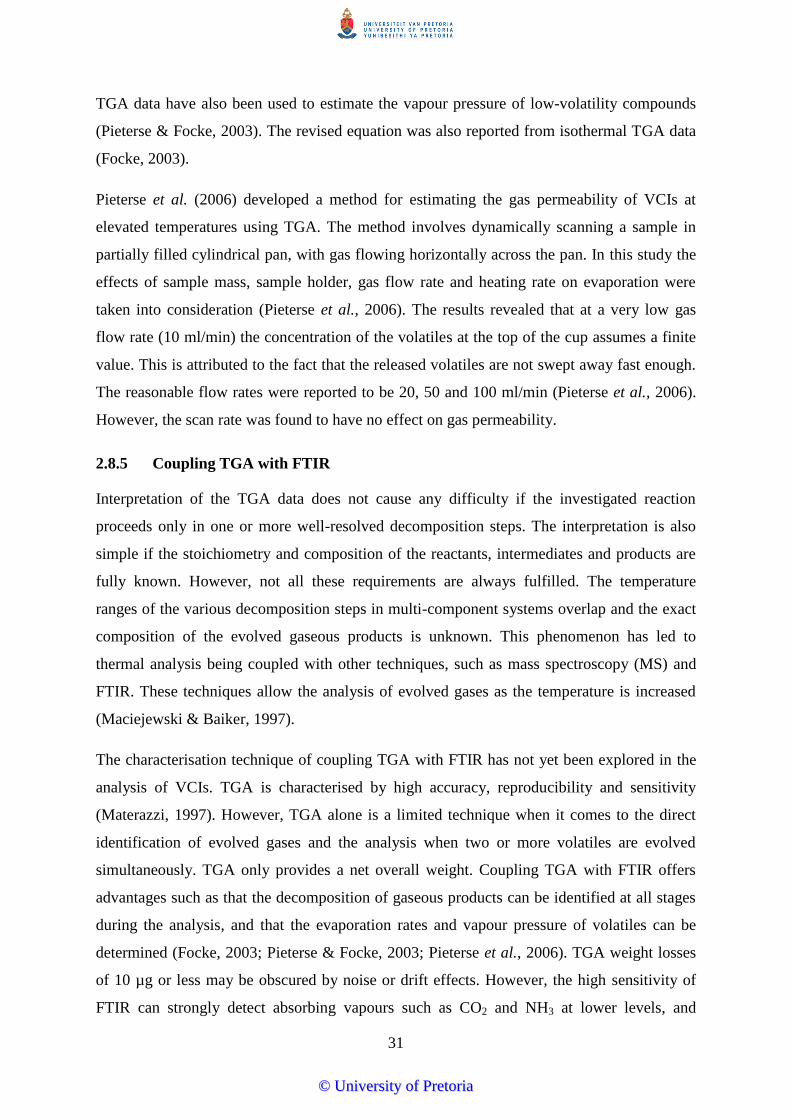
31
TGA data have also been used to estimate the vapour pressure of low-volatility compounds
(Pieterse & Focke, 2003). The revised equation was also reported from isothermal TGA data
(Focke, 2003).
Pieterse et al. (2006) developed a method for estimating the gas permeability of VCIs at
elevated temperatures using TGA. The method involves dynamically scanning a sample in
partially filled cylindrical pan, with gas flowing horizontally across the pan. In this study the
effects of sample mass, sample holder, gas flow rate and heating rate on evaporation were
taken into consideration (Pieterse et al., 2006). The results revealed that at a very low gas
flow rate (10 ml/min) the concentration of the volatiles at the top of the cup assumes a finite
value. This is attributed to the fact that the released volatiles are not swept away fast enough.
The reasonable flow rates were reported to be 20, 50 and 100 ml/min (Pieterse et al., 2006).
However, the scan rate was found to have no effect on gas permeability.
2.8.5 Coupling TGA with FTIR
Interpretation of the TGA data does not cause any difficulty if the investigated reaction
proceeds only in one or more well-resolved decomposition steps. The interpretation is also
simple if the stoichiometry and composition of the reactants, intermediates and products are
fully known. However, not all these requirements are always fulfilled. The temperature
ranges of the various decomposition steps in multi-component systems overlap and the exact
composition of the evolved gaseous products is unknown. This phenomenon has led to
thermal analysis being coupled with other techniques, such as mass spectroscopy (MS) and
FTIR. These techniques allow the analysis of evolved gases as the temperature is increased
(Maciejewski & Baiker, 1997).
The characterisation technique of coupling TGA with FTIR has not yet been explored in the
analysis of VCIs. TGA is characterised by high accuracy, reproducibility and sensitivity
(Materazzi, 1997). However, TGA alone is a limited technique when it comes to the direct
identification of evolved gases and the analysis when two or more volatiles are evolved
simultaneously. TGA only provides a net overall weight. Coupling TGA with FTIR offers
advantages such as that the decomposition of gaseous products can be identified at all stages
during the analysis, and that the evaporation rates and vapour pressure of volatiles can be
determined (Focke, 2003; Pieterse & Focke, 2003; Pieterse et al., 2006). TGA weight losses
of 10 µg or less may be obscured by noise or drift effects. However, the high sensitivity of
FTIR can strongly detect absorbing vapours such as CO2 and NH3 at lower levels, and
©© UUnniivveerrssiittyy ooff PPrreettoorriiaa

32
samples can be introduced into TGA without any chemical or physical modification
(Mittleman, 1990; Materazzi, 1997). Both qualitative and quantitative characterisation of the
material during thermal decomposition or vaporisation can be performed.
Qualitative TGA analysis is performed by comparing the recorded spectral response with the
key fragment ions and their relative intensities for known compounds with those of the
reference material (Eigenmann et al., 2006a & b). Compared with other evolved gas analysis
methods, FTIR is fast, offers high sensitivity and can detect almost all molecules except the
homonuclear diatomic gases (Eigenmann et al., 2006a).
In quantitative measurements the gas flow rate, heating rates and the spectral resolution
should be kept constant. The peak area can be calibrated to milligrams of the generated gas,
and acceptable linear concentration can be obtained using the Beer-Lambert law (Mittleman,
1990). The calibration requires the preparation of reference mixtures with varying
concentrations (Marsanich et al., 2002; Eigenmann et al., 2006a & 2006b).
Eigenmann et al. (2006a) described three methods of quantification using TGA-FTIR. The
methods are based on calibration by decomposing a sample with a well-known reaction
stoichiometry, injection of a known amount of calibration standard into the carrier gas stream
flowing through TGA and FTIR, and vaporisation of known amounts of liquids in TGA.
These quantification methods are discussed below.
Pulse calibration
In this calibration method, FTIR signal quantification is achieved by injecting (through the
installed injection ports) the pulses of a known volume before and after the decomposition of
the samples being investigated (Eigenmann et al., 2000; 2006a & 2006b). This is followed by
heating of the installed injection ports. The method requires a relatively low gas flow rate.
This is because of the short residence time in the transfer line which results in a sharp and
narrow FTIR signal (Eigenmann et al., 2006a). The method was recently used by Marsanich
et al. (2002).
Pinhole calibration
This method involves placing a known amount of liquid in a crucible. The crucible is then
closed with a lid with known pinhole diameters. This is followed by placing a sample on
TGA and this is then vaporised isothermally or by linear heating ramp (Eigenmann et al.,
©© UUnniivveerrssiittyy ooff PPrreettoorriiaa

33
2006a). The sample leaves the pan through the pinhole by diffusion until the vapour pressure
is greater than the atmospheric pressure (Slager & Prozonic, 2005). For highly volatile liquids
it is necessary to use lids with smaller pinholes (Eigenmann et al., 2006a). The carrier gas
flow is important in this method because it affects the intensity and shape of the FTIR bands
(Slager & Prozonic, 2005; Eigenmann et al., 2006a). Low flow rates lead to high maximum
intensities but increase the residence time of the evaporated molecules in TGA-FTIR. This
might result in back-mixing which leads to significant tailoring of the FTIR signal. This
makes it difficult to evaluate the peak intensities of the recorded FTIR signals. The main
disadvantage of this method is the uncontrolled evaporation of sample during experimental
settling, which means that calibration and decomposition cannot be done in one experimental
run (Eigenmann et al., 2006a).
Differential calibration
This method is based on the isothermal or non-isothermal vaporisation of a liquid compound
at different temperatures. It entails utilising low heating rates. In the differential time periods,
simultaneous monitoring of the corresponding mass losses and intensities of the FTIR signal
is required. The method involves plotting a calibration curve of mass lost versus the FTIR
integral intensity. The calibration standard and sample under investigation are placed in two
separate pans which are weighed continuously during the TGA runs (Eigenmann et al.,
2006a). Marsanich et al. (2002) used this method and the results revealed that it is only
reliable if the liquid solution under investigation has low volatility at ambient temperature.
©© UUnniivveerrssiittyy ooff PPrreettoorriiaa

34
3 EXPERIMENTAL
3.1 Reagents and suppliers
Table 1 shows all the reagents, the molecular mass, the melting and boiling points, and the
suppliers. All the reagents were used without further purification.
Table 1: Reagents, molecular mass, melting and boiling points, and the suppliers
Reagent M
(g.mol-1
)
ρ (g.cm-3
)
at 20 °C
m.p.
(°C)
b.p.
(°C)
Supplier
Hexylamine (99%) 101.19 0.77 -22.90 131.00 Merck Chemicals
Morpholine (99.5%) 87.12 1.01 -5.00 129.00 Sigma Aldrich
Triethylamine (99%) 101.19 0.73 -114.70 88.70 Merck Chemicals
Formic acid (85%) 46.03 1.22 8.40 100.80 Associated Chemical
Enterprises
Acetic acid (99.8%) 60.05 1.05 16.50 118.10 Merck Chemicals
Propanoic acid (99%) 74.08 0.99 -21.00 141.00 Merck Chemicals
Hexanoic acid (98%) 116.16 0.92 -3.40 205.00 Fluka
Octanoic acid
(99.5%)
144.21 0.91 16.70 237.00 Sigma Aldrich
Sodium hydrogen
carbonate (99%)
84.01 2.20 50.00 851.00 Merck Chemicals
Sodium sulphate
anhydrous (99%)
142.04 2.66 884.00 1429.00 Unilab
Sodium chloride
(99.5%)
58.44 2.16 801.00 1413.00 Unilab
Silica gel - - - - Merck Chemicals
Drierite 8 mesh - - - - Sigma Aldrich
pH strips - - - - Merck Chemicals
©© UUnniivveerrssiittyy ooff PPrreettoorriiaa

35
3.2 Experimental methods
Amine-carboxylic acid binary mixtures were prepared in a dry glove-box under a nitrogen
atmosphere to avoid air oxidation or contamination with moisture. The mixtures were
prepared by weighing out the predetermined amounts of the constituents. The primary amine
used in the present study was hexylamine, the secondary was morpholine and the tertiary was
triethylamine. The carboxylic acids used were formic, acetic, propanoic, hexanoic and
octanoic acids.
Each binary system consisted of the amine-acid mixture with amine mole fractions of 0.20,
0.25, 0.33, 0.50, 0.67, 0.75 and 0.80. All the experiments were performed at an atmospheric
pressure of 91.6 ± 0.3 kPa. Phase-separated amine-carboxylic acid mixtures were individually
characterised and labelled top or bottom, depending on the position of the phase-separated
layer.
Liquid-liquid phase composition data were determined by titration under reflux at
atmospheric pressure. Amine was added to a known amount of carboxylic acid at 50 °C from
a burette until the mixture became turbid. The temperature of the mixture was controlled by a
heated water bath. Each experiment was repeated at least three times for statistical purposes.
The densities of the neat amines, carboxylic acids and the selected mixtures were determined
at atmospheric pressure with a glass pycnometer. The temperature was maintained at 50 ±
1°C using a heated water bath fitted with a temperature controller.
Corrosion tests were performed on mild steel, galvanised steel and copper metal buttons
using Skinner’s corrosion test method (Skinner, 1993). The method was used as is, without
any further modifications. In this test the metal buttons are first exposed to a small quantity of
the VCI during a film forming period. This is followed by a corrosion period during which
electrolyte produces continuous condensation on the downward-facing exposed metal
surface. The test simulates relatively harsh conditions with the actual metal temperature
reaching a temperature of approximately 33 °C. In every corrosion experiment performed
new glass-wares and or equipment were used.
The full method was as follows. The metal buttons were 16.0 mm in diameter. The
thicknesses were 0.49 mm, 0.59 mm and 0.66 mm for the galvanised steel, mild steel and
copper metals respectively. The surfaces of the mild steel and copper were first polished and
rinsed several times in acetone. The polishing was omitted for the galvanised steel buttons to
©© UUnniivveerrssiittyy ooff PPrreettoorriiaa

36
avoid removing the zinc layer from the surface. The surface roughness of polished metal
buttons was determined with Bruker Dimension Icon® atomic force microscope (AFM).
Experiments were carried out in the contact mode with SNL tip (silicon tip on nitride lever).
The spring constant was 0.12 Nm-1
. For each metal, the surface roughness was determined as
an average over fifteen 50 μm image scans (captured at the scan rate of 0.2 Hz or 0.4 Hz)
performed on three different samples. The measure root mean square average of the height
deviations, from the mean image data place were 0.21 ± 0.07 μm, 0.22 ± 0.12 μm and 0.26 ±
0.14 μm and for the galvanised steel, mild steel and copper metals respectively.
Weight determinations of the individual metal buttons were performed prior to the corrosion
tests. A 10 mm hole was punched into a plastic film with an adhesive side back. This film
was placed over the metal disc with the hole located in a concentric position. This assembly
was then stuck to the inside surface of the lid of a 1 L glass preserving jar. On closing the jar
the exposed polished metal surface pointed down towards the bottom of the jar. Thus the
adhesive film held the metal buttons in place such that the metal surface area, exposed to
water vapour and moisture condensation during the corrosion test was approximately 80.8
mm2.
Approximately 250 mg of the VCI model compound to be tested was measured into a glass
vial (diameter ca. 54 ɸ mm; height ca. 60 mm) and placed inside a 1 L glass jar. The lid was
closed and jar was partially submerged in a water bath with temperature set at 40 °C. About
one third of the jar protruded above the water level. Following a 72 h film forming period,
electrolyte was added to the 1 L jar and it was left for another 72 h at 40 °C. This corrosive
electrolyte was prepared by dissolving approximately 148 mg of sodium sulphate, 165 mg of
sodium chloride and 138 mg of sodium hydrogen carbonate in 1 L of deionised water.
At the end of this period the metal buttons were removed from the lid. Following an
evaluation by visual inspection, the surfaces of the metal buttons were cleaned by rinsing
them several times with acetone. They were left to dry before mass loss was determined.
Every experiment was repeated at least three times for statistical purposes. Eight blanks were
run for each metal to provide a reference corrosion rate under the test conditions used. These
test specimens were treated in the same way except that no corrosion inhibitor was added.
The corrosion rate (CR) and inhibitor effectiveness of each sample in μm year-1
were
estimated from the mass loss determinations using mass loss determinations using Equations
(1) and (2) (given in Chapter 2).
©© UUnniivveerrssiittyy ooff PPrreettoorriiaa

37
In a separate set of experiments, the corrosion tests were repeated up to the end of the film
forming period. At this point the vials were removed and weighed to determine how much of
the VCI model compound had evaporated. In addition, vials containing 250 mg VCI mixture
were placed in a convection oven set at 40 °C. They were removed after 72 h and the mass
loss was recorded.
The pH for the selected VCI model compounds was determined using Schott® instruments
lab 860 pH meter. The pH meter was calibrated before measurements by using the standard
solutions. Solutions containing approximately 5 wt. % VCI model compound in deionised
water were prepared. The pH of the VCI solutions was determined by submerging the probe
into a VCI solution while stirring and recording the values for each solution. The probe was
thoroughly rinsed with deionised water prior to placing in a solution for pH measurement.
The refractive indices of the amines, carboxylic acids and their mixtures at 20 °C were
determined using an ATAGO® NAR-liquid instrument (Model DTM-N) with digital thermo-
meter supplied by ATAGO Ltd (Japan). One or two drops of the sample were placed on the
polished surface of the refracting prism. The incident prism was closed and locked using the
knob so that the liquid was evenly distributed on the face of the refracting prism. This was
followed by closing the refraction mirror and opening the light shield for the incident prism.
The refractive index was measured by viewing the mixture through the eyepiece. The
dispersion was adjusted using a correction knob until a clear light/dark boundary was seen.
This boundary was lined up exactly in the centre of the cross-hairs and the refractive indices
were determined from the scale below the boundary. After each measurement the surface was
cleaned and dried to avoid contamination. The accuracy of the refractometer was checked by
using the standards with known refractive index values and comparing the reported values
with the measured values before and after the measurements.
3.3 Instrumentation
The binary mixtures were characterised using simultaneous TGA-FTIR. Data were collected
by means of a Perkin-Elmer TGA 4000 thermogravimetric analyser coupled with a Spectrum
RX 100 spectrometer with a 1 m TL800 EGA transfer line. A 180 μl open aluminium pan
was partially filled with 85 ± 5 mg of sample. The pan dimensions are shown in Figure 3. The
sample was heated from 25 to 50 °C, at a heating rate of 20 °C min-1
and kept isothermal at
50 °C for the duration of the test period. The high test temperature of 50 °C was selected to
maximise volatility and because it corresponds to the highest temperature at which VCIs are
©© UUnniivveerrssiittyy ooff PPrreettoorriiaa

38
expected to function during commercial use. The data were collected under nitrogen (N2) at a
flow rate of 50 mL min-1
to prevent oxidation. The evolved gases were transferred from the
TGA to the FTIR cell at a flow rate of 30 mL min-1
. The spectra were recorded every minute
at 2 cm-1
wavenumber intervals at a resolution of 2 cm-1
. The transfer line and FTIR cell
temperature were both kept at 230 °C to avoid condensation and to dissociate all complexes.
Figure 3: TGA pan dimensions (where d refers to the diameter and h the height)
There is a time lag from the point at which vapours are released and recorded as a TGA mass
loss signal and the capture of the corresponding FTIR spectrum. The length of this time delay
was determined experimentally by monitoring the thermal decomposition of sodium
bicarbonate. This reaction releases carbon dioxide which features a strong IR absorption band
at 2349 cm-1
. Approximately 30 mg of sodium bicarbonate was placed in an open 180 μl
aluminium pan. The sample was heated from 25 to 400 °C at 20 °C min-1
under a stream of
nitrogen gas at a flow rate of 50 mL min-1
. The delay time was determined as the difference
between the time that the TGA derivative mass loss signal reached a maximum and the time
that the maximum absorption of the CO2 IR peak was reached. The experiment was repeated
at least three times for statistical purposes.
Liquid phase FTIR data were collected using a Perkin-Elmer Spectrum RX 100 spectrometer.
Samples were placed between two KBr crystal windows (25 mm diameter and 4 mm thick).
Background corrected spectra were recorded at room temperature in the wavenumber range
4000 to 800 cm-1
at a resolution of 2 cm-1
.
h = 6.68 mm h = 4.82 mm
h = 1.85 mm
d = 2.36 mm
d = 4.16 mm
d (outside) = 7.15 mm
d = 6.42 mm
©© UUnniivveerrssiittyy ooff PPrreettoorriiaa

39
Differential scanning calorimetry (DSC) was performed on a Mettler Toledo DSC1
instrument. Approximately 5–10 mg of each sample was placed in standard a 40 μL
aluminium pan with a pinhole and heated from -40 °C to 400 °C at a heating rate of 10 °C
min-1
in nitrogen flowing at 50 mL min-1
.
©© UUnniivveerrssiittyy ooff PPrreettoorriiaa

40
4 RESULTS
PART 1: METHOD DEVELOPMENT
Figure 4 shows the phase diagram for TEA-acetic acid mixtures at 1 atmosphere using the
overall amine mole fraction (zA) as composition descriptor. It summarises the previously
reported liquid-liquid equilibrium (LLE) and vapour-liquid equilibrium (VLE) phase
composition data for TEA-acetic acid mixtures (Kohler et al., 1972; Van Klooster &
Douglas, 1945). The LLE data of Kohler and co-workers deviate at higher amine
concentrations. The LLE data points determined in this study at a temperature of 50 C
(zA = 0.44 and 0.89) are plotted for comparison. They are in better agreement with the values
reported by Van Klooster & Douglas (1945).
Figure 4: Phase diagram of TEA-acetic acid binary mixtures; ◊ indicates LLE data obtained
by Kohler et al. (1972), ○ indicates LLE data, ♦ and ∆ VLE data obtained by Van Klooster &
Douglas (1945) at atmospheric pressure, and ● LLE data obtained in the present study
10
30
50
70
90
110
130
150
170
0.0 0.2 0.4 0.6 0.8 1.0
Tem
pera
ture
( C
)
zA (-)
©© UUnniivveerrssiittyy ooff PPrreettoorriiaa

41
4.1 Liquid phase FTIR
The liquid phase FTIR spectra of pure acetic acid and pure triethylamine in comparison with
their vapour phase spectra are shown in Figures 5(a) and (b). In the liquid phase pure acetic
acid shows a broad OH stretching absorption band of the dimer-bonded hydrogen form
centred at 3040 cm-1
(Marchél, 1987). The contribution due to anti-symmetric and symmetric
stretching vibration of the methyl CH3 group attached to the carbonyl is observed at
2935 cm-1, 2685 cm
-1 and 2630 cm
-1 (Päivärinta et al., 2001). A sharp absorption band of
strong intensity due to carbonyl C=O dimer form is observed at 1705 cm-1
, while the
monomer contribution is observed as a very weak band at 1760 cm-1
(Coates, 2000). A broad
band of weak intensity at 944 cm-1
is due to the OH out-of-plane deformation vibration mode
of the two hydrogen atoms in the acetic acid dimer ring (Burneau et al., 2000). The presence
of the aforementioned band suggests that acetic acid dimers are the dominant species in the
liquid phase. The methyl CH3 asymmetric and symmetric bending vibration bands are
observed at 1409 cm-1
and 1360 cm-1
respectively (Coates, 2000). The position of these
methyl bands coincides with that of the COH in-plane bending vibration at 1409 cm-1
and a
shoulder at 1366 cm-1
. The OH deformation vibration is observed at 1051 cm-1
, coinciding
with the methyl CH3 rocking mode and the C=O stretching mode calculated to the value of
1021 cm-1
(Burneau et al., 2000). The shoulder at 1240 cm-1
is due to CO stretching vibration
(Coates, 2000).
The position of the OH band in acetic acid shifted to higher wavenumbers of 3580 cm-1
in the
vapour phase (see Figure 5a). The shape and position of this band indicate that the monomers
are dominant in the vapour phase. This is also confirmed by the shift of the C=O absorption
band to higher wavenumbers and the absence of the OH out-of-plane deformation vibration
mode at 944 cm-1
in the vapour phase.
TEA (zA = 1.00) shows an absorption band at 1477 cm-1
due to the CH3 anti-symmetric
deformation mode (see Figure 5b). The CH3 symmetric umbrella deformation mode is
observed at 1385 cm-1
. The CN stretching vibration mode is observed at 1212 cm-1
and
1057 cm-1
(Coates, 2000; Socrates, 1980). The liquid phase and vapour phase FTIR spectra
are very similar.
©© UUnniivveerrssiittyy ooff PPrreettoorriiaa

42
(a) (b)
Figure 5: Liquid phase and vapour phase spectra of (a) pure acetic acid and (b) pure TEA
Figure 6 shows the liquid phase FTIR spectra of the binary TEA-acetic acid mixtures
compared with pure TEA and pure acetic acid. Addition of amine results in a shift in the
dimer C=O band position to higher frequencies and the disappearance of the dimeric OH out-
of-plane deformation band. The lack of the OH out-of-plane dimer form indicates the
formation of a complex between TEA and acetic acid (Karlsson et al., 2000). The carbonyl
C=O is observed at 1722 cm-1
in all TEA-acetic acid mixtures. The contribution due to the
C=O monomer form is observed as a shoulder in the mixture with composition zA = 0.20, but
is absent when zA = 0.33. The new absorption band observed at 1576 cm-1
is due to the
presence of an ionic carboxylate, COO- (Wierzejewska-Hnat et al., 1980; Friberg et al.,
1990). The COH in-plane bending absorption bands shifted position to a lower frequency of
1378 cm-1
due to hydrogen bonding between acetic acid and TEA. This was observed in all
the mixtures. The CO stretching absorption band is observed at 1248 cm-1
. The intensity of
this band is stronger compared with that of acetic acid. This is attributed to the contribution
of the CN stretching mode from amine which also occurs at the same position (Socrates,
1980). The bottom phase of the sample prepared as zA = 0.80 shows absorption bands similar
to zA = 0.20, 0.25 and 0.33.
8001600240032004000
Tra
nsm
itta
nce
(a
.u)
Wavenumber (cm-1)
Acetic acid Liquid
Vapor
8001600240032004000
Tra
nsm
itta
nce
(a
.u)
Wavenumber (cm-1)
TEA Liquid
Vapor
©© UUnniivveerrssiittyy ooff PPrreettoorriiaa

43
Figure 6: Liquid phase FTIR spectra of binary acetic acid-TEA mixtures in comparison with
pure acetic acid and pure TEA
4.2 DSC
The DSC data for acetic acid showed two thermal transitions (see Figure 7). The first was the
melting transition and had an onset of 11 °C, while the second was a boiling transition with
an onset of 108 °C. TEA melts at -115 °C. Consequently, in the temperature range studied,
TEA showed only a single thermal (boiling) transition with an onset temperature of 84 °C.
The TEA-acetic acid mixtures featured significantly higher boiling transitions when
evaporated into a stream of nitrogen gas. A sample with zA = 0.39 and a mixture with
zA = 0.33 featured onset temperatures of 156 °C. Mixtures with compositions zA = 0.20 and
zA = 0.25 showed boiling onsets occurring at 154 and 158 °C respectively. This suggests that
the mixtures with the highest apparent boiling points are those that closely match the
composition of the A1C3 complex, i.e. an amine to acid mole ratio of 1:3.
800120016002000
Tra
nsm
itta
nce
(a
.u)
Wavenumber (cm-1)
zA = 1.0
0.8 (bottom)
0.33
0.25
0.20
0
©© UUnniivveerrssiittyy ooff PPrreettoorriiaa

44
Figure 7: DSC profiles of acetic acid-TEA binary mixtures in comparison with pure acetic
acid and pure TEA
4.3 TGA-FTIR
Figure 8 illustrates how the lag time between the mass loss and the FTIR signals was
determined. It shows plots of the TGA derivative mass loss signal and the maximum
absorbance of the band located near 2300 wavenumbers in the FTIR spectrum. The excellent
match of the superimposed signals was obtained by an appropriate time shift of the former
signal. The average lag time was determined as 0.56 ± 0.03.
Figure 9 shows the TGA mass loss curves for TEA-acetic acid and selected mixtures. The
pure compounds evaporated much more rapidly than the mixtures. Mass loss was most rapid
for TEA, reflecting its higher volatility compared with acetic acid. Interestingly, the zA = 0.24
mixture was the least volatile as it showed the lowest mass loss rate. This composition is
close to that of the A1C3 complex. The sample of the top layer phase with zA = 0.89
evaporated at a similar rate to pure triethylamine, suggesting that only the amine was
released. The sample with zA = 0.39, with a composition matching that of the bottom layer
obtained following phase separation, evaporated at an intermediate rate.
-20 0 20 40 60 80 100 120 140 160 180
He
at
flo
w (
a.u
)
Temperature ( C)
Ex
o
ZA = 1.00
0.39
0.33
0.25
0.20
0
Endo
©© UUnniivveerrssiittyy ooff PPrreettoorriiaa

45
Figure 8: TGA-FTIR data for heating sodium bicarbonate from 25 C to 400 C at a scan
rate of 20 °C min-1
in nitrogen gas flowing at a rate of 50 mL min-1
. The maximum
absorbance of the band located near 2300 wavenumbers in the FTIR spectrum (□) and the
TGA derivative mass signal shifted by a time interval of 0.56 min (▲) are shown
Figure 9: TGA evaporation profiles of selected acetic acid-TEA binary mixtures compared
with pure acetic acid and pure TEA
0
0.2
0.4
0.6
0.8
1
0
0.01
0.02
0.03
6 7 8 9 10
TG
A d
eriv
ati
ve
ma
ss (
mg
.min
-1)
Ab
sorb
an
ce a
t 2
30
0 c
m-1
(-)
FTIR time (min)
FTIR peak maximum
TGA derivative
TGA signal
time shifted
0.0
0.1
1.0
1 10 100 1000
Fra
ctio
n vapori
zed (
-)
Time (min)
100
89
39
24
20
0
TEA, %
©© UUnniivveerrssiittyy ooff PPrreettoorriiaa

46
Figures 10(a) and (b) compare the vapour phase FTIR spectra of representative TEA-acetic
acid mixtures with the spectra obtained for pure TEA and pure acetic acid vapours. Consider
the spectra in Figure 10(a) for the mixture with initial composition zA = 0.33. Now it appears
that it is TEA that evaporates initially as the spectra that is recorded when just 3% had
evaporated is nearly identical to that of pure TEA. The C=O monomer and OH absorption
bands for acetic acid at 1790 cm-1
, 1814 cm-1
and 3580 cm-1
respectively are only noticeable
at a much later stage.
In Figure 10(b) (for the mixture with composition zA = 0.20), the spectrum recorded when
just 1% had evaporated is nearly identical to that for pure acetic acid. No TEA absorption
bands are noticeable at this stage. This implies that the steady-state vapour composition lies
between these two compositions.
(a) (b)
Figure 10: Time evolution of the gas phase FTIR spectra for a mixture with initial
composition zA = 0.33 (a) and zA = 0.20 (b) as a function of mass fraction evaporated. The
arrows indicating the time direction and the spectra for pure TEA and pure acetic acid are
shown for comparison
The dominant features that distinguish the FTIR spectra for TEA and for acetic acid are the
groups of bands between 3300 cm-1
and 2450 cm-1
, and those between 1950 cm-1
and
1600 cm-1
respectively. These were used to determine the composition of the vapour streams
in the following way. The areas under the absorbance vs. wavenumber plots, from 3300 cm-1
8001600240032004000
Abso
rbance
(a.u
)
Wavenumber (cm-1)
0.03
0.17
0.39
0.65
zA = 0.33
Pure acetic acid: zA = 0
Fractionevaporated Pure TEA: zA = 1
8001600240032004000
Abso
rbance
(a.u
)
Wavenumber (cm-1)
zA = 0.20
0.58
0.34
0.11
0.01
Fraction
evaporatedPure TEA: zA = 1.00
Pure acetic acid: zA = 0
©© UUnniivveerrssiittyy ooff PPrreettoorriiaa

47
and 1600 cm-1
, were determined using fourth-order Newton Cotes integration (Gerald, 1970).
However, interfering CO2 absorption bands are found in the region between 2270 cm-1
and
2450 cm-1
, and this region was therefore excluded from the integration range. The integrated
areas were scaled directly with the TGA mass loss rates according to
(5)
where ai is the integrated area under the absorbance curve (in the wavenumber ranges
indicated) in cm-1
; is the TGA mass flux of component i entering the vapour phase in
mg.min-1
; ki is a characteristic constant for component i with units min.mg-1
.cm-1
; A is the
dimensionless absorbance; and is the wavenumber measured in cm-1
.
The proportionality constants for the instrument combination used in this study were
experimentally determined as kA = 20.0 ± 0.2 and kC = 18.3 ± 0.4 for triethylamine and acetic
acid respectively (see Figure 11).
Figure 11: TEA and acetic acid calibration curves used for the determination of the
proportionality constants
A characteristic normalised shape function for each of the pure components was defined by
the following integral:
2270 3300
1600 2450i i ia k m Ad Ad
im
0
30
60
90
120
0 1 2 3 4 5 6
Inte
gra
ted
are
a (
cm-1
)
-dm/dt (mg/min)
TriethylaminekA = 20 ± 0.2
Acetic acidkC = 18.3 ± 0.4
©© UUnniivveerrssiittyy ooff PPrreettoorriiaa
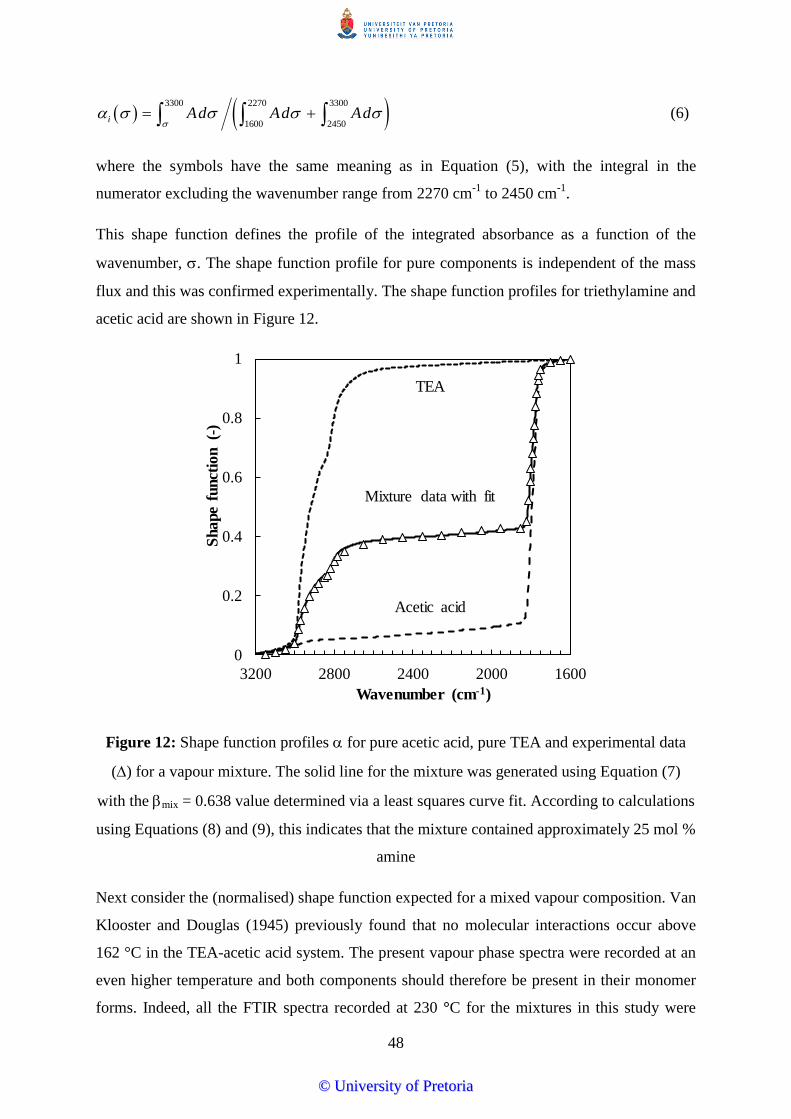
48
(6)
where the symbols have the same meaning as in Equation (5), with the integral in the
numerator excluding the wavenumber range from 2270 cm-1
to 2450 cm-1
.
This shape function defines the profile of the integrated absorbance as a function of the
wavenumber, . The shape function profile for pure components is independent of the mass
flux and this was confirmed experimentally. The shape function profiles for triethylamine and
acetic acid are shown in Figure 12.
Figure 12: Shape function profiles for pure acetic acid, pure TEA and experimental data
() for a vapour mixture. The solid line for the mixture was generated using Equation (7)
with the mix = 0.638 value determined via a least squares curve fit. According to calculations
using Equations (8) and (9), this indicates that the mixture contained approximately 25 mol %
amine
Next consider the (normalised) shape function expected for a mixed vapour composition. Van
Klooster and Douglas (1945) previously found that no molecular interactions occur above
162 °C in the TEA-acetic acid system. The present vapour phase spectra were recorded at an
even higher temperature and both components should therefore be present in their monomer
forms. Indeed, all the FTIR spectra recorded at 230 °C for the mixtures in this study were
3300 2270 3300
1600 2450i Ad Ad Ad
0
0.2
0.4
0.6
0.8
1
16002000240028003200
Sh
ap
e f
un
ctio
n (-
)
Wavenumber (cm-1)
TEA
Mixture data with fit
Acetic acid
©© UUnniivveerrssiittyy ooff PPrreettoorriiaa

49
consistent with this assumption. The absence of the carbonyl C=O dimer band at 1705 cm-1
,
the shape and position of the OH band at 3580 cm-1
, and the strong C=O absorption band at
1790 cm-1
in the spectra recorded for the pure acetic acid vapour confirmed that acetic acid
was predominantly present in the monomer form and that the contribution from dimers was
insignificant. The ionic carboxylate bands were absent in the vapour spectra obtained for the
mixtures. Furthermore, in the mixtures the acetic acid C=O absorption band was observed at
almost precisely the same position found for the neat acetic acid (1790 cm-1
and 1814 cm-1
).
This confirmed negligible interaction between acetic acid molecules and TEA molecules in
the vapour phase at 230 C.
The absence of complex-forming interactions in the vapour phase at the measurement
temperature that was used means that the recorded spectra are simply a combination of the
spectra expected for the pure compounds. Thus the shape function for a mixed vapour is
given by a linear combination of the two pure-component shape functions:
(7)
where mix is a characteristic measure of the mixture composition and A and C are the shape
functions for triethylamine and acetic acid respectively.
The mix values were determined from experimental data using least squares data fits of
Equation (7). Once the mix values were known, the mass fraction of amine in the vapour
phase was calculated using the following equation:
(8)
where wA is the mass fraction of an amine in the vapour.
The mole fraction of amine in the vapour (yA) was determined as follows:
(9)
where MA is the molar mass of an amine and MC is the molar mass of carboxylic acid.
Figure 12 compares the measured shape functions for pure acetic acid, pure TEA and the
vapour released by a specific mixture. As mentioned above, such plots were used to
α β α (1 β )αmix mix A mix C
β
β (1 β )
mixA
Amix mix
C
wk
k
(1 )
A AA
A A A C
w My
w M w M
©© UUnniivveerrssiittyy ooff PPrreettoorriiaa

50
determine the composition of the vapours. This was done by first extracting the mix values in
Equation (7). Next the amine mole fraction in the released vapour was determined by
applying Equations (8) and (9). These were then plotted against time (Figure 13) or against
the mass fraction of mixture released (Figure 14).
Figures 13 and 14 show that the mole fraction of an amine in the released vapour (yA) initially
either increases or decreases but then stabilises at a plateau value (see Figure 15). This value
is, within experimental error, the same for all mixtures irrespective of their initial
concentration. The plateau composition was determined as yA = 0.267 ± 0.017 by averaging
all the vapour compositions measured beyond the point where 50% of the original charge had
volatilised for mixtures initially containing 19, 20, 23, 24 and 38 mol % TEA. This value is
only slightly higher than the composition of the A1C3 complex.
Figure 13: Time dependence of the mole fraction of TEA present in the released vapour. The
indicated TEA concentrations refer to the initial TEA content of the liquid phase
When the composition of the emitted vapour stabilises at a plateau value, it must mean that
this should also be true for the liquid phase. In fact, the compositions of the vapour and liquid
phases should be the same. This can be checked by performing a mass balance. The
differential equation is:
0.0
0.2
0.4
0.6
0.8
1.0
0 200 400 600 800
y A(-
)
Time (min)
89
44
34
32
20
TEA (mol %)
©© UUnniivveerrssiittyy ooff PPrreettoorriiaa

51
(10)
and
(11)
where mi is the mass of component i in the liquid phase.
These two equations can be solved by numerical integration using the TGA mass loss data
and the vapour phase composition determined from the FTIR results. The mole fraction of
amine in the liquid phase can then be determined from:
(12)
Figure 14: Mole fraction of TEA released into the vapour phase as a function of the fraction
of VCI released. The indicated TEA concentrations refer to the initial TEA content of the
liquid phase
1A AA
dm dmy
dm m dt
1CA
dmy
dm
(1 )
A AA
A A A C
m Mx
m M m M
0.0
0.2
0.4
0.6
0.8
1.0
0 20 40 60 80 100
y A(-
)
VCI released (wt. %)
89
39
24
23
20
TEA (mol %)
©© UUnniivveerrssiittyy ooff PPrreettoorriiaa

52
Figure 15: Evaporation trend obtained for TEA-acetic acid binary mixtures
The results of these calculations are presented in Figure 16. They confirm that the liquid
compositions also approached the same plateau value as found for the vapour phase. This
indicates that, over time, evaporation of an amine-acetic acid mixture will reach an
“azeotrope”-like point where the relative concentrations of the vapour and liquid phases
become identical.
The present results indicate that the steady-state composition of the vapour released by the
TEA-acetic acid binary mixtures contains excess acetic acid. When this vapour comes into
contact with the adsorbed moisture on the surface of a metal, the acid dimers in the A1C3
complex will dissociate and hydrolyse to form free monomeric acids. This may lower the pH
values of the water film, which may then induce corrosion (Bastidas et al., 2005). This may
provide an explanation as to why TEA-acetic acid is a poor VCI (Vuorinen & Skinner, 2002).
An effective VCI vapour has to contain excess amine and should not result in too low a pH
for the liquid water film adsorbed on the metal surface.
0
0.2
0.4
0.6
0.8
1
0 0.2 0.4 0.6 0.8 1
y A(v
ap
ou
r) (
-)
zA (Feed) (-)
yA (Plateau)
Average
©© UUnniivveerrssiittyy ooff PPrreettoorriiaa

53
Figure 16: Calculated mole fractions of TEA in the liquid phase as a function of the initial
mixture composition and the fraction of VCI released. The indicated TEA concentrations
refer to the initial content of the liquid phase
0.0
0.2
0.4
0.6
0.8
1.0
0 20 40 60 80 100
xA
(-)
VCI released (wt. %)
89 39 24 23 20
TEA (mol %)
©© UUnniivveerrssiittyy ooff PPrreettoorriiaa

54
PART 2: METHOD APPLICATION
4.4 Liquid phase FTIR and refractive index
The measured refractive index values are shown in Appendix A. Numerous liquid phase
FTIR data were collected and these are shown in Appendix B. The data set in Figure 17
shows the effect of liquid phase composition on the FTIR spectra for triethylamine-hexanoic
acid mixtures. The figure only shows the FTIR region of interest (between 1750 and
1350 cm-1
). The pure carboxylic acids (zA = 0) all showed a sharp absorption band of high
intensity at approximately 1705 cm-1
, which is characteristic of the hydrogen-bonded
carbonyl (C=O) functional group in the carboxylic acid dimer (Coates, 2000). The
absorbance of this peak decreases rapidly as the amount of amine present in the mixtures
increases. It is very high in mixtures with low amine content and low in mixtures with high
amine content.
Figure 17: Liquid phase FTIR spectra of binary mixtures of triethylamine and hexanoic acid.
The absorption maximum at ca. 1560 cm-1
is attained at a composition corresponding to the
A1C3 complex, i.e. zA = 0.25
As the intensity of this peak decreases upon amine addition, several new absorption bands
develop that are consistent with the formation of an ionic complex (salt formation) between
the amine and the acid in the liquid phase. The band observed at approximately 1560 cm-1
is
due to the ionic carboxylate ion, COO- (Päivärinta et al., 2001; Coates, 2000), while the band
near 1400 cm-1
is attributed to the protonated amine (Whitehead, 1969; Coates, 2000).
©© UUnniivveerrssiittyy ooff PPrreettoorriiaa
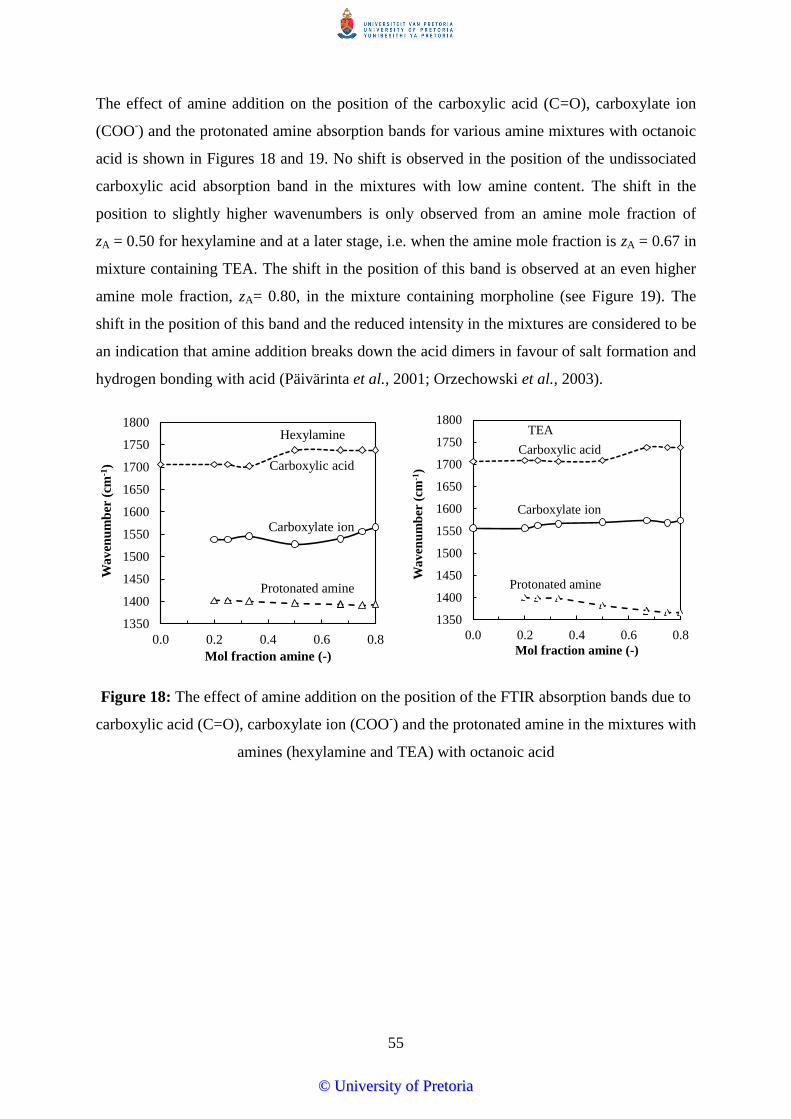
55
The effect of amine addition on the position of the carboxylic acid (C=O), carboxylate ion
(COO-) and the protonated amine absorption bands for various amine mixtures with octanoic
acid is shown in Figures 18 and 19. No shift is observed in the position of the undissociated
carboxylic acid absorption band in the mixtures with low amine content. The shift in the
position to slightly higher wavenumbers is only observed from an amine mole fraction of
zA = 0.50 for hexylamine and at a later stage, i.e. when the amine mole fraction is zA = 0.67 in
mixture containing TEA. The shift in the position of this band is observed at an even higher
amine mole fraction, zA= 0.80, in the mixture containing morpholine (see Figure 19). The
shift in the position of this band and the reduced intensity in the mixtures are considered to be
an indication that amine addition breaks down the acid dimers in favour of salt formation and
hydrogen bonding with acid (Päivärinta et al., 2001; Orzechowski et al., 2003).
Figure 18: The effect of amine addition on the position of the FTIR absorption bands due to
carboxylic acid (C=O), carboxylate ion (COO-) and the protonated amine in the mixtures with
amines (hexylamine and TEA) with octanoic acid
1350
1400
1450
1500
1550
1600
1650
1700
1750
1800
0.0 0.2 0.4 0.6 0.8
Waven
um
ber
(cm
-1)
Mol fraction amine (-)
Carboxylic acid
Carboxylate ion
Protonated amine
Hexylamine
1350
1400
1450
1500
1550
1600
1650
1700
1750
1800
0.0 0.2 0.4 0.6 0.8
Wa
ven
um
ber
(cm
-1)
Mol fraction amine (-)
Carboxylic acid
Carboxylate ion
Protonated amine
TEA
©© UUnniivveerrssiittyy ooff PPrreettoorriiaa

56
Figure 19: The effect of amine addition on the position of the FTIR absorption bands due to
carboxylic acid (C=O), carboxylate ion (COO-) and the protonated amine in the mixtures of
morpholine with octanoic acid
The presence of these two absorption bands (carboxylate ion and protonated amine) confirms
that amine addition leads to proton transfer from the acid to an amine during the complex-
formation process and thus the ionic nature of the mixtures (Karlsson et al., 2000;
Orzechowski et al., 2003). Both these bands (carboxylate ion and protonated amine) grow in
intensity as amine is added but start waning again beyond a critical amine concentration.
Figure 20 shows the effect of amine content on the intensity of the carboxylate ion band for
mixtures containing octanoic acid. It reaches maxima at amine concentrations of zA = 0.25 for
the tertiary amine and zA = 0.50 for the primary and secondary amines. The liquid phase
FTIR spectra obtained using the other carboxylic acids also showed a similar trend. Thus the
liquid phase FTIR spectra suggest that the A1C3 complex dominated in mixtures of the
alkanoic acids with the tertiary amine (TEA), while the A1C1 (or more correctly the A2C2
complex) was strongly favoured in the mixtures containing the primary amine (hexylamine)
and the secondary amine (morpholine).
The representative data for the variation of the refractive index with composition are shown
in Figures 21A and B. These refractive index data also support the aforementioned
hypothesis. The refractive index data reached a maximum value at zA ≈ 0.25 for the tertiary
amine and at zA ≈ 0.50 for the primary and secondary amines. This was observed for all the
amine-alkanoic acid mixtures.
1350
1400
1450
1500
1550
1600
1650
1700
1750
1800
0.0 0.2 0.4 0.6 0.8
Wa
ven
um
ber
(cm
-1)
Mol fraction amine (-)
Carboxylic acid
Carboxylate ion
Protonated amine
Morpholine
©© UUnniivveerrssiittyy ooff PPrreettoorriiaa

57
Figure 20: The effect of liquid phase composition on the absorbance maximum near
1560 cm-1
in the FTIR spectra of binary mixtures of the various amines with octanoic acid.
The absorption maximum at ca. 1560 cm-1
is attained at a composition corresponding to the
A1C3 complex for TEA, but for the other two amines it corresponds to the A2C2 complex,
i.e. zA = 0.50
Figure 21: The effect of liquid phase composition on the refractive index of amine-propanoic
(A) and amine-hexanoic acid (B) mixtures at 20 °C. The 1:1 and 2:1 (mole basis) mixtures of
hexanoic acid and the 1:1 mixture of propanoic acid with morpholine are not reported
because they were solids at this temperature
1.38
1.40
1.42
1.44
1.46
1.48
0 0.2 0.4 0.6 0.8 1
ηD
(-)
Amine mole fraction zA (-)
Morpholine
Hexylamine
TEA
Propanoic acid mixtures A
1.40
1.41
1.42
1.43
1.44
1.45
1.46
1.47
0 0.2 0.4 0.6 0.8 1
nD
(-)
Amine mole fraction, zA (-)
Morpholine
Hexylamine
TEA
Hexanoic acid mixtures B
©© UUnniivveerrssiittyy ooff PPrreettoorriiaa

58
4.5 Liquid phase DSC
DSC scans covering the temperature range -40 °C to 250 °C collected under a flowing
nitrogen stream are shown in Figure 22 for the pure amines and pure carboxylic acids. DSC
scans for hexylamine and carboxylic acids (acetic, hexanoic and octanoic) featured two
endothermic thermal transitions. The first DSC peak, with onset temperatures of -23, 11,
-4.97 and 14.73 °C for hexylamine, acetic acid, hexanoic acid, and octanoic acid respectively,
corresponds to the melting transition. The second endothermic event corresponds to the onset
of boiling. The scans for TEA, morpholine and propanoic acid showed only a single thermal
transition due to boiling. The boiling temperature of carboxylic acids used in the present
study increases with an increase in chain length. It is lower in acetic acid and high in octanoic
acid as seen in Figure 22B.
Figure 22: DSC traces of pure amines (A) and pure carboxylic acids (B)
Figure 23 shows the effect of composition on the DSC traces in the system of hexylamine-
carboxylic acid mixtures. The position of the melting endotherms shows complex
composition dependence. The highest melting temperature was shown by the mixture with a
1:1 composition. This behaviour is observed in the hexylamine-acetic acid (Figure 23A),
hexylamine-hexanoic acid (Figure 23C) and hexylamine-octanoic acid (Figure 23D)
mixtures. Compositions intermediate to this and the pure amine and carboxylic acids featured
melting temperatures that were lower than those of the latter. This melting point trend is
consistent with a eutectic comprising the A2C2 salt and the neat carboxylic acid. The systems
containing morpholine also showed similar behaviour (a representative DSC scan is shown in
-40 0 40 80 120 160 200 240
Hea
t fl
ow
(a
.u.)
Temperature ( C)
En
do
Exo
Hexylamine
Morpholine
TEA
A
-40 0 40 80 120 160 200 240
Hea
t fl
ow
(a
.u.)
Temperature ( C)
En
do
Ex
o
Acetic
Propanoic
Hexanoic
Octanoic
B
©© UUnniivveerrssiittyy ooff PPrreettoorriiaa

59
Figure 24). These observations provide further support for the prevalence of the A2C2
complex for the primary and secondary amines.
Figure 23: DSC traces of binary hexylamine and (A) acetic, (B) propanoic, (C), hexanoic
and (D) octanoic acid mixtures in comparison with pure hexylamine and pure carboxylic
acids
0 50 100 150 200 250
Hea
t fl
ow
(a
.u.)
Temperature ( C)
En
do
Ex
o
AzA = 1.00
0.80
0.75
0.67
0.50
0.33
0.25
0.20
0
0 50 100 150 200 250
Hea
t fl
ow
(a
.u.)
Temperature ( C)
En
do
BzA = 0
0.20
0.25
0.33
0.50
0.67
0.75
0.80
1.00
0 50 100 150 200 250
Hea
t fl
ow
(a
.u.)
Temperature ( C)
Ex
oE
nd
o
zA = 1.00
0.80
0.75
0.67
0.50
0.33
0.25
0.20
0
C
0 50 100 150 200 250
Hea
t fl
ow
(a.u
.)
Temperature ( C)
D
En
do
Ex
o
zA = 1.00
0.20
0.25
0.33
0.50
0.67
0.75
0.80
0
©© UUnniivveerrssiittyy ooff PPrreettoorriiaa

60
Figure 24: DSC traces of secondary amine, morpholine, with octanoic acid mixtures
Figure 25 shows the representative DSC scans obtained with tertiary amine, TEA. It shows
the TEA-hexanoic and TEA-octanoic acid mixtures with different compositions. In this case
no melting endotherm transitions were observed above -40 °C. Only the boiling transition is
observed. However, the highest boiling transitions showed a smooth variation with
composition (see Figure 26). The enthalpy of vaporisation peaked near a composition
consistent with the prevalence of the A1C3 complex as previously observed for the TEA-
acetic acid system in Part 1 of this chapter. The amine-carboxylic acid mixtures based on the
shorter chain carboxylic acids in all mixtures featured higher boiling transitions than the
parent compounds when evaporating into a stream of nitrogen gas. The highest boiling
temperatures were found for the mixtures with compositions close to those of the 1:3 amine-
carboxylic acid complexes (zA = 0.25). When the amine was present in excess beyond this
level in the mixtures, an additional endothermic thermal transition was observed. The
temperature of the first endothermic transition event matched the boiling transition of the
pure parent amine. This suggests that when the mixture is rich in amine, mostly TEA
volatilises during the initial stages.
0 50 100 150 200 250
E
nd
o
Hea
t fl
ow
(a.u
.)
E
xo
Temperature (C)
zA = 1.00
0.80
0.75
0.67
0.50
0.33
0.25
0.20
0
©© UUnniivveerrssiittyy ooff PPrreettoorriiaa

61
(a)
(b)
Figure 25: DSC scans of binary TEA systems with (a) hexanoic and (b) octanoic acid
mixtures
Figure 26: DSC results for liquid mixtures: DSC melting peak temperatures for
hexylamine-octanoic acid mixtures; vaporisation enthalpies; and
vaporisation peak temperatures for triethylamine-octanoic acid mixtures
-20 20 60 100 140 180 220
Hea
t fl
ow (a
.u)
Temperature (⁰C)
zA = 1.00
0.80
0.75
0.67
0.50
0.33
0.25
0.20
0
En
do
Exo
0 40 80 120 160 200 240
Hea
t fl
ow
,a.u
Temperature, ⁰C
zA = 1.00
0.80
0.75
0.67
0.50
0.33
0.25
0.20
0
En
do
Ex
o
-700
-600
-500
-400
-300
-200
0
50
100
150
200
250
0 0.2 0.4 0.6 0.8 1
Vap
ori
zati
on
en
thalp
y (
J/g
)
DS
C p
eak
tem
per
atu
re (C
)
Mol fraction amin, zA (-)
©© UUnniivveerrssiittyy ooff PPrreettoorriiaa

62
4.6 TGA
Figure 27 shows the mass loss rates of the neat carboxylic acids and the neat amines
evaporating into nitrogen at 50 °C. At this temperature evaporation was fastest for TEA and
slowest for octanoic acid. TEA evaporated completely in less than 20 minutes, whereas only
about 0.6% fraction of the octanoic acid had evaporated after 90 minutes. As expected, the
rate of evaporation correlated with the ranking of the normal boiling points for the
compounds and decreased with the increasing chain length of the carboxylic acid. This
indicates that the volatility of the carboxylic acids is dependent on the chain length. The
longer the carboxylic acid chain length the less volatile the acid.
Figure 27: TGA evaporation rates for the neat amines and carboxylic acids measured at
50 C
Hexylamine systems
Figure 28 shows the evaporative mass loss curves for hexyalmine with (A) acetic,
(B) propanoic, (C) hexanoic and (D) octanoic acid binary mixtures. Figure 29 plots the time it
takes to reach the selected fractional mass loss values as a function of the initial mixture
composition. Pure acetic acid evaporated much more rapidly than the mixtures. Hexylamine
also evaporated quicker than the mixtures (see Figures 28A and 29B). The hexylamine-acetic
acid binary mixture containing 50 mol % hexylamine was the least volatile (see Figures 28A
©© UUnniivveerrssiittyy ooff PPrreettoorriiaa

63
and 29B). This is confirmed by the lowest mass loss rate obtained for this mixture. This
composition is close to that of the reported A1C1 complex.
Figure 28: TGA evaporation profiles of hexylamine and (A) acetic, (B) propanoic,
(C) hexanoic and (D) octanoic acid binary mixtures compared with those of pure hexylamine
and pure carboxylic acids
In the hexylamine-propanoic acid system, propanoic acid evaporates similarly to acetic acid
(see Figures 28A and 29(b)). The mixtures also follow a trend similar to that observed for
hexylamine-acetic acid. However, in hexylamine-propanoic acid binary mixtures, the mixture
with a composition of 33 mol % hexylamine is the least volatile. This composition is close to
the reported A1C2 complex.
0.01
0.1
1
10 100 1000
Fra
ctio
n v
ap
ori
zed
(-)
Time (min)
0 20 25
33 50 67
75 80 100
Hexylamine (mol %)
A
0.01
0.1
1
10 100 1000F
ract
ion
vap
ori
zed
(-)
Time (min)
0 20 25
33 50 67
75 80 100
Hexylamine (mol %)
B
0.001
0.01
0.1
1
10 100 1000
Fra
ctio
n v
ap
ori
zed
(-)
Time (min)
0 20 25
33 50 67
75 80 100
Hexylamine (mol %)
C
0.0001
0.001
0.01
0.1
1
1 10 100 1000
Fra
ctio
n v
ap
ori
zed
(-)
Time (min)
0 20 25
33 50 67
75 80 100
Hexylamine (mol %)
D
©© UUnniivveerrssiittyy ooff PPrreettoorriiaa

64
(A) (B)
(C) (D)
Figure 29: Time it takes to reach the selected fractional mass loss values as a function of
composition of the mixtures for (A) hexylamine-acetic, (B) hexylamine-propanoic,
(C) hexylamine-hexanoic and (D) hexylamine-octanoic acid
Interestingly, pure hexanoic acid is the least volatile compared with its mixtures with
compositions of 67, 75 and 80 mol % hexylamine (see Figures 28C and 29C). However, the
mixtures with compositions of 20, 25, 33 and 50 mol % hexylamine show mass loss rates
slower than that of the pure hexanoic acid. Again, the mixture with a composition of
33 mol % hexylamine is also the least volatile, as with hexylamine-propanoic acid.
1
10
100
1000
0.0 0.2 0.4 0.6 0.8 1.0
Tim
e to
x e
va
po
rate
d (
min
)
Hexylamine mol fraction (-)
Evaporated, wt.%
10
15
1
10
100
1000
0.0 0.2 0.4 0.6 0.8 1.0
Tim
e to
xev
ap
ora
ted
(m
in)
Hexylamine mol fraction (-)
Evaporated, wt.%
10
15
1
10
100
1000
0.0 0.2 0.4 0.6 0.8 1.0
Tim
e to
xev
ap
ora
ted
(m
in)
Hexylamine mol fraction (-)
Evaporated, wt.%
4
5
0
1
10
100
1000
0.0 0.2 0.4 0.6 0.8 1.0
Tim
e to
xev
ap
ora
ted
(m
in)
Hexylamine mol fraction (-)
Evaporated, wt.%
1
©© UUnniivveerrssiittyy ooff PPrreettoorriiaa

65
Octanoic acid shows a mass rate slower than that of the hexylamine-octanoic acid binary
mixtures with compositions of 20, 33, 50, 67, 75 and 80 mol % hexylamine. This reflects the
high volatility of the mixtures when compared with the pure octanoic acid (see Figure 28D
and Figure 29D). The binary mixture with a composition of 50 mol % hexylamine is the least
volatile even when compared with octanoic acid.
Note that mixtures high in amine content showed rapid rates of evaporation initially but this
then levelled out to significantly lower rates at longer times. Again this suggests rapid loss of
amine via preferential vaporisation. The slow mass loss rate of the prepared binary mixtures
indicates that the interaction between amine and carboxylic acid results in low volatile
mixtures. This also reflects the low vapour pressures of these binary mixtures, indicating that
their volatility is suppressed.
Morpholine systems
Similarly to the hexylamine-acetic acid system, acetic acid evaporated much more rapidly in
the morpholine-acetic acid system, reflecting its high volatility when compared with the pure
morpholine (see Figures 30A and 31A). The mixtures showed the slowest rate of mass loss
compared with morpholine and pure carboxylic acids. Among the mixtures in the
morpholine-acetic acid binary system, the 25 mol % or the 33 mol % morpholine
composition were found to be the least volatile (see Figures 30A and 31B).
Pure morpholine evaporated more quickly than propanoic acid in the morpholine-propanoic
acid binary mixtures, reflecting its high volatility compared with propanoic acid (see Figures
30B–D and 31B–D). The binary morpholine-propanoic acid mixture with a composition of
33 mol % morpholine was found to be the least volatile among all the binary morpholine-
propanoic acid compositions used in the present study. This composition is close to the
reported A1C2 complex.
©© UUnniivveerrssiittyy ooff PPrreettoorriiaa

66
Figure 30: TGA evaporation profiles of morpholine and (A) acetic, (B) propanoic, (C)
hexanoic and (D) octanoic acid binary mixture compared to pure morpholine and pure
carboxylic acids
Pure hexanoic and pure octanoic acid evaporated more slowly than pure morpholine, and also
more slowly than some of their binary mixtures as in hexylamine, reflecting their low
volatility (see Figures 30C–D and 31C–D). However, in the morpholine-hexanoic acid
system the mixtures with compositions of 20, 25, 33 and 50 mol % morpholine are less
volatile than pure hexanoic acid (see Figures 30C and 31C), while in morpholine-octanoic
acid only the 25 mol % morpholine composition evaporated more slowly than octanoic acid
(see Figures 30D and 31D). The mixture with a composition of 25 mol % morpholine was
0.01
0.1
1
10 100 1000
Fra
ctio
n v
ap
ori
zed
(-)
Time (min)
0 20 25
33 50 67
75 80 100
Morpholine (mol %)
A
0.01
0.1
1
10 100 1000
Fra
ctio
n v
ap
ori
zed
(-)
Time (min)
0 20 25
33 50 67
75 80 100
Morpholine (mol %)
B
0.001
0.01
0.1
1
10 100 1000
Fra
ctio
n v
ap
ori
zed
(-)
Time (min)
0 20 25
33 50 67
75 80 100
Morpholine (mol %)
C
0.0001
0.001
0.01
0.1
1
1 10 100 1000
Fra
ctio
n v
ap
ori
zed
(-)
Time (min)
0 20 25
33 50 67
75 80 100
Morpholine (mol %)
D
©© UUnniivveerrssiittyy ooff PPrreettoorriiaa

67
found to be the least volatile in both the morpholine-hexanoic and morpholine-octanoic acid
binary mixtures. This composition is close to that of the A1C3 complex.
(A) (B)
(C) (D)
Figure 31: Time it takes to reach the selected fractional mass loss values as a function of
composition of the mixture for (A) morpholine-acetic, (B) morpholine-propanoic,
(C) morpholine-hexanoic and (D) morpholine-octanoic acid
1
10
100
1000
0.0 0.2 0.4 0.6 0.8 1.0
Tim
e to
x e
va
po
rate
d (
min
)
Morpholine mol fraction (-)
Evaporated, wt.%
10
15
20
1
10
100
1000
0.0 0.2 0.4 0.6 0.8 1.0
Tim
e to
xev
ap
ora
ted
(m
in)
Morpholine mol fraction (-)
Evaporated, wt%
10
15
20
30
1
10
100
1000
0.0 0.2 0.4 0.6 0.8 1.0
Tim
e to
xev
ap
ora
ted
(m
in)
Morpholine mol fraction (-)
Evaporated, wt.%
4
5
0
1
10
100
1000
0.0 0.2 0.4 0.6 0.8 1.0
Tim
e to
xev
ap
ora
ted
(m
in)
Morpholine mol fraction (-)
Evaporated, wt.%
1
©© UUnniivveerrssiittyy ooff PPrreettoorriiaa

68
Triethylamine systems
Figure 32 shows the mass loss profiles for TEA with (A) acetic, (B) propanoic, (C) hexanoic
and (D) octanoic acid binary mixtures. Figure 33 plots the time it takes to reach the selected
fractional mass loss values as a function of the initial mixture composition. The least volatile
mixture in the TEA-acetic acid system was found to be the one with the composition closer to
the previously reported A1C3 complex. The same composition (25 mol % TEA) was also
found to be the least volatile in the binary TEA-propanoic acid and TEA-hexanoic acid
systems (see Figures 32B and 33B; 32C and 33D).
Pure propanoic acid was found to evaporate more slowly than TEA, reflecting its low
volatility when compared with TEA. The binary mixtures with compositions of 50, 67, 75
and 80 mol % TEA initially show rapid mass loss, and then later reach equilibrium (see
Figure 32B). The initial rapid mass loss rate can be attributed to the loss of free TEA.
For the TEA-octanoic acid system, the curves are sandwiched between those for the neat
amine and the neat octanoic acid (see Figures 32D and 33D). This was not the case for the
mixtures with hexylamine and morpholine. From the present TGA results, it appears that the
composition of the least volatile mixture between amine and carboxylic acid occurs at
different stoichiometries for every amine-carboxylic acid combination. This least volatile
mixture is found to be close to the reported A1C1, A1C2 or A1C3 amine-carboxylic acid
complexes. However, it should be kept in mind that this study only considered a limited set of
mixtures. It is very unlikely that any of these would correspond exactly to the composition of
the least volatile mixture in the respective systems. The reduced volatility of the binary
mixtures is attributed to the strong interaction between amines and carboxylic acid, as
observed in the liquid phase FTIR results. Free amine and/or free acid were found to
evaporate first and then the mixture reaches equilibrium. At this equilibrium point the
mixtures behave similarly to an “azeotrope” as described in Part 1 of this chapter.
©© UUnniivveerrssiittyy ooff PPrreettoorriiaa

69
Figure 32: TGA evaporation profiles of TEA and the (A) acetic, (B) propanoic, (C) hexanoic
and (D) octanoic acid binary mixtures compared with pure morpholine and pure carboxylic
acids
0.01
0.1
1
1 10 100 1000
Fra
ctio
n v
ap
ori
zed
(-)
Time (min)
0 19 20
23 24 39
89 100
TEA (mol %)
A
0.001
0.01
0.1
1
1 10 100 1000
Fra
ctio
n v
ap
ori
zed
(-)
Time (min)
0 20 25
33 50 67
75 80 100
TEA (mol %)
B
0.001
0.01
0.1
1
1 10 100 1000
Fra
ctio
n v
ap
ori
zed
(-)
Time (min)
0 20 25
33 50 67
75 80 100
TEA (mol %)
C
0.0001
0.001
0.01
0.1
1
1 10 100 1000
Fra
ctio
n v
ap
ori
zed
(-)
Time (min)
0 20 25
33 50 67
75 80 100
TEA (mol %)
D
©© UUnniivveerrssiittyy ooff PPrreettoorriiaa

70
(A) (B)
(C) (D)
Figure 33: Time it takes to reach the selected fractional mass loss values as a function of the
composition of the mixture for (A) TEA-acetic, (B) TEA-propanoic, (C) TEA-hexanoic and
(D) TEA-octanoic acid
1
10
100
1000
0.0 0.2 0.4 0.6 0.8 1.0
Tim
e to x
evap
orate
d (
min
)
TEA mol fraction (-)
Evaporated, wt.%
15
20
1
10
100
1000
0.0 0.2 0.4 0.6 0.8 1.0
Tim
e to
xev
ap
ora
ted
(m
in)
TEA mol fraction (-)
Evaporated, wt.%
10
15
20
40
50
1
10
100
1000
0.0 0.2 0.4 0.6 0.8 1.0
Tim
e to
xev
ap
ora
ted
(m
in)
TEA mol fraction (-)
Evaporated, wt.%
4
5
0
1
10
100
1000
0.0 0.2 0.4 0.6 0.8 1.0
Tim
e to
xev
ap
ora
ted
(m
in)
TEA mol fraction (-)
Evaporated, wt.%
1
©© UUnniivveerrssiittyy ooff PPrreettoorriiaa
71
4.7 Vapour phase FTIR
Numerous vapour phase spectra were collected for all the binary amine-carboxylic acid
mixtures. However, systems such as hexylamine-acetic acid, hexylamine-propanoic acid,
morpholine-acetic acid and morpholine-propanoic acid showed only the release of amine in
mixtures with compositions of 0.67, 0.75 and 0.80 mol %, while the compositions of 0.20,
0.25 and 0.33 mol % showed only the release of carboxylic acid. The mixture with an amine
composition of 0.50 mol % showed only the release of amine in the morpholine-propanoic
acid system and released both amine and acid in morpholine-acetic acid. No absorption bands
were obtained in hexylamine-acetic acid because of the low vapour pressure of the mixture.
These collected spectra are shown on Appendix C.
Figure 34A-D compares the vapour phase FTIR spectra of the representative TEA-propanoic
acid mixtures with the spectra obtained for pure TEA and pure propanoic acid. The mixture
with composition zA = 0.20 is shown in Figure 34A. The spectrum recorded when just a 1%
mass fraction had evaporated to when 23% had evaporated is nearly identical to that of pure
propanoic acid. No TEA absorption bands are noticeable at 2980 cm-1
and 2818 cm-1
. This
indicates that the mixture only emits propanoic acid. Therefore all the mass loss observed
previously on TGA is due to the evaporation of propanoic acid.
The mixture with composition zA = 0.25 shows the release of both TEA and propanoic acid
throughout (see Figure 34B). This is confirmed by the C=O monomer and OH absorption
bands for propanoic acid at 1792 cm-1
and 1816 cm-1
, and 3600 cm-1
respectively. The TEA
absorption is confirmed by the bands at 2980 cm-1
and 2818 cm-1
. The spectra in Figure 32C
for the mixture with composition zA = 0.50 shows that the spectrum recorded when just a
13% fraction had evaporated is nearly identical to that of pure TEA. The mixture with
composition zA = 0.75 also shows the initial evaporation of TEA with a 28% fraction
evaporated (see Figure 34D). The C=O monomer and OH absorption bands at 1792 cm-1
and
1816 cm-1
and 3600 cm-1
respectively are only noticeable at a much later stage. The results
for this composition are similar to those obtained with compositions zA = 0.33, 0.67 and 0.80.
©© UUnniivveerrssiittyy ooff PPrreettoorriiaa

72
(A) (B)
(C) (D)
Figure 34: Time evolution of the vapour phase FTIR spectra for binary TEA-propanoic acid
mixtures with initial composition (A) zA = 0.20, (B) 0.25, (C) 0.50 and (D) 0.75 as a function
of mass fraction evaporated. The arrows indicate the time direction. The spectra for pure TEA
and pure propanoic acid are shown for comparison
The longer chain carboxylic acids (hexanoic and octanoic) used in the present study showed
very weak intensity absorption bands on FTIR in the vapour phase. This is attributed to the
8001600240032004000
Ab
sorb
an
ce (a.u
)
Wavenumber (cm-1)
zA = 0.20
Pure propionic acid: zA = 0
Fraction evaporated0.01
0.13
0.18
0.23
Pure TEA: zA = 1
8001600240032004000
Ab
sorb
ance
(a.u
)Wavenumber (cm-1)
zA = 0.25
Pure propionic acid: zA = 0
Fraction evaporated
0.01
0.12
0.18
0.23
Pure TEA: zA = 1
8001600240032004000
Ab
sorb
an
ce (a.u
)
Wavenumber (cm-1)
Pure TEA: zA = 1
Pure propionic acid: zA = 0
Fraction evaporated
0.28
0.80
0.83
0.87
zA = 0.75
©© UUnniivveerrssiittyy ooff PPrreettoorriiaa

73
fact that the released concentrations were too low for the FTIR instrument to detect. Binary
mixtures of amines (hexylamine, morpholine and TEA) with hexanoic and octanoic acid all
showed similar behaviour on FTIR in the vapour phase. The selected time evolution vapour
phase FTIR spectra of morpholine-hexanoic and morpholine-octanoic acid binary mixtures
are shown in Figure 35A and B. Note that the absorption bands were only noticeable for the
mixtures with compositions zA = 0.50, 0.67, 0.75 and 0.80. The results indicate that only
morpholine is released by these binary amine-carboxylic acid mixtures. Therefore all the
mass loss observed on TGA for the amine-hexanoic and amine-octanoic acid binary mixtures
is due to the evaporation of amine.
The present results give a clear understanding as to why octanoic acid-morpholine was
reported to be an effective VCI for mild steel (Vuorinen & Skinner, 2002). The synergism
between mixtures of amines and the OH ions from moisture on the metallic surface plays a
significant role in maintaining the pH at the required values for effective corrosion inhibition.
One component in the mixtures is reported to generate the OH ions, while the other one
improves the protective effect of the mixture (Andreev & Goncharova, 2004). The present
results reveal that the primary role of carboxylic acids (hexanoic and octanoic) in VCIs is to
control the release rate of the amine. Similar results were obtained with both primary and
tertiary amines. The release of amines is also observed in the mixtures with compositions zA
= 0.75 and 0.80.
The binary amine-hexanoic acid and amine-octanoic acid mixtures with compositions of
0.20, 0.25 and 0.33 mol % showed no absorption bands on FTIR. Only a clear band similar to
that obtained for pure hexanoic acid and pure octanoic acid was observed. These spectra are
shown in Appendix C. This result implies that the concentration of the released vapours was
too low for FTIR to detect. It is also supported by the fact that the mass losses of these
compositions observed in TGA for these particular compositions were also very low. This is
because the mixture contains more carboxylic acids and hence more stable dimers with low
vapour pressures being formed.
©© UUnniivveerrssiittyy ooff PPrreettoorriiaa

74
(A) (B)
Figure 35: Time evolution of the vapour phase FTIR spectra for (A) binary morpholine-
hexanoic acid mixtures with initial composition zA = 0.67 and (B) binary morpholine-
octanoic acid mixtures with initial composition zA = .0.50 as a function of mass fraction
evaporated. The arrows indicate the time direction. The spectra for pure morpholine and pure
carboxylic acids are shown for comparison
The dominant feature that distinguishes the vapour phase FTIR spectra for amines
(hexylamine, morpholine and TEA) and the spectra for carboxylic acids (formic, acetic,
propanoic, hexanoic and octanoic) are the groups of bands between 3300 cm-1
and 2450 cm-1
and those between 1950 cm-1
and 1600 cm-1
respectively, as explained for the TEA-acetic
acid binary mixtures. The Newton Coates fourth-order integration method was used, followed
by scaling the areas directly with the TGA mass loss rates according to Equation (5). The
proportionality constants obtained for the TGA-FTIR were experimentally determined and
are given in Table 2. The calibration curves are shown in Appendix D. The proportionality
constants for hexanoic and octanoic acid were not determined because these carboxylic acids
showed no absorption bands on FTIR in the vapour phase, as mentioned.
The shape function profiles of pure amines and pure carboxylic acid and of their respective
binary mixtures are shown in Appendix E. These profiles are similar to those obtained for
TEA-acetic acid binary mixtures. Mass fractions of the amine in the vapour phase were
8001600240032004000
Ab
sorb
an
ce (a
.u)
Wavenumber (cm-1)
zA = 1.00
zA = 0.67
Fraction evaporated
0.02
0.26
0.31
0.34
zA = 0
8001600240032004000A
bso
rban
ce (
a.u
)Wavenumber (cm-1)
zA = 1.00
zA = 0.50
Fraction evaporated
0.003
0.005
0.066
0.078
zA = 0
©© UUnniivveerrssiittyy ooff PPrreettoorriiaa

75
calculated, and the mole fraction of amine in the vapour was also determined as described for
TEA-acetic acid binary mixtures in Part 1 of this chapter.
Table 2: Experimentally determined proportionality constants for the neat amines and the
neat carboxylic acids
Pure component kA or kC value
Hexylamine 17.4 ± 0.6
Morpholine 14.8 ± 0.3
TEA 20.0 ± 0.2
Acetic acid 18.3 ± 0.4
Propanoic acid 16.3 ± 0.3
Quantification in the vapour phase was performed using the method described for TEA-acetic
acid binary mixtures in Part 1 of this chapter. However, as explained before, most of the
binary amine-carboxylic acid mixtures used in the present study showed the release of either
acid or amine. Therefore only the mixtures from which both components are released were
considered for the calculation of the liquid phase composition, xA. Figure 36 shows the mole
fraction of amine in the released vapours (yA) and the calculated mole fraction in the liquid
phase (xA) for the TEA-formic acid mixture with an initial TEA composition of 33.3 mol %.
The mixture initially emits a vapour that is 90% rich in amine. Later this composition
decreases and stabilises at a plateau value, similarly to TEA-acetic acid mixtures. The plateau
composition was determined as yA =0.280 ± 0.002. The value is slightly higher than that
obtained in TEA-acetic acid mixtures. However, it is close to the composition of the reported
A1C3 complex. This composition was also found to be true for the liquid phase.
©© UUnniivveerrssiittyy ooff PPrreettoorriiaa

76
Figure 36: Mole fraction of TEA released into the vapour phase as a function of the
percentage weight fraction released by the TEA-formic acid binary mixture with an initial
composition of 33.3 mol % TEA
Figure 37 shows the mole fraction of TEA in the vapour phase and in the liquid phase as a
function of the percentage weight fraction released by the TEA-propanoic acid binary
mixture with composition (a) 33.3 and (b) 50 mol % TEA. These binary mixtures follow the
same evaporation trend as that observed in the TEA-acetic acid and TEA-formic acid
mixtures. However, the composition of the plateau value for the TEA-propanoic acid binary
mixture was found to be approximately 24 mol % TEA on average. This was also found to be
true for the liquid phase. This composition is lower than that observed in the TEA-acetic acid
and TEA-formic acid binary mixtures. However, it is the closest to the reported 1:3 amine:
acid complex. This vapour composition is rich in propanoic acid. The present results suggest
that the TEA-propanoic acid system will not be good as a VCI, nor will the TEA-formic acid
and TEA-acetic acid systems. The present results also suggest that the amount of each
component in the vapour phase is not the same throughout. It can either increase or decrease
initially, depending on the amine content, until it reaches a plateau.
The binary TEA-propanoic acid mixture with 80 mol % TEA composition shows the initial
release of only TEA (see Figure 38). This result is similar to those obtained for the TEA-
acetic acid top layer. No plateau is observed in this mixture.
0
0.2
0.4
0.6
0.8
1
0.0
0.2
0.4
0.6
0.8
1.0
0 10 20 30 40
xA
y A
VCI released (wt. %)
33.3 mol % TEA
yA
xA
©© UUnniivveerrssiittyy ooff PPrreettoorriiaa

77
(a) (b)
Figure 37: Mole fraction of amine in the released vapour (yA) and the calculated amine mole
fraction in the liquid phase (xA) for the TEA-propanoic acid mixture with an initial
composition (a) 33.3 and (b) 50 mol % TEA
Figure 39 plots the instantaneous composition of the released vapour against the
instantaneous (calculated) composition of the remaining liquid. Unfortunately, xA could not
be calculated for the primary amine (hexylamine) systems because they were releasing either
an amine or an acid, but not both. Furthermore, in some instances the released concentration
was too low for FTIR quantification to be performed. These plots for TEA and morpholine
with propanoic acid are reminiscent of lower boiling binary “azeotrope” systems. Stability
analysis of batch distillation operations of such systems indicates that the liquid phase
composition converges to the “azeotrope” irrespective of the initial composition of the liquid
phase. This also explains why the compositions plotted in Figures 36 and 37 approach a
constant steady-state value over time as the liquid is allowed to evaporate.
0.0
0.2
0.4
0.6
0.8
1.0
0.0
0.2
0.4
0.6
0.8
1.0
0 5 10 15 20 25 30
xA
yA
VCI released (wt. %)
33.3 mol % TEA
yA
xA
0
0.2
0.4
0.6
0.8
1
0.0
0.2
0.4
0.6
0.8
1.0
10 20 30 40 50 60
xAy A
VCI released (wt. %)
50 mol % TEA
yA
xA
©© UUnniivveerrssiittyy ooff PPrreettoorriiaa

78
Figure 38: Mole fraction of TEA released into the vapour phase as a function of the
percentage weight fraction released by the TEA-propanoic acid binary mixture with an initial
composition of 80 mol % TEA
Figure 39: Vapour-liquid “equilibrium” at 50 C in the TEA-propanoic acid and morpholine-
propanoic acid systems
Unfortunately, as mentioned earlier, the volatilities of the mixtures based on hexanoic acid
and octanoic acid were too low to allow direct determination of mixed vapour compositions
from the IR spectra obtained with the present TGA-FTIR setup. Nonetheless, one can use an
indirect approach to infer the likely steady-state composition of such evaporating mixtures.
0.0
0.2
0.4
0.6
0.8
1.0
0.0
0.2
0.4
0.6
0.8
1.0
0 20 40 60 80 100
xAy A
VCI released (wt. %)
80 mol % TEA
yA
xA
©© UUnniivveerrssiittyy ooff PPrreettoorriiaa

79
The steady-state (“azeotrope”) composition should correspond to the mixture composition
that exhibits the lowest rate of evaporation. This was confirmed within experimental error for
the discrete set of compositions that were tested for acetic acid and propanoic acid. Further
confirmation is provided by the following observation, which also applied to the hexanoic
acid and octanoic acid mixtures. The initial release of the amine was detected for all mixtures
higher in amine content. Those with equal moles of amine and acid had the lowest volatility
composition (as indicated by the TGA mass loss rate). Thus it may safely be concluded that
the composition of the mixtures exhibiting the lowest volatility indicates the steady-state,
“azeotrope”-like composition of that particular amine-carboxylic acid VCI system.
4.8 Corrosion tests
The octanoic acid-based VCI model compounds were all found to be corrosive towards
galvanised steel. All samples showed white staining after exposure. Therefore, only the
corrosion test results for mild steel and copper are presented in Figure 40. None of the
mixtures was particularly effective with respect to copper protection, with all of them causing
green staining of the copper samples. Surprisingly, the staining was only slight for the 1:1
hexylamine-octanoic acid mixture, even though the inhibition performance was poor.
Figure 40: Skinner corrosion test results on copper and mild steel for the amine-octanoic acid
mixtures with amine contents of zA = 0.25 and 0.50
0 20 40 60 80 100
(1:3)
Hexylamine (1:1)
(1:3)
Morpholine (1:1)
(1:3)
TEA (1:1)
(1:3)
Hexylamine (1:1)
(1:3)
Morpholine (1:1)
(1:3)
TEA (1:1)
Inhibitor efficiency (%)
Mild steel
Copper
©© UUnniivveerrssiittyy ooff PPrreettoorriiaa

80
The morpholine-octanoic acid and TEA-octanoic acid mixtures, both with zA = 0.50,
produced the best inhibitor efficiencies for mild steel at ca. 91% (with no staining) and
ca. 82% (with slight black staining) respectively. This is in approximate agreement with the
findings of the previous study (Vuorinen & Skinner, 2002). The hexylamine-octanoic acid
mixture with zA = 0.50 did not perform as well. In this case the inhibitor efficiency was only
about 68%, although the metal surface did not show any staining.
©© UUnniivveerrssiittyy ooff PPrreettoorriiaa

81
5 DISCUSSION
Volatility is a key property of the VCIs that are used to prevent atmospheric corrosion of
metals. Proprietary mixtures of amines and carboxylic acids are suitable for the protection of
iron and steel components against atmospheric corrosion during storage and transportation.
The interactions between these two types of molecule are well established, but little is known
about the nature of the vapours that are emitted. In this study a new method, based on
thermogravimetric analysis coupled with evolved gas (TGA-FTIR) was developed in order to
shed light on this aspect. The TGA provided information on the rate of VCI release, while the
FTIR spectra allowed quantification of the composition of the vapour emitted. The method
was applied to study VCI model compounds based on mixtures of triethylamine and acetic
acid. The mixtures were kept isothermally at 50 C and allowed to vaporise into a stream of
nitrogen gas. The vapour phase FTIR spectra were recorded at 230 C as, at this temperature,
interactions between the amine molecules and the carboxylic acids are insignificant. At this
elevated temperatures the hydrogen-bonded amine-carboxylic acid mixtures dissociate to
yield free amine and carboxylic acid molecules. This greatly simplified the task of
quantifying the vapour phase compositions as the mixture FTIR spectra were simply
composition-weighted linear combinations of the spectra for the pure amine and acid present.
Volatile corrosion inhibitors (VCIs) model compounds, comprising of mixtures of amines
and carboxylic acids, were characterised by thermal analysis (DSC and TGA), Fourier
transform infrared spectroscopy (FTIR) and also by the TGA-FTIR evolved gas analysis
technique. Pure carboxylic acids featured dimers as the dominant species in the liquid phase.
However, the dimer concentration decreased significantly on addition of an amine. This was
confirmed by the decrease in the intensity of the carboxylic acid dimer (C=O) absorption
band and by the absence of the dimer OH out-of-plane bending absorption band at 944 cm-1
in the FTIR spectra of the liquid phase mixtures. Therefore, amine addition leads to the
dissociation of carboxylic acid dimers in favour of salt formation.
The order of the amines (primary, secondary or tertiary), and the chain length of the aliphatic
carboxylic acids, were varied. The carboxylic acid chain length was varied because the
shorter chain carboxylic acids are more volatile and it was easier to quantify their vapours in
the amine mixtures. Furthermore equimolar mixtures of amines with octanoic acid are known
VCIs whereas those with acetic acid may even promote corrosion (Vuorinen & Skinner,
©© UUnniivveerrssiittyy ooff PPrreettoorriiaa

82
2002). In addition, the interactions between the carboxylic acids and the amines are not
significantly affected by the chain length of the former.
It is well known that carboxylic acid monomers form hydrogen-bonded dimers (denoted by
C2) and 1:1 salts with amines via an acid-base reaction (denoted by A1C1). The ionic A1C1
salt is usually stabilised in organic liquid media by either associating as ion pairs (A2C2) or by
interactions with acid dimers to form A1C3 complexes. The ionic nature of the mixtures was
confirmed by the presence of the carboxylate COO– absorption band at approximately 1560
cm-1
and also by the presence of the protonated amine at approximately 1400 cm-1
on the
FTIR (Figure 17). Liquid phase FTIR spectroscopy, refractive index data and DSC results
indicated that the nature of the complexes formed in the liquid phase varied with the
composition of the bulk solution (Figure 20, 21 and 26). With the tertiary amine
(triethylamine), the maximum ionisation was achieved at a composition corresponding to that
of the A1C3 complex. It is most likely that steric hindrance effects hampered stabilisation via
associated ion pair formation when the salt-forming amine is tertiary. In contrast, the other
two lower order amines formed low-melting crystalline 1:1 salts, with the A2C2 complex also
being favoured in the liquid state.
As expected, the volatility of the pure carboxylic acids decreased as the carboxylic acid chain
length increased. This was confirmed by the high boiling temperatures of hexanoic and
octanoic acids observed with DSC (Figure 25). It was further confirmed by the low mass loss
rates observed in TGA conducted at 50 °C and in consequence the low intensity of the
absorption bands in the vapour phase FTIR spectra for the higher acids. Of the pure amines,
triethylamine was found to be the most volatile, while morpholine was the least volatile.
VCIs are often present in either a paper sheet or a plastic film and must reach the metal
surface by crossing a thin layer of air. In the presence of favourable temperature gradients
transport of the VCI will be enhanced by free convection. In the present study, for the
duration of the corrosion test the bottom of the jar was kept in a constant water bath set at 40
°C. However, the top of the jar is exposed to the air of the hood. Skinner (1993) estimated
that the temperature at the sample could be about 33 °C. Therefore it is expected that the
temperature difference will lead to convection currents that could assist the VCI to reach the
metal surface. However, if the air is stagnant, the release rate of a pure volatile compound is
determined by its gas permeability (Pieterse et al., 2006). It constitutes a lower limit for the
isothermal rate at which the VCI will be released. The gas permeability parameter is the
©© UUnniivveerrssiittyy ooff PPrreettoorriiaa

83
product of the vapour pressure and the diffusion coefficient in air, i.e. Si = PiDAi. The former
is a measure of the concentration of the compound in air, while the latter is an indication of
the mobility of the inhibitor molecules in the gas phase. The gas permeability can be
estimated by simple isothermal or dynamic scanning TGA experiments. In essence, the
technique is based on the quantification of the vaporisation mass loss rate from a partially
filled cylindrical cup (Pieterse & Focke, 2003). The governing equation is
(13)
where m is the mass of compound i remaining in the pan in kg; t is the time in s; M is the
molar mass of the compound in kg mol-1
; A is the vaporisation surface area in m2; R is the
universal gas constant in J mol-1
K-1
; z is the distance from the liquid meniscus to the top edge
of the pan in m; T is the temperature in K; P is the vapour pressure of the compound in Pa;
and DAi is the diffusion coefficient of the compound i in air in m2 s
-1.
The calculation of the diffusion length z requires density data and these are reported in
Table 3 for the systems of interest here. During the initial period of evaporation the area of
diffusion was found to be 3.24 x 10⁻⁵
m2.
Table 3: Experimental densities (ρ) of the neat amines, the neat carboxylic acids and the least
volatile binary mixtures in the amine-carboxylic acid systems at 50 °C. The number in
brackets indicates the concentration of the amine in the mixture in mol %
ρ (kg.m-3
) Neat Triethylamine Hexylamine Morpholine
Neat 702 ± 2 739 ± 0.4 1 007 ± 2
Acetic acid 1 020 ± 4 991 ± 3 (24) 912 ± 12 (50) 737 ± 0 (50)
Propanoic acid 963 ± 3 960 ± 1 (25) 928 ± 2 (33) 1063 ± 1 (33)
Hexanoic acid 901 ± 1 867 ± 2 (25) 895 ± 0 (25) 959 ± 1 (25)
Octanoic acid 889 ± 1 894 ± 3 (20) 887 ± 1 (25) 935 ± 1 (25)
Equation (13) was used to estimate the gas permeability of the least volatile VCI mixtures. In
the present case it was assumed that the molar mass of the active species in these mixtures
corresponded to that of the relevant A1Cn complex. Figure 41 plots the values of the gas
permeability for morpholine, propanoic acid, and the mixture containing 33.3 mol % of the
amine measured at 50 C. The Si = PiDAi values in Table 4 are averaged values obtained in
©© UUnniivveerrssiittyy ooff PPrreettoorriiaa

84
the plateau region of the profiles of the mixtures. Figure 41 provides a representative plot that
shows the points at which these values were determined. The calculated Si values for the least
volatile mixtures are independent of the amount of liquid that has evaporated, indicating that
such compositions do behave like pseudo-compounds. Numerous PiDAi profiles were
generated for different amine-carboxylic acid mixtures and they are shown in Appendix F.
The values of the gas permeability for other mixtures are presented in Table 4. Among the
neat compounds, triethylamine featured the highest and octanoic acid the lowest Si value. The
lowest overall Si value obtained in this study was 0.009 ± 0.001 Pa m2.s
-1 for the hexylamine-
octanoic acid binary mixture containing 25 mol % amine.
Figure 41: Product of vapour pressure and diffusion coefficient of the morpholine-propanoic
acid binary mixture compared with pure morpholine and pure propanoic acid
Irrespective of the initial amine content of a given system, the composition of the liquid
remaining and the vapour emitted eventually settled at the same fixed steady-state value as
the VCI in the liquid state was depleted. This behaviour is reminiscent of “azeotrope”
formation. For triethylamine-based mixtures this steady-state “azeotrope”-like composition
was found at approximately 27 mol % TEA. This value is close to the composition of the 1:3
mole ratio amine-acid complex. For the TEA-acetic acid model compound, the steady state
(“azeotrope”) vapour composition is rich in acetic acid and this may explain why the TEA-
0.1
1
10
100
10 100
PCD
AC
(Pa
.m2s-1
)
Fraction evaporated (wt.%)
Morpholine
Propanoic acid
Morpholine-propionic acid
(33.3 mol% morpholine)
©© UUnniivveerrssiittyy ooff PPrreettoorriiaa

85
acetic acid mixture is a poor VCI for mild steel. As expected, mixtures close to the
“azeotrope” composition featured the lowest volatility.
Table 4: Gas permeability (Si = PiDAi) of the neat amines, the neat carboxylic acids and the
least volatile binary mixtures in the amine-carboxylic acid systems at 50 °C. The number in
brackets indicates the concentration of the amine in the mixture in mol %
PiDAi (Pa.m2.s
-1) Neat Triethylamine Hexylamine Morpholine
Neat - 60 ± 0.2 69 ± 0.3
Acetic acid 164 ± 2 1.89 ± 0.01 (24) 0.41 ± 0.03 (50) 0.67 ± 0.01 (50)
Propanoic acid 45.0 ± 0.2 1.34 ± 0.01 (25) 0.24 ± 0.01(33) 0.74 ± 0.01 (33)
Hexanoic acid 1.28 ± 0.1 0.16 ± 0.01 (25) 0.063 ± 0.002 (25) 0.078 ± 0.02 (25)
Octanoic acid 0.19 ± 0.02 0.048 ± 0.003 (20) 0.009 ± 0.001 (25) 0.022 ± 0.001 (25)
The triethylamine systems all showed “azeotrope” compositions close to the composition of
the A1C3 complex. The behaviour of the systems based on the primary and secondary amines
was different. Here the “azeotrope” composition of the acetic acid systems corresponded
approximately to that expected for the 1:1 salt. This was expected as this complex is favoured
with these amines in combination with any of the acids tested in this study, as indicated by
the FTIR, DSC and refractive index data. However, as the chain length increased, in the
series acetic acid to octanoic acid, the amine content of the “azeotrope” decreased, moving
closer towards the composition of the A1C3 complex. This trend can be attributed to the
decreasing volatility of the carboxylic acid dimers as their chain length increased in
conjunction with the dissociative evaporation mechanism described in Scheme V.
Important conclusions can be drawn from these results. Firstly, the gas permeabilities of the
“azeotrope” compositions tend to be much lower than those of the parent amines or
carboxylic acids. The volatility suppression for the present mixtures ranged from one to five
orders of magnitude. This implies that the amine-carboxylic acid-based VCIs will emit
vapours at a much lower rate than their constituents, permitting prolonged periods of action.
©© UUnniivveerrssiittyy ooff PPrreettoorriiaa

86
Scheme V: Schematic presentation of an amine-carboxylic acid mixture. A and C represent
an amine and a carboxylic acid, while C···C and A+C
- represent a hydrogen bonded
carboxylic acid dimer and an amine-carboxylic acid salt respectively.
The evaporation of the VCI can be explained in terms of the dissociative evaporation
mechanism pictured in Scheme V. It represents a modification of the proposal first made by
Andreev and Ibatullin (2002). In essence, it is assumed salt and complex formation are
dynamic processes and that only neutral molecules evaporate. This means that vaporisation
occurs mostly by the release of free amine molecules, acid monomers and possibly acid
dimers. In the first step, amine carboxylate salt complexes (A2C2) dissociate near the surface
to form free amine and carboxylic monomers. The more volatile amine can then be released
into the vapour phase. The same is true for the carboxylic monomer. However, its release into
the vapour phase is retarded by the dynamic formation of acid dimers (i.e. C2) and their
subsequent complexation with remaining salt species, i.e. forming the A1C3 complex. The
likelihood of retaining the carboxylic acid molecules increases as the chain length of the
alkanoic acid increases because its volatility relative to that of the free amine is suppressed.
So, in summary, when ion pair dissociate, the free amine is more easily lost to the vapour
phase than the acid monomer. In addition, the volatility of the acid monomer that is left
behind is further reduced by dimerisation and the subsequent association of the acid dimer
with an amine-acid ion pair.
The application of Equation (13) to the systems tested here in the VCI corrosion test
apparatus showed that the 72 h film-forming period used was sufficient to vaporise most of
the VCI dosed in the present Skinner’s corrosion tests. The 1:3 mixture of hexylamine-
octanoic acid was the least volatile system considered in this study. Calculations based on the
gas permeability of this composition, and considering the dimensions of the vials used for the
VCI liquids, show that about 2.5 h at 50 C would be sufficient to vaporise 250 mg in the
Skinner set-up, provided it formed a uniform layer at the bottom of the vial. Although the
3A+C-A + A + C +C + A+C-
A + A
C CA +
A+C-
A+C-+C C+
©© UUnniivveerrssiittyy ooff PPrreettoorriiaa

87
corrosion test was only conducted at 40 C, it is unlikely that the vaporisation rate would be
slower by more than a factor of two at 50 C. This was confirmed experimentally by the
complete mass loss observed for the vials kept for 72 h in the convection oven set at 40 C.
When VCI mixture is allowed to vaporise inside a closed test jar, the rate of vaporization will
decrease over time as the air in the jar above the vial becomes saturated with VCI
components. However, after 72 h film forming period only minor amounts of the VCI were
still present in the vials that were placed inside the test jars. This amount varied from as little
as 4.4% for the 1:3 hexylamine-octanoic acid mixture to as much as 18% for the 1:1
morpholine-octanoic acid mixture. Nonetheless, these results do confirm that, for the VCI
mixtures tested in the present study, most of the active had indeed evaporated during the film
forming period of the corrosion test. As the air in the jar above the vial gets saturated with the
VCI components, it is suspected that some VCI will adsorb on the glass and metal surfaces
and also condense to form a thin liquid layer at the bottom of the jar.
The inhibitor performance reported in literature pertains to that of equimolar mixture
(Skinner, 1993; Vuorinen & Skinner, 2002). The present corrosion tests results (Figure 40)
confirmed the previous findings for the 1:1 mixtures containing triethylamine-octanoic acid
and morpholine-octanoic acid (Vuorinen & Skinner, 2002). Interestingly, the present TGA-
FTIR results indicated that these equimolar mixtures release mostly free amine during the
initial stages of evaporation. No carboxylic acid absorption bands were observed on the FTIR
spectra in the vapour phase for the octanoic acid and hexanoic acid amine systems. This
suggests that on application of these VCIs the primary role of carboxylic acid, at least
initially, is to control the release rate of the amine. The equimolar mixtures performed
reasonably well as VCIs for mild steel in the Skinners test.
Contrary to the equimolar mixtures, in all three systems a significant drop in inhibitor
efficiency was observed when the amine concentration in the VCI mixture was reduced to zA
= 0.25 as shown in Figure 40. These samples also showed black staining of the metal surface,
although it was only slight for the 1:3 hexylamine systems. Since the major part of the
inhibitors vaporized in these tests, the explanation might be found in the excess acid present
imparting an adverse pH, outside the passivation range, in the moisture film on the metal
surface. To test this hypothesis, the pH of 5 wt.% solutions in deionised water was
determined. The results presented in Table 5 confirm that the solutions containing the 1:3
©© UUnniivveerrssiittyy ooff PPrreettoorriiaa

88
amine-octanoic acid mixtures yielded slightly more acidic solutions than the corresponding
1:1 mixtures.
Table 5: The experimental pH values for 5 wt.% solutions, in deionised water, of 1:1 and 1:3
mixtures of the amines with octanoic acid.
Amine: acid (mol ratio) Triethylamine Hexylamine Morpholine
1:1 6.7 7.6 7.0
1:3 6.1 6.5 6.1
The key finding of the present study is that the amount of amine released initially, by a
mixture with carboxylic acids, differs from the ultimate value. Over time the mixtures
composition stabilises and reaches an “azeotrope”-like steady state composition. Therefore
the main conclusion of this investigation is that the long-term performance of the vapour
released from amine-carboxylic acid VCIs may not accord with the results obtained from the
short-term inhibitor performance tests. The present observations also suggest that future
formulations of amine-carboxylic acid systems should pay closer attention to matching the
volatilities of the constituent amines and carboxylic acids.
©© UUnniivveerrssiittyy ooff PPrreettoorriiaa

89
6 CONCLUSION
A TGA-FTIR method was successfully developed and applied to study the evaporation of
amine-carboxylic acid-based VCI model compounds. The method is simple to use and
allowed the quantification of both liquid and vapour phase compositions. It is hoped that this
method will find utility in the characterisation of other VCIs and thereby aid in understanding
their mechanism of action.
Mixtures of amines and carboxylic acid were studied using this new TGA-FTIR technique.
Evaporation was followed by TGA and the nature and composition of the released vapours
was determined by FTIR. It is well known that carboxylic acids form dimers (C2) while the
amines and acids can undergo Brønsted-Lowry acid-base interactions to form a salt. The salt
is stabilized by forming an ion pair (A2C2) or by complexing with an acid dimer (A1C3). It
was found that the A1C3 complex dominated in the mixtures containing tertiary amine, while
the A1C1 complex was favoured in liquid mixtures containing the primary and secondary
amines. This was confirmed by the liquid phase FTIR, DSC and the refractive index results.
Volatility was quantified by the gas permeability values measured using TGA measurements.
The amine-carboxylic acid mixtures were generally found to be much less volatile than the
corresponding pure components.
Amine carboxylic acid-based VCIs are traditionally employed as equimolar mixtures in
commercial practice. The present study investigated the performance of mixtures of octanoic
acid with hexylamine, morpholine and triethylamine. The equimolar mixtures proved to be
effective as VCIs for mild steel in the Skinner’s test. However, it was found that the
composition of the mixtures released by such systems varied over time. Initially the vapours
are amine rich implying that it is progressively depleted in the liquid phase. Eventually an
“azeotrope”-like steady state is reached where the vapour and the liquid compositions
converge to the same value. This composition was close to that expected for the A1C3
complex. It consists of a strongly associated ion pair formed by the 1:1 salt of the amine with
one carboxylic acid that is stabilized by association with a carboxylic acid dimer. This
behaviour can be explained by the dissociative evaporation model. It assumes that complex
formation is a dynamic process and that only free amines and carboxylic acids can enter the
vapour phase from the liquid. Note that this chemical model does not preclude the subsequent
formation of similar complexes in the vapour phase.
©© UUnniivveerrssiittyy ooff PPrreettoorriiaa

90
The present study was performed at 50 °C. However the compositions of the vapours released
by such systems can also be understood by studying the (atmospheric pressure) phase
diagram. Figure 4 shows the VLE data obtained by van Klooster and Douglas for TEA-acetic
acid binary mixtures. As expected the highest boiling temperature (i.e. lowest volatility) is
found for the “azeotrope” composition. This was confirmed by the boiling onset temperatures
observed in the DSC data for the TEA-acetic acid mixtures. The reason for this is attributed
to volatility suppression caused by the ionic nature of the mixtures, confirmed by the FTIR
results. TEA and acetic acid molecules are held together by strong electrostatic forces.
Therefore high temperatures are necessary to overcome the strong ionic bonds between TEA
and acetic acid and this leads to a higher-boiling “azeotrope”.
When the amine is initially present beyond the azeotrope value, the phase diagram reveals
that almost pure amine will be released by the mixture. As the excess amine evaporates, the
liquid is depleted and the acetic acid concentration in the liquid increases until the mixture
reaches the steady state “azeotrope”-like composition. For this system (TEA-acetic acid) this
stage is rich in acid and hence mixtures featuring this composition could result in the creation
of a corrosive environment. When the initial amine concentration is below the “azeotrope”
composition, the phase diagram shows that almost pure acid will vaporize. In this case the
vapours could be corrosive right from the start and may cause metal discoloration before the
actual corrosion protection sets in.
The inhibitor efficiencies of 1:3 amine-octanoic acid mixtures were tested and compared to
those of the traditional 1:1 mixtures for mild steel. The former had compositions close to that
of the azeotrope”. However, they provided poor corrosion protection when compared to the
corresponding equimolar mixtures. Thus the main conclusion of this investigation is that the
long term performance of amine-carboxylic acid VCI vapours released from reservoirs may
not accord with the results obtained by short term inhibitor performance tests. The present
observations also suggest that the future formulations of amine-carboxylic acid systems
should pay closer attention to matching the volatilities of the constituent amines and
carboxylic acids.
©© UUnniivveerrssiittyy ooff PPrreettoorriiaa

91
REFERENCES
Ahmad, Z. (2006).Corrosion control by inhibition. In: Amad, Z. (Ed.), Principles of
Corrosion Engineering and Corrosion Control, Boston, US: Butterworth-Heinemann,
pp 352–381.
Åmond, L.-R. and Tullin, C.T. (2012). The theory behind FTIR analysis. Application
examples from measurements at the 12 MW circulating fluidized bed. Department of
Energy Conversion, Chalmers University of Technology, Sweden. Available at:
http://www.fysik.lu.se./cecost [Accessed on 12 January 2012).
Andreev, N. N. and Goncharova, O. A. (2004). The effect of OH- ions on the inhibition of
steel corrosion with amines. Prot. Met., 40 (3): 280–287.
Andreev, N. N. and Ibatullin, K.A. (2002). On the prediction of the vapour’s pressure of salt
type volatile inhibitors, Prot. Met. 38: 13-16s
Andreev, N. N. and Kuznetsov, Y. I. (2005). Physicochemical aspects of the action of volatile
metal corrosion inhibitors Rus. Chem. Rev., 74: 685–695.
Badran, B.M., Abdel-Fattah, A. A. and Abdul A. A. (1982). New corrosion inhibitors based
on fatty materials-II. Epoxidized fatty materials modified with aromatic amines.
Corros. Sci., 22(6): 525–536.
Barrow, G. M. and Yerger, E. A. (1954). Acid-base reactions in non-dissociating solvents.
Acetic acid and triethylamine in carbon tetrachloride and chloroform. J. Am. Chem.
Soc., 76: 5211–5216.
Bastidas, D.M., Cano, E. and Mora, E.M. (2005). Volatile corrosion inhibitors: a review Anti-
Corros. Methods Mater., 52(2): 71–77.
Bastidas, J.M. and Mora, E.M. (1998). A laboratory study of mild steel vapour phase
corrosion and its inhibition by dicyclohexylamine Can. Metall. Q., 37(1): 57–65.
Beverley, K.J., Clint, J.H. and Fletcher, P.D.I. (1999). Evaporation rates of pure liquids
measured using a gravimetric technique. Phys. Chem., Chem. Phys., 1: 149–153.
©© UUnniivveerrssiittyy ooff PPrreettoorriiaa

92
Bobik, M. (1977). Ultrasound absorption in mixtures of triethylamine with carboxylic acids.
Adv. Mol. Rel. Int. Pro.,11: 191–209.
Bommersbach, P., Alemany-Dumont, C., Millet, J.P. and Normand, B. (2005). Formation and
behaviour study of an environment-friendly corrosion inhibitor by electrochemical
methods. Electrochim. Acta, 51: 1076–1084.
Boyle, B. (2004). A look at the developments in vapour phase corrosion inhibitors. Met.
Finish., 102(5): 37–41.
Buckland, S., Friman, R. and Karlsson, S. (1997). Aggregation studies in alkanoic acid-alkyl
amine-water systems. Colloids Surf., A, 123–124: 125–133.
Burneau, A., Génin, F. and Quilès, F. (2000). Ab initio study of the vibrational properties of
acetic acid monomers and dimers. Phys. Chem. Chem. Phys., 2: 5020–5029.
Cano, E., Bastidas, D.M., Simancas, J. and Bastidas, J.M. (2005). Dicyclohexylamine nitrite
as volatile corrosion inhibitor for steel in polluted environments. Corrosion, 61(5):
473–479.
Choi, H., Song, Y.K., Kim, K.Y. and Park, J.M. (2012). Encapsulation of triethanolamine as
organic corrosion inhibitor into nanoparticles and its active corrosion protection for
steel sheets. Surf. Coat. Technol., 206: 2354–2362.
Coates, J. (2000). Interpretation of infrared spectra, a practical approach. In: Meyers, R.A.
(Ed.), Encyclopedia of Analytical Chemistry, Chichester: Wiley, pp. 10815–10837.
DeTar, D. F. and Novak, R. W. (1970). Carboxylic acid-amine equilibria in nonaqueous
solvents. J. Am. Chem. Soc., 92: 1361–1365.
Du Preez, P.F. (1998). The development and evaluation of new vapour phase corrosion
inhibitors. M Eng thesis, Department of Chemical Engineering, University of Pretoria,
Pretoria, South Africa.
Duprat, M., Dabosi, F., Moran, F. and Rocher, S. (1981). Inhibition of corrosion of carbon
steel by the aliphatic fatty polyamines in association with organic phosphorous
compounds in 3% sodium chloride solution. Corrosion, 37: 262–266.
©© UUnniivveerrssiittyy ooff PPrreettoorriiaa

93
Dutton, R. (2004). Problems with volatile corrosion in the metal finishing industry. Pollution
Control, 12–15.
Eibl, S. and Reiner, D. (2011). Correlation of content and corrosion protection of volatile
corrosion inhibitors in packaging material-regaining trust. VCI Mater. Corros., 62(8):
745–752.
Eigenmann, F., Maciejewski, M. and Baiker, A. (2000). Gas adsorption studied by pulse
thermal analysis. Thermochim. Acta, 359: 131–141.
Eigenmann, F., Maciejewski, M. and Baiker, A. (2006a). Influece of measuring conditions on
the quantification of spectroscopic signals in TA-FTIR-MS system. J. Therm. Anal.
Calorim., 83(2): 321–330.
Eigenmann, F., Maciejewski, M. and Baiker, A. (2006b). Quantitative calibration of
spectroscopic signals in combined TG-FTIR system. Thermochim. Acta, 440: 81–92.
Estevão, L.R.M. and Nascimento, R.S.V. (2001). Modifications in volatilization rate of
volatile corrosion inhibitors by means of host-guest systems. Corros. Sci., 43: 1133–
1153.
Fiaud, C. (1994). Theory and practice of vapour phase inhibitors, in corrosion inhibitors,
European Federation of Corrosion Publications, No. 11, Institute of Materials, London,
1994, pp. 1-11.
Focke, W.W. (2003). A revised equation for estimating the vapour pressure of low volatility
substances from isothermal TG data. J. Therm. Anal. Cal., 74: 1107–1118.
Friberg, S.E., Sun, W.M., Yang, Y. and Ward, A.J.I. (1990). Molecular interactions in
nonaqueous cationic system. J. Colloid Interface Sci., 11: 503–517.
Gao, G., Liang, C.H. and Wang, H. (2007). Synthesis of tertiary amines and their inhibitive
performance on carbon steel corrosion. Corros. Sci., 49: 1833–1846.
Gerald, C. F. (1970). Applied Numerical Analysis. Reading, US: Addison-Wesley Publishing
Co.
©© UUnniivveerrssiittyy ooff PPrreettoorriiaa

94
Goldade, V.A., Pinhuk, L.S., Makarevich, A.V. and Kestelman, V.N. (2005). In: Hull R.,
Osgood Jr, R.M., Parisi, J. and Walimont, H. (Eds), Plastics for Corrosion Inhibition
Berlin-Heidelberg: Springer-Verlag.
Gough, S.R. and Price, A.H. (1968). Dielectric study of the molecular complexes formed
between triethylamine and acetic acid and monochloroacetic acid. J. Phys. Chem., 72:
3347–3349.
Gűnzler, H. and Grelich, H.-U. (2002). IR Spectroscopy – An Introduction. Weinheim:
Wiley-VCH.
Hafaiedh, N., Toumi, A. and Bouanz, M. (2009). Dynamic viscosity study of binary mixtures
triethylamine + water at temperatures ranging from (283.15 to 291.35) K. J. Chem.
Eng. Data, 5: 2195–2199.
Hassan, S.M., Moussa, M.N., El-Tagoury, M.M. and Radi, A.A. (1990). Aromatic acid
derivatives as corrosion inhibitors for aluminium in acidic and alkaline solutions. Anti-
Corros. Methods Mater., 8–11.
Hays, G.F. (2010). Now is the time. In: Elizer, A. (Ed.), Corrosion Processes and Advanced
Materials in Industry, Switzerland: Trans Tech Publications Ltd.
Heal, G.R. (2002). Thermogravimetry and derivative thermogravimetry. In: Haines, P.J.
(Ed.), Principles of Thermal Analysis and Calorimetry, London: Royal Society of
Chemistry.
Hœrlé, F., Mazaudier, F., Dillmann, P.H. and Santarini, G. (2004). Advances in
understanding atmospheric corrosion of iron. II. Mechanistic modeling of wet and dry
cycles. Corros. Sci., 46: 1431–1465.
Hyskens, P., Felix, N., Janssens, A.,, Van den Broeck, F. and Kapuku, F. (1980). Influence of
the dielectric constant on the viscosity and on the formation of conducting ions in
binary carboxylic acids-triethylamine mixtures J. Phys. Chem., 84: 1387–1393.
Karlsson, S., Backlund, S. and Friman, R. (2000). Complexation in the heptanoic acid-
heptylamine system Colloid Polym. Sci. 278: 8–14.
©© UUnniivveerrssiittyy ooff PPrreettoorriiaa

95
Karlsson, S., Päivärinta, J., Friman, R., Poso, A., Hotokka, M. and Backlund, S. (2001).
Characterization of the phase behaviour and complexation in heptanoic acid-
heptylamime-water system. J. Phys. Chem. B, 105: 7944–7949.
Kohler, F. and Hyskens, P. (1976). Some aspects of the structure and interaction potential of
hydrogen bonded complexes. Adv. Mol. Rel. Pro., 8: 125–154.
Kohler, F., Atrops, H., Kalal, H., Liebermann, E., Wilhem, E., Ratkovics, F. and Salamon, T.
(1981a). Molecular interactions in mixtures of carboxylic acids with amines. 1. Melting
curves and viscocities J. Phys. Chem., 85: 2520–2524.
Kohler, F., Gopal, R., Gõtze, G., Atrops, H., Demiriz, M.A., Liebermann, E., Wilhem, E.,
Ratkovics, F. and Palagyl, B. (1981b). Molecular interactions in mixtures of carboxylic
acids with amines. 2. Volumetric, conductimetric, and NMR properties. J. Phys. Chem.,
85: 2524–2549.
Kohler, F., Findenegg, G.H. and Bobik, M. (1974). Mixtures of trifuoroacetic acid with acetic
acid and carbon tetrachloride J. Phys. Chem., 78(17): 1709–1714.
Kohler, F., Liebermann, E., Miksch, G. and Kainz, C. (1972). On the thermodynamics of the
acetic acid-triethylamine system. J. Phys. Chem., 76: 2764–2768.
Kondo, H. (2008). Protic ionic liquids with ammonium salts as lubricants for magnetic thin
film media Tribol. Lett., 31: 211–218.
Kubilda, A.I. and Schreiber, V.M. (1978). Infrared study of some complexes with a strong
hydrogen bond at high and low temperatures J. Mol. Struct., 47: 323-328.
Kui, X., Chao-Fang, D., Xiao-Gang, L., and Fu-Ming, W. (2008). Corrosion products and
formation mechanism during intial stage of atmospheric corrosion of carbon steel.
J. Iron. Steel Res. Int., 15: 42–48.
Kuznetsov, Y.I., Frolove, L. and Toming, E.V. (2007). On the protection of carbon steels
from hydrogen sulfide corrosion with volatile and contact inhibitors Prot. Met., 43(2):
149–154.
Liljefors, T. and Norby, P.O. (1997). An ab initio study of the trimethylamine-formic acid
and trimethylammonium ion-formate anion complexes, their monohydrates, and
continuum solvation J. Am. Chem. Soc.. 119: 1052–1058.
©© UUnniivveerrssiittyy ooff PPrreettoorriiaa
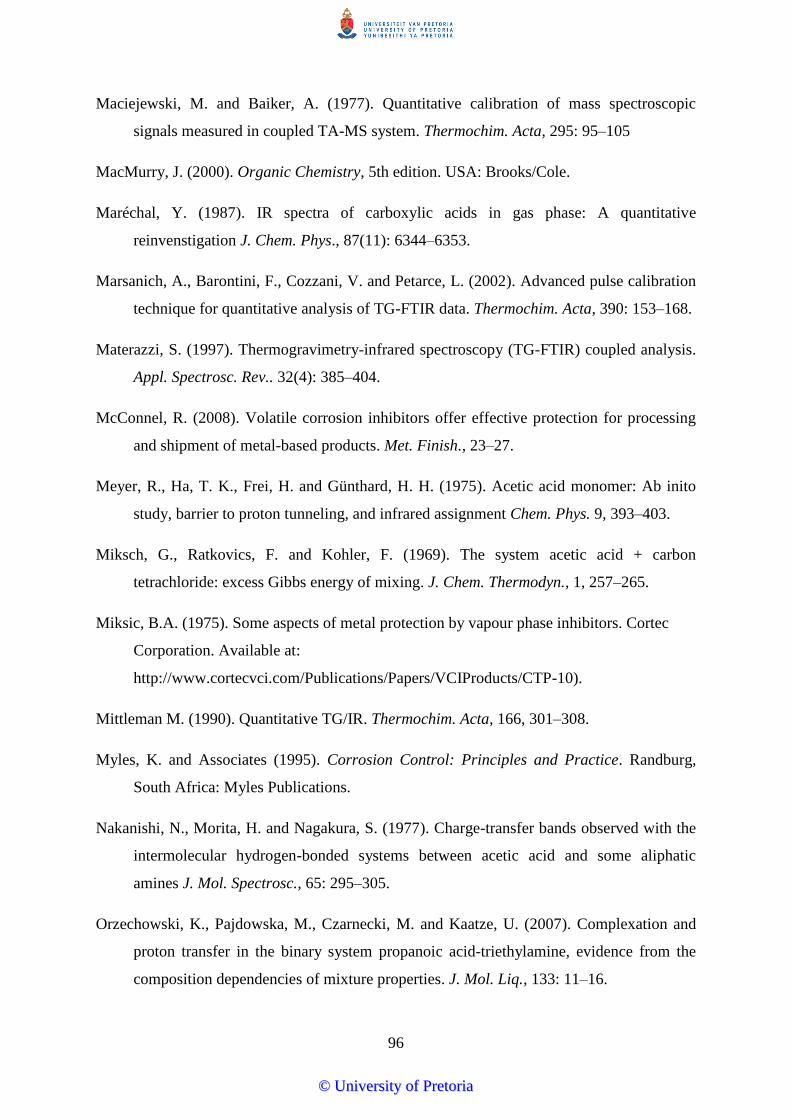
96
Maciejewski, M. and Baiker, A. (1977). Quantitative calibration of mass spectroscopic
signals measured in coupled TA-MS system. Thermochim. Acta, 295: 95–105
MacMurry, J. (2000). Organic Chemistry, 5th edition. USA: Brooks/Cole.
Maréchal, Y. (1987). IR spectra of carboxylic acids in gas phase: A quantitative
reinvenstigation J. Chem. Phys., 87(11): 6344–6353.
Marsanich, A., Barontini, F., Cozzani, V. and Petarce, L. (2002). Advanced pulse calibration
technique for quantitative analysis of TG-FTIR data. Thermochim. Acta, 390: 153–168.
Materazzi, S. (1997). Thermogravimetry-infrared spectroscopy (TG-FTIR) coupled analysis.
Appl. Spectrosc. Rev.. 32(4): 385–404.
McConnel, R. (2008). Volatile corrosion inhibitors offer effective protection for processing
and shipment of metal-based products. Met. Finish., 23–27.
Meyer, R., Ha, T. K., Frei, H. and Günthard, H. H. (1975). Acetic acid monomer: Ab inito
study, barrier to proton tunneling, and infrared assignment Chem. Phys. 9, 393–403.
Miksch, G., Ratkovics, F. and Kohler, F. (1969). The system acetic acid + carbon
tetrachloride: excess Gibbs energy of mixing. J. Chem. Thermodyn., 1, 257–265.
Miksic, B.A. (1975). Some aspects of metal protection by vapour phase inhibitors. Cortec
Corporation. Available at:
http://www.cortecvci.com/Publications/Papers/VCIProducts/CTP-10).
Mittleman M. (1990). Quantitative TG/IR. Thermochim. Acta, 166, 301–308.
Myles, K. and Associates (1995). Corrosion Control: Principles and Practice. Randburg,
South Africa: Myles Publications.
Nakanishi, N., Morita, H. and Nagakura, S. (1977). Charge-transfer bands observed with the
intermolecular hydrogen-bonded systems between acetic acid and some aliphatic
amines J. Mol. Spectrosc., 65: 295–305.
Orzechowski, K., Pajdowska, M., Czarnecki, M. and Kaatze, U. (2007). Complexation and
proton transfer in the binary system propanoic acid-triethylamine, evidence from the
composition dependencies of mixture properties. J. Mol. Liq., 133: 11–16.
©© UUnniivveerrssiittyy ooff PPrreettoorriiaa

97
Orzechowski, K., Pajdowska, M., Fuchs, K. and Kaatze, U. (2003). Complex formation in
binary propanoic acid-triethylamine mixtures: A dielectric relaxation and titration
study. J. Chem. Phys., 119: 8558–8566.
Orzechowski, K., Pajdowska, M., Przybylski, J., Gliński, J. and Kolodziej, H.A. (2000).
Dielectric, acaustic, desimetric and viscosimetric investigations of the tributylamine +
propanoic acid system. Phys. Chem. Chem. Phys.. 2: 4676–4681.
Padjowska, M. and Sobczyk, L. (1982). Dielectric relaxation in propanoic acid-tri-n-
butylamine system. Adv. Mol. Relax. Interact. Proc., 22: 159–165.
Päivärinta, J. Karlsson, S. Hotkka, M. and Poso, A. (2000). Calculated and measured
vibrational frequencies in an alkanoic acid-alkylamine complex. Chem. Phys. Lett.
327: 420–424.
Päivärinta, J., Karlsson, S., Poso, A. and Hotokka, M. (2001). Calculated molecular
properties for different alkanoic acid-alkylamine complexes: A comparison with
measured FTIR and Raman spectra. Chem. Phys., 263: 127–138.
Pereira, E. A. and Tavares, M.F.M. (2004). Determination of volatile corrosion inhibitors by
capillary electrophoresis. J. Chromatogr. A, 1051: 303–308.
Pieterse, N. and Focke, W.W. (2003). Diffusion controlled evaporation through a stagnant
gas: Estimating low vapour pressures from thermogravimetric data. Thermochim. Acta,
406: 191–198.
Pieterse, N., Focke, W.W., Vuorinen, E. and Rácz, I. (2006). Estimating the gas permeability
of commercial volatile corrosion inhibitors at elevated temperatures with thermo-
gravimetry. Corros. Sci., 48: 1986–1995.
Quraishi, M.A. and Jamal, D. (2002). Development and testing of all organic volatile
corrosion inhibitors. Corrosion, 58(5): 387-391.
Quraishi, M.A., Bhardwaj, V. and Jamal, D. (2005). Prevention of metallic corrosion by some
salts of benzoic hydrazide under vapour phase conditions. Indian J. Chem. Technol.,
12: 93–97.
Ramachandran, S., Tsai, B.L., Blanco, M., Chen, H.J., Tang, Y. and Goddard, W.A. (1996).
The self-assembled monolayer mechanism of corrosion inhibition for iron surfaces. In:
©© UUnniivveerrssiittyy ooff PPrreettoorriiaa

98
Jones, R.H. and Baer, D.R. (Eds), New Techniques for Characterizing Corrosion and
Stress Corrosion. Warrendale, US: The Minerals, Metals & Material Society, pp 177–
182.
Rammelt, U., Koehler, S. and Reinhard, G. (2009). Use of vapour phase corrosion inhibitors
in packages for protecting mild steel against corrosion Corros. Sci,. 51: 921–925.
Rammelt, U., Koehler, S. and Reinhard, G. (2011). Electrochemical characterisation of the
ability of dicarboxylic acid salts to the corrosion inhibition of mild steel in aqueous
solutions. Corros. Sci., 53: 3515–3520.
Rawat, J. and Quraishi, M. A. (2003). Influence of some 6-methoxy-aminobenzothiazole
derivatives on corrosion of ferrous and non-nonferrous metals under vapour-phase
conditions. Corrosion, 59(3): 238.
Roberge, P. R. (2000). Handbook of Corrosion Engineering. New York: McGraw-Hill.
Roberge, P.R., Klassen, R.D. and Haberecht, P.W. (2002). Atmospheric corrosivity modeling
– A review. Mater. Des., 23: 321–330.
Rozenfeld, I.L. (1981). Corrosion Inhibitors. New York: McGraw-Hill.
Saeten, O. J., Sjöblom, J. and Gestbom, B. (1991). A dielectric spectroscopic study of fatty
acid/amine complexes in solution. J. Phys. Chem., 95: 1449–1453.
Sanyal, B. (1981). Organic compounds as corrosion inhibitors in different environments –
A review. Prog. Org. Coat., 9: 165–236.
Sastri, V.S. (1998). Corrosion Inhibitors: Principles and Applications. New York: Wiley.
Shreir, L.L., Jarman, R.A. and Burstein, G.T. (1994). Corrosion Control, 3rd edition, Volume
2. Oxford: Butterworth-Heinemann.
Skinner, W. (1993). A new method for quantitative evaluation of volatile corrosion inhibitors.
Corros. Sci., 35: 1494–1501.
Skinner, W., Du Preez, F. and Vuorinen, E. (1999). Evaluation of vapour phase corrosion
inhibitors. Br. Corros. J., 34: 151–152.
©© UUnniivveerrssiittyy ooff PPrreettoorriiaa

99
Skoog, D.A., West, D.M. and Holler, F.A. (1996). Fundamentals of Analytical Chemistry, 7th
edition. Fort Worth, Texas: Saunders College Publishing.
Slager, T.L. and Prozonic, F.M. (2005). Simple methods for calibrating IR in TGA/IR
analyses. Thermochim. Acta, 426: 93–99.
Socrates, G. (1980). Infrared Characteristic Group Frequencies. Chichester: Wiley.
Subramanian, A., Kumar, R.R., Natesan, M. and Vasudevan, T. (2002). The performance of
VPI-coated paper for temporary corrosion prevention of metals. Anti-Corros. Meth.
Mater., 49(5): 354–363.
Syed, S. (2006). Atmospheric corrosion of materials. Emirates J. Eng. Res., 11: 1–24.
Tamada, J.A. and King, C.J. (1990). Extraction of carboxylic acids with amine extractants.
2. Chemical interactions and interpretation of data. Ind. Eng. Chem. Res., 29: 1327–
1333.
Tamura, H. (2008). The role of rust in corrosion and corrosion protection of iron and steel.
Corros. Sci., 50: 1872–1883.
Van Klooster, H.S. and Douglas, W.A. (1945). The system of acetic acid-triethylamine.
J. Phys. Chem., 49: 67–70.
VCI-2000. Available at: http://www.vci2000.com/html/technical.html [Accessed on 12
January 2012].
Vuorinen, E. and Focke, W. (2006). A new technique to evaluate the volatility of vapour
phase corrosion inhibitors (VCIs) and potential VCIs. Chemical Technology, 26.
Vuorinen, E. and Skinner, W. (2002). Amine carboxylates as vapour phase corrosion
inhibitors. Br. Corros. J., 37: 159–160.
Vuorinen, E., Kálmán, E. and Focke, W. (2004). Introduction to vapour phase corrosion
inhibitors in metal packaging. Surf. Eng., 20: 281–284.
Vuorinen, E., Kálmán, E. and Focke, W. (2004). Introduction to vapour phase corrosion
inhibitors in metal packaging. Surf. Eng., 20: 281–284.
©© UUnniivveerrssiittyy ooff PPrreettoorriiaa

100
Whitehead, E.S. (1969). Quantitative infrared determination of ammonium ion in
hydroxylamine sulfate. Anal. Chem., 41: 829.
Wierzejewska-Hnat, M., Mielke, Z. and Ratajczak, H. (1980). Infrared studies of complexes
between carboxylic acids and tertiary amines in argon matrices. J.C.S. Faraday II. 76:
834–843.
©© UUnniivveerrssiittyy ooff PPrreettoorriiaa

101
PUBLICATIONS
1. Nhlapo, N.S., Focke, W.W. and Vuorinen, E. (2012). TGA-FTIR study of the vapours
released by the triethylamine-acetic acid mixtures. Thermochimica Acta, 546: 113–119.
2. Focke, W.W., Nhlapo, N.S. and Vuorinen, E. (2012). Thermal and thermal analysis and
FTIR studies of volatile corrosion inhibitor model systems. Corrosion Science
(Manuscript submitted).
©© UUnniivveerrssiittyy ooff PPrreettoorriiaa

102
APPENDICES
Appendix A: The refractive index values of the pure components and the mixtures determined at 20 °C
Table A-1: The refractive index data for pure amines, pure carboxylic acids and their respective mixtures (the letter in brackets indicates the top
and bottom layers respectively
Refractive index
Sample
(amine mol %)
0 20 25 33 50 67 75 80 100
Hexylamine-acetic 1.3725 1.4195 1.4275 1.4346 - 1.4386 1.4336 1.4305 1.4175
Hexylamine-propanoic 1.3863 1.4245 1.4295 1.4366 1.4466 1.4386 1.4356 1.4366 1.4175
Hexylamine-hexanoic 1.4155 1.4346 1.43860 1.4426 1.4486 1.4416 1.4356 1.4326 1.4175
Hexylamine-octanoic 1.4276 1.4426 1.4436 1.4436 - 1.4436 1.4376 1.4346 1.4175
Morpholine-acetic 1.3725 1.4295 1.4386 1.4446 - - - - 1.4547
Morpholine-propanoic 1.3863 1.4325 1.4406 1.4516 - 1.4667 1.4647 1.4617 1.4547
Morpholine-hexanoic 1.4155 1.4396 1.4456 1.4526 - - 1.4607 1.4597 1.4547
Morpholine-octanoic 1.4276 1.4446 1.4486 1.4616 - - 1.4606 1.4597 1.4547
TEA-formic 1.3692 1.4125 1.4215 1.4346 1.4042 (t) 1.4041 (t) 1.4040 (t) 1.4042 (t) 1.4040
1.4406 (b) 1.4436 (b) 1.4436 (b) 1.4426 (b)
TEA-acetic 1.3725 1.4845 1.4255 1.4335 1.4040 (t) 1.4040 (t) 1.4041 (t) 1.4042 (t) 1.4040
1.4345 (b) 1.4346 (b) 1.4345 (b) 1.4346 (b)
TEA-propanoic 1.3863 1.4255 1.4356 1.4356 1.4326 1.4175 1.4125 1.4085 1.4040
TEA-hexanoic 1.4155 1.4356 1.4386 1.4396 1.4316 1.4216 1.4215 1.4125 1.4040
TEA-octanoic 1.4276 1.4416 1.4436 1.4426 1.4376 1.4286 1.4225 1.4155 1.4040
©© UUnniivveerrssiittyy ooff PPrreettoorriiaa
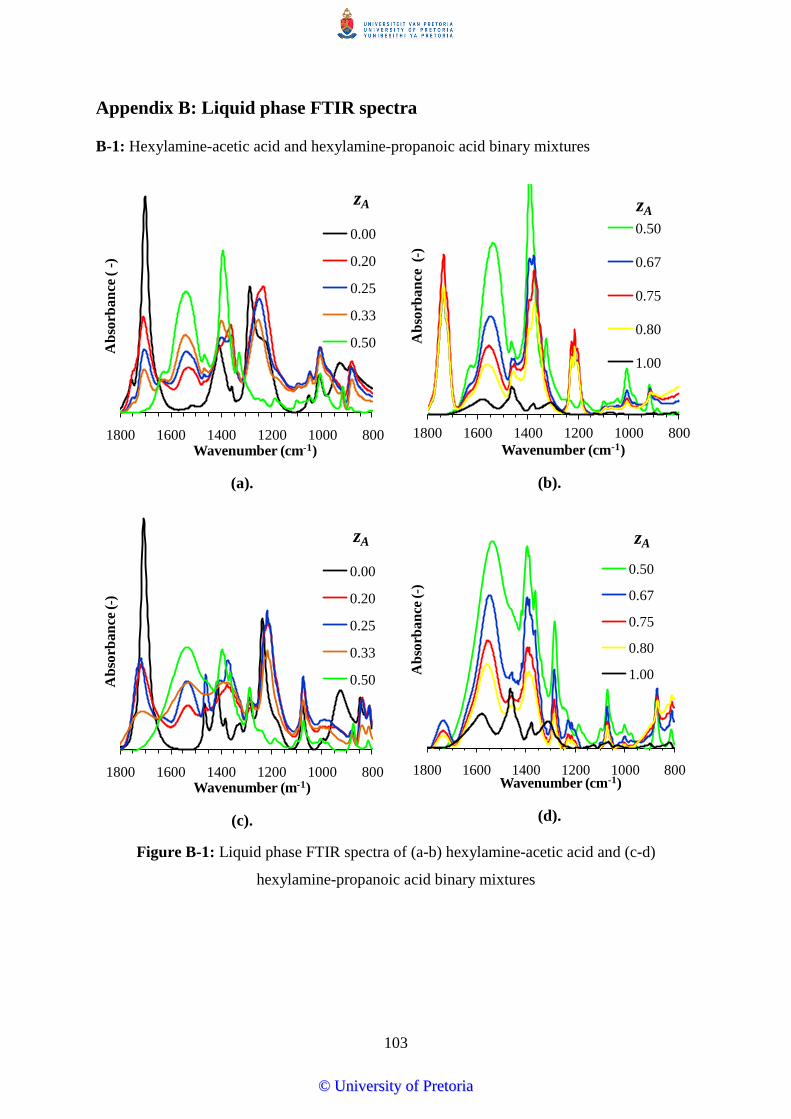
103
Appendix B: Liquid phase FTIR spectra
B-1: Hexylamine-acetic acid and hexylamine-propanoic acid binary mixtures
(a).
(b).
(c).
(d).
Figure B-1: Liquid phase FTIR spectra of (a-b) hexylamine-acetic acid and (c-d)
hexylamine-propanoic acid binary mixtures
80010001200140016001800
Ab
sorb
an
ce ( -
)
Wavenumber (cm-1)
0.00
0.20
0.25
0.33
0.50
zA
80010001200140016001800
Ab
sorb
an
ce (
-)
Wavenumber (cm-1)
0.50
0.67
0.75
0.80
1.00
zA
80010001200140016001800
Ab
sorb
an
ce (-)
Wavenumber (m-1)
0.00
0.20
0.25
0.33
0.50
zA
80010001200140016001800
Ab
sorb
an
ce (
-)
Wavenumber (cm-1)
0.50
0.67
0.75
0.80
1.00
zA
©© UUnniivveerrssiittyy ooff PPrreettoorriiaa

104
B-2: Hexylamine-octanoic acid and morpholine-acetic acid binary mixtures
(a).
(b).
(c).
(d).
Figure B-2: Liquid phase FTIR spectra of (a-b) hexylamine-octanoic acid and (c-d)
morpholine-acetic acid binary mixtures
80010001200140016001800
Ab
sorb
an
ce (-)
Wavenumber (cm-1)
0.00
0.20
0.25
0.33
0.50
zA
80010001200140016001800
Ab
sorb
an
ce (
-)Wavenumber (cm-1)
0.50
0.67
0.75
0.80
1.00
zA
80010001200140016001800
Ab
sorb
an
ce (-)
Wavenumber (cm-1)
0.00
0.20
0.25
0.33
0.50
zA
80010001200140016001800
Ab
sorb
an
ce (
-)
Wavenumber (cm-1)
0.50
0.67
0.75
0.80
1.00
zA
©© UUnniivveerrssiittyy ooff PPrreettoorriiaa

105
B-3: Morpholine-propanoic acid and TEA-octanoic binary mixtures
(a).
(b).
(c).
(d).
Figure B-3: Liquid phase FTIR spectra of (a-b) morpholine-propanoic acid and (c-d)TEA-
octanoic acid binary mixtures
80010001200140016001800
Ab
sorb
an
ce (-)
Wavenumber (cm-1)
0.00
0.20
0.25
0.33
0.50
zA
80010001200140016001800
Ab
sorb
an
ce (
-)
Wavenumber (cm-1)
0.50
0.67
0.75
0.80
1.00
zA
80010001200140016001800
Ab
sorb
an
ce (-)
Wavenumber (cm-1)
0.00
0.20
0.25
0.33
0.50
zA
80010001200140016001800
Ab
sorb
an
ce (
-)
Wavenumber (cm-1)
0.50
0.67
0.75
0.80
1.00
zA
©© UUnniivveerrssiittyy ooff PPrreettoorriiaa

106
B-4: The effect of liquid phase composition on the absorbance of the FTIR peaks near
1700 cm-1
, 1550 cm-1
and 1400 cm-1
(a)
(b)
(c)
(d)
Figure B-4: The effect of liquid phase composition on the absorbance near 1700 cm-1
,
1550 cm-1
and 1400 cm-1
in the FTIR spectra of (a) hexylamine-acetic, (b) hexylamine-
propanoic (c) morpholine-acetic and (d) morpholine-propanoic acid
0.00
0.05
0.10
0.15
0.20
0.25
0.30
0.35
0.40
0.45
0.50
0.0 0.2 0.4 0.6 0.8 1.0
Ab
sorb
an
ce (-)
Mol fraction amine (-)
1700
1550
1400
Wavenumber, cm-1
0.00
0.05
0.10
0.15
0.20
0.25
0.30
0.35
0.40
0.45
0.50
0.0 0.2 0.4 0.6 0.8 1.0
Ab
sorb
an
ce, -
Mol fraction amine, -
1700
1550
1400
Wavenumber, cm-1
0.00
0.0 0.2 0.4 0.6 0.8 1.0
Ab
sorb
an
ce (
-)
Mol fraction amine (-)
1700
1550
1400
Wavenumber, cm-1
0.00
0.05
0.10
0.15
0.20
0.25
0.30
0.35
0.40
0.45
0.50
0.0 0.2 0.4 0.6 0.8 1.0
Ab
sorb
an
ce (-)
Mol fraction amine (-)
1700
1550
1400
Wavenumber, cm-1
©© UUnniivveerrssiittyy ooff PPrreettoorriiaa

107
B-5: The effect of liquid phase composition on the absorbance of the FTIR peaks near
1700 cm-1
, 1550 cm-1
and 1400 cm-1
(a)
(b)
(c)
(d)
Figure B-4: The effect of liquid phase composition on the absorbance near 1700 cm-1
,
1550 cm-1
and 1400 cm-1
in the FTIR spectra of (a) morpholine-hexanoic, (b) morpholine-
octanoic and (c) TEA-hexanoic and (d) TEA-octanoic acid
0.00
0.05
0.10
0.15
0.20
0.25
0.30
0.35
0.40
0.45
0.50
0.0 0.2 0.4 0.6 0.8 1.0
Ab
sorb
an
ce (-)
Mol fraction amine (-)
1700
1550
1400
Wavenumber, cm-1
0.00
0.05
0.10
0.15
0.20
0.25
0.30
0.35
0.40
0.0 0.2 0.4 0.6 0.8 1.0
Ab
sorb
an
ce (-)
Mol fraction amine (-)
1700
1550
1400
Wavenumber, cm-1
0.00
0.05
0.10
0.15
0.20
0.25
0.30
0.0 0.2 0.4 0.6 0.8 1.0
Ab
sorb
an
ce (
-)
Mol fraction amine (-)
1700
1550
1400
Wavenumber, cm-1
0.00
0.05
0.10
0.15
0.20
0.25
0.30
0.35
0.40
0.0 0.2 0.4 0.6 0.8 1.0
Ab
sorb
an
ce (
-)
Mol fraction amine (-)
1700
1550
1400
Wavenumber, cm-1
©© UUnniivveerrssiittyy ooff PPrreettoorriiaa
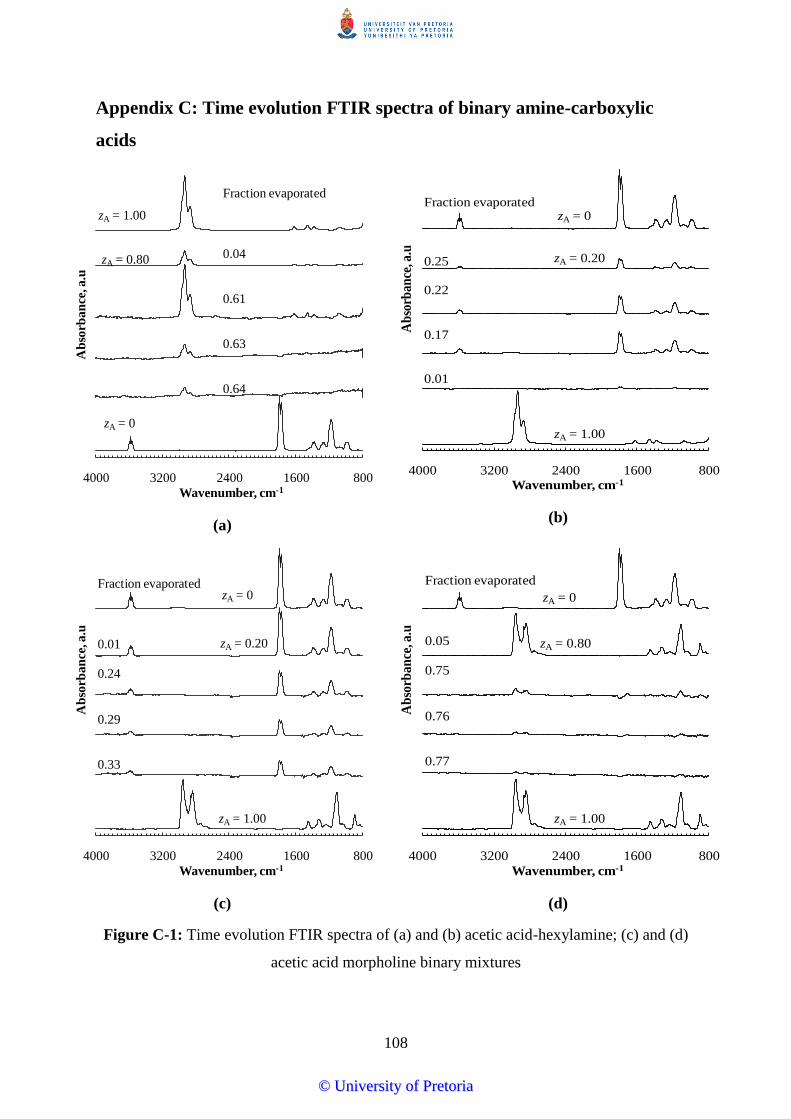
108
Appendix C: Time evolution FTIR spectra of binary amine-carboxylic
acids
(a)
(b)
(c)
(d)
Figure C-1: Time evolution FTIR spectra of (a) and (b) acetic acid-hexylamine; (c) and (d)
acetic acid morpholine binary mixtures
8001600240032004000
Ab
sorb
an
ce, a
.u
Wavenumber, cm-1
zA = 1.00
zA = 0.80
Fraction evaporated
0.04
0.61
0.63
0.64
zA = 0
8001600240032004000
Ab
sorb
an
ce, a
.u
Wavenumber, cm-1
zA = 1.00
zA = 0.20
Fraction evaporated
0.25
0.22
0.17
0.01
zA = 0
8001600240032004000
Ab
sorb
an
ce, a
.u
Wavenumber, cm-1
zA = 1.00
zA = 0.20
Fraction evaporated
0.01
0.24
0.29
0.33
zA = 0
8001600240032004000
Ab
sorb
an
ce, a
.u
Wavenumber, cm-1
zA = 1.00
zA = 0.80
Fraction evaporated
0.05
0.75
0.76
0.77
zA = 0
©© UUnniivveerrssiittyy ooff PPrreettoorriiaa

109
(a)
(b)
(c)
(d)
Figure C-2: Time evolution FTIR spectra of (a) and (b) propanoic acid-hexylamine, (c) and
(d) propanoic acid-morpholine binary mixtures
8001600240032004000
Ab
sorb
ance
, a.u
Wavenumber, cm-1
zA = 0.67
Fraction evaporated
0.03
0.34
0.35
0.37
zA = 0
8001600240032004000A
bso
rban
ce, a
.uWavenumber, cm-1
zA = 0.25
zA = 0
Fraction evaporated
0.004
0.07
0.09
0.12
zA = 1.00
8001600240032004000
Ab
sorb
an
ce, a
.u
Wavenumber, cm-1
zA = 1.00
zA = 0.80
Fractionevaporated
0.03
0.58
0.65
0.68
zA = 0
8001600240032004000
Ab
sorb
an
ce, a
.u
Wavenumber, cm-1
zA = 1.00
zA = 0.20
Fraction evaporated
0.01
0.19
0.25
0.30
zA = 0
©© UUnniivveerrssiittyy ooff PPrreettoorriiaa

110
(a)
(b)
(c)
(d)
Figure C-3: Time evolution FTIR spectra of (a) TEA-hexanoic acid, (b) morpholine-
hexanoic acid, (c) and (d) morpholine-octanoic acid binary mixtures
8001600240032004000
Ab
sorb
an
ce, a
.u
Wavenumber, cm-1
zA = 1.00
zA = 0.80
Fractionevaporated
0.03
0.53
0.58
0.60
zA = 0
8001600240032004000
Ab
sorb
an
ce, a
.u
Wavenumber, cm-1
zA = 1.00
zA = 0.20
Fraction evaporated
0.003
0.03
0.03
0.04
zA = 0
8001600240032004000
Ab
sorb
an
ce, a
.u
Wavenumber, cm-1
zA = 1.00
zA = 0.80
Fractionevaporated
0.03
0.44
0.51
0.55
zA = 0
8001600240032004000
Ab
sorb
an
ce, a
.u
Wavenumber, cm-1
zA = 1.00
zA = 0.20
Fraction evaporated
0.001
0.012
0.017
0.021
zA = 0
©© UUnniivveerrssiittyy ooff PPrreettoorriiaa

111
Appendix D: Calibration curves
D-1: Calibrations curves of pure hexylamine, pure morpholine, pure TEA, and pure formic
acid
(a)
(b)
(c)
(d)
Figure D-1: Calibration curves of (a) pure hexylamine, (b) pure morpholine, (c) pure TEA
and (d) formic acid
0
5
10
15
20
25
0 0.2 0.4 0.6 0.8 1 1.2 1.4
Inte
gra
ted
are
a (
-)
-dm/dt (mg/min)
HexylamineK = 17.4 ± 0.6
0
2
4
6
8
10
12
14
16
18
0 0.25 0.5 0.75 1 1.25
Inte
gra
ted
area
(-)
-dm/dt (mg/min)
MorpholineK = 14.9 ± 0.3
0
30
60
90
120
0 2 4 6
Inte
grat
ed a
rea
(-)
-dm/dt (mg/min)
TriethylamineK = 20 ± 0.2
0
5
10
15
20
25
30
35
0 0.5 1 1.5 2
Inte
gra
ted
are
a (
-)
-dm/dt (mg/min)
Formic acidK = 21.2 ± 0.6
©© UUnniivveerrssiittyy ooff PPrreettoorriiaa

112
D-2: Calibration curves of pure acetic acid and pure propanoic acid
(a)
(b)
Figure D-2: Calibration curves of (a) pure acetic acid and (b) pure propanoic acid
0
5
10
15
20
25
30
35
0 0.5 1 1.5 2
Inte
gra
ted
are
a (
-)
-dm/dt (mg/min)
Acetic acidK = 18.3 ± 0.4
0
2
4
6
8
10
12
0 0.2 0.4 0.6 0.8 1
Inte
gra
ted
area
(-)
-dm/dt (mg/min)
Propionic acidK = 16.1 ± 0.3
©© UUnniivveerrssiittyy ooff PPrreettoorriiaa

113
Appendix E: Shape functions
E-1: Shape of pure components in comparison with the FTIR spectra
(a)
(b)
(c)
(d)
Figure E-1: Absorbance integrals and FTIR spectra of pure components
0
0.2
0.4
0.6
0.8
1
16002000240028003200
Ab
sorb
an
ce in
terg
ral
(-)
Wavenumber, cm-1
Formic acid
0
0.2
0.4
0.6
0.8
1
16002000240028003200
Ab
sorb
an
ce in
terg
ral
(-)
Wavenumber (cm-1)
Propionic acid
0
0.2
0.4
0.6
0.8
1
16002000240028003200
Ab
sorb
an
ce in
tergral
(-)
Wavenumber (cm-1)
Hexylamine
0
0.2
0.4
0.6
0.8
1
16002000240028003200
Ab
sorb
an
ce in
terg
ral
(-)
Wavenumber (cm-1)
Mopholine
©© UUnniivveerrssiittyy ooff PPrreettoorriiaa

114
E-2: Shape of pure components in comparison with the mixtures
(a)
(b)
(c)
(d)
Figure E-2: Shape of pure components in comparison with the mixtures
0
0.2
0.4
0.6
0.8
1
16002000240028003200
Sh
ap
e fu
nct
ion
( -
)
Wavenumber (cm-1)
TEA
Mixture data with fit
Propionic acid
0
0.2
0.4
0.6
0.8
1
16002000240028003200
Sh
ap
e fu
nct
ion
s (-
)
Wavenumber (cm-1)
Morpholine
Mixture with data fit
Propionic acid
0
0.2
0.4
0.6
0.8
1
16002000240028003200
Sh
ap
e fu
nct
ion
s (-
)
Wavenumber (cm-1)
Acetic acid
Hexylamine
Mixture
Fit
0
0.2
0.4
0.6
0.8
1
16002000240028003200
Sh
ap
e fu
nct
ion
s (-
)
Wavenumber (cm-1)
Formic acid
TEA
Mixture
Fit
©© UUnniivveerrssiittyy ooff PPrreettoorriiaa

115
Appendix F: PiDAi profiles of pure amines, pure carboxylic acids and their
mixtures
F-1: PiDAi profiles of pure components
(a)
(b)
(c)
(d)
Figure F-1: PiDAi profiles of pure (a) hexylamine and pure morpholine, (b) pure formic,
acetic, and propanoic acids, (c) pure hexanoic acid and (d) pure octanoic acid
0
10
20
30
40
50
60
70
80
15 20 25 30 35 40 45 50 55 60
PCD
AC
(Pa.m
2s-1
)
Time (min)
Hexylamine
Morpholine
0
50
100
150
200
250
15 20 25 30 35 40 45 50 55 60
PCD
AC
(Pa.m
2s-1
)
Time (min)
Formic acid
Acetic acid
Propanoic acid
0
1
2
3
4
30 40 50 60 70 80 90
PCD
AC
(Pa
.m2s-1
)
Time (min)
Hexanoic acid
0.0
0.1
0.2
0.3
0.4
0.5
0.6
40 50 60 70 80 90
PCD
AC
(Pa
.m2s-1
)
Time (min)
Octanoic acid
©© UUnniivveerrssiittyy ooff PPrreettoorriiaa

116
F-2: PiDAi profiles of hexylamine-carboxylic acid binary mixtures
(a)
(b)
(c)
(d)
Figure F-2: PiDAi profiles of hexylamine-carboxylic acid binary mixtures
0.0
0.2
0.4
0.6
0.8
1.0
1.2
1.4
320 400 480 560 640 720 800
PCD
AC
(Pa
.m2s-1
)
Time (min)
Hexylamine-acetic acid
(50 mol % hexylamine)
0.0
0.2
0.4
0.6
0.8
1.0
300 400 500 600 700 800P
CD
AC
(Pa
.m2s-1
)Time (min)
Hexylamine-propanoic acid
(33 mol % hexylamine)
0.00
0.05
0.10
0.15
0.20
0 100 200 300 400 500 600 700 800
PCD
AC
(Pa
.m2s-1
)
Time (min)
Hexylamine-hexanoic acid
(33 mol % hexylamine)
0.00
0.01
0.02
0.03
0.04
0.05
200 300 400 500 600 700 800
PCD
AC
(Pa
.m2s-1
)
Time (min)
Hexylamine-octanoic acid
(25 mol% hexylamine)
©© UUnniivveerrssiittyy ooff PPrreettoorriiaa

117
F-3: PiDAi profiles of morpholine-carboxylic acid binary mixtures
(a)
(b)
(c)
(d)
Figure F-3: PiDAi profiles of morpholine-carboxylic acid binary mixtures
0.0
0.2
0.4
0.6
0.8
1.0
1.2
1.4
200 300 400 500 600 700 800
PCD
AC
(Pa
.m2s-1
)
Time (min)
Morpholine-acetic acid
(50 mol% morpholine)
0.0
0.5
1.0
1.5
2.0
0 100 200 300 400 500 600 700 800P
CD
AC
(Pa.m
2s-1
)Time (min)
Morpholine-propanoic acid
(33 mol% morpholine)
0.00
0.05
0.10
0.15
0.20
0 100 200 300 400 500 600 700 800
PCD
AC
(Pa.m
2s-1
)
Time (min)
Morpholine-hexanoic acid
(25 mol% morpholine)
0
0.01
0.02
0.03
0.04
0.05
400 500 600 700 800
PCD
AC
(Pa.m
2s-1
)
Time (min)
Morpholine-octanoic acid
(25 mol% morpholine)
©© UUnniivveerrssiittyy ooff PPrreettoorriiaa

118
F-4: PiDAi profiles of TEA-carboxylic acid binary mixtures
(a)
(b)
(c)
(d)
Figure F-4: PiDAi profiles of TEA-carboxylic acid binary mixtures
0.0
0.5
1.0
1.5
2.0
2.5
3.0
200 300 400 500 600 700 800
PCD
AC
(Pa.m
2s-1
)
Time (min)
TEA-acetic acid (24 mol% TEA)
TEA-formic acid (25 mol% TEA)
0.0
0.5
1.0
1.5
2.0
0 100 200 300 400 500 600 700 800
PCD
AC
(Pa
.m2s-1
)
Time (min)
TEA-propanoic acid
(25 mol% TEA)
0.0
0.2
0.4
0.6
0.8
1.0
300 400 500 600 700 800
PCD
AC
(Pa.m
2s-1
)
Time (min)
TEA-hexanoic acid
(25 mol% TEA)
0.00
0.05
0.10
0.15
0.20
300 400 500 600 700
PCD
AC
(Pa
.m2s-1
)
Time (min)
TEA-octanoic acid
(20 mol% TEA)
©© UUnniivveerrssiittyy ooff PPrreettoorriiaa