Embed Size (px)
Citation preview

7/28/2019 TGSF Advisors - Major Themes (April 2013) Copy
http://slidepdf.com/reader/full/tgsf-advisors-major-themes-april-2013-copy 1/95
TGSF Advisors 1

7/28/2019 TGSF Advisors - Major Themes (April 2013) Copy
http://slidepdf.com/reader/full/tgsf-advisors-major-themes-april-2013-copy 2/95
TGSF Advisors 2
Don’t be satisfied with stories, how things have gone with others. Unfold your own myth.
Rumi

7/28/2019 TGSF Advisors - Major Themes (April 2013) Copy
http://slidepdf.com/reader/full/tgsf-advisors-major-themes-april-2013-copy 3/95
TGSF Advisors
Contents
INTRODUCTION 4
Theme 1 WINTER OF OUR DISCONTENT 5
Theme 2 BUBBLE IN SAFETY 12
Theme 3 LORDS OF FINANCE 21
Theme 4 SUPER SAD TRUE LOVE STORY 26
Theme 5 MRS. WATANABE 32
Theme 6 RICHISTAN 45
Theme 7 DEVIL TAKE THE HINDMOST 51
Theme 8 SUPERMONEY 56
Theme 9 THE RICHEST MAN IN BABYLON 69
Theme 10 WHEN MONEY DIES 76
APPENDIX THE FUND 82
3

7/28/2019 TGSF Advisors - Major Themes (April 2013) Copy
http://slidepdf.com/reader/full/tgsf-advisors-major-themes-april-2013-copy 4/95
TGSF Advisors
Introduction
e investment environment is changing at a rate that's representative of global economic
imbalances, fund flows, and geopolitical risks. We believe this decade will witness greatly increased volatility and instability in the economy and financial system. Very few past modelsare still valid. Such a situation has contributed to the extreme uncertainty that currently prevails. Our guiding principle is to help investors understand and navigate through all
the complexities of an unstable, inflation-prone world.
At TGSF, we are constantly searching for a new paradigm and look to identify major themes.Erudition drives our process. Fundamental to our approach to investing is a coreunderstanding of history, politics, economics and psychology. We are always seeking moreknowledge. We believe an eclectic approach that is based on common sense, strong logic, andobjective data, balanced by right-brain intuition and lots of curiosity is what works best.
Our asset allocation framework divides the world into three buckets: the tactical outlook, thecyclical view and the strategic or thematic drivers. e tactical or short-term view has ahorizon of up to three months. e main inputs are technical and focus on such indicators assentiment, momentum and extremes in market positioning. e main thrust of the cyclicaloutlook is our 6 to 12 month view on the world. e following themes should be key driversof financial market performance over the next 1 to 5 years.
4

7/28/2019 TGSF Advisors - Major Themes (April 2013) Copy
http://slidepdf.com/reader/full/tgsf-advisors-major-themes-april-2013-copy 5/95
TGSF Advisors
THE LONG WAVE DECLINEWINTER OF OUR DISCONTENT
Theme 1
5

7/28/2019 TGSF Advisors - Major Themes (April 2013) Copy
http://slidepdf.com/reader/full/tgsf-advisors-major-themes-april-2013-copy 6/95
TGSF Advisors
e last long cycle (from 1980 to 2000-05) was shaped
by exceptional growth in supply on a global level.Strong growth in the working-age population acrossAsia and the opening-up of world trade led toconsiderable expansion in global productioncapacities. ese factors created a highly competitiveand disinflationary environment of plentiful supply,which was characterized by low interest rates, a creditboom and, in the financial markets, exuberant appetite
for risky assets.
As the demographic cycle progresses, we are seeingthe emergence of an aging population, which is lessfavorable to productive investment. Additionally, thedeveloped world is facing a serious debt overhang anda long period of slow nominal growth. Meanwhile the
rise in living standards among the emergingpopulation heralds an unprecedented level of growthin demand. Taken together, the world supply/demand balance is dramatically changing against a
backdrop of resource shortages which are likely tofavor shorter cycles, increased government
intervention in economic aff airs and inflation.
The shifting macro landscape
6
Source: SG

7/28/2019 TGSF Advisors - Major Themes (April 2013) Copy
http://slidepdf.com/reader/full/tgsf-advisors-major-themes-april-2013-copy 7/95
TGSF Advisors
The Kondratieff Cycle
7
e Kondratieff cycle is an inflationary/deflationary cycle. During spring, inflation is benign. In summer,
consumer price inflation increases in line with themonetary expansion which finances the summer war.Price inflation reaches its peak at the end of summer.During autumn the rate of increase in inflation falls.is is disinflation. Conversely, in autumn, asset prices(stocks, bonds and real estate) are inflated to extremelevels on the back of a massive expansion of credit. isspeculative excess reaches its peak at the end of autumn. In winter, prices for stocks, bonds, real estateand debt plummet. e fall in asset prices and the
massive contraction in credit lead to a frighteningdeflationary depression (see Fisher’s Debt Deflation).
According to Seymour Pierce, key characteristics of theWinter phase are as follows:
• e economy is finally overwhelmed by excessivedebt and speculation
• Prices, employment, output and investment all fallsharply as the economy goes into depression
• Poor management and bad financial decisionswhich remained undetected during the boom inasset prices are exposed
• Credit markets seize up and there are widespread
bank failures• Debt is reduced, usually through a mixture of
bankruptcies and deleveraging
We have had three major cycles in this process since1788 and are currently in the late stages of the fourth.e current long wave will likely play out just as it did inearlier cycles (1837, 1873 and 1929). Historically, it’snot been until excess debt, misallocated capital and
speculative bubbles have been suffi
ciently purgedfrom the system that a new long wave cycle begins.
e transition towards the new regime can be nothingbut chaotic. However, this time policy makers cancreate unlimited amounts of money in contrast toprevious long waves. is suggests debt reduction willbe targeted through extreme policy activism andinflation.
Source: Seymour Pierce

7/28/2019 TGSF Advisors - Major Themes (April 2013) Copy
http://slidepdf.com/reader/full/tgsf-advisors-major-themes-april-2013-copy 8/95
TGSF Advisors
Fisher’s Debt Deflation (2008 version)
8
Source: Nautilus Research

7/28/2019 TGSF Advisors - Major Themes (April 2013) Copy
http://slidepdf.com/reader/full/tgsf-advisors-major-themes-april-2013-copy 9/95
TGSF Advisors
The Great Levitation
e Fed and its peers have manufactured trillions of dollars to prop up economies and financial markets.
As shown in the charts above, unlike both the U.S. in the 1930s and Japan since 1990, the U.S. quickly entered a reflation and ended the “ugly deflationary deleveraging” phase of the process (which lasted fromSeptember 2008, when Lehman fell, to March 2009, when the Fed instituted its aggressive program of quantitative easing to monetize the debts). e key going forward will be for policy makers to maintainbalance so that the debt/income ratio keeps declining in an orderly way.
9
Source: Bridgewater Associates
7/28/2019 TGSF Advisors - Major Themes (April 2013) Copy
http://slidepdf.com/reader/full/tgsf-advisors-major-themes-april-2013-copy 10/95
TGSF Advisors
Unfinished business
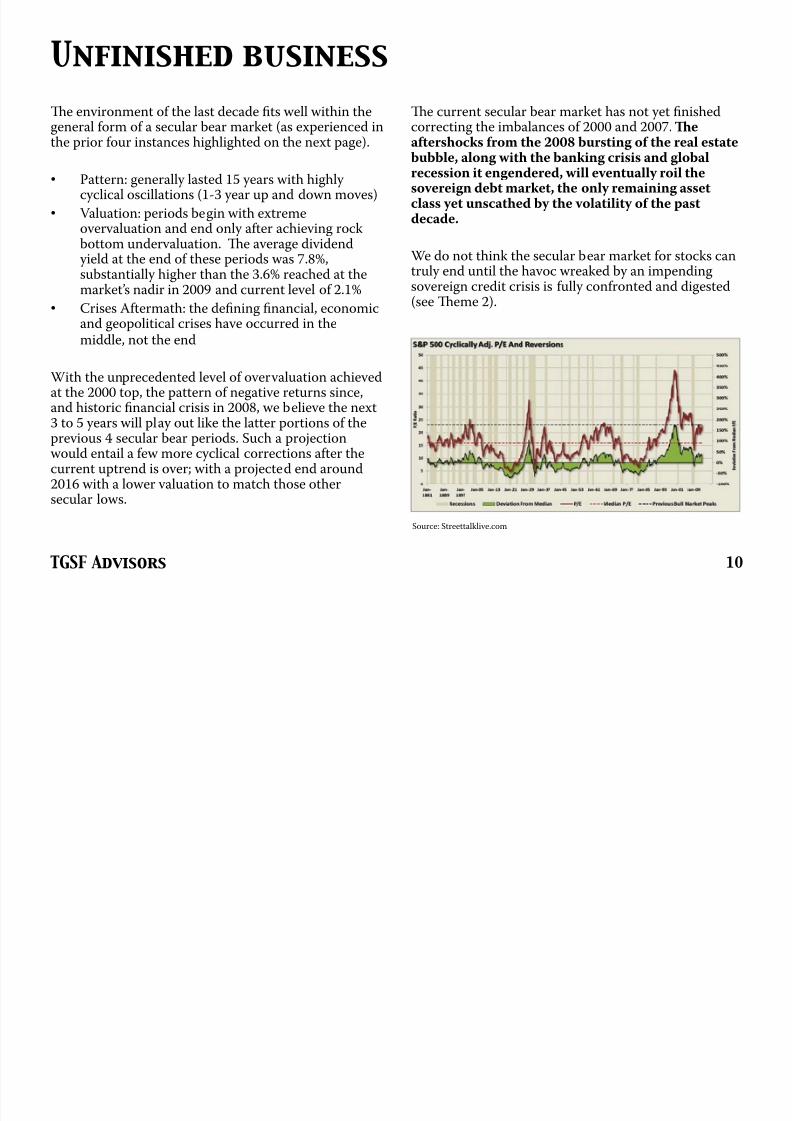
e environment of the last decade fits well within thegeneral form of a secular bear market (as experienced in
the prior four instances highlighted on the next page).
• Pattern: generally lasted 15 years with highly cyclical oscillations (1-3 year up and down moves)
• Valuation: periods begin with extremeovervaluation and end only after achieving rockbottom undervaluation. e average dividend yield at the end of these periods was 7.8%,
substantially higher than the 3.6% reached at themarket’s nadir in 2009 and current level of 2.1%
• Crises Aftermath: the defining financial, economicand geopolitical crises have occurred in themiddle, not the end
With the unprecedented level of overvaluation achievedat the 2000 top, the pattern of negative returns since,
and historic financial crisis in 2008, we believe the next3 to 5 years will play out like the latter portions of theprevious 4 secular bear periods. Such a projectionwould entail a few more cyclical corrections after thecurrent uptrend is over; with a projected end around2016 with a lower valuation to match those othersecular lows.
e current secular bear market has not yet finishedcorrecting the imbalances of 2000 and 2007. e
aftershocks from the 2008 bursting of the real estatebubble, along with the banking crisis and globalrecession it engendered, will eventually roil thesovereign debt market, the only remaining assetclass yet unscathed by the volatility of the pastdecade.
We do not think the secular bear market for stocks can
truly end until the havoc wreaked by an impendingsovereign credit crisis is fully confronted and digested(see eme 2).
10
Source: Streettalklive.com

7/28/2019 TGSF Advisors - Major Themes (April 2013) Copy
http://slidepdf.com/reader/full/tgsf-advisors-major-themes-april-2013-copy 11/95
TGSF Advisors
Current bear market in context
Today’s bear market has yet to match the extremes of previous secular trends.
11
Source: Cliff Gehrett

7/28/2019 TGSF Advisors - Major Themes (April 2013) Copy
http://slidepdf.com/reader/full/tgsf-advisors-major-themes-april-2013-copy 12/95
TGSF Advisors
US BOND MARKET TOPBUBBLE IN SAFETY
Theme 2
12

7/28/2019 TGSF Advisors - Major Themes (April 2013) Copy
http://slidepdf.com/reader/full/tgsf-advisors-major-themes-april-2013-copy 13/95
TGSF Advisors
e bond bull-market began in 1981. e decline in yields from the peak to the present is a stunning91%. For three decades, the trend in bond prices hasalmost been straight up, producing an entiregeneration of real money investors conditioned tobuy any dip (in search for yield) and remaininvested for the long term. ere has been an 8-foldrise in total bond fund assets over the past 22 years.
ere are no guarantees in life or investing, but weare pretty sure that buying an extended market afterthree decades of rise is not a good idea, regardlessof whether our monetary and economicexpectations turn out right. Spending more than
you make, let alone more than you will ever make,always leads to ruin. e only diff erence is that if
you operate in the key currency it takes longer forthe whistle to blow.
U.S. Treasury bonds have enjoyed their longestand biggest bull market on record and evidenceis rapidly mounting that the trend in interestrates is poised to reverse.
A generation of bond bulls
13

7/28/2019 TGSF Advisors - Major Themes (April 2013) Copy
http://slidepdf.com/reader/full/tgsf-advisors-major-themes-april-2013-copy 14/95
TGSF Advisors
e Debt Supercycle is a description of the long-termdecline in U.S. balance sheet liquidity and rise in
indebtedness during the post-WWII period. Money anddebt around the world exploded since the 1960s. Debtlevels – especially in the household sector – rose farbeyond what could reasonably have been predicted.According to BCA Research, below are just a few of thereasons why the debt ratio rose steadily:
• ere was huge pent-up demand for housing andconsumer durables after the war ended
• e decline in interest rates from the extremely high levels of the early 1980s meant that borrowerscould aff ord to carry more debt
• Financial deregulation beginning in the 1980s, andinnovations such as securitization, resulted in ageneral easing of credit conditions with banksbecoming much more willing to lend
• e Fed was tolerant of rapid credit growth andchose not to lean against the growing housing andcredit bubble
e above tailwinds behind credit growth have largely ended.e Debt Supercycle reached an importantinflection point during the 2008 crisis, with theauthorities reaching the limit of their ability to getconsumers to take on more leverage. e trend in theratio of consumer debt to income is likely to be flat oreven downward sloping in the years ahead, thussuggesting that deleveraging has a long way to go.
The Debt Supercycle
14

7/28/2019 TGSF Advisors - Major Themes (April 2013) Copy
http://slidepdf.com/reader/full/tgsf-advisors-major-themes-april-2013-copy 15/95
TGSF Advisors
With consumers no longer prepared to borrow andspend with wild abandon, the government was forced to
leverage itself up instead. In doing so, the credit risk hasshifted from the private to the public sector.e DebtSupercycle has moved into its final inning, withgovernment debt soaring dramatically in the pastfew years.
It took the U.S. almost 200 years to accumulate a publicdebt of $1 trillion (from 1789 to 1981) but subsequently, just 30 years for the debt to explode to more than $16trillion. Since 1981, the U.S. increased its sovereign debt
by 1,560% while its population increased by only 35%.
e highest U.S. debt to GDP was in World War II at127%. In the space of just five years, the US may possibly exceed that and accumulate more federal debtthan during the previous entire history of the nation. Inthe 1980s, it took $4 of new credit to generate $1 of realGDP. Over the last decade, it has taken $10, and since2006, $20 to produce the same result.
In our view, public debt will be pushed to the limit ina few more years.e massive government borrowingto fund the outsized deficits is only delaying the neededcorrections. In the short term, U.S. is able to monetizerapidly expanding debt. Ultimately, this can only lead toinflation, which is a slow-motion default, and politically,the easiest way out.
Pushing against the limit
15
Source: TTMYGH

7/28/2019 TGSF Advisors - Major Themes (April 2013) Copy
http://slidepdf.com/reader/full/tgsf-advisors-major-themes-april-2013-copy 16/95
TGSF Advisors
At this point, the immediate risk for the U.S. economy isnot a rise in interest rates; it is the emergence of a risk
premium on U.S. government debt. Such a riskpremium is now very likely to appear if the U.S.government does not legislate a massive decrease ingovernment spending.
As Grant Williams points out, if nothing is done anddebt ratios continue to rise, there may come a day whenthe buyers of this debt come to understand that therising debt-to-GDP levels have gotten to unacceptablelevels and decide that they own enough or more than
enough – particularly given the price risk at the end of a31-year secular bull market, with the lowest yields inthe history of capitalism. And it seems this rollover inthe U.S. Treasury market is already under way:foreign central bank purchases of U.S. Treasury bonds have been in decline since 2009.
During the Great Depression, interest rates on lower-grade bonds trended lower until 1930, and those on
high-grade bonds continued lower until 1931.
enthey soared, on fears of default. Looking at current fiscaltrends, we believe default fears will soon start to riseand investors will begin to demand higher rates tocompensate for the perceived increase in risk, whichwill foreshadow an actual increase in risk. Make nomistake – U.S. government bonds are no longer arisk-free asset.
The return of risk premium
16
Source: BCA Research

7/28/2019 TGSF Advisors - Major Themes (April 2013) Copy
http://slidepdf.com/reader/full/tgsf-advisors-major-themes-april-2013-copy 17/95
TGSF Advisors
America is running a chronic deficit and going deeperand deeper into debt. e U.S. government currently
has monthly revenues of $200 billion and expendituresof $300 billion. at leads to a deficit of $1.2 trillionevery year. Once fiscal policy is pushed to the limitsof sustainability, the Debt Supercycle could come toa violent end.
e record low levels of Treasury yields and the resilientdollar show that markets are currently unconcernedwith the U.S. fiscal trends. But, this will not always betrue. e long-run fiscal trend is grim, largely reflecting
demographic pressures on healthcare and, to a lesserextent, Social Security. In the next several years, webelieve the markets will likely force a majorretrenchment in U.S. fiscal policy.e current low interest rates in America are only creating a false senseof security. e initial rise in rates may be very muted,or may even be delayed, but will likely accelerate in timeand lead, towards the end of this decade, to muchhigher rates than now seem imaginable.
Since 1790, the average interest rate on U.S. long-termTreasuries has been 5%. If the interest to be paid on theU.S. government’s debt jumped to 7% in the comingdecade, not an unreasonable level given the nation’sshaky finances, at that rate, the amount of the budgetdedicated to debt service each year would soar from$454 billion today to $2 trillion – an amount equivalentto 80% of total tax revenues.
A false sense of security
17
7/28/2019 TGSF Advisors - Major Themes (April 2013) Copy
http://slidepdf.com/reader/full/tgsf-advisors-major-themes-april-2013-copy 18/95
TGSF Advisors
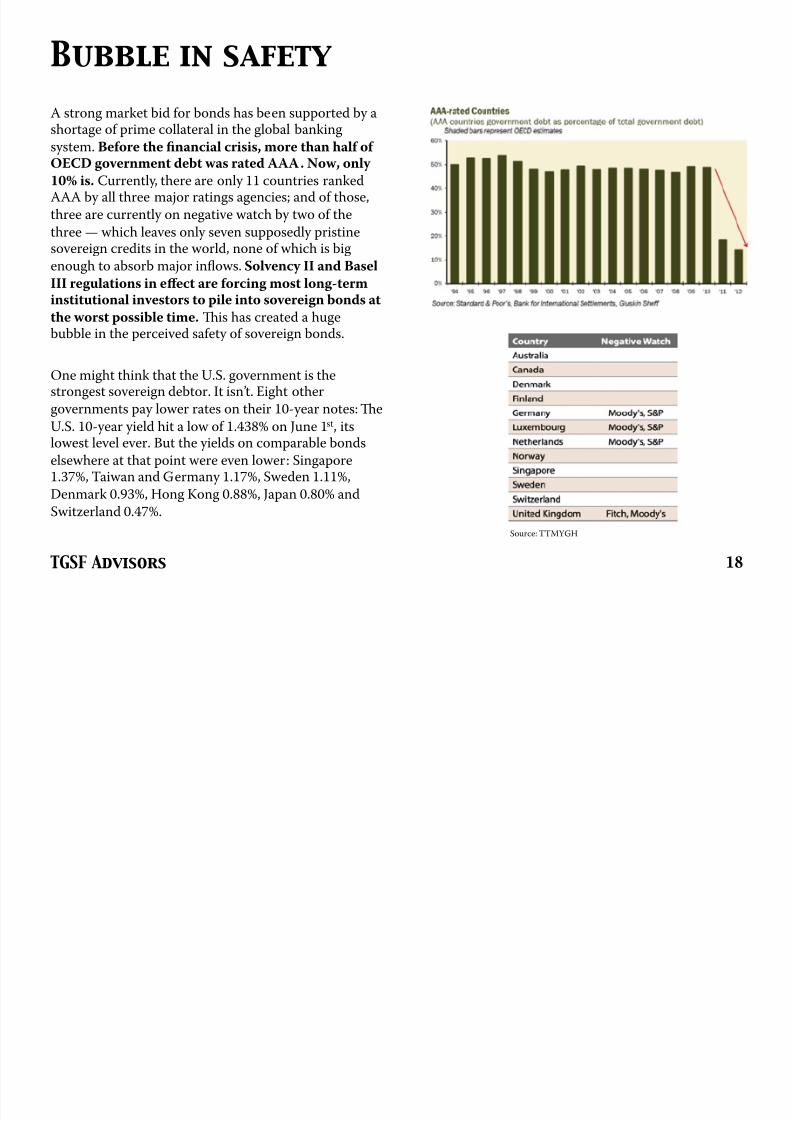
A strong market bid for bonds has been supported by ashortage of prime collateral in the global banking
system. Before the financial crisis, more than half of OECD government debt was rated AAA. Now, only
10% is. Currently, there are only 11 countries rankedAAA by all three major ratings agencies; and of those,
three are currently on negative watch by two of the
three — which leaves only seven supposedly pristinesovereign credits in the world, none of which is big
enough to absorb major inflows. Solvency II and Basel
III regulations in eff ect are forcing most long-terminstitutional investors to pile into sovereign bonds at
the worst possible time. is has created a hugebubble in the perceived safety of sovereign bonds.
One might think that the U.S. government is thestrongest sovereign debtor. It isn’t. Eight other
governments pay lower rates on their 10-year notes:
eU.S. 10-year yield hit a low of 1.438% on June 1st, itslowest level ever. But the yields on comparable bonds
elsewhere at that point were even lower: Singapore1.37%, Taiwan and Germany 1.17%, Sweden 1.11%,
Denmark 0.93%, Hong Kong 0.88%, Japan 0.80% and
Switzerland 0.47%.
Bubble in safety
18
Source: TTMYGH

7/28/2019 TGSF Advisors - Major Themes (April 2013) Copy
http://slidepdf.com/reader/full/tgsf-advisors-major-themes-april-2013-copy 19/95
TGSF Advisors
60-year cycle in interest rates
Interest rates are dominated by a 60-year Kondratie ff cycle. Looking back through history, there have been important bottoms for interest rates which can be seen near the decadal marks of 1770, 1830,
1890, and 1950. Each of these bottoms arrives approximately 60 years after the prior one. e next major bottom for interest rates is ideally due about now. With U.S. yields close to 220 year lows, we are approaching the natural end of a 31 year period of declining interest rates.
19

7/28/2019 TGSF Advisors - Major Themes (April 2013) Copy
http://slidepdf.com/reader/full/tgsf-advisors-major-themes-april-2013-copy 20/95
TGSF Advisors
When the levee breaks
Once the interest rate cycle turns, there will be a global rush for the exits. It may have already begun as the U.S. 10-year yield hit a low of 1.438% on June 1st , 2012 – its lowest level ever. We believe U.S.
Treasuries could easily repeat their 83% price decline of 1946-1981.
Consider what would happen to bond prices if interest rates moved suddenly and sharply higher. A 300
basis point increase in yields would, on average, result in a 22% loss in 10-year bond prices. In 30-year bonds, the same increase in yields would lead to a loss of 40%.
20
Source: Bloomberg

7/28/2019 TGSF Advisors - Major Themes (April 2013) Copy
http://slidepdf.com/reader/full/tgsf-advisors-major-themes-april-2013-copy 21/95
TGSF Advisors
THE COMING LOSS OF CENTRALBANK INDEPENDENCELORDS OF FINANCE
Theme 3
21

7/28/2019 TGSF Advisors - Major Themes (April 2013) Copy
http://slidepdf.com/reader/full/tgsf-advisors-major-themes-april-2013-copy 22/95
TGSF Advisors
For four years rich-world central bankers have donetheir best to rejuvenate economies withconventional and unconventional monetary policy without great success. Policy rates in the U.S., U.K.,Europe, and Japan are near zero while bond-buyingprograms are meant to drive down long-terminterest rates to spur spending and investment andto flood the financial system with money.
e central banks’ balance sheets are the new policy tool against a deflationary depression. As interestrates embarked on a multi-year decline from the
1980s on, central bank balance sheets are now set to embark on a multi-year climb.
Over the past year, central banks in the advanced
economies have continued or even expanded theirpurchases of government bonds and their supportof liquidity in the banking system. At $18 trillionand counting, the aggregate assets of all central
banks now stand at roughly 30% of global GDP,double the ratio of a decade ago.
A few good men
22
Source: Bloomberg
Source: Bloomberg

7/28/2019 TGSF Advisors - Major Themes (April 2013) Copy
http://slidepdf.com/reader/full/tgsf-advisors-major-themes-april-2013-copy 23/95
TGSF Advisors
e era when monetary policy was simply aboutcontrolling inflation is over. Globally, central banksare now edging down monetary policy paths thatcan be viewed as increasingly backstopping budgetdeficits as lawmakers of respective governmentscontinue to fail to make progress toward fiscalconsolidation. A progression down this roadcould lead to a series of unintended
consequences.
We believe this process is well underway and willaccelerate as social unrest, the worst demographicsin 500 years, and massive unfunded liabilities pushgovernments to instruct central banks to directly fund deficits. e first country to openly acknowledge this step is the Bank of Japan, which is
under enormous pressure to reflate aggressively.Governments are elected, central bankers are not.In the end when the pressure takes hold, centralbankers have to do what they are told, in this case –ultra and unlimited monetary ease. It they don’tcomply, they will be replaced.
e primary issuance of government debt willremain elevated for the foreseeable future and thatthe burden of absorption of government debt by thedomestic financial sector – including the centralbank – will remain onerous. In turn, thisdevelopment bears a direct threat to theindependence of these central banks. To the extentthat the central bank is driven to accumulategovernment securities at artificially inflated prices
(and repressed yields), either such purchases mustbe i) held to maturity (implies that the central bankwill not have the freedom to contract its balancesheet in a timely manner in order to tightenquantitative monetary policy) or ii) the governmentmust be prepared to underwrite the capital lossesrealized from the sales of such securities in anormalized yield environment.
A central bank that is beholden to government inthis way has lost its independence. Its objectivehas been subtly realigned to the preservation of thecreditworthiness of the sovereign.
A brave new world of central banking
23

7/28/2019 TGSF Advisors - Major Themes (April 2013) Copy
http://slidepdf.com/reader/full/tgsf-advisors-major-themes-april-2013-copy 24/95
TGSF Advisors
As central bank balance sheets are essentially co-opted in the financing of perpetual fiscal deficits,
central banks lose their ability to fulfill aninflation mandate. Fiscally-profligate, advancedeconomies, including U.S., Japan, U.K., France, Italy and Spain, are playing with inflationary fire as they consider alternatives to a disciplined programme of deficit reduction.
According to Dylan Grice, if we look back throughtime at inflationary crises – from ancient Rome, toMing China, to revolutionary France and Americaor to Weimar Germany – uncontrolled inflationsare primarily caused by overleveraged governmentswhich resorted to money printing as the easiest way to avoid explicit default. We believe inflation willultimately prove to be the path of least politicalresistance. It is merely a question of time before the
global inflationary movement gets underway.
Today our central bankers are as confident intheir ability to control inflation as they were inthe soundness of the financial system in 2006.Hubris has played the lead role in all great financialtragedies. e stage is set for the return of inflation.
Inflation: the next financial tragedy
Budget deficits before five hyperinflations
24
Source: SG, Bernholz
Source: US Treasury
7/28/2019 TGSF Advisors - Major Themes (April 2013) Copy
http://slidepdf.com/reader/full/tgsf-advisors-major-themes-april-2013-copy 25/95
TGSF Advisors
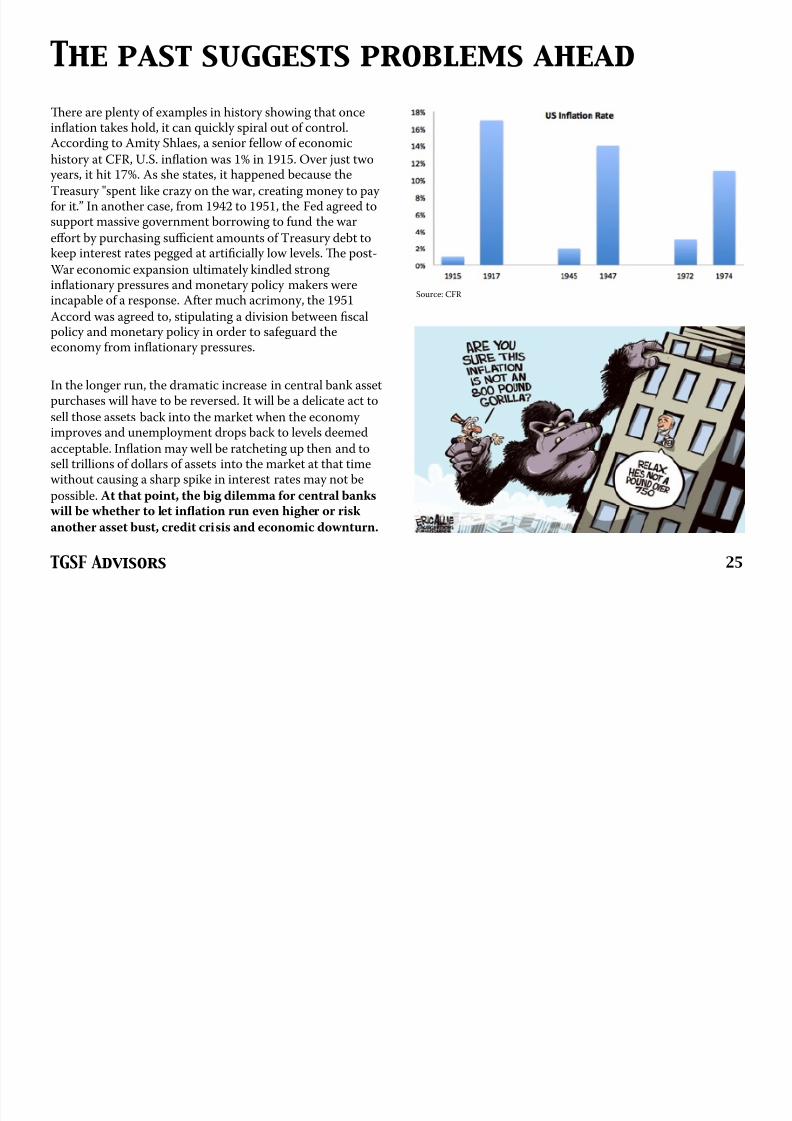
ere are plenty of examples in history showing that onceinflation takes hold, it can quickly spiral out of control.
According to Amity Shlaes, a senior fellow of economichistory at CFR, U.S. inflation was 1% in 1915. Over just two
years, it hit 17%. As she states, it happened because the
Treasury "spent like crazy on the war, creating money to pay for it.” In another case, from 1942 to 1951, the Fed agreed tosupport massive government borrowing to fund the war
eff ort by purchasing sufficient amounts of Treasury debt tokeep interest rates pegged at artificially low levels. e post-
War economic expansion ultimately kindled stronginflationary pressures and monetary policy makers wereincapable of a response. After much acrimony, the 1951
Accord was agreed to, stipulating a division between fiscalpolicy and monetary policy in order to safeguard theeconomy from inflationary pressures.
In the longer run, the dramatic increase in central bank assetpurchases will have to be reversed. It will be a delicate act to
sell those assets back into the market when the economy improves and unemployment drops back to levels deemed
acceptable. Inflation may well be ratcheting up then and tosell trillions of dollars of assets into the market at that timewithout causing a sharp spike in interest rates may not be
possible. At that point, the big dilemma for central banks will be whether to let inflation run even higher or risk
another asset bust, credit crisis and economic downturn.
The past suggests problems ahead
25
Source: CFR

7/28/2019 TGSF Advisors - Major Themes (April 2013) Copy
http://slidepdf.com/reader/full/tgsf-advisors-major-themes-april-2013-copy 26/95
TGSF Advisors
EUROPE (BREAK-UP)SUPER SAD TRUE LOVE STORY
Theme 4
26

7/28/2019 TGSF Advisors - Major Themes (April 2013) Copy
http://slidepdf.com/reader/full/tgsf-advisors-major-themes-april-2013-copy 27/95
TGSF Advisors
e European Union was created for politicalreasons. Economic considerations were a means toan end, and that end was to stop the wars that hadtorn Europe apart in the first half of the 20th century. e key was linking Germany and Francein an unbreakable alliance based on the promise of economic prosperity. Anyone who doesn'tunderstand the political origins of the EuropeanUnion and focuses only on its economic intent fails
to understand how it works and can be taken by surprise by the actions of its politicians.
Germany was the main champion of the euro, a
single currency controlled by a single bank overwhich Germany had influence in proportion to itsimportance.e single currency, with its focus on
avoiding inflation, protected German creditorsagainst European countries inflating their way outof debt. e debt was denominated in euros, theEuropean Central Bank controlled the value of theeuro, and European countries inside and outside theEurozone were trapped in this monetary policy.
So long as there was prosperity, the underlyingproblems of the system were hidden. But the 2008crisis revealed the problems. First, most Europeancountries had significant negative balances of tradewith Germany. Second, European monetary policy focused on protecting the interests of Germany and,to a lesser extent, France. e regulatory regimecreated systemic rigidity, which protected existinglarge corporations. e unequal distribution of the
cost, both nationally and socially, is the threatfacing the European Union.
Stratfor believes what started out four years ago as a
sovereign debt crisis, morphed into a currency crisis and led to the fall of several Europeangovernments, has now triggered a full blown crisis
of public confidence: in the economy, in the future,in the benefits of European economic integration, inthe euro and in the free market system.e publicis very worried about joblessness, inflation and
public debt, and those fears are fueling much of the uncertainty and negativity.
Eurozone’s loveless marriage
27

7/28/2019 TGSF Advisors - Major Themes (April 2013) Copy
http://slidepdf.com/reader/full/tgsf-advisors-major-themes-april-2013-copy 28/95
TGSF Advisors
Dramatically higher unemployment has been one of themain social consequences of the European crisis.
Average unemployment in the European Union hasreached 10.7 percent of the labor force, a significant
increase from the 7.2 percent unemployment recordedin the third quarter of 2007, before the crisis began. All
told, more than 26 million people are out of work in the
European Union.
Overall joblessness is spread unevenly across theContinent.e countries in the Eurozone’s periphery have the highest unemployment rates in Europe, with
Spain, Greece and Portugal at the top of the list. By
contrast, central and northern European countries(Germany, Austria and the Netherlands) have the
lowest unemployment rates. is unequal distributionof unemployment aff ects the way the diff erent countries
view the crisis and the strategies each government
wants to use to overcome it.
Instead of leading to convergence in Eurozone
economies, the union has led to massive divergences,with the strong getting stronger and the weak getting
weaker.
The young and the restless
28
Source: Bloomberg

7/28/2019 TGSF Advisors - Major Themes (April 2013) Copy
http://slidepdf.com/reader/full/tgsf-advisors-major-themes-april-2013-copy 29/95
TGSF Advisors
Gloom and doom surround the future of Europe.Troubled countries are facing an increasingly clearchoice: i) they can stay in the Eurozone, and face
years of endless recession, ii) they can abandon theeuro, perhaps bringing immediate catastrophe butgiving them the freedom to devalue their new currencies, or iii) they can accept the German off erto surrender sovereignty and accept Germanleadership and domination of a unified Europe in
return for a financial rescue.
We believe bailouts that do not allow recipientcountries to grow are doomed to failure and merely buy time. Ultimately, there will be no choice butto allow countries to default. is will necessitatea recapitalization of the European banking system.
If Europe is in crisis, the world's largest economy is in crisis, political as well as financial. And thatmatters to the world perhaps more than anything
else. Soon, a new wave of defaults is set to begin.
The inevitability of default
29

7/28/2019 TGSF Advisors - Major Themes (April 2013) Copy
http://slidepdf.com/reader/full/tgsf-advisors-major-themes-april-2013-copy 30/95
TGSF Advisors
Debt traps have caused sovereign defaults to soar fourtimes since 1800. e first three episodes began in the
secondary depressions after wars – 1837, 1873, and1933. e fourth was in the early 1980s. During the
Great Depression, roughly 50% of the world's countrieseither defaulted on or restructured their sovereign debt.
As part of the solution, every major currency left the
gold standard.
Greece has defaulted or rescheduled its debt five times
since gaining independence in 1829. In fact, since itsindependence, Greece has spent 50% of those years in
default or rescheduling. Greece left the gold standard
on April 26, 1932 and declared a moratorium on allinterest payments – the only European country to do so
at the time. Greece adopted protectionist policies suchas import quotas, and coupled with a weak drachma,
stifled imports, allowing Greek industry to expand
during the Great Depression. By 1939, Greek industrialoutput was 179% that of 1928. Problem solved.
We expect a similar outcome ahead for troubled
European nations as they decide to leave the single
currency union.
Historical perspective on debt traps
30

7/28/2019 TGSF Advisors - Major Themes (April 2013) Copy
http://slidepdf.com/reader/full/tgsf-advisors-major-themes-april-2013-copy 31/95
TGSF Advisors
In our view, the next big movement in Europe is forconvergence and not more divergence. If the eurobreaks up, the Bundesbank will be left carrying thecan for its credit position in Target 2 and theGerman banking system for possibly as much as€1trn. In other words, Germany, and its bondmarket, will be bust. e other scenario is thatGermany or the ECB promises to underwrite a hugeprogram of bank guarantees, in which case,
southern European long rates will collapse, whilebund yields rise. In other words, once an EMUbreak-up is on the cards, we are going to get moreconvergence in European yields one way or theother. e only question is whether that happenswithin a single currency and a resulting rise inGerman bond yields, or with diff erent currenciesand a resulting collapse of Southern European bond
yields.
We favor selling bunds before Germany loses itstriple-A rating and before the ECB attempts tooverride the Bundesbank.
Breaking up with bunds
31
German 10yr Yields1989 – 2013
Source: Bloomberg

7/28/2019 TGSF Advisors - Major Themes (April 2013) Copy
http://slidepdf.com/reader/full/tgsf-advisors-major-themes-april-2013-copy 32/95
TGSF Advisors
JAPANMRS. WATANABE
Theme 5
32

7/28/2019 TGSF Advisors - Major Themes (April 2013) Copy
http://slidepdf.com/reader/full/tgsf-advisors-major-themes-april-2013-copy 33/95
TGSF Advisors
Japan has been stuck in what can only be called an “ugly deflationary deleveraging” for over 20 years. In 1989,
the private sector debt bubble burst and thegovernment sector debt and fiscal expansion began.However, there was never adequate “money printing/monetization” to cause nominal growth to be abovenominal interest rates and to have the currency devalue.While Japan has eased somewhat, nominal incomegrowth has been stagnant, with persistent deflationeroding moderate gains in real growth.
Money creation has been limited at 0.7% of GDP per year, and the yen has appreciated 2.9% per year againstthe dollar. As a result, since 1990 real growth hasaveraged 1.1% with persistent deflation (averaging-0.5%).is has left nominal growth 2% below nominalinterest rates which cumulatively has led to a largeincrease in the debt/income ratio from about 400% of GDP at the end of 1989 to 500% today.
e BoJ has “printed/monetized” very little in duration-adjusted terms throughout the deleveraging process,with most of the printing that it has done going to shortterm cash-like assets of little duration. As result, it hasfailed to reflate sufficiently and the government isbuilding a terrible debt burden. Although, it seems thatpolicymakers are finally grasping the situation.
The most ugly case of deleveraging
33
Source: Bridgewater Associates

7/28/2019 TGSF Advisors - Major Themes (April 2013) Copy
http://slidepdf.com/reader/full/tgsf-advisors-major-themes-april-2013-copy 34/95
TGSF Advisors
e BoJ Act was revised in April 1998 to ensure thatJapan's central bank would maintain its independence
from the government. However, given that the Japaneseeconomy has contracted for the 4th year out of the lastfive, legislators are increasingly tempted to lean onmonetary officials to provide further accommodation.
• On October 30, 2012 the BoJ and Ministry of Finance issued a joint statement entitled“Measures Aimed at Overcoming Deflation”,setting the stage for “powerful easing”, including anexplicit attempt to weaken the yen
• On December 16, 2012 Shinzo Abe was electedPrime Minister with a mandate to end deflation
• On January 22, 2013 the BoJ agreed to a 2 percentinflation target and to make open-ended assetpurchases from 2014
• On February 3, 2013 Finance Minister Taro Asosaid the government is imitating his Depression-era predecessor, Korekiyo Takahashi, who toldthe BoJ to underwrite government debt to fund
deficit spending
In addition to the actions of the government, there isongoing discussion amongst politicians of the need torewrite the legislation that governs the BoJ to include amechanism for the Diet to haul the BoJ Governor infront of a committee once per year to explain hissuccess or lack thereof with regard to hitting theinflation target, and fire him if he fails.
This time is different (promise)
34

7/28/2019 TGSF Advisors - Major Themes (April 2013) Copy
http://slidepdf.com/reader/full/tgsf-advisors-major-themes-april-2013-copy 35/95
TGSF Advisors
ere are only two simple rules to remember wheninvesting in Japan. e first is to never underestimate
the amount of pain that the Japanese population canendure.e second is to never underestimate theJapanese policymakers’ ability to test the first rule. Justconsider the following:
• e country is in such disarray that the currentFinance Minister is the 10th Japan has seen since2006
• e government has run budget deficits for 19consecutive years and new bond issuances have
have outstripped tax revenues 4 years in a row • e aging population has strangled tax revenues
and is inflating expenditure on a growing basis• Despite repeated interventions by the BoJ a strong
currency persists and the the entire currentaccount threatens to turn negative next year
• Energy costs have soared with abrupt closures of nearly all nuclear power plants, increasing relianceon high-cost LNG imports
• Flow of new domestic bond buyers is drying up sofast that the BoJ is now buying a majority of new issuance
• Diplomatic relations with Japan’s three largestneighbors: China, South Korea and Taiwan havebeen thrown into chaos over disputed territories
• e stock market is still down 70% after 23 years
To-do list: a laundry list of problems
35
Nikkei 225 Index
Source: Trading Economics

7/28/2019 TGSF Advisors - Major Themes (April 2013) Copy
http://slidepdf.com/reader/full/tgsf-advisors-major-themes-april-2013-copy 36/95
TGSF Advisors 36
The big turnaround in trade
Since 1980, Japan consistently held a positive balance of trade – until 2011, when Japan had a trade deficit for the first time in over 30 years. e trend worsened in 2012 and January 2013 saw the trade
deficit widen to a new record. e trade balance is facing a structural decline.
Source: Trading Economics

7/28/2019 TGSF Advisors - Major Themes (April 2013) Copy
http://slidepdf.com/reader/full/tgsf-advisors-major-themes-april-2013-copy 37/95
TGSF Advisors
Post-2008 crisis, the Japanese government’s dependency on bond issuance to fund expenditures and generate
revenue has become staggering. Bond issuance is now responsible for the largest chunk of government
revenues at 48 percent. Poor demographics exacerbatethe weak economy being held together by a mountain of
debt. Substantial financing needs that cannot be
covered entirely by national savings lead to everincreasing reliance on the bond market for expenditures
and increasing import costs. e current low bond
yields are no panacea, it only buys time for a structuraladjustment to take place.
Based on analysis conducted by SG, with bond yields ataround 0.8%, ‘trend’ nominal GDP slightly negative, and
on-balance sheet debt to GDP at around 200%, Japanshould be aiming for a primary surplus of 3.3% in order
to stabilize its debt ratio. Should anything push bond
yields higher, even by just a percentage point, the on-balance sheet debt situation will become explosive. e
8% contraction required to rein in Japan’s current debtratio is politically impossible. And note, the estimated
8% required contraction assumes the Japanese
government can continue to fund itself at a near 1% JGB yield, which is clearly unrealistic.
The vicious debt cycle
37
Debt service is already 35% of government revenues atexisting yields. It would only take a 2.5% rise in
interest rates, to an average of just over 3.5% for debtservice costs, to consume 100 percent of government
tax revenue.is is known as the “Keynesian end-point”, when interest on debt alone would exceed
revenue.

7/28/2019 TGSF Advisors - Major Themes (April 2013) Copy
http://slidepdf.com/reader/full/tgsf-advisors-major-themes-april-2013-copy 38/95
TGSF Advisors 38
Crossing the Rubicon
For the past few years, Japan has been issuing more debt than it collects in general revenues. is policy path is not sustainable over the long-run.
Source: GaveKal Research
7/28/2019 TGSF Advisors - Major Themes (April 2013) Copy
http://slidepdf.com/reader/full/tgsf-advisors-major-themes-april-2013-copy 39/95
TGSF Advisors
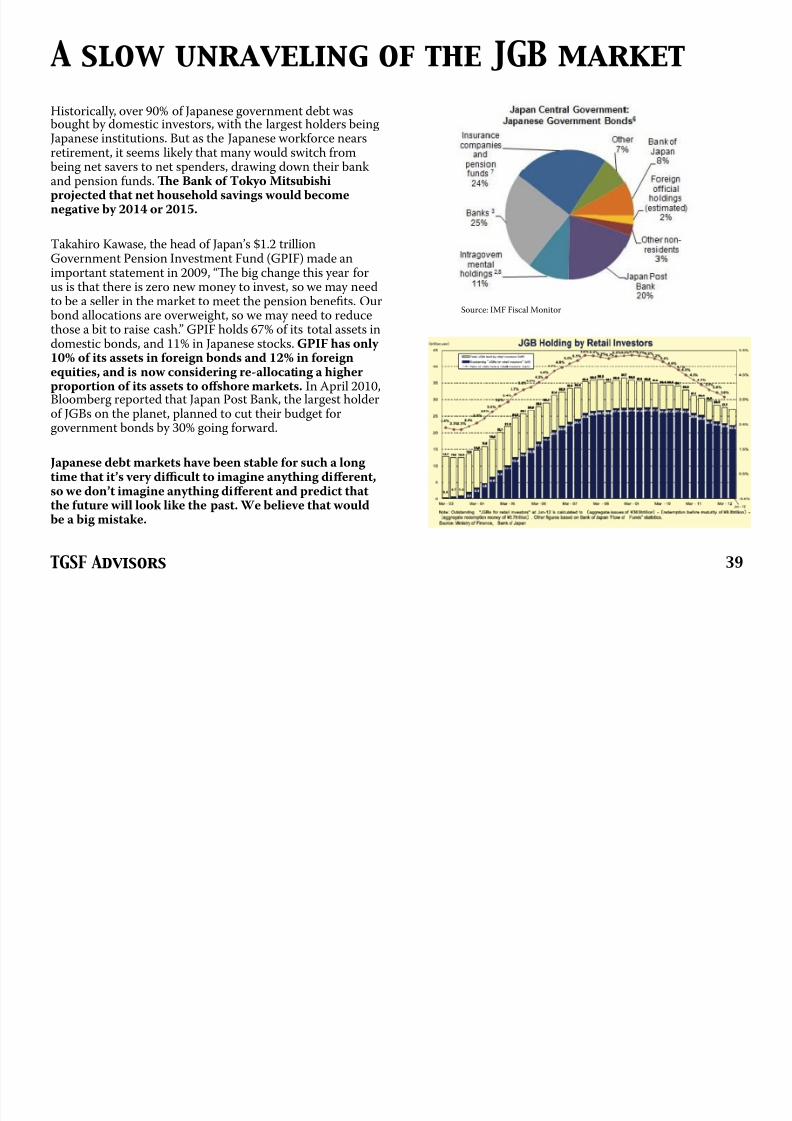
Historically, over 90% of Japanese government debt wasbought by domestic investors, with the largest holders being
Japanese institutions. But as the Japanese workforce nearsretirement, it seems likely that many would switch frombeing net savers to net spenders, drawing down their bankand pension funds.e Bank of Tokyo Mitsubishiprojected that net household savings would becomenegative by 2014 or 2015.
Takahiro Kawase, the head of Japan’s $1.2 trillionGovernment Pension Investment Fund (GPIF) made animportant statement in 2009, “e big change this year forus is that there is zero new money to invest, so we may needto be a seller in the market to meet the pension benefits. Ourbond allocations are overweight, so we may need to reducethose a bit to raise cash.” GPIF holds 67% of its total assets indomestic bonds, and 11% in Japanese stocks. GPIF has only 10% of its assets in foreign bonds and 12% in foreignequities, and is now considering re-allocating a higherproportion of its assets to off shore markets. In April 2010,Bloomberg reported that Japan Post Bank, the largest holder
of JGBs on the planet, planned to cut their budget forgovernment bonds by 30% going forward.
Japanese debt markets have been stable for such a long time that it’s very difficult to imagine anything diff erent,so we don’t imagine anything diff erent and predict thatthe future will look like the past. We believe that wouldbe a big mistake.
A slow unraveling of the JGB market
39
Source: IMF Fiscal Monitor

7/28/2019 TGSF Advisors - Major Themes (April 2013) Copy
http://slidepdf.com/reader/full/tgsf-advisors-major-themes-april-2013-copy 40/95
TGSF Advisors 40
The widow-maker
In our view, the key to understanding what will cause a shift to higher JGB yields is in the 3 images shown below: a) Excess deposits enter a drawdown period => b) Lower deposits cause banks to reduce
JGB portfolios => c) JGB portfolio liquidation leads to higher yields, similar to what occurred in 1999,when JGB yields jumped from under 1% to over 2%. According to the IMF, the e ff ect from a 1% decline in deposits results in a decline of 0.5% to 0.86% in banks’ holdings of JGBs. is e ff ect is found to have
increased in recent years.
Source: GS, IMF, Yaser Anwar
7/28/2019 TGSF Advisors - Major Themes (April 2013) Copy
http://slidepdf.com/reader/full/tgsf-advisors-major-themes-april-2013-copy 41/95
TGSF Advisors
Reinhart and Rogoff say that one of the telltale early signs that governments are struggling to maintain
market confidence and risk inflation is when debtmaturities decline. is is what is happening in Japantoday. e average duration of Japanese governmentdebt is now under 6 years. e vehicle of choice for theJapanese government has been shorter-term bills, notJGBs. Once the BoJ is forced into monetization of government deficits, even if only with the initialintention of stabilizing government finances in theshort-term, it will prove difficult to stop. When it
becomes the largest holder and most regular buyerof JGBs, Japan will be on its inflationary trajectory.
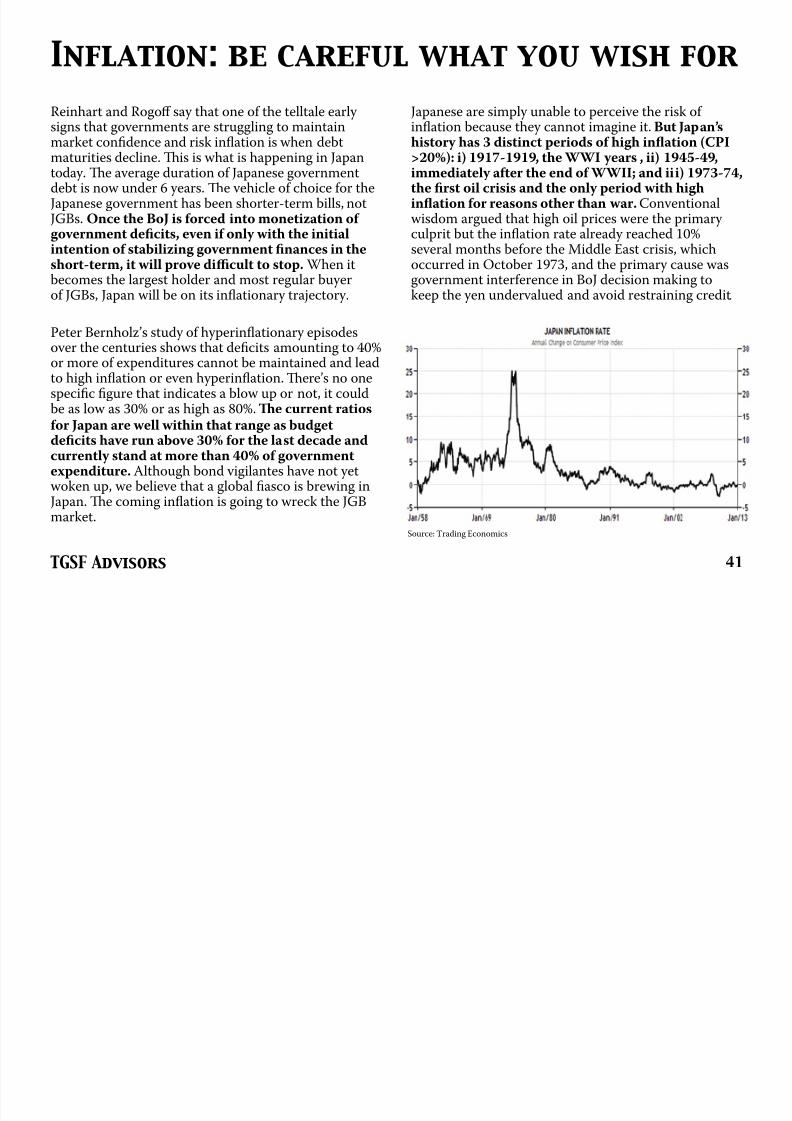
Peter Bernholz’s study of hyperinflationary episodesover the centuries shows that deficits amounting to 40%or more of expenditures cannot be maintained and leadto high inflation or even hyperinflation. ere’s no onespecific figure that indicates a blow up or not, it couldbe as low as 30% or as high as 80%. e current ratios
for Japan are well within that range as budgetdeficits have run above 30% for the last decade andcurrently stand at more than 40% of governmentexpenditure. Although bond vigilantes have not yetwoken up, we believe that a global fiasco is brewing inJapan.e coming inflation is going to wreck the JGBmarket.
Inflation: be careful what you wish for
41
Japanese are simply unable to perceive the risk of inflation because they cannot imagine it. But Japan’s
history has 3 distinct periods of high inflation (CPI>20%): i) 1917-1919, the WWI years , ii) 1945-49,immediately after the end of WWII; and iii) 1973-74,the first oil crisis and the only period with highinflation for reasons other than war. Conventionalwisdom argued that high oil prices were the primary culprit but the inflation rate already reached 10%several months before the Middle East crisis, whichoccurred in October 1973, and the primary cause was
government interference in BoJ decision making tokeep the yen undervalued and avoid restraining credit.
Source: Trading Economics

7/28/2019 TGSF Advisors - Major Themes (April 2013) Copy
http://slidepdf.com/reader/full/tgsf-advisors-major-themes-april-2013-copy 42/95
TGSF Advisors 42
The yen will lose strength this decade
From a low in 1985 to the high in 1988, the Yen rose by 118%. Subsequently it corrected until 1990 by 25%. From the low in 1990, the Yen rose to a high in 1995 by 98%. ereafter, it sold o ff again by 45%
to a low in 1998. Following a trading range of between 145 and 100, the Yen rose yet again between 2007 and November 2011 by 67%. e bear-market in Yen has started now and could last for some time. Japan's currency is 80% stronger now than in 1971 while the U.S. and South Korea are about 40%
weaker. ere is plenty of room for the currency to devalue further. A self-fulfilling feed-back loop of Yen depreciation could be exacerbated as Japanese overseas subsidiaries delay their repatriation of foreign income and dividends if they anticipate further Yen weakness, which would cause further
deterioration in Japan’s current account.

7/28/2019 TGSF Advisors - Major Themes (April 2013) Copy
http://slidepdf.com/reader/full/tgsf-advisors-major-themes-april-2013-copy 43/95
TGSF Advisors
The sun will shine on Japanese stocks
43
e TOPIX 30 consists of the largest JPY companies whose sales primarily come from outside Japan,and indirectly are short significant USDJPY. So in a scenario where the BoJ is compelled to create
inflation, equities would benefit, as per the case during periods of hyperinflation. Japan’s financial system largely depends on JGB stability while Japanese equities are under-owned.
Source: SG, BoJ

7/28/2019 TGSF Advisors - Major Themes (April 2013) Copy
http://slidepdf.com/reader/full/tgsf-advisors-major-themes-april-2013-copy 44/95
TGSF Advisors
Japan is going through a monumental change. eattitude of policymakers is changing and we expect to
see that reflected in aggressive monetary actions andsupportive fiscal measures which will result in a sharply
weaker currency. e combination should also logically lead to a re-pricing of a number of assets around the
world.is is far from just a JGB market problem,
which is a key source of liquidity for global pensionfunds, insurance companies, SWFs and reserve
managers. Japan is the fourth largest exporter in the
world and second largest consumer of U.S. Treasuries.
Dylan Grice warns: as the Japanese situation gets out of control and/or Japan’s retirees age and run down theirwealth, Japan’s policymakers will be forced to sell assets,
including U.S. Treasuries currently worth $750 billion.At nearly 10% of the outstanding U.S. Treasury
stock, this might well precipitate other government
funding crises (bearing in mind that the Japanesemodel is the argument buttressing confidence in
Western government bonds in the face of deterioratingfiscal conditions). At the very least we expect it to
trigger an international bond market rout scary enough
to spook all other asset classes.
Mrs. Watanabe corners the globe
44
7/28/2019 TGSF Advisors - Major Themes (April 2013) Copy
http://slidepdf.com/reader/full/tgsf-advisors-major-themes-april-2013-copy 45/95
TGSF Advisors
THE RISE OF THE ASIANCONSUMERRICHISTAN
Theme 6
45
7/28/2019 TGSF Advisors - Major Themes (April 2013) Copy
http://slidepdf.com/reader/full/tgsf-advisors-major-themes-april-2013-copy 46/95
TGSF Advisors
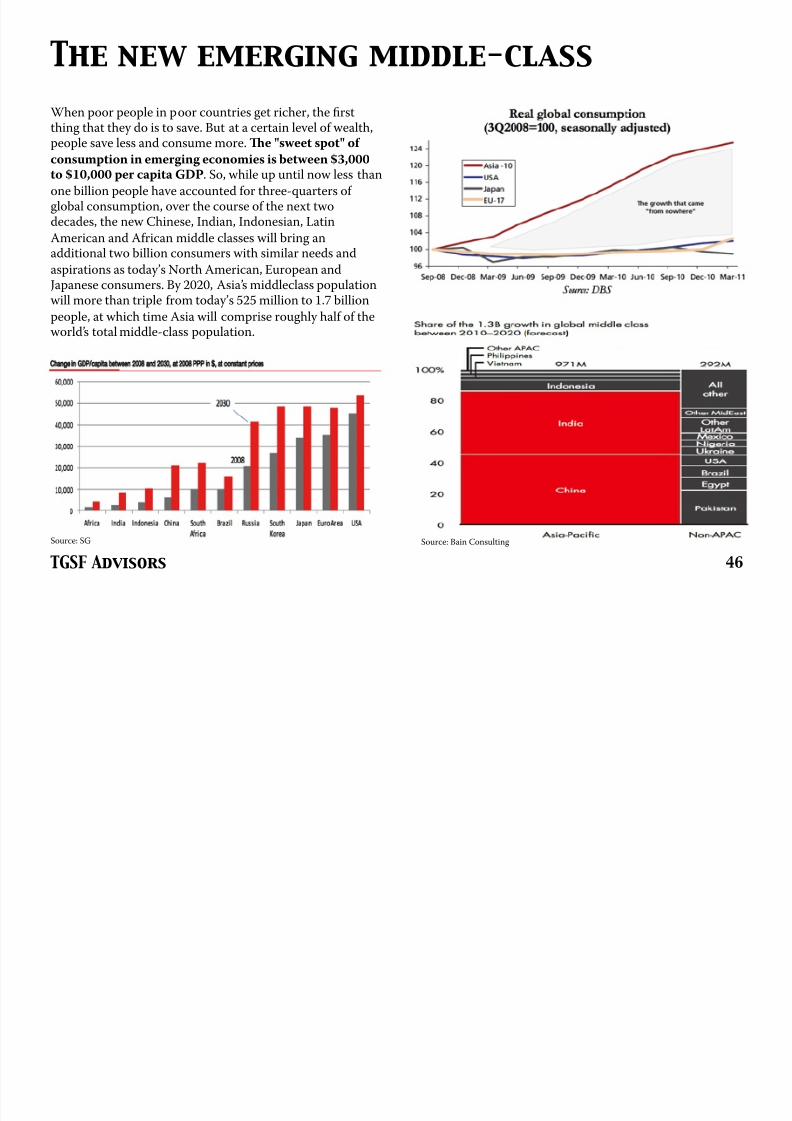
When poor people in poor countries get richer, the firstthing that they do is to save. But at a certain level of wealth,
people save less and consume more. e "sweet spot" of consumption in emerging economies is between $3,000to $10,000 per capita GDP. So, while up until now less than
one billion people have accounted for three-quarters of global consumption, over the course of the next twodecades, the new Chinese, Indian, Indonesian, Latin
American and African middle classes will bring anadditional two billion consumers with similar needs and
aspirations as today’s North American, European and
Japanese consumers. By 2020, Asia’s middleclass populationwill more than triple from today’s 525 million to 1.7 billion
people, at which time Asia will comprise roughly half of theworld’s total middle-class population.
The new emerging middle-class
46
Source: SG Source: Bain Consulting

7/28/2019 TGSF Advisors - Major Themes (April 2013) Copy
http://slidepdf.com/reader/full/tgsf-advisors-major-themes-april-2013-copy 47/95
TGSF Advisors
China is at a critical turning point. With its export marketsincreasingly saturated, the country has no choice but to
shift its growth model from investment and exports todomestic demand and consumption. Over time, China’shousehold saving rate will gradually decline. Rising
disposable income, an aging population, the expansion of household credit, and an improving social safety net will allsupport domestic consumption.
Real private consumption growth has averaged 10.1% perannum over the last two decades, outpacing every other
major country. China’s monthly retail sales are approachingthose of the U.S. in dollar terms. e potential for China’sconsumer story and the growth of its middle class is
enormous. China is now the world’s largest auto market andthe second largest luxury goods market.
If one defines the middle class as those who earn between$6,000 and $30,000, China now has roughly 335 million
people whose incomes fall in that range, compared to 50million in the U.S., and by 2020 over 75% of Chineseincome-earners will belong to this middle class, up from 25%
today. To put this in some perspective, approximately 740million Chinese people will join the middle class club over
the next decade, more than Europe’s entire currentpopulation.
China’s consumer fairy-tale
47

7/28/2019 TGSF Advisors - Major Themes (April 2013) Copy
http://slidepdf.com/reader/full/tgsf-advisors-major-themes-april-2013-copy 48/95
TGSF Advisors
China’s new car market will grow by 15% annually to 2016.In addition to the new car market, China’s passenger carfleet will grow from around 60 million in 2010 to more than
145 million by 2015, according to AlixPartners. By 2020, twoout of every ten Chinese individuals could own anautomobile. Total sales are expected to exceed 30 millionunits by 2020 in China, assuming an annual growth rate of 5.3% in the next decade. In Southeast Asia (Indonesia,Malaysia and ailand), annual demand for motor vehicles isexpected to expand at an even faster rate of 10.5% per yearfrom 2.2 million units in 2010 to 5.9 million units in 2020.
Despite rapid growth in automobile sales in recent years, the
penetration rate is still below 100 cars per 1,000 inhabitantsin China (compared to about 500 cars per 1,000 inhabitantsin the developed world), implying huge upward salespotential in the future. Consider that Japan’s ownership rateis over 300 cars per 1,000 inhabitants. If China grew to half of this level, it would imply a total number of 200 millioncars, about 200% above current levels. Given this marketpotential, as well as its likely impact on other supportindustries, the urgency of understanding China’s autoindustry has never been greater.
In China, per capita GDP reached $1,000 in 2000. In 2010,when it reached $3,000 the growth of car sales grew exponentially, from 1 million to 18 million. In the next 5
years, when per capita GDP reaches $6,000, some 460million people will be able to aff ord a car. How many peopleactually forecast that China’s car sales would actually be 15million or 17 million? Zero. And that’s the point. e pointis that non-linearity of demand is very difficult to forecast.
The growing auto industry
48

7/28/2019 TGSF Advisors - Major Themes (April 2013) Copy
http://slidepdf.com/reader/full/tgsf-advisors-major-themes-april-2013-copy 49/95
TGSF Advisors
e luxury-goods market is booming. By 2015, Chinais expected to have four million wealthy households,
defined as having annual household income exceeding250,000 yuan ($38,000), making it the world’s fourth-
largest host of wealthy households after the U.S., Japanand the U.K. Although these wealthy households
currently account for less than 1% of total urban
Chinese households, they are growing quite rapidly,with the number projected to increase by 16% annually
over the next five years.
According to McKinsey, sales of luxury items in China
may more than double within five years to 180 billion
yuan ($27 billion) in 2015. CLSA forecasts that demandfor luxury goods and travel from Greater China will
account for 44% of global sales by 2020, up from 15%currently.
e wealthy consumers in China are about twenty years younger than their counterparts in the U.S. and Japan,
with 80% younger than 45 in China, compared to 30% in
the U.S. and 19% in Japan. In our view, multinationalcompanies with the strongest global brands will
enjoy the greatest opportunities in China.
Living luxuriously
49

7/28/2019 TGSF Advisors - Major Themes (April 2013) Copy
http://slidepdf.com/reader/full/tgsf-advisors-major-themes-april-2013-copy 50/95
TGSF Advisors
We find dominant consumer businesses to be excellentlong-term compounders of capital: secular volume
growth, pricing power and high margins due to strong‘moats’, low capital intensity, scalability once
distribution is in place and typically without muchcyclicality or balance sheet risk in a downturn. e
beauty of investing in a listed minority equity of global
FMCG companies is highlighted by our friend YaserAnwar:
• Proven business models in the world’s fastest-growing markets
• Best-in-class management and governance in
difficult markets protects against fraud
• Benefit from global brand portfolio, innovation,
credibility with suppliers, scale in sourcing, and
balance sheet strength of parent
• Strong alignment with parent who values locallisting and can access cash only via dividends
Many of the best consumer companies have listings inemerging and frontier markets: Nestle, Unilever and
Colgate-Palmolive are just a few examples.
Buying into a local franchise
50
Nestle Pakistan1991 - 2013
Unilever India1991 - 2013
Source: Bloomberg
Source: Bloomberg
7/28/2019 TGSF Advisors - Major Themes (April 2013) Copy
http://slidepdf.com/reader/full/tgsf-advisors-major-themes-april-2013-copy 51/95
TGSF Advisors
CURRENCY GAMESDEVIL TAKE THE HINDMOST
Theme 7
51

7/28/2019 TGSF Advisors - Major Themes (April 2013) Copy
http://slidepdf.com/reader/full/tgsf-advisors-major-themes-april-2013-copy 52/95
TGSF Advisors
e most significant currency war began after the1929 Wall Street Crash, when France lost faith in
British Sterling as a source of value and beganselling it heavily on the markets. France and the U.S.began building hoards of gold, which inevitably contributed to the Sterling crises of 1931; whereby Britain took the pound off the gold standard (seechart on right).
A “beggar thy neighbor” policy became entrenchedas nations competed to export unemployment, viacurrency devaluation. e fluctuations in exchangerates were harmful for international traders. Globaltrade declined sharply as a result and was alsodisrupted by retaliatory tariff s.
According to BCA Research, the rolling currency devaluations only ceased when France, Britain andU.S. created the Tripartite Agreement, which wasinformal and provisional, but nonethelesssuccessfully stabilized exchange rates. World tradestill did not recover until much later.
Learning from the Great Depression
52
Source: SG, GFD

7/28/2019 TGSF Advisors - Major Themes (April 2013) Copy
http://slidepdf.com/reader/full/tgsf-advisors-major-themes-april-2013-copy 53/95
TGSF Advisors
Over the past decade, current account surplusesrelative to GDP have been shrinking in major
countries around the world. If future growthappears to be more of a zero-sum game, with somecountries and regions trying to gain advantage overothers, then we should anticipate more competitivedevaluations in the race to garner an increasingshare of the export pie. e combination of
shrinking worldwide growth and “beggar-thy-
neighbor” policies could get far enough out of control that war becomes the last resort.
Bonfire of the currencies
53

7/28/2019 TGSF Advisors - Major Themes (April 2013) Copy
http://slidepdf.com/reader/full/tgsf-advisors-major-themes-april-2013-copy 54/95
TGSF Advisors
e peak and decline of current account surplusesaround the world also suggest that the deficit countries
that have traditionally benefited from surplus countriesultimately will be forced to rely on their own central
banks to meet the capital-supply gap, which is what hasoccurred in the U.S. e Fed will be buying about 90%
of the country's new issuance in treasuries and
mortgage bonds in 2013.
According to Guggenheim Partners, central banks from
Brussels to Beijing are once again over allocated to U.S.Treasuries. At some point, these institutions will seek
greater portfolio diversification and the U.S. will lose its
ability to foist debt on the rest of the world. Following Bretton Woods’ collapse, Japan reduced its Treasury
holdings by over a third. Will China repeat this whenBretton Woods II collapses?
China is showing a marked reluctance to continuefunding U.S. deficits as its holdings of U.S. Treasuries
have fallen by approximately $160 billion. S&P
downgraded the U.S. AAA sovereign credit rating on 5August 2011 and Chinese holdings of U.S. Treasury
bonds peaked at $1.3 trillion in July 2011.
The death knell for the dollar
Chinese holdings of U.S.Treasuries ($ bn)
54
Source: US Treasury

7/28/2019 TGSF Advisors - Major Themes (April 2013) Copy
http://slidepdf.com/reader/full/tgsf-advisors-major-themes-april-2013-copy 55/95
TGSF Advisors
China is now the center of a growing percentage of bothAsian, and emerging market trade. As a result, China isincreasingly asking its EM trade partners why theirmutual trade should be settled in U.S. dollars? After all,by trading in dollars, China and its EM trade partnersare making themselves dependent on the willingness/ability of Western banks to finance their trade. ForChina, the fact that Western banks are not reliablepartners was the major lesson of 2008 and again of 2011.
China is taking the leading role and has either begun
trading in local currencies or agreed currency swaps inorder to permit this with a long list of trading partnersincluding: Germany, Japan, Russia, Australia, Brazil,Turkey, UAE, ailand, Indonesia, Malaysia andKazakhstan. In July 2012, trade in Yuan accounted for10% of China’s trade compared with zero two years ago.Preparations to replace the dollar are advancing. Chinahas a genuine opportunity to establish the RMB as thedominant trade currency for its region and the wideremerging markets, just as the deutsche mark did in the
1970s and 1980s.
e internationalization of the RMB and the birth of the RMB bond market is likely to be one of the mostimportant developments of the decade. Understanding this new market will prove essential tounderstanding the world of tomorrow .
RMB Internationalization
55
Source: GaveKal Research

7/28/2019 TGSF Advisors - Major Themes (April 2013) Copy
http://slidepdf.com/reader/full/tgsf-advisors-major-themes-april-2013-copy 56/95
TGSF Advisors
PRECIOUS METALSSUPERMONEY
Theme 8
56
C

7/28/2019 TGSF Advisors - Major Themes (April 2013) Copy
http://slidepdf.com/reader/full/tgsf-advisors-major-themes-april-2013-copy 57/95
TGSF Advisors
e largest and most price-insensitive institutionsin the world are now buyers of gold. e reversal of
the trend of central banks selling gold is one of the most important developments in recenthistory. Central banks as a group are now buyers of gold for the first time since 1988. In 2012, centralbank demand totaled 534 tons, a level not seen innearly 50 years.
e proportion of bullion as a percentage of official
reserves in the BRIC countries – Brazil, Russia,India and China – averages just 5%, compared withmore than 70% in the US and Germany. Russia hasdoubled its gold since 2007, India has increased itsgold reserves by more than 50% while Chinacontinues to buy aggressively. In our view, this trendwill not reverse.
China holds roughly 1.7% of its $3.2 trillion reservesin gold. If the country was to increase theproportion of gold in its reserves to the worldaverage of 10.7%, it would need to buy some 5,000tons – that’s equal to almost two times last year’sglobal mine output.
Central banks reverse role
57
Source: World Gold Council
C ’

7/28/2019 TGSF Advisors - Major Themes (April 2013) Copy
http://slidepdf.com/reader/full/tgsf-advisors-major-themes-april-2013-copy 58/95
TGSF Advisors
Back in December 2009, China Youth Daily quotedState Council advisor Ji Xiaonan as stating that a team
of experts from Beijing and Shanghai had set up a taskforce to consider growing China’s gold reserves. Most
telling were his conclusions: “We suggested that China’sgold reserves should reach 6,000 tons in the next 3-5
years and perhaps 10,000 tons in 8-10 years…if China
wants to take its gold reserves to 10,000 tonnes in 10 years, the country needs to buy or acquire the yellow
metal to the quantity of nearly 1,000 tonnes per year.” In
April 2011 PBoC Governor Zhou Xiaochuan said thatUSD reserves had to be urgently diversified, without
going into specifics. Days later Xia Bin, a member of thePBoC monetary policy committee, said that USD
reserves of $1 trillion would be sufficient, implying a $2
trillion cut in USD reserves.
• At today’s spot price (~$1,700/oz), $2 trillion
equates to ~33,000 tonnes of gold, or ~12 yearsworth of global mine supply
Even if only a fraction of the demand from China’s
reserve objectives flows into the spot market, it would
put significant upward pressure on prices.
Despite China’s highly publicized gold hoarding overthe past several years, China has not updated the IMF
on official gold holdings since April 2009 (reported at1,054 tons). Using China’s imports from Hong Kong
as a proxy for additions to current stockpiles, we cansee that China has at least doubled its gold reserves.
In 2012 alone, China imported more gold than all
ECB holdings.
China’s long-term demand objectives
58
Source: Sharelynx
P ?

7/28/2019 TGSF Advisors - Major Themes (April 2013) Copy
http://slidepdf.com/reader/full/tgsf-advisors-major-themes-april-2013-copy 59/95
TGSF Advisors
ere is simply not enough gold in the world that hasbeen mined or will be mined in the next few decades to
meet the demand for gold by central banks if they alldecide to diversify their portfolios. If the BRIC
countries decide to bring their gold-to-currency ratiosup to the standard of the U.S. (a standard admittedly
declining of late), they would need to find 78,000 tons,
not quite half the gold ever mined. If they decided thatSwitzerland was the “gold standard” for central banks,
they would need to buy more than twice the amount of
gold ever mined. Neither is possible – and that is justthe BRIC countries.
Annual gold mine production has averaged about 2,500tons per year for the last few years. In 1900, about
30,000 metric tons of gold had already been mined. ismeans that over 80% of the current aboveground supply
of gold has been mined since 1900 and that the
aboveground stock of gold has increased by about 1.5%per annum. If global production of gold continues at
a rate of 2,500 metric tons a year, and if the USGS iscorrect in its estimate that there are only 51,000
metric tons of exploitable gold reserves, then gold
production will be exhausted in about 20 years.
Peak gold?
59
Source: World Gold Council
G

7/28/2019 TGSF Advisors - Major Themes (April 2013) Copy
http://slidepdf.com/reader/full/tgsf-advisors-major-themes-april-2013-copy 60/95
TGSF Advisors
Gold held as official reserves
We are heading towards a central bank arms race to accumulate gold.
60
Source: World Gold Council
R

7/28/2019 TGSF Advisors - Major Themes (April 2013) Copy
http://slidepdf.com/reader/full/tgsf-advisors-major-themes-april-2013-copy 61/95
TGSF Advisors
Negative real interest rates have been a significantdriver of the gold price in past years as shown in the
chart on the right prepared by Cliff Gehrett:
• From December 1973 to November 1980, realinterest rates averaged negative 1.7%, while theprice of gold increased by ~500%
• Similarly, the negative real interest rate fromOctober 2002 to the present have averaged
0.8% while the price of gold has risen by ~400%
We are currently in a ~2% negative real interest rateenvironment, solidly within the bullish sweet spotfor gold price appreciation.
• Negative real interest environments forceinvestors into risk assets, such as gold, to avoida loss of purchasing power
• It is likely that this environment will continue
as the Fed has pledged to keep the federalfunds rate unchanged through at least 2015
Real interest rate levels are important
61
Source: Cliff Gehrett
D ’ F

7/28/2019 TGSF Advisors - Major Themes (April 2013) Copy
http://slidepdf.com/reader/full/tgsf-advisors-major-themes-april-2013-copy 62/95
TGSF Advisors
Don’t fight the Fed
e correlation between the Fed’s balance sheet and the price of gold is very high at 0.93.
62
G

7/28/2019 TGSF Advisors - Major Themes (April 2013) Copy
http://slidepdf.com/reader/full/tgsf-advisors-major-themes-april-2013-copy 63/95
TGSF Advisors
Gold stocks are now trading back near 2007 levels,despite a twofold increase in the price of gold.e
underperformance of gold equities vis-à-vis theprice of gold can be mostly explained by ETF flows.Gold stocks have been cannibalized by the surge inETF volumes, with P/E multiples moving inversely with ETF flows. Part of the reason is that duringtimes of extreme risk aversion and safe havendemand, investors prefer physical gold. Goldholdings in 22 ETFs amount to 2,450 tons –exceeding the bullion held by the Bank of Franceand just 2 tons below Italy’s reserves.
We believe the gold equity sell-off over the past 18months represents a nadir in investor sentiment,typical of major bottoms. Investor disappointmentover the past three years has left gold equitiescheap, unloved and under owned. e final catalystfor gold shares may well be intense investorpressure to contain cost overruns and focus onefficiency. Six gold mining CEOs lost their jobs in2012. Such shakeups usually herald a major shift incorporate strategy, and with current valuations,gold equities could do well, even if gold prices gonowhere.
Gold stocks are valuable now
63
W ’ a g s o

7/28/2019 TGSF Advisors - Major Themes (April 2013) Copy
http://slidepdf.com/reader/full/tgsf-advisors-major-themes-april-2013-copy 64/95
TGSF Advisors
We’re making history here
Despite rebounding after the 2008 collapse, mining shares, when priced in ounces of gold, have hit new and unprecedented lows.
64
Silver: even more attractive than gold

7/28/2019 TGSF Advisors - Major Themes (April 2013) Copy
http://slidepdf.com/reader/full/tgsf-advisors-major-themes-april-2013-copy 65/95
TGSF Advisors
In 1950, there were 10 billion ounces of availablesilver above ground. By 1980, that number shrank
to 3.5 billion. And today, no significant governmentstockpiles of silver exist anywhere in the world. eUSGS actually lists the U.S. government's currentstockpile of silver simply as: “None.” ere arecurrently just over 1 billion ounces of silver leftabove ground in bullion form today.at is asurprisingly small number in relation to the 46billion ounces mined throughout history. Forcomparison, there are currently approximately 2billion ounces of gold above ground in bullion formcompared with the 5 billion ounces of gold minedthroughout history. e reason is due to silver’sconsumption in industrial use and the fact that it istypically never recycled.
Annual silver demand (see chart on top right) fromindustry and other sources totals approx. 700mn ozwhich leaves only 300mn oz for investmentpurposes ($10 billion at today’s price).at is a very small amount compared to potential investmentdemand and in relation to available gold supply forinvestment (~$230 billion).is makes silver evenmore scarce than gold.
Silver: even more attractive than gold
65
Chinese entering the silver market

7/28/2019 TGSF Advisors - Major Themes (April 2013) Copy
http://slidepdf.com/reader/full/tgsf-advisors-major-themes-april-2013-copy 66/95
TGSF Advisors
Chinese entering the silver market
e last two decades have witnessed a number of significant changes in the Chinese silver market.
Looking back to 1990, it is fair to say that thecountry was only a relatively small player in theglobal silver market. Last year, however, following aperiod of robust growth, China is now the world’ssecond largest silver fabricator and is likely tobecome the second largest producer, with its shareof global demand and supply now standing at 17%
and 14% respectively.
In China’s first full year after liberalization of theinvestment market in July 2009, net demand forsilver bars and coins more than doubled, totaling9.8 Moz, equivalent to almost $200 million. By 2011, these had figures soared to 17.0 Moz andsome $600 million respectively. To put this into awider perspective, Chinese investors last yearaccounted for 8% of global net purchases of silverbars and coins. Moreover, expectations are thatfurther growth is in the pipeline for the years tocome as local savers put their trust in preciousmetals as a store of value and inflation hedge.
66
An important math lesson

7/28/2019 TGSF Advisors - Major Themes (April 2013) Copy
http://slidepdf.com/reader/full/tgsf-advisors-major-themes-april-2013-copy 67/95
TGSF Advisors
e data below is taken from Sprott and it showsthe U.S. Mint gold and silver sales in ounces. You
just can’t keep buying physical silver on a one toone ratio to gold and have the price diff erentialbe 54 to 1. at’s just mathematically impossible.We believe the gold to silver ratio (shown right) willmove significantly lower to restore a fundamentalbalance between supply and demand. e ratio has
varied widely through the years but has declined inthe past to the range of 10 or 15 to 1 in extendedprecious metals bull-markets.
An important math lesson
67
Source: CIBC WM
Playing platinum and palladium

7/28/2019 TGSF Advisors - Major Themes (April 2013) Copy
http://slidepdf.com/reader/full/tgsf-advisors-major-themes-april-2013-copy 68/95
TGSF Advisors
While gold and silver are a pure demand-side story, we arepositive on platinum and palladium given the favorable supply-side situation. Supply problems out of South Africa (whichproduces close to 75% of the world’s annual platinum supply and37% of the world’s palladium) will be the driving force behind
platinum’s price appreciation, while palladium will benefit fromthe depletion of Russian stockpiles and flat production fromNorilsk (accounts for 42% of global supply).
Roger Baxter, senior executive at the Chamber of Mines of SouthAfrica, recently stated that at least 50% of the country’s platinumindustry is marginal or in a loss-making position today. In
addition, many of the mining operations are suff ering fromdeclining ore grades, further lowering mine output.e result has
been a 25% decline in annual South African platinum productionsince 2006. e palladium supply is also at risk of further laborstrikes and mine shutdowns.
On the demand-side, both metals are crucial to a number of important industrial applications where demand for them isrelatively inelastic to price. e driving force is the autocatalyst
market which benefits from growing global auto sales (the averageautomobile carries a mere $212 worth of PGMs per vehicle).e
jewellery market is also key. China is expected to have consumed1.92 million ounces of platinum in 2012, representing 70% of theoverall global platinum jewellery consumption of 2.73 millionounces. We prefer to build exposure through direct purchasesof the metals themselves.
Playing platinum and palladium
68

7/28/2019 TGSF Advisors - Major Themes (April 2013) Copy
http://slidepdf.com/reader/full/tgsf-advisors-major-themes-april-2013-copy 69/95
TGSF Advisors
IRAQTHE RICHEST MAN IN BABYLON
Theme 9
69
The story of Babylon

7/28/2019 TGSF Advisors - Major Themes (April 2013) Copy
http://slidepdf.com/reader/full/tgsf-advisors-major-themes-april-2013-copy 70/95
TGSF Advisors
The story of Babylon
Iraq is the latest iteration of an old story. If the ird Baron de Rothschild articulated a theme – “buy whenthere is blood on the streets” – then Iraq is the latest variation on that theme. Heeding Rothschild’s advice was
immensely rewarding in earlier “frontier” markets, such as post-WWII Italy and South Korea; in time, thesame might be said of Iraqi equities.
Few would think of Iraq as being a place worth investing in today given the continued outbreaks of violence,political uncertainty, the legacy of war damage and the persistence of fundamental ethnic divisions withinthe country. For almost a decade, perceptions of Iraq have been shaped by stories that tell only of thecountry’s horrors and ignore what we believe is so crucial to understanding the potential of Iraqi equities to
undergo a historic re-rating. We thank Euphrates Advisors for being the first to alert us of this long-termopportunity.
Iraqi GDP was $88 billion in 2007; the 2012 GDP was $179 billion – a doubling in five years. Iraq’s oilexports are at an all-time high and the 13% GDP growth this year makes it one of the fastest growing economies in the world. Inflation is under control and the country sits on $47 billion of international
reserves, an amount equivalent to 12 months import cover and one that provides the central bank with
a great deal of power to defend the dinar should the need arise. e story could not be better. Yet Iraqiequities are given no credit for this objective economic improvement.
70
The major pivot point

7/28/2019 TGSF Advisors - Major Themes (April 2013) Copy
http://slidepdf.com/reader/full/tgsf-advisors-major-themes-april-2013-copy 71/95
TGSF Advisors
To appreciate how far Iraq has come since 2007, we look atwhat life was like for average Iraqis during the 20 years
before 2007. From 1990 to 1998, the Iraqi dinar lost-99.9983% against the U.S. dollar, the result of mismanaged finances and a crippling sanctions regime.
Prices spiraled out of control, rising 45,000% andcreating devastating economic conditions, examples of which include: i) surgeons driving taxis to make ends meet;
engineers and accountants selling fruit, ii) a “highly-paid”physician fortunate enough to practice medicine earning the
equivalent of 30 eggs and 20 loaves of bread per month, and
iii) individuals finding it more economical to stay at homerather than work since daily transportation costs exceeded
monthly income.
According to Euphrates Advisors, the turning point came in
2007 for two reasons. First, the “Surge” eliminated 90% of the insurgency and put an eff ective end to the civil war.Second, the Central Bank of Iraq (CBI) achieved price
stability, establishing its institutional credibility and thereby ending the 17-year hyperinflation. To regain control over
inflation the CBI allowed the dinar to appreciate roughly 20% against the dollar. is action reduced import costs thusrelieving the major source of inflationary pressure. Taken
together, both reasons imparted much needed macrostability to Iraq and set the stage for an economic revival.
The major pivot point
71
Source: Trading Economics
Source: Brookings
The newest oil baron of the world

7/28/2019 TGSF Advisors - Major Themes (April 2013) Copy
http://slidepdf.com/reader/full/tgsf-advisors-major-themes-april-2013-copy 72/95
TGSF Advisors
Iraq has the world’s 4th largest proven oil reserves (afterSaudi Arabia, Venezuela and Iran) and 10th largest
proven gas reserves. Much of Iraq is unexplored and therange of possible upside is 45-100bn additional barrelswith some of the world’s lowest production costs. Iraq’soil production, at 3 million barrels per day, is 13%higher than one year ago, 27% higher than two yearsago, and double its 2005 level.
According to BP, Iraq has proven recoverable oilreserves of 115bn bbl, equivalent to 8.3% of global
reserves and 10.8% of OPEC’s reserves. We expect theproved reserve base to rise further given the operationalperformance of the existing fields, which will benefitfurther from modern enhanced recovery techniquesbrought in by the foreign oil companies, as well as therecent giant discoveries, especially in Kurdistan.
BMI sees Iraq crossing the 6mn b/d oil productionmark by 2015, with the largest contributions from thegiant southern fields such as Rumaila, Zubair and WestQurna-I.e forecast assumes that oilfields beingdeveloped by foreign companies will only hit 50-60% of their intended plateau target. e country could beproducing as much as 8mn b/d by the end of thedecade, representing the greatest potential for oilproduction growth in the Middle East region.
The newest oil baron of the world
Iraqi oil production and export capacity (mmbbl/day)
72
A truly rare tale of economic progress
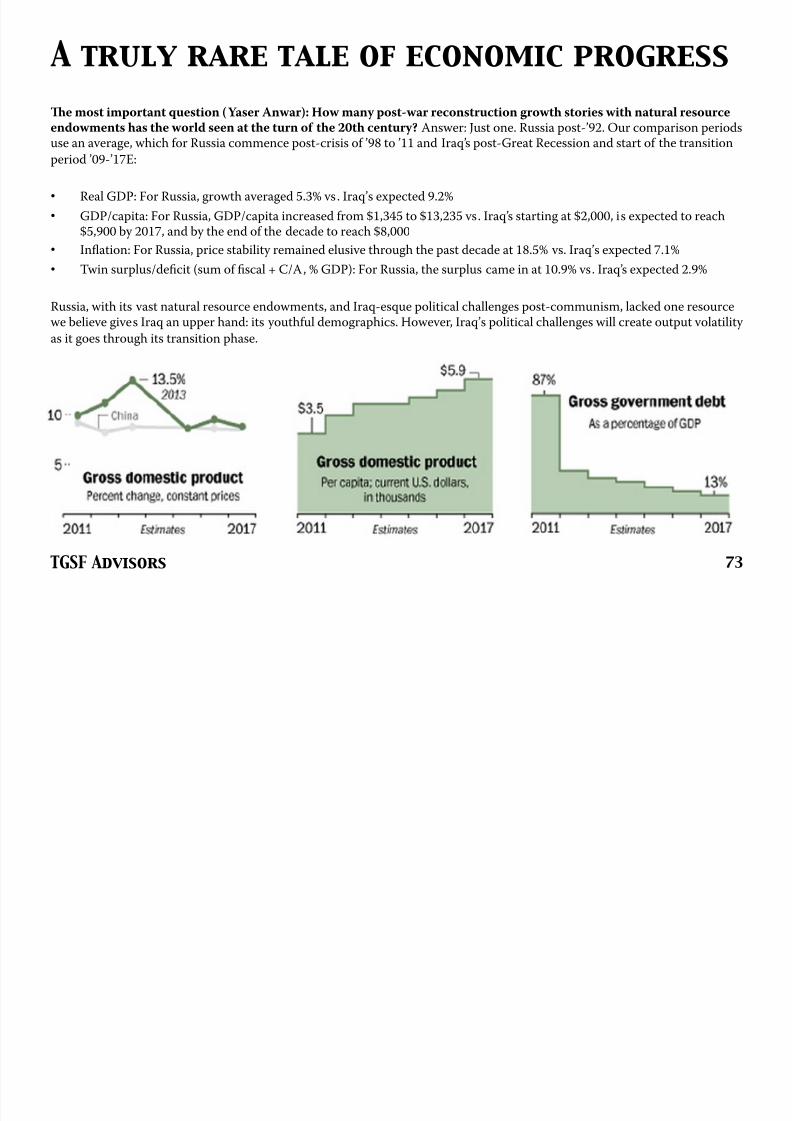
7/28/2019 TGSF Advisors - Major Themes (April 2013) Copy
http://slidepdf.com/reader/full/tgsf-advisors-major-themes-april-2013-copy 73/95
TGSF Advisors
A truly rare tale of economic progress
e most important question (Yaser Anwar): How many post-war reconstruction growth stories with natural resourceendowments has the world seen at the turn of the 20th century? Answer: Just one. Russia post-’92. Our comparison periods
use an average, which for Russia commence post-crisis of ’98 to ’11 and Iraq’s post-Great Recession and start of the transitionperiod ’09-’17E:
• Real GDP: For Russia, growth averaged 5.3% vs. Iraq’s expected 9.2%
• GDP/capita: For Russia, GDP/capita increased from $1,345 to $13,235 vs. Iraq’s starting at $2,000, is expected to reach$5,900 by 2017, and by the end of the decade to reach $8,000
• Inflation: For Russia, price stability remained elusive through the past decade at 18.5% vs. Iraq’s expected 7.1%
• Twin surplus/deficit (sum of fiscal + C/A, % GDP): For Russia, the surplus came in at 10.9% vs. Iraq’s expected 2.9%
Russia, with its vast natural resource endowments, and Iraq-esque political challenges post-communism, lacked one resourcewe believe gives Iraq an upper hand: its youthful demographics. However, Iraq’s political challenges will create output volatility
as it goes through its transition phase.
73
The coming credit boom

7/28/2019 TGSF Advisors - Major Themes (April 2013) Copy
http://slidepdf.com/reader/full/tgsf-advisors-major-themes-april-2013-copy 74/95
TGSF Advisors
The coming credit boom
Iraq is slowly transitioning from a state-dominated financial model to one in which the private sector plays asubstantial role. e country has long operated with essentially no financial leverage. Iraq could be in a situation in
which a new phenomenon – the private credit cycle – is superimposed on a petrodollar cycle. Below are someof the key highlights:
• Population of 32 million in Iraq yet only 4.5 million people have bank accounts
• Debit and credit cards, ATMs, internet banking and auto loans are all new to the Iraqi financial system
• Iraqi banks have low loan/deposit ratios but that will change with improving confidence and robust economicfundamentals (some banks are now extending the duration of certain loans to 3 years; in 2006, most banks wereonly comfortable extending 1-month loans)
• Bank participation levels are rising with recent data from the Central Bank of Iraq showing a near 80% increasein the deposits component of M2 (primarily a result of the oil wind-fall)
• GDP/capita has been steadily rising from $1,200 to $3,500 (’05-’12) bolstering domestic demand, and givenexpected size of Iraqi economy over the next 10 to 15 years (around $500 billion), bank assets and deposits as a% of GDP in ’10 of 3.2 & 2.3, respectively, will meaningfully expand
• Regulatory/central bank initiatives aimed towards improving flow of credit include lowering domestic reserverequirements to 15% vs. 20% in 2011, and raising minimum capital requirements by 5x to $213 million by 2013
Long-term opportunity: Iraq’s GDP is approximately $170 billion. Suppose GDP is $240 billion by 2020. If Iraq’s top five private banks assets equal 50% of GDP (the same rate for Saudi banks), then they will collectively have $120 billion in assets. If they equally split that figure, then each bank will have $24 billion in assets in 2020. Excluding Al Rajhi Bank, which trades at a steep premium relative to its peers, the average top five Saudi banks market cap is .2x total assets. If we apply that same ratio to Iraq, that implies a 2020 market cap of $5 billion for each of the top five private banks. ese banks currently have market caps of approximately $250 million. us, in this admittedly rosy scenario each of the top five Iraqi banks will have market caps 20x higher at the end of this decade .
74
Investment opportunity of the decade

7/28/2019 TGSF Advisors - Major Themes (April 2013) Copy
http://slidepdf.com/reader/full/tgsf-advisors-major-themes-april-2013-copy 75/95
TGSF Advisors
We strongly believe Iraqi stocks are going to be theinvestment opportunity of the decade. Iraq fits a well-defined, time-tested narrative about buying neglected, poorly understood and undervaluedassets.
• e ISX has 70 companies listed – 30 of whichtrade regularly
• Index turnover of $1 to $2 million per day is in linewith many fledgling frontier markets
• Market composition: 1) 50% Telecom; 2) 42%Financials; 3) 7% Industrials; and 4) 1% ConsumerDiscretionary
• Stock market appreciated by 51% in 2011 and 20%in 2012 (USD priced RS ISX Index)
• Market capitalization more than doubled to $10.2billion as of February 2013 following the listing of Qatar Telecom affiliate Asiacell
• Foreign investors make up less than 7% of the
market
In our view, investors are unaware of the major turningpoint that occurred in 2007, the dire conditions thatpreceded it, and the steadily improving fundamentalswhich have followed it.
Investment opportunity of the decade
75
RSISX Iraq Index2010– 2013
Source: Bloomberg

7/28/2019 TGSF Advisors - Major Themes (April 2013) Copy
http://slidepdf.com/reader/full/tgsf-advisors-major-themes-april-2013-copy 76/95
TGSF Advisors
THE GREAT SOCIAL DISORDERWHEN MONEY DIES
Theme 10
76
Words of wisdom

7/28/2019 TGSF Advisors - Major Themes (April 2013) Copy
http://slidepdf.com/reader/full/tgsf-advisors-major-themes-april-2013-copy 77/95
TGSF Advisors
“By a continuing process of inflation, Governmentscan confiscate, secretly and unobserved, an
important part of the wealth of their citizens. By thismethod they not only confiscate, but they confiscatearbitrarily ; and, while the process impoverishesmany, it actually enriches some ….ose to whomthe system brings windfalls …. become “profiteers”
who are the object of the hatred … the process of wealth-getting degenerates into a gamble and a
lottery .. Lenin was certainly right.ere is no subtler, no surer means of overturning the existing basis of society than to debauch the currency.e
process engages all the hidden forces of economic law on the side of destruction, and does it in a
manner which not one man in a million is able todiagnose.”
Lord Keynes (1921)
Words of wisdom
History is replete with disorders in which social cohesion has been undermined by currency debasements.e multi-decade credit inflation can now be seen to have had similarly corrosive eff ects. Yet central banksare determined to continue down the same route. Further debasement of money will cause further
debasement of society. – Dylan Grice
77
The Great Society

7/28/2019 TGSF Advisors - Major Themes (April 2013) Copy
http://slidepdf.com/reader/full/tgsf-advisors-major-themes-april-2013-copy 78/95
TGSF Advisors
e Gini coefficient (which is a measure of incomeinequality) is reaching its highest level since the early
1920s. Real wage growth has stagnated since 2000,while education and healthcare costs have soared. In
the U.S., one in six people are on food stamps – that’s47 million people. 37% of young households hold zero
or negative net worth. More than half of college
graduates under the age of 25 are jobless or working inpositions that didn’t require a college education, the
highest percentage in at least 11 years. Labor force
participation is at a 31-year low (63.5%).
e percentageof young people not in the labor force is the highest
since 1955. ese trends are unlikely to change anytimesoon.
e American society is vulnerable. e family unit,that basic building block of all communities and
civilizations from village to empire, is breaking down.
Marriages are at an all-time low. As a whole, just 52% of adults above 18 are married, compared to 57% in 2000.e average age at marriage is pushing 30. Divorce isbooming: 50% of first marriages, 67% of second, and
74% of third marriages end in divorce. at is
dismaying. e social consequences of this are vast.
The Great Society
Income Gini ratio for US households
78
Source: US Department of Commerce (Census Bureau), Sprott
A global army of the unemployed

7/28/2019 TGSF Advisors - Major Themes (April 2013) Copy
http://slidepdf.com/reader/full/tgsf-advisors-major-themes-april-2013-copy 79/95
TGSF Advisors
Macro imbalances have been passed on to the labormarket to a significant degree. According to ILO, 2013
is expected to top 200 million people unemployed withthe epicenter in the advanced economies. e number
of underemployed 15-to 24-year-olds in the OECD ishigher than at any time since the organization began
collecting data in 1976. A paradigm shift is afoot and
the great challenge facing the developed world isfiguring out how to re-absorb the hundreds of
millions of unemployable. Failure to do so will create
unsustainable political, social, and economic strain.
Consider someone unemployed in his 20s, perhaps witha university degree. e numbers mean that there is anexcellent chance that he will never have the opportunity
to pursue his chosen career and quite possibly willnever get a job at the social level he anticipated. In
Spain and Greece, the young – and the old as well – are
facing personal catastrophe. In the others, thepercentage facing personal catastrophe is lower, but still
very real. Also remember that unemployment does notaff ect just one person. It aff ects the immediate family,
parents and possibly other relatives. e eff ect is not
only financial but also psychological. It creates a pall, asense of failure and dread.
e deep lack of confidence in the financial and politicalsystem has left the public deeply divided and hostile.
Globally, there are young people full of energy andanger. We are mindful that unemployment is a root of
anti-state movements on the left and the right. eextended and hopelessly unemployed have little to lose
and think they have something to gain by destabilizing
the state. It is hard to quantify what level of unemployment breeds that sort of unrest, but there is
no doubt that Spain and Greece are in that zone and
that others might be as well.
A global army of the unemployed
79
Source: International Labor Organization
Bull-market in international tensions

7/28/2019 TGSF Advisors - Major Themes (April 2013) Copy
http://slidepdf.com/reader/full/tgsf-advisors-major-themes-april-2013-copy 80/95
TGSF Advisors
In the coming years, trillions of dollars of debts will berestructured and millions of financially prudent savers
will lose large percentages of their real purchasingpower at exactly the wrong time in their lives. Again,
the world will not end, but the social fabric of theprofligate nations will be stretched and in some cases
torn. Sadly, looking back through economic history, all
too often war is the manifestation of simple economicentropy played to its logical conclusion. We believe
that war is an inevitable consequence of the current
global economic situation. – Kyle Bass
High commodity prices also lead to a sharpening of thestruggle for new supplies and increase the occasions formilitary conflicts. Simply put, when markets are glutted
and over-supplied; no one is going to care to fight inorder to satisfy its demand. Conversely, when markets
are characterized by acute shortages, people will fight
and go to war in order to secure their required supplies.is is particularly the case when shortages threaten to
undermine economic survival or national security. ispattern can be observed throughout history. Writing in
1968, Will Durant, in his e Lessons of History,
said that “in the last 3,421 years of recorded history only 268 have seen no war.”
Bull market in international tensions
80
Source: GaveKal Research
Potential conflicts around the world

7/28/2019 TGSF Advisors - Major Themes (April 2013) Copy
http://slidepdf.com/reader/full/tgsf-advisors-major-themes-april-2013-copy 81/95
TGSF Advisors
e world’s major powers – the U.S., Russia and China– have made it clear that they are shifting theirattention away from the developed world towards Asia.Relatively smaller countries in the region have no choicebut to choose sides and follow the major powers in theirgeopolitical battles.e geopolitical situation in Asiais becoming increasingly complicated. Territorialdisputes could easily turn into regional tensions, withfurther escalation possible due to the involvement of the major powers. Such has been the case with theongoing disputes in the East China Sea and the SouthChina Sea. Militarization is set to increase.
ere are rising tensions across the Middle East astraditional ruling elites attempt to defuse the impact of the Arab Spring and its demands for democraticaccountability. is has manifested itself in two ways:first, the stressing of religious allegiances which has ledto increased discrimination against religious minoritiesand an active Sunni-versus-Shia rivalry; and second, the
massive increases in government expenditures whichimply that most producers now need prices of $75 to$100 per barrel or higher to balance their budgets. As aresult, there is rising potential for conflict that will leadto a cutoff of some portion of the region’s oil supply orthe crimping of export capacity due to regionalpopulation demand – or some combination of the two.
Potential conflicts around the world
81
Estimated increase in total defensespending by region (2010-2020)
Source: Bain Consulting

7/28/2019 TGSF Advisors - Major Themes (April 2013) Copy
http://slidepdf.com/reader/full/tgsf-advisors-major-themes-april-2013-copy 82/95
TGSF Advisors
THE FUNDTHE GOOD SOCIETY FUND
APPENDIX
82
CONFIDENTIAL

7/28/2019 TGSF Advisors - Major Themes (April 2013) Copy
http://slidepdf.com/reader/full/tgsf-advisors-major-themes-april-2013-copy 83/95
TGSF Advisors 83
e social object of skilled investment should be to defeat the dark forces of time and
ignorance which envelope our future.
Lord Keynes
Our Philosophy

7/28/2019 TGSF Advisors - Major Themes (April 2013) Copy
http://slidepdf.com/reader/full/tgsf-advisors-major-themes-april-2013-copy 84/95
TGSF Advisors
Our Philosophy
84
e investment environment is changing at a rate that's representative of global economicimbalances, fund flows, and geopolitical risks. We believe this decade will witness greatly
increased volatility and instability in the economy and financial system. Our guiding principleis to help investors understand and navigate through all the complexities of an unstable,inflation-prone world.
Fundamental to our approach to investing is a core understanding of history, politics,economics and psychology. We are always seeking more knowledge. We believe an eclectic
approach that is based on common sense, strong logic, and objective data, balanced by right-brain intuition and lots of curiosity is what works best.
e Good Society Fund (TGSF) is a discretionary global macro strategy hedge fund. e Fundseeks to combine fundamental investment research with technical analysis to exploitopportunities in global stocks, bonds, currencies, and commodities. Our primary objective is
to achieve long-term capital appreciation by targeting 15% to 20% net annual returns.
World at a glance

7/28/2019 TGSF Advisors - Major Themes (April 2013) Copy
http://slidepdf.com/reader/full/tgsf-advisors-major-themes-april-2013-copy 85/95
TGSF Advisors
World at a glance
85
In the investment world, anyone who foresees and understands the trends, who is open- minded, and who keeps emotions at bay, wins.
e structural backdrop for a global macro strategy
• Developed economy governments are insolvent
• e process of deleveraging and global rebalancing is underway
• Outsized dislocations from “non-economic” policy actions• e loss of central bank independence with likely unintended consequences
• Ongoing battle between deflation and reflationary forces
• Shorter and more volatile economic cycles that are globally synchronized
• Drop of confidence in policymakers, institutions and the “system” at large
• Increased risk of geopolitical tensions and social conflict
• Market prices only reflect fair value by accident and in passing
Investment Strategy

7/28/2019 TGSF Advisors - Major Themes (April 2013) Copy
http://slidepdf.com/reader/full/tgsf-advisors-major-themes-april-2013-copy 86/95
TGSF Advisors
Investment Strategy
86
Our investment strategy is grounded in a thorough understanding of the macro environmentand key investment themes. We look to build a diversified portfolio of trades that each add
incremental alpha. Our approach takes advantage of directional market movements that have astrong fundamental reasoning based upon our independent research. We have a deep focus oncyclical versus secular economic trends and their impact on various markets.
In our analysis of the macro environment, we look for markets where there is the potential fora paradigm shift. is is when the basic assessment of the outlook completely changes and the
market slowly recognizes that there is another economic equilibrium which is very far from thecurrent state. ese shifts will commonly allow for great entry levels and the potential to grow into major long-term trends.
We pay particular attention to the embedded beliefs in financial markets and assess valuationsand trends in this context. It is the changing views and behaviors of market participants that
changes asset pricing, which is driven by both new information and a changing interpretationof existing information. In pursuing our target of superior risk-adjusted absolute returns, weuse a strong alliance of trading disciplines and aim to maximize the balance of risk and rewardat all times.
Thematic Approach

7/28/2019 TGSF Advisors - Major Themes (April 2013) Copy
http://slidepdf.com/reader/full/tgsf-advisors-major-themes-april-2013-copy 87/95
TGSF Advisors
Thematic Approach
87
One or two big themes define most years
1997 e Asian Financial Crisis
1998 Yen / Asian FX rally / Russian Default
1999 Tech / Dotcom boom
2000 Tech / Dotcom bust
2001 Eurodollar surge / Gold upturn
2002 US dollar bear market
2003 Deflation scare / Emerging market bull-run
2004 Oil price break-out / US housing boom
2005 China bottom / GCC stock market bubble
2006 M&A boom / US housing top
2007 US housing bust / China bubble peak
2008 Credit crisis - Policy panic! / Commodity top
2009 Reflation QE I / Global risk rally 2010 Reflation QE II / EU Deleveraging I
2011 EU Deleveraging II / US housing bottom
2012 Bubble in safety / China bottom
2013 Abenomics / Gold stock lows
Fund Overview

7/28/2019 TGSF Advisors - Major Themes (April 2013) Copy
http://slidepdf.com/reader/full/tgsf-advisors-major-themes-april-2013-copy 88/95
TGSF Advisors
Fund Overview
88
Launch Date: May 2013
Style: Discretionary global macro
Typical Portfolio: 5 – 10 investment themes, 30 – 40 positions
Tradable Instruments: Stocks, bonds, currencies and commodities
Geographic Focus: Global, thematic approach
Investment Horizon: 6 to 18 months with shorter term tactical trading
Position Limits: Max 15% on longs, Max 5% on shorts at cost
Volatility: Target annualized volatility of 12%
Research Methodology

7/28/2019 TGSF Advisors - Major Themes (April 2013) Copy
http://slidepdf.com/reader/full/tgsf-advisors-major-themes-april-2013-copy 89/95
TGSF Advisors
Research Methodology
89
Macro Analysis - Imagine
• Assess broad capital market, demographic, economic and political environments
• Analysis of monetary, fiscal and regulatory policies
• Identify secular themes and look for trends that are against mainstream thinking
Fundamental Analysis - Research
• Top-down fundamental research across stocks, bonds, currencies and major commodities
• In-depth country, sector and company reviews
• Bottom-up valuation analysis
Technical Analysis - Execute
• Analysis of trends, market flows, sentiment, consensus views and investor positioning
• Identify entry and exit points, support and resistance levels and changes in trends
• Reduce the influence of emotions and ego on trading
Investment Process

7/28/2019 TGSF Advisors - Major Themes (April 2013) Copy
http://slidepdf.com/reader/full/tgsf-advisors-major-themes-april-2013-copy 90/95
TGSF Advisors
Investment Process
90
Idea Generation Portfolio Construction Risk Monitoring
ematic approach leads toselection of key countries
and sectors based on
detailed macro analysis
Particular interest in
potential for paradigm
shifts when consensusoutlook completely changes
Evaluate risk-reward profile
for range of trades that canbe used to express a theme
Maintain flexibility towards
shifts in data and economicexpectations
Build a diversifiedportfolio of themes to
enable profitability in
diff erent market regimes
Optimize position sizing,
define entry and exit
points and implementtrade only when the
timing is right
Constantly evaluatechanging assetcorrelations to ensure
genuine independent
themes rather thanmultiple expressions of
the same idea
Real-time portfoliomonitoring seeks to
ensure ongoing picture of
aggregate risks
Stop-loss set pre-trade
with strict risk limits for
each position
Portfolio risk reduction
levels at 5% and 10% to
facilitate re-evaluationbefore rebuilding risk
Examine tail risks with
scenario based stresstesting
Risk Management Principles

7/28/2019 TGSF Advisors - Major Themes (April 2013) Copy
http://slidepdf.com/reader/full/tgsf-advisors-major-themes-april-2013-copy 91/95
TGSF Advisors
Risk Management Principles
91
Focus more intently on the downside than the upside. We believe if we protect the downside,the upside will take care of itself. Preservation of capital is our number one priority.
We believe in being open-minded and flexible when challenged by the market. e willingnessto admit we could be wrong and take action to limit downside risk.
Use of macro analysis to avoid economic turbulence by managing the portfolio’s risk exposure,and bottom-up analysis to maintain a value bias to the holdings within the portfolio.
Scenario based stress testing identifies the potential portfolio losses that can be ascribed to
specific (sometimes very large) simultaneous changes in market prices and rates.
We practice patience and do not mind holding funds invested. We take risk only when we see
an opportunity.
An objective assessment of behavioral risks inherent in our decision making to improve ourinvestment process and philosophy.
Team

7/28/2019 TGSF Advisors - Major Themes (April 2013) Copy
http://slidepdf.com/reader/full/tgsf-advisors-major-themes-april-2013-copy 92/95
TGSF Advisors 92
Jawad S. MianFounder and Chief Investment Officer
• 8 years of investment management experience
• Most recently Portfolio Manager at QInvest in Doha, Qatar where he managed $250mn in assets
• Previously, Portfolio Manager at Rasmala Investments in Dubai, UAE
• Started career at CIBC in Toronto, Canada in Retail Markets before moving to CIBC Mellon
• BA in Finance and Economics from
e University of Western Ontario in Canada
• CFA and CMT charterholder
Summary of Terms

7/28/2019 TGSF Advisors - Major Themes (April 2013) Copy
http://slidepdf.com/reader/full/tgsf-advisors-major-themes-april-2013-copy 93/95
TGSF Advisors 93
Domicile: Bermuda
Minimum Investment: USD 10,000
Liquidity: Monthly
Fees: 2% management and 20% performance
High-Water Mark: Yes
Prime Broker: Interactive Brokers
Administrator: Apex Fund Services
Auditor: Deloitte

7/28/2019 TGSF Advisors - Major Themes (April 2013) Copy
http://slidepdf.com/reader/full/tgsf-advisors-major-themes-april-2013-copy 94/95
TGSF Advisors 94
is document is not an off er to sell or a solicitation of an off er to buy interests in TGSF
Advisors. An off ering will only be made by means of a confidential private off eringmemorandum and only in those jurisdictions where permitted by law.

7/28/2019 TGSF Advisors - Major Themes (April 2013) Copy
http://slidepdf.com/reader/full/tgsf-advisors-major-themes-april-2013-copy 95/95