Embed Size (px)
Citation preview
UNITED KINGDOM
January – March 2016
27th April 2016
22
Disclaimer
Santander UK Group Holdings plc (“Santander UK Group Holdings”) is a subsidiary of Banco Santander, S.A. (“Santander”).
Santander UK Group Holdings and Santander both caution that this presentation may contain forward-looking statements. Such forward-looking statements are found in various places throughout this presentation. Words such as “believes”, “anticipates”, “expects”, “intends”, “aims” and “plans” and other similar expressions are intended to identify forward-looking statements, but they are not the exclusive means of identifying such statements. Forward-looking statements include, without limitation, statements concerning our future business development and economic performance. Forward-looking statements involve known and unknown risks and uncertainties, they are based on management’s current expectations, estimates and projections and both Santander UK Group Holdings and Santander caution that these statements are not guarantees of future performance. We also caution readers that a number of important factors could cause actual results to differ materially from the plans, objectives, expectations, estimates and intentions expressed in such forward-looking statements. We have identified certain of these factors on pages 329 to 349 of the Santander UK Group Holdings Annual Report for 2015. Investors and others should carefully consider the foregoing factors and other uncertainties and events. Undue reliance should not be placed on forward-looking statements when making decisions with respect to Santander UK, Santander and/or their securities. The information in this presentation, including any forward-looking statements, speak only as of the date on which they are made, and we do not undertake any obligation to update or revise any of them, whether as a result of new information, future events or otherwise. Statements as to historical performance, historical share price or financial accretion are not intended to mean that future performance, future share price or future earnings for any period will necessarily match or exceed those of any prior quarter. Nothing in this presentation should be construed as a profit forecast.
No representation or warranty of any kind is made with respect to the accuracy, reliability or completeness of any information, opinion or forward-looking statement, any assumptions underlying them, the description of future operations or the amount of any future income or loss contained in this presentation or in any other written or oral information made or to be made available to any interested party or its advisers by Santander UK Group Holdings or Santander’s advisers, officers, employees or agents. It does not purport to be comprehensive and has not been independently verified. Any prospective investor should conduct their own due diligence on the accuracy of the information contained in this presentation.
This presentation does not constitute an offer to sell, or a solicitation of an offer to subscribe for, any securities, it does not constitute advice or a recommendation to buy, sell or otherwise deal in any securities of Santander UK Group Holdings or Santander or any other securities and should not be relied on for the purposes of an investment decision. This presentation has not been filed, reviewed or approved by any regulator, governmental regulatory body or securities exchange in any jurisdiction or territory.
To the fullest extent permitted by law, neither Santander UK Group Holdings nor Santander accept any liability whatsoever for any direct or consequential loss arising from any use of or reliance on this presentation.
By attending / reading the presentation you agree to be bound by these provisions.
Note : The results information contained in this presentation has been prepared according to Spanish accounting criteria, regulation and Banco Santander group policy in a manner applicable to all subsidiaries of the Banco Santander Group. As a result it may differ from that disclosed locally by Santander UK. The results information in this presentation includes all of the Banco Santander group operations in the UK even if they are in Santander UK consolidated Group.
Source: Santander UK Group Holdings Q1 2016 results “Quarterly Management Statement for the three months ended 31 March 2016” or Santander UK Group Holdings Management (‘MI’), unless otherwise stated. Santander has a standard listing of its ordinary shares on the London Stock Exchange and Santander UK continues to have its preference shares listed on the London Stock Exchange. Further information in relation to Santander UK can be found at: www.santander.co.uk/uk/about-santander-uk. Neither the content of Santander UK’s website nor any website accessible by hyperlinks on Santander UK’s website is incorporated in, or forms part of, this presentation.
Santander UK Group Holdings plc. Registered Office: 2 Triton Square, Regent's Place, London, NW1 3AN, United Kingdom. Registered Number 8700698. Registered in England. www.santander.co.uk. Telephone 0870 607 6000. Calls may be recorded or monitored. Santander UK Group Holdings plc. and its subsidiaries operate primarily in the UK, are regulated by the UK Prudential Regulation Authority (‘PRA’) and the Financial Conduct Authority (‘FCA’) and are part of the Banco Santander, S.A. group (the ‘Banco Santander group’). Santander UK plc’s Financial Services Register number is 106054. Santander UK plc. is also licensed by the Financial Supervision Commission of the Isle of Man for its branch in the Isle of Man. Deposits held with the Isle of Man branch are covered by the Isle of Man Depositors’ Compensation Scheme as set out in the Isle of Man Depositors’ Compensation Scheme Regulations 2010.In the Isle of Man, Santander UK plc’s principal place of business is at 19/21 Prospect Hill, Douglas, Isle of Man, IM1 1ET. Santander and the flame logo are registered trademarks. Banco Santander S.A. London Branch is regulated by the Financial Conduct Authority.
Agenda
■ Macro-economic environment and financial system
■ Strategy and business
■ Results
■ Appendix
44
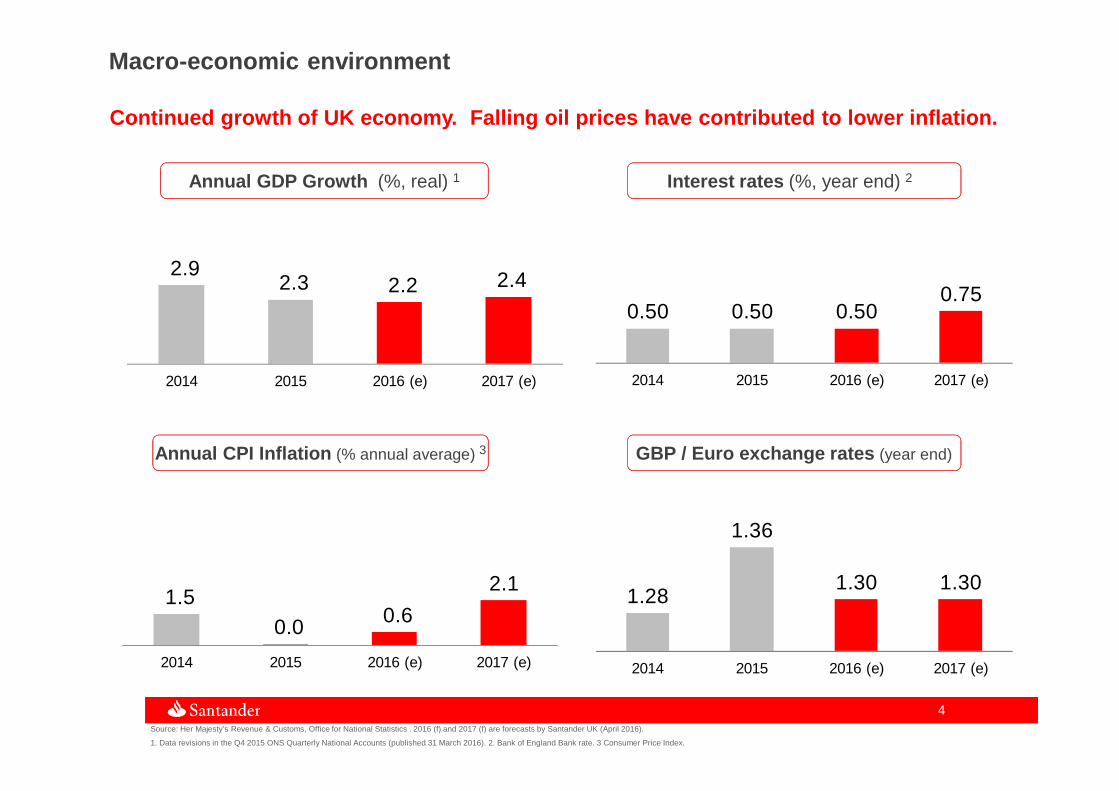
2.9 2.3 2.2 2.4
2014 2015 2016 (e) 2017 (e)
0.50 0.50 0.500.75
2014 2015 2016 (e) 2017 (e)
1.5 0.0 0.6
2.1
2014 2015 2016 (e) 2017 (e)
1.28
1.36
1.30 1.30
2014 2015 2016 (e) 2017 (e)
Source: Her Majesty’s Revenue & Customs, Office for National Statistics . 2016 (f) and 2017 (f) are forecasts by Santander UK (April 2016).
1. Data revisions in the Q4 2015 ONS Quarterly National Accounts (published 31 March 2016). 2. Bank of England Bank rate. 3 Consumer Price Index.
Macro-economic environment
Annual GDP Growth (%, real) 1
GBP / Euro exchange rates (year end)Annual CPI Inflation (% annual average) 3
Interest rates (%, year end) 2
Continued growth of UK economy. Falling oil prices have contributed to lower inflation.
55
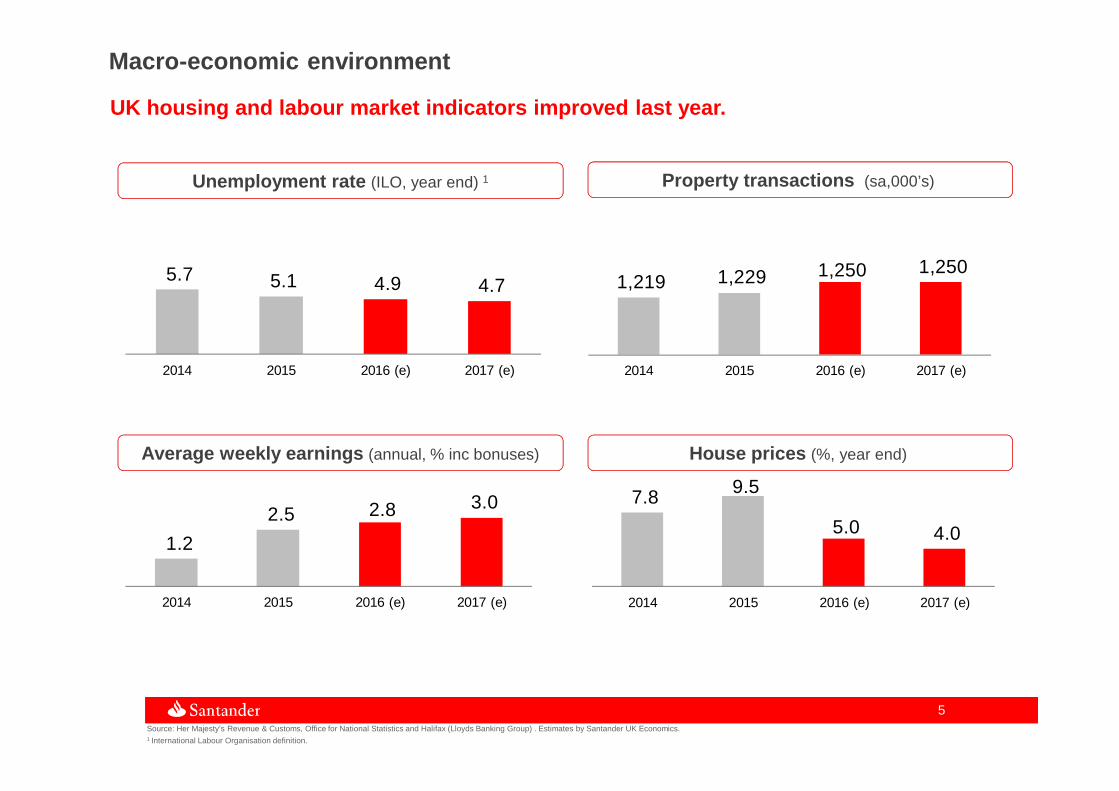
5.7 5.1 4.9 4.7
2014 2015 2016 (e) 2017 (e)
7.8 9.5
5.0 4.0
2014 2015 2016 (e) 2017 (e)
1.2
2.5 2.8 3.0
2014 2015 2016 (e) 2017 (e)
1,219 1,229 1,250 1,250
2014 2015 2016 (e) 2017 (e)
Source: Her Majesty’s Revenue & Customs, Office for National Statistics and Halifax (Lloyds Banking Group) . Estimates by Santander UK Economics.1 International Labour Organisation definition.
Macro-economic environment
UK housing and labour market indicators improved las t year.
Unemployment rate (ILO, year end) 1
House prices (%, year end) Average weekly earnings (annual, % inc bonuses)
Property transactions (sa,000’s)
66
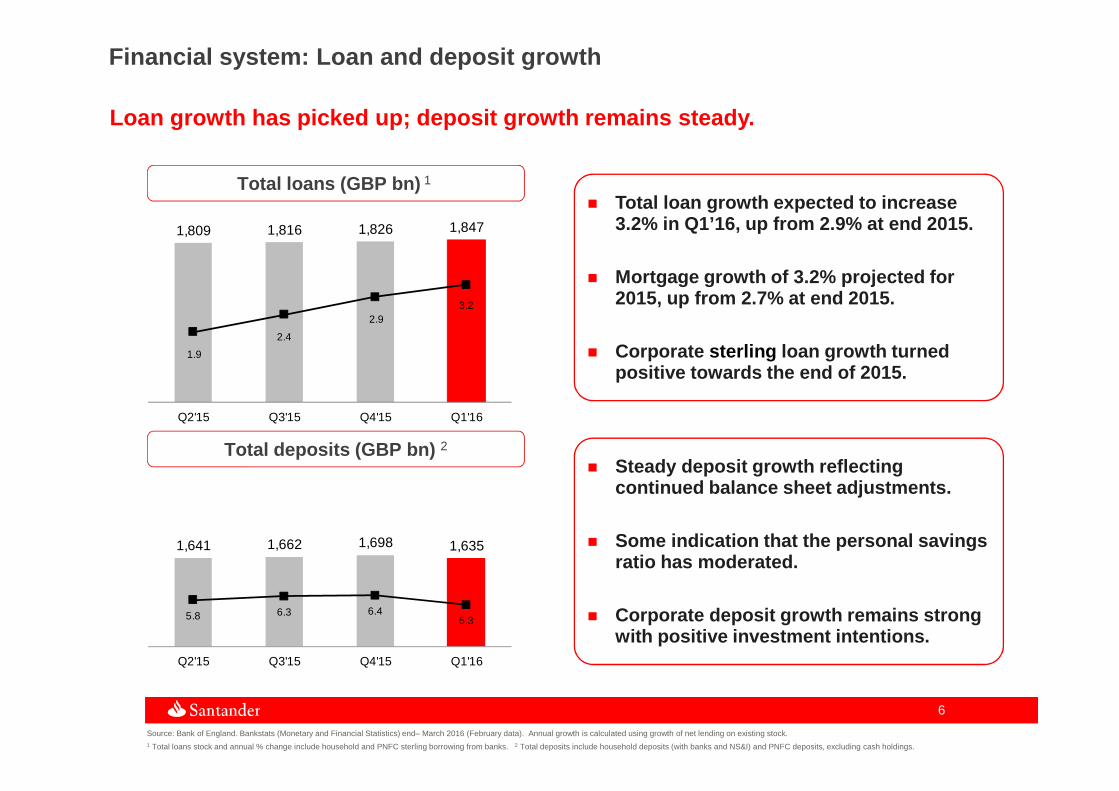
1,641 1,662 1,698 1,635
5.8 6.3 6.45.3
Q2'15 Q3'15 Q4'15 Q1'16
1,809 1,816 1,826 1,847
1.9
2.4
2.93.2
Q2'15 Q3'15 Q4'15 Q1'16
Source: Bank of England. Bankstats (Monetary and Financial Statistics) end– March 2016 (February data). Annual growth is calculated using growth of net lending on existing stock.1 Total loans stock and annual % change include household and PNFC sterling borrowing from banks. . 2 Total deposits include household deposits (with banks and NS&I) and PNFC deposits, excluding cash holdings.
Financial system: Loan and deposit growth
� Total loan growth expected to increase 3.2% in Q1’16, up from 2.9% at end 2015.
� Mortgage growth of 3.2% projected for 2015, up from 2.7% at end 2015.
� Corporate sterling loan growth turned positive towards the end of 2015.
� Steady deposit growth reflecting continued balance sheet adjustments.
� Some indication that the personal savings ratio has moderated.
� Corporate deposit growth remains strong with positive investment intentions.
Total loans (GBP bn) 1
Total deposits (GBP bn) 2
Loan growth has picked up; deposit growth remains s teady.
Agenda
■ Macro-economic environment and financial system
■ Strategy and business
■ Results
■ Appendix
881Active customers hold at least one active product. For current accounts, savings accounts or credit cards an active product must be open and have a balance of more than £50 or at least one transaction in the last month. 2.Local criteria includes
branches and universities and excludes agencies. 3 Calculated as Customer Loans and Credits divided by Customer Deposits on the face of the balance sheet. 4 Local Statutory view.
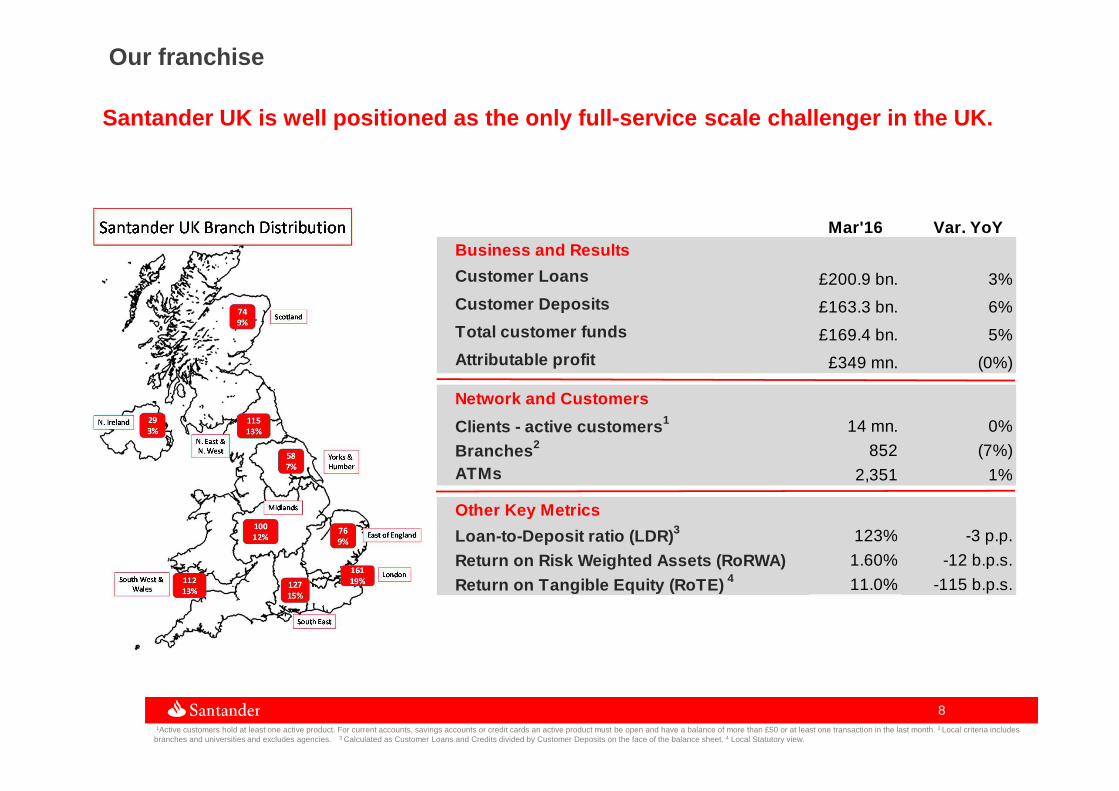
Our franchise
Santander UK is well positioned as the only full-se rvice scale challenger in the UK.
Mar'16 Var. YoY Business and Results
Customer Loans £200.9 bn. 3%
Customer Deposits £163.3 bn. 6%
Total customer funds £169.4 bn. 5%
Attributable profit £349 mn. (0%)
Network and Customers
Clients - active customers 1 14 mn. 0%
Branches 2 852 (7%)ATMs 2,351 1%
Other Key Metrics
Loan-to-Deposit ratio (LDR) 3 123% -3 p.p.
Return on Risk Weighted Assets (RoRWA) 1.60% -12 b.p.s.
Return on Tangible Equity (RoTE) 4 11.0% -115 b.p.s.
99
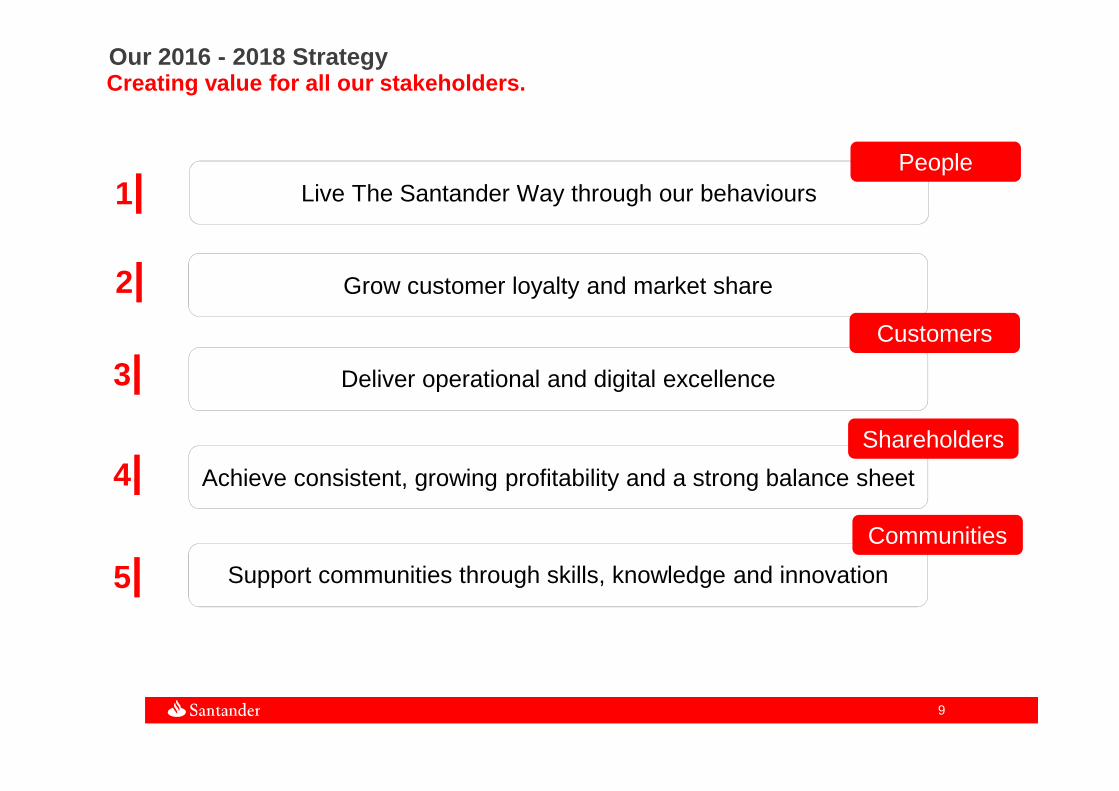
Our 2016 - 2018 StrategyCreating value for all our stakeholders.
Grow customer loyalty and market share
1|
2|
3|
4|
5|
Live The Santander Way through our behaviours
Deliver operational and digital excellence
Achieve consistent, growing profitability and a strong balance sheet
Support communities through skills, knowledge and innovation
People
Customers
Shareholders
Communities
1010
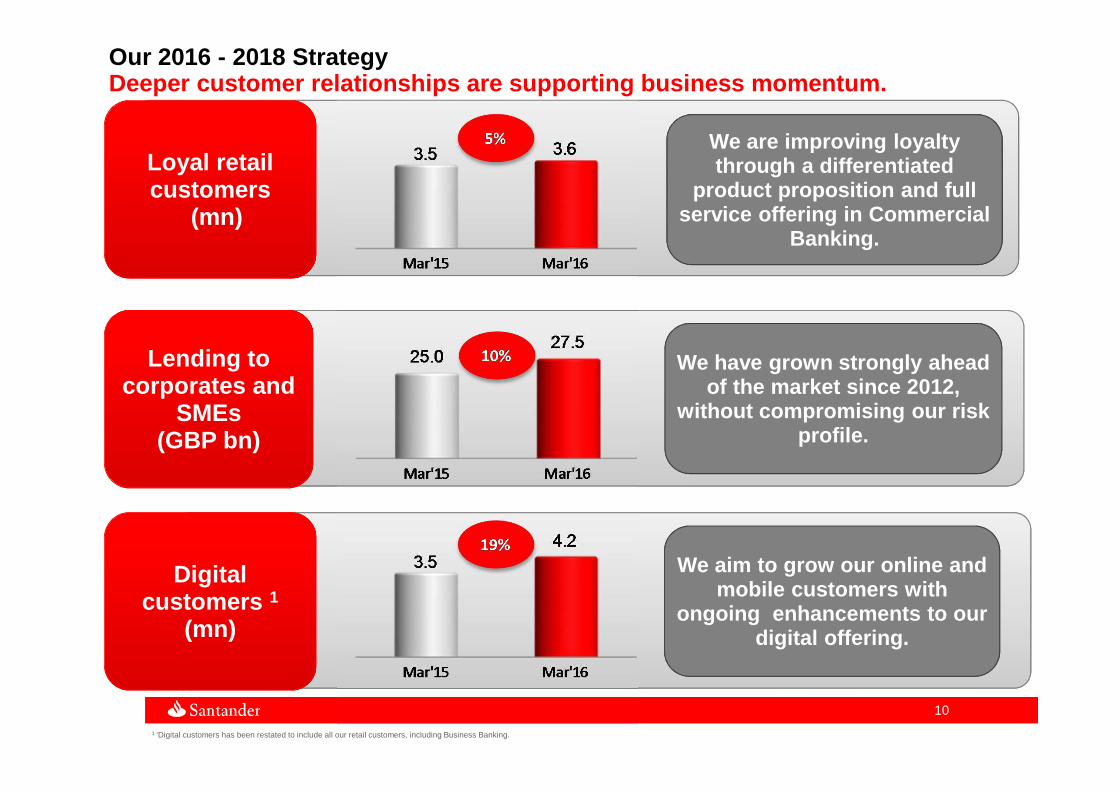
Deeper customer relationships are supporting busine ss momentum.
We are improving loyalty through a differentiated
product proposition and full service offering in Commercial
Banking.
We have grown strongly ahead of the market since 2012,
without compromising our risk profile.
Lending to corporates and
SMEs(GBP bn)
Loyal retail customers
(mn)
We aim to grow our online and mobile customers with
ongoing enhancements to our digital offering.
Digital customers 1
(mn)
Our 2016 - 2018 Strategy
1 ‘Digital customers has been restated to include all our retail customers, including Business Banking.
1111
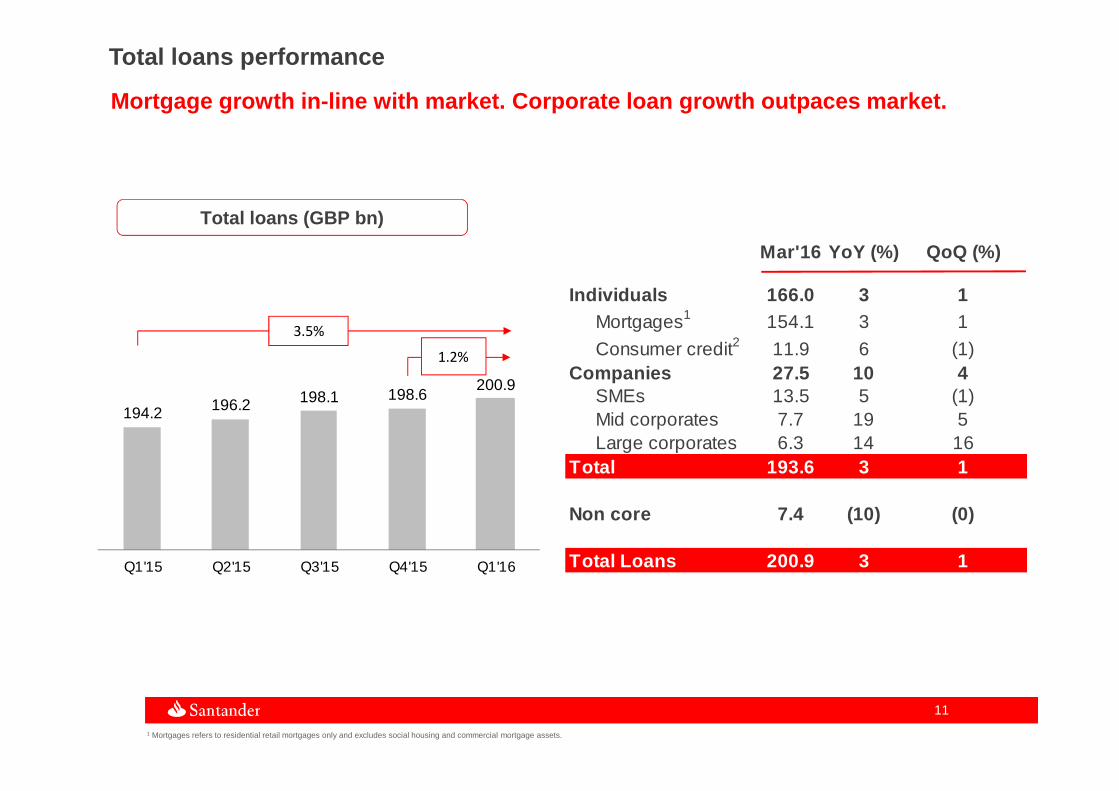
Mar'16 YoY (%) QoQ (%)
Individuals 166.0 3 1Mortgages1 154.1 3 1
Consumer credit2 11.9 6 (1)Companies 27.5 10 4
SMEs 13.5 5 (1)Mid corporates 7.7 19 5Large corporates 6.3 14 16
Total 193.6 3 1
Non core 7.4 (10) (0)
Total Loans 200.9 3 1
194.2 196.2 198.1 198.6200.9
Q1'15 Q2'15 Q3'15 Q4'15 Q1'16
3.5%
1.2%
1 Mortgages refers to residential retail mortgages only and excludes social housing and commercial mortgage assets.
Total loans performance
Total loans (GBP bn)
Mortgage growth in-line with market. Corporate loan growth outpaces market.
1212
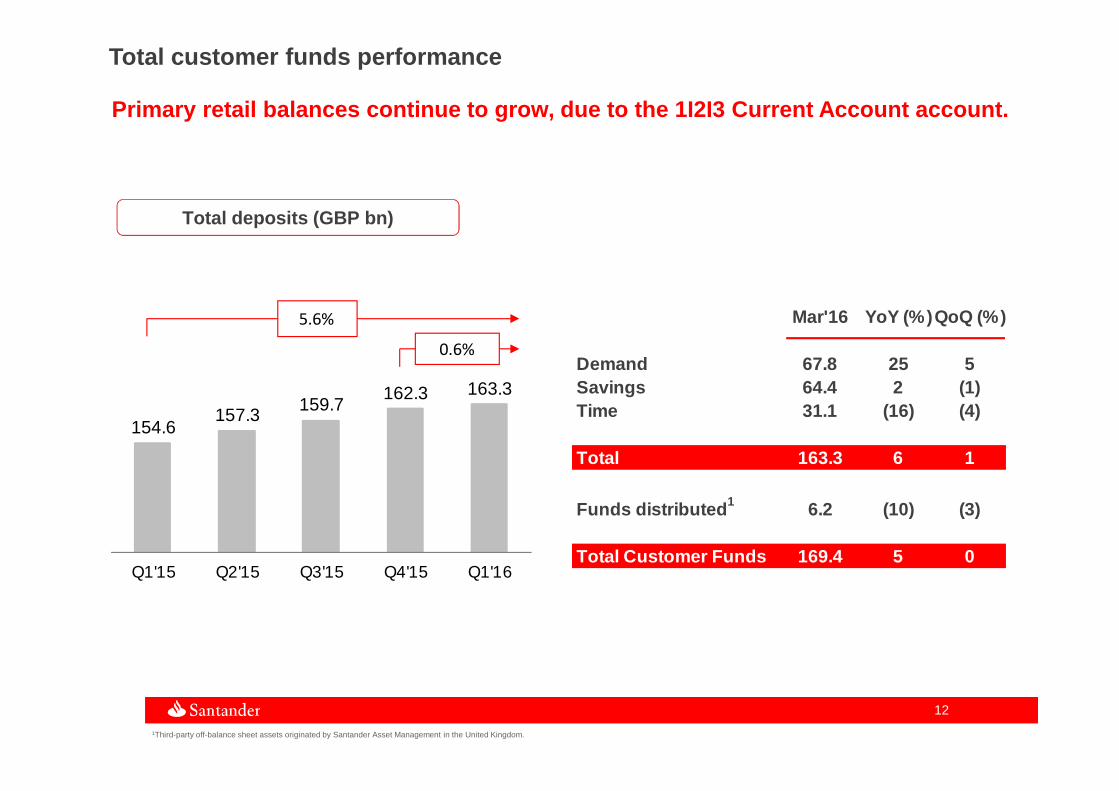
Mar'16 YoY (%) QoQ (%)
Demand 67.8 25 5Savings 64.4 2 (1)Time 31.1 (16) (4)
Total 163.3 6 1
Funds distributed 1 6.2 (10) (3)
Total Customer Funds 169.4 5 0
154.6157.3
159.7162.3 163.3
Q1'15 Q2'15 Q3'15 Q4'15 Q1'16
5.6%
0.6%
1 1Third-party off-balance sheet assets originated by Santander Asset Management in the United Kingdom.
Total customer funds performance
Total deposits (GBP bn)
Primary retail balances continue to grow, due to th e 1I2I3 Current Account account.
Agenda
■ Macro-economic environment and financial system
■ Strategy and business
■ Results
■ Appendix
1414
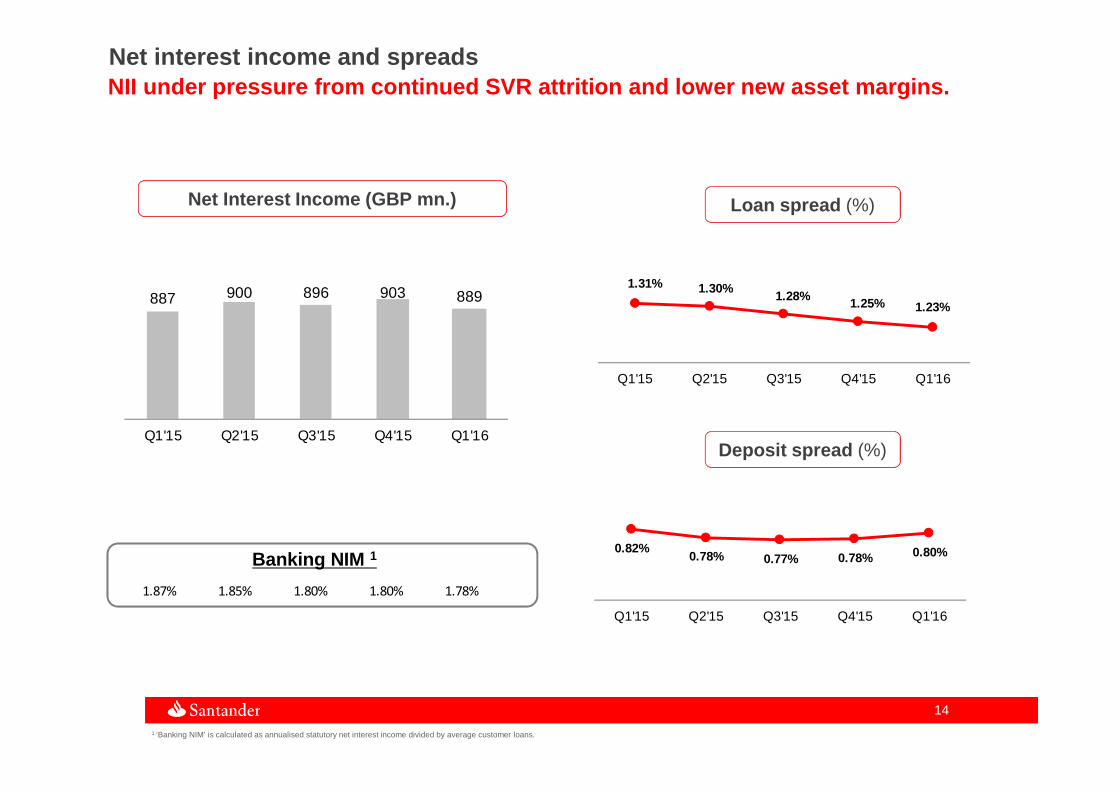
Banking NIM 1
1 ‘Banking NIM’ is calculated as annualised statutory net interest income divided by average customer loans.
Net interest income and spreadsNII under pressure from continued SVR attrition and lower new asset margins.
Deposit spread (%)
Loan spread (%)Net Interest Income (GBP mn.)
1.87% 1.85% 1.80% 1.80% 1.78%
887 900 896 903 889
Q1'15 Q2'15 Q3'15 Q4'15 Q1'16
1.31% 1.30%1.28% 1.25% 1.23%
Q1'15 Q2'15 Q3'15 Q4'15 Q1'16
0.82%0.78% 0.77% 0.78% 0.80%
Q1'15 Q2'15 Q3'15 Q4'15 Q1'16
1515
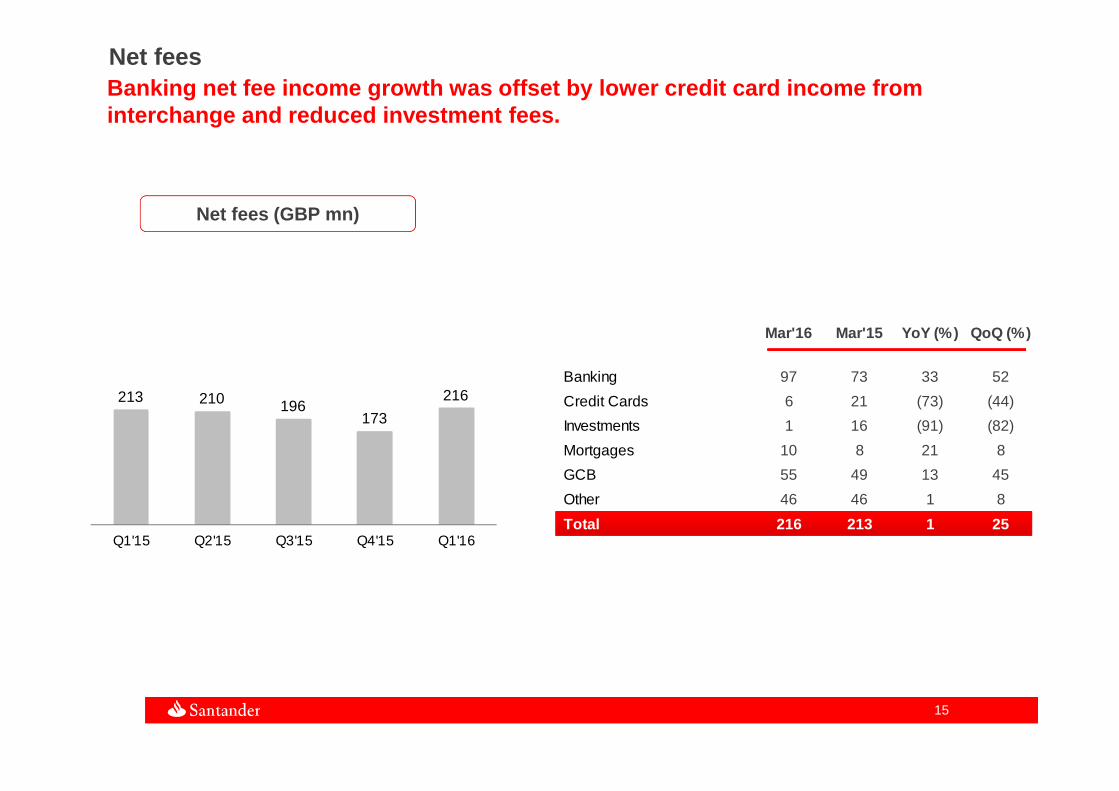
Mar'16 Mar'15 YoY (%) QoQ (%)
Banking 97 73 33 52
Credit Cards 6 21 (73) (44)
Investments 1 16 (91) (82)
Mortgages 10 8 21 8
GCB 55 49 13 45
Other 46 46 1 8
Total 216 213 1 25
213 210 196173
216
Q1'15 Q2'15 Q3'15 Q4'15 Q1'16
Net feesBanking net fee income growth was offset by lower c redit card income from interchange and reduced investment fees.
Net fees (GBP mn)
1616
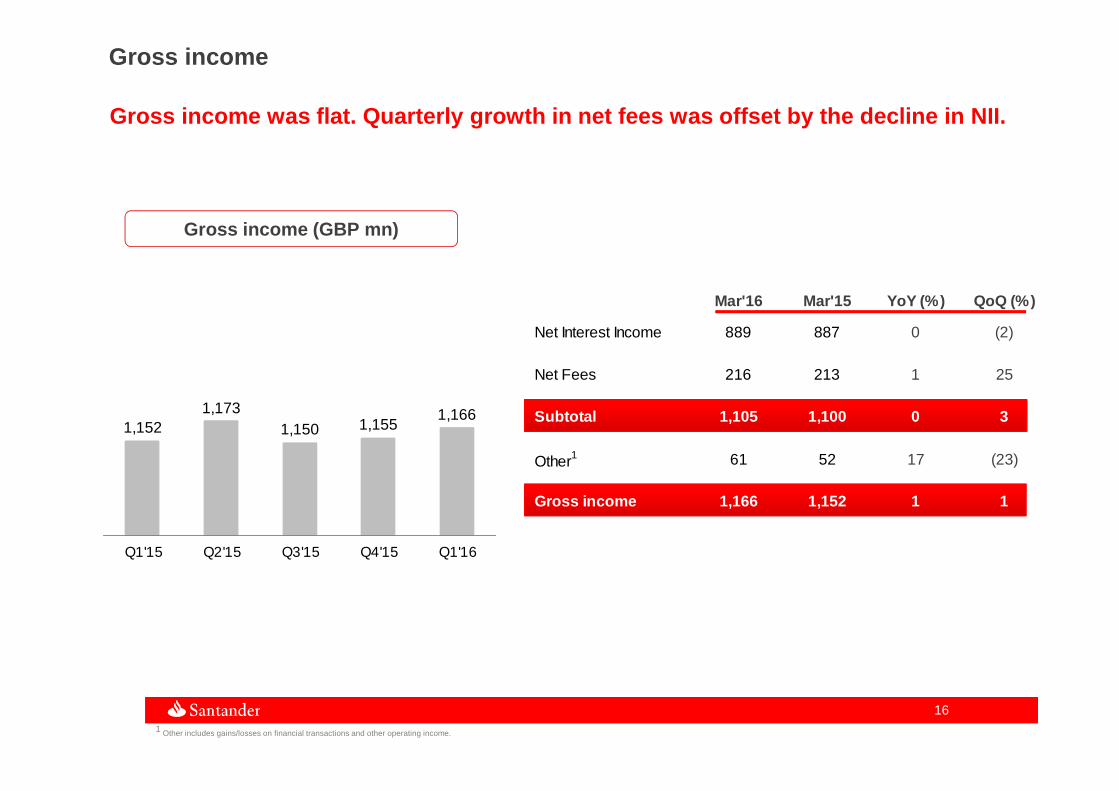
Gross income
Gross income was flat. Quarterly growth in net fees was offset by the decline in NII.
Gross income (GBP mn)
01/03/2016 01/03/2015
Mar'16 Mar'15 YoY (%) QoQ (%)
Net Interest Income 889 887 0 (2)
Net Fees 216 213 1 25
Subtotal 1,105 1,100 0 3
Other1 61 52 17 (23)
Gross income 1,166 1,152 1 1
1,1521,173
1,150 1,1551,166
Q1'15 Q2'15 Q3'15 Q4'15 Q1'16
1 Other includes gains/losses on financial transactions and other operating income.as Corporate & Institutional Banking (‘CIB’)
1717
agencies
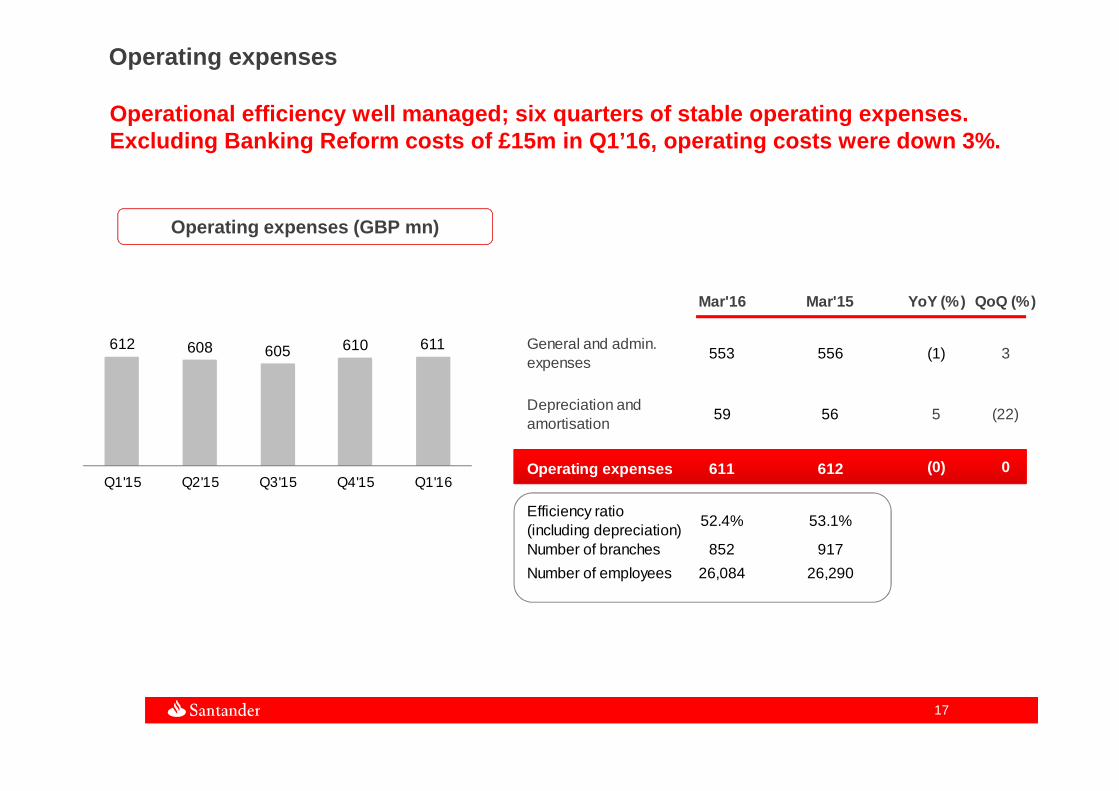
Operating expenses
Operational efficiency well managed; six quarters o f stable operating expenses.Excluding Banking Reform costs of £15m in Q1’16, op erating costs were down 3%.
Operating expenses (GBP mn)
Mar'16 Mar'15 YoY (%) QoQ (%)
General and admin. expenses
553 556 (1) 3
Depreciation and amortisation
59 56 5 (22)
Operating expenses 611 612 (0) 0
Efficiency ratio (including depreciation)
52.4% 53.1%
Number of branches 852 917
Number of employees 26,084 26,290
612 608 605 610 611
Q1'15 Q2'15 Q3'15 Q4'15 Q1'16
1818
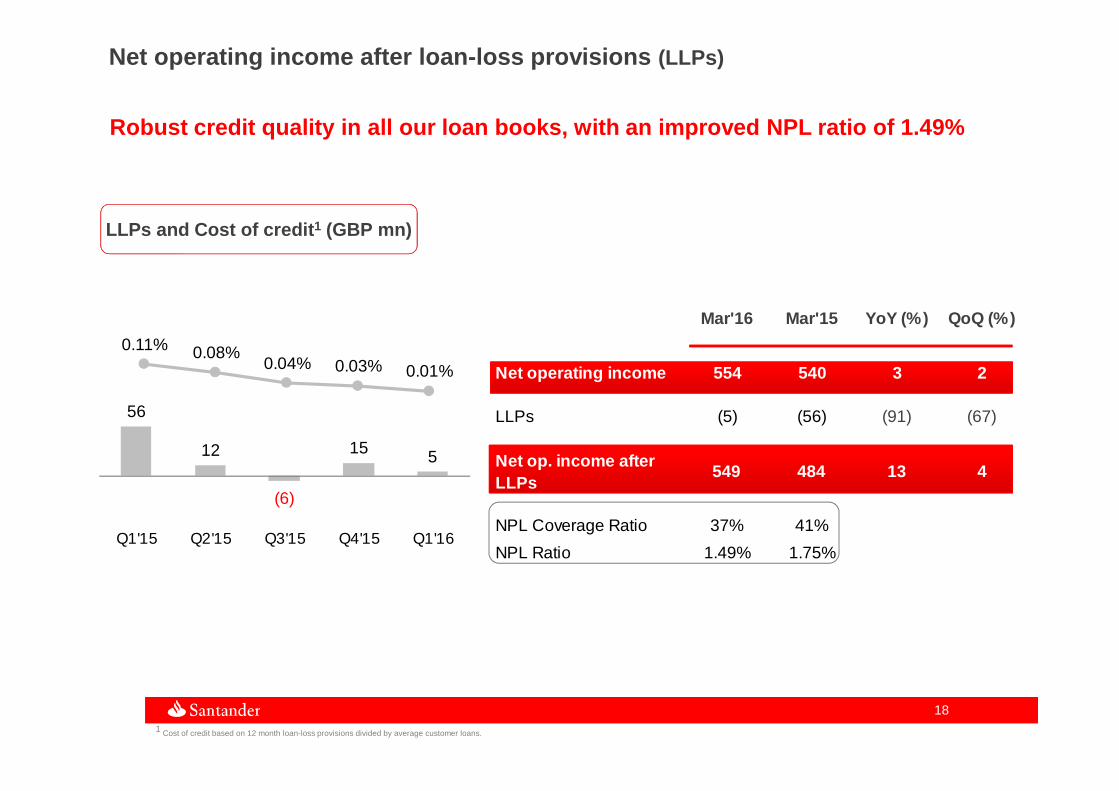
Net operating income after loan-loss provisions (LLPs)
Robust credit quality in all our loan books, with a n improved NPL ratio of 1.49%
LLPs and Cost of credit 1 (GBP mn)
1 Cost of credit based on 12 month loan-loss provisions divided by average customer loans.& Institutional Banking (‘CIB’)
Mar'16 Mar'15 YoY (%) QoQ (%)
Net operating income 554 540 3 2
LLPs (5) (56) (91) (67)
Net op. income after LLPs
549 484 13 4
NPL Coverage Ratio 37% 41%
NPL Ratio 1.49% 1.75%
56
12
(6)
15 5
Q1'15 Q2'15 Q3'15 Q4'15 Q1'16
0.11% 0.08%0.04% 0.03% 0.01%
1919
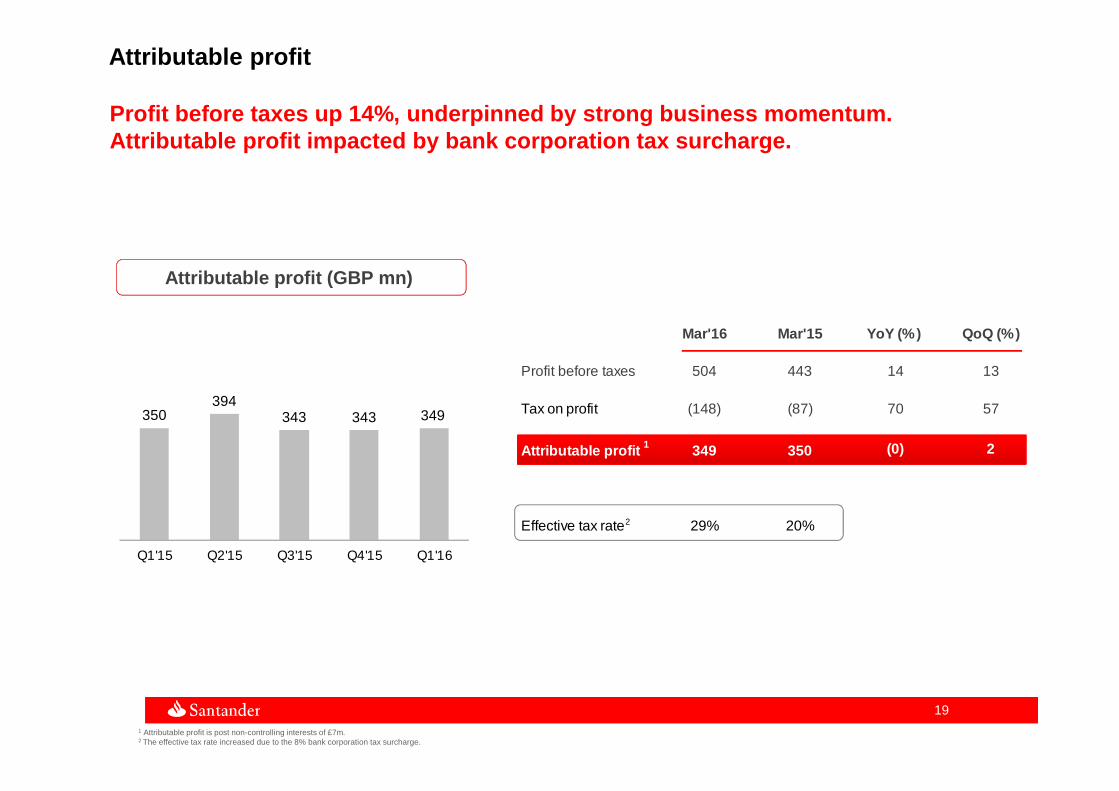
Mar'16 Mar'15 YoY (%) QoQ (%)
Profit before taxes 504 443 14 13
Tax on profit (148) (87) 70 57
Attributable profit 1 349 350 (0) 2
Effective tax rate 29% 20%
350394
343 343 349
Q1'15 Q2'15 Q3'15 Q4'15 Q1'16
1 Attributable profit is post non-controlling interests of £7m.2 The effective tax rate increased due to the 8% bank corporation tax surcharge.
Attributable profit
Profit before taxes up 14%, underpinned by strong b usiness momentum.Attributable profit impacted by bank corporation ta x surcharge.
Attributable profit (GBP mn)
2
2020
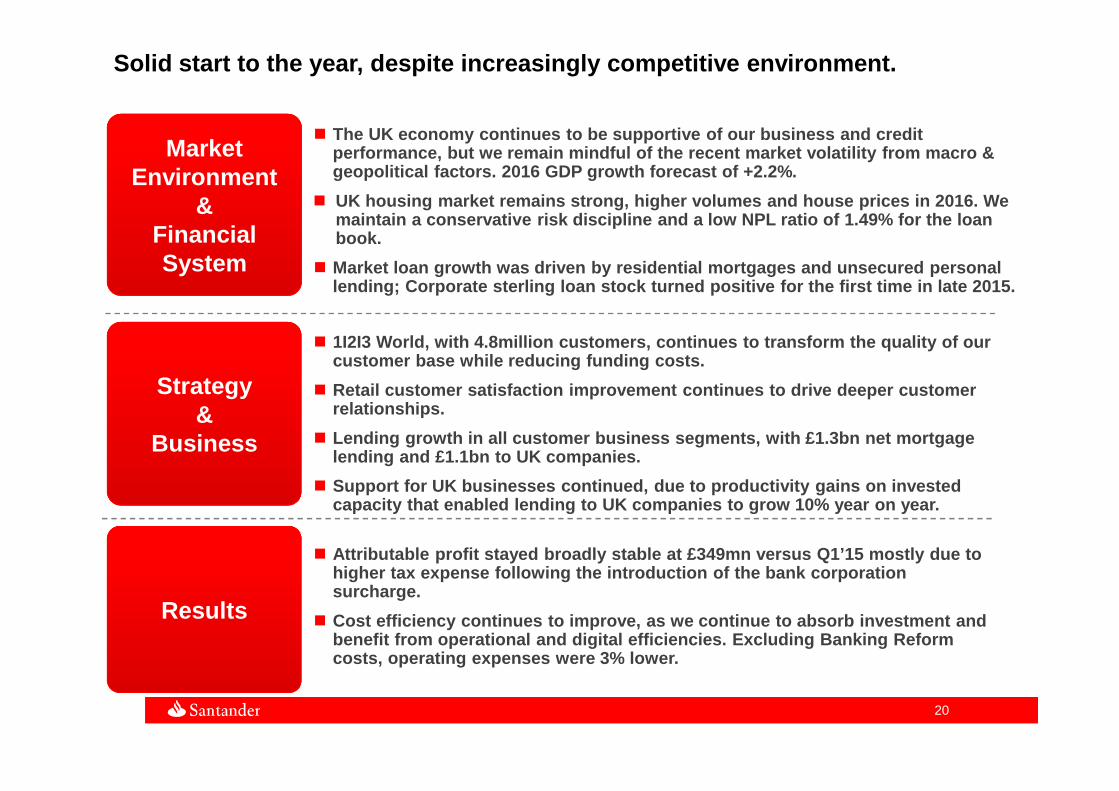
Solid start to the year, despite increasingly compe titive environment.
� The UK economy continues to be supportive of our bu siness and credit performance, but we remain mindful of the recent ma rket volatility from macro & geopolitical factors. 2016 GDP growth forecast of + 2.2%.
� UK housing market remains strong, higher volumes an d house prices in 2016. We maintain a conservative risk discipline and a low N PL ratio of 1.49% for the loan book.
� Market loan growth was driven by residential mortga ges and unsecured personal lending; Corporate sterling loan stock turned positi ve for the first time in late 2015.
Market Environment
& Financial System
Strategy &
Business
Results
� 1I2I3 World, with 4.8million customers, continues t o transform the quality of our customer base while reducing funding costs.
� Retail customer satisfaction improvement continues to drive deeper customer relationships.
� Lending growth in all customer business segments, w ith £1.3bn net mortgage lending and £1.1bn to UK companies.
� Support for UK businesses continued, due to product ivity gains on invested capacity that enabled lending to UK companies to gr ow 10% year on year.
� Attributable profit stayed broadly stable at £349mn versus Q1’15 mostly due to higher tax expense following the introduction of th e bank corporation surcharge.
� Cost efficiency continues to improve, as we continu e to absorb investment and benefit from operational and digital efficiencies. Excluding Banking Reform costs, operating expenses were 3% lower.
Agenda
■ Macro-economic environment and financial system
■ Strategy and business
■ Results
■ Appendix
2222
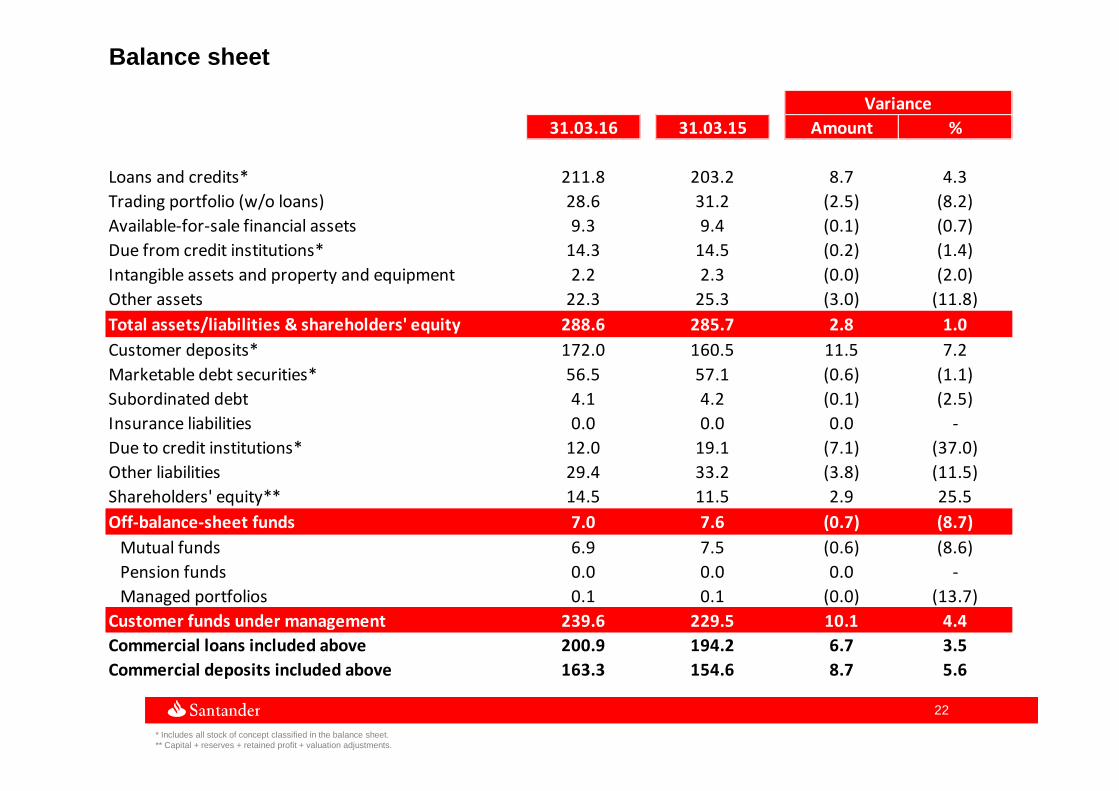
Balance sheet
31.03.16 31.03.15 Amount %
Loans and credits* 211.8 203.2 8.7 4.3
Trading portfolio (w/o loans) 28.6 31.2 (2.5) (8.2)
Available-for-sale financial assets 9.3 9.4 (0.1) (0.7)
Due from credit institutions* 14.3 14.5 (0.2) (1.4)
Intangible assets and property and equipment 2.2 2.3 (0.0) (2.0)
Other assets 22.3 25.3 (3.0) (11.8)
Total assets/liabilities & shareholders' equity 288.6 285.7 2.8 1.0
Customer deposits* 172.0 160.5 11.5 7.2
Marketable debt securities* 56.5 57.1 (0.6) (1.1)
Subordinated debt 4.1 4.2 (0.1) (2.5)
Insurance liabilities 0.0 0.0 0.0 -
Due to credit institutions* 12.0 19.1 (7.1) (37.0)
Other liabilities 29.4 33.2 (3.8) (11.5)
Shareholders' equity** 14.5 11.5 2.9 25.5
Off-balance-sheet funds 7.0 7.6 (0.7) (8.7)
Mutual funds 6.9 7.5 (0.6) (8.6)
Pension funds 0.0 0.0 0.0 -
Managed portfolios 0.1 0.1 (0.0) (13.7)
Customer funds under management 239.6 229.5 10.1 4.4
Commercial loans included above 200.9 194.2 6.7 3.5
Commercial deposits included above 163.3 154.6 8.7 5.6
Variance
* Includes all stock of concept classified in the balance sheet.** Capital + reserves + retained profit + valuation adjustments.
2323
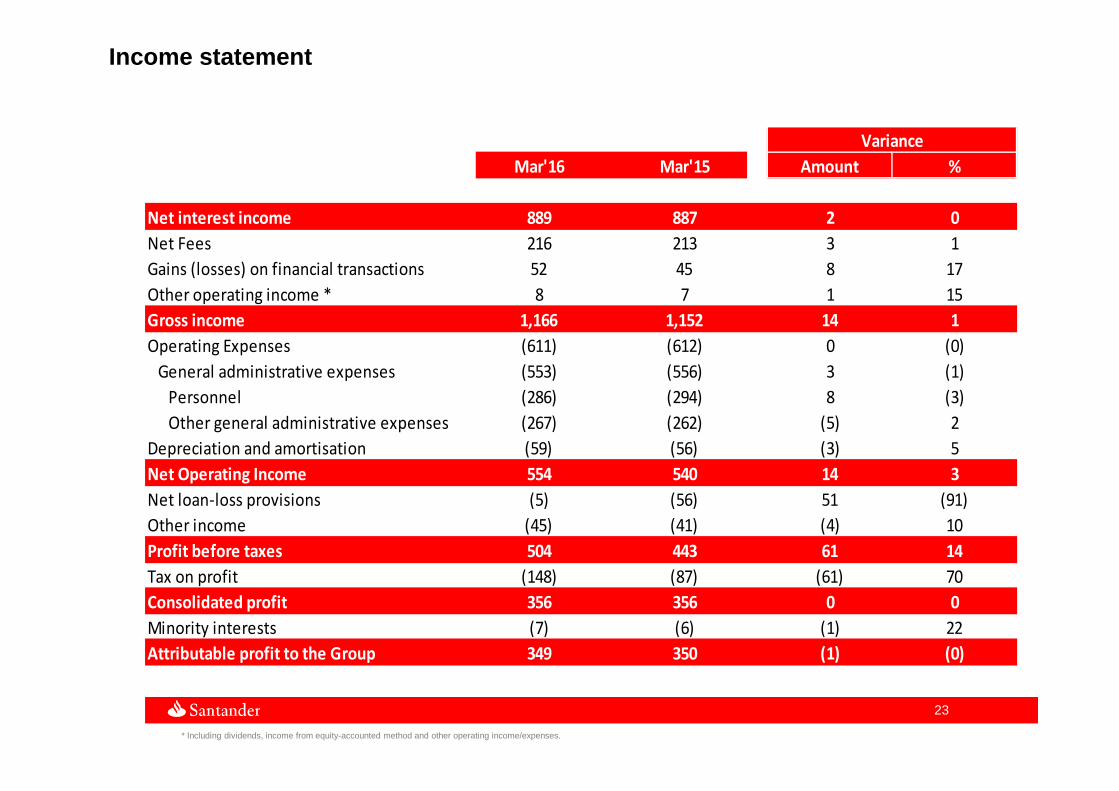
Income statement
Mar'16 Mar'15 Amount %
Net interest income 889 887 2 0
Net Fees 216 213 3 1
Gains (losses) on financial transactions 52 45 8 17
Other operating income * 8 7 1 15
Gross income 1,166 1,152 14 1
Operating Expenses (611) (612) 0 (0)
General administrative expenses (553) (556) 3 (1)
Personnel (286) (294) 8 (3)
Other general administrative expenses (267) (262) (5) 2
Depreciation and amortisation (59) (56) (3) 5
Net Operating Income 554 540 14 3
Net loan-loss provisions (5) (56) 51 (91)
Other income (45) (41) (4) 10
Profit before taxes 504 443 61 14
Tax on profit (148) (87) (61) 70
Consolidated profit 356 356 0 0
Minority interests (7) (6) (1) 22
Attributable profit to the Group 349 350 (1) (0)
Variance
* Including dividends, income from equity-accounted method and other operating income/expenses.
2424
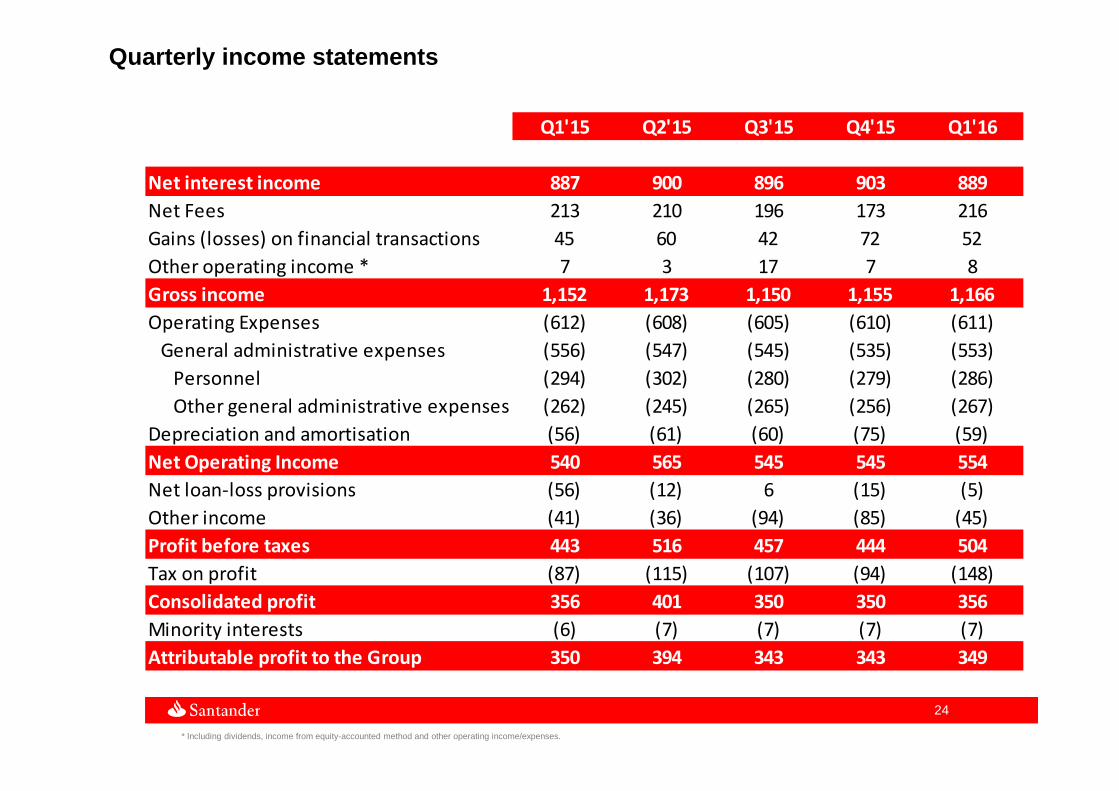
Quarterly income statements
* Including dividends, income from equity-accounted method and other operating income/expenses.
Q1'15 Q2'15 Q3'15 Q4'15 Q1'16
Net interest income 887 900 896 903 889
Net Fees 213 210 196 173 216
Gains (losses) on financial transactions 45 60 42 72 52
Other operating income * 7 3 17 7 8
Gross income 1,152 1,173 1,150 1,155 1,166
Operating Expenses (612) (608) (605) (610) (611)
General administrative expenses (556) (547) (545) (535) (553)
Personnel (294) (302) (280) (279) (286)
Other general administrative expenses (262) (245) (265) (256) (267)
Depreciation and amortisation (56) (61) (60) (75) (59)
Net Operating Income 540 565 545 545 554
Net loan-loss provisions (56) (12) 6 (15) (5)
Other income (41) (36) (94) (85) (45)
Profit before taxes 443 516 457 444 504
Tax on profit (87) (115) (107) (94) (148)
Consolidated profit 356 401 350 350 356
Minority interests (6) (7) (7) (7) (7)
Attributable profit to the Group 350 394 343 343 349
Nuestra misión es contribuir al progreso de las personas y de las empresas.
Nuestra cultura se basa en la creencia de que todo lo que hacemos debe ser
Thank you
Our purpose is to help people and businesses prosper.
Our culture is based on the belief that everything we do should be