Embed Size (px)
Citation preview
14th Annual Report and Survey of Biopharmaceutical Manufacturing Capacity and ProductionA Study of Biotherapeutic Developers and Contract Manufacturing Organizations
April 2017
BioPlan Associates, Inc.2275 Research Blvd., Suite 500Rockville, MD 20850 USA301.921.5979www.bioplanassociates.com
Copyright ©2017 by BioPlan Associates, Inc.
All rights reserved. Unauthorized reproduction strictly prohibited.
associates, inc.
Report and Survey of Biopharmaceutical Manufacturing Capacity and Production
WWW.BIOPLANASSOCIATES.COMii
14th Annual Report and Survey of Biopharmaceutical Manufacturing Capacity and ProductionA Study of Biotherapeutic Developers and Contract
Manufacturing Organizations
April 2017
BioPlan Associates, Inc.
2275 Research Blvd, Suite 500
Rockville MD 20850
301-921-5979
www.bioplanassociates.com
Copyright © 2017 by BioPlan Associates, Inc.
All rights reserved, including the right of reproduction in whole or in part in any form. No part of this publication may be reproduced, stored in a retrieval system, or transmitted in any form or by any means, electronic, mechanical, photocopying, recording or otherwise, without the written permission of the publisher.
For information on special discounts or permissions contact
BioPlan Associates, Inc. at 301-921-5979, or [email protected]
Managing Editor: Eric S. Langer
Project Director: Donnie E. Gillespie
Assistant Editor: Ronald A. Rader
Layout and Cover Design: ES Design
IS BN 978-1-934106-32-7
FRONT COVER: Pre-validated, pre-assembled and pre-sterilized single-use fi lling systems, developed by Bosch Packaging
Technology in cooperation with Sartorius Stedim Biotech (SBB). Photo copyright © Bosch.
©2017 BIOPLAN ASSOCIATES, INC. • NO UNAUTHORIZED REPRODUCTION PERMITTED • ALL RIGHTS RESERVED iii
AC K N O W L E D G M E N TWe wish to recognize our sponsoring institutions, and our media sponsors. Their efforts in assuring the cooperation and participation in the survey of their respective memberships helped guarantee the large group of survey participants to ensure data accuracy.
Our Institution Partners, all of whom contributed their time and effort to ensure the broad, international coverage of this project, include:
■ AusBiotech (Malvern, Victoria, Australia)
■ ABO China (Beijing, China)
■ Beijing Pharma and Biotech Center (Beijing, China)
■ BIO (Biotechnology Industry Organization, Washington, D.C.)
■ Bio-Process Systems Alliances/SOCMA (BPSA) (Washington, D.C.)
■ BioMaryland (Rockville, MD)
■ California Life Sciences Association (CLSA) (San Francisco, CA)
■ Colorado BioScience Association (Denver, CO)
■ KTN (Knowledge Transfer Network) (London, United Kingdom)
■ D2L Pharma (Bangalore, India)
■ EuropaBio (Brussels, Belgium)
■ Massachusetts Biotechnology Council (Cambridge, MA)
■ Ma ssachusetts Life Sciences Center (Waltham, MA)
■ MichBio (Ann Arbor, MI)
■ North Carolina BioSciences Organization (Research Triangle Park, NC)
■ North Carolina Biotechnology Center (Research Triangle Park, NC)
■ Pharma & Biopharma Outsourcing Association (PBOA) (Ringwood, NJ)
■ San Diego Biotechnology Network (SDBN) (San Diego, CA)
■ Washington Biotechnology & Biomedical Association (WBBA) (Seattle, WA)
To ensure global coverage for this project, we again invited major Media Sponsors to support our outreach to biopharmaceutical decision-makers. Our media sponsors, who helped ensure broad and representative coverage of industry participation, include:
■ American Pharmaceutical Review (South San Francisco, CA)
■ BioPharm International (Iselin, NJ)
■ BioProcess International, (Westborough, MA)
■ BioProcessing Journal (Norfolk, VA)
■ Contract Pharma, (Ramsey, NJ)
■ Genetic Engineering and Biotechnology News (New Rochelle, NY)
■ Life Science Leader (Erie, PA)
■ Pharmaceutical Manufacturing (Schaumburg, IL)
■ Pharmaceutical Outsourcing (Fishers, IN)
■ Pharmaceutical Processing (Rockaway, NJ)
■ Pharmaceutical Technology (Iselin, NJ)
■ Pharmaceutical Technology Europe (Iselin, NJ)
Report and Survey of Biopharmaceutical Manufacturing Capacity and Production
WWW.BIOPLANASSOCIATES.COMiv
The early participation of our authors and sponsors in evaluating the areas and trends to be surveyed this year ensured the project was designed to cover the most relevant issues in biopharmaceutical manufacturing today. As always, their continued support was critical to the success of the project.
Eric S. Langer
Editor
©2017 BIOPLAN ASSOCIATES, INC. • NO UNAUTHORIZED REPRODUCTION PERMITTED • ALL RIGHTS RESERVED v
A B O U T B I O P L A N A S S O C I AT E S , I N C . BioPlan Associates, Inc. is a biotechnology and life sciences market analysis, research, and publishing organization. We have managed biotechnology, biopharmaceutical, diagnostic, and life sciences research projects for companies of all sizes for almost 30 years. Our extensive market analysis, research and management project experience covers biotechnology and biopharmaceutical manufacturing, vaccine and therapeutic development, contract research services, diagnostics, devices, biotechnology supply, physician offi ce labs and hospital laboratory environments.
We prepare custom studies, and provide public information our clients require to make informed strategic decisions, defi ne objectives, and identify customer needs. With market information, our clients are better able to make informed, market-based decisions because they understand the trends and needs in high technology industries.
BioPlan Associates, Inc. 2275 Research Blvd., Suite 500Rockville, MD 20850 USAwww.bioplanassociates.com Tel: 301-921-5979
Report and Survey of Biopharmaceutical Manufacturing Capacity and Production
WWW.BIOPLANASSOCIATES.COMvi
E D I T O REric S. Langer, MS, President, BioPlan Associates, Inc.Mr. Langer is President and Managing Partner and President of BioPlan Associates, Inc., a biotechnology and life sciences consulting company that has been providing management and market strategy services, and technology analysis to biopharmaceutical and healthcare organizations since 1989. He has over 25 years’ experience in biotechnology and life sciences management and market assessment. He is an experienced medical and biotechnology industry practitioner, strategist, researcher, and science writer. He has held senior management and marketing positions at biopharmaceutical supply companies. He teaches Biotechnology Marketing, Marketing Management, Services Marketing, Advertising Strategy, and Bioscience Communication at Johns Hopkins University, American University, and lectures extensively on pricing and channel management topics. Mr. Langer has a degree in Chemistry and a Masters in International Business. He has written and consulted extensively for companies involved in: large scale biopharmaceutical manufacturing, global biotechnology in China, Asia, and the Middle East; he has expertise in cell culture markets, media, sera, tissue engineering, stem cells, diagnostic products, blood products, genetics, DNA/PCR purifi cation, blood components, and many other areas.
Ronald A. Rader, Senior Research DirectorMr. Ronald A. Rader has written and edited dozens of books and studies on biotechnology topics. He created the fi rst biosimilars pipeline database, and is qualifi ed with a B.S. (Microbiology), M.L.S. (Library Science). He has nearly 30 years’ experience as a biotechnology, pharmaceutical and chemical information specialist and publisher. From 1988, he was Editor/Publisher of the Antiviral Agents Bulletin, the only periodical specializing in antiviral/HIV drug and vaccine development. In 1994, he published the Federal Bio-Technology Transfer Directory, abstracting and indexing all federal laboratory, e.g., NIH, inventions and technology transfers in biotech/biomedical areas, further marketed as an online database until 2000. Mr. Rader published Biopharmaceutical Products in the U.S. Market fi rst in April 2001. Mr. Rader has been Manager of Information Services, Porton International plc, Prior to that he served as a biomedical/chemical information specialist/manager/analyst with companies including Gillette Medical Evaluation Labs., Gillette Co.; MITRE Corp.; Biospherics; Computer Sciences Corp. (CSC); Technical Resources Inc.; and Bio-Conversion Labs.
©2017 BIOPLAN ASSOCIATES, INC. • NO UNAUTHORIZED REPRODUCTION PERMITTED • ALL RIGHTS RESERVED vii
14th Annual Report and Survey of Biopharmaceutical Manufacturing Capacity and Production • April 2017A Study of Biotherapeutic Developers and Contract
Manufacturing Organizations
CONTENTSMETHODOLOGY ............................................................................................................xxiv
CHAPTER 0: DEMOGRAPHICS .......................................................................................... 1
Introduction ......................................................................................................................... 1
0-1 Respondents’ Area of Involvement ........................................................................... 1
0-2 Respondents Qualifi cations ...................................................................................... 4
0-3 Facility Locations .......................................................................................................6
0-4 Areas of Biopharmaceutical Manufacturing Operations ........................................ 8
0-5 Production Operations, Phase of Development .................................................... 10
0-6 Employees at Facility ............................................................................................... 13
0-7 Batches Run at Facility per Year ............................................................................. 14
0-8 Single Use Bioreactor Capacity, In Use at Site ........................................................................................................................ 15
0-9 Stainless Steel Bioreactor Capacity, In Use at Site ............................................... 16
CHAPTER 1: INTRODUCTION AND DISCUSSION ................................................................ 17
1-1 Introduction: The Biopharmaceutical Industry ..................................................... 17
1-2 Current Status and Market Trends .......................................................................... 20
1-3 Market Potential ........................................................................................................23
1-4 Biopharmaceuticals and Biosimilars in the Pipeline ............................................ 25
1-5 Biopharmaceutical Approvals Generic .................................................................. 28
1-6 Global Biopharmaceutical and Recombinant Protein/mAb Markets .................. 31Overall Health of the Biopharmaceutical Sector ........................................................ 32
U.S. Industry Leadership Continues .......................................................................... 34
Biopharmaceuticals in the Rest-of-the-World ............................................................. 35
1-7 Biopharmaceutical Markets by Product Class ...................................................... 38mAbs are the Leading Product Classes .................................................................... 38
Report and Survey of Biopharmaceutical Manufacturing Capacity and Production
WWW.BIOPLANASSOCIATES.COMviii
1-8 Biopharmaceutical Blockbusters ........................................................................... 40
1-9 Commercial Product Expression Systems ............................................................ 42
1-10 Animal Derived Products and Biopharmaceuticals ............................................. 43
1-11 Cost-Containment and Price Controls ................................................................... 43
1-12 Future Trends in the Biopharmaceutical Industry ................................................ 45
1-13 Overview of Biopharmaceutical Market Trends .................................................... 46
CHAPTER 2: Overview of Critical Issues in Bioprocessing ............................................ 51
2-1 China’s Advances in Global Biopharma and Bioprocessing .............................. 52
2-2 I ndia’s Importance to the Global Biopharma Industry ......................................... 59
2-3 Economic Models for Media and Buffer Prep Operations ................................... 65
2-4 Overview of Capacity Utilization and Capacity Trends among CMOs ............... 69
2-5 Demand for Improved Downstream Bioprocessing Technologies ..................... 72
2-6 Cell Therapy and Gene Therapy Manufacturing Capacity Trends ...................... 76
2-7 Current and Future Trends in Biosimilars Manufacturing Costs ........................ 82
2-8 Bioprocessing Demands of Industry Suppliers are Evolving ............................. 86
CHAPTER 3: Emerging Issues in Biopharmaceutical Manufacturing ............................. 89
3-1 Industry Trends in 2017 ........................................................................................... 89Introduction ................................................................................................................ 89
Productivity and Cost Reductions .............................................................................. 90
3-2 Budget Issues in 2017 .............................................................................................. 92Budget Change Comparisons ................................................................................... 95
3-3 Operational Changes ............................................................................................... 98
3-4 New Bioprocessing Products Development Opportunities in 2017 .................... 99Upstream New Product Areas of Need .................................................................... 100
Trends: Upstream New Product Areas of Need 2010-2017 ..................................... 102
Downstream New Product Areas of Need ............................................................... 104
Trends: Downstream New Product Areas of Need 2010-2017 ................................ 105
Other New Product Areas of Need ........................................................................... 107
Trends: Other General New Product Areas of Need 2010-2017 .............................. 109
Innovations in Single-use/Disposable Equipment .....................................................111
Discussion of Needed Single-use Innovations ..........................................................111
Other Areas for Innovation ....................................................................................... 113
New Product Development Areas: Biotherapeutic Developers vs. CMOs .............. 113
New Product Development Areas: U.S. vs. Western Europe and ROW ................. 116
3-5 Factors in Biomanufacturing Creating Improvements ....................................... 118Factors Improving Biomanufacturing Performance, 2010 - 2015 ............................ 118
Factors Improving Biomanufacturing Performance, Biotherapeutic Developers vs. CMOs (2015 Data) .......................................................................... 120
©2017 BIOPLAN ASSOCIATES, INC. • NO UNAUTHORIZED REPRODUCTION PERMITTED • ALL RIGHTS RESERVED ix
TABLE OF CONTENTS / FIGURES AND TABLES
Factors Improving Biomanufacturing Performance, U.S. vs. Western Europe vs. ROW (2015 Data) .................................................................................. 121
3-6 Cost-Cutting Actions & Development Timelines (2016 data) ............................. 122Cost-Cutting Changes: Specifi c to Outsourcing (2016 data) ................................... 124
3-7 Average Cost per Gram Recombinant Protein .................................................... 125
3-8 Assay Development ............................................................................................... 126
3-9 Continuous Bioprocessing Operations Issues ................................................... 128Perfusion vs Batch Fed Bioprocessing .................................................................... 132
3-10 Discussion .............................................................................................................. 134
3-11 Perfusion Operations and Continuous Bioprocessing Trends .......................... 135Continuous Bioprocessing: Trends and Opportunities ............................................. 136
3-12 Selecting Bioreactors in New Facilities ............................................................... 137
3-13 Supplier-End-User Technical Relationships ....................................................... 141
3-14 Discussion: Industry Trends and Issues ........................................................... 142Industry Growth and Adaptation ............................................................................... 142
Cost Cutting Trends ................................................................................................ 142
Trends in Assay Development ................................................................................. 143
Trends in Speeding Development and Approval Timelines ...................................... 143
Trends in Bioprocessing Industry Desires for Improved Products and Services ..... 144
CHAPTER 4: Capacity Utilization ................................................................................. 145
4-1 Capacity Utilization Trends ................................................................................... 145
Capacity Utilization Defi nitions ................................................................................. 145
Relevance of Capacity Utilization ............................................................................ 146
Capacity Utilization in Biomanufacturing, 2017 ........................................................ 147
Capacity Utilization Changes Since 2004 ............................................................... 148
Average Growth Rate in Capacity Utilization, 2006-2017 ........................................ 150
4-2 Capacity Utilization: CMOs vs. Biotherapeutic Developers ............................... 150
4-3 Capacity Utilization: U.S. vs. Western European Manufacturers....................... 153
4-4 Respondents’ Current Total Production Capacity............................................... 154Mammalian Cell Culture ........................................................................................... 154
Estimated Bioreactor Capacity Distribution, Biotherapeutic Developers and CMOs ............................................................................................ 158
Biopharmaceutical Developers/Manufacturers as CMOs ........................................ 160
Microbial Fermentation Capacity ............................................................................. 161
Yeast Production Capacity ....................................................................................... 162
Insect Cells Production Capacity ............................................................................. 162
4-5 Current State of Capacity Utilization .................................................................... 162Future Capacity Issues ............................................................................................ 164
4-6 Range of Titers for mAb Production..................................................................... 165Annual mAb Titer Change, 2008-2017 ..................................................................... 167
Report and Survey of Biopharmaceutical Manufacturing Capacity and Production
WWW.BIOPLANASSOCIATES.COMx
4-7 Discussion: Capacity and Industry Trends .......................................................... 168Capacity Utilization .................................................................................................. 168
CHAPTER 5: Current and Future Capacity Constraints ................................................ 175
5-1 Current Capacity Constraints ............................................................................... 175Respondents Experiencing No Capacity Constraints .............................................. 177
Respondents’ Perception of Capacity Constraints, 2004-2017 ................................ 177
Perception of Capacity Constraints: Biotherapeutic Developers vs. CMOs ........... 179
Capacity Constraints: U.S. vs. Western European Biotherapeutic Developers & CMOs .............................................................................................. 181
5-2 Expected Capacity Constraints ............................................................................ 183Respondents’ Expectations of Capacity Constraints by 2022 .................................. 183
Expected Capacity Constraints by 2022: Comparing 2004 to 2017 Data ................ 185
Expected Capacity Constraints by 2022: CMOs vs. Biotherapeutic Developers .... 187
Expected Capacity Constraints by 2022: U.S. vs. Western Europe......................... 189
5-3 Factors Impacting Future Production Capacity .................................................. 190Factors Creating Future Capacity Constraints ......................................................... 190
Factors Creating Future Capacity Constraints, 2008 vs. 2017 ................................ 192
Factors Creating Future Capacity Constraints: Biotherapeutic Developers vs. CMOs .............................................................................................. 195
CMOs’ Capacity Bottleneck Projections, in Retrospect ........................................... 197
Biotherapeutic Developers’ Capacity Bottleneck Projections, in Retrospect ........... 198
Factors Creating Capacity Constraints: U.S. vs. Western European Respondents 199
5-4 Key Areas to Address to Avoid Future Capacity Constraints ............................ 201Analysis of Areas to Avoid Capacity Constraints: Changing Perspectives, 2006-2017 ......................................................................................... 203
Key areas to Address to Avoid Capacity Constraints; Biotherapeutic Developers vs. CMOs .............................................................................................. 206
Key Areas to Address to Avoid Capacity Constraints: U.S. vs. Western Europe ..... 208
5-5 Discussion ..............................................................................................................210Overall Capacity Constraints ................................................................................... 211
CHAPTER 6: Future Capacity Expansions .................................................................... 215
6-1 Planned Future Capacity Expansions .................................................................. 215Planned Future Capacity Expansions, 2009-2022 ................................................... 216
Planned Future Capacity Expansions by 2022; CMOs vs. Biotherapeutic Developers ............................................................................................................... 218
Planned Five-Year Capacity Expansions; U.S. vs. Western European Manufacturers .......................................................................................................... 219
Planned Future Capacity Expansions of >100% ...................................................... 220
©2017 BIOPLAN ASSOCIATES, INC. • NO UNAUTHORIZED REPRODUCTION PERMITTED • ALL RIGHTS RESERVED xi
TABLE OF CONTENTS / FIGURES AND TABLES
CHAPTER 7: Outsourcing Trends in Biopharmaceutical Manufacturing ..................... 223Why Outsource? ...................................................................................................... 223
Strategic Manufacturing Planning ............................................................................ 224
Future Projections .................................................................................................... 225
7-1 Current Outsourcing by Production System ....................................................... 225Facilities Currently Outsourcing No Production (All Production “In-house”), 2006-2017 ................................................................................................................ 229
7-2 Future Outsourcing ................................................................................................ 231Biotherapeutic Developers’ Outsourcing, 2022 Projections, by System .................. 231
Biotherapeutic Developers Outsourcing Some Production in 2022 ......................... 232
7-3 Outsourced Activities in Biopharmaceutical Manufacturing ............................. 234Comparison of Biomanufacturers’ Outsourcing, (2010-2017) .................................. 236
Increased Outsourced Activities, 24-month Projections .......................................... 238
Outsourcing Activities Projected at ‘Signifi cantly Higher Levels’, Comparison of 2010-2017 Trends ............................................................................................... 240
Average Percentage of Activities Outsourced Today ............................................... 242
Comparison of Outsourcing Activities, 2010-2017 ................................................... 244
Change in Spending on Outsourcing Activities ........................................................ 247
7-4 Critical Outsourcing Issues ................................................................................... 249Selecting a CMO: 2017 ........................................................................................... 249
Selecting a CMO, 2006-2017 ................................................................................... 251
Changes in Critical Issues when Considering a CMO, 2008-2017 .......................... 253
7-5 CMOS’ Problems with Their Clients ...................................................................... 255
7-6 Country Selections for International Outsourcing (Off-shoring) of Biomanufacturing .................................................................................................. 257U.S. vs. Western European Respondents’ Outsourcing Destinations ..................... 259
Western European Respondents’ Outsourcing Destinations ................................... 264
5-Year Projection for Biomanufacturing International Outsourcing/Off-shoring ....... 267
7-7 Offshoring Trends .................................................................................................. 2695-Year Projection for Percentages of Biomanufacturing International Outsourcing/Off-shoring ........................................................................................... 271
7-8 Discussion of Outsourcing and Offshoring ......................................................... 273Selecting a CMO ...................................................................................................... 277
CHAPTER 8: Disposables and Single-Use Systems in Biopharmaceutical Manufacturing ............................................................................................................ 281
8-1 Use of Disposables and Single-Use Systems ..................................................... 281Disposables Applications in Biopharmaceutical Manufacturing ............................... 282
Trends in Disposable Applications: 2006-2017 ........................................................ 284
Annual Growth Rate for Disposables Market Penetration/Usage ............................ 28610-year Growth in Disposables Applications, Percentage-point Gains .................... 287
Disposable Use by Stage of Production/Application ............................................... 289
Use of Disposables: CMOs vs. Biotherapeutic Developers .................................... 291
Report and Survey of Biopharmaceutical Manufacturing Capacity and Production
WWW.BIOPLANASSOCIATES.COMxii
8-2 Leachables and Extractables ................................................................................ 293Paying for L&E Testing, 2015 vs 2016 ..................................................................... 293
8-3 Reasons for Increasing Use of Disposables & Single-Use Systems ................ 295Reasons for Increased Use of Disposables, 2006 through 2015 ............................ 297
Reasons for Increased Use of Disposables: Biotherapeutic Developers vs. CMOs .............................................................................................. 299
Single Most Critical Reason for Increasing the Use of Disposables ........................ 300
8-4 Factors That May Restrict Use of Disposables .................................................. 302Factors That May Restrict Use of Disposables: Trends 2006-2015 ......................... 304
Factors that May Restrict Use of Disposables: CMO’s vs. Biotherapeutic Developers ............................................................................................................... 306
Most Critical Reasons for Restricting Use of Disposables ....................................... 307
Most Important Reasons for Not Increasing Use of Disposables, 2008-2017 ......... 309
Most Important Reasons for Restricting Use of Disposables: Biotherapeutic
Developer vs. CMO ................................................................................................. 311
Top Reasons for Not Increasing the Use of Disposables: U.S. vs. Western Europe Respondents ............................................................................................... 313
8-5 Standards Setting for Disposable, Single-use Systems ..................................... 315Standardizing Single-use Designs ........................................................................... 315
Standardization Factors, 2013-2015 ........................................................................ 316
Suppliers’ Expectations for Standards Setting Bodies ............................................. 318
8-6 Budgets for Disposable Systems ......................................................................... 320
8-7 Need for Single-use Sensors, and Bioreactor Attributes ................................... 321Single-Use Adoption Issues ..................................................................................... 321
Single-use Adoption Factors, U.S. vs Western Europe ............................................ 322
Single-Use Sensor Technologies ............................................................................. 323
8-8 Recycling and Disposal of Single-use Plastics ................................................... 325Waste Disposal of Single-use Devices .................................................................... 325
Meeting Respondents’ Demands for Recycling ....................................................... 326
8-9 Satisfaction with Single-use Device Vendors ..................................................... 327Single-Use Attribute Importance Analysis ................................................................ 329
Single-use Suppliers’ Delivery Problems, 2013-2017 ............................................. 331
8-10 Single Use Operations and Trends ....................................................................... 333Percentage of Unit Operations that are Single-Use ................................................. 333
Distribution of Responses ........................................................................................ 334
8-11 Discussion of Single-use Bioprocessing ............................................................. 336Single-use Advantages ............................................................................................ 336
Growth in the Use of Single-use Systems ............................................................... 337
Downstream Single-use Systems Use ..................................................................... 338
CMOs’ Use of Single-use Equipment ....................................................................... 338
Downstream Bottlenecks Persist ............................................................................. 339
Modular: The Next Trend after Single-Use .............................................................. 339
Single-use Equipment Sourcing, Quality Issues, and L&E Testing .......................... 340
©2017 BIOPLAN ASSOCIATES, INC. • NO UNAUTHORIZED REPRODUCTION PERMITTED • ALL RIGHTS RESERVED xiii
TABLE OF CONTENTS / FIGURES AND TABLES
CHAPTER 9: Downstream Purifi cation ........................................................................ 345
9-1 Impact of Downstream Processing on Capacity ................................................. 345Impact of Downstream Processing on Capacity, Biopharmaceutical Developers vs. CMOs ............................................................................................. 348
Impact of Downstream Processing on Capacity, U.S. vs. Western European Biomanufacturers ..................................................................................................... 349
9-2 Specifi c Purifi cation Step Constraints ................................................................. 352Changes in Impact on Capacity of Purifi cation Steps, 2008-2017 ........................... 353
Specifi c Purifi cation Step Constraints, U.S. vs. Western European Biomanufacturers ..................................................................................................... 354
9-3 Downstream Purifi cation Issues ........................................................................... 355Protein A and Alternatives ........................................................................................ 355
Changes in Perception of Protein A and Alternatives ............................................... 356
Protein A Downstream Purifi cation Issues, U.S. vs. Western Europe ...................... 358
9-4 mAb Purifi cation Capacity Estimates .................................................................. 359Upstream Production Titer vs. Max Capacity ........................................................... 359
9-5 New Downstream Processing Technologies ....................................................... 361New Downstream Processing Solutions; 2010 – 2017 ............................................ 363
New Downstream Processing Technologies; Biotherapeutic Developers vs. CMOs .............................................................................................. 365
New Downstream Processing Technologies; U.S. vs. Western Europe .................. 367
9-6 Improvements to Downstream Operations .......................................................... 369Comparison of New Downstream Technology Implementation; Biomanufacturers vs. CMOs .................................................................................... 371
Comparison of New Downstream Technology Investigations; U.S. vs. W. Europe vs. ROW ................................................................................... 373
9-7 Discussion .............................................................................................................. 375Upstream Expression Titer Trends and Impact on Downstream Operations ........... 375
Downstream Processing Solutions .......................................................................... 375
CHAPTER 10: Quality Issues, Batch Failures, and PAT in Biopharmaceutical Manufacturing ............................................................................................................ 379
10-1 Hurdles to Implementing Process Analytical Technology ................................. 380Trends in PAT, 2008-2017 ........................................................................................ 380
PAT Adoption Will Increase ...................................................................................... 382
10-2 Batch Failure Frequency in Biopharmaceutical Manufacturing ........................ 383
10-3 Primary Cause of Batch Failures, Percentages of Failures ............................... 386
10-4 Quality Problems in BioManufacturing Attributed to Vendors .......................... 391
10-5 Automation Implementation ................................................................................. 393Comparison of Implementation Plans 2009 - 2013 .................................................. 393
10-6 Quality Initiative Implementation ......................................................................... 394Comparison of Quality Initiative Implementation, 2009 - 2017 ................................ 396
Report and Survey of Biopharmaceutical Manufacturing Capacity and Production
WWW.BIOPLANASSOCIATES.COMxiv
10-7 Global Quality Supply Management .................................................................... 398Quality Supply Management-U.S. vs. W. Europe .................................................... 398
10-8 Discussion ..............................................................................................................399Hurdles Hindering Implementation of PAT ............................................................... 399
Batch Failures Due to Single-Use Adoption or Continued Stainless Steel Use? ..... 400
Quality Problems Traced to Vendors ....................................................................... 401
Process Information Needs and Value Drive Automation ....................................... 401
Quality Initiatives Are Becoming Commonplace and the New Industry Norm ......... 401
Challenges to Implementing PAT, QbD and other Quality Initiatives ........................ 402
Supply Management Issues with Single-Use Systems ............................................ 402
CHAPTER 11: Hiring, Employment Growth, and Training in BiopharmaceuticalManufacturing ............................................................................................................ 403
Introduction .............................................................................................................. 403
11-1 Hiring Trends .......................................................................................................... 404Trends in New Hires, by Area; 2008 - 2017 ............................................................. 404
11-2 Hiring in 2022: 5-year Trends ................................................................................ 406
11-3 Hiring Challenges Today........................................................................................ 407Hiring Diffi culties; 2010 - 2017 ................................................................................. 409
Hiring Diffi culties: U.S. vs. Western Europe ............................................................. 411
U.S. vs. Western Europe Hiring Trends ................................................................... 411
11-4 Training in Biopharmaceutical Manufacturing .................................................... 413Changes in Training for New Manufacturing Employees, 2009 - 2017 .................... 414
11-5 Discussion ............................................................................................................. 415Options Developing for Bioprocessing Training ....................................................... 415
Continued Growth in Biopharmaceutical Manufacturing Jobs ................................. 416
CHAPTER 12: Fill and Finish ........................................................................................ 419Introduction .............................................................................................................. 419
12-1 Demographics ........................................................................................................ 419Areas of Involvement ............................................................................................... 419
Geographic Location, Facilities ................................................................................ 420
12-2 Trends in Fill-Finish and Related Bioprocessing Capacity .............................. 420Analysis of US and European In-house Capacity and Capacity Utilization ............ 420
Challenges in Estimating Fill-Finish Capacity ......................................................... 422
12-3 Current Fill-Finish Trends ...................................................................................... 422Recent Industry Trends .......................................................................................... 424
Future Fill and Finish Trends ................................................................................... 425
Suppliers’ Innovation Trends .................................................................................... 425
Industry Capacity Data ............................................................................................. 426
New Technology Implementation in Fill-Finish ......................................................... 427
12-4 Discussion .............................................................................................................. 428Voice of Industry ...................................................................................................... 428
©2017 BIOPLAN ASSOCIATES, INC. • NO UNAUTHORIZED REPRODUCTION PERMITTED • ALL RIGHTS RESERVED xv
TABLE OF CONTENTS / FIGURES AND TABLES
CHAPTER 13: Suppliers to Biopharmaceutical Manufacturing and Life Sciences ....... 429Introduction .............................................................................................................. 429
13-1 Demographics ........................................................................................................ 429Areas of Involvement ............................................................................................... 429
Location of Vendor Sales ........................................................................................ 432
Respondents’ Primary Job ...................................................................................... 434
13-2 Growth Rate of Sales by Suppliers ...................................................................... 435Average Industry Growth Rate, By Segment ........................................................... 436
Vendor Sales Growth Rates, by Industry Segment, 2007 to 2017 ........................... 437
Supplier Annual Sales, Distribution .......................................................................... 439
13-3 Discussion of Vendor and Industry Growth ....................................................... 440
13-4 Budget Issues and Problems Faced by Industry Suppliers ............................... 441Budget Challenges in 2017 ...................................................................................... 441
Vendor Average Budget Changes for 2009 - 2017 .................................................. 443
Vendor Pricing Changes .......................................................................................... 445
Future Price Changes .............................................................................................. 446
Supplier Budget Issues ............................................................................................ 448
13-5 Cost Cutting Actions by Vendors ......................................................................... 448Cost Cutting Actions, By Segment ........................................................................... 450
13-6 Problems Clients Have with Their Vendors ......................................................... 452
13-7 Vendor Expansion Plans ....................................................................................... 454Biopharma Vendor Business Trends, 2010 - 2017 .................................................. 456
13-8 New Technology Areas in Development by Vendors ......................................... 458Suppliers’ Development of Innovative Technologies ............................................... 464
Suppliers’ R&D Budget Spending for Innovative Technologies ............................... 465
13-9 Sales Staff Training ............................................................................................... 466Days of Training Provided ....................................................................................... 466
Areas where Training May Help Sales Staff Perform, Trends 2010 - 2017 .............................................................................................................. 466
Clients’ Demands on Vendors .................................................................................. 468
13-10 Biopharma Vendors’ Financial Outlook for 2017 ............................................... 470
13-11 Discussion of Biopharma Suppliers .................................................................... 472Bioprocessing Vendors Will See Continued Market Growth .................................... 472
Single-use Systems Are Increasingly Driving Sales ................................................ 472
Trends Favor Increased Vendor Sales ..................................................................... 473
Vendors are Offering More Services, Going for Larger Sales .................................. 473
Biopharma Suppliers in Emerging Regions ............................................................. 474
Report and Survey of Biopharmaceutical Manufacturing Capacity and Production
WWW.BIOPLANASSOCIATES.COMxvi
FIGURESFig 0.1: Area of Primary Involvement in Biopharmaceutical Manufacturing, 2010 to 2017 ......3
Fig 0.2: Respondents’ Job Responsibilities, 2011 – 2017 .....................................................................................................................................5
Fig 0.3: Facility Location ...........................................................................................................6
Fig 0.4: Facility Location, by Region .........................................................................................7
Fig 0.5: Biopharmaceutical Manufacturing Systems, (2007-2017) Trends ...............................9
Fig 0.6: Phase of Development of Surveyed Respondents.....................................................11
Fig 0.7: Phase of Development of Surveyed Respondents, (U.S. vs Western Europe) ..........12
Fig 0.8: Distribution of Employees at Facility, and Organization.............................................13
Fig 0.9: Distribution of Total Batches Run at Facility Last Year, by Scale of Production ........14
Fig 0.10: Distribution of Largest SINGLE-USE Bioreactor Capacity .........................................15
Fig 0.11: Distribution of Largest STAINLESS Bioreactor Capacity ...........................................16
Fig 1.1: Number of Biosimilars in the U.S. Pipeline by Launchable Dates .............................27
Fig 1.2: Biosimilars Launchable Dates by Sum of Current Reference Products Sales ($millions) ..........................................................................................27
Fig 1.3: FDA Approvals of New Biopharmaceutical Products 1982-2016 ..............................28
Fig 2.1: China Respondents’ Job Responsibilities ..................................................................52
Fig 2.2: China Biopharmaceutical Facility Type ......................................................................52
Fig 2.3: Top “Strength” Attributes Required for China’s Biologics Companiesto Expand Globally.....................................................................................................54
Fig 2.4: Top Attributes Chinese Companies Need to Compete Globally................................54
Fig 2.5: What China Biopharma Needs to Compete Globally as aBiopharma Center in 10 Years ...................................................................................55
Fig 2.6: Chinese Bioprocessing Facilities: Primary Objectives forBiologics Production – 2016 vs 2026.........................................................................56
Fig 2.7: Respondents’ Job Responsibilities ............................................................................59
Fig 2.8: Biopharmaceutical Facility Type ................................................................................59
Fig 2.9: Top “Strength” Attributes Required for India’s Biologics Companiesto Expand Globally.....................................................................................................60
Fig 2.10: Top Attributes Indian Companies Need to Compete Globally ...................................61
Fig 2.11: What India Biopharma Needs to Compete Globally as aBiopharma Center in 10 Years ...................................................................................62
Fig 2.12: Indian Bioprocessing Facilities: Primary Objectives forBiologics Production – 2016 vs 2026.........................................................................63
Fig 2.13: Biosimilars in the Pipeline Targeting Specifi c Reference andClasses of Products ...................................................................................................82
Fig 2.14: Summary of Lowest Facility Manufacturing Cost Estimates* .....................................84
Fig 2.15: Future of Biomanufacturing; System Requirements ...................................................86
Fig 2.16: Suppliers’ Type of Service Valued Most.....................................................................87
Fig 2.17: How Can Suppliers Work More Effectively with Customers .......................................87
©2017 BIOPLAN ASSOCIATES, INC. • NO UNAUTHORIZED REPRODUCTION PERMITTED • ALL RIGHTS RESERVED xvii
TABLE OF CONTENTS / FIGURES AND TABLES
Fig 3.1: SINGLE most important biomanufacturing trend or operational area, 2014-2017 ....91
Fig 3.2: Biomanufacturers’ Budget Shifts in 2017 ...................................................................93
Fig 3.3: Approximate Average Change in Biomanufacturers’ Budgets for 2017 ....................94
Fig 3.4: Average Biomanufacturers’ Budget Change, 2009-2017 ..........................................97
Fig 3.5: New Product Development-Upstream Focus Areas ................................................101
Fig 3.6: New Product Development-Upstream Focus Areas (2010-2017)............................103
Fig 3.7: New Product Development-Downstream Focus Areas ............................................104
Fig 3.8: New Product Development-Downstream Focus Areas (2010-2017) .......................106
Fig 3.9: New Product Development – General Focus Areas.................................................108
Fig 3.10: New Product Development – General Focus Areas, 2010-2017 .............................110
Fig 3.11: New Product Development Areas of Interest: BiotherapeuticDevelopers vs CMO’s ..............................................................................................115
Fig 3.12: New Product Development Areas of Interest: U.S. vs Western Europeand ROW..................................................................................................................117
Fig 3.13: Factors in Biomanufacturing Performance Creating “Signifi cant” or“Some” Improvements: US Vs Western Europe Vs Rest of World (2015 Data) .......119
Fig 3.14: Cost-Cutting Changes: Actions Undertaken During “Past 12 Months” Comparing 2011-2016 ............................................................................................123
Fig 3.15: Distribution, Average Cost per Gram for PRIMARY Recombinant Protein, 2017.....125
Fig 3.16: Biomanufacturing Assay ‘Areas’ Urgently Requiring New, Improved Testing Methods, 2011 -2015 ..................................................................127
Fig 3.17: Perfusion Operations Issues: Perfusion vs. Batch-Fed Processes (2016 data).......130
Fig 3.18: Perfusion Operations Issues: Comparison 2010 - 2016 (2016 data) .......................131
Fig 3.19: Concerns Over Perfusion Processes vs. Batch-fed Processes in Bioprocessing ....................................................................................133
Fig 3.20: Continuous Bioprocessing Technologies Evaluation, 2016-2017 ............................135
Fig 3.21: Likelihood of Implementing Bioreactor, by Type .....................................................139
Fig 3.22: Likelihood of Implementing Single-use Bioreactors, Clinical Scale, 2012-2017 .....140
Fig 3.23: Areas having dedicated, F/T staff engineers or technicians working directly with the vendors, 2016-2017 ...................................................................................141
Fig 4.1: Capacity Utilization, By System................................................................................147
Fig 4.2: Capacity Utilization, By System, 2004-2017 ............................................................149
Fig 4.3: Change in Capacity Utilization, CAGR, 2006-2017..................................................150
Fig 4.4: Capacity Utilization, By System, Biotherapeutic Developer vs. CMOs ....................152
Fig 4.5: Capacity Utilization, By System, U.S. vs Western Europe .......................................154
Fig 4.6: Current Production Capacity Distribution, Mammalian Cell Culture ........................155
Fig 4.7: Production Capacity Distribution, Mammalian Cell Culture, 2011-2017 ..................157
Fig 4.8: Current Production Capacity Distribution, Microbial Fermentation ..........................161
Fig 4.9: Mammalian Cell Culture Capacity Estimates 2003-2016 .........................................163
Fig 4.10: Microbial Fermentation Capacity Estimates 2003-2016...........................................164
Fig 4.11: Range of Titres for Mabs Obtained at Various Production Scales, Distribution.......166
Report and Survey of Biopharmaceutical Manufacturing Capacity and Production
WWW.BIOPLANASSOCIATES.COMxviii
Fig 4.12: Average Mab Titre Trend 2008-2017 .......................................................................167
Fig 5.1: Capacity Constraints, by Stage of Production .........................................................176
Fig 5.2: Capacity Constraints, 2004 through 2017 ...............................................................178
Fig 5.3: Capacity Constraints Trends, 2004-2017 ................................................................179
Fig 5.4: Capacity Constraints, Biotherapeutic Developers vs. CMOs ..................................181
Fig 5.5: Capacity Constraints, US vs. Western Europe .........................................................182
Fig 5.6: Expectations of Capacity Constraints; by Stage of Production; Five-year Projections ...............................................................................................184
Fig 5.7: Expectations of Capacity Constraints: Five-year Projections Made in 2004-2017 ..................................................................................................186
Fig 5.8: Expectations of Capacity Constraints: Five-year Projections Made in 2004 thru 2022 (Trend Line) ......................................................................187
Fig 5.9: Five-year Projections for Capacity Constraints: Biotherapeutic Developers vs. CMOs ..............................................................................................188
Fig 5.10: Five-year Projections for Capacity Constraints: U.S. vs. Western Europe ..............189
Fig 5.11: Factors Creating Future Capacity Constraints .........................................................191
Fig 5.12A: Factors Creating Future Capacity Constraints, 2008-2017 ......................................193
Fig 5.12B: Factors Creating Future Capacity Constraints, 2008-2017 ......................................194
Fig 5.13: Factors Creating Future Capacity Constraints: Biotherapeutic Developers vs. CMOs ..............................................................................................196
Fig 5.14: Factors Creating Future Capacity Constraints, U.S. vs. Western European Biomanufacturers ....................................................................................200
Fig 5.15: Key areas to Address to Avoid Capacity Constraints ..............................................202
Fig 5.16A: Key areas to Address to Avoid Capacity Constraints; 2006-2017 ...........................204
Fig 5.16B: Key areas to Address to Avoid Capacity Constraints; 2006-2017 ...........................205
Fig 5.17: Key Areas to Address to Avoid Capacity Constraints; Biotherapeutic Developers vs. CMOs ..............................................................................................207
Fig 5.18: Key areas to Address to Avoid Capacity Constraints; U.S. vs. Western Europe .....209
Fig 6.1: Industry Average Planned Production Increase by 2022 ........................................215
Fig 6.2: Planned Future Capacity Expansion: 5-year Estimates, 2009 - 2022 .....................217
Fig 6.3: Planned Future Capacity Expansion: 5-year Estimates; Biotherapeutic Developers vs. CMOs ..............................................................................................218
Fig 6.4: Planned Future Capacity Expansion: 5-year Estimates; U.S. vs. Western Europe ..220
Fig 6.5: Percent of Respondents Projecting Production Increases of over 100% by 2022; 5-year Trend.............................................................................................................221
Fig 7.1: Current Percent Production Outsourced; by System ...............................................228
Fig 7.2: Biopharmaceutical Manufacturing Facilities Outsourcing NO Production, 2006-2017 ......................................................................................230
Fig 7.3: Future Outsourcing: Percent Production Outsourced; by System, in 2022 .............232
Fig 7.4: Five-year Projections: % Biotherapeutic Developers Planning to Outsource at Least Some Production; Projections made 2007-2017 ........................................233
Fig 7.5: Percent of Biomanufacturers Outsourcing at Least Some Activity Today ...............235
©2017 BIOPLAN ASSOCIATES, INC. • NO UNAUTHORIZED REPRODUCTION PERMITTED • ALL RIGHTS RESERVED xix
TABLE OF CONTENTS / FIGURES AND TABLES
Fig 7.6: Percent of Biomanufacturers Outsourcing at Least Some Activity Today, 2010 – 2017 ....................................................................................237
Fig 7.7: Outsourcing Activities Projected to be Done at ‘Signifi cantly Higher Levels’ in 2 Years .....................................................................................................239
Fig 7.8: Outsourcing Activities Projected to be Done at ‘Signifi cantly Higher Levels’ in 2 Years, 2010 - 2017 Trends....................................................................241
Fig 7.9: Current Outsourcing: Average Percentage of Activity Outsourced Today ..............243
Fig 7.10A: Estimated Average Percent of Activity Outsourced by Facilities, 2010 thru 2017 ...245
Fig 7.10B: Estimated Average Percent of Activity Outsourced by Facilities, 2010 thru 2017 ...246
Fig 7.11: Change in Spending on Outsourcing for R&D or Manufacturing, 2012 - 2017 .......248
Fig 7.12: Outsourcing Issues: BioManufacturing by Contract Manufacturing Organizations ...........................................................................................................250
Fig 7.13: Important Outsourcing Issues: BioManufacturing by Contract Manufacturing Organizations, Trends 2006-2017 ...........................................................................252
Fig 7.14: Important Outsourcing Issues: Response Shifts Over Time 2006-2017, Percentage Point Differences ..................................................................................254
Fig 7.15: Most Common Mistakes Biopharmaceutical Sponsors Make with their CMOs, 2010-2013 ................................................................................................................256
Fig 7.16: Country Selections as Destination for International Outsourcing of BioManufacturing (All Respondents) .......................................................................258
Fig 7.17: Percent U.S. Respondents Considering Country as ‘Possible’ Outsourcing Destination ..........................................................................................260
Fig 7.18: Percent U.S. Respondents Considering Country as “Strong Likelihood” or “Likelihood” as Outsourced Capacity Destination ...............................................262
Fig 7.19: Percent Western European Respondents Considering Country as ‘Possible’ Outsourcing Destination ..........................................................................265
Fig 7.20: Percent European Respondents Considering Country as “Strong Likelihood” or “Likelihood” as Outsourced Capacity Destination ..............................................266
Fig 7.21: Percent of Biomanufacturing Operations Off-shored (International Outsourcing) within 5 Years ...........................................................................................................268
Fig 7.22: Percent Biomanufacturers Performing at Least “Some” International Outsourcing/Off-shoring during Next 5 Years (2011-2017) .....................................270
Fig 7.23: Estimated % Operations Done as International Outsourcing/Off-shoring during Next 5 Years (2011-2017) .............................................................................272
Fig 8.1: Usage of Disposables in Biopharmaceutical manufacturing, any Stageof R&D or Manufacture ............................................................................................283
Fig 8.2: Usage of Disposables in Biopharmaceutical manufacturing, any Stage of R&D or Manufacture; 2006-2017 .........................................................................285
Fig 8.3: Average Annual Growth Rate, Disposables, 2006-2017..........................................287
Fig 8.4: 10-Year Percentage-Point Change in First-Usage of Disposables, 2006-2017 .......288
Fig 8.5: Usage of Disposables in Biomanufacturing, by Stage of Manufacture (R&D - Commercial) .................................................................................................290
Fig 8.6: Usage of Disposables in Biopharmaceutical Manufacturing; Biotherapeutic Developer vs. CMO..................................................................................................292
Report and Survey of Biopharmaceutical Manufacturing Capacity and Production
WWW.BIOPLANASSOCIATES.COMxx
Fig 8.7: Value of Useable Leachables and Extractables Data (2016 Data)..........................294
Fig 8.8: Reasons for Increasing Use of Disposable System Components in 2015(data from 2015) ......................................................................................................296
Fig 8.9: Reasons for Increasing Use of Disposable System Components, 2006-2015 ........298
Fig 8.10: Single Most Critical Reason for Increasing Use of Disposables, 2009 - 2017.........301
Fig 8.11: Reasons for Restricting Use of Disposables (2015 Data) ........................................303
Fig 8.12: Factors Restricting Use of Disposables, 2006-2015 (2015 Data) ............................305
Fig 8.13: Top Reasons for Not Increasing Use of Disposables, 2017 ....................................308
Fig 8.14: Top Reasons for Not Increasing Use of Disposables, 2008-2017 ...........................310
Fig 8.15: Top Reasons for Not Increasing Use of Disposables, Biotherapeutic Developer vs. CMO..................................................................................................312
Fig 8.16: Top Reasons for Not Increasing Use of Disposables, U.S. vs Western Europe ......314
Fig 8.17: Single-use/Disposables Standardization Factors (2015 Data) ................................316
Fig 8.18: Single-use/Disposables Standardization Factors, 2013 - 2015 ...............................317
Fig 8.19: Suppliers’ Perception of Organizations Responsible for Establishing Standards for Single-use Devices ..........................................................................319
Fig 8.20: Single-use / Disposable Device Adoption Factors...................................................321
Fig 8.21: Single-use / Disposable Device Adoption Factors; U.S. vs Western Europe ..........322
Fig 8.22: Need for Improved Single-Use Sensors, 2012-2017 ...............................................324
Fig 8.23: Single-use Recycling; Respondents’ Desires for Disposal vs. Actual Disposal Process (2016 data) .................................................................................325
Fig 8.24: Single-use Product Vendor Satisfaction Factors, 2008 - 2017.................................328
Fig 8.25: Importance of Single-use Product Attributes vs. Level of Vendor Satisfaction ........330
Fig 8.26: Percentage Point Gap between Importance of SUS Product Attributes and Level of Satisfaction, 2013-2017 .............................................................................332
Fig 8.27: Estimated Percentage of Facilities’ Unit Operations that are “Single-use” (2014 - 2017)............................................................................................................334
Fig 8.28: Distribution of Responses, % Single-use Devices in Biomanufacturing ..................335
Fig 9.1: Impact of Downstream Processing on Overall Capacity, 2008-2017 ......................347
Fig 9.2: Impact of Downstream Processing on Overall Capacity; Biotherapeutic Developers vs. CMOs ..............................................................................................349
Fig 9.3: Impact of Downstream Processing on Overall Capacity; U.S. vs. Western Europe ..........................................................................................351
Fig 9.4: Impact on Capacity of Depth, Chromatography and UF Purifi cation Steps ............352
Fig 9.5: Impact on Capacity of Purifi cation Steps: Experiencing at “Signifi cant” or“Severe” Constraints, 2008 - 2017 ...........................................................................353
Fig 9.6: Impact on Capacity of Purifi cation Steps, U.S. vs. Western Europe ........................354
Fig 9.7: Issues Regarding Protein A Usage ..........................................................................355
Fig 9.8: Issues Regarding Protein A Usage, 2009 - 2017 .....................................................357
Fig 9.9: Issues Regarding Protein A Usage; U.S. Vs. Western Europe ................................358
Fig 9.10: mAb Operations: Upstream Production Titer (Distribution of Responses, 2016 Data) ...............................................................................................................359
©2017 BIOPLAN ASSOCIATES, INC. • NO UNAUTHORIZED REPRODUCTION PERMITTED • ALL RIGHTS RESERVED xxi
TABLE OF CONTENTS / FIGURES AND TABLES
Fig 9.11: Bioreactor Yield at which DOWNSTREAM Purifi cation Train Becomes Bottlenecked (2016 Data) ........................................................................................360
Fig 9.12: New Downstream Processing Solutions...................................................................362
Fig 9.13: New Downstream Processing Solutions Comparison 2010-2017 ............................364
Fig 9.14: New Downstream Processing Solutions; Biotherapeutic Dev. vs. CMOs ................366
Fig 9.15: New Downstream Processing Solutions; U.S. vs. Western Europe .........................368
Fig 9.16: Improving Downstream Operations, 2011 - 2017 ....................................................370
Fig 9.17: Improving Downstream Operations; Biomanufacturers vs. CMOs ..........................372
Fig 9.18: Improving Downstream Operations (U.S. vs. Western Europe vs. ROW) ................374
Fig 10.1: Hurdles Hindering Implementation of PAT (2008 – 2017)........................................381
Fig 10.2: Batch Failure Frequency Distribution, 2009 – 2017 .................................................385
Fig 10.3: Average Rates of Failure, by Primary Cause, and Phase of Manufacture ...............387
Fig 10.4: Average Rates of Failure, by Primary Cause, and Phase of Manufacturing 2009 - 2017 (Commercial Manufacture) .................................................................388
Fig 10.5: Average Rates Failure, by Primary Cause, and Phase of Manufacturing 2009 - 2017 (“Clinical” Scale) ..................................................................................390
Fig 10.6: Quality Problems Traced to Vendors; 2008 – 2017..................................................392
Fig 10.7: Quality Initiative Implemented Currently, or within Next 12 Months .........................395
Fig 10.8: Quality Initiative to be Implemented in “Next 12 Months,” Comparing 2009 - 2017 ..............................................................................................................397
Fig 11.1: New Hires in Biopharmaceutical Manufacturing (2017) ..........................................404
Fig 11.2: Estimated Hiring, by Area, 2008-2017 .....................................................................405
Fig 11.3: New Hires in Biopharmaceutical Manufacturing (2022) ..........................................406
Fig 11.4: Areas Where Hiring Diffi culties Exist in Biopharmaceutical Operations ..................408
Fig 11.5: Areas Where Hiring Diffi culties Exist in Biopharmaceutical Operations; 2010 - 2017 ..............................................................................................................410
Fig 11.6: Areas Where Hiring Diffi culties Exist in Biopharmaceutical Operations, U.S. vs. Western Europe ..........................................................................................412
Fig 11.7: Training for New Operations/Manufacturing Employees .........................................413
Fig 11.8: Average Annual Changes in Training for New Operations/Manufacturing Employees, 2009 – 2017..........................................................................................414
Fig 12.1: Fill-Finish Operation Type .......................................................................................419
Fig 12.2: Fill-Finish Operation Location ...................................................................................420
Fig 12.3: Fill-Finish Capacity Utilization Averages, 2015-2017 ...............................................421
Fig 12.4: Most Important Trends in Fill-Finish, 2015-2017 ......................................................423
Fig 12.5: Novel Fill-Finish Technology Implementation Plans within 24 Months, 2015 vs 2017............................................................................................................427
Fig 13.1: Area of Biopharmaceutical Involvement, Vendor .....................................................430
Fig 13.2: Area of Biopharmaceutical Involvement, Vendor Comparison 2010 to 2017 ..........431
Fig 13.3: Geographic Locations in which Vendors Currently Actively Sell Products orServices, 2008 - 2017 ..............................................................................................433
Fig 13.4: Respondents’ Primary Job Function ........................................................................434
Report and Survey of Biopharmaceutical Manufacturing Capacity and Production
WWW.BIOPLANASSOCIATES.COMxxii
Fig 13.5: Average Annual Vendor Sales Growth Rate, 2007 - 2017 .......................................435
Fig 13.6: Biopharmaceutical Supply Market Segment Sales Growth Distribution ..................436
Fig 13.7: Average Annual Vendor Segment Sales Growth Rates, 2017 .................................437
Fig 13.8: Average Annual Vendor Sales Growth Rate, 2007 - 2017, by Segment ..................438
Fig 13.9: Vendors’ Approx. Annual Sales to Biopharmaceutical Segment %, 2012-2017......439
Fig 13.10: Vendors’ Average Budget Change for 2017 ............................................................442
Fig 13.11: Vendors’ Average Budget Change for 2009 - 2017, Summary................................444
Fig 13.12: Vendors’ Average Pricing Changes ........................................................................445
Fig 13.13: Vendors’ Average Pricing Changes, 2009-2016 Actual and 2017 projected ..........447
Fig 13.14: Actions undertaken to reduce overall costs, prior 12 months, 2011-2017 ..............449
Fig 13.15: Actions undertaken to reduce overall costs in past 12 months, By Segment..........451
Fig 13.16: (See Fig 10.6; recap): Quality Problems Traced to Vendors ...................................453
Fig 13.17: Biopharma Business and Marketing Plans, 2017 ....................................................455
Fig 13.18: Biopharma Business and Marketing Plans, 2010-2017 ...........................................457
Fig 13.19A: Top New Technologies or New Product Development Areas .................................459
Fig 13.19B: Top New Technologies or New Product Development Areas .................................460
Fig 13.20: Plans for Launching Signifi cant, Truly Novel Bioprocessing Advances ..................464
Fig 13.21: R&D Spending/Budget for New Products/Services .................................................465
Fig 13.22: Areas Where Training May Help Sales Staff Perform Better; 2010 – 2017 ..............467
Fig 13.23: Client Demands of Vendors, Service and Support, 2012 - 2017 .............................469
Fig 13.24: Vendors’ Optimism; Financial Performance 2011-2016, and Projected Performance in 2017 ................................................................................................471
©2017 BIOPLAN ASSOCIATES, INC. • NO UNAUTHORIZED REPRODUCTION PERMITTED • ALL RIGHTS RESERVED xxiii
TABLESTable 1.1 FDA Biopharmaceutical Approvals, 2016 ..................................................................29
Table 1.2 Number of Products in U.S. and European Markets* ................................................32
Table 1.3 Summary of Worldwide Biopharmaceutical Revenue Growth by Product Class, 2007 and 2016 .................................................................................38
Table 1.4 Blockbuster Biopharmaceutical Products* ................................................................40
Table 1.5 Expression Systems/Host Cells for U.S./EU-Marketed Cultured Biopharmaceuticals ...................................................................................................42
Table 2.1 Average Annual Total Costs for In-house Buffer Prep, by Liter Production ...............66
Table 2.2 Downstream Operations Causing Greatest Problems ...............................................73
Table 3.1 Areas of Signifi cant Projected Budget Percentage Increases for Biomanufacturing, Past Years...................................................................................96
Table 4.1 Western European Biomanufacturers’ Average Capacity Utilization .......................153
Table 4.2 U.S. Biomanufacturers’ Average Capacity Utilization ..............................................153
Table 4.3 Distribution of Mammalian Cell Culture Capacity, Product Manufacturers ............159
Table 4.4 Compound Annual Change in Mab Titre, 2008-2017 ..............................................168
Table 5.1 “Severe” or “Signifi cant” Capacity Constraints, by Stage of Production, 2009-2017 ............................................................................................176
Table 5.2 “Severe” or “Signifi cant” Capacity Constraints today, W. Europe v. U.S., 2010-2017 ..............................................................................................................182
Table 6.1 Western European Biomanufacturers’ 5-year projected increases .........................217
Table 6.2 U.S. Biomanufacturers’ 5-year projected increases ................................................217
Table 7.1 Respondents Reporting No outsourced production (i.e., all in-house manufacturing), 2009-2017 ..........................................................224
Table 7.2 Respondents Outsourcing up to 50% of Production, Mammalian andMicrobial Systems, 2009-2017 .................................................................................225
Table 7.3 Respondents Outsourcing Over 50% of Production, Mammalian and Microbial Cell Systems, 2009-2017 .........................................................................225
Table 7.4 Percent of U.S.-based Respondents Indicating Country as a“Strong Likelihood” or “Likelihood” as Outsourcing Destination, 2009-2017 ..........263
Table 7.5 Percent of European-based Respondents Indicating Country as a“Strong Likelihood” or “Likelihood” as Outsourcing Destination, 2011-2017 ..........267
Table 9.1 Percent experiencing “Serious” or “Some” capacity problemsdue to downstream processing 2008-2017 .............................................................348
Table 9.2 Percent U.S. vs. Western Europe facilities experiencing “Serious”capacity problems due to downstream processing, 2009-2017 .............................349
Table 9.3 Percent U.S. vs. Western Europe facilities not expecting to seebottlenecks due to downstream processing, 2008-2017 ........................................350
Table 9.4 Upstream Production Titer vs. Max Capacity, 2016 Data ........................................359
Table 10.1 Batch Failures, Average Weeks per Failure, per Facility, 2008-2017 ......................381
Table 13.1 Selected “Other” New Technology Areas in Development ......................................461
Table 13.2 Average Vendor Sales and Technical Training Days, 2011 - 2013 .........................466
TABLE OF CONTENTS / FIGURES AND TABLES
Report and Survey of Biopharmaceutical Manufacturing Capacity and Production
WWW.BIOPLANASSOCIATES.COMxxiv
M E T H O D O LO G YThis report is the fourteenth in our annual evaluations of the state of the biopharmaceutical manufacturing industry. The strength of this study’s methodology remains in its breadth of coverage, which yields a composite view from the respondents closest to the industry. This year, BioPlan Associates, Inc. surveyed 227 qualifi ed and responsible individuals at biopharmaceutical manufacturers and contract manufacturing organizations in 25 countries; plus 131 industry vendors and direct suppliers of materials, services and equipment to this industry segment. Using a web-based survey tool, we obtained and evaluated information regarding respondents’ current capacity, production, novel technology adoption, human resources, quality, and outsourcing issues. We assessed respondents’ projected reasons for bottlenecks, and their perception of how these bottlenecks might be resolved.
We continue to provide additional in-depth analysis of specifi c issues affecting the industry in Chapter 2. These Monographs cover the events shaping the past year, and evaluate how they will affect, or create trends that will shape biopharmaceutical manufacturing over the next fi ve years. We also have included this year a chapter on Fill-and Finish operations. Over the past few years, advances in technologies, drug delivery, and single-use applications have increasingly made this segment an area of interest for innovation.
To ensure comprehensive global coverage, we partnered with world-wide organizations to ensure the most accurate overview of the worldwide biopharmaceutical industry. Our industry partners are included in our acknowledgment section. In addition, to support this coverage, we also include acknowledgment of our media partners, whose assistance enabled us to reach the high quality of respondents required in this quantitative analysis.
Further information on methodology, breakouts on specifi c segments, and data from earlier surveys may be obtained by contacting us at the address below.
Eric S. LangerPresidentBioPlan Associates, Inc.2275 Research Blvd., Suite 500Rockville, MD 20850301-921-5979 [email protected]
©2017 BIOPLAN ASSOCIATES, INC. • NO UNAUTHORIZED REPRODUCTION PERMITTED • ALL RIGHTS RESERVED 1
CHAPTER 0: DEMOGRAPHICS
C H A P T E R 0:D E M O G R A P H I C S
INTRODUC TION
Survey respondents included diverse biopharmaceutical senior managers, executives and scientists covering a spectrum involved in biopharmaceutical development and manufacturing, including those within CMOs. As reported below, ≥88% of respondents
had VP, CEO or Director job titles. In addition, in Chapter 13, we separately present responses from bioprocessing suppliers and vendors. As in previous years, responses are from companies of all sizes and types. Respondents had a broad range of responsibilities, but all respondents had to qualify as involved with bioprocessing/manufacturing in some way.
This is an international project done annually, with this now the 14th year edition. We solicit and receive survey responses from individuals at organizations around the world; this year includes input from individuals based in 25 countries.
The diversity of survey respondents supports providing a comprehensive view of the industry from those most involved in managing biopharmaceutical manufacturing activities worldwide. Resulting survey data offer a means for understanding the industry and its future course. The breakdown of results by organizations, such as into CMOs vs. biotherapeutic manufacturers, provides further insights into these two major segments of the industry. These two types of organizations have different business drivers, risk profi les, costs of capital, etc.
0-1 RESPONDENTS’ AREA OF INVOLVEMENTOf the 227 biopharmaceutical manufacturers’ and contract manufacturing organizations’ (CMOs) staff responding to this year’s survey, 25.1% were primarily involved in “L arge-scale cell culture production for therapeutics”, a slight increase from 23.0% and 23.6% from the last two years, respectively. The percentage of respondents involved in “Process Development for biopharmaceutical manufacturing” was down slightly this year to 25.6% from a high of 27.0% in 2016. A slight increase to 14.1% was seen in those involved in “S cale-up (or clinical-scale) production for biopharmaceuticals only” compared with 12.6% in 2016. But overall, the general pattern of type of organization of those surveyed has not changed.
Respondents involved with “Large-scale contract manufacturing (CMO) for biopharmaceuticals” had the largest percentage to date of 11.5%, up from 9.5% in 2016. “Large-scale microbial fermentation for therapeutics” accounted for 4.8% of respondents, a decrease of 1.1% percentage point; and 8.4% of respondents indicated they were primarily involved in “Vaccine production”, a slight uptick from 2016 (8.1%). “‘Other’ large-scale biopharmaceutical
Report and Survey of Biopharmaceutical Manufacturing Capacity and Production
WWW.BIOPLANASSOCIATES.COM2
manufacturing” respondents accounted for 7.0% of the total this year, an increase from 6.3% in 2016, and “‘Other’ contract manufacturing (CMO) for biopharmaceuticals” accounted for 3.5% of respondents, nearly back up to 2014 levels (3.8%). Lastly, 5.4% of respondents accounted for “Fill/Finish operations”, a slight decline from 6.8% in 2016.
Overall, the makeup of respondents remains overall consistent with prior years’ studies, with the most signifi cant changes seen in “Large-scale cell culture production for therapeutics” and “Large-scale contract manufacturing (CMO) for biopharmaceuticals”. This may be the result of more products being manufactured at larger scale, which is the case, with related trends discussed in Chapter 1. Despite variations, including decreases, in reporting involvement in aspects of biopharmaceutical manufacturing, this year’s data continues to fall within the range defi ned by prior years’ data reporting, with the relative rankings remaining largely unaffected. This year-to-year coherency supports the accuracy of these demographic data.
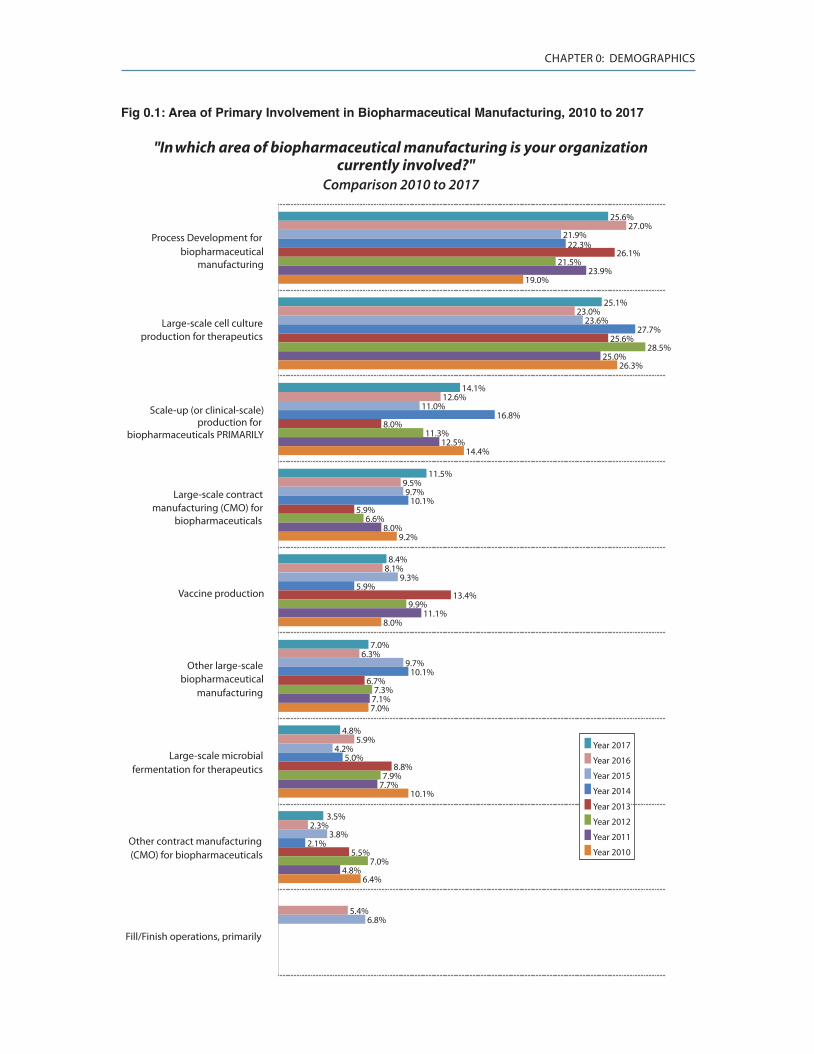
©2017 BIOPLAN ASSOCIATES, INC. • NO UNAUTHORIZED REPRODUCTION PERMITTED • ALL RIGHTS RESERVED 3
CHAPTER 0: DEMOGRAPHICS
Fig 0.1: Area of Primary Involvement in Biopharmaceutical Manufacturing, 2010 to 2017
"In which area of biopharmaceutical manufacturing is your organization currently involved?"
Comparison 2010 to 2017
25.6%
25.1%
14.1%
11.5%
8.4%
7.0%
4.8%
27.0%
23.0%
12.6%
9.5%
8.1%
6.3%
5.9%
2.3%
5.4%
21.9%
23.6%
11.0%
9.7%
9.3%
9.7%
4.2%
3.8%
6.8%
27.7%
16.8%
10.1%
5.9%
10.1%
5.0%
2.1%
26.1%
25.6%
8.0%
5.9%
13.4%
6.7%
8.8%
5.5%
21.5%
28.5%
11.3%
6.6%
9.9%
7.3%
7.9%
7.0%
23.9%
25.0%
12.5%
8.0%
11.1%
7.1%
7.7%
4.8%
19.0%
26.3%
14.4%
9.2%
8.0%
7.0%
10.1%
6.4%
3.5%
22.3%Process Development for
biopharmaceuticalmanufacturing
Large-scale cell cultureproduction for therapeutics
Scale-up (or clinical-scale)production for
biopharmaceuticals PRIMARILY
Large-scale contractmanufacturing (CMO) for
biopharmaceuticals
Vaccine production
Other large-scalebiopharmaceutical
manufacturing
Large-scale microbialfermentation for therapeutics
Other contract manufacturing(CMO) for biopharmaceuticals
Fill/Finish operations, primarily
Year 2017
Year 2016
Year 2015
Year 2014
Year 2013
Year 2012
Year 2011
Year 2010
Report and Survey of Biopharmaceutical Manufacturing Capacity and Production
WWW.BIOPLANASSOCIATES.COM4
0-2 RESPONDENTS QUALIFIC ATIONSRespondents were asked about their areas of responsibility, as indicated by job titles. Over 88% had titles of VP, Director or President/CEO, a slight decrease from last year’s 92%, but still consistent with 91.7% in 2015 and nearly 88% in 2014, with about 90% being the average in recent years. This year, only 11.0% of respondents were VPs, Directors or Managers of QA, QC, Validation, or RA, a sharp decline from a high of 15.8% reported in 2016. Biopharmaceutical Scientist or Engineer respondents lacking VP/Director/Manager responsibilities in Process Development, R&D or Production made up 11.0%, a jump from the consistently declining level of the last three years of 7.9% in 2016, 8.3% in 2015, and 12.1% in 2014.
Presidents/CEOs represented 5.3% of respondents, a decline from 7.4% in 2016; and VPs or Directors of R&D accounted for 4.8% of respondents; still averaging similar totals seen in past years. Respondents with VP or Director: Operations responsibilities increased to 8.8% from a low of 5.9% in 2016. VPs, Directors or Managers in Process Development comprised the largest percentage of respondents at 36.1%, a slight decrease from 36.5% reported in 2016. VPs, Directors or Managers of Manufacturing and Production comprised the second-highest number of respondents at 22.9%. Combining VPs with Process Development Directors and Managers with those in Manufacturing and Production, the percentage comes to 59%, making up most of the respondents. Overall, respondent job titles or levels of responsibility have changed little over the years.
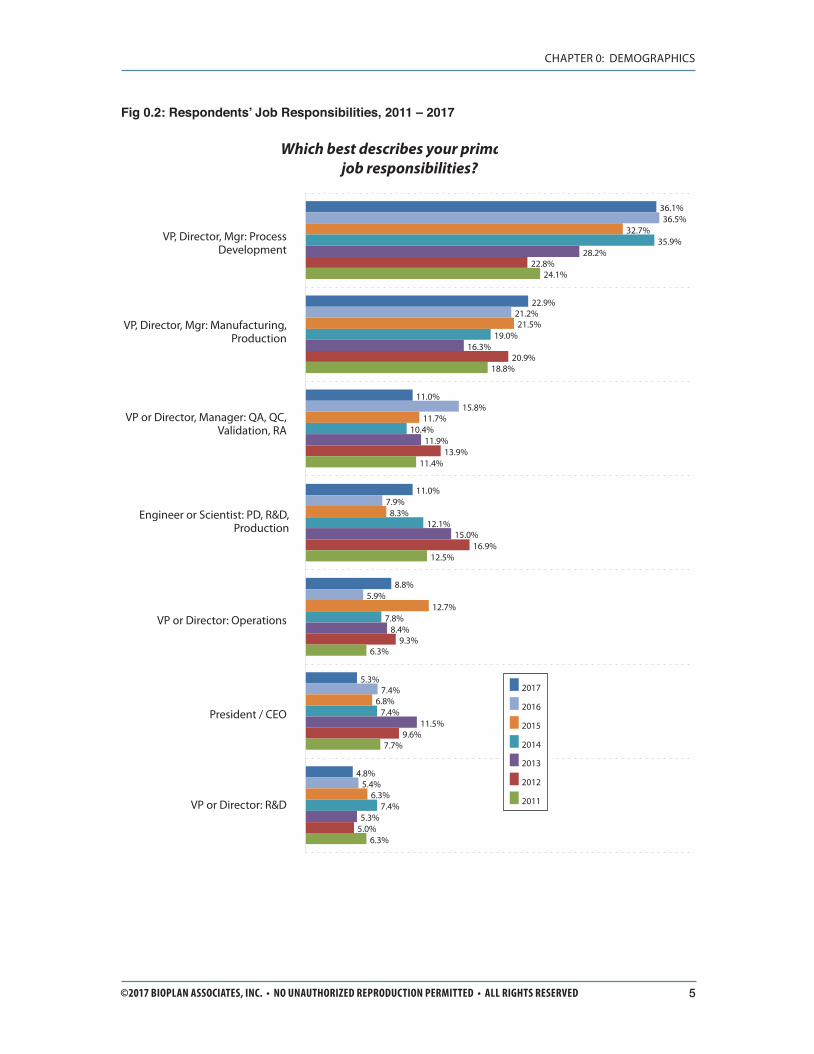
©2017 BIOPLAN ASSOCIATES, INC. • NO UNAUTHORIZED REPRODUCTION PERMITTED • ALL RIGHTS RESERVED 5
CHAPTER 0: DEMOGRAPHICS
Fig 0.2: Respondents’ Job Responsibilities, 2011 – 2017
Which best describes your primajob responsibilities?
36.1%
22.9%
11.0%
11.0%
8.8%
5.3%
4.8%
36.5%
21.2%
15.8%
7.9%
5.9%
7.4%
5.4%
32.7%
21.5%
11.7%
8.3%
12.7%
6.8%
6.3%
35.9%
19.0%
10.4%
12.1%
7.8%
7.4%
7.4%
28.2%
16.3%
11.9%
15.0%
8.4%
11.5%
5.3%
22.8%
20.9%
13.9%
16.9%
9.3%
9.6%
5.0%
24.1%
18.8%
11.4%
12.5%
6.3%
7.7%
6.3%
VP, Director, Mgr: Process Development
VP, Director, Mgr: Manufacturing, Production
VP or Director, Manager: QA, QC, Validation, RA
Engineer or Scientist: PD, R&D, Production
VP or Director: Operations
President / CEO
VP or Director: R&D
2017
2016
2015
2014
2013
2012
2011
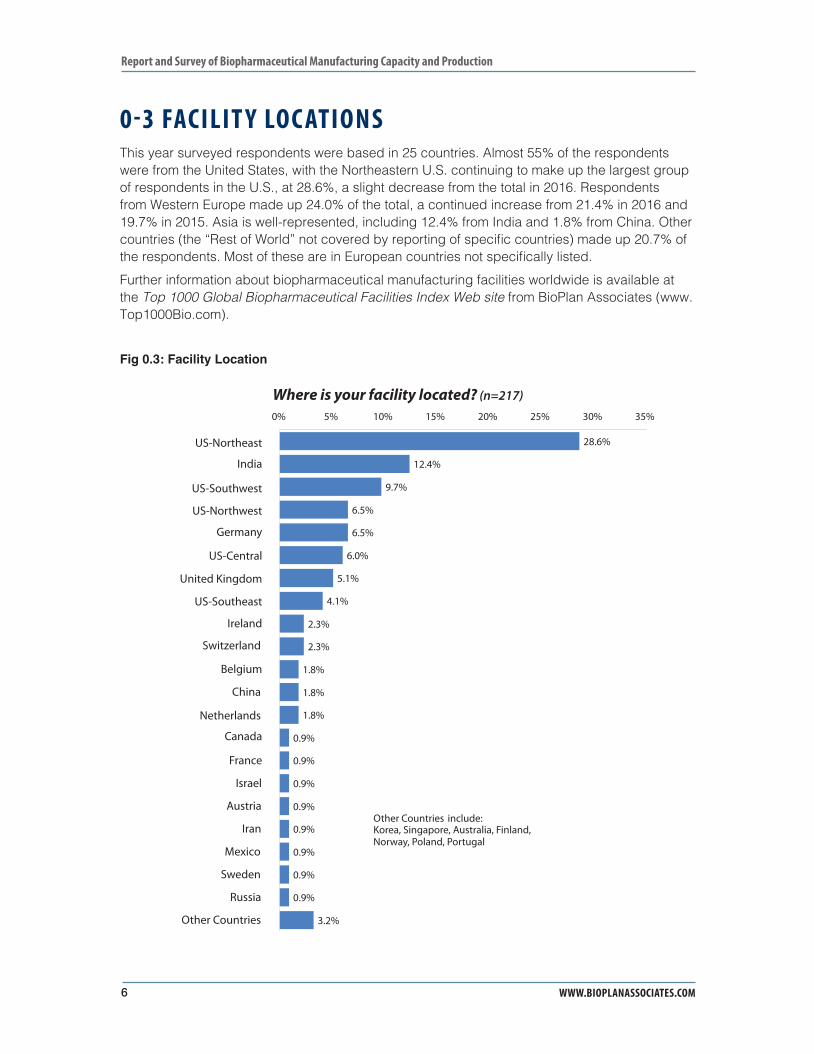
Report and Survey of Biopharmaceutical Manufacturing Capacity and Production
WWW.BIOPLANASSOCIATES.COM6
0-3 FACILIT Y LOC ATIONSThis year surveyed respondents were based in 25 countries. Almost 55% of the respondents were from the United States, with the Northeastern U.S. continuing to make up the largest group of respondents in the U.S., at 28.6%, a slight decrease from the total in 2016. Respondents from Western Europe made up 24.0% of the total, a continued increase from 21.4% in 2016 and 19.7% in 2015. Asia is well-represented, including 12.4% from India and 1.8% from China. Other countries (the “Rest of World” not covered by reporting of specifi c countries) made up 20.7% of the respondents. Most of these are in European countries not specifi cally listed.
Further information about biopharmaceutical manufacturing facilities worldwide is available at the Top 1000 Global Biopharmaceutical Facilities Index Web site from BioPlan Associates (www.Top1000Bio.com).
Fig 0.3: Facility Location
Where is your facility located? (n=217)
28.6%
12.4%
9.7%
6.5%
6.5%
6.0%
5.1%
4.1%
2.3%
2.3%
1.8%
1.8%
1.8%
0.9%
0.9%
0.9%
0.9%
0.9%
0.9%
0.9%
0.9%
3.2%
0% 5% 10% 15% 20% 25% 30% 35%
US-Northeast
India
US-Southwest
US-Northwest
Germany
US-Central
United Kingdom
US-Southeast
Ireland
Switzerland
Belgium
China
Netherlands
Canada
France
Israel
Austria
Iran
Mexico
Sweden
Russia
Other Countries
Other Countries include: Korea, Singapore, Australia, Finland, Norway, Poland, Portugal
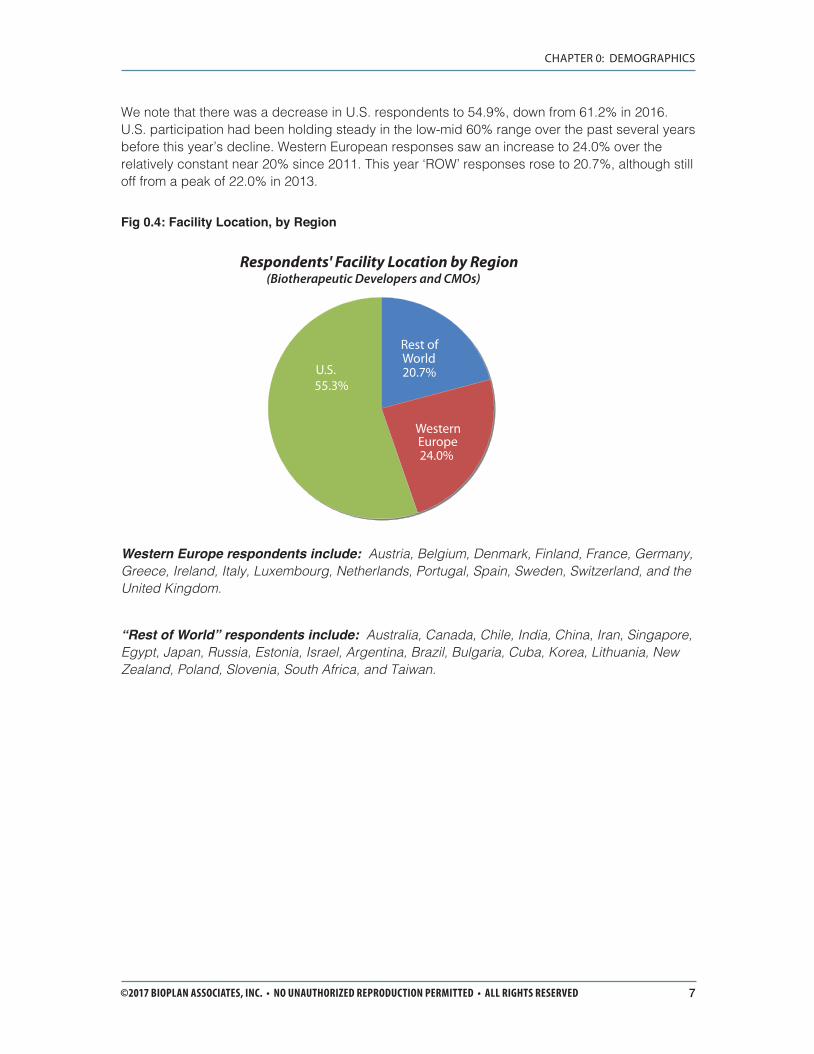
©2017 BIOPLAN ASSOCIATES, INC. • NO UNAUTHORIZED REPRODUCTION PERMITTED • ALL RIGHTS RESERVED 7
CHAPTER 0: DEMOGRAPHICS
We note that there was a decrease in U.S. respondents to 54.9%, down from 61.2% in 2016. U.S. participation had been holding steady in the low-mid 60% range over the past several years before this year’s decline. Western European responses saw an increase to 24.0% over the relatively constant near 20% since 2011. This year ‘ROW’ responses rose to 20.7%, although still off from a peak of 22.0% in 2013.
Fig 0.4: Facility Location, by Region
Western Europe respondents include: Austria, Belgium, Denmark, Finland, France, Germany, Greece, Ireland, Italy, Luxembourg, Netherlands, Portugal, Spain, Sweden, Switzerland, and the United Kingdom.
“Rest of World” respondents include: Australia, Canada, Chile, India, China, Iran, Singapore, Egypt, Japan, Russia, Estonia, Israel, Argentina, Brazil, Bulgaria, Cuba, Korea, Lithuania, New Zealand, Poland, Slovenia, South Africa, and Taiwan.
Respondents' Facility Location by Region (Biotherapeutic Developers and CMOs)
Rest of World
WesternEurope
U.S.55.3%
20.7%
24.0%
Report and Survey of Biopharmaceutical Manufacturing Capacity and Production
WWW.BIOPLANASSOCIATES.COM8
0-4 AREAS OF BIOPHARMACEUTIC AL MANUFAC TURING OPERATIONSMammalian Cell Culture systems continue to dominate product development and manufacture, and this is refl ected in the survey data. Further, a majority of biopharmaceutical products in the development pipeline and entering the market are mammalian-expressed, including various recombinant monoclonal antibody (mAb) products, with this now including multiple biosimilar versions of many of these mAbs. With the continuing incremental increases in mammalian system titers and yields, and with mammalian culture all that many bioprocessing professionals are now knowledgeable about, many facilities are standardizing using mammalian vs. microbial systems. In some cases, this even includes products that could be manufactured in microbial systems, which are generally cheaper or more productive, but are often initially manufactured in mammalian systems, if these get the job done, such as to produce pre-clinical or early clinical supplies. Besides mammalian being the dominant platform, but generally more expensive than microbial manufacture, development continues using mammalian platforms. Mammalian manufacturing has advantages including being more adaptable to single-use systems manufacturing, besides more bioprocessing professionals now being more familiar with mammalian vs. microbial manufacturing. The state of mammalian and microbial manufacturing is also discussed in other sections below.
This year, we see an increase from last year in those reporting their facilities using Mammalian Cell Culture and Microbial Fermentation; and small upticks in the overall percentage of respondents for Yeast and Insect Cells were also observed. Note, respondents were permitted to select multiple platform systems. Respondents citing their facilities as involved in “Mammalian Cell Culture” increased this year from 2016 (81.1% vs. 79.3%, respectively. In fact, relative to last year, all expression systems increased slightly, with only “Plant Cells,” an outlier at the lowest end, decreasing by reported 0.1%. This overall slight increase suggests that the industry is slowing increasing the diversity of basic expression systems/platforms it is using.
We saw an increase for “Microbial Fermentation” systems, where 40.3% of respondents noted facility involvement in this area, a 2.8%-point increase from the previous year (37.5%).
Less common systems, including Yeast and Insect Cells, saw small increases. This year, 19.4% of respondents noted that their facility had production operations in “Yeast”, a continued increase fi rst observed in 2015. The 2.6% of respondents involved with “Plant Cells” was a slight decrease from 2016. In contrast, “Insect Cells” saw an increase to 9.7%, continuing a general trend upward that started in 2014.
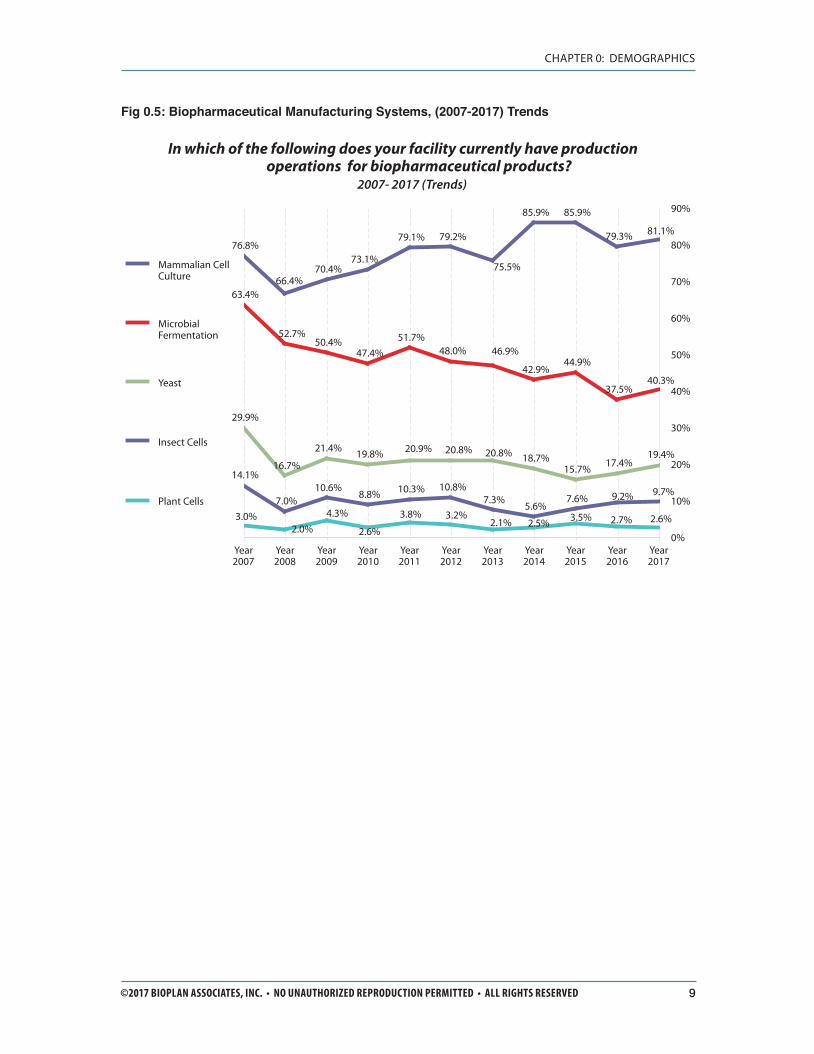
©2017 BIOPLAN ASSOCIATES, INC. • NO UNAUTHORIZED REPRODUCTION PERMITTED • ALL RIGHTS RESERVED 9
CHAPTER 0: DEMOGRAPHICS
Fig 0.5: Biopharmaceutical Manufacturing Systems, (2007-2017) Trends
In which of the following does your facility currently have production operations for biopharmaceutical products?
2007- 2017 (Trends)
79.3%
85.9%85.9%
79.2%79.1%
73.1%70.4%
66.4%
76.8%
37.5%
44.9%42.9%
48.0%51.7%
47.4%50.4%
52.7%
63.4%
17.4%15.7%18.7%19.8%21.4%
16.7%
29.9%
7.6%5.6%
7.3%10.8%10.3%8.8%
10.6%7.0%
14.1%
2.0%3.0%
81.1%
75.5%
40.3%
46.9%
19.4%20.8%20.8%20.9%
9.7%9.2%
2.6%2.7%3.5%2.5%2.1%3.2%3.8%
2.6%
4.3%
0%
10%
20%
30%
40%
50%
60%
70%
80%
90%
Year2017
Year2016
Year2015
Year2014
Year2013
Year2012
Year2011
Year2010
Year2009
Year2008
Year2007
Mammalian CellCulture
MicrobialFermentation
Yeast
Insect Cells
Plant Cells
Report and Survey of Biopharmaceutical Manufacturing Capacity and Production
WWW.BIOPLANASSOCIATES.COM10
0-5 PRODUC TION OPERATIONS, PHASE OF DEVELOPMENTWe identifi ed the phases of pipeline development in which respondents’ organizations (companies) had products. This year, over half (51.5%) of respondent companies had products at R&D stage, holding steady with 52.5% seen in 2016. Respondents’ facilities involved with R&D have shifted back to their relative 50% level seen in almost all previous years, but they remain much lower than the 73.3% in 2006. Respondents reporting their facilities involved with Preclinical operations were 62.6%, an increase over last year’s 57.6%. Note, respondents could indicate multiple phases of development for their facility.
The percentage of respondents whose facilities have biopharmaceutical products on the market slightly decreased to 52.5%, down from 54.2% in 2016. The percentage with their facilities involved with products in Phase III development increased to 59.1% this year, up 3.2% from 2016. A rather large jump of 16% was seen in those working with Phase I development from 52.5% in 2016 to 61.1% this year; this was the largest change seen in any of these categories. Perhaps, this suggests a recent increase in products entering clinical trials.
These respondent facility phase of development data continue to have small annual fl uctuations as the industry continues its overall maturation, with most respondents now employed by companies with revenue streams from marketed biologics. 2009 has been widely noted as the year the biopharmaceutical industry fi nally, as a whole, turned a profi t. Overall, the employers of the surveyed biopharmaceutical manufacturing-related professionals are rather evenly distributed over the pipeline spectrum from pre-clinical through commercial manufacturing, with each phase being worked on by 50+% of survey respondent organizations.
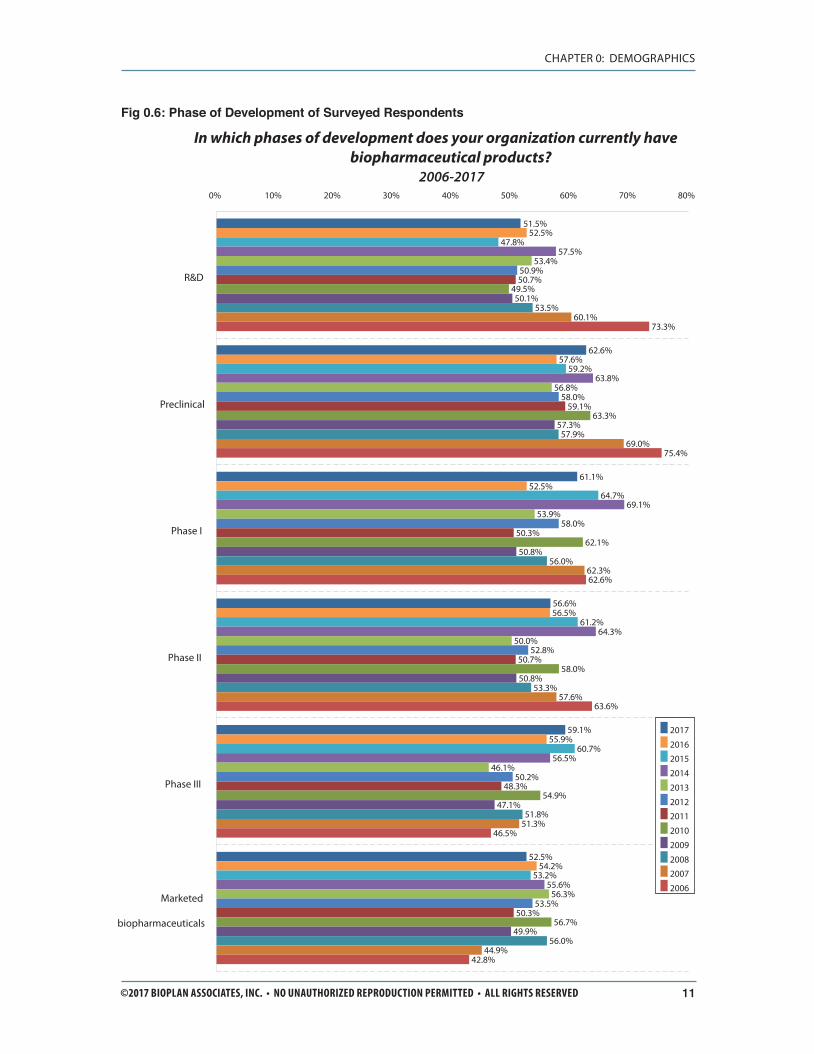
©2017 BIOPLAN ASSOCIATES, INC. • NO UNAUTHORIZED REPRODUCTION PERMITTED • ALL RIGHTS RESERVED 11
CHAPTER 0: DEMOGRAPHICS
Fig 0.6: Phase of Development of Surveyed Respondents
In which phases of development does your organization currently have biopharmaceutical products?
2006-2017
62.6%
61.1%
56.6%
59.1%
52.5%
52.5%
57.6%
52.5%
56.5%
55.9%
54.2%
47.8%
59.2%
64.7%
61.2%
60.7%
53.2%
57.5%
63.8%
69.1%
64.3%
56.5%
55.6%
53.4%
56.8%
53.9%
50.0%
46.1%
56.3%
50.9%
58.0%
58.0%
52.8%
50.2%
53.5%
50.7%
59.1%
50.3%
50.7%
48.3%
50.3%
49.5%
63.3%
62.1%
58.0%
54.9%
56.7%
50.1%
57.3%
50.8%
50.8%
47.1%
49.9%
53.5%
57.9%
56.0%
53.3%
51.8%
56.0%
60.1%
69.0%
62.3%
57.6%
51.3%
44.9%
73.3%
75.4%
62.6%
63.6%
46.5%
42.8%
51.5%
0% 10% 20% 30% 40% 50% 60% 70% 80%
R&D
Preclinical
Phase I
Phase II
Phase III
Marketed
biopharmaceuticals
2017
2016
2015
2014
2013
2012
2011
2010
2009
2008
2007
2006
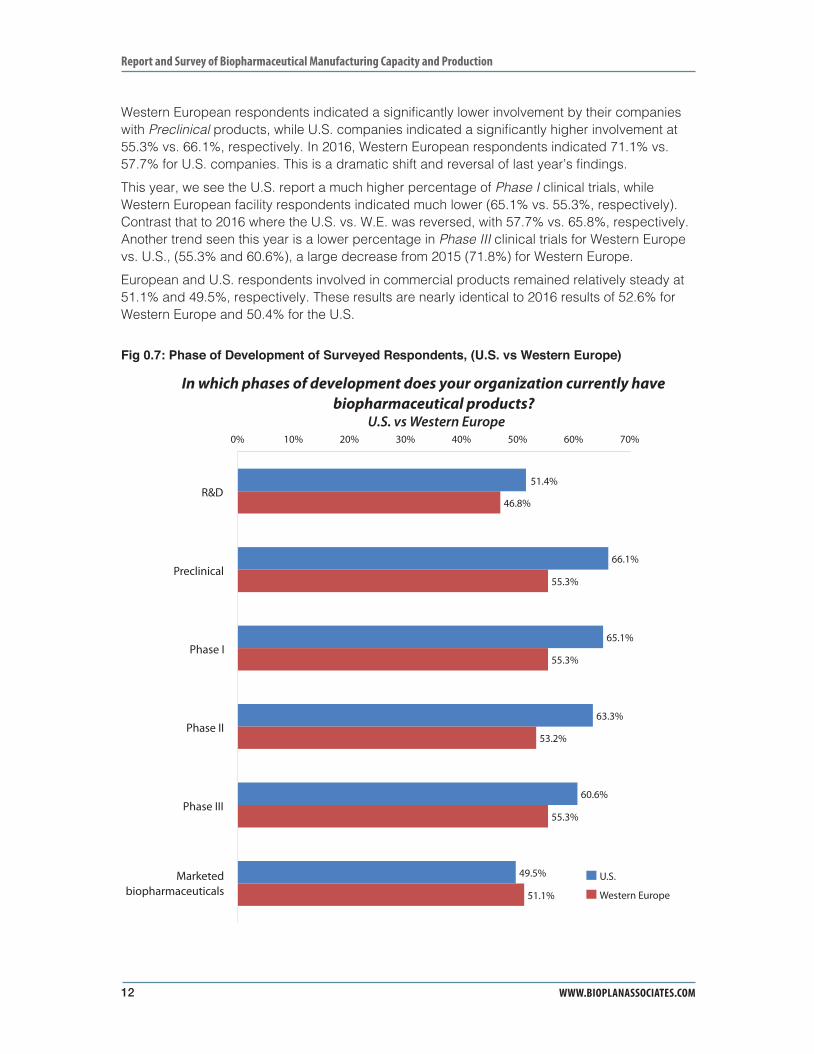
Report and Survey of Biopharmaceutical Manufacturing Capacity and Production
WWW.BIOPLANASSOCIATES.COM12
Western European respondents indicated a signifi cantly lower involvement by their companies with Preclinical products, while U.S. companies indicated a signifi cantly higher involvement at 55.3% vs. 66.1%, respectively. In 2016, Western European respondents indicated 71.1% vs. 57.7% for U.S. companies. This is a dramatic shift and reversal of last year’s fi ndings.
This year, we see the U.S. report a much higher percentage of Phase I clinical trials, while Western European facility respondents indicated much lower (65.1% vs. 55.3%, respectively). Contrast that to 2016 where the U.S. vs. W.E. was reversed, with 57.7% vs. 65.8%, respectively. Another trend seen this year is a lower percentage in Phase III clinical trials for Western Europe vs. U.S., (55.3% and 60.6%), a large decrease from 2015 (71.8%) for Western Europe.
European and U.S. respondents involved in commercial products remained relatively steady at 51.1% and 49.5%, respectively. These results are nearly identical to 2016 results of 52.6% for Western Europe and 50.4% for the U.S.
Fig 0.7: Phase of Development of Surveyed Respondents, (U.S. vs Western Europe)
In which phases of development does your organization currently have biopharmaceutical products?
U.S. vs Western Europe
66.1%
65.1%
63.3%
60.6%
49.5%
46.8%
55.3%
55.3%
53.2%
55.3%
51.1%
51.4%
0% 10% 20% 30% 40% 50% 60% 70%
R&D
Preclinical
Phase I
Phase II
Phase III
Marketedbiopharmaceuticals
U.S.
Western Europe
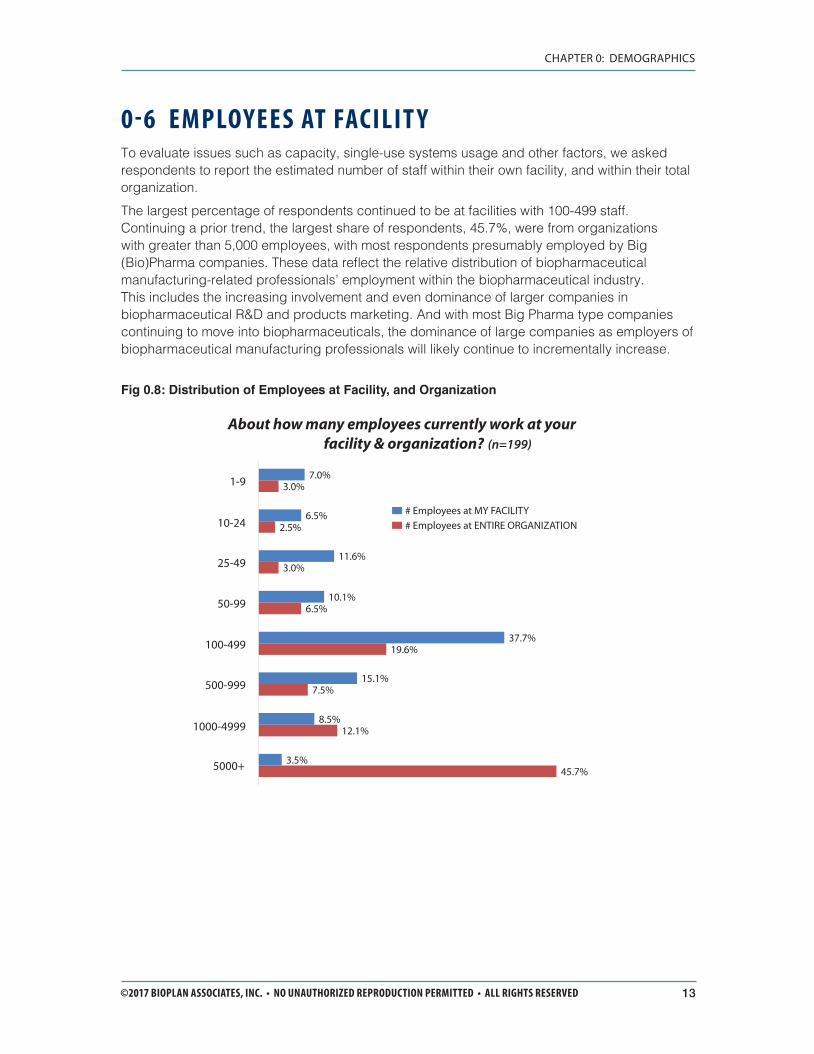
©2017 BIOPLAN ASSOCIATES, INC. • NO UNAUTHORIZED REPRODUCTION PERMITTED • ALL RIGHTS RESERVED 13
CHAPTER 0: DEMOGRAPHICS
0-6 EMPLOYEES AT FACILIT YTo evaluate issues such as capacity, single-use systems usage and other factors, we asked respondents to report the estimated number of staff within their own facility, and within their total organization.
The largest percentage of respondents continued to be at facilities with 100-499 staff. Continuing a prior trend, the largest share of respondents, 45.7%, were from organizations with greater than 5,000 employees, with most respondents presumably employed by Big (Bio)Pharma companies. These data refl ect the relative distribution of biopharmaceutical manufacturing-related professionals’ employment within the biopharmaceutical industry. This includes the increasing involvement and even dominance of larger companies in biopharmaceutical R&D and products marketing. And with most Big Pharma type companies continuing to move into biopharmaceuticals, the dominance of large companies as employers of biopharmaceutical manufacturing professionals will likely continue to incrementally increase.
Fig 0.8: Distribution of Employees at Facility, and Organization
About how many employees currently work at your facility & organization? (n=199)
7.0%
6.5%
11.6%
10.1%
37.7%
15.1%
8.5%
3.5%
3.0%
2.5%
3.0%
6.5%
19.6%
7.5%
12.1%
45.7%
1-9
10-24
25-49
50-99
100-499
500-999
1000-4999
5000+
# Employees at MY FACILITY# Employees at ENTIRE ORGANIZATION
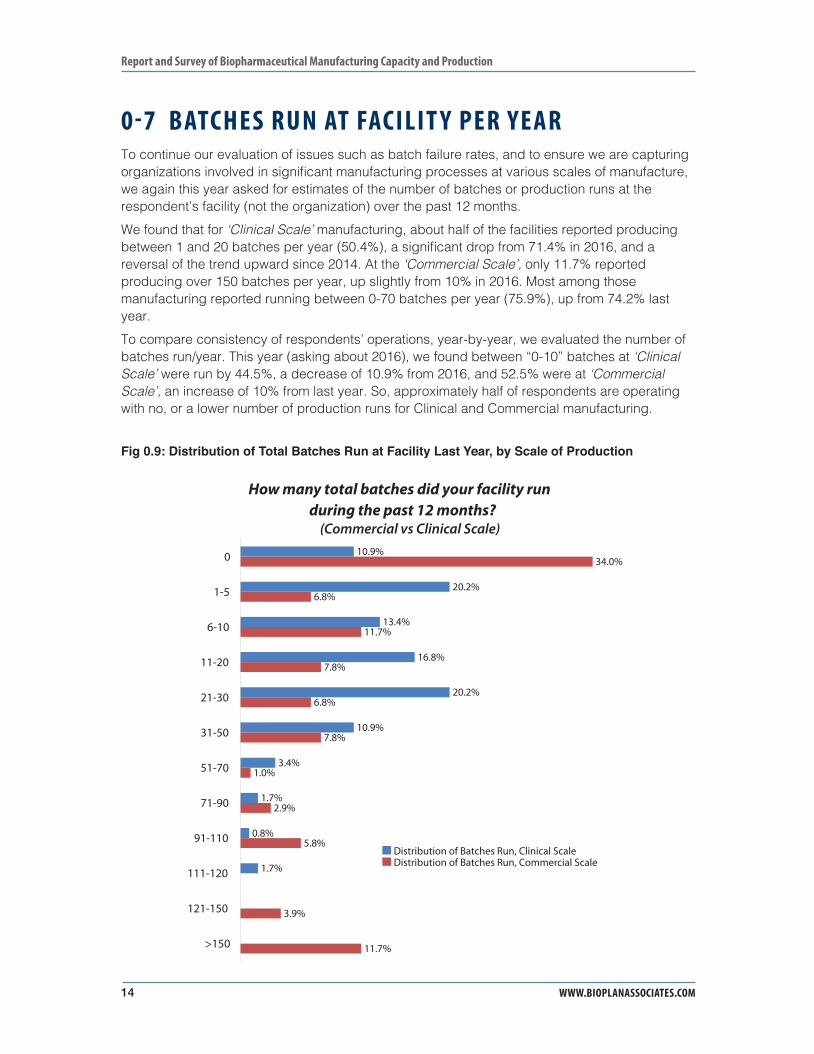
Report and Survey of Biopharmaceutical Manufacturing Capacity and Production
WWW.BIOPLANASSOCIATES.COM14
0-7 BATCHES RUN AT FACILIT Y PER YEARTo continue our evaluation of issues such as batch failure rates, and to ensure we are capturing organizations involved in signifi cant manufacturing processes at various scales of manufacture, we again this year asked for estimates of the number of batches or production runs at the respondent’s facility (not the organization) over the past 12 months.
We found that for ‘Clinical Scale’ manufacturing, about half of the facilities reported producing between 1 and 20 batches per year (50.4%), a signifi cant drop from 71.4% in 2016, and a reversal of the trend upward since 2014. At the ‘Commercial Scale’, only 11.7% reported producing over 150 batches per year, up slightly from 10% in 2016. Most among those manufacturing reported running between 0-70 batches per year (75.9%), up from 74.2% last year.
To compare consistency of respondents’ operations, year-by-year, we evaluated the number of batches run/year. This year (asking about 2016), we found between “0-10” batches at ‘Clinical Scale’ were run by 44.5%, a decrease of 10.9% from 2016, and 52.5% were at ‘Commercial Scale’, an increase of 10% from last year. So, approximately half of respondents are operating with no, or a lower number of production runs for Clinical and Commercial manufacturing.
Fig 0.9: Distribution of Total Batches Run at Facility Last Year, by Scale of Production
How many total batches did your facility run during the past 12 months?
(Commercial vs Clinical Scale)10.9%
20.2%
13.4%
16.8%
20.2%
10.9%
3.4%
1.7%
0.8%
1.7%
34.0%
6.8%
11.7%
7.8%
6.8%
7.8%
1.0%
2.9%
5.8%
3.9%
11.7%
0
1-5
6-10
11-20
21-30
31-50
51-70
71-90
91-110
111-120
121-150
>150
Distribution of Batches Run, Clinical ScaleDistribution of Batches Run, Commercial Scale
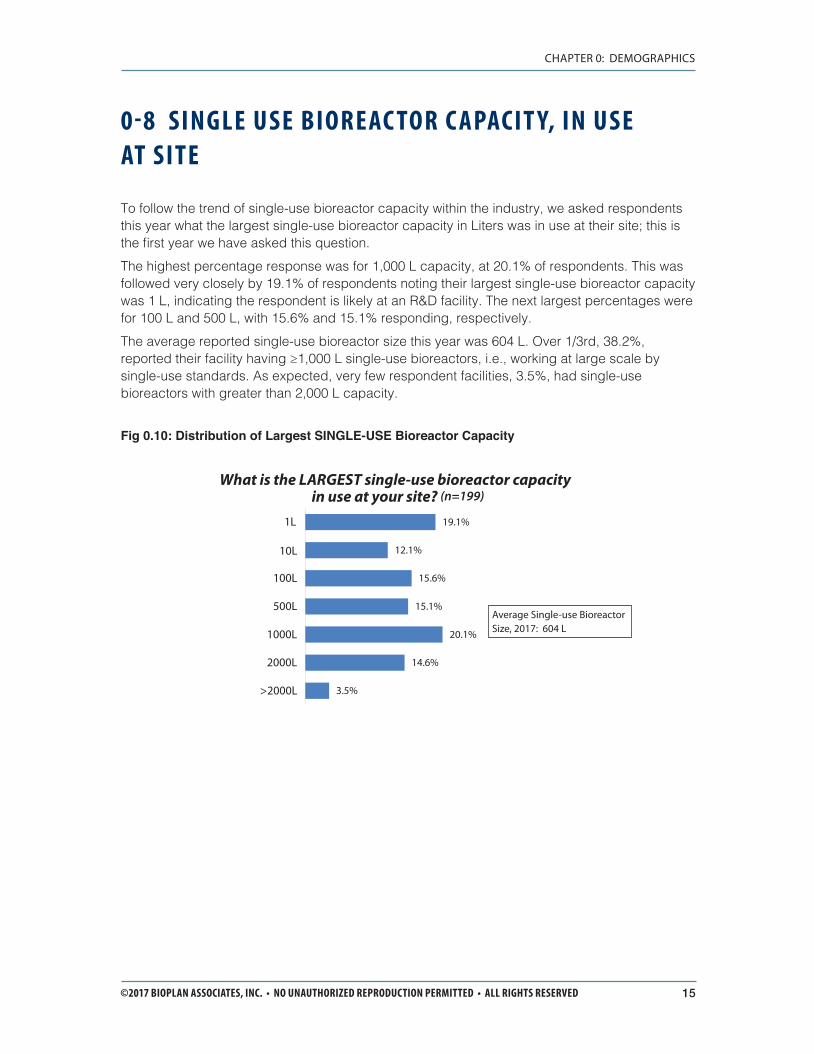
©2017 BIOPLAN ASSOCIATES, INC. • NO UNAUTHORIZED REPRODUCTION PERMITTED • ALL RIGHTS RESERVED 15
CHAPTER 0: DEMOGRAPHICS
0-8 SINGLE USE BIOREAC TOR C APACIT Y, IN USE AT SITE
To follow the trend of single-use bioreactor capacity within the industry, we asked respondents this year what the largest single-use bioreactor capacity in Liters was in use at their site; this is the fi rst year we have asked this question.
The highest percentage response was for 1,000 L capacity, at 20.1% of respondents. This was followed very closely by 19.1% of respondents noting their largest single-use bioreactor capacity was 1 L, indicating the respondent is likely at an R&D facility. The next largest percentages were for 100 L and 500 L, with 15.6% and 15.1% responding, respectively.
The average reported single-use bioreactor size this year was 604 L. Over 1/3rd, 38.2%, reported their facility having ≥1,000 L single-use bioreactors, i.e., working at large scale by single-use standards. As expected, very few respondent facilities, 3.5%, had single-use bioreactors with greater than 2,000 L capacity.
Fig 0.10: Distribution of Largest SINGLE-USE Bioreactor Capacity
What is the LARGEST single-use bioreactor capacity in use at your site? (n=199)
12.1%
15.6%
15.1%
20.1%
14.6%
3.5%
19.1%1L
10L
100L
500L
1000L
2000L
>2000L
Average Single-use Bioreactor Size, 2017: 604 L
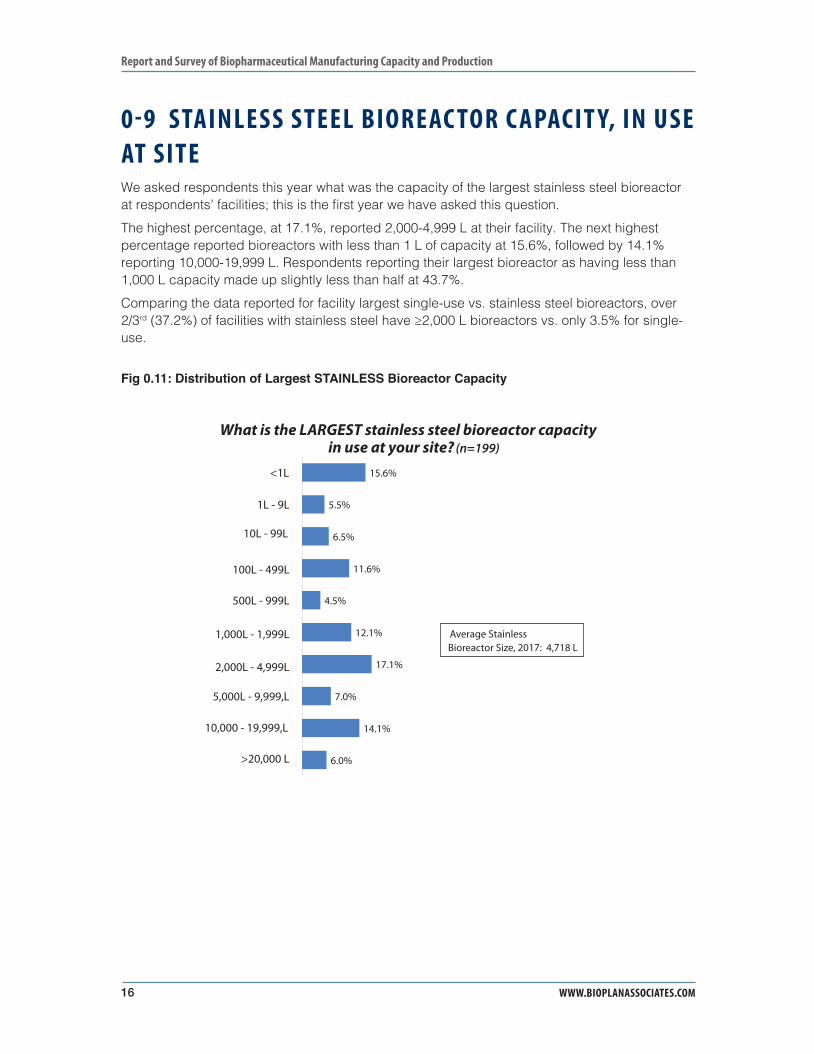
Report and Survey of Biopharmaceutical Manufacturing Capacity and Production
WWW.BIOPLANASSOCIATES.COM16
0-9 STAINLESS STEEL BIOREAC TOR C APACIT Y, IN USE AT SITEWe asked respondents this year what was the capacity of the largest stainless steel bioreactor at respondents’ facilities; this is the fi rst year we have asked this question.
The highest percentage, at 17.1%, reported 2,000-4,999 L at their facility. The next highest percentage reported bioreactors with less than 1 L of capacity at 15.6%, followed by 14.1% reporting 10,000-19,999 L. Respondents reporting their largest bioreactor as having less than 1,000 L capacity made up slightly less than half at 43.7%.
Comparing the data reported for facility largest single-use vs. stainless steel bioreactors, over 2/3rd (37.2%) of facilities with stainless steel have ≥2,000 L bioreactors vs. only 3.5% for single-use.
Fig 0.11: Distribution of Largest STAINLESS Bioreactor Capacity
What is the LARGEST stainless steel bioreactor capacity in use at your site? (n=199)
5.5%
6.5%
11.6%
4.5%
12.1%
17.1%
7.0%
14.1%
6.0%
15.6%<1L
1L - 9L
10L - 99L
100L - 499L
500L - 999L
1,000L - 1,999L
2,000L - 4,999L
5,000L - 9,999,L
10,000 - 19,999,L
>20,000 L
Average Stainless Bioreactor Size, 2017: 4,718 L
©2017 BIOPLAN ASSOCIATES, INC. • NO UNAUTHORIZED REPRODUCTION PERMITTED • ALL RIGHTS RESERVED 17
CHAPTER 1: I N T R O D U C T I O N A N D D I S C U S S I O N
C H A P T E R 1: I N T R O D U C T I O N A N D D I S C U S S I O N
1-1 INTRODUC TION: THE BIOPHARMACEUTIC AL INDUSTRYThe pharmaceutical and biopharmaceutical industries remain active, profi table and growing economic activities, despite about a decade ago having recovered from worldwide economic problems and increasingly being targeted for criticism for excessively high prices. There are estimated to be well over 10,000 therapeutics in R&D, both drugs (chemical substance pharmaceuticals) and biopharmaceuticals (biotechnology-derived pharmaceuticals), with nearly 40,000 ongoing (or recently reported) clinical trials. Among these, >40% or likely over approaching 5,000 candidate products in R&D are biopharmaceutical products.
A signifi cant portion of, about 1,400 products, in the development pipeline, are follow-on biopharmaceuticals, mostly biosimilars but also a large number of biobetters and biogenerics. The large number of biosimilars and biobetters in development indicate the maturation of the biopharmaceutical industry, as its current major products start to go off-patent. This activity represents a considerable shift in product mix and a rapidly increasing number of biopharmaceutical industry products from as short as fi ve or more years ago. This large proportion of R&D targeted to development of a large number of biopharmaceuticals (even if not innovative products) also refl ects a basic shift in the pharmaceutical industry from small molecule drugs to biopharmaceuticals as its new and most innovative and profi table products.
Until relatively recently, pharmaceutical companies of all sizes, particularly the Big Pharma-type companies that now do most biopharmaceutical R&D, have often continued to cut back on expenses as much as possible and consolidate R&D and companies, with the resulting companies often ending up concentrating on developing fewer products. But in terms of biopharmaceuticals, any such decrease in overall company R&D is likely currently being more than counter-balanced by both established and new companies moving into biopharmaceuticals. This increasingly includes a large number of new entrants into the cellular and gene therapies areas. But even if there were signifi cant pipeline shrinkage, this may simply refl ect the industry doing a better job in eliminating less promising candidates before they enter clinical trials. This ‘failing faster,’ i.e., earlier in development, is much less costly and disruptive than products failing later in development. If the industry is doing a better job of weeding out poor candidate products earlier, the industry may actually be on track for increased future success and increased productivity and profi ts, with fewer costly late-stage failures and a higher percentage of pipeline products making it to the market.

For Ordering Information on the Full Report, ContactBioPlan Associates, Inc.301-921-5979www.bioplanassociates.com/14th