Embed Size (px)
Citation preview
Th e global fi nancial crisis and the shift to shadow banking
Yeva Nersisyan* and L. Randall Wray*
While most economists agree that the world is facing the worst economic crisis since the Great Depression, there is little agreement as to what caused it. Some have argued that the fi nancial instability we are witnessing is due to irration-al exuberance of market participants, fraud, greed, too much regulation, etc. However, some post-Keynesian economists following Minsky have argued that this is a systemic problem, a result of internal market processes that allowed fragility to build over time. In this paper we focus on the shift to the ›shadow banking system‹ and the creation of what Minsky called the Money Manager phase of capitalism. In this system, rapid growth of leverage and fi nancial lay-ering allows the fi nancial sector to claim an ever rising proportion of national income – what is sometimes called ›fi nancialization‹ – as the fi nancial system evolved from hedge to speculative and fi nally to a Ponzi scheme.
Th e policy response to the fi nancial crisis in the US and elsewhere has largely been an attempt to rescue money manager capitalism. Moreover, in the case of the US the bailout policy has contributed to further concentration of the fi nancial sector, increasing dangers. We believe that the policies directed at saving the system are doomed to fail – and that alternative policies should be adopted. Th e eff ective solution should come in the way of downsizing the fi -nancial sector by two-thirds or more, and eff ecting fundamental modifi cations.
JEL classifi cations: G21, G23, G28Keywords: Institutional Investors; Financial Crisis; Financialization; Money Managers; Financial Concentration; Shadow Banking; Subprime Mortgages; Securitized Mortgages
* University of Missouri-Kansas City, USA.
Correspondence Address:Yeva Nersisyan / Randall Wray, Haag Hall 211, Economics Department, University of Missouri-Kansas city, 5100 Rockhill Road, Kansas city, MO 64110, USA, e-mail: [email protected] / [email protected].
Received 03 February 2010, accepted 06 July 2010
© INTERVENTION 7 (2), 2010, 377 – 400Downloaded from Elgar Online at 03/14/2022 04:12:23AM
via free access

378 Intervention. European Journal of Economics and Economic Policies
1. Introduction
Th ere is little doubt that the current crisis is the worst since the Great Depression. Proff ered explanations regarding the causes include: irrational exuberance, perverse incentives, greedy bankers, and misguided policy. Some economists who follow Minsky, however, have argued that the current crisis resulted from the fundamental fl aws of capitalism, and particular-ly of what Minsky called money manager capitalism (Wray 2009). It was not unexpected, and came as a ›shock‹ only to the ›true believers‹ of free markets, like Alan Greenspan and economists of the Chicago persuasion. As Minsky warned, stability is destabilizing and it is not surprising that in the context of deregulation and de-supervision starting in 1970s the fi nancial system had become prone to repetitive crises that became more frequent, se-vere, and longer-lasting.
Th is paper sheds light on the changes that have occurred in the US fi nancial system over the post war period as it came to take an ever larger share of income fl ows. Similar transformations have taken place in the global fi nancial system, but here we will focus on the US. An examination of the shift of the relative weights of various types of fi nancial in-stitutions as well as other developments in the fi nancial sector shows how the whole sys-tem evolved toward fragility. Increased concentration in the banking sector has created a few large ›too big to fail‹ institutions said to be of ›systemic importance‹ – institutions we would prefer to designate as ›too big to save‹ because they are ›systemically dangerous‹. Th is problem is exacerbated after each crisis as institutions that survive the crisis become big-ger and more powerful.
Meanwhile, even though large portions of managed money have been wiped out dur-ing the crisis, it is obvious that it has made a comeback and is looking for another bubble. And policy is actually pursuing a strategy of increasing the size and importance of the most dangerous institutions. Th e response in Washington has been to save these dangerous in-stitutions and then to propose creation of a ›systemic regulator‹. We believe the mega-in-stitutions are too complex and too politically powerful to eff ectively regulate. Hence, we propose downsizing institutions as well as the fi nancial system as a whole. Despite its re-cent anti-Wall Street rhetoric, the Obama administration has failed to bring any signifi cant changes to the way fi nance operates. Even Obama’s timid proposals, such as taxing banks that received bail-out money, are facing major resistance from the fi nanciers, thus, are un-likely to pass. As memories of the crisis fade away, the momentum for real change has been lost. Indeed, the policy response to date has sown the seeds for another crisis. We do not have the space to delineate specifi c alternatives, but argue that downsizing fi nance is a pre-requisite to achieving any success at restoring stability to the fi nancial system.
2. Financialization of the US economy
Minsky adopted a stages approach to the evolution of the fi nancial system, calling the cur-rent phase Money Manager Capitalism, characterized by »highly levered profi t-seeking or-
Downloaded from Elgar Online at 03/14/2022 04:12:23AMvia free access

Nersisyan/Wray: Th e shift to shadow banking 379
ganizations« such as money market mutual funds, mutual funds, sovereign wealth funds, and private pension funds (Minsky 1986/2008: 274). A number of structural changes have contributed to creating a fragile fi nancial system. Th e ultimate outcome is repetitive bub-bles, which turn into fi nancial crises after blowing up. With government bail-outs to save fi nancial institutions, after each crisis the fi nancial sector ›recovers‹ fi rst, leaving long last-ing impacts on the real economy in terms of lost output and prolonged unemployment – and setting the stage for the next collapse. While the typical recession since the early 1970s has been relatively shallow, recovery has taken a long time as job creation is slow to resume.
Minsky rightly argued that relatively robust performance of the economy immediate-ly after the post-war period was not due to the private sector becoming more stable, rather, it was the outcome of eff ective institutional constraints in the form of regulation, and crea-tion of the Big Government and Big Bank. Another factor conducive to stability was that most debts had been wiped out during the depression leaving the private sector with little debt – simplifying balance sheets in Minsky’s terms. Additionally, a large government defi -cit gave households and fi rms a safe fi nancial asset in the form of government debt that was leveraged to produce robust growth (Wray 2009). Over time, the ratio of government debt to GDP fell, while the private debt ratios grew.
Meanwhile, the New Deal Reforms ensured the fi nancial sector’s share of the econo-my remained fairly limited: it only performed a supporting role for the productive sector. A number of rules helped to restrict concentration in the fi nancial sector and forestalled the emergence of large institutions of ›systemic importance‹ – especially the Glass-Steagall Act that separated commercial banks from investment banks ensuring a guaranteed prof-it for the former, as well as interstate banking rules that helped to limit the size of institu-tions and made regulating them easier. Th us, the immediate post war period experienced a long expansion with mild recessions but no fi nancial crises. But stability is destabilizing, and this long period of robust growth created the necessary conditions for fi nancial crises to return. Financial innovations circumventing regulation eroded New Deal regulations, and the system gradually transitioned to fragility making another debt defl ation possible.
Over time, we saw an increasing role for the fi nancial sector, the so-called fi nanciali-zation of the economy. Unlike the early postwar period where fi nance played a peripheral role, largely supporting the industrial sector, in most developed countries it now dictated the rules of the game. Krippner defi nes fi nancialization as a »pattern of accumulation in which profi ts accrue primarily through fi nancial channels rather than through trade and commodity production« (Krippner 2005: 174). Indeed, the distinction between ›fi nance‹ and ›industry‹ disappeared as major manufacturers such as General Electric and General Motors constructed fi nancial arms that were (at times) far more profi table than their man-ufacturing business. Th is made the real economy vulnerable to the instability in the fi nan-cial sector – since a fi nancial crisis would threaten even manufacturers with bankruptcy.
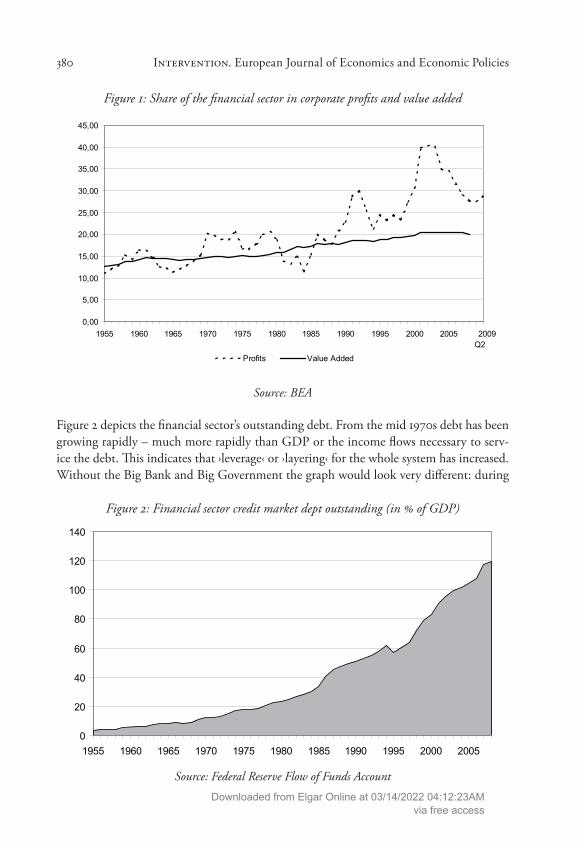
Figure 1 shows how the fi nancial sector’s share of corporate profi ts rose rapidly (es-pecially since the 1970s) while its contribution to gross value added has remained relative-ly stable. In recent years, while the fi nancial sector contributed just 20 per cent to GDP it reaped 40 per cent of corporate profi ts.
Downloaded from Elgar Online at 03/14/2022 04:12:23AMvia free access
380 Intervention. European Journal of Economics and Economic Policies
Figure 1: Share of the fi nancial sector in corporate profi ts and value added
0,00
5,00
10,00
15,00
20,00
25,00
30,00
35,00
40,00
45,00
1955 1960 1965 1970 1975 1980 1985 1990 1995 2000 2005 2009Q2
Profits Value Added
Source: BEA
Figure 2 depicts the fi nancial sector’s outstanding debt. From the mid 1970s debt has been growing rapidly – much more rapidly than GDP or the income fl ows necessary to serv-ice the debt. Th is indicates that ›leverage‹ or ›layering‹ for the whole system has increased. Without the Big Bank and Big Government the graph would look very diff erent: during
Figure 2: Financial sector credit market dept outstanding (in % of GDP)
0
20
40
60
80
100
120
140
1955 1960 1965 1970 1975 1980 1985 1990 1995 2000 2005
Source: Federal Reserve Flow of Funds Account
Downloaded from Elgar Online at 03/14/2022 04:12:23AMvia free access

Nersisyan/Wray: Th e shift to shadow banking 381
each crisis the level of outstanding debt would decrease due to defaults. Th at was exactly what happened over the course of the 1930s – so that the economy emerged from the de-pression with almost no private sector debt. But without a large-scale debt defl ation, the fi nancial sector has been allowed to expand outstanding debt to 120 per cent of US GDP.Hence, without a depression to wipe out debt, it continued to grow on trend. Th at is why the fi nancial sector was able to capture an ever-rising share of profi ts. Not only did this hinder ›real production‹ as fi rms and households had to devote larger portions of income to debt service, but also it focused capitalist attention on the fi nancial sector rather than the ›real‹ sector because it appeared to be more profi table.
2.1 Concentration and shift to the shadow fi nancial sector
Th e regulatory framework’s dismantling since the 1970s boosted growing concentration in the fi nancial system. US fi nancial institutions grew in part because of the elimination of niche banking, allowing big banks to engage in a larger variety of fi nancial activities. With globalization and the rise of securitization, many large domestic institutions became ac-tive participants in global fi nancial markets thus growing even bigger. Each sector came to be dominated by a few large institutions with each institution being so large as to be able to bring down the whole system if it failed. By 2007 the top 4 banks accounted for over 40 per cent of bank assets.
Another major transformation was the shift of the weight of the fi nancial system away from banks and toward ›markets‹ or what Minsky called managed money. Commercial banks and savings institutions have become a much smaller share of the fi nancial sector as seen from the relative shrinking of their assets. In 2007, institutional investors held about $24 trillion, or 38 per cent of total fi nancial assets of the fi nancial sector, compared to $12 trillion, or 19 per cent, held by banks (Flow of Funds Accounts). Th e rise of money managers has been accompanied by concentration of assets in each sector in the hands of very few institutions.
Figure 4 shows fi nancial sector total credit market debt outstanding. Credit market debt owed by commercial banks, fi nance companies and savings institutions has decreased while borrowing by issuers of ABS, Agency- and GSE-backed mortgage pools as well as funding corporations has grown. A remarkable change is the increase of credit market borrowing by ABS issuers: from nothing in 1984 to more than 20 per cent of total credit market borrow-ing in 2008. Issuers of ABS are Special Purpose Vehicles established to hold assets and issue debt obligations backed by those assets. Th ese are not actual institutions but rather entities created for bookkeeping purposes (Guide to Flow of Funds Accounts). Banks set up ABS issuers to move securitized assets from their balance sheets to that of the former. Th ese Spe-cial Purpose Vehicles then issue bonds and commercial paper which are backed by the as-sets in the pool. Th is allows regulated banks to avoid capital and reserve requirements – in-creasing leverage and return on equity.
Downloaded from Elgar Online at 03/14/2022 04:12:23AMvia free access

382 Intervention. European Journal of Economics and Economic Policies
Figure 3: Shares of fi nancial institutions (in % of total assets)
Commercial Banks
Savings Institutions
Managed Money
Life Insurance Companies
0
10
20
30
40
50
60
70
80
90
100
1945
1950
1955
1960
1965
1970
1975
1980
1985
1990
1995
2000
2005
Property-casualty InsuranceCompaniesLife Insurance Companies
Managed Money
Funding Corporations
Security Brokers and Dealers
Real Estate Investment Trusts
Finance Companies
Issuers of Asset-backed Securities
Agency- and GSE-backed MortgagePoolsGovernment-sponsored Enterprises
Credit Unions
Savings Institutions
Commercial Banks
Source: Federal Reserve Flow of Funds Accounts
Figure 4: Credit market debt owed by fi nancial institutions (in % of total owed by the fi nancial sector)
Government-sponsored Enterprises
Agency- and GSE-backed Mortgage Pools
ABS IssuersFinance Companies
0
10
20
30
40
50
60
70
80
90
100
1955
1958
1961
1964
1967
1970
1973
1976
1979
1982
1985
1988
1991
1994
1997
2000
2003
2006
Bank Holding Companies
Funding Corporations
Brokers and Dealers
REITs
Finance Companies
ABS Issuers
Agency- and GSE-backedMortgage PoolsGovernment-sponsoredEnterprisesLife Insurance Companies
Credit Unions
Savings Institutions
Commercial Banks
Source: Federal Reserve Flow of Funds Accounts
Downloaded from Elgar Online at 03/14/2022 04:12:23AMvia free access
Nersisyan/Wray: Th e shift to shadow banking 383
2.2 Th e banking sector
Following his dissertation advisor, Schumpeter, Minsky argued that banks are central to the operation of a capitalist economy and that the assets and liabilities of banks largely de-termine the fi nancial framework of the economy (Minsky 1986/2008: 354). Th e fragility of the fi nancial structure is based on the quality of loans made by bankers. If bankers fi nance risky operations, they become fragile. Before the invention of securitization, banks were interested in granting loans only to creditworthy customers. As Minsky argued, a success-ful loan offi cer was considered to be »a partner of a borrower« (Minsky 1986/2008: 260 – 261). Financial innovations such as securitization and Credit Default Swaps, however, have separated risk from responsibility, contributing to a deterioration of loan quality and hence greater fragility. Deregulation allowed banks to engage in all sorts of risky activities many of which are incompatible with the role banks are supposed to play. Many of the larger banks have changed so much that it is unclear whether they can be called banks – since they did little underwriting, and tried to shift risks off balance sheets – either by packaging and sell-ing assets or by purchasing ›insurance‹ in the form of CDSs.
As shown in Figure 5, the number of commercial banks has decreased by half to about 7,000 banks in the past two decades not counting the failure of many small banks that will come in the months ahead. Th is is remarkable considering that the number of institutions was almost constant at about 14,000 from 1934 to 1985. Of course this refl ected two trends: rising concentration but also the shift of importance to ›markets‹ or what are called shadow banks.
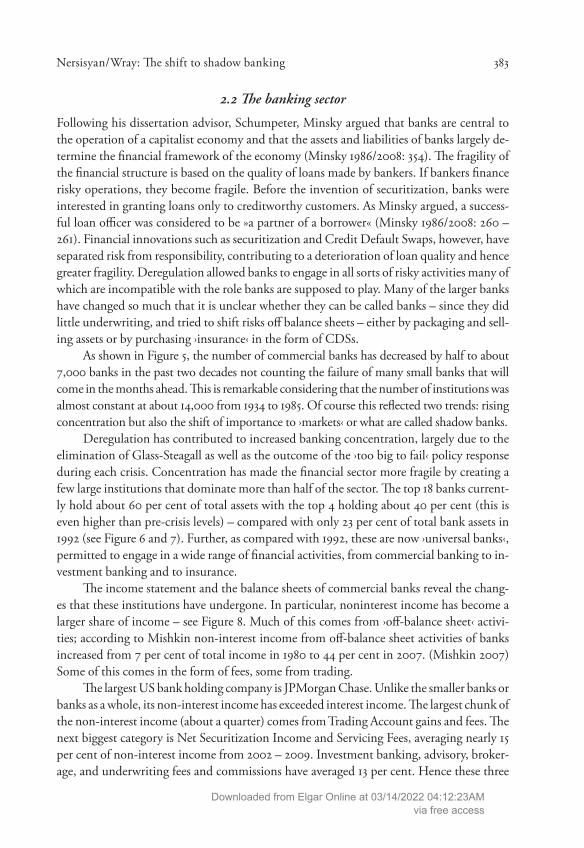
Deregulation has contributed to increased banking concentration, largely due to the elimination of Glass-Steagall as well as the outcome of the ›too big to fail‹ policy response during each crisis. Concentration has made the fi nancial sector more fragile by creating a few large institutions that dominate more than half of the sector. Th e top 18 banks current-ly hold about 60 per cent of total assets with the top 4 holding about 40 per cent (this is even higher than pre-crisis levels) – compared with only 23 per cent of total bank assets in 1992 (see Figure 6 and 7). Further, as compared with 1992, these are now ›universal banks‹, permitted to engage in a wide range of fi nancial activities, from commercial banking to in-vestment banking and to insurance.
Th e income statement and the balance sheets of commercial banks reveal the chang-es that these institutions have undergone. In particular, noninterest income has become a larger share of income – see Figure 8. Much of this comes from ›off -balance sheet‹ activi-ties; according to Mishkin non-interest income from off -balance sheet activities of banks increased from 7 per cent of total income in 1980 to 44 per cent in 2007. (Mishkin 2007) Some of this comes in the form of fees, some from trading.
Th e largest US bank holding company is JPMorgan Chase. Unlike the smaller banks or banks as a whole, its non-interest income has exceeded interest income. Th e largest chunk of the non-interest income (about a quarter) comes from Trading Account gains and fees. Th e next biggest category is Net Securitization Income and Servicing Fees, averaging nearly 15 per cent of non-interest income from 2002 – 2009. Investment banking, advisory, broker-age, and underwriting fees and commissions have averaged 13 per cent. Hence these three
Downloaded from Elgar Online at 03/14/2022 04:12:23AMvia free access

384 Intervention. European Journal of Economics and Economic Policies
Figure 5: Number of banks 1934 – 2008
0
2.000
4.000
6.000
8.000
10.000
12.000
14.000
16.000
1934
1939
1944
1949
1954
1959
1964
1969
1974
1979
1984
1989
1994
1999
2004
Source: Federal Deposit Insurance Corporation
Figure 6: Total assets and deposits held by top 18 banks (in % of total)*
0,00
10,00
20,00
30,00
40,00
50,00
60,00
70,00
1992 2002 2007 2008 2009*
Assets Deposits
Note: * As of June 30, 2009.
Source: Federal Deposit Insurance Corporation
Downloaded from Elgar Online at 03/14/2022 04:12:23AMvia free access
Nersisyan/Wray: Th e shift to shadow banking 385
categories together have been the source of more than 50 per cent of non-interest income. Indeed, at the peak of the boom, non-interest income was twice as big as net interest earn-ings as shown in Figure 9.
Figure 7: Share of total bank assets: 4 largest banks
0,00
5,00
10,00
15,00
20,00
25,00
30,00
35,00
40,00
45,00
1992 1994 1996 1998 2000 2002 2004 2006 2008
Chase Bank of America Citi Wells Fargo
Source: Federal Reserve Flow of Funds Accounts
Figure 8: Interest vs. non-interest income of all FDIC insured banks (in billions US $)
0
100
200
300
400
500
600
700
1934
1939
1944
1949
1954
1959
1964
1969
1974
1979
1984
1989
1994
1999
2004
Total Interest Income Total Non-Interest Income
Source: Federal Deposit Insurance Corporation
Downloaded from Elgar Online at 03/14/2022 04:12:23AMvia free access

386 Intervention. European Journal of Economics and Economic Policies
As Minsky argued, if bankers put emphasis on the value of collateral rather than expect-ed cash fl ows a fragile fi nancial system emerges because loan viability depends on expected market value of the assets pledged (Minsky 1986/2008: 261). Th is is precisely what has hap-pened: banks originated mortgages which largely depended on the value of the collateral and especially on the bubble to maintain rising prices. Commercial and Industrial loans have decreased from 20 per cent of total assets to 10 per cent on average. Th is indicates that the larger banks aren’t really in the business of making loans to businesses. Th erefore, the ma-jor rationale for bailouts of the biggest banks – that capital injections into the larger banks will get credit fl owing again to business – is fundamentally fl awed. Help for small and me-dium sized banks might lead to more business loans, but the biggest banks are largely fo-cused on other activities.
Table 1.1: Top 18 banks (% of assets)
1992 2002 2007 2008Net Loans and Leases 59.58 54.26 56.40 47.50All real Estate Loans 21.39 25.78 30.13 25.00Commercial Real Estate 4.29 4.09 3.77 3.711 – 4 family residential 11.47 18.18 21.89 17.34Commercial and Industrial Loans 20.67 13.11 11.80 10.91
Source: Federal Deposit Insurance Corporation
Figure 9: Chase: Interest vs. non-interest income (in thousands US $)
0
5.000.000
10.000.000
15.000.000
20.000.000
25.000.000
1992 1994 1996 1998 2000 2002 2004 2006 20080
1.000.000
2.000.000
3.000.000
4.000.000
5.000.000
6.000.000
Net Interest Income (LHS)Total Noninterest Income (LHS)Trading Account Gains and Fees (RHS)
Source: Federal Deposit Insurance Corporation
Downloaded from Elgar Online at 03/14/2022 04:12:23AMvia free access

Nersisyan/Wray: Th e shift to shadow banking 387
Table 1.2: Top 3 banks (% of assets)
1992 2002 2007 2008Net Loans and Leases 65.72 49.32 47.37 43.03All real Estate Loans 23.73 17.16 22.46 22.73Commercial Real Estate 3.53 2.00 1.83 1.911 – 4 family residential 13.48 12.33 17.69 17.22Commercial and Industrial Loans 21.58 13.84 11.68 10.28
Source: Federal Deposit Insurance Corporation
Table 1.3: All other banks (% of assets)
1992 2002 2007 2008Net Loans and Leases 55.46 61.17 67.79 65.83All real Estate Loans 25.79 32.81 40.85 41.78Commercial Real Estate 8.28 11.77 15.35 14.661 – 4 family residential 13.75 14.54 13.06 16.05Commercial and Industrial Loans 13.67 12.62 14.21 12.52
Source: Federal Deposit Insurance Corporation
Tables 1.1 – 1.3 show the loan composition of banks. We have divided the banks into 3 groups: the largest 3, the largest 18 and all remaining banks. Larger banks are quite diff erent from smaller banks in terms of the quantity as well as the type of loans. Th e largest 3 banks’ loans and leases have decreased from 65 per cent of total assets to about 43 per cent in just over 15 years. Real estate loans have remained relatively stable at around 22 per cent, how-ever, 1 – 4 family residential loans (which were the main product for securitization) have risen. A very important change is the decrease in commercial and industrial loans – from about 22 per cent of total assets to 11 per cent in the last 15 years. Th e picture is fairly simi-lar for the top 18 banks.
Commercial loans are granted with the expectation of future cash fl ows. Residential loans, on the other had, were increasingly made against the value of collateral. Reliance on residential mortgages made the banks vulnerable to changing conditions in the housing market thus giving rise to fragility.
Declining Net Loans and Leases has been accompanied by increasing trading. For ex-ample, at Chase trading has increased from 2.57 per cent of assets in 1992 to about 21 per cent of assets in 2008 and for BOA from 2.43 per cent of assets in 1992 to about 11 per cent in 2008. A decrease in loans has also been compensated by holding more securities (rising from 5 per cent to 17 per cent of assets), and particularly asset backed securities. At Citi-
Downloaded from Elgar Online at 03/14/2022 04:12:23AMvia free access

388 Intervention. European Journal of Economics and Economic Policies
bank loans and leases have decreased to about 44 per cent from over 64 per cent of assets. Securities peaked at the end of 2006 at over 20 per cent of assets and trading account as-sets at over 17 per cent of assets in 2007. In sum, these data show that the larger banks are diff erent from traditional banks: for the most part, lending to the productive sector is less important for them.
2.3 Innovations
Two ›innovations‹ played an especially important role in transforming the system towards fragility: securitization and credit default swaps. Th e two developments go hand in hand with banks securitizing every type of loan and the CDS issuers ›insuring‹ these securities. Th is was very important in promoting the belief that lack of underwriting was not impor-tant. Various kinds of insurance, including buy-back guarantees as well as CDSs made the securitized mortgages (and other types of loans) appear safe, thus, supported high prices for them. At the peak of the bubble mortgage backed securities were about 70 per cent of to-tal securities of the large banks and about 50 per cent for smaller banks. Larger banks secu-ritized from 40 to 60 per cent of 1-4 family residential loans, selling securities to managed money. AIG and other sellers of CDS were eager to ›insure‹ all these risks, enhancing credit.
CDSs are marketed as insurance, or a way to hedge against risks and therefore distribute it to market participants who are most willing and able to bear it. However, as Lewis (2009) nicely explains, CDSs create risk out of thin air, essentially allowing holders to make bets on the death of assets, fi rms or even national governments. CDS were initially used to safeguard investments in company bonds but with the increasing levels of securitization any type of debt came to be viewed as insurable by CDS. Wall Street banks also used CDS to mask the risks they had on their books. By engaging in risky activities and meantime ›hedging‹ by buying CDS banks seemed to remain relatively risk free in the eyes of regulators. It could get pretty convoluted because CDSs allowed one to make bets on failures of assets, fi rms, or even nations. Goldman Sachs for example declared that it was immune to AIG’s failure because it had hedged against that by buying CDS betting on AIG’s failure (Lewis 2009). In other words, Goldman could hold risky securities, purchase ›insurance‹ from AIG on those securities, then make a bet that AIG would fail to honor that insurance – and there-by seemingly protect itself from any risk. But for any such bet, there is a counterparty that must make good – and that is eventually what brought the whole superstructure to crisis.
Th e data on derivatives is impressive. JPMorgan Chase, for example, held derivatives worth 6,072 per cent of its assets at the peak of the bubble in 2007. Th e other two giants, Citigroup and Bank of America, although still far behind Chase, had 2,022 per cent and 2,486 per cent respectively. Goldman Sachs, the other giant, had an astonishing amount of derivatives on its balance sheets: 25,284 per cent of assets in 2008 and 33,823 per cent as of June 2009. Citigroup and BOA now have more of this risk on their books than before the crisis (FDIC, SDI database).
Downloaded from Elgar Online at 03/14/2022 04:12:23AMvia free access
Nersisyan/Wray: Th e shift to shadow banking 389
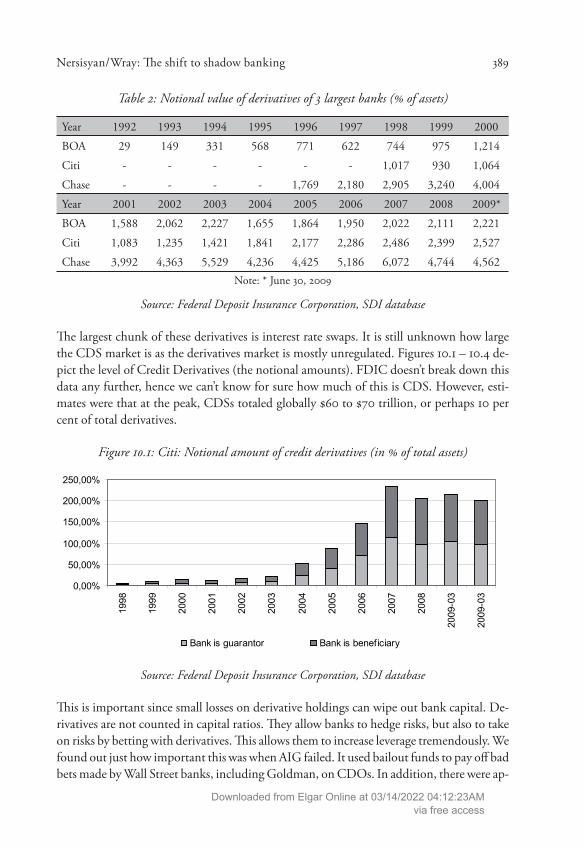
Table 2: Notional value of derivatives of 3 largest banks (% of assets)
Year 1992 1993 1994 1995 1996 1997 1998 1999 2000
BOA 29 149 331 568 771 622 744 975 1,214
Citi - - - - - - 1,017 930 1,064
Chase - - - - 1,769 2,180 2,905 3,240 4,004
Year 2001 2002 2003 2004 2005 2006 2007 2008 2009*
BOA 1,588 2,062 2,227 1,655 1,864 1,950 2,022 2,111 2,221
Citi 1,083 1,235 1,421 1,841 2,177 2,286 2,486 2,399 2,527
Chase 3,992 4,363 5,529 4,236 4,425 5,186 6,072 4,744 4,562Note: * June 30, 2009
Source: Federal Deposit Insurance Corporation, SDI database
Th e largest chunk of these derivatives is interest rate swaps. It is still unknown how large the CDS market is as the derivatives market is mostly unregulated. Figures 10.1 – 10.4 de-pict the level of Credit Derivatives (the notional amounts). FDIC doesn’t break down this data any further, hence we can’t know for sure how much of this is CDS. However, esti-mates were that at the peak, CDSs totaled globally $60 to $70 trillion, or perhaps 10 per cent of total derivatives.
Figure 10.1: Citi: Notional amount of credit derivatives (in % of total assets)
0,00%
50,00%
100,00%
150,00%
200,00%
250,00%
1998
1999
2000
2001
2002
2003
2004
2005
2006
2007
2008
2009
-03
2009
-03
Bank is guarantor Bank is beneficiary
Source: Federal Deposit Insurance Corporation, SDI database
Th is is important since small losses on derivative holdings can wipe out bank capital. De-rivatives are not counted in capital ratios. Th ey allow banks to hedge risks, but also to take on risks by betting with derivatives. Th is allows them to increase leverage tremendously. We found out just how important this was when AIG failed. It used bailout funds to pay off bad bets made by Wall Street banks, including Goldman, on CDOs. In addition, there were ap-
Downloaded from Elgar Online at 03/14/2022 04:12:23AMvia free access

390 Intervention. European Journal of Economics and Economic Policies
parently $10 billion in bad debts which AIG has so far refused to cover. Th ese appear to be pure gambling by its (bank) counterparties. Th at is, the banks placed bets on securities they did not hold. At the time of writing this paper, the information is still secret as the Federal Reserve Bank of New York (which handled the bailout of AIG) refuses to release the details.
Figure 10.2: Chase: Notional amount of credit derivatives (in % of total assets)
0,00%
100,00%
200,00%
300,00%
400,00%
500,00%
600,00%
1997
1998
1999
2000
2001
2002
2003
2004
2005
2006
2007
2008
2009
-03
2009
-06
Bank is guarantor Bank is beneficiary
Source: Federal Deposit Insurance Corporation, SDI database
Figure 10.3: BOA: Notional amount of credit derivatives (in % of total assets)
Source: Federal Deposit Insurance Corporation, SDI database
0,00%20,00%40,00%60,00%80,00%
100,00%120,00%140,00%160,00%180,00%200,00%
1997
1998
1999
2000
2001
2002
2003
2004
2005
2006
2007
2008
2009
-03
2009
-06
Bank is guarantor Bank is beneficiary
Downloaded from Elgar Online at 03/14/2022 04:12:23AMvia free access

Nersisyan/Wray: Th e shift to shadow banking 391
Figure 10.4: Goldman Sachs: Notional amount of credit derivatives (in % of total assets)
0,00%
100,00%
200,00%
300,00%
400,00%
500,00%
600,00%
31-December-2008 31-March-2009 30-June-2009
Bank is guarantor Bank is beneficiary
Source: Federal Deposit Insurance Corporation, SDI database
3. Disparate eff ects of the crisis on fi nancial institutions
Th ere has been a major redistribution of wealth and power in the fi nancial sector as a result of the crisis. Wall Street as a whole shrank but not all companies have been aff ected equally by the crisis as shown in Table 3. Th e market capitalization of Citigroup, for example, has shrunk 62 per cent since the peak of the market and it could shrink more since it is still on government support. Bank of America’s market value has decreased by 45 per cent since the peak. It has however, become bigger, in terms of asset size, by acquiring Merrill Lynch. JP-Morgan Chase has been the largest benefi ciary of the crisis, surpassing Citigroup and Bank of America as it became the largest bank in the US. Its value has decreased from the peak of the market but only by about 6 per cent, a small decline compared to its pears. To some extent it appears that this result is due to the more cautious approach that Morgan took to the new types of assets. Wells Fargo became the fourth largest bank in the US, in terms of assets, after acquiring Wachovia. It has grown over 12 per cent from the peak of the market. And note that peak was also the peak of the bubble.
So far, government has actually favored consolidation when faced with a failing fi nan-cial institution. By creating mega-institutions, government’s bail-out has given them immu-nity for future crises by labeling them ›too big to fail‹ and ›systemically important‹ (while it refuses to provide a list naming its favored institutions, the list certainly includes the top 20). Determining which institutions will be bailed out and which will go under, govern-ment has conducted a major redistribution of wealth and power that could have far reach-ing implications for the future.
Downloaded from Elgar Online at 03/14/2022 04:12:23AMvia free access

392 Intervention. European Journal of Economics and Economic PoliciesTa
ble 3
: Abs
olut
e and
rela
tive s
ize o
f lar
gest
insti
tutio
ns
Mar
ket p
eak
–O
ct 9
, 200
7 ($
bln)
Shar
e of
larg
est
29 a
t pea
k (%
)M
arke
t Tro
ugh
– M
arch
9,
2009
($bl
n)
Shar
e of
larg
est
29 a
t tro
ugh
(%)
Mar
ket c
apita
li-za
tion
as o
f Ja
nuar
y 26
, 20
10*
Shar
e of
larg
est
23 a
s of
Jan
26,
2010
(%)
Cha
nge i
n m
arke
t ca
pita
lizat
ion
from
the
peak
of t
he m
arke
t to
Jan
26, 2
010
(%)
Mar
ket c
apita
lizat
ion
of
29 la
rges
t ins
titut
ions
1870
100
290
100
725.
310
0.0
Citi
Gro
up23
6.9
12.7
5.8
2.00
89.7
10.3
-62.
1
Bank
of A
mer
ica
233.
312
.524
8.28
127.
814
.7-4
5.2
AIG
179.
89.
65.
71.
973.
30.
4-9
8.2
Cha
se16
18.
659
.820
.62
151.
517
.5-5
.9
Wel
ls Fa
rgo
124.
16.
642
.314
.59
139.
816
.112
.6
Gol
dman
Sac
hs10
3.5
5.5
37.3
12.8
677
.68.
9-2
5.1
Mor
gan
Stan
ley
73.4
3.9
17.7
6.10
37.2
4.3
-49.
3
Fann
ie M
ae65
.23.
52.
10.
721.
10.
1-9
8.3
Amer
ican
Exp
ress
744.
012
.54.
3145
.45.
2-3
8.6
Cap
ital O
ne30
.11.
63.
41.
1715
.91.
8-4
7.3
Bank
of N
Y M
ello
n51
.22.
720
.77.
1435
.44.
1-3
1.0
Fred
die
Mac
41.5
2.2
1.2
0.41
0.8
0.1
-98.
1
Mer
rill L
ynch
64.1
3.4
BofA
----
----
Wac
hovi
a10
1.7
5.4
Wel
ls Fa
rgo
----
----
Was
hing
ton
Mut
ual
31.3
1.7
Cha
se--
----
--
Lehm
an B
roth
ers
34.3
1.8
Bank
rupt
----
----
Not
e: *
Due
to la
ck o
f dat
a fo
r tot
al m
arke
t cap
italiz
atio
n of
the
rem
aini
ng 2
3 ins
titut
ions
, the
tota
l mar
ket c
apita
lizat
ion
for t
his d
ate
is th
e su
m o
f mar
ket
capi
taliz
atio
n of
the
insti
tutio
ns li
sted
in th
e ta
ble.
Sour
ce: N
ew Y
ork
Tim
es fo
r Octo
ber 2
007
and
Mar
ch 2
009;
Yah
oo F
inan
ce fo
r Jan
uary
26.
Downloaded from Elgar Online at 03/14/2022 04:12:23AMvia free access
Nersisyan/Wray: Th e shift to shadow banking 393
4. Policy response
Unlike many analyses of this crisis, including some that refer to Minsky’s work, our thesis is that this is a systemic crisis that cannot be resolved by ramping up regulations, or prohibiting the most dangerous practices. We see the current situation as somewhat analogous to that of the early 1930s – a crisis of fi nancial capitalism. In the aftermath of that earlier crisis, a new form of capitalism was created – what Minsky called managerial welfare-state capitalism or what Galbraith called the new industrial state. What we are arguing is that a similar major transformation is required – a new New Deal. Th us, while we agree with many commentators that the seeds of this current crisis can be found in deregulation, risky fi nancial innovations, fraud perpetrated by ›bad apples‹, and so on, we do not believe these analyses go far enough in recognizing the systemic nature of the crisis. Indeed, the deregulation itself was ›endogenous‹, to some extent required by the evolution of the system, competition from shadow banks, and so on. Th at is, the crisis was an endogenously created result of the postwar form of capitalism that can only be rectifi ed by measures re-directing the evolution of the system.
Our brief analysis of the mainstream policy proposals allows us to conclude that none of them will be eff ective in making the fi nancial system safer. A detailed analysis of those proposals as well as our solutions proposed here can be found in Auerback/Wray (2009), Nersisyan/Wray (2010), and Tymoigne/Wray (2009). We understand that the proposals presented below may sound too radical or politically unfeasible. But the New Deal reforms didn’t pass with ease either and indeed the fi nancial reforms were phased in over years. Th e current crisis was perhaps not painful enough to create the necessary political conditions for a meaningful reform. We fear that there will be another even deeper crisis not far in the future which will make our currently too radical policy proposals politically feasible.
When the bubble burst and a global crisis was created, it seemed that there was a gen-eral consensus for meaningful reform. It was obvious that deregulation, de-supervision, and self-regulation had failed and that real change was necessary to prevent the system from de-stroying itself. Additionally, reform was virtually required to attenuate public anger over the bailouts. In the eyes of many, the economy has survived the worst and is on a path to a recovery. Many economists now argue that it is time for the government to work out an exit strategy to downsize its share in the fi nancial sector. Th ose fearing infl ation have also argued that the Fed will soon need to start raising interest rates. Many on Wall Street, who were very eager to receive government support when their institutions were failing, are now arguing that government intrusions are unacceptable. In fact, despite major injections of bailout funds, the government has actually played a negligible role in the decision making of those fi rms it helped. One year after President Obama took over the government hasn’t made any signifi cant progress in reforming Wall Street.
Th ere have been few criminal prosecutions of the fi nancial geniuses who engineered the crisis. Executive pay is still at all-time highs with Goldman Sachs’ 30,000 employees expect-ed to get as much as $700,000 each in bonuses (Berenson 2009). On top of everything else, large banks still reap government subsidies: the Washington Post reports that banks with more than $100 billion in assets are getting a competitive advantage by being able to borrow at in-
Downloaded from Elgar Online at 03/14/2022 04:12:23AMvia free access
394 Intervention. European Journal of Economics and Economic Policies
terest rates 0.34 per centage points lower than rates charged to the rest of the industry (that advantage was only 0.08 per cent in 2007) (Cho 2009). Banks have been making record prof-its with Goldman Sachs, Merrill Lynch, Morgan Stanley and the investment banking divi-sion of JPMorgan Chase reporting $22.5 billion in earnings in the fi rst nine months of 2009.
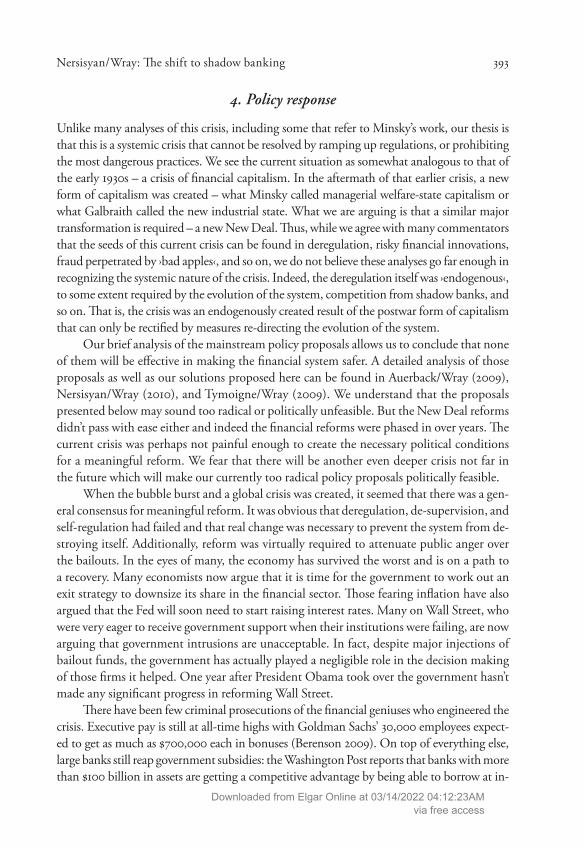
So we do realize that many point to reported profi ts of the megabanks as evidence that the policies have worked, although we are very skeptical of the claim that the crisis is over. Above we have argued that these policies have promoted consolidation and concentration. Further, they have permitted banks to continue to do what they were doing – that is, to en-gage in risky practices. It is not possible to say with certainty how banks have been able to manufacture profi ts even though they are not making loans, and even though they still hold billions of bad, delinquent loans. Th e reported profi ts come from trading activity. It is rel-atively easy to manufacture profi ts on trades of opaque assets that do not have real market prices – indeed, that is exactly what led to the crisis. We suspect that most of the reported profi ts result from ›quid pro quo‹ trades – you buy my bad assets at infl ated prices, I buy yours, and we both book big profi ts. Th at is exactly what US thrifts did in the 1980s. In any event, the fi nancial sector is again capturing an outsized share of corporate profi ts – which we believe is not a good sign even if the profi ts are real – as shown in Figure 11. In recent quarters the fi nancial sector has rallied (note: profi ts relative to GDP are indexed to 100 in the fi rst quarter of 2001). At the peak of the bubble, the fi nancial sector’s profi ts relative to GDP had increased by 50 per cent. In the crash, the fi nancial sector’s share fell to less than half of its 2001 value. However, it has already recovered to its 2001 share. Th e non-fi nancial sector’s profi t share also rose in the boom, but did not fall nearly so low in the crash – and its recovery has been far less robust.)
Figure 11: Profi ts of diff erent sectors as % of GDP (indexed to Q1 2001)
0
50
100
150
200
250
200
1-II
200
1-IV
200
2-II
200
2-IV
200
3-II
200
3-IV
200
4-II
200
4-IV
200
5-II
200
5-IV
200
6-II
200
6-IV
200
7-II
200
7-IV
200
8-II
200
8-IV
200
9-II
Total Domestic Industries Financial Sector Nonfinancial Sector
Source: BEA and authors’ calculations
Downloaded from Elgar Online at 03/14/2022 04:12:23AMvia free access

Nersisyan/Wray: Th e shift to shadow banking 395
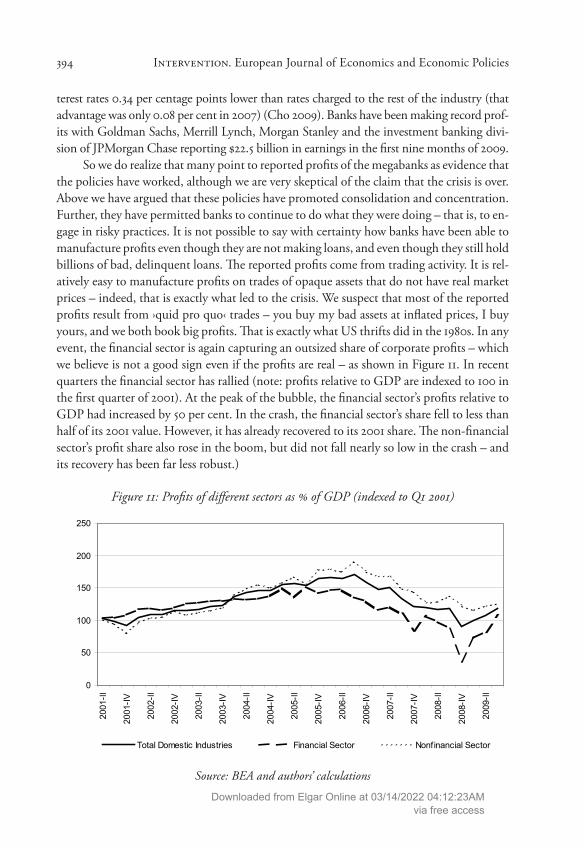
We are also doubtful that the US economy is really recovering. First, GDP got a big boost from the ›cash for clunkers‹ program in which the US government off ered a subsidy for new car purchases on the condition that older cars were crushed. Table 4 shows the boost this added to third quarter 2009 GDP growth: 1.45 per cent while total GDP growth was 2.2 per cent. More recently, most economic growth has resulted from inventory investment as business refi lled shelves. Th e 5.7 per cent GDP growth for the fourth quarter of 2009 came from 3.39 per cent growth in inventories and only 2.34 per cent growth in fi nal sales of do-mestic product. Since the stimulus package will have run out by summer 2010, and since no large fi scal package is likely to be forthcoming, we doubt that a true recovery will get underway. Finally, when we look at the global defl ationary pressures that exist – with the lone exception of the BRICs (Brazil, India and China) – we do not see where the impetus for growth will come from.
Table 4: Contributions to per cent change in real gross domestic product by major type of product (seasonally adjusted at annual rates)
Gross domestic product 2009-III 2009-IVTotal GDP Growth 2.2 5.7 Final sales of domestic product 1.54 2.34 Durable Goods 0.76 -0.01 Non-Durable Goods 0.15 1.71 Services 0.7 1.14 Structures -0.06 -0.5 Change in private inventories 0.69 3.39 Durable Goods 0.88 2.07 Non-Durable Goods -0.19 1.32Addenda: Motor vehicle output 1.45 0.61
Source: BEA
Obama warned Wall Street that this is going to be »the most ambitious overhaul of the fi -nancial system since the Great Depression«, but he is not going to impose real change:
»Instead, we are calling on the fi nancial industry to join us in a constructive eff ort to update the rules and regulatory structure to meet the challenges of this new century […]. We have sought ideas and input from industry leaders, policy experts, academ-ics, consumer advocates, and the broader public«. (Obama 2009)
Th e government is looking at Wall Street with naïveté, hoping it will reform itself. Howev-er, if something can be learnt from the crisis it is that we cannot rely on these institutions
Downloaded from Elgar Online at 03/14/2022 04:12:23AMvia free access

396 Intervention. European Journal of Economics and Economic Policies
to self-regulate. Geithner’s proposed legislation seeks to give the government the ability to take over failing giant institutions and to resolve them in an orderly manner to prevent rip-ple eff ects throughout the system. Th is proposal is not only not bold enough but is also re-dundant as the government already has the power to take over and resolve large institutions like it did in case of the Continental Illinois bank (Johnson 2009). Hence, the regulatory reform proposal of the administration is timid and appears to be aimed at saving the sys-tem as it is, without any major changes. But even a conservative proposal like this is high-ly unlikely to make it far considering the strong resistance from the fi nancial sector and its track record of eff ectively blocking any change it doesn’t like.
A progressive policy aimed at solving the issue of too big to fail institutions would break down every institution that is considered to be ›systemically important‹ into small-er functional pieces. Too big to fail institutions shouldn’t be allowed to exist. Th ey are too complex and too big to be safely managed and resolved if necessary. Allowing such institu-tions to exist gives too much power, both market and political, to behemoths. Instead, the FDIC should be required to determine which large banks are insolvent based on current market values. Th e balance sheets of the top 20 banks should be examined on a consolidat-ed basis, with derivative positions netted (data indicates that most derivatives are held by the biggest banks, which serve as counterparties for one another). After netting positions the insolvent banks would be resolved following two principles: resolution at the least cost to the FDIC and with a view to downsizing institutions. Th e ultimate objective must be to minimize impacts on the rest of the banking system. It will be necessary to cover some uninsured losses to other fi nancial institutions (smaller commercial banks that are other-wise solvent) as well as to equity holders (such as pension funds) arising due to the resolu-tion (Auerback/Wray 2009).
Close regulation of securitized products and establishing a centralized clearinghouse for derivative trades is the second major component of the plan. Originators of securitized products would have to keep some portion of those assets on their books. However, a large part of the disturbances of the early 2008 were due to Bear Stearns, Lehman Brothers, and others doing exactly that (Johnson 2009). Th is and other types of recursive arrangements were the main reason why many institutions went insolvent and were near the brink of fail-ure. Th is proposal is actually rather conservative considering the role that mortgage backed securities played in the debacle of the fi nancial system. Even today many supporters of se-curitization defend it as a good tool for distributing risks to those who are most willing to bear it. But we have learnt during this crisis that those who are most willing to bear the risk might not always be able to do so. Moreover, distributing risk doesn’t eliminate it from the system – indeed it increases it by removing the incentive to underwrite. Without going further into detail on the fl aws of securitization which have been extensively examined, we argue that securitization should be forbidden altogether as an activity that regulated and protected banks would be permitted to undertake. By separating risk from responsibility, it creates perverse incentives and helps generate bubbles which will inevitably burst. Auer-back argues that banks should be required to keep loans on their balance sheets as there is
Downloaded from Elgar Online at 03/14/2022 04:12:23AMvia free access

Nersisyan/Wray: Th e shift to shadow banking 397
no public purpose served by selling loans to third parties. And as we have seen there can be substantial negative consequences (Auerback 2009).
Many critics have proposed legislation to deal with the issue of credit default swaps, a major factor behind magnifying the eff ects of the crisis. For example, a popular proposal is to create a regulated exchange for Credit Default Swaps and other fi nancial derivatives through which banks and other fi nancial institutions will be required to trade these instru-ments. Th at would make the market more transparent, and could reduce counterparty risk. But even this very conservative policy has received strong resistance from the fi nancial sec-tor and going into the third year of the crisis, the derivatives market is still largely unregu-lated. Th e fi nancial lobby is actively working to water down any regulatory tightening on derivatives, a major source of profi ts and hence bonuses for the banks.
We think that it would be best to simply forbid regulated and protected banks from using credit default swaps – they should bear the risks so that they have an incentive to do proper underwriting. Hence we agree with analysts who have rightly argued that banks should be forbidden to buy or sell credit default insurance as they don’t serve any public purpose. Th ese are merely a vehicle for the fi nancial sector for redistributing wealth and reaping massive profi ts. CDS allow the lender to be paid off even when the borrower de-faults on their asset thus making the bank indiff erent to the creditworthiness of the bor-rower. Th e solution to the CDS problem is to make big banks net out gross CDS positions among themselves and then forbid their use of Credit Default Swaps altogether. (Auerback/Wray 2009, Tymoigne/Wray 2009)
Perhaps the best part of the proposal put forward by Washington, and the one least likely to pass is the creation of a new Consumer Finance Protection Agency which would protect consumers from deceptive practices and abuse. It would have the powers to regu-late mortgages, credit cards and any other form of consumer debt. As NY-Times reports, however, big fi nancial institutions have unifi ed with smaller community banks to fi ght against the creation of this agency (Labaton/Zeleny 2009). We realize that the Fed would like to take over control of this function, but it has demonstrated over the past several dec-ades that it is particularly ill-suited to protect consumers. It is captured by its owners – the member commercial banks.
Most recently, under the pressure of public anger, Obama proposed a new ›Volcker Rule‹ that would prohibit regulated and publicly insured fi nancial institutions from oper-ating hedge funds, private equity funds, or engaging in proprietary trading. Th e expecta-tion is that by somewhat limiting the types of activities these institutions can be engaged in, their further consolidation will be prevented and they will even shrink. Th is is a step in the right direction but is not nearly enough to make the fi nancial sector safe. Any insti-tution that has access to the Fed and to the FDIC should be prohibited from making any kinds of trades. Th ey should return to their traditional roles of making loans, purchasing securities, and then holding them through maturity. Any bank that is unhappy with these new conditions can hand back its bank charter and become an unprotected fi nancial insti-tution. Th ose that retain their charters will be treated as public-private partnerships, which is what banks are. Th ey put up $5 of their own money, then gamble with $95 of government
Downloaded from Elgar Online at 03/14/2022 04:12:23AMvia free access

398 Intervention. European Journal of Economics and Economic Policies
(guaranteed) money. Th e only public purpose they serve is underwriting – and that only works if they hold all the risks.
And fi nally, the solution to the current mess should not bypass the issue of fraud. It is rampant in the fi nancial sector and has certainly increased since the crisis (Where do you think all of those record profi ts come from?). Fraudulent institutions must be shut down, investigated and their management jailed (Black 2009 and various Congress testimonies and posts on NEP).
It is obvious that the bailout policies haven’t worked to fi x the economy. Trying to save the system as it is and even exacerbating the already existing problems along the way create the necessary conditions for another massive fi nancial crisis and even a depression to oc-cur in the not so remote future. Bank balance sheets haven’t been simplifi ed, fi nancial in-stitutions haven’t been restructured and concentration problems haven’t been resolved. Th e only changes that have taken place have been superfi cial and have contributed to making the system even more fragile. Debts are still at historically high levels. Th e large four banks have derivatives on their balance sheets which are thousands of times more than their as-sets. Th e fundamental causes of the crisis haven’t been addressed; the system today is in a worse shape than it was prior to the crisis. Th e reforms proposed by the government will not prevent any future crises and they wouldn’t have prevented this one if they were in place.
Th e more progressive policies proposed above would help simplify the fi nancial sys-tem, reduce concentration, and decrease its size relative to the economy, something that the administration’s proposal will fail to achieve. We will also need debt relief for house-holds. Th is can include a package of policies that would replace unaff ordable mortgages with better terms provided by strengthened GSEs. Some underwater mortgages should be foreclosed, with homeowners converted to renters with an option to repurchase the home later. Tax relief and job creation will help to boost ability to service debt, and will help to jumpstart the economy so that fi rms can stop downsizing. Th e public retirement system will need strengthening and real health care reform is required (Nersisyan/Wray 2010, Au-erback/Wray 2010).
Th e role of managed money must be reduced; this can be encouraged by eliminat-ing various subsidies including tax-advantaged saving. In the place of private pensions we need to expand and strengthen publicly provided pensions. Of course, all of this is a move-ment in the opposite direction to that currently envisioned by the Obama administration – which is actually trying to increase the fi nancialization of health care by forcing all indi-viduals to purchase health ›insurance‹. And managed money is looking to fi nancialize death (through securitization of ›death settlements‹, buying up life insurance policies of people with terminal illnesses) (Auerback/Wray 2009). Managed money is searching for its next bubble which is probably in commodities futures (again) or carbon futures trading. Unless it is constrained, another boom and bust is inevitable.
Minsky argued that depressions play a useful role for capitalist economies: they sim-plify balance sheets by wiping out fi nancial assets and liabilities. Th e result is a system where hedge units are a majority and which therefore is relatively stable. One reason why fi nancial fragility has built up over time in the post-war period was because there were no depres-
Downloaded from Elgar Online at 03/14/2022 04:12:23AMvia free access
Nersisyan/Wray: Th e shift to shadow banking 399
sions. To be sure, there were fi nancial crises that wiped out a signifi cant proportion of debt in the economy. But as Big Government and Big Bank set fl oors and ceilings in the econo-my, each time the system recovered with still high levels of debt. But the experience shows that this is not sustainable. While we are not advocating that the government allow a 1930s style debt defl ation, we argue that for any policy to be eff ective in the longer run, it needs to involve balance sheet simplifi cation but without depression.
Th e government has all the powers necessary to re-regulate Wall Street. New Deal re-forms were very successful in containing instability for a couple of decades. But innovations as well as deregulation rendered these ineff ective. Minsky argued that the Fed and legisla-tion can guide the evolution of the fi nancial system to constrain instability by encouraging institutions and practices that reduce instability and constraining those that enhance it. He also argued that if the Fed can intervene to put a fl oor on the collapse it must also »take in-itiatives to prevent the development of practices conductive to fi nancial instability« (Min-sky 1986/2008: 349). Th e current crisis was a warning sign. Th e question is: will we take this warning seriously and reform the system or do we need another Great Depression to fi nally bring about real change?
»Th e profi t-seeking bankers almost always win their game with the authorities, but, in winning, the banking community destabilizes the economy; the true losers are those who are hurt by unemployment and infl ation.« (Minsky 1986/2008: 279)
As long as there are large pools of managed money looking for high returns, the question is where the next bubble will develop. Th e only hope is a substantial downsizing of man-aged money, which will help to reduce the infl uence of money managers on our economy and our political system.
References
Auerback, M., Wray, L.R. (2010): Toward true health care reform: More care, less insurance, Public Policy Brief No. 110, Levy Economics Institute, March 2010.
Auerback, M., Wray, L.R. (2009): Banks running wild: Th e subversion of insurance by ›Life Settlements‹ and Credit Default Swaps, Policy Note, Levy Economics Institute, 2009/9.
Auerback, M. (2009): Obama’s fi nance reform speech fi zzles; big banks set to reinfl ate bubble, posted on New Deal 2.0 Website, September 16, 2009, URL: http://www.newdeal20.org/2009/09/16/obamas-finance-reform-speech-fizzles-big-banks-set-to-reinflate-bubble-4726/.
Berenson, A. (2009): A year after a cataclysm, little change on Wall St., in: Th e New York Times, September 12, 2009.
Black, W. (2009): Systematically dangerous institutions, New Economic Perspectives Blog, October 15, 2009, URL: http://neweconomicperspectives.blogspot.com/2009/10/systemically-dangerous-institutions.html.
Cho, D. (2009): ›Too big to fail‹ have grown even bigger: Behemoths born of the bailout reduce consumer choice, tempt corporate moral hazard, in: Washington Post, August 28, 2009.
Downloaded from Elgar Online at 03/14/2022 04:12:23AMvia free access
400 Intervention. European Journal of Economics and Economic Policies
Flow of Funds (2009): Accounts of the United States, 1945 – 2008, June 11, 2009.Guide to Flow of Funds Accounts, Volume 2.Johnson, S. (2009): Th e defanging of Obama’s regulation plan, in: Th e New York Times, June
18, 2009.Krippner, G. (2005): Th e fi nancialization of the American economy, in: Socio-Economic Re-
view, 3(2), 173 – 208.Labaton, S., Zeleny, J. (2009): For Obama, a chance to reform the Street is fading, in: Th e New
York Times, September 15, 2009.Lewis, M. (2009): Th e man who crashed the world, in: Th e Vanity Fair, August.Minsky, H.P. (1986/2008): Stabilizing an Unstable Economy, New York: McGraw Hill.Mishkin, F. (2007): Th e Economics of Money, Banking and Financial Markets, 8th ed., Boston:
Pearson Education.Nersisyan, Y., Wray, L.R. (2010): Th e trouble with the pensions: Toward an alternative public
policy to support retirement, Public Policy Brief No. 109, Levy Economics Institute, March 2010.
Obama, B. (2009): Normalcy cannot lead to complacency, Speech delivered in New York, September 14, 2009, available at URL: http://www.whitehouse.gov/blog/Normalcy-Cannot-Lead-to-Complacency.
Tymoigne, E., Wray, L.R. (2009): It isn’t working: Time for more radical policies, Public Policy Brief No. 105A, Levy Economics Institute, October 2010.
Wray, R.L. (2009): Th e rise and fall of money manager capitalism: A Minskian approach, in: Cambridge Journal of Economics, 33, 807 – 828.
Downloaded from Elgar Online at 03/14/2022 04:12:23AMvia free access


![Light Space Perspective Shadow Maps · rameterize the shadow map is to tilt or warp the shadow plane directly [CG04, LI03]. Recent approaches propose to combine shadow maps with shadow](https://img.pdfslide.net/doc/110x75/5e37bd5178a8d5075e57de01/light-space-perspective-shadow-maps-rameterize-the-shadow-map-is-to-tilt-or-warp.jpg)