Embed Size (px)
Citation preview
9Th e ‘Miracle’ Still Waiting to Happen
Performance of India’s Manufactured Exports in Comparison to China
C. Veeramani*
* I am thankful to K.L. Krishna and Vikas Chitre for helpful comments on an earlier draft of this chapter.
INTRODUCTION
At the end of the 1950s, India turned to a strategy of industrialization based on import substitution. China too adopted the heavy-industry oriented development strategy (also known as the leap forward strategy) during the early 1950s. Both the countries introduced a battery of trade and exchange controls, which severed the link between domestic and world relative prices. Exchange rates were overvalued creating a bias against exports in both the countries (Lal 1995). By contrast, the East Asian tiger economies adopted export promoting policies (Weiss 2005). Thus, India’s ‘Hindu rate of growth’ under import substitution was oft en contrasted with the growth ‘miracle’ that the East Asian tigers had experienced under export promoting policies. As the East Asian ‘miracle’ gained widespread attention and as doubts about the eff ectiveness of import substitution arose in other countries, it became common practice to recommend the East Asian model for other countries wishing to accelerate the pace of their industrialization and economic growth (Bhagwati 2002). China started
its trade liberalization process in earnest in 1978, while India introduced ‘cautious’ liberalization during the 1980s, focusing on internal deregulation rather than on trade liberalization. Th e most pronounced overhaul of India’s trade policy regime occurred during the early 1990s in response to a severe balance of payment crisis. Th e post-1991 policy changes in India have gone a long way towards product market liberalization by easing entry barriers for domestic and foreign fi rms in manufacturing industries. However, it must be noted at the outset that India’s factor markets (labour and land) are still plagued by severe distortions and policy induced rigidities. Subsequent to market-oriented reforms, both India and China have been successful in achieving a turnaround in their economic growth rates. Today, India and China are among the fastest growing economies of the world. However, certain important contrasts are evident in the growth process in the two countries. China’s growth pattern exhibits striking similarities with the manufacturing-based export-oriented growth of the East Asian tigers while Indian growth reveals some notable idiosyncrasies. China followed the conventional pattern of shift ing labour from agriculture to labour-intensive manufacturing. By contrast, India seems to be skipping the intermediate stage of industrialization and directly moving to the fi nal stage of services-led growth.

During the last two decades (1990–2010), the share of manufacturing in India’s GDP remained low in the range of 14–17 per cent as against 30–33 per cent for China. International comparisons suggest that the actual manufacturing share of GDP for India was lower than what was predicted while the opposite is the case for China (ADB 2007).1 Further, in contrast to employment-intensive growth in China, India’s manufacturing growth followed a relatively capital-intensive path.2 Th e share of manufactures in India’s merchandise exports declined from about 70 per cent in 1990 to 63 per cent in 2010. In contrast, the share of manufactures in China’s merchandise exports increased from 71 per cent in 1990 to 94 per cent in 2010. Unlike in China, exports have not yet become a major engine of growth in India’s manufacturing sector. Between 1990 and 2010, China’s share in the world exports of manufactures steadily increased from about 2 per cent to a whopping 15 per cent while India’s share increased from 0.5 per cent to just 1.4 per cent. Th e lack of dynamism in labour-intensive manufacturing has considerably slowed down the process of transferring the large pools of India’s surplus labour from agriculture into the well paying modern sectors.3 Agriculture accounted for 17 per cent of India’s GDP in 2009, but employed 52 per cent of the total workforce. Th us, Indian growth has not been eff ective in reducing poverty on the scale that was possible in China and other industrialized countries of East Asia. Th e experience of the successful East Asian countries shows that rapid industrialization, based on the expansion of labour-intensive manufactured exports in the early phase of development is crucial for employment generation and sustained poverty reduction (Islam 2008). Drawing upon the experience of China’s export success in manufacturing, this chapter attempts to provide explanations for India’s lacklustre performance. Th e chapter highlights certain idiosyncrasies pertaining to the pattern of
1 Predicted shares are calculated from a cross-country regression of manufacturing shares on GDP per capita, GDP per capita squared, population and foreign trade to GDP ratio. For 2000, the predicted shares are about 20 and 27 per cent respectively for India and China while the actual shares are 16 per cent for India and 35 per cent for China (ADB 2007: 294).
2 Th at India’s manufacturing growth followed a relatively capital-intensive path is evident from the much smaller growth rate of employment than capital stock and value added. During 1973–2003, registered manufacturing employment grew slowly (1.3 per cent per annum) while capital stock grew faster (7.3 per cent per annum) than manufacturing value added (6 per cent) (see Gupta et al. 2010).
3 Typically, employment in manufacturing only requires on-the-job training whereas employment in formal service sectors (such as banking, insurance, fi nance, communications, and information technology) requires at least college level education.
specialization, structure of trade, and the nature of inward foreign direct investment in Indian manufacturing. Th e remainder of the chapter is organized as follows. Th e next section briefl y discusses the relative contribution of the manufacturing sector to aggregate GDP and merchandise exports in India and China. As shown by the Heckscher-Ohlin model, the workhorse of international economics, a country’s export structure is intrinsically linked to its relative factor endowments. Th erefore, in order to put the empirical analysis in perspective, the next section discusses trends in relative factor endowments (physical capital, arable land, human capital etc.) in the two countries. In the section that follows, we analyse the changes in the commodity pattern of exports and interpret the fi ndings in light of the observed changes in relative factor endowments in the two countries. Th e next section discusses the extent to which India’s manufacturing industries are linked to the vertically integrated global production networks. Th e next section deals with the geographical direction of manufacturing exports from India and China. Finally, the last section provides a conclusion and draws some policy implications.
RELATIVE CONTRIBUTION OF THE MANUFACTURING SECTOR TO GDP AND EXPORTS
The decade-wise average growth rates of GDP across sectors in India and China during the period 1970–2010 are depicted in Figures 9.1 and 9.2 respectively. It is clear that throughout the period the service sector was the fastest growing sector in the Indian economy followed by industry. A similar trend can be observed in China during the 1970s and 1980s, but industry emerged as the fastest growing sector in that country during the more recent decades of the 1990s and the 2000s. During the period 1950–2 to 1964–6, India’s registered manufacturing output grew at a rate of about 5 per cent per annum, which is substantially below the growth rates recorded by a number of other comparable countries (Brazil, Mexico, Pakistan, Philippines, and Taiwan) during this period (Little et al. 1970). Th e years since the early 1970s witnessed some improvement with a growth rate of 6 per cent per annum for 1973–2003, but the trend growth rate during the post-1991 reform period showed little change (Gupta et al. 2010). Overall, this growth performance is respectable, but pales in comparison with the performance recorded by East Asian NIEs and China (Weiss 2011). During 2000–10, manufacturing GDP grew at a rate of 8.7 per cent per annum in India while it grew at a much higher rate of 11.6 per cent in China. Th e major contrasts between the economies of India and China are clearly evident in Table 9.1 which presents the
the ‘miracle’ still waiting to happen 133

134 india development report
Figure 9.1 Average Annual Growth Rates Across Sectors, India, 1970–2010Source: World Development Indicators, the World Bank.
Figure 9.2 Average Annual Growth Rates Across Sectors, China, 1970–2010Source: World Development Indicators, the World Bank.
12.0
10.0
8.0
6.0
4.0
2.0
0
1970–80 1980–90 1990–2000 2000–10
Agriculture Industry Services Manufacturing Total
16.0
14.0
12.0
10.0
8.0
6.0
4.0
2.0
0
1970–80 1980–90 1990–2000 2000–10
Agriculture Industry Services Manufacturing Total
sectoral composition of GDP in the two countries. In con-trast to China, where the industrial sector always accounted for the largest share of GDP, services held the dominant share in India’s GDP (except in 1970 when agriculture was the leading sector). As one would expect, the share of agriculture declined with growth in both the countries. Th e
share of manufacturing in India’s GDP virtually remained constant in the range of 14–17 per cent during 1970–2010. During the same period, manufactures’ share in China’s GDP was in the much higher range of 30–40 per cent. In 2010, manufacturing accounted for about 14 per cent of India’s GDP while its share was 30 per cent for China.

the ‘miracle’ still waiting to happen 135
While services and industry accounted for the largest shares of output in India and China respectively, agriculture contributed to the largest share of employment in both the countries (Table 9.2). However, consistent with its declining share in GDP, workers moved out of agriculture, but the decline in the share of employment in agriculture was much larger for China. Agriculture’s share in employment declined from 62 per cent in 1994 to 51 per cent in 2010 in India while it declined faster, from 54 per cent in 1994 to 40 per cent in 2008, in China.4 Th e contributions of the industrial and service sectors in total employment was higher for China than for India. Since manufacturing output is far more tradable than services, India’s low share of manufacturing output resulted in a low trade to GDP ratio. Th us, exports of goods and services as a percentage of GDP was much lower for India (average of 21 per cent for 2006–10) compared with China (average of 34 per cent for 2006–10). Likewise, as Panagariya (2007: 234) noted ‘in labour-abundant economies such as China and India, the direct foreign investment is attracted principally to the manufacturing sector to take advantage of lower wages’. Th us, India’s low share of manufacturing output also means less foreign direct investment (FDI). Hence, the
4 It is likely that China’s statistics signifi cantly overestimate its employment share in agriculture because a signifi cant proportion of migrant workers employed in cities may be reporting their occupation as agriculture.
diff erences in the share of manufacturing output are part of the explanation why China is able to attract a much higher inward FDI fl ows compared with India.5 Figure 9.3 shows the changes in the share of manufacturing in total merchandise exports. It is interesting to note that during the 1980s manufacturing accounted for a higher share of India’s export than that of China’s. However, this pattern got reversed since the early 1990s, with the share of manufacturing in China’s exports showing steady increases and remaining considerably higher than that of India’s. In 2010, manufacturing constituted about 94 per cent of China’s merchandise exports while the similar fi gure for India was 63 per cent. Table 9.3 reports the average annual growth rates for different categories of exports—manufacturing, non-manufacturing, and services—for India, China, and the world. Compared to the previous two decade of the 1980s and 1990s, India’s total exports (merchandise plus services) grew at a faster rate of 22 per cent per annum during the fi rst decade of the 21st century, matching the growth rates of China for the fi rst time. During 2000–10, India’s service exports registered a higher growth rate than China’s while India’s merchandise exports registered a lower growth rate.
5 Inward FDI infl ows as a percentage of GDP was 2.5 per cent for India (average for the period 2006–10) while the corresponding fi gure was nearly 4 per cent for China (estimated from World Development Indicators, World Bank).
Table 9.1 Sectoral Composition of GDP (% shares)
India China 1970 1980 1990 2000 2010 1970 1980 1990 2000 2010Agriculture 42.3 35.7 29.3 23.4 19.0 35.2 30.2 27.1 15.1 10.1Services 36.9 39.6 43.8 50.5 54.7 24.3 21.6 31.5 39.0 43.1Industry 20.8 24.7 26.9 26.2 26.3 40.5 48.2 41.3 45.9 46.8 of which Manufacturing 14.2 16.7 16.7 15.6 14.2 33.7 40.2 32.7 32.1 29.6Total 100 100 100 100 100 100 100 100 100 100
Source: World Development Indicators, the World Bank.
Table 9.2 Sectoral Composition of Employment (% shares)
India China 1994 2000 2005 2010 1980 1990 1994 2000 2005 2008Agriculture 61.9 59.8 55.8 51.1 68.7 60.1 54.3 50.0 44.8 39.6Services 22.4 24.1 25.2 26.5 13.1 18.5 23.0 27.5 31.3 33.2Industry 15.7 16.1 19.0 22.4 18.2 21.4 22.7 22.5 23.8 27.2Source: Key Indicators of the labour market, ILO.

136 india development report
Within the merchandise sector, India recorded a lower growth rate than China in manufacturing exports while the opposite was true for non-manufacturing exports. In short, during the last one decade, services and non-manufactured exports grew growing faster in India than in China while manufactured exports continued to grow faster in China.
It is remarkable that China is able to sustain rapid growth despite the fact that its base export value today is about seven times higher than that of India. Figures 9.4 and 9.5 show the changes in the world market shares of India and China in diff erent categories of exports. India accounted for a meagre 0.5 per cent or less in total
Table 9.3 Average Annual Growth Rates of Exports, Values in US$
Merchandise Total Merchandise Services Total Merchandise Manufactures Non-Manufactures plus ServicesIndia1980–90 10.6 2.1 7.3 4.7 6.71990–2000 10.2 7.1 9.5 13.8 10.52000–10 17.1 27.1 20.0 26.0 21.9
China 1980–90 17.8 6.1 12.8 11.6* 14.4*1990–2000 16.7 4.8 14.5 18.2 14.82000–10 23.2 14.6 22.4 20.3 22.2
World1980–90 9.2 0.8 5.9 8.0 6.31990–2000 7.4 5.1 6.8 6.8 6.82000–10 9.4 14.2 10.9 11.5 11.0Note: * For the period 1982–90.Source: Estimated from the WTO database.
100
90
80
70
60
50
40
30
20
10
0
China
198
0
198
2
198
4
198
6
198
8
199
0
199
2
199
4
199
6
199
8
20
00
20
02
20
04
20
06
20
08
2010
India
Figure 9.3 Share of Manufacturing in Total Merchandise ExportsSource: Estimated from the WTO database.

the ‘miracle’ still waiting to happen 137
3.5
3.0
2.5
2.0
1.5
1.0
0.5
0
1980
1982
1984
1986
1988
1990
1992
1994
1996
1998
2000
2002
2004
2006
2008
2010
Services Non-manufactures Manufactures
Figure 9.4 World Market Shares of Exports, IndiaSource: Estimated from the WTO database.
Figure 9.5 World Market Shares of Exports, ChinaSource: Estimated from the WTO database.
16
14
12
10
8
6
4
2
0
1980
1982
1984
1986
1988
1990
1992
1994
1996
1998
2000
2002
2004
2006
2008
2010
Services Non-manufactures Manufactures
138 india development report
world exports of manufactured products during the 1980s, which increased marginally to 0.6 per cent in 1992 and remained at that level until 1998 before showing a relatively faster increase during the 2000s. In 2010, India accounted for 1.4 per cent of world exports of manufactures while China’s share was a whopping 15 per cent. China’s shares were higher than India’s in services and non-manufactures as well, but the diff erence was not noticeably high as in the case of manufactured exports.
RELATIVE FACTOR ENDOWMENTS
Th e Heckscher-Ohlin model of international trade explains the specialization patterns of countries based on their relative factor endowments. According to this model, a country will specialize and export products that are intensive in the use of the factor that is abundant in that country. Th us, for example, a country with an abundant supply of labour has a comparative advantage in labour-intensive products. In order to put the empirical analysis that follows
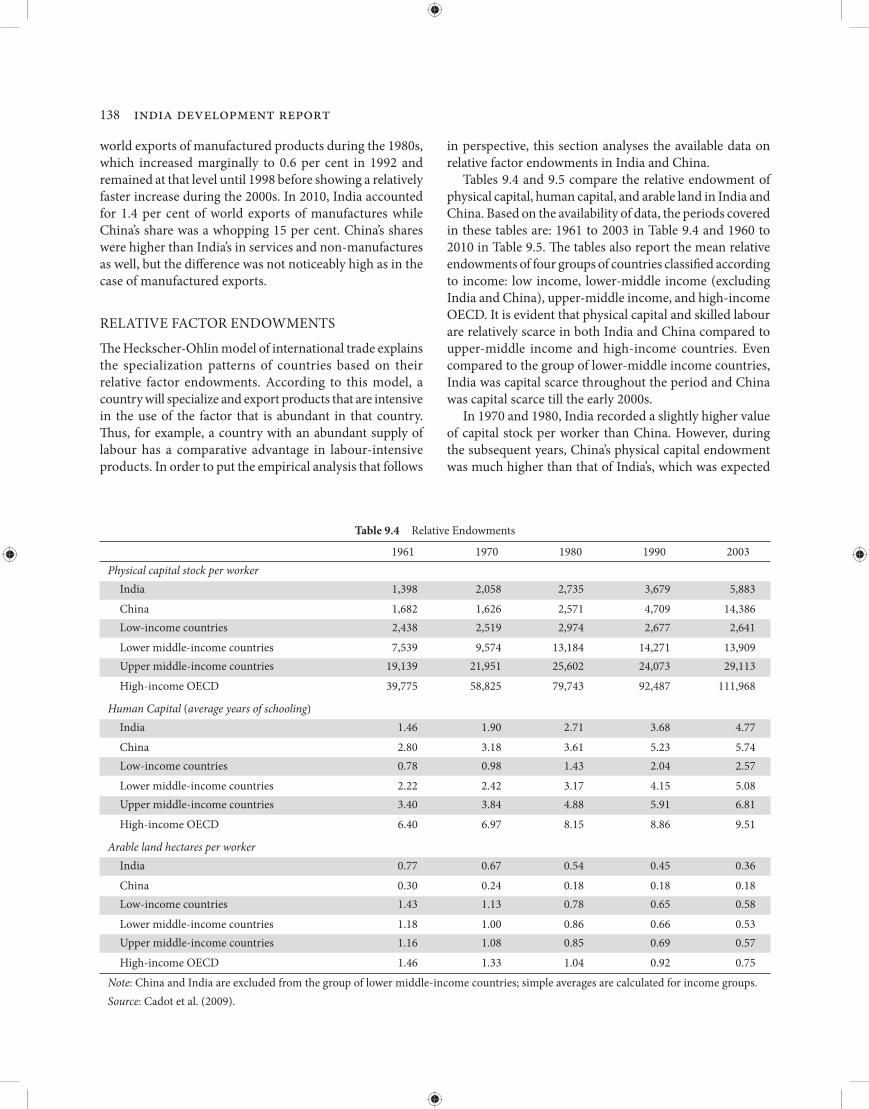
in perspective, this section analyses the available data on relative factor endowments in India and China. Tables 9.4 and 9.5 compare the relative endowment of physical capital, human capital, and arable land in India and China. Based on the availability of data, the periods covered in these tables are: 1961 to 2003 in Table 9.4 and 1960 to 2010 in Table 9.5. Th e tables also report the mean relative endowments of four groups of countries classifi ed according to income: low income, lower-middle income (excluding India and China), upper-middle income, and high-income OECD. It is evident that physical capital and skilled labour are relatively scarce in both India and China compared to upper-middle income and high-income countries. Even compared to the group of lower-middle income countries, India was capital scarce throughout the period and China was capital scarce till the early 2000s. In 1970 and 1980, India recorded a slightly higher value of capital stock per worker than China. However, during the subsequent years, China’s physical capital endowment was much higher than that of India’s, which was expected
Table 9.4 Relative Endowments
1961 1970 1980 1990 2003Physical capital stock per worker India 1,398 2,058 2,735 3,679 5,883 China 1,682 1,626 2,571 4,709 14,386 Low-income countries 2,438 2,519 2,974 2,677 2,641 Lower middle-income countries 7,539 9,574 13,184 14,271 13,909 Upper middle-income countries 19,139 21,951 25,602 24,073 29,113 High-income OECD 39,775 58,825 79,743 92,487 111,968
Human Capital (average years of schooling) India 1.46 1.90 2.71 3.68 4.77 China 2.80 3.18 3.61 5.23 5.74 Low-income countries 0.78 0.98 1.43 2.04 2.57 Lower middle-income countries 2.22 2.42 3.17 4.15 5.08 Upper middle-income countries 3.40 3.84 4.88 5.91 6.81 High-income OECD 6.40 6.97 8.15 8.86 9.51
Arable land hectares per worker India 0.77 0.67 0.54 0.45 0.36 China 0.30 0.24 0.18 0.18 0.18 Low-income countries 1.43 1.13 0.78 0.65 0.58 Lower middle-income countries 1.18 1.00 0.86 0.66 0.53 Upper middle-income countries 1.16 1.08 0.85 0.69 0.57 High-income OECD 1.46 1.33 1.04 0.92 0.75Note: China and India are excluded from the group of lower middle-income countries; simple averages are calculated for income groups. Source: Cadot et al. (2009).

the ‘miracle’ still waiting to happen 139
due to the faster economic growth in the former compared to the latter since the early 1980s. As expected, the average years of schooling in both India and China were much below the level in high-income OECD and upper-middle income countries. Compared to the lower-middle income countries,
the average years of schooling were better in China but worse in India. Highly skilled workers, that is, those with more than a secondary education were relatively scarce in both India and China. In 2010, about 23 per cent of the population in
Table 9.5 Educational Attainment
1960 1970 1980 1990 2000 2010No schooling India 72.1 66.2 66.3 51.6 43.0 32.7 China 58.3 41.9 27.1 22.2 11 6.5 Korea 42.6 24.3 13.1 11.4 5.9 3.6 Low-income countries 73.4 67.6 59.6 49.9 42.3 34.6 Lower middle-income countries* 56.0 47.8 37.8 30.5 24.0 18.2 Upper middle-income countries 38.4 30.1 21.9 15.0 10.0 6.8 High-income OECD 8.0 6.2 4.7 4.5 3.7 2.6
Primary education India 24.8 27.1 12.6 18.7 19.7 20.9 China 28.7 36.9 38.4 34.5 30.4 24.1 Korea 36.9 39.1 28 22 11.8 9.4 Low-income countries 21.4 24.2 26.5 30.6 33.5 35.6 Lower middle-income countries* 31.0 33.8 35.1 35.2 35.8 33.0 Upper middle-income countries 46.7 47.2 43.3 38.1 31.3 25.7 High-income OECD 63.4 54.0 43.3 35.6 25.7 19.0
Secondary education India 2.5 5.6 18.7 25.6 32.9 40.7 China 12.3 20.3 33.6 41.3 54.1 60.4 Korea 17.8 30.8 49.8 47.8 52 46.8 Low-income countries 4.5 7.3 12.4 17.4 21.8 26.7 Lower middle-income countries* 11.4 16.2 23.3 28.8 32.9 39.7 Upper middle-income countries 13.0 19.7 29.8 39.0 48.2 53.8 High-income OECD 23.9 33.0 41.5 45.1 51.2 55.4
Tertiary education India 0.6 1.1 2.3 4 4.5 5.8 China 0.7 0.8 0.9 1.9 4.6 9 Korea 2.6 5.8 9.1 18.8 30.2 40.1 Low-income countries 0.7 0.9 1.5 2.1 2.4 3.2 Lower middle-income countries* 1.7 2.3 3.9 5.5 7.1 9.1 Upper middle-income countries 1.9 3.0 5.1 8.0 10.6 13.7 High-income OECD 4.6 6.8 10.5 14.8 19.4 23.1
Per capita income (constant 2000 US$) India 145 214 229 318 453 823 China 105 122 186 392 949 2425Note: China and India are excluded from the group of lower middle-income countries; simple averages are calculated for income groups. Source: Barro and Lee (2010).

140 india development report
high-income OECD countries and about 14 per cent in upper-middle income countries had attained tertiary education while these fi gures in China and India were about 9 per cent and 6 per cent respectively. Th e attainment of tertiary education in India was less than the mean attainment ratio in lower-middle income countries. In terms of secondary level education, China consistently ranked above India and other lower-middle income countries. In 2010, about 60 per cent of the population in China and 41 per cent of the population in India had attained secondary level education. In terms of population without schooling, India has always been similar to the low-income economies. In 2010, about 33 per cent of India’s population was without schooling compared to 6.5 per cent in China. Th us, unskilled labour, defi ned as those with no schooling, was more abundant in India as compared to China. Th e pattern remains the same even if unskilled labour is instead defi ned as those with no schooling or with only primary attainment. More than half of India’s population had either no schooling or only primary attainment while 70 per cent of China’s population had attained education either till the secondary level or above. In addition to being relatively skill and capital scarce, India and China are relatively land scarce compared to other countries (Table 9.4). However, land is relatively abundant in India than in China. In sum, compared to high-income and middle-income countries, physical capital, skilled labour, and land are relatively scarce both in India and China but unskilled labour is relatively abundant. Th is is particularly true for India than for China. Th erefore, it is beyond doubt that the true comparative advantage of India would lie in industries that intensively use unskilled labour rather than physical capital and skilled labour. For the more recent years, based on relative factor endowments, India’s comparative advantage in unskilled labour-intensive goods appears particularly strong compared to China’s.
PATTERN OF EXPORT SPECIALIZATION
Accumulation of factor endowments, such as human and physical capital, that characterize economic growth can bring about a dynamic process of changing comparative advantages. For example, the road to export success of the Newly Industrialized Countries (NICs) in Asia started with labour-intensive and low technology manufactures. However, as investments in physical and human capital rose and as labour costs increased with the accumulation of skills, relatively more sophisticated manufacturing activities expanded in these countries at the expense of traditional labour-intensive manufactures. This pattern of initial specialization in labour-intensive activities followed by a
move up the ladder of comparative advantage, as relative resource endowments change, is precisely the sequence envisaged in the ‘stages of comparative advantage’ thesis postulated by Balassa (1977). In the light of the observed diff erences in relative factor endowments between India and China at given points in time and their changes over time, as shown above, we now analyse the commodity pattern of exports from the two countries. We are particularly interested in assessing the extent of congruence between the evolution of relative factor endowments and commodity specialization in the two countries. In order to view the dynamics of specialization through the lens of the Heckscher-Ohlin model, we classify traded products according to factor intensities. First, using relatively aggregate data at the 1 and 2-digit level of the Standard International Trade Classifi cation (SITC), we classify products into two broad categories: labour-intensive and capital-intensive. Second, using the factor intensity classification of the International Trade Centre (ITC), adapted by Hinloopen and van Marrewijk (2008), we classify the traded products into fi ve specifi c categories: natural resource-intensive, unskilled labour-intensive, human capital-intensive, technology-intensive, and unclassifi ed. Th e latter classifi cation makes use of data disaggregated at the three-digit level of SITC (Revision 2).6 Based on the aggregate classifi cation scheme mentioned above, the shares of diff erent commodity groups in the export baskets of the two countries are shown in Table 9.6. It is evident that throughout the period 1962–92, labour-intensive products accounted for more than three-fourths of both India and China’s total manufacturing exports. Between 1992 and 2008, however, the share of labour-intensive products declined from 78 per cent to 47 per cent in China while it declined from 84 per cent to 63 per cent in India. World market shares of the two countries in diff erent broad groups of commodities are shown in Table 9.7. It is evident that India’s world market share in labour-intensive products was higher than China’s in 1962. India’s share declined from 1.6 per cent in 1962 to 0.9 in 1972. In 1982, China accounted for over 2 per cent of the world exports
6 Th e classifi cation is available at: (http://www2.econ.uu.nl/users/marrewijk/eta/intensity.htm) (accessed on 15 October 2011). A total number of 240 items, at the three-digit SITC level, have been grouped into fi ve categories (number of items in each category in parentheses): primary (83), natural resource-intensive (21), unskilled labour–intensive (26), human capital-intensive (43), technology-intensive (62), and unclassifi ed (5). For our purpose, we defi ne an additional category, called the capital-intensive category, by adding human capital-intensive and technology-intensive categories.

the ‘miracle’ still waiting to happen 141
of labour-intensive products, while India’s share was below 0.9 per cent. China’s share increased dramatically to about 8 per cent in 1992, 15 per cent in 2002, and to a whopping 20 per cent in 2008 while India’s share increased marginally to about 2 per cent by 2008. In 2008, China accounted for 41 per cent of the world exports of clothing and footwear, while India’s share was a mere 3 per cent. China also recorded a signifi cant increase in its world market share of capital-intensive products, particularly machinery. China’s share in the total world exports of machinery items increased from almost zero to as high as 20 per cent in 2008. By contrast, India’s market share in machinery was a mere 0.5 per cent. Table 9.8 reports the commodity composition of the two country’s exports according to the more detailed factor intensity classifi cation. Panel A shows the shares of the vari-ous factor intensity categories within aggregate merchandise exports while panel B shows the results for manufactured exports. A steady increase in the share of technology-intensive products (within aggregate merchandise as well as manufacturing) is a trend that is common for both India and China. Th is trend, however, is more pronounced for China
than for India: the share of technology-intensive products in India’s manufactured exports increased from 10 per cent in 1980 to 33 per cent in 2010 while it increased from 17 per cent to as high as 57 per cent for China. Between 1980 and 2010, the share of human capital-intensive goods in India’s manufactured exports increased from 14 per cent to 21 per cent while it declined from 19 per cent to 16 per cent for China. In 1980, consistent with the two countries comparative advantages, unskilled labour-intensive goods constituted the largest share of manufacturing exports both in India (49 per cent) and China (58 per cent). However, the share of this category declined signifi cantly in both the countries in subsequent years, with the latest share being 22 per cent in India and 25 per cent in China. It must be noted that though the share of unskilled labour activities declined in both the countries, the decline occurred from a much higher starting point for China than for India. Th is decline in the share of the unskilled labour-intensive category is broadly consistent with the steady decline in the endowment of unskilled labour (that is, those with either no schooling or
Table 9.6 Composition of Exports
Labour-Intensive Capital-Intensive Resource- Textile Misc. Clothing & Total Chemicals Machinery Transport Total based (SITC 65) Manu Footwear (SITC (SITC 5) (SITC Equipment (SITC products facturing (SITC 6+8) 71+72) (SITC 73) 5+7) (SITC 6) (SITC 8) 84+85) 1962India 89.4 73.4 4.8 2.9 94.2 3.4 2 0.3 5.7China 79.6 39.4 10.5 5.4 90.1 8 1.3 0.7 10
1972 India 80.3 47.8 9 5.7 89.3 3.3 5.2 2.3 10.8China 57.5 35 25.8 12.5 83.3 11.5 4 1.2 16.7
1982India 57.5 19.1 27 20.2 84.5 3.6 7.3 4.6 15.5China 42.3 24.6 39.2 25.8 81.5 11.8 5.7 1 18.5
1992India 52.2 17.5 31.8 25 84 8.1 5.4 2.5 16China 17.9 9.2 59.6 31.8 77.5 4.3 16.9 1.2 22.4
2002 India 48 14.3 24.8 16.2 72.8 16.1 8.8 2.4 27.3China 14.2 4.7 44.7 17 58.9 3.6 36.1 1.5 41.2
2008 India 43.1 8.1 19.4 11.6 62.5 18.4 14.8 4.2 37.4China 16.3 3.2 30.7 11.1 47 5.2 45.4 2.4 53Source: Estimated from COMTRADE-WITS using partner country import records (mirror exports).

142 india development report
Table 9.7 World Market Shares
Labour-Intensive Capital-Intensive Resource- Textile Misc. Clothing & Total Chemicals Machinery Transport Total based (SITC 65) Manu Footwear (SITC (SITC 5) (SITC Equipment (SITC products facturing (SITC 6+8) 71+72) (SITC 73) 5+7) (SITC 6) (SITC 8) 84+85) 1962China 1.03 2.33 0.48 0.80 0.91 0.33 0.02 0.03 0.09India 1.89 7.07 0.36 0.71 1.55 0.23 0.06 0.02 0.09
1972China 0.93 2.69 0.90 1.31 0.92 0.48 0.07 0.04 0.15India 1.17 3.31 0.28 0.54 0.89 0.12 0.09 0.07 0.09
1982China 1.80 6.08 2.71 5.41 2.15 1.00 0.22 0.07 0.35India 0.94 1.80 0.71 1.61 0.85 0.12 0.11 0.12 0.11
1992China 3.42 8.82 12.49 20.08 7.75 1.40 2.18 0.31 1.53India 1.28 2.16 0.85 2.02 1.08 0.34 0.09 0.09 0.14
2002China 7.42 14.60 23.47 29.81 15.43 2.40 9.37 0.96 5.98India 2.19 3.86 1.14 2.46 1.67 0.93 0.20 0.13 0.34
2008China 12.72 24.00 29.97 40.59 20.39 5.01 19.64 2.82 12.61India 2.63 4.73 1.48 3.32 2.12 1.39 0.50 0.39 0.70Source: Estimated from COMTRADE-WITS using partner country import records (mirror exports).
just primary education) in both the countries (see Table 9.5). Similarly, the increase in the share of capital-intensive goods (that is, the combined share of technology and human capital-intensive goods) is consistent with the increase in the endowment of physical capital per worker and skilled labour in both the countries. Overall, the evolution of industrial specialization in India and China seems consistent with the changes in their relative endowments. However, a comparison of the trajectories in the two countries brings out the fact that industrial specialization in India is disproportionately biased towards capital and skill-intensive industries than in China (also see Krueger 2010; Kochhar et al. 2006; Panagariya 2008). Th e following observations make this argument clearer. First, between 1980 and 2010 both the countries expe-rienced an equal rate of decline in the share of unskilled labour-intensive goods in exports (that is, about 56 per cent) though the corresponding decline in the share of unskilled labour in the total workforce was faster in China
(53 per cent) than in India (32 per cent). Th us, compared to China the extent of decline in the share of unskilled labour-intensive goods in India’s exports seems dispro-portionately higher. Second, during the same period, the share of capital-intensive goods in India’s exports more than doubled from 24 per cent to 54 per cent while it increased less rapidly from 37 per cent to 73 per cent in China. In contrast, the endowment of physical capital stock per worker increased signifi cantly faster in China (from $2,571 in 1980 to $14,386 in 2010) than in India (from $2,735 to $5,883 in 2010). Th us, compared to China, the extent of increase in the share of capital-intensive goods in India’s exports is disproportionally higher than what would be explained by the growth in the endowment of physical capital stock per worker. Th ird, a recent study, using fi nely disaggregated 10-digit level US bilateral import data, has shown that India’s export bundle to the US is becoming increasingly more similar to that of the high-income OECD countries (Veeramani and

the ‘miracle’ still waiting to happen 143
Saini 2011).7 It has been noticed that in a majority of the cases, the 10-digit level export unit values of India in the US market are higher than that of China. Th e higher export unit values of India may refl ect its undue specialization in capital and skill intensive varieties and production process. For, it may be argued that, the higher the level of capital and skill embodied in a variety/product line, the higher the price (unit value) that it commands in export markets.8 Finally, as discussed in detail in the next section, there are strong reasons to believe that Tables 9.6 and 9.8 overestimate the share of capital-intensive exports and underestimate the share of labour-intensive exports for both the countries, but signifi cantly more so for China than for India. In other
7 Specifi cally, an export similarity index (ESI), which captures the extent of product structure overlap between India and the high income OECD countries has been computed using finely disaggregated (10-digit level) US bilateral import data. Th e rationale behind the use of ESI is the idea that the OECD countries hold comparative advantages in products that are most sophisticated and, therefore, an increase in the value of ESI would imply catching up by India with the OECD (Schott 2008).
8 A higher price that results from ‘distorted’ specialization, however, does not translate into an overall higher volume of exports.
words, it is likely that the actual share of labour-intensive exports was much bigger than what is shown in Tables 9.6 and 9.8 for China while this discrepancy was relatively smaller for India.
GLOBAL PRODUCTION NETWORKS AND VERTICAL SPECIALIZATION
China’s export promotion policies since the 1990s have relied heavily on a strategy of integrating its domestic industries with global production networks. Global production networks refer to the links between a lead or a key fi rm and its suppliers in diff erent countries (Weiss 2011). In certain industries, such as electronics and automobiles, technology makes it possible to sub-divide the production process into discrete stages. In such industries, the fragmentation of the production process into smaller and more specialized components allows fi rms to locate parts of the production in countries where intensively used resources are available at lower costs. A high level of fragmentation (vertical specialization) based trade, which occurs when countries specialize in particular stages of a good’s production sequence rather
Table 9.8 Export Composition According to Factor Intensity Classifi cation
India China 1980 1990 2000 2005 2010 1980 1990 2000 2005 2010Panel A: Total MerchandisePrimary 38.7 28.5 20.7 23.2 30.1 51.4 19.4 7.3 4.9 3.6Natural resource-intensive 16.2 24.3 20.0 20.0 17.5 3.4 2.9 3.1 3.3 2.6Unskilled labour-intensive 30.2 30.6 29.1 20.0 14.3 27.8 46.5 39.3 28.2 24.4Capital-intensive 14.8 16.5 30.1 35.2 35.4 17.3 31.1 49.3 63.6 69.3 human capital-intensive 8.5 9.1 14.0 16.8 13.8 9.2 15.5 14.4 15.6 14.9 technology-intensive 6.3 7.4 16.1 18.4 21.6 8.1 15.6 35.9 48.0 54.4Unclassifi ed 0.0 0.0 0.0 1.7 2.7 0.1 0.0 0.0 0.0 0.0Total 100 100 100 100 100 100 100 100 100 100
Panel B: ManufacturingNatural resource-intensive 26.3 33.5 24.3 24.3 24.3 5.3 2.6 2.4 2.4 1.8Unskilled labour-intensive 49.4 43.2 37.2 27.4 21.8 58.3 58.3 42.8 30.0 25.5Capital-intensive 24.3 23.3 38.5 48.2 54.0 36.5 39.0 54.8 67.5 72.6 human capital-intensive 14.0 12.8 17.9 23.0 21.1 19.4 19.5 15.7 16.5 15.6 technology-intensive 10.3 10.5 20.6 25.2 32.9 17.1 19.5 39.1 51.0 57.0Total 100 100 100 100 100 100 100 100 100 100Note: Shares of the capital-intensive category have been obtained by adding the shares of human capital-intensive and technology-intensive categories.Source: Estimated from COMTRADE-WITS using partner country import records (mirror exports) and the factor intensity classifi cation of the International Trade Centre (ITC), adapted by Hinloopen and van Marrewijk (2008).

144 india development report
than in the entire good, has been an important factor in driving the East Asian export growth (Athukorala 2012; Athukorala and Yamashita 2006). Th is type of trade is the result of increasing inter-connected production processes that form a vertical trading chain stretching across many countries, with each country specializing according to factor intensities involved at the diff erent stages in production. Labour abundant countries like China tend to specialize in low skilled labour-intensive activities involved in the production of a final good while the capital and skill-intensive activities are carried out in countries where those factors are abundant. Th us, international fi rms might retain skill and knowledge-intensive stages of production (such as R& D and marketing) in the high-income headquarters (for example, the US, EU, and Japan) but locate all or parts of their production in a low wage country (for example, China or Vietnam). Th e major driving forces behind the steadily increasing vertical specialization-based trade during the last two decades include: (i) world-wide reduction of tariff barriers, (ii) spatial inter-dependence and production sharing of multinational fi rms, and (iii) expansion of transportation and communication networks. A manifestation of China’s participation in global production networks is the growing importance of machinery items in its export basket (see Tables 9.6 and 9.7). In 2008, machinery contributed about 45 per cent of Chinese exports and China accounted for about 20 per cent of the world exports in this product category. Th e fast growth of China’s machinery exports has been driven by its high degree of integration with regional and global production networks (Athukorala 2012). In particular, based on imported parts and components, China has emerged as a global hub for electrical and electronic goods assembly. Typically, China imports the parts and components from other parts of East Asia and exports the fi nished goods to the United States and Europe. Since this strategy involves processing or assembly of imported parts and components, the net domestic value added per unit of the exported good is generally not very high. However, since the scale of operations is usually very large, the total domestic value addition from these activities is considerably high contributing to employment generation for a large number of migrant workers in China. Th ough, machinery as a whole may be considered as a capital-intensive category, certain stages of production or tasks (such as low-end assembly activities) within this category are highly labour-intensive. The data disaggregated at the three-digit level does not fully capture these heterogeneities. Th e calculations shown in Table 9.8 ignore the fact that within the three-digit industries, that are grouped under the capital-intensive category, China
largely specializes in process and product lines that are mainly labour-intensive. Th erefore, Tables 9.6 and 9.8 may signifi cantly overestimate the shares of capital-intensive exports and underestimate the shares of labour-intensive exports from China. Th is discrepancy, however, is likely to be smaller for India since she remains a minor player in fragmentation-based trade. A proxy variable for measuring the intensity of vertical specialization-based trade is the share of parts and components (henceforth referred to as ‘components’ for brevity) in total manufacturing trade. Based on estimates by Athukorala (2012), Table 9.9 reports the components shares for India, China, and several other countries for two time points, 1992–3 and 2006–7. Th at a growing share of world trade is based on vertical specialization and fragmentation is evident from the fact that the share of components in world manufacturing exports increased sharply from 19 per cent in 1992–3 to 27 per cent in 2006–7. Th is share increased at a much faster rate in developing Asian countries, from 17 per cent to 34 per cent.
Table 9.9 Share of Parts and Components in Manufacturing Trade (%)
Exports Imports 1992–3 2006–7 1992–3 2006–7Developing Asia 17.3 34.0 29.0 44.2 China, PR 7.4 25.6 20.4 44.0 Hong Kong SAR 15.8 33.3 24.1 48.5 Taiwan 24.7 44.2 29.5 38.9 Korea, RP 18.1 47.3 30.1 31.9 ASEAN 6 22.7 44.2 36.0 47.9 Indonesia 3.8 21.5 27.0 21.8 Malaysia 27.7 53.6 40.5 50.0 Philippines 32.9 71.7 32.6 61.3 Singapore 29.0 49.3 39.9 60.4 Th ailand 14.1 29.9 30.6 36.1 Vietnam — 11.0 — 19.1 India 3.0 10.4 17.5 22.9Memo items East Asia 20.2 34.1 27.2 42.1 Japan 23.9 34.4 19.3 29.9 NAFTA 28.4 31.2 37.4 28.8 EU 15 18.3 22.4 21.2 23.2 World 19.3 27.1 19.6 27.3Note: shares for 1992–3 have been computed using the average trade values for the years 1992 and 1993 and analogously for 2006–7. Source: Athukorala (2012).
the ‘miracle’ still waiting to happen 145
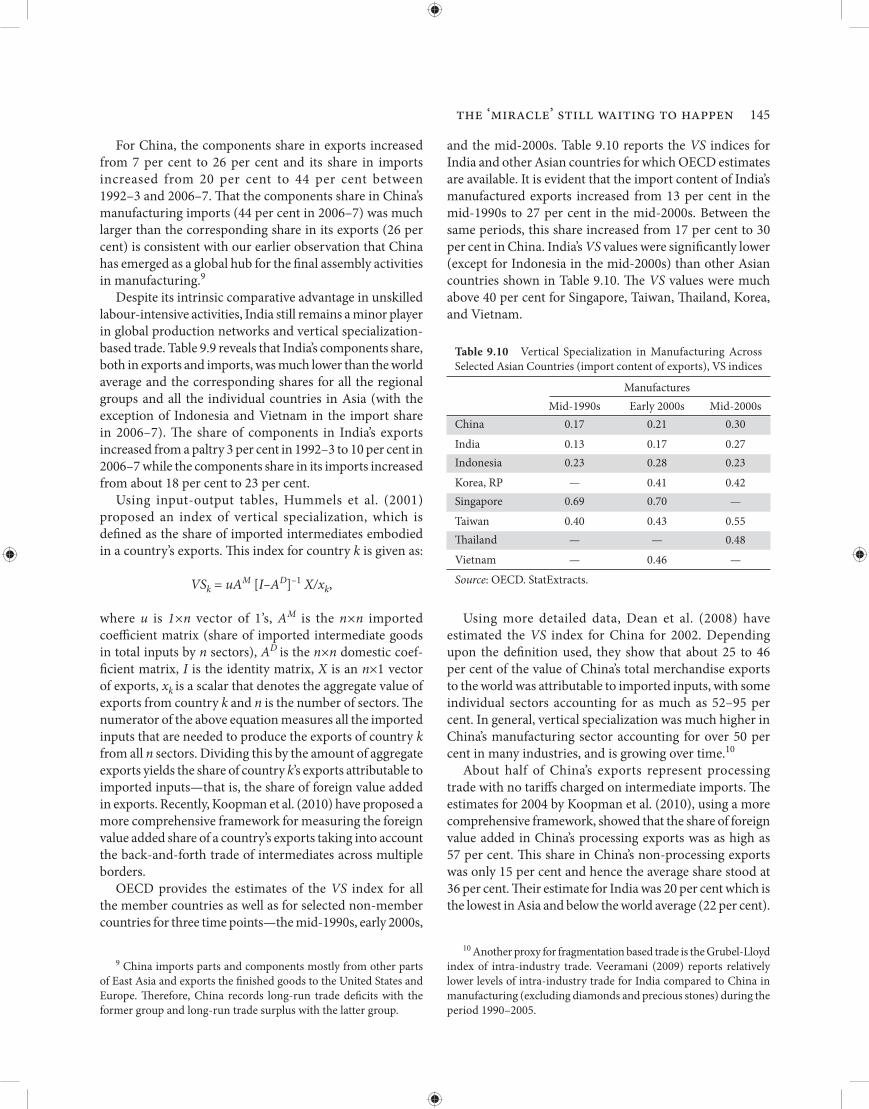
For China, the components share in exports increased from 7 per cent to 26 per cent and its share in imports increased from 20 per cent to 44 per cent between 1992–3 and 2006–7. Th at the components share in China’s manufacturing imports (44 per cent in 2006–7) was much larger than the corresponding share in its exports (26 per cent) is consistent with our earlier observation that China has emerged as a global hub for the fi nal assembly activities in manufacturing.9 Despite its intrinsic comparative advantage in unskilled labour-intensive activities, India still remains a minor player in global production networks and vertical specialization-based trade. Table 9.9 reveals that India’s components share, both in exports and imports, was much lower than the world average and the corresponding shares for all the regional groups and all the individual countries in Asia (with the exception of Indonesia and Vietnam in the import share in 2006–7). Th e share of components in India’s exports increased from a paltry 3 per cent in 1992–3 to 10 per cent in 2006–7 while the components share in its imports increased from about 18 per cent to 23 per cent. Using input-output tables, Hummels et al. (2001) proposed an index of vertical specialization, which is defi ned as the share of imported intermediates embodied in a country’s exports. Th is index for country k is given as:
VSk = uAM [I–AD]–1 X/xk,
where u is 1×n vector of 1’s, AM is the n×n imported coeffi cient matrix (share of imported intermediate goods in total inputs by n sectors), AD is the n×n domestic coef-fi cient matrix, I is the identity matrix, X is an n×1 vector of exports, xk is a scalar that denotes the aggregate value of exports from country k and n is the number of sectors. Th e numerator of the above equation measures all the imported inputs that are needed to produce the exports of country k from all n sectors. Dividing this by the amount of aggregate exports yields the share of country k’s exports attributable to imported inputs—that is, the share of foreign value added in exports. Recently, Koopman et al. (2010) have proposed a more comprehensive framework for measuring the foreign value added share of a country’s exports taking into account the back-and-forth trade of intermediates across multiple borders. OECD provides the estimates of the VS index for all the member countries as well as for selected non-member countries for three time points—the mid-1990s, early 2000s,
9 China imports parts and components mostly from other parts of East Asia and exports the fi nished goods to the United States and Europe. Th erefore, China records long-run trade defi cits with the former group and long-run trade surplus with the latter group.
and the mid-2000s. Table 9.10 reports the VS indices for India and other Asian countries for which OECD estimates are available. It is evident that the import content of India’s manufactured exports increased from 13 per cent in the mid-1990s to 27 per cent in the mid-2000s. Between the same periods, this share increased from 17 per cent to 30 per cent in China. India’s VS values were signifi cantly lower (except for Indonesia in the mid-2000s) than other Asian countries shown in Table 9.10. Th e VS values were much above 40 per cent for Singapore, Taiwan, Th ailand, Korea, and Vietnam.
Table 9.10 Vertical Specialization in Manufacturing Across Selected Asian Countries (import content of exports), VS indices
Manufactures Mid-1990s Early 2000s Mid-2000sChina 0.17 0.21 0.30India 0.13 0.17 0.27Indonesia 0.23 0.28 0.23Korea, RP — 0.41 0.42Singapore 0.69 0.70 —Taiwan 0.40 0.43 0.55Th ailand — — 0.48Vietnam — 0.46 —Source: OECD. StatExtracts.
Using more detailed data, Dean et al. (2008) have estimated the VS index for China for 2002. Depending upon the defi nition used, they show that about 25 to 46 per cent of the value of China’s total merchandise exports to the world was attributable to imported inputs, with some individual sectors accounting for as much as 52–95 per cent. In general, vertical specialization was much higher in China’s manufacturing sector accounting for over 50 per cent in many industries, and is growing over time.10
About half of China’s exports represent processing trade with no tariff s charged on intermediate imports. Th e estimates for 2004 by Koopman et al. (2010), using a more comprehensive framework, showed that the share of foreign value added in China’s processing exports was as high as 57 per cent. Th is share in China’s non-processing exports was only 15 per cent and hence the average share stood at 36 per cent. Th eir estimate for India was 20 per cent which is the lowest in Asia and below the world average (22 per cent).
10 Another proxy for fragmentation based trade is the Grubel-Lloyd index of intra-industry trade. Veeramani (2009) reports relatively lower levels of intra-industry trade for India compared to China in manufacturing (excluding diamonds and precious stones) during the period 1990–2005.

146 india development report
Vertical specialization is not a phenomenon restricted to East Asia alone. Between 1970 and 1990, growth in vertical specialization related exports accounted for about 30 per cent or more of the growth in overall exports of 10 OECD and four emerging market countries (Hummels et al. 2001). Inward FDI was instrumental in integrating China’s manufacturing with global vertical production chains. Th e bulk of the FDI fl ows to the manufacturing sector in China and other East Asian developing countries are vertical (export promoting) in nature. Vertical FDI represents international fragmentation of the production process by multinationals, locating each stage of the production in the country where it can be done at the least cost. Th e contribution of foreign funded enterprises in total Chinese exports steadily increased from less than 9 per cent in 1989 to 55 per cent in 2010.11
In contrast, inward FDI into India was primarily horizontal (domestic market seeking) rather than vertical. FDI was much less important in driving India’s export growth, accounting for less than 10 per cent of manufacturing exports. A recent OECD Investment Policy Review for India observes: ‘despite the government’s intention of promoting export-oriented FDI projects, the main objective of foreign investment in India was domestic market seeking and foreign-invested enterprises were characterised by a gener-ally poor export performance, though no less poor than their domestic counterparts’ (OECD 2009: 31). Krueger (2010: 424) notes that ‘… India has not succeeded in attracting foreign investors to use India as an export platform in many of the unskilled-labour intensive industries that have been attracted to east and southeast Asia.’ China, through specialization in labour-intensive processes, tasks, and product lines, has successfully inte-grated its manufacturing sector with global production networks. In contrast, India has been locked out of the vertically integrated global supply chains in manufacturing industries mainly because the country’s incentive structures are not in alignment with its comparative advantage in unskilled labour-intensive activities. We elaborate on this in the concluding section.
GEOGRAPHICAL DIRECTION OF EXPORTS
Th e disproportionate bias of India’s export specialization towards capital and skill-intensive product lines and the
11 Th e shares were 32 per cent in 1995 and 50 per cent in 2001. Th ese shares (except for 1989) have been computed using data from the various issues of the Chinese Statistical Yearbook published by the National Bureau of Statistics of China. Th e share for the year 1989 is taken from the World Investment Report, 2003, published by UNCTAD.
resulting disconnect with global production networks have a bearing on the geographical pattern of India’s exports. Arguably, India’s product specialization patterns provide it with a comparative advantage in relatively poorer markets (such as Africa) but at the cost of losing market shares in the richer countries. In the past, traditional developed country markets (comprising Australia and New Zealand, Europe, Japan, and North America) accounted for a major share of India’s export basket. But their dominance has been steadily declining over the last two decades. Th e aggregate share of these markets in India’s merchandise exports declined from about 63 per cent in 1993 to 35 per cent in 2010 (Veeramani 2012). Th e remaining group of countries (which include South and Central America, Caribbean, and the various regions of Asia and Africa), accounted for nearly two-thirds of India’s merchandise exports in 2010. The share of the high-income OECD countries in India’s total manufacturing exports declined sharply from 58 per cent in 2000 to 41 per cent in 2010. For China, the corresponding decline in the share of high-income OECD countries was relatively slow from 62 to 53 per cent. In contrast to India, China continues to show a high trade orientation with traditional developed country markets. What explains India’s declining trade intensity with traditional developed country markets? A possible explana-tion for this trend lies in India’s idiosyncratic pattern of specialization. India’s capital and skill-intensive products are unlikely to make inroads into the quality conscious richer country markets. Th ese products from India, however, may enjoy a competitive advantage in the relatively poorer country markets. Th at the nature of specialization has a bearing on the geographical direction of exports is evident from the fact that the high-income OECD countries account for a much smaller share in India’s total exports of capital-intensive products (for example, ‘machinery & transport equipment’) compared to their share in India’s total exports of labour-intensive products (for example, ‘textiles’). In 2010, the high-income OECD countries accounted for about 52 per cent of the total exports of ‘textiles’ from India while their share in ‘machinery & transport equipments’ was much smaller at 38 per cent (see Table 9.11). For China, however, the high-income OECD countries accounted for much above 50 per cent of its exports in both these product groups. Th e high share of OECD countries in China’s exports of ‘machinery & transport equipment’ is consistent with its high degree of vertical specialization in the labour-intensive production stages within these industries. A concrete example that should make our arguments clearer is related to India’s export pattern of passenger motor vehicles (HS 8703), a capital and skill-intensive product

the ‘miracle’ still waiting to happen 147
group. India’s exports of passenger motor vehicles increased remarkably from $151 million in 2002 to $4,511 million in 2010, registering a growth rate of 44 per cent a year. Low and middle-income countries were the major destinations for these exports from India. In 2010, the high-income countries accounted for only 8 per cent of Indian exports of passenger motor vehicles while Sub-Saharan Africa accounted for 11 per cent. By contrast, the high-income countries accounted for 58 per cent of India’s total exports of HS 6105 (‘men’s or boy’s shirts, knitted or crocheted’)—a traditional labour-intensive group—while Sub-Saharan Africa accounted for just 1 per cent. Clearly, changes in specialization have bearings on the geographical direction of exports. In general, India’s movement out of labour-intensive industries implies a loss of comparative advantage in the richer country markets. It is important to note that the overall size of developing country markets remains much smaller than traditional developed country markets.12 Therefore, the undue dependence on developing country markets may put a natural limit on India’s volume growth of exports. It is beyond doubt that India holds a huge unexploited export potential in traditional developed country markets despite the recent slowdown in these countries. The general perception, however, is that India should necessarily diversify to new markets in the developing world if it has to increase its export volume. Consistent with this perception, the Indian government recently announced an export incentive scheme providing explicit financial supports for market diversifi cation.13 Th e recent slowdown in the developed countries may provide a short-term rationale for this diversifi cation strategy. Viewed through the lens of the Heckscher-Ohlin model, however, the declining trade intensity with traditional richer country markets is symptomatic of distortions in India’s specialization patterns
12 Th e countries in the traditional group accounted for about 70 per cent of world exports in 2002 and 58 per cent in 2010.
13 See the ‘Foreign Trade Policy 2009-14’, Ministry of Commerce and Industry, Department of Commerce, Government of India, available at: http://dgft .gov.in/exim/2000/policy/ft p-plcontent0910.pdf (accessed on 1 November 2011).
in favour of capital-intensive industries. In order to exploit the export potential in developed country markets, it is imperative to realign India’s specialization on the basis of its intrinsic comparative advantage in labour-intensive manufacturing.
CONCLUDING REMARKS AND THE WAY FORWARD
Th e road to the success of exports in the East Asian countries started by specializing in low skilled labour-intensive and low technology manufactures. In contrast, the pattern of India’s industrial growth, though still at the early stage, shows a bias in favour of relatively skill and capital-intensive industries. Th e fast growing exports from the country are either skilled labour-intensive (such as drugs and pharmaceuticals and fi ne chemicals) or capital-intensive (such as automobiles and parts). Th e share of capital-intensive products in India’s manufacturing export basket more than doubled from about 23 per cent in 1990 to nearly 54 per cent in 2010 while the share of unskilled labour-intensive products nearly halved from 43 per cent to 22 per cent. Th e lack of dynamism in labour-intensive manufacturing is a matter of concern because it is this sector that holds the potential to absorb the large pools of unskilled surplus labour from India’s agriculture sector. Th us, Indian growth has not been eff ective in reducing poverty on the scale that was possible in China and other industrialized countries of East Asia. Th e experience of East Asian countries shows that export-led industrialization based initially on labour-intensive industries is crucial for sustained employment generation and poverty reduction. India seems to be skip-ping this important intermediate stage of industrialization and moving directly to the next stage based on capital and skill-intensive industries. That India’s export basket is biased towards capital and skill-intensive products is an anomaly given the fact that the country’s true comparative advantage lies in unskilled labour-intensive activities. While India’s import substitution policy regime created a bias in favour of capital and skill-intensive manufacturing, the reforms since 1991 have not been comprehensive enough to remove this bias.
Table 9.11 Share of High-Income OECD Countries in Exports from India and China
India China 1990 2000 2010 1990 2000 2010Manufactures 48.9 58.1 40.8 29.9 61.8 53.2Textiles 53.9 66.1 51.7 37.0 57.6 55.1Machinery and transport equipment 17.4 46.7 38.3 12.8 59.1 51.6Source: Estimated using COMTRADE-WITS database.

148 india development report
Th ough the post-1991 policy changes have gone a long way towards product market liberalization by easing entry barriers, factor markets (labour and land) are still plagued by severe distortions and policy induced rigidities. Arguably, government interventions in factor markets have had the unintended consequence of creating a bias in the incentive structure against labour-intensive manufacturing. Trade liberalization by itself does not guarantee specialization in line with the comparative advantage of a country if other policies militate against the effi cient pattern of resource allocation. In particular, India’s archaic labour laws create severe exit barriers and hence discourage large fi rms from choosing labour-intensive activities and technologies (Krueger 2010; Kochhar et al. 2006; Panagariya 2007). A provision in the Industrial Disputes Act (IDA) 1948 stipulates that fi rms employing 100 or more regular workers must seek prior consent of the state government before any retrenchment or closure of fi rms.14 Based on a labour market survey and comparable research in other countries, an OECD report (2007: 13) notes that ‘laws governing regular employment contracts in India are stricter than those in Brazil, Chile, China and all but two OECD countries’. Nagaraj (2011), however, questions the hypothesis that labour market rigidities are holding up India’s industrial growth. He argues that the exemptions and loopholes built into the labour laws provide suffi cient fl exibilities to fi rms to retrench workers. It has also been argued that in order to surpass stringent labour laws, fi rms are increasingly using non-regular contract labour (for example, see Sharma 2006). While illegal retrenchments and use of contract workers are not ruled out, the main charge against this legislation is that it raises the implicit cost of employing workers (including the costs of litigation and bribes to politicians and trade union leaders in the event of illegal retrenchments) and reduces the freedom of fi rms to decide the optimal way of choosing their product lines and employing the workers.15 Th ese costs can be prohibitive especially in labour-intensive segments where fi rms generally operate with low margins in a highly competitive international environment. Overall,
14 Th e original post-independence legislation allowed employers to retrench workers as market conditions required, subject to minimum levels of protection through stipulated notice periods, severance payments etc. Th e legislation was tightened in 1976 for fi rms employing over 300 workers by making it mandatory for fi rms to obtain government permission to retrench workers. In 1982, this restriction was extended to all fi rms employing 100 or more workers.
15 Leaving the debate on the specifi c eff ect of IDA aside, it has been generally agreed that the ‘Indian labour laws are so numerous, complex and even ambiguous that they promote litigation rather than the resolution of problems related to industrial relations’ (Sharma 2006: 2078).
the legislation has created an incentive for fi rms to choose skill and capital-intensive product lines that employ relatively more white collar workers who are not classifi ed as ‘workmen’ and therefore do not enjoy employment protection under IDA. A number of econometric studies have attempted to analyse the impact of labour laws on employment and fi rm performance in India. Such attempts have been encumbered by diffi culties in properly measuring the extent of labour market rigidities. Some recent studies, exploiting state-level variations in labour policies, suggest that labour market rigidities have constrained employment, fi rm performance, and industrial growth in India (see, for example, Hasan et al. 2007 and Aghion et al. 2008).16
Until the reforms, China had severe distortions in all its factor and commodity markets (Lal 1995). Th e Chinese labour market was characterized by direct allocation of jobs and administrative control of wages. China gradually liberalized the labour market, particularly in the non-state sector, providing greater fl exibility in the allocation of resources (Brooks and Tao 2003; Meng 2000). Firms in special economic zones, in the very early stage of opening, had the authority to hire and fire. The government then extended this policy to other areas in the country (Panagariya 2007). A fl exible labour market, with appropriate social safety nets, is a crucial necessary condition for the growth of labour-intensive manufacturing in India. Other constraints that stand in the way of manufacturing growth include inadequate supply of physical infrastructure (especially power, roads, and ports) and a highly inefficient and cumbersome land acquisition procedure. Faced with power shortages, capital and skill-intensive industries such as automobiles and pharmaceuticals, might be in a position to rely on the high-cost internal sources of power. Th is option, however, is not aff ordable to fi rms in the labour-intensive segments that generally operate with low margins. A high level of vertical specialization-based trade, which occurs when countries specialize in particular stages of a good’s production sequence rather than in the entire good, has been an important factor in driving the East Asian export growth. China, through specialization in labour-intensive processes and product lines, has successfully integrated its manufacturing sector with global production networks. Inward FDI has been instrumental in integrating China’s manufacturing with global vertical production chains. Th e bulk of the FDI fl ows to China’s manufacturing sector has been vertical (export promoting) in nature, which represents
16 Bhattacharjea (2006) provides a critical review of these studies.

the ‘miracle’ still waiting to happen 149
international fragmentation of the production process by multinationals. In contrast, due to its idiosyncratic specialization, India has been locked out of the vertically integrated global supply chains in manufacturing industries. Inward FDI into India is primarily horizontal (market seeking) rather than vertical in nature. FDI has been much less important in driving India’s export growth, accounting for less than 10 per cent of manufacturing exports. What explains the fact that India has been attracting horizontal rather than vertical FDI while the opposite has been the case for China? Th e factors responsible for this are broadly the same as those that explain the relatively low degree of India’s vertical specialization in general. First, there existed a powerful incentive for multinationals to undertake tariff jumping horizontal investment as Indian tariff rates, despite the reduction since 1991, remained relatively high until 2007. Higher tariff rates would have made India a relatively undesirable destination for vertical investments. Second, vertical specialization has been discouraged in India also on account of labour laws, ineffi cient infrastruc-ture, a burdensome regulatory environment, an ineffi cient land acquisition process, and poor trade facilitation.17 Th e World Bank’s annual ‘Doing Business 2012’ ranked India 132nd out of 183 countries in ease of doing business while China’s rank stood much better at 91st. Th e Logistic Performance Index (LPI) database of the World Bank, ranks countries on the basis of the quality of trade-related logistic provisions.18 According to the latest LPI index, India’s rank stood at 47 out of 155 countries while China’s rank was higher at 27. Recognizing the importance of a strong manufacturing sector for employment generation, the Indian government recently announced the National Manufacturing Policy (NMP).19 Th is policy aims to create 100 million additional
17 For a long period, India had had a small scale reservation (SSR) policy under which a number of industrial activities (mostly unskilled labour-intensive) were ‘reserved’ for small scale units (see Mohan 2002 for a detailed analysis). Reduction in the list of SSR industries started in 1997 and continued till the late 2000s. Krueger (2010: 422–3) pointed out that ‘because exporting many unskilled-labor intensive goods requires considerable fi xed costs and fairly large scales of output, it is possible that there will be a delay between the time SS regulations are relaxed and exporting activity increases’. It may also be noted that the stringent labour laws applicable to the larger fi rms may act as a major disincentive for fi rms to expand in the de-reserved industries. In the absence of labour reforms, de-reservation alone is unlikely to generate signifi cant growth in labour-intensive production and exports.
18 For details see http://info.worldbank.org/etools/tradesurvey/Mode1a.asp, last accessed on 18 September 2012.
19 See Mani (2011) for a critical evaluation of NMP.
jobs and to increase the share of manufacturing in India’s GDP to 25 per cent by 2022. A major ingredient of this policy is the plan to establish national investment and manufacturing zones, with the units in the zones being given single-window clearance, a liberal exit policy, and certain tax exemptions. Th e good part of the policy is that it addresses, at least partly, some of the rigidities in the factor (labour and land) markets. However, there has been little or no eff ort to situate NMP in the context of growing global production networks in manufacturing industries. Failing to recognize the importance of integrating domestic manufacturing industries with the vertically integrated global production networks, NMP erroneously assumes that a signifi cant local value addition is a necessary condition for manufacturing to increase its size. Th e policy aims to improve domestic value addition by encouraging the local availability of most of the components, spare parts, and raw material (Mani 2011). Th is strategy will possibly result in realizing a higher net domestic value added per unit of the good produced but at the cost of a lower total domestic value addition since the domestic industries are being locked out of global production networks. Th e grand idea of building a self-contained indigenous industry with local value chains is meaningless in the current landscape of international commerce, where countries engage in production and trade by specializing at the level of distinct product lines and processes within each industry. What is important is the creation of an environment that allows entrepreneurs to freely search and identify opportunities in the vertically integrated global supply chains of various industries. A deliberate strategy of promoting greater integration of domestic industries with global production networks will accelerate the process of shift ing the surplus labour engaged in India’s agriculture to labour-intensive manufacturing. Increased participation in global production networks must form an essential part of the strategy for achieving inclusive growth in India.
REFERENCESADB (2007), Asian Development Outlook, Manila: Asian Develop-
ment Bank.Aghion, Philippe, Robin Burgess, Stephen J. Redding, and Fabrizio
Zilibotti (2008), ‘The Unequal Effects of Liberalization: Evidence from Dismantling the License Raj in India’, American Economic Review 98(4): 1397–1412.
Athukorala, Prema-chandra (2012), ‘Asian Trade Flows: Trends, patterns and Prospects’, Japan and the World Economy (forthcoming).
Athukorala, Prema-chandra and Nobuaki Yamashita (2006), ‘Production Fragmentation and Trade Integration: East Asia

150 india development report
in a Global Context’, Th e North American Journal of Economics and Finance 17(3): 233–56.
Balassa, Bela (1977), A Stages Approach to Comparative Advantage. Washington, DC: Th e World Bank, World Bank Staff Working Paper No. 256.
Barro, Robert and Jong-Wha Lee (2010), ‘A New Data Set of Educational Attainment in the World, 1950–2010’, NBER Working Paper No. 15902.
Bhagwati, Jagdish N (2002), Th e Wind of the Hundred Days: How Washington Mismanaged Globalization. Cambridge, Mass: MIT Press.
Bhattacharjea, Aditya (2006), ‘Labour Market Regulation and Industrial Performance in India: A Critical Review of the Empirical Evidence’, Indian Journal of Labour Economics 49(2): 211–32.
Brooks, Ray and Ran Tao (2003), China’s Labour Market Perfor-mance and Challenges. Washington, DC: IMF Working Paper No. 03/210.
Cadot Olivier, Bolormaa Tumurchudur, and Miho Shirotori (2009), ‘Revealed Factor Intensity Indices at Product Level’, UNCTAD Publication series on ‘Policy Issues in International Trade and Commodities’.
Dean, Judit M., K.C. Fung, and Zhi Wang (2008), ‘How Vertically Specialized is Chinese Trade’, Offi ce of Economics Working Paper No 2008-09-D, U.S. International Trade Commission. Aailable at: http://usitc.gov/publications/332/working_papers/ec200809d.pdf, last accessed on 18 September 2012.
Gupta, Poonam, Rana Hasan, and Utsav Kumar (2010), ‘What Constraints Indian Manufacturing’, in Barry Eichengreen, Poonam Gupta, and Rajiv Kumar (eds), Emerging Giants: China and India in the World Economy. New York: Oxford University Press, pp. 307–39.
Hasan, Rana, Devashish Mitra, and K.V. Ramaswamy (2007), ‘Trade Reforms, Labor Regulations, and Labor-Demand Elasticities: Empirical Evidence from India’, Review of Economics and Statistics 89(3): 466–81.
Hinloopen, J. and C. van Marrewijk (2008), ‘Empirical Relevance of the Hillman Condition for Revealed Comparative Advantage: 10 Stylized Facts’ Applied Economics 40 (18): 2313–28.
Hummels, David, Jun Ishii, and Kei-Mu Yi (2001), ‘Th e Nature and Growth of Vertical Specialization in World Trade’, Journal of International Economics 54: 75–96.
Islam, Rizwanul (2008), ‘Has Development and Employment Th rough Labor Intensive Industrialization Become History?’, in Kaushik Basu and Ravi Kanbur (eds), Arguments for a Better World: Essays in Honor of Amartya Sen, Volume 2, New York: Oxford University Press, pp. 387–410.
Kochhar, Kalpana, Utsav Kumar, Raghuram Rajan, Arvind Subramanian, and Ioannis Tokatlidis (2006), ‘India’s Pattern of Development: What Happened, What Follows’, Journal of Monetary Economics 53(5): 981–1019.
Koopman, Robert, William Powers, Zhi Wang, and Shang-Jin Wei (2010), ‘Give Credit where Credit is Due: Tracing Value Added in Global Production Chains’, NBER Working Paper 16426.
Krueger, Anne O. (2010), ‘India’s Trade with the World: Retrospect and Prospect’, in Sharkar Acharya and Rakesh Mohan (eds), India’s Economy: Performance and Challenges. New Delhi: Oxford University Press, pp. 399–429.
Lal, D. (1995), ‘India and China: Contrasts in Economic Liberalization?’, World Development 23 (9): 1475–94.
Little, I., T. Scitovsky, and M. Scott (1970), Industry and Trade in Some Developing Countries. London and New York: Oxford University Press.
Mani, Sunil (2011), ‘National Manufacturing Policy: Making India a Powerhouse?’ Economic and Political Weekly 46 (53): 16–19.
Meng, Xin (2000), Labour Market Reform in China. New York: Cambridge University Press.
Mohan, Rakesh (2002), ‘Small-scale Industry Policy in India: A Critical Evaluation’, in Anne O. Krueger (ed.), Economic Policy Reforms and the Indian Economy. Chicago: University of Chicago Press, pp. 213–97.
Nagaraj, R. (2011), ‘Industrial Performance, 1991–2008: A Review’, in D.M. Nachane (ed.), India Development Report 2011. New Delhi: Oxford University Press, pp 69–80.
Organization for Economic Corporation and Development (2007), OECD Economic Surveys: India, Vol. 2007/14. Paris: OECD.
————– . (2009), OECD Investment Policy Reviews: India. Paris: OECD.
Panagariya, Arvind (2007), ‘Why India Lags Behind China and How It Can Bridge the Gap’, World Economy 30(2): 229–48.
————– . (2008), India: Th e Emerging Giant. New York: Oxford University Press.
Schott, Peter K. (2008), ‘Th e Relative Sophistication of Chinese Exports’, Economic Policy 23 (53): 5–49.
Sharma, Alakh, N. (2006) ‘Flexibility, Employment and Labour Market Reforms in India’, Economic and Political Weekly XLI (21): 2078–85.
Veeramani, C. (2009), ‘Specialisation Patterns under Trade Liberalisation: Evidence from India and China’, in Natalia Dinello and Wang Shaoguang (eds), China, India and Beyond: Development Drivers and Limitations. Edward Elgar, Cheltenham, pp. 73–97.
————– . (2012), ‘Anatomy of India’s Merchandise Export Growth, 1993–94 to 2010–11’, Economic and Political Weekly 47 (1): 94–104.
Veeramani, C. and K. Gordhan Saini (2011), ‘India’s Export Sophistication in a Comparative Perspective’, in D M Nachane (ed.), India Development Report 2011. New Delhi: Oxford University Press, pp. 187–95.
Weiss, John (2005), ‘Export Growth and Industrial Policy: Lessons from the East Asian Miracle Experience’, ADB Institute Discussion Paper No. 26. Available at: http://www.adbi.org/fi les/2005.02.dp26.eastasia.govt.policy.pdf, last accessed on 18 September, 2012.
————– . (2011), The Economics of Industrial Development. London and New York: Routledge.


![[Phind] Miracle](https://img.pdfslide.net/doc/110x75/5472c10eb4af9fa90a8b4fb9/phind-miracle.jpg)