Embed Size (px)
Citation preview
Credit Card Basics
Bruce E. SullivanVP / Head of Specialized Sales- Federal, Visa, Inc.
GSA SmartPay Conference
®
11th Annual GSA SmartPay Conference
Phoenix, ArizonaJuly 28th - July 30th, 2009
®
Credit Card Basics
To ensure the best possible learning experience for participants, please adhere to the following house rules:
• Turn cell phones and pagers to vibrate• Hold questions to end of session• Must be scanned to receive CLP credits
− For each course• Unanswered Questions
− Q-Cards & Ballot Boxes− Answer to be emailed after the
conference - within 45 days
House Rules
®

Credit Card Basics
This session is designed to assist you in achieving the following goals:
• Review the card industry structure• Understand the commercial card value
propositions• Identify industry overviews and trends• Review best practices
Goals & Objectives
®
Agenda
Best Practices4.
Industry Overview & Historic Trends
3.
Commercial Card Value Proposition
2. Industry Structure1.
®
1. Industry Structure
®
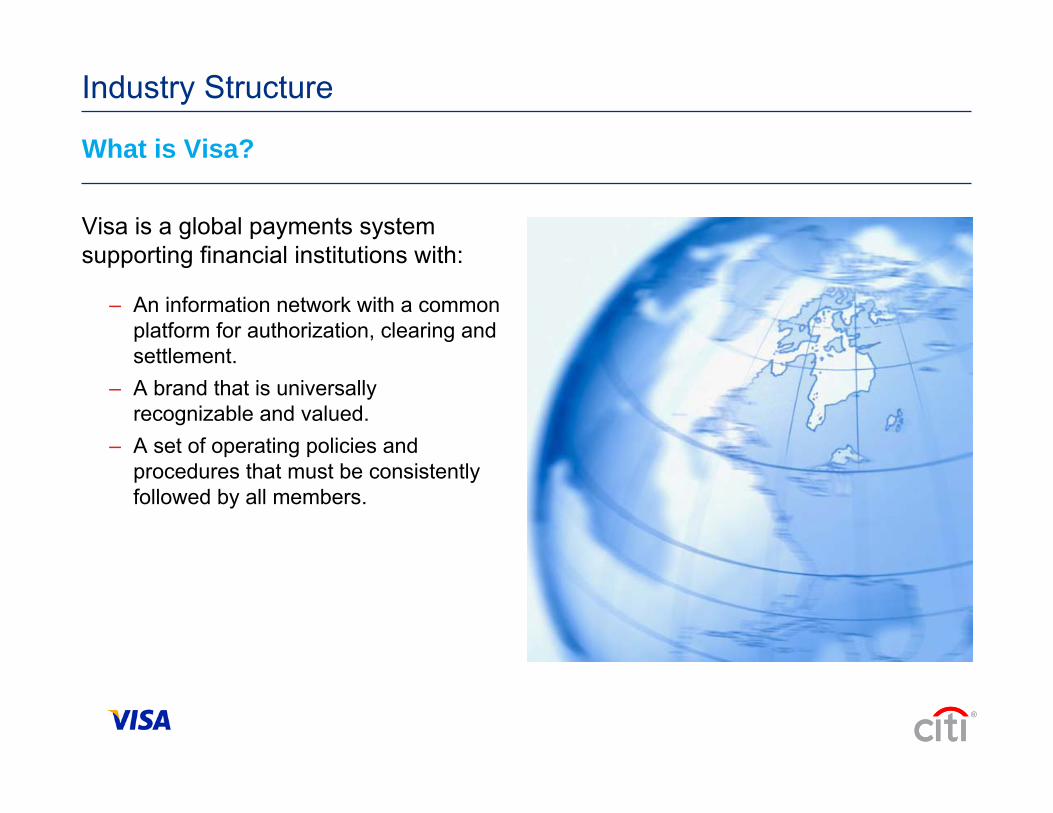
Industry Structure
Visa is a global payments system supporting financial institutions with:
What is Visa?
®
– An information network with a common platform for authorization, clearing and settlement.
– A brand that is universally recognizable and valued.
– A set of operating policies and procedures that must be consistently followed by all members.
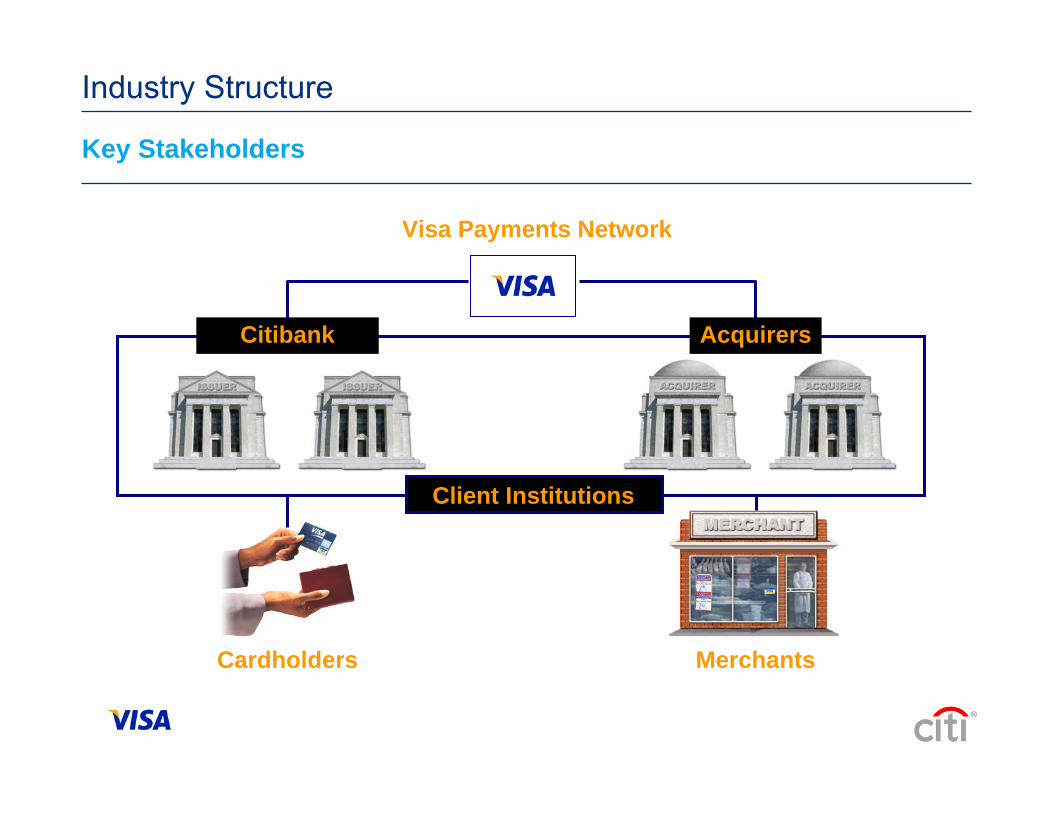
Industry Structure
Key Stakeholders
®
Visa Payments Network
Cardholders Merchants
Client Institutions
Citibank Acquirers
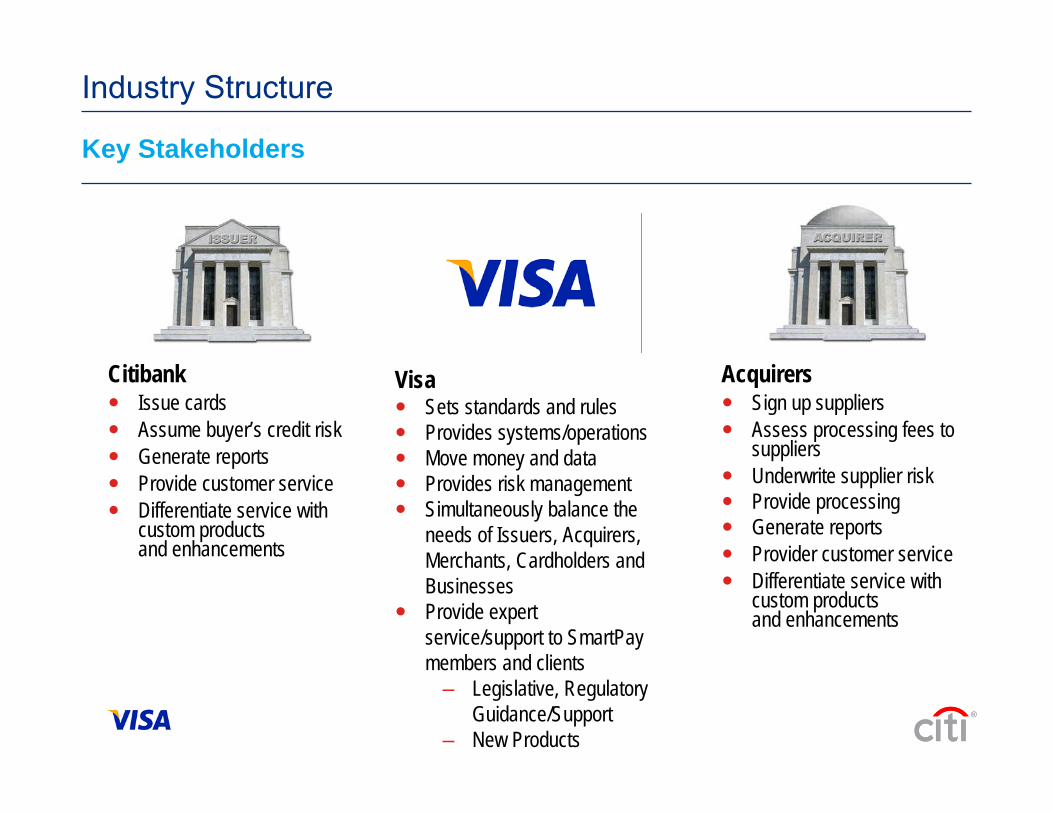
Industry Structure
Key Stakeholders
®
CitibankIssue cardsAssume buyer’s credit riskGenerate reportsProvide customer serviceDifferentiate service withcustom productsand enhancements
AcquirersSign up suppliersAssess processing fees to suppliersUnderwrite supplier riskProvide processingGenerate reportsProvider customer serviceDifferentiate service withcustom productsand enhancements
VisaSets standards and rulesProvides systems/operationsMove money and dataProvides risk managementSimultaneously balance the needs of Issuers, Acquirers, Merchants, Cardholders and BusinessesProvide expert service/support to SmartPay members and clients
– Legislative, Regulatory Guidance/Support
– New Products
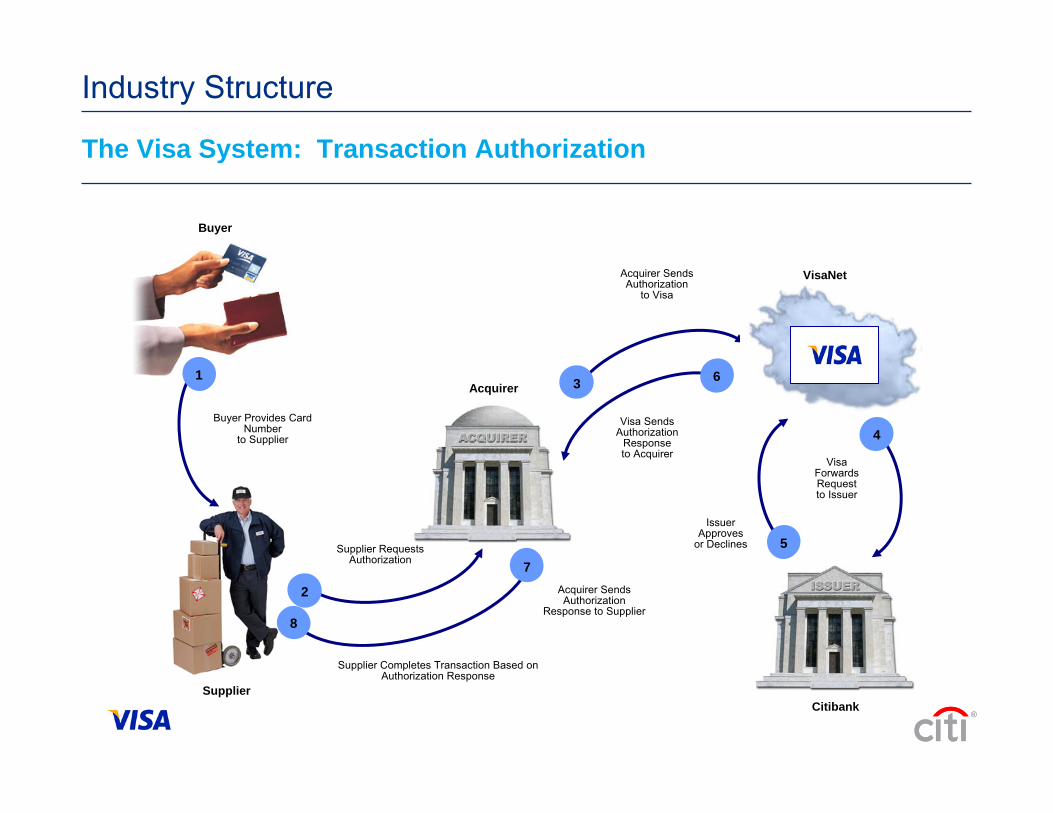
Industry Structure
The Visa System: Transaction Authorization
®
Buyer
1
Buyer Provides Card Number
to Supplier
Supplier
Acquirer
Supplier RequestsAuthorization
2
Acquirer SendsAuthorization
to Visa
3
Visa SendsAuthorization
Responseto Acquirer
6
7Acquirer SendsAuthorization
Response to Supplier
Supplier Completes Transaction Based on Authorization Response
8
Citibank
4
VisaForwardsRequestto Issuer
5Issuer
Approvesor Declines
VisaNet
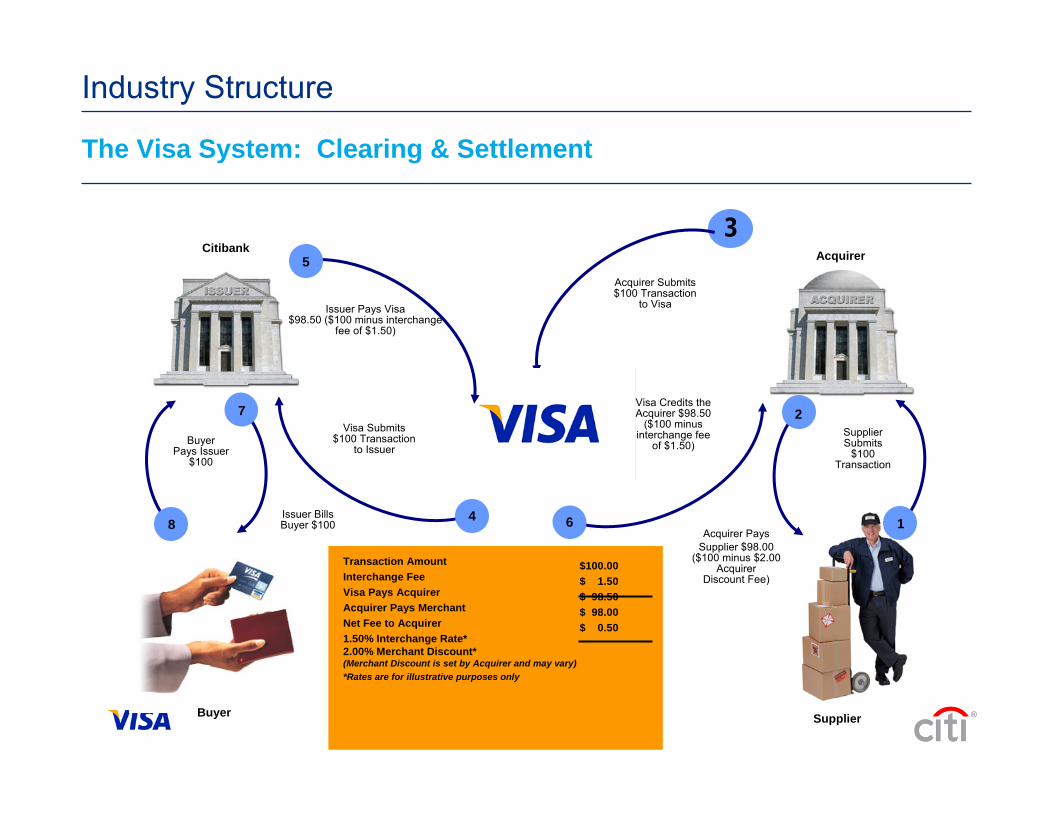
Industry Structure
The Visa System: Clearing & Settlement
®
3
Acquirer Submits$100 Transaction
to Visa
Acquirer
Supplier
1
SupplierSubmits
$100Transaction
6
Visa Credits theAcquirer $98.50
($100 minusinterchange fee
of $1.50)
2
Acquirer PaysSupplier $98.00
($100 minus $2.00Acquirer
Discount Fee)
8
BuyerPays Issuer
$100
Transaction AmountInterchange FeeVisa Pays AcquirerAcquirer Pays MerchantNet Fee to Acquirer1.50% Interchange Rate*2.00% Merchant Discount* (Merchant Discount is set by Acquirer and may vary)*Rates are for illustrative purposes only
$100.00$ 1.50$ 98.50$ 98.00$ 0.50
Buyer
7
Issuer BillsBuyer $100
Citibank
4
Visa Submits$100 Transaction
to Issuer
5
Issuer Pays Visa$98.50 ($100 minus interchange
fee of $1.50)
2. Commercial Card Value Proposition
®
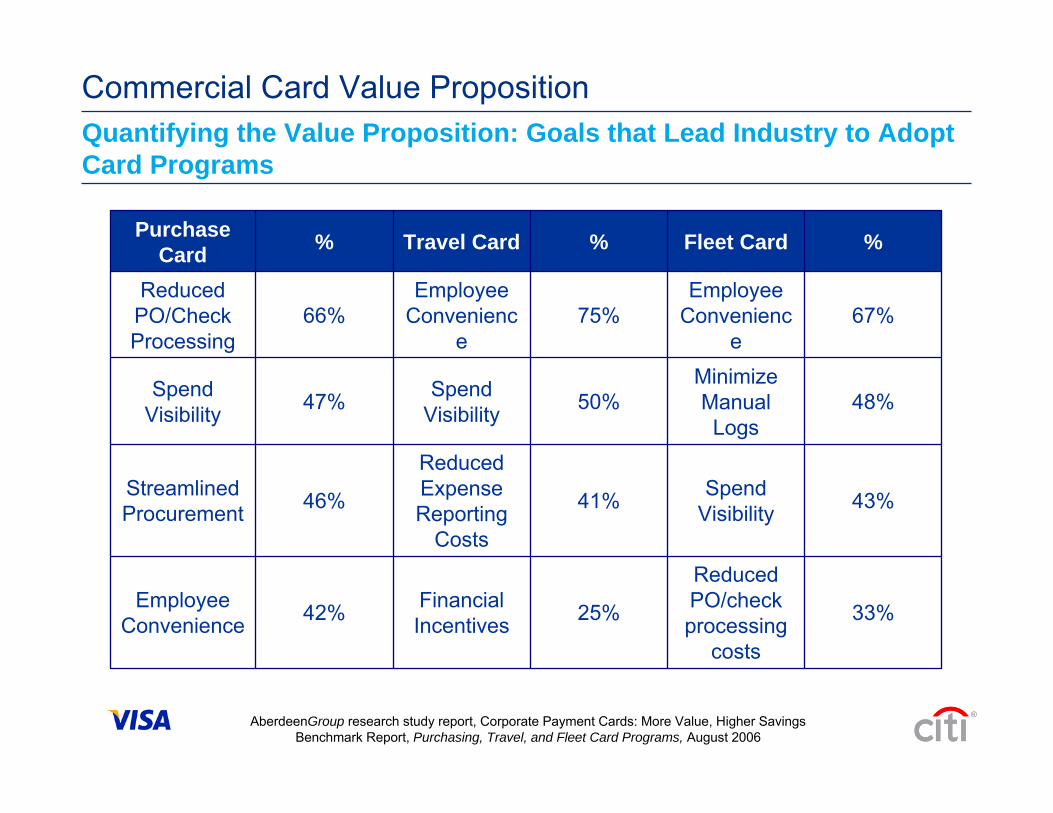
Commercial Card Value PropositionQuantifying the Value Proposition: Goals that Lead Industry to Adopt Card Programs
®
33%
Reduced PO/check processing
costs
25%Financial Incentives42%Employee
Convenience
43%Spend Visibility41%
Reduced Expense Reporting
Costs
46%Streamlined Procurement
48%Minimize Manual Logs
50%Spend Visibility47%Spend
Visibility
67%Employee
Convenience
75%Employee
Convenience
66%Reduced
PO/Check Processing
%Fleet Card%Travel Card%Purchase Card
AberdeenGroup research study report, Corporate Payment Cards: More Value, Higher Savings Benchmark Report, Purchasing, Travel, and Fleet Card Programs, August 2006
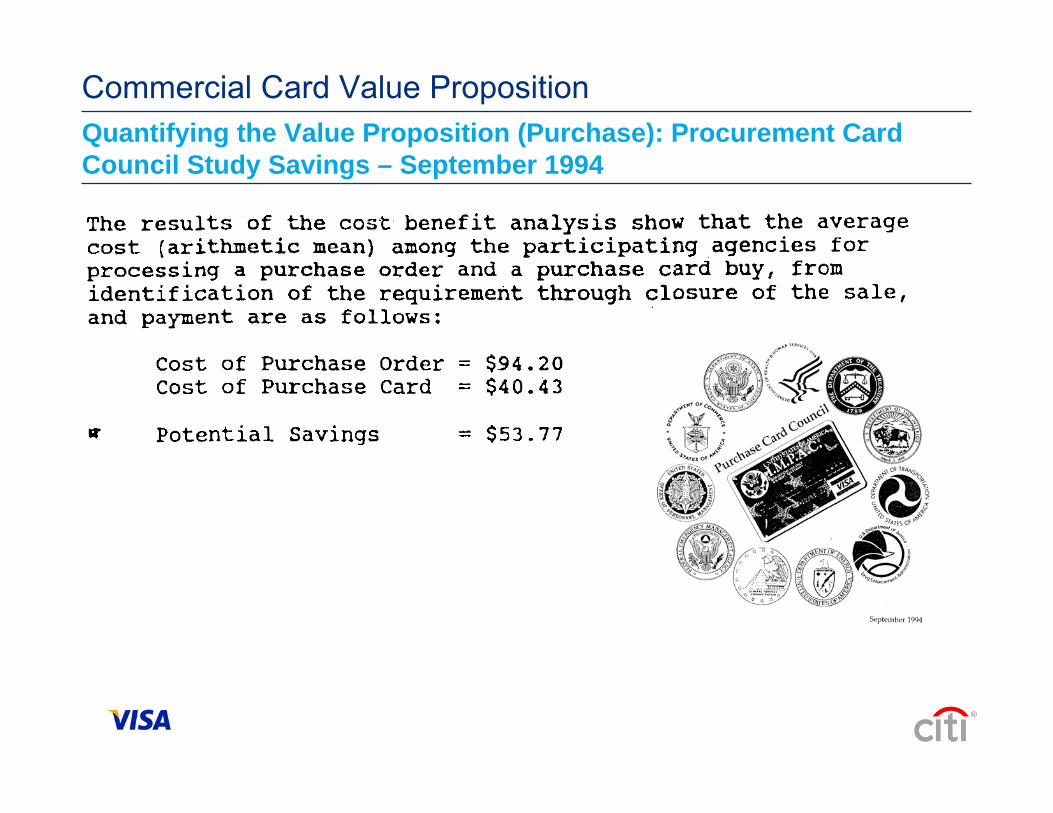
Commercial Card Value PropositionQuantifying the Value Proposition (Purchase): Procurement Card Council Study Savings – September 1994
®
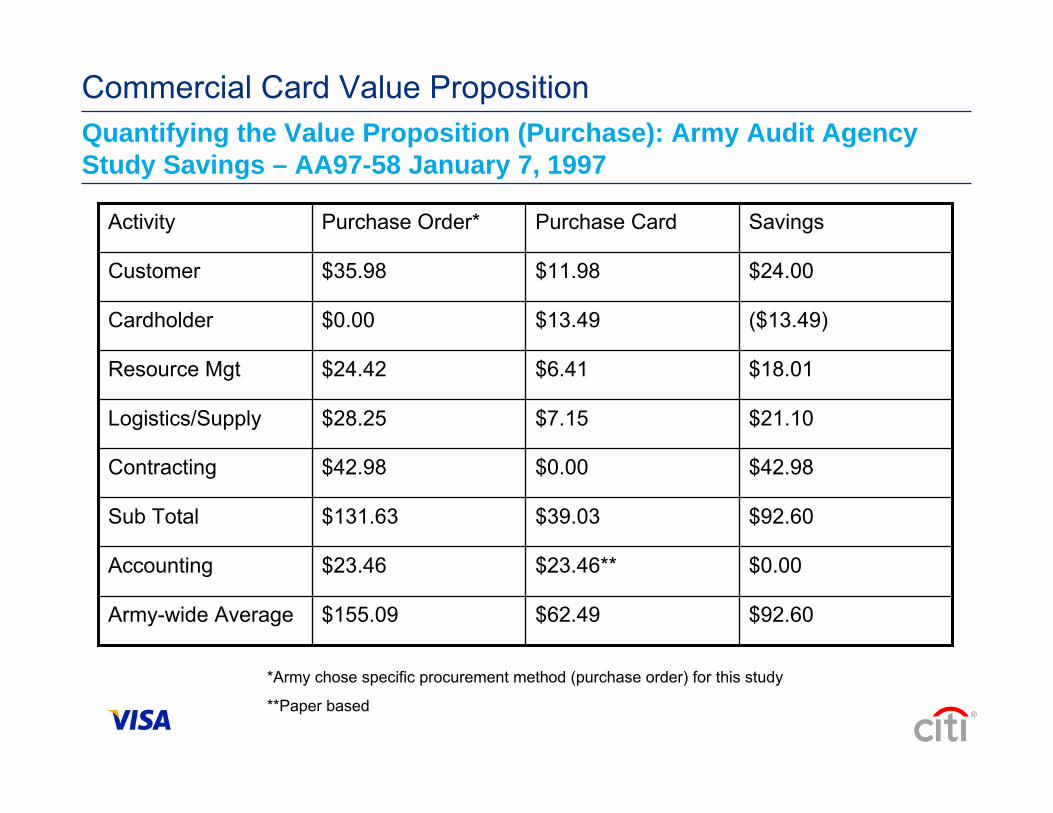
Commercial Card Value PropositionQuantifying the Value Proposition (Purchase): Army Audit Agency Study Savings – AA97-58 January 7, 1997
®
*Army chose specific procurement method (purchase order) for this study
**Paper based
$92.60$62.49$155.09Army-wide Average
$0.00$23.46**$23.46Accounting
$92.60$39.03$131.63Sub Total
$42.98$0.00$42.98Contracting
$21.10$7.15$28.25Logistics/Supply
$18.01$6.41$24.42Resource Mgt
($13.49)$13.49$0.00Cardholder
$24.00$11.98$35.98Customer
SavingsPurchase CardPurchase Order*Activity
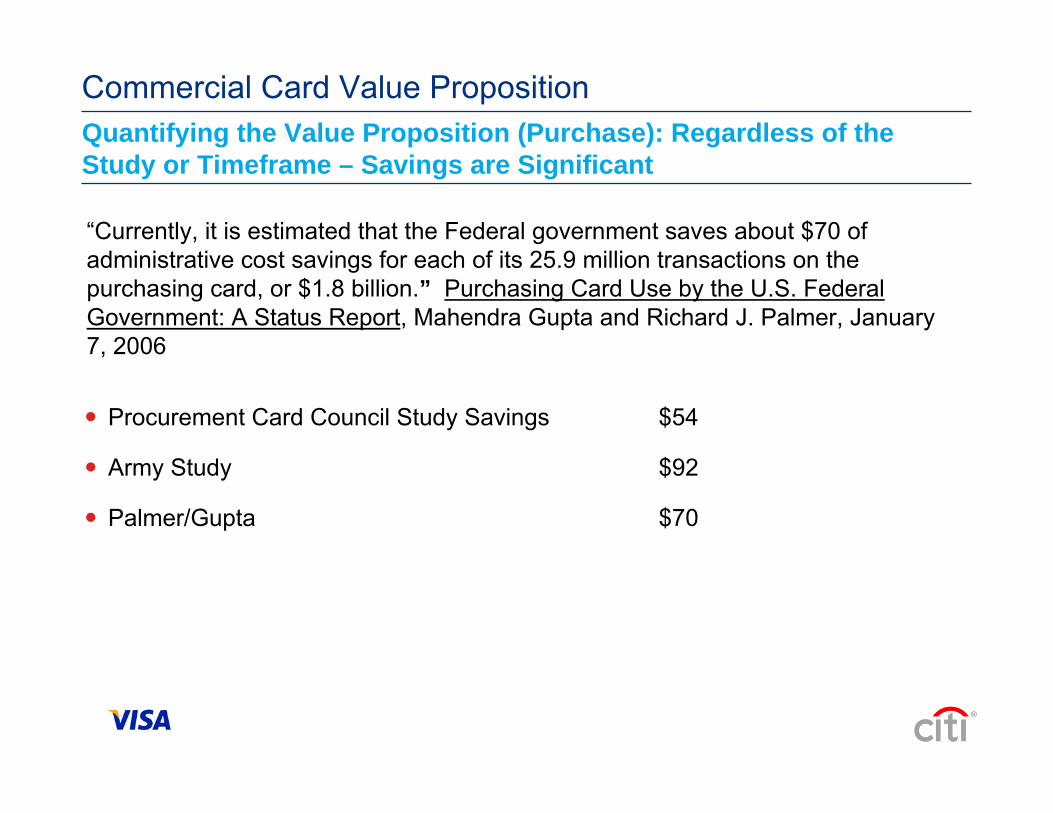
Quantifying the Value Proposition (Purchase): Regardless of the Study or Timeframe – Savings are Significant
®
Procurement Card Council Study Savings $54
Army Study $92
Palmer/Gupta $70
“Currently, it is estimated that the Federal government saves about $70 of administrative cost savings for each of its 25.9 million transactions on the purchasing card, or $1.8 billion.” Purchasing Card Use by the U.S. Federal Government: A Status Report, Mahendra Gupta and Richard J. Palmer, January 7, 2006
Commercial Card Value Proposition
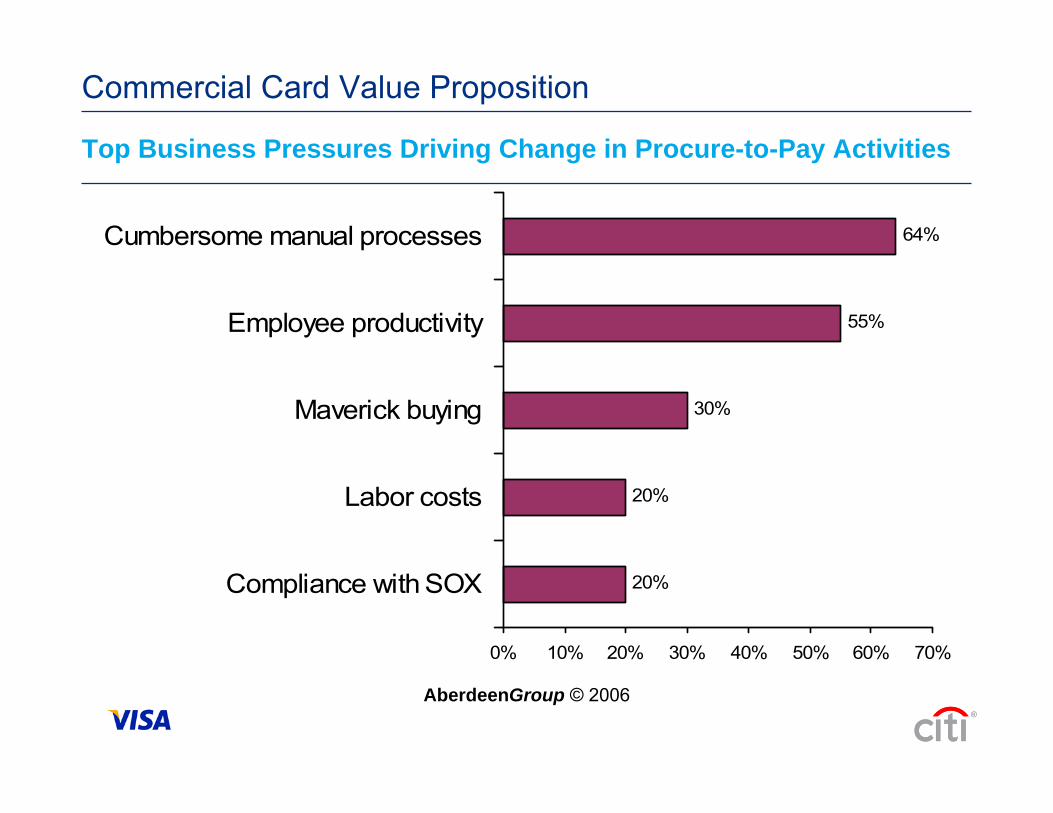
Top Business Pressures Driving Change in Procure-to-Pay Activities
®
20%
20%
30%
55%
64%
0% 10% 20% 30% 40% 50% 60% 70%
Compliance with SOX
Labor costs
Maverick buying
Employee productivity
Cumbersome manual processes
AberdeenGroup © 2006
Commercial Card Value Proposition
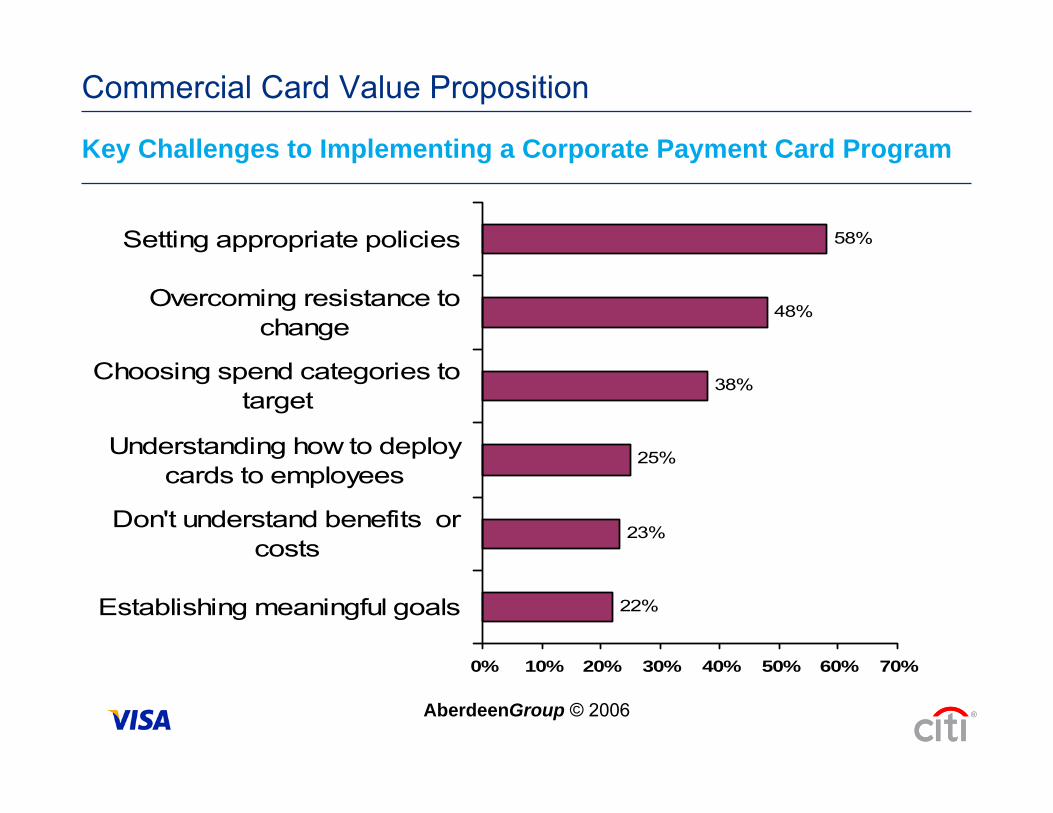
Key Challenges to Implementing a Corporate Payment Card Program
®
22%
23%
25%
38%
48%
58%
0% 10% 20% 30% 40% 50% 60% 70%
Establishing meaningful goals
Don't understand benefits orcosts
Understanding how to deploycards to employees
Choosing spend categories totarget
Overcoming resistance tochange
Setting appropriate policies
AberdeenGroup © 2006
Commercial Card Value Proposition
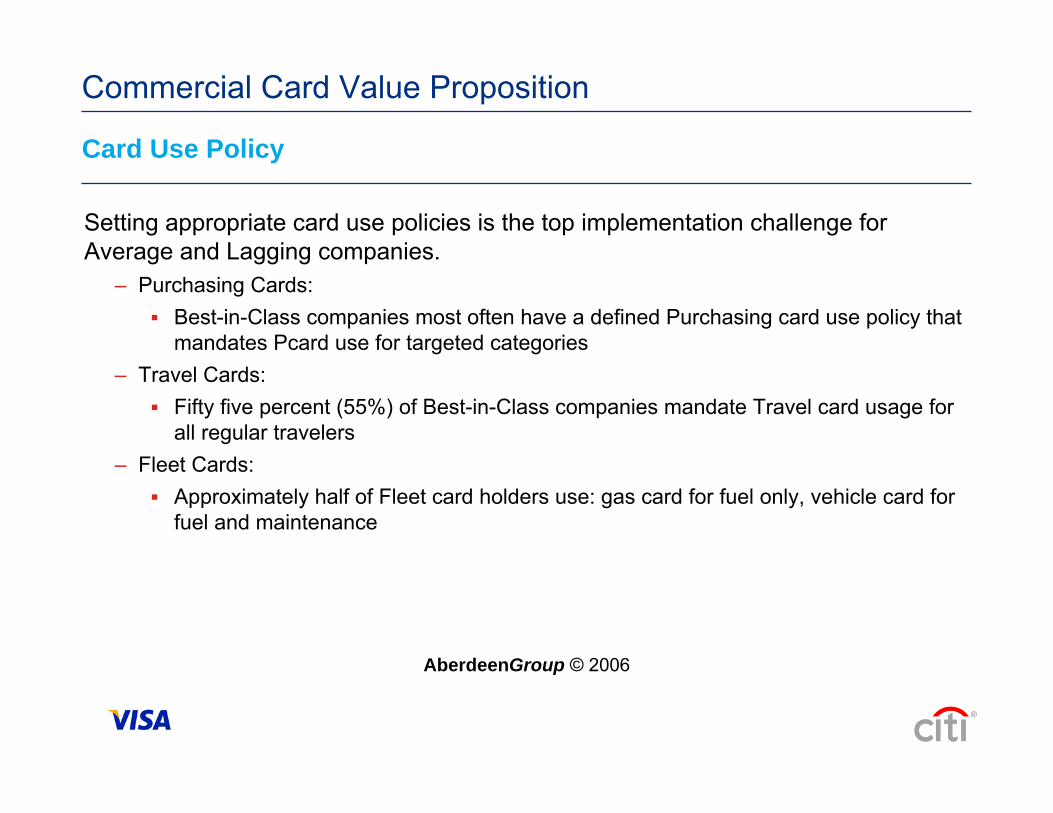
Card Use Policy
®
Setting appropriate card use policies is the top implementation challenge for Average and Lagging companies.
– Purchasing Cards:Best-in-Class companies most often have a defined Purchasing card use policy that mandates Pcard use for targeted categories
– Travel Cards:Fifty five percent (55%) of Best-in-Class companies mandate Travel card usage for all regular travelers
– Fleet Cards:Approximately half of Fleet card holders use: gas card for fuel only, vehicle card for fuel and maintenance
AberdeenGroup © 2006
Commercial Card Value Proposition
3. Industry Overview & Historic Trends
®
Industry Average Steps to Success
®
AberdeenGroup © 2006
Industry Overview & Historic Trends
Move more spend under the card. Increasing the amount of spend under the card will enable incremental savings and increased category spend visibility
Strictly enforce the use of P-cards for targeted categories. For Travel cards, move away from reimbursing personal card expenses and mandate the use of corporate card for all regular travelers
Industry Average Steps to Success (continued)
®
AberdeenGroup © 2006
P-card: give more decision-making power in managing the P-card program to the Purchasing director who is closer to the program and is able to make sound decisions about its use.
Travel card: give the Purchasing director more decision making power for the program decisions, relegate program management to the Travel director.
Fleet card: coordinate card policy decisions more closely with the Fleet director.
Move to the electronic program reporting and online statement delivery, as well as automatic card transactions reconciliation.
Industry Overview & Historic Trends
Industry Trends: North American Purchase Card Industry
®
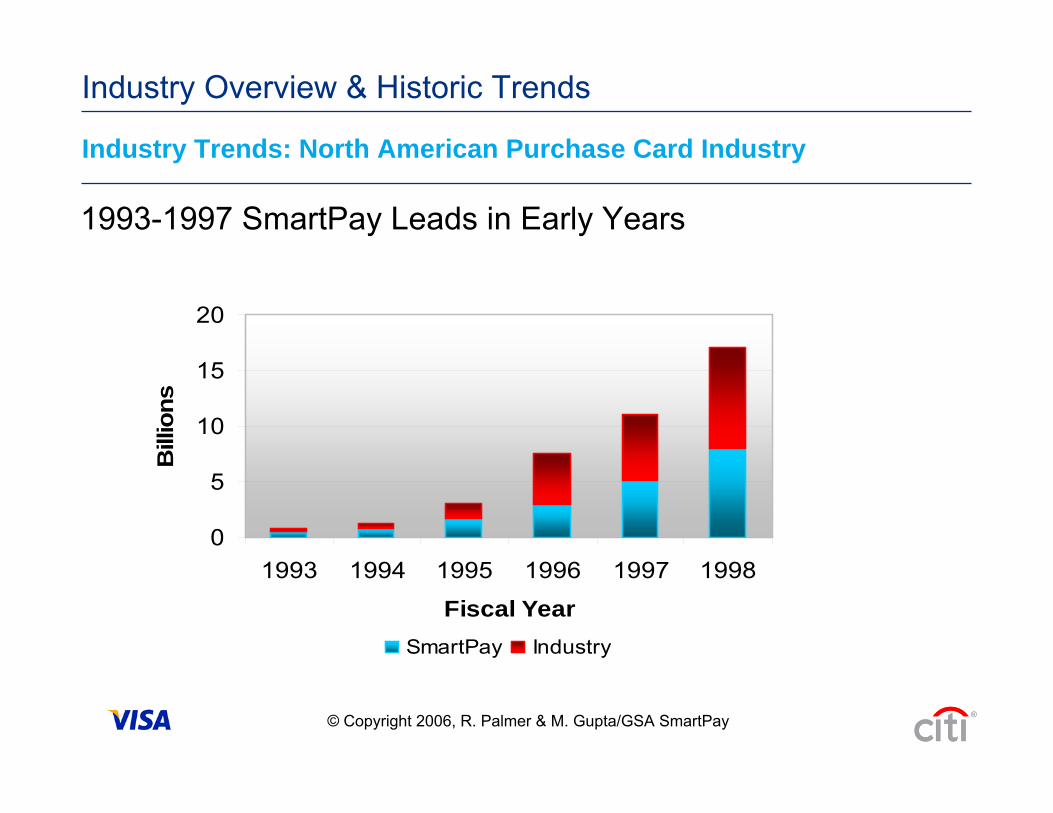
0
5
10
15
20
1993 1994 1995 1996 1997 1998
Fiscal Year
Bill
ions
SmartPay Industry
© Copyright 2006, R. Palmer & M. Gupta/GSA SmartPay
1993-1997 SmartPay Leads in Early Years
Industry Overview & Historic Trends
Industry Trends: North American Purchase Card Industry
®
Industry Overview & Historic Trends
© Copyright 2006, R. Palmer & M. Gupta/GSA SmartPay
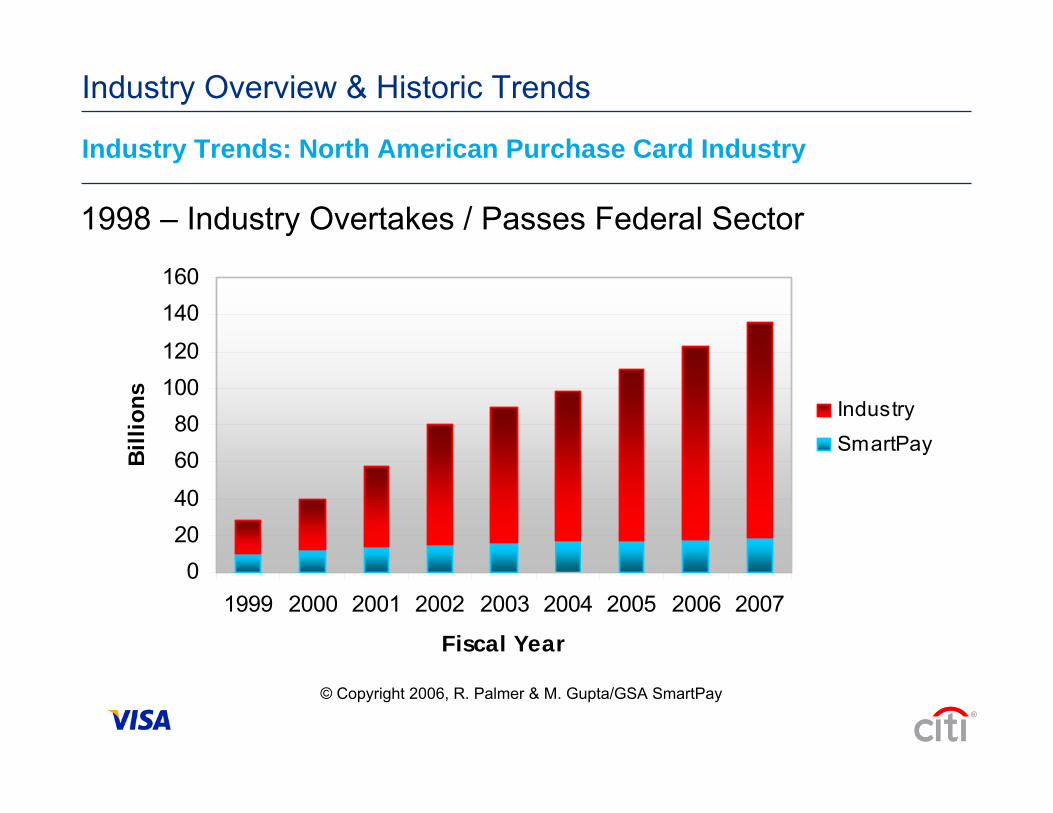
02040
6080
100120
140160
1999 2000 2001 2002 2003 2004 2005 2006 2007
Fiscal Year
Bill
ions Industry
SmartPay
1998 – Industry Overtakes / Passes Federal Sector
Industry Trends: North American Purchase Card Industry
®
Industry Overview & Historic Trends
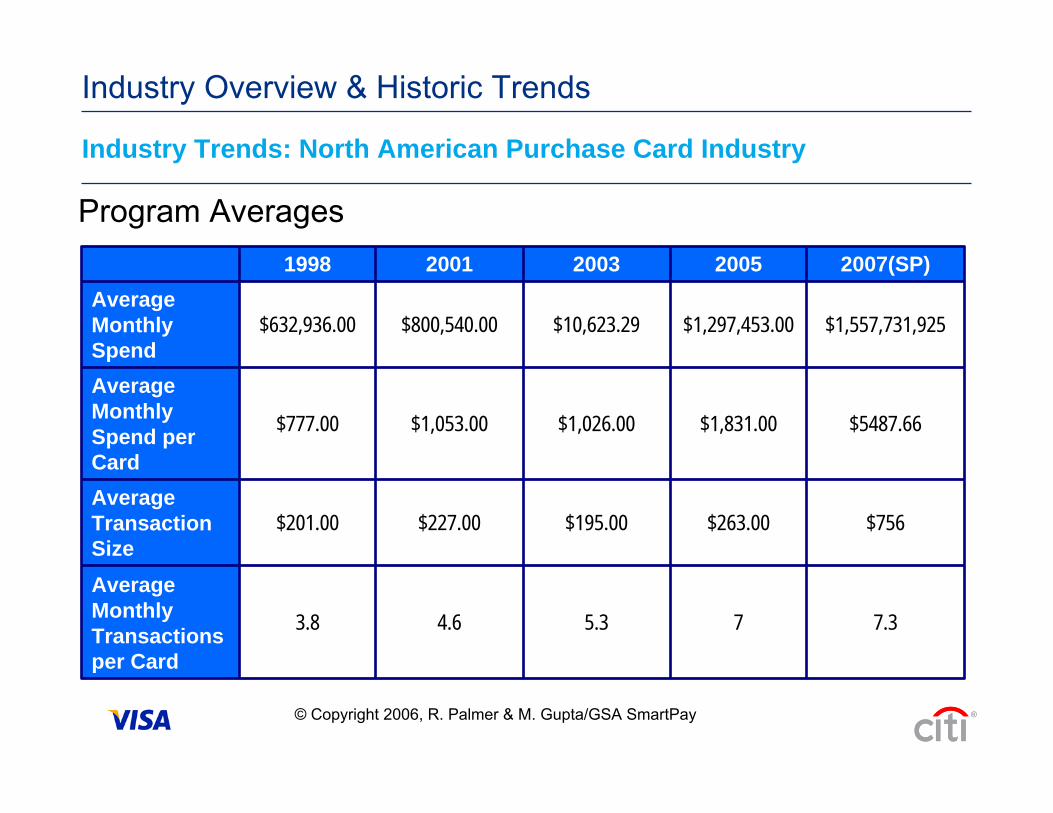
Program Averages
7.375.34.63.8
Average Monthly Transactions per Card
$756$263.00$195.00$227.00$201.00Average Transaction Size
$5487.66$1,831.00$1,026.00$1,053.00$777.00
Average Monthly Spend per Card
$1,557,731,925$1,297,453.00$10,623.29$800,540.00$632,936.00Average Monthly Spend
2007(SP)2005200320011998
© Copyright 2006, R. Palmer & M. Gupta/GSA SmartPay
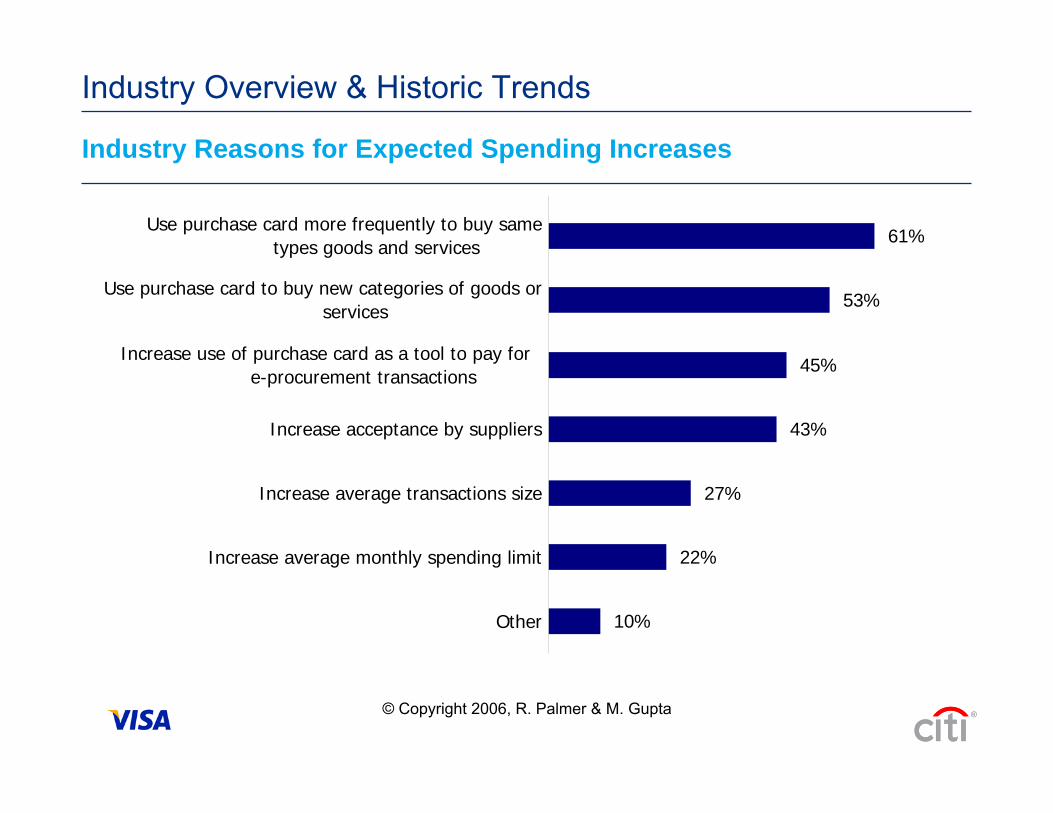
Industry Reasons for Expected Spending Increases
®
Industry Overview & Historic Trends
10%
22%
27%
43%
45%
53%
61%
Other
Increase average monthly spending limit
Increase average transactions size
Increase acceptance by suppliers
Increase use of purchase card as a tool to pay for e-procurement transactions
Use purchase card to buy new categories of goods orservices
Use purchase card more frequently to buy sametypes goods and services
© Copyright 2006, R. Palmer & M. Gupta
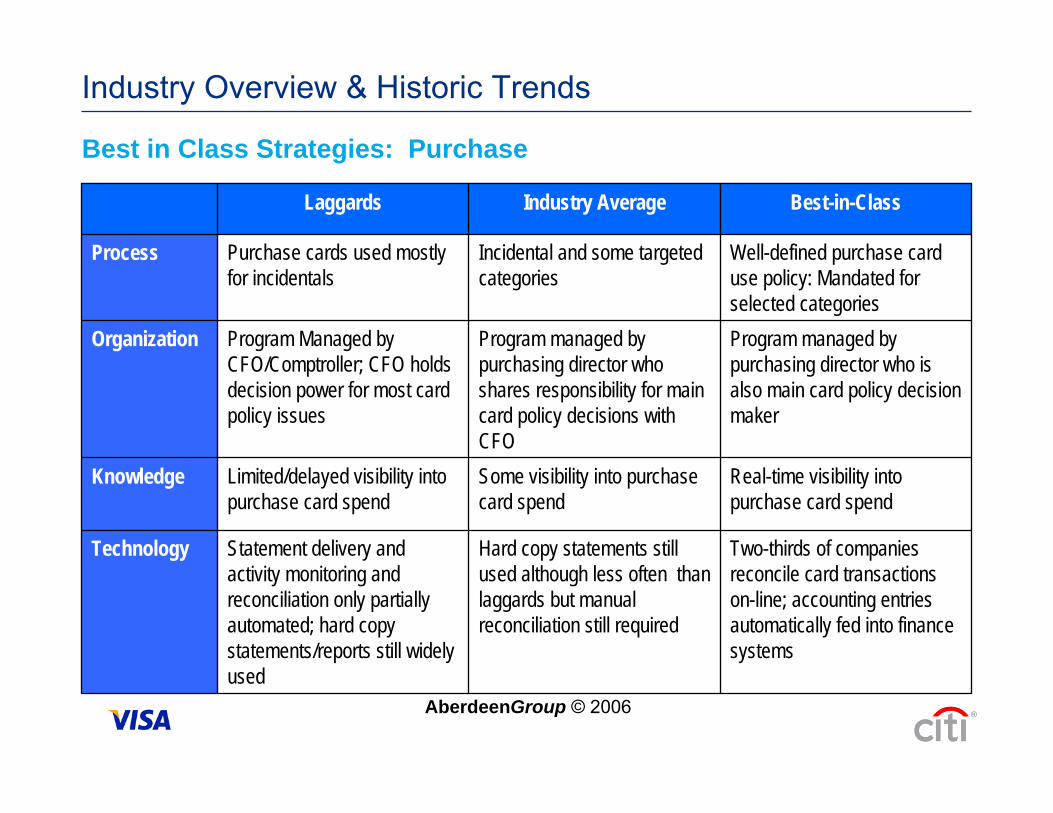
Best in Class Strategies: Purchase
®
Industry Overview & Historic Trends
Two-thirds of companies reconcile card transactions on-line; accounting entries automatically fed into finance systems
Hard copy statements still used although less often than laggards but manual reconciliation still required
Statement delivery and activity monitoring and reconciliation only partially automated; hard copy statements/reports still widely used
Technology
Real-time visibility into purchase card spend
Some visibility into purchase card spend
Limited/delayed visibility into purchase card spend
Knowledge
Program managed by purchasing director who is also main card policy decision maker
Program managed by purchasing director who shares responsibility for main card policy decisions with CFO
Program Managed by CFO/Comptroller; CFO holds decision power for most card policy issues
Organization
Well-defined purchase card use policy: Mandated for selected categories
Incidental and some targeted categories
Purchase cards used mostly for incidentals
Process
Best-in-ClassIndustry AverageLaggards
AberdeenGroup © 2006
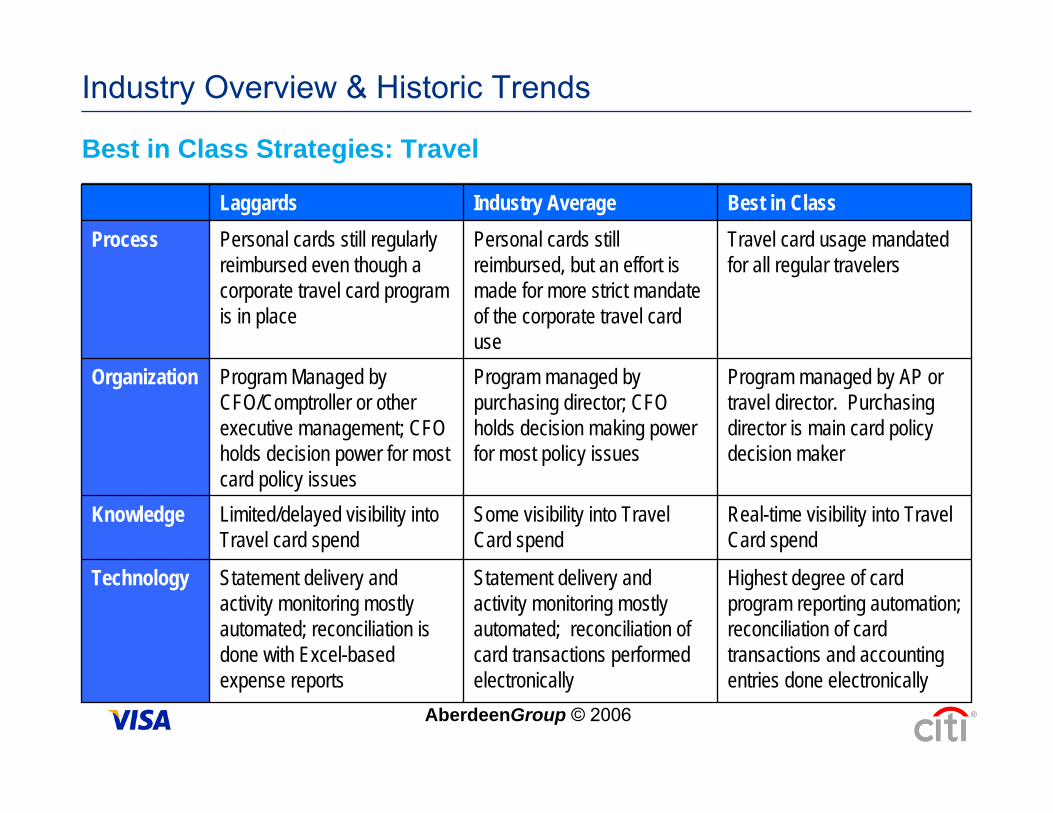
Best in Class Strategies: Travel
®
Industry Overview & Historic Trends
Highest degree of card program reporting automation; reconciliation of card transactions and accounting entries done electronically
Statement delivery and activity monitoring mostly automated; reconciliation of card transactions performed electronically
Statement delivery and activity monitoring mostly automated; reconciliation is done with Excel-based expense reports
Technology
Real-time visibility into Travel Card spend
Some visibility into Travel Card spend
Limited/delayed visibility into Travel card spend
Knowledge
Program managed by AP or travel director. Purchasing director is main card policy decision maker
Program managed by purchasing director; CFO holds decision making power for most policy issues
Program Managed by CFO/Comptroller or other executive management; CFO holds decision power for most card policy issues
Organization
Travel card usage mandated for all regular travelers
Personal cards still reimbursed, but an effort is made for more strict mandate of the corporate travel card use
Personal cards still regularly reimbursed even though a corporate travel card program is in place
ProcessBest in ClassIndustry AverageLaggards
AberdeenGroup © 2006
4. Best Practices
®
Program Best Practices
®
Best Practices
Strong executive endorsement
Cross-functional collaboration (Acquisition, Finance, Logistics, Internal Control, etc.)
Integration with technology investments (E Purchasing)
Broadest distribution of cards
Broadest utilization of cards (payment and purchase)
Mix of payment applications (interchange and non-interchange based)
Connection to broader cost management agenda (strategic sourcing)
Program Best Practices (continued)
®
Best Practices
Concentration on streamlining business processes
Goals and metrics
Higher spending limits, driving more active card use
Expanded span of acceptable purchases
Perform a process mapping / cost analysis
Quantify purchase card ROI
Set & track performance goals
Provide comprehensive training and communications
Credit Card Basics
This session was designed to assist you in achieving the following goals:
• Review the card industry structure• Understand the commercial card value
propositions• Identify industry overviews and trends• Review best practices
Summary
®
Terms & Disclosures
Tuesday, July 28, 2009
®
IRS Circular 230 Disclosure: Citigroup Inc. and its affiliates do not provide tax or legal advice. Any discussion of tax matters in these materials (i) is not intended or written to be used, and cannot be used or relied upon, by you for the purpose of avoiding any tax penalties and (ii) may have been written in connection with the "promotion or marketing" of any transaction contemplated hereby ("Transaction"). Accordingly, you should seek advice based on your particular circumstances from an independent tax advisor.
Any terms set forth herein are intended for discussion purposes only and are subject to the final terms as set forth in separate definitive written agreements. This presentation is not a commitment to lend, syndicate a financing, underwrite or purchase securities, or commit capital nor does it obligate us to enter into such a commitment. Nor are we acting in any other capacity as a fiduciary to you. By accepting this presentation, subject to applicable law or regulation, you agree to keep confidential the existence of and proposed terms for any Transaction.
Prior to entering into any Transaction, you should determine, without reliance upon us or our affiliates, the economic risks and merits (and independently determine that you are able to assume these risks) as well as the legal, tax and accounting characterizations and consequences of any such Transaction. In this regard, by accepting this presentation, you acknowledge that (a) we are not in the business of providing (and you are not relying on us for) legal, tax or accounting advice, (b) there may be legal, tax or accounting risks associated with any Transaction, (c) you should receive (and rely on) separate and qualified legal, tax and accounting advice and (d) you should apprise senior management in your organization as to such legal, tax and accounting advice (and any risks associated with any Transaction) and our disclaimer as to these matters. By acceptance of these materials, you and we hereby agree that from the commencement of discussions with respect to any Transaction, and notwithstanding any other provision in this presentation, we hereby confirm that no participant in any Transaction shall be limited from disclosing the U.S. tax treatment or U.S. tax structure of such Transaction.
We are required to obtain, verify and record certain information that identifies each entity that enters into a formal business relationship with us. We will ask for your complete name, street address, and taxpayer ID number. We may also request corporate formation documents, or other forms of identification, to verify information provided.
Any prices or levels contained herein are preliminary and indicative only and do not represent bids or offers. These indications are provided solely for your information and consideration, are subject to change at any time without notice and are not intended as a solicitation with respect to the purchase or sale of any instrument. The information contained in this presentation may include results of analyses from a quantitative model which represent potential future events that may or may not be realized, and is not a complete analysis of every material fact representing any product. Any estimates included herein constitute our judgment as of the date hereof represent potential future events that may or may not be realized, and is not a complete analysis of every material fact representing any product. Any estimates included herein constitute our judgment as of the date hereof and are subject to change without any notice. We and/or our affiliates may make a market in these instruments for our customers and for our own account. Accordingly, we may have a position in any such instrument at any time.
Although this material may contain publicly available information about Citi corporate bond research, fixed income strategy or economic and market analysis, Citi policy (i) prohibits employees from offering, directly or indirectly, a favorable or negative research opinion or offering to change an opinion as consideration or inducement for the receipt of business or for compensation and (ii) prohibits analysts from being compensated for specific recommendations or views contained in research reports. So as to reduce the potential for conflicts of interest, as well as to reduce any appearance of conflicts of interest, Citi has enacted policies and procedures designed to limit communications between its investment banking and research personnel to specifically prescribed circumstances.
© 2009 Citibank, N.A. All rights reserved. Citi, Citi Arc Design, CitiDirect, Citimanager, Citibank Custom Reporting System, Citibank Electronic Reporting System, are trademarks and service marks of Citigroup Inc. or its affiliates and are used and registered throughout the world.
In January 2007, Citi released a Climate Change Position Statement, the first US financial institution to do so. As a sustainability leader in the financial sector, Citi has taken concrete steps to address this important issue of climate change by: (a) targeting $50 billion over 10 years to address global climate change: includes significant increases in investment and financing of alternative energy, clean technology, and other carbon-emission reduction activities; (b) committing to reduce GHG emissions of all Citi owned and leased properties around the world by 10% by 2011; (c) purchasing more than 52,000 MWh of green (carbon neutral) power for our operations in 2006; (d) creating Sustainable Development Investments (SDI) that makes private equity investments in renewable energy and clean technologies; (e) providing lending and investing services to clients for renewable energy development and projects; (f) producing equity research related to climate issues that helps to inform investors on risks and opportunities associated with the issue; and (g) engaging with a broad range of stakeholders on the issue of climate change to help advance understanding and solutions. Citi works with its clients in greenhouse gas intensive industries to evaluate emerging risks from climate change and, where appropriate, to mitigate those risks.
©2009 Citibank, N.A. All rights reserved. Citi, Citi and Arc Design and CitiDirect are trademarks and service marks of Citigroup Inc., used and registered throughout the world.
®