Embed Size (px)
Citation preview
7/27/2019 Thackray Market Letter 2013 October
http://slidepdf.com/reader/full/thackray-market-letter-2013-october 1/9
An ETF for all seasons
The Horizons Seasonal Rotation ETF (HAC)
Visit: HorizonsETFs.com for more information
Thackray Market Letter— Know Your Buy & Sells a Month in Advance —
Published the 10th Calendar Day of Every MonthVolume 7, Number 10, October 2013 Written by Brooke Thackray
alphaMountain Investments - alphamountain.com
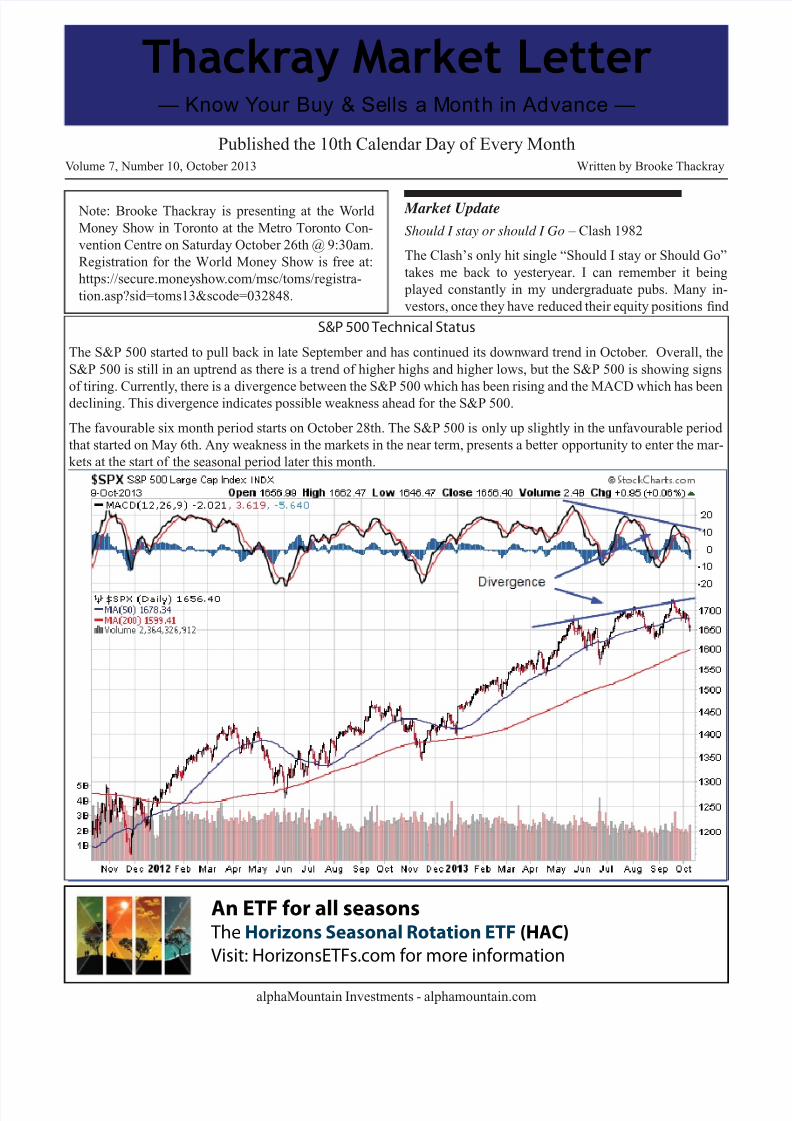
S&P 500 Technical Status
The S&P 500 started to pull back in late September and has continued its downward trend in October. Overall, the
S&P 500 is still in an uptrend as there is a trend of higher highs and higher lows, but the S&P 500 is showing signs
of tiring. Currently, there is a divergence between the S&P 500 which has been rising and the MACD which has been
declining. This divergence indicates possible weakness ahead for the S&P 500.
The favourable six month period starts on October 28th. The S&P 500 is only up slightly in the unfavourable period
that started on May 6th. Any weakness in the markets in the near term, presents a better opportunity to enter the mar-
kets at the start of the seasonal period later this month.
Market Update
Should I stay or should I Go – Clash 1982
The Clash’s only hit single “Should I stay or Should Go”
takes me back to yesteryear. I can remember it being
played constantly in my undergraduate pubs. Many in-
vestors, once they have reduced their equity positions find
Note: Brooke Thackray is presenting at the World
Money Show in Toronto at the Metro Toronto Con-
vention Centre on Saturday October 26th @ 9:30am.
Registration for the World Money Show is free at:
https://secure.moneyshow.com/msc/toms/registra-
tion.asp?sid=toms13&scode=032848.
7/27/2019 Thackray Market Letter 2013 October
http://slidepdf.com/reader/full/thackray-market-letter-2013-october 2/9alphaMountain Investments - alphamountain.com
— 2 —
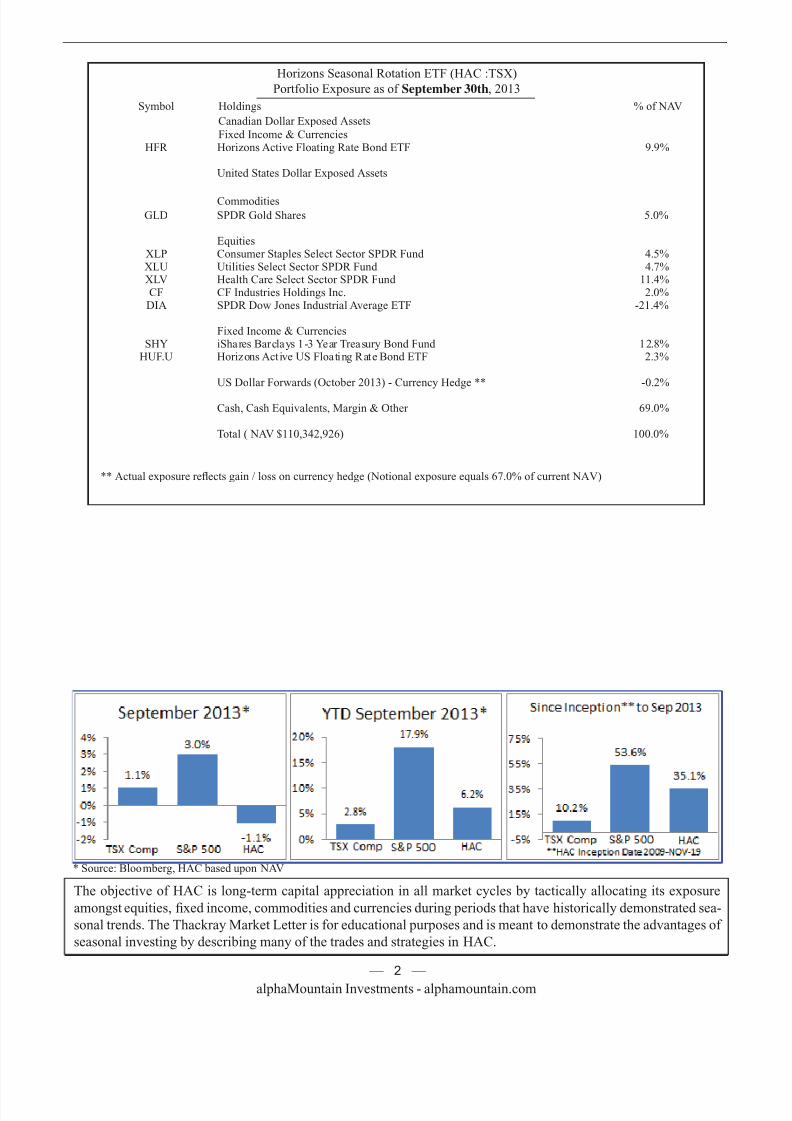
Horizons Seasonal Rotation ETF (HAC :TSX)
Portfolio Exposure as of September 30th, 2013
Symbol Holdings % of NAV
Canadian Dollar Exposed AssetsFixed Income & Currencies
HFR Horizons Active Floating Rate Bond ETF 9.9%
United States Dollar Exposed Assets
Commodities
GLD SPDR Gold Shares 5.0%
EquitiesXLP Consumer Staples Select Sector SPDR Fund 4.5%XLU Utilities Select Sector SPDR Fund 4.7%XLV Health Care Select Sector SPDR Fund 11.4%CF CF Industries Holdings Inc. 2.0%
DIA SPDR Dow Jones Industrial Average ETF -21.4%
Fixed Income & CurrenciesSHY iShares Barclays 1-3 Year Treasury Bond Fund 12.8%
HUF.U Horizons Active US Floating Rate Bond ETF 2.3%
US Dollar Forwards (October 2013) - Currency Hedge ** -0.2%
Cash, Cash Equivalents, Margin & Other 69.0%
Total ( NAV $110,342,926) 100.0%
** Actual exposure reflects gain / loss on currency hedge (Notional exposure equals 67.0% of current NAV)
The objective of HAC is long-term capital appreciation in all market cycles by tactically allocating its exposure
amongst equities, fixed income, commodities and currencies during periods that have historically demonstrated sea-
sonal trends. The Thackray Market Letter is for educational purposes and is meant to demonstrate the advantages of
seasonal investing by describing many of the trades and strategies in HAC.
* Source: Bloomberg, HAC based upon NAV
7/27/2019 Thackray Market Letter 2013 October
http://slidepdf.com/reader/full/thackray-market-letter-2013-october 3/9alphaMountain Investments - alphamountain.com
— 3 —
it dif ficult to get back into the market, regardless if it has
increased or decreased. As a result they suffer indecision–
wondering, “Should I Stay or Should I go?”
For seasonal investors, the answer of whether to get in
the market on not, is so much easier compared to inves-
tors following other disciplines. The answer is based on
seasonal investing being a long-term disciplined strategy.
Yes, you heard it correctly– seasonal investing is a long-
term discipline. Although the trades are shorter than the
standard “buy and hold” approach, the discipline’s suc-
cess is based upon performing a number of trades over
time, realizing that all trades will not work, The goal is to
have the trades that do work, more than offset the trades
that do not work.
Most of the regular readers of this newsletter and my
books, will be familiar with the favourable six month cy-
cle (for stocks) that lasts from October 28th to May 5th.
This six month period has historically been a much better
time to be in the stock market than the other six months of
the year. This makes the answer to the question, “Should
I Stay or Should I Go?”, so much easier for seasonal in-
vestors. In short– the answer is go– increase stock market
exposure at the start of the favourable six month period.
Yes, there may be a better time to enter the market, but
on average, entering at the end of the October 27th (to be
in the market for October 28th), has proven to be a long-
term successful strategy.
I am not the first person to put forward the favourable
six month strategy. In fact, it has been written about, in
its different variations, by many others. Academics like
everything in nice tidy boxes, so they almost universallyhave analyzed the six month period starting at the begin-
ning of November and ending at the end of April. Some-
times this strategy is called the Halloween Effect. Pro-
fessors Jacobsen and Zhang published, The Halloween
Indicator: Everywhere and All the Time, in October 2012.
This article illustrated the magnitude of how much bet-
ter the November to April six month period is for stocks,
compared to the other six months of the year. The arti-
cle can be found at, http://papers.ssrn.com/sol3/papers.
cfm?abstract_id=2154873.
In 1999 I coauthored Time In Time Out: Outsmart theStock Market Using Calendar Investment Strategies. At
the time, it was probably one of the most seminal works
on the six month cycle in the stock market– it looked at
averages, frequencies, decade analysis, included interest
and dividends etc. In working up my analysis, it became
quite clear that being in the market for the last few days of
October provided a large benefit. In my Thackray’s 2011
Investor’s Guide, I presented the Last 4 Market Days in
October strategy. From 1950 to 2009 the last four days in
October produced an astounding average rate of return of
1% and was positive 58% of the time. It is important to
realize that like any strategy, it does not work all of the
time, but when it works, it can work very well. Investors
should seriously consider entering into the market for the
last few days of October, in order to start of the six month
favourable season for stocks.
I often get asked the question: should a seasonal strategy
be altered for economic announcements? In other words,
should strategy implementation be delayed until after
announcements, such as an unemployment report? The
simple answer is NO. The truth is that no one knows what
the employment report beholds. Everyone has expecta-
tions and if the actual results beat the expectations, then
the market will likely respond by moving higher, and if
results fall short of expectations, the market will likely
decline. It is too risky to guess. If a strong seasonal trend
exists and a favourable announcement is released, the po-
tential upside movement tends be larger than the potentialdownside movement if an unfavourable announcement is
released.
I raise this point because of the current shenanigans tak-
ing place in Washington with the debt ceiling limit. The
government is set to run out of money sometime later in
October. Most people expect the government to resolve
the issue before it becomes critical, although they do ad-
mit that there is a slim chance that the impasse will not
be broken. As we move closer to the government running
out of money and without any progress in talks between
the two parties, the markets will likely respond negative-ly. If the situation has not been resolved by the start of the
favourable six month seasonal period for stocks, what is
the best strategy for a seasonal investor? Although there
may be increasing risk of a default, the seasonal invest-
ment approach is to enter the market. If the debt ceiling
is resolved shortly afterwards, the market could respond
violently to the upside. Investors staying out of the mar-
ket, waiting for a better time to enter could miss out on
large gains.
HAC Update and OpportunitiesWhat the HAC is Going On?
There are a lot of sectors that start their seasonal periods
at the end of October. There are a small number of sec-
tors that on average start their seasonal runs in mid-Oc-
tober. It is important to realize that if the market sells off
strongly in the next few weeks, investors should expect
these preferred October sectors to also decline. This is
particularly true with a strong market sell-off. It is im-
7/27/2019 Thackray Market Letter 2013 October
http://slidepdf.com/reader/full/thackray-market-letter-2013-october 4/9alphaMountain Investments - alphamountain.com
— 4 —
portant to realize that these sectors have on average out-
performed the S&P 500 starting in the middle of October.
The key word is average. Overall, when the increases are
weighed against the decreases, the effects of the increases
are greater. Seasonal investors should treat these sectors
as preferred sectors for a volatile month that is often nega-
tive. Having preferred sectors for October, does not give a
seasonal green light to have a fully allocated equity port-
folio in mid-October. On a seasonal basis, the best time toenter the stock market on a broad scale is towards the end
of October.
Preferred October Sectors
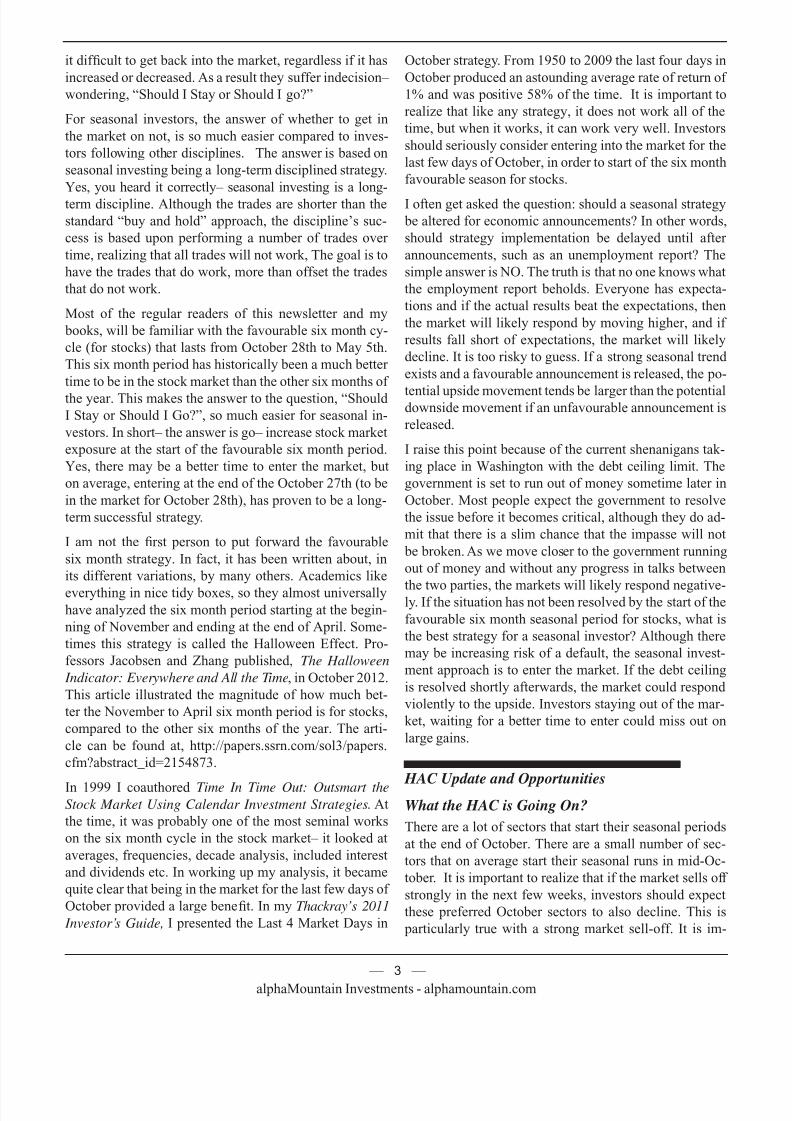
Technology
On average, the technology sector’s seasonal period starts
on October 9th and lasts until January 17th. During this
time period, from 1990 to 2013 the technology sector has
produced an average gain of 9.9% and has been positive
71% of time. The technology sector tends to outperformthe S&P 500 in October when the market is not suffering
major downdrafts and is either rising or falling slightly.
This sector is often a market leader and when it is out-
performing, it is positive for the market, which often fol-
lows. The one caveat is Apple, which has a large influence
on the technology sector as it is 15% of XLK. Currently
Apple is very news driven and could provide a counter
trend to other stocks in the sector.
Technically, the sector has been performing at market for
the last few months and is still in its trading channel. Per-
forming at market is typically a good setup for the start of
a seasonal trade.
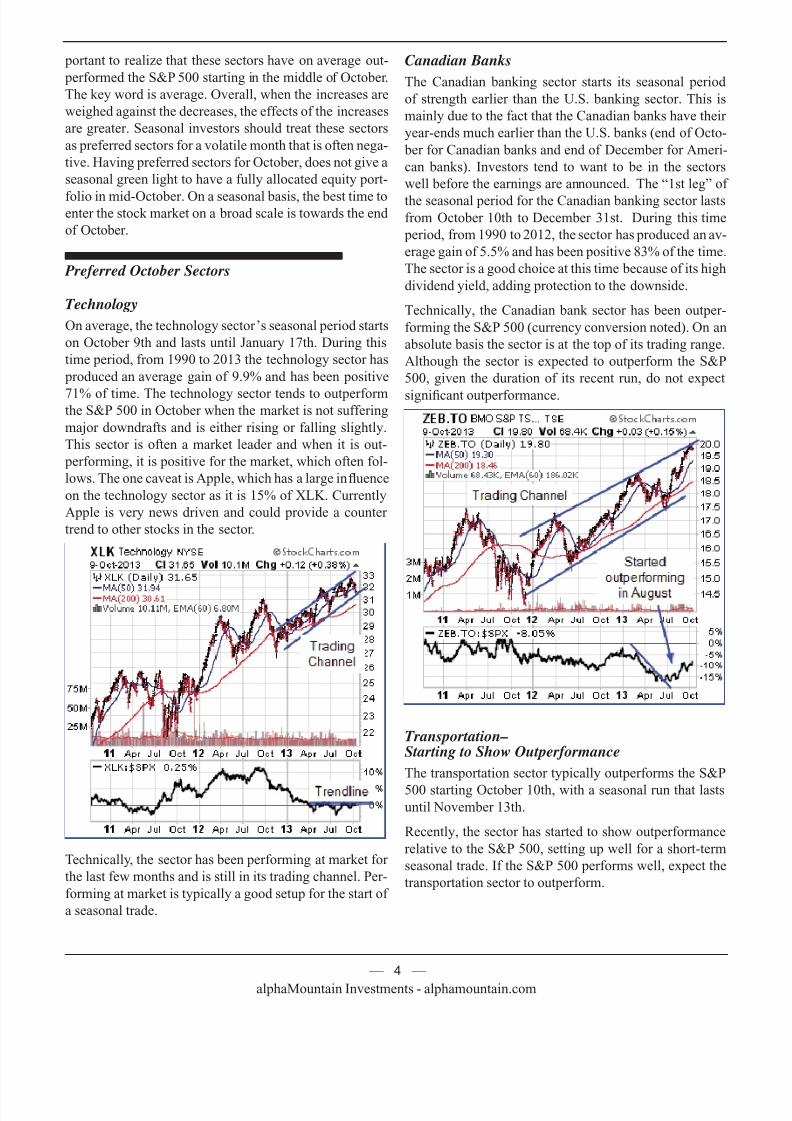
Canadian Banks
The Canadian banking sector starts its seasonal period
of strength earlier than the U.S. banking sector. This is
mainly due to the fact that the Canadian banks have their
year-ends much earlier than the U.S. banks (end of Octo-
ber for Canadian banks and end of December for Ameri-
can banks). Investors tend to want to be in the sectors
well before the earnings are announced. The “1st leg” of
the seasonal period for the Canadian banking sector lastsfrom October 10th to December 31st. During this time
period, from 1990 to 2012, the sector has produced an av-
erage gain of 5.5% and has been positive 83% of the time.
The sector is a good choice at this time because of its high
dividend yield, adding protection to the downside.
Technically, the Canadian bank sector has been outper-
forming the S&P 500 (currency conversion noted). On an
absolute basis the sector is at the top of its trading range.
Although the sector is expected to outperform the S&P
500, given the duration of its recent run, do not expect
significant outperformance.
Transportation–Starting to Show Outperformance
The transportation sector typically outperforms the S&P
500 starting October 10th, with a seasonal run that lastsuntil November 13th.
Recently, the sector has started to show outperformance
relative to the S&P 500, setting up well for a short-term
seasonal trade. If the S&P 500 performs well, expect the
transportation sector to outperform.
7/27/2019 Thackray Market Letter 2013 October
http://slidepdf.com/reader/full/thackray-market-letter-2013-october 5/9alphaMountain Investments - alphamountain.com
— 5 —
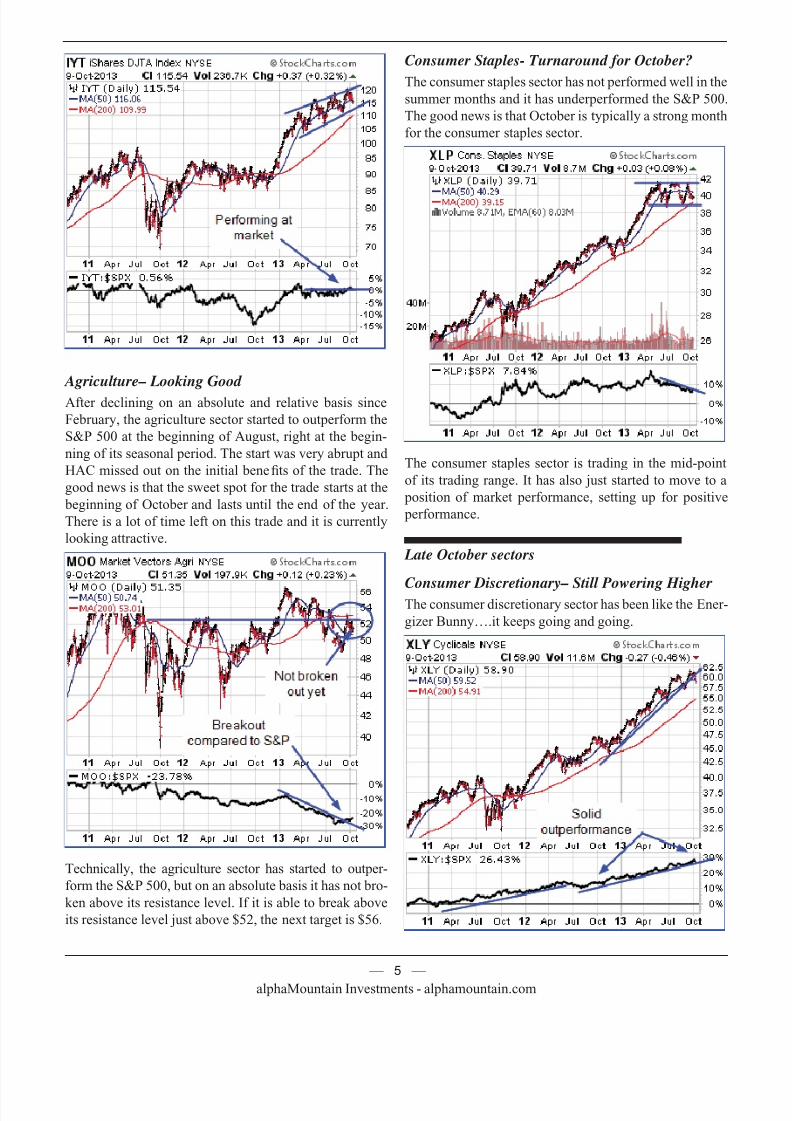
Agriculture– Looking Good
After declining on an absolute and relative basis since
February, the agriculture sector started to outperform the
S&P 500 at the beginning of August, right at the begin-
ning of its seasonal period. The start was very abrupt and
HAC missed out on the initial benefits of the trade. The
good news is that the sweet spot for the trade starts at the
beginning of October and lasts until the end of the year.
There is a lot of time left on this trade and it is currently
looking attractive.
Technically, the agriculture sector has started to outper-
form the S&P 500, but on an absolute basis it has not bro-
ken above its resistance level. If it is able to break above
its resistance level just above $52, the next target is $56.
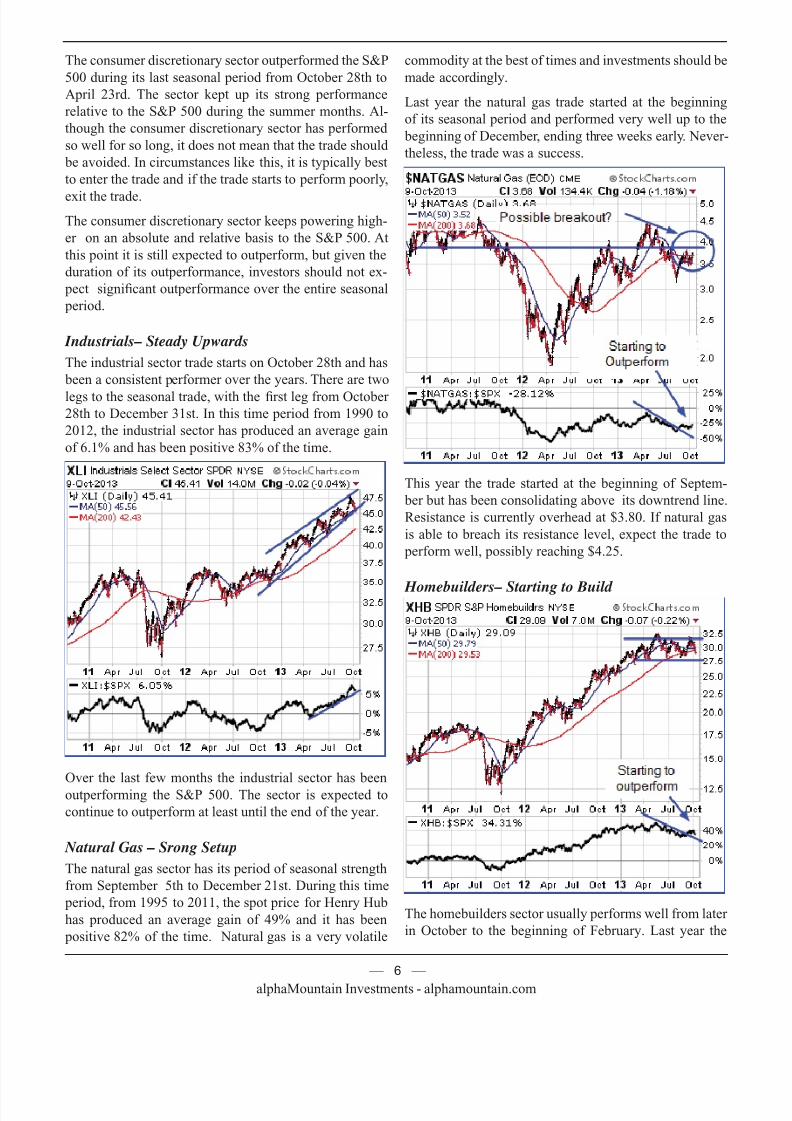
Consumer Staples- Turnaround for October?
The consumer staples sector has not performed well in the
summer months and it has underperformed the S&P 500.
The good news is that October is typically a strong month
for the consumer staples sector.
The consumer staples sector is trading in the mid-point
of its trading range. It has also just started to move to a
position of market performance, setting up for positive
performance.
Late October sectors
Consumer Discretionary– Still Powering HigherThe consumer discretionary sector has been like the Ener-
gizer Bunny….it keeps going and going.
7/27/2019 Thackray Market Letter 2013 October
http://slidepdf.com/reader/full/thackray-market-letter-2013-october 6/9alphaMountain Investments - alphamountain.com
— 6 —
The consumer discretionary sector outperformed the S&P
500 during its last seasonal period from October 28th to
April 23rd. The sector kept up its strong performance
relative to the S&P 500 during the summer months. Al-
though the consumer discretionary sector has performed
so well for so long, it does not mean that the trade should
be avoided. In circumstances like this, it is typically best
to enter the trade and if the trade starts to perform poorly,
exit the trade.
The consumer discretionary sector keeps powering high-
er on an absolute and relative basis to the S&P 500. At
this point it is still expected to outperform, but given the
duration of its outperformance, investors should not ex-
pect significant outperformance over the entire seasonal
period.
Industrials– Steady Upwards
The industrial sector trade starts on October 28th and has
been a consistent performer over the years. There are two
legs to the seasonal trade, with the first leg from October 28th to December 31st. In this time period from 1990 to
2012, the industrial sector has produced an average gain
of 6.1% and has been positive 83% of the time.
Over the last few months the industrial sector has been
outperforming the S&P 500. The sector is expected to
continue to outperform at least until the end of the year.
Natural Gas – Srong Setup
The natural gas sector has its period of seasonal strength
from September 5th to December 21st. During this time
period, from 1995 to 2011, the spot price for Henry Hub
has produced an average gain of 49% and it has been
positive 82% of the time. Natural gas is a very volatile
commodity at the best of times and investments should be
made accordingly.
Last year the natural gas trade started at the beginning
of its seasonal period and performed very well up to the
beginning of December, ending three weeks early. Never-
theless, the trade was a success.
This year the trade started at the beginning of Septem-
ber but has been consolidating above its downtrend line.
Resistance is currently overhead at $3.80. If natural gas
is able to breach its resistance level, expect the trade to
perform well, possibly reaching $4.25.
Homebuilders– Starting to Build
The homebuilders sector usually performs well from later
in October to the beginning of February. Last year the
7/27/2019 Thackray Market Letter 2013 October
http://slidepdf.com/reader/full/thackray-market-letter-2013-october 7/9alphaMountain Investments - alphamountain.com
— 7 —
trade worked very well. So far this year the sector has
pulled back from early May when bond yields started to
rise.
Currently the Homebuilders ETF (XHB) is consolidating
between $28 and $32. A break above $32 would be very
positive for this sector. Investors should be concerned
with the position, if during the seasonal period, the sector
was underperforming the S&P 500 and broke below $28.
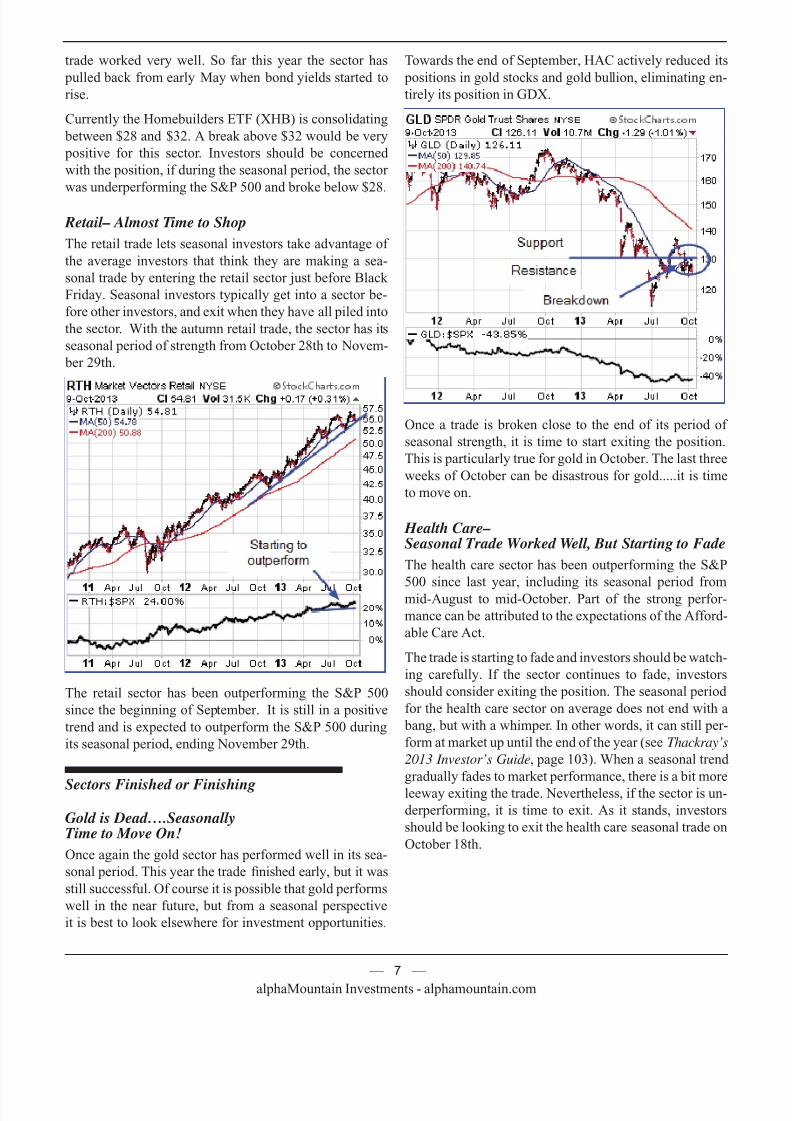
Retail– Almost Time to Shop
The retail trade lets seasonal investors take advantage of
the average investors that think they are making a sea-
sonal trade by entering the retail sector just before Black
Friday. Seasonal investors typically get into a sector be-
fore other investors, and exit when they have all piled into
the sector. With the autumn retail trade, the sector has its
seasonal period of strength from October 28th to Novem-
ber 29th.
The retail sector has been outperforming the S&P 500
since the beginning of September. It is still in a positive
trend and is expected to outperform the S&P 500 during
its seasonal period, ending November 29th.
Sectors Finished or Finishing
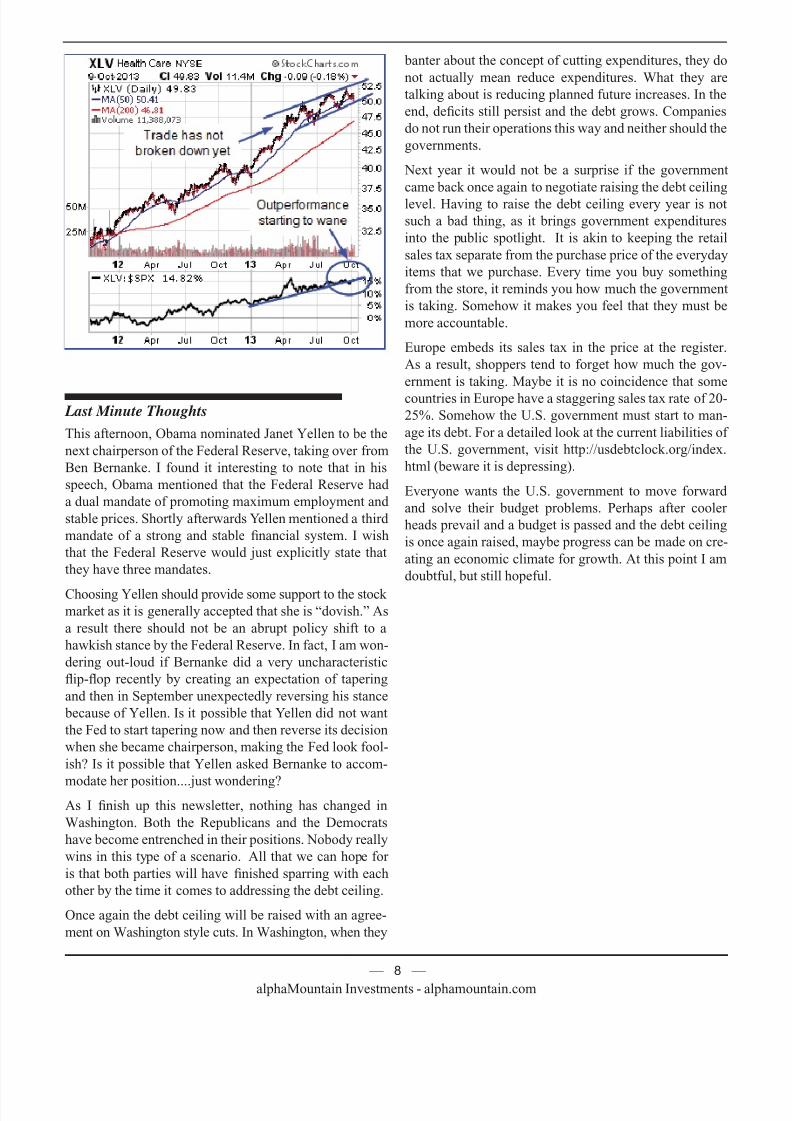
Gold is Dead….SeasonallyTime to Move On!
Once again the gold sector has performed well in its sea-
sonal period. This year the trade finished early, but it was
still successful. Of course it is possible that gold performs
well in the near future, but from a seasonal perspective
it is best to look elsewhere for investment opportunities.
Towards the end of September, HAC actively reduced its
positions in gold stocks and gold bullion, eliminating en-
tirely its position in GDX.
Once a trade is broken close to the end of its period of
seasonal strength, it is time to start exiting the position.
This is particularly true for gold in October. The last three
weeks of October can be disastrous for gold.....it is time
to move on.
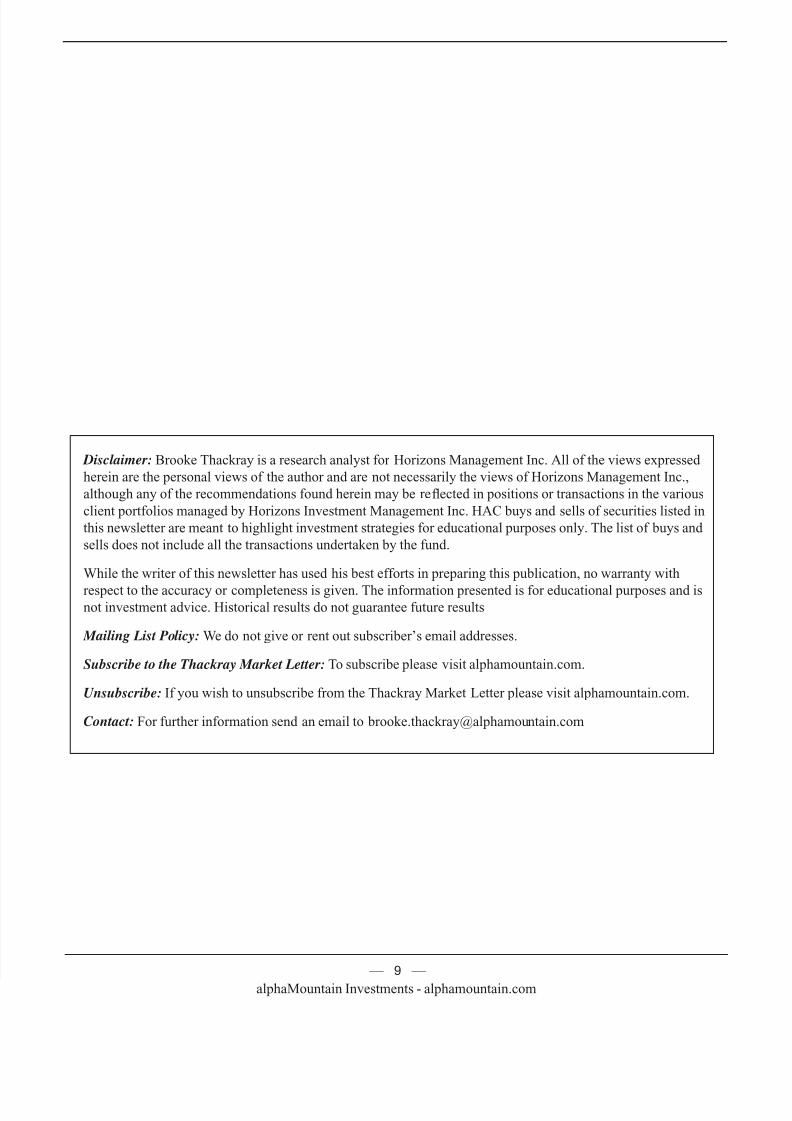
Health Care–Seasonal Trade Worked Well, But Starting to Fade
The health care sector has been outperforming the S&P
500 since last year, including its seasonal period from
mid-August to mid-October. Part of the strong perfor-
mance can be attributed to the expectations of the Afford-
able Care Act.
The trade is starting to fade and investors should be watch-
ing carefully. If the sector continues to fade, investors
should consider exiting the position. The seasonal period
for the health care sector on average does not end with a
bang, but with a whimper. In other words, it can still per-
form at market up until the end of the year (see Thackray’s
2013 Investor’s Guide, page 103). When a seasonal trend
gradually fades to market performance, there is a bit more
leeway exiting the trade. Nevertheless, if the sector is un-
derperforming, it is time to exit. As it stands, investors
should be looking to exit the health care seasonal trade on
October 18th.
7/27/2019 Thackray Market Letter 2013 October
http://slidepdf.com/reader/full/thackray-market-letter-2013-october 8/9alphaMountain Investments - alphamountain.com
— 8 —
Last Minute Thoughts
This afternoon, Obama nominated Janet Yellen to be the
next chairperson of the Federal Reserve, taking over from
Ben Bernanke. I found it interesting to note that in his
speech, Obama mentioned that the Federal Reserve had
a dual mandate of promoting maximum employment and
stable prices. Shortly afterwards Yellen mentioned a third
mandate of a strong and stable financial system. I wish
that the Federal Reserve would just explicitly state that
they have three mandates.
Choosing Yellen should provide some support to the stock market as it is generally accepted that she is “dovish.” As
a result there should not be an abrupt policy shift to a
hawkish stance by the Federal Reserve. In fact, I am won-
dering out-loud if Bernanke did a very uncharacteristic
flip-flop recently by creating an expectation of tapering
and then in September unexpectedly reversing his stance
because of Yellen. Is it possible that Yellen did not want
the Fed to start tapering now and then reverse its decision
when she became chairperson, making the Fed look fool-
ish? Is it possible that Yellen asked Bernanke to accom-
modate her position....just wondering?As I finish up this newsletter, nothing has changed in
Washington. Both the Republicans and the Democrats
have become entrenched in their positions. Nobody really
wins in this type of a scenario. All that we can hope for
is that both parties will have finished sparring with each
other by the time it comes to addressing the debt ceiling.
Once again the debt ceiling will be raised with an agree-
ment on Washington style cuts. In Washington, when they
banter about the concept of cutting expenditures, they do
not actually mean reduce expenditures. What they are
talking about is reducing planned future increases. In the
end, deficits still persist and the debt grows. Companies
do not run their operations this way and neither should the
governments.
Next year it would not be a surprise if the government
came back once again to negotiate raising the debt ceiling
level. Having to raise the debt ceiling every year is not
such a bad thing, as it brings government expenditures
into the public spotlight. It is akin to keeping the retail
sales tax separate from the purchase price of the everyday
items that we purchase. Every time you buy something
from the store, it reminds you how much the government
is taking. Somehow it makes you feel that they must be
more accountable.
Europe embeds its sales tax in the price at the register.
As a result, shoppers tend to forget how much the gov-
ernment is taking. Maybe it is no coincidence that some
countries in Europe have a staggering sales tax rate of 20-
25%. Somehow the U.S. government must start to man-
age its debt. For a detailed look at the current liabilities of
the U.S. government, visit http://usdebtclock.org/index.
html (beware it is depressing).
Everyone wants the U.S. government to move forward
and solve their budget problems. Perhaps after cooler
heads prevail and a budget is passed and the debt ceiling
is once again raised, maybe progress can be made on cre-
ating an economic climate for growth. At this point I am
doubtful, but still hopeful.
7/27/2019 Thackray Market Letter 2013 October
http://slidepdf.com/reader/full/thackray-market-letter-2013-october 9/9alphaMountain Investments - alphamountain.com
— 9 —
Disclaimer: Brooke Thackray is a research analyst for Horizons Management Inc. All of the views expressed
herein are the personal views of the author and are not necessarily the views of Horizons Management Inc.,
although any of the recommendations found herein may be reflected in positions or transactions in the various
client portfolios managed by Horizons Investment Management Inc. HAC buys and sells of securities listed in
this newsletter are meant to highlight investment strategies for educational purposes only. The list of buys and
sells does not include all the transactions undertaken by the fund.
While the writer of this newsletter has used his best efforts in preparing this publication, no warranty with
respect to the accuracy or completeness is given. The information presented is for educational purposes and isnot investment advice. Historical results do not guarantee future results
Mailing List Policy: We do not give or rent out subscriber’s email addresses.
Subscribe to the Thackray Market Letter: To subscribe please visit alphamountain.com.
Unsubscribe: If you wish to unsubscribe from the Thackray Market Letter please visit alphamountain.com.
Contact: For further information send an email to [email protected]