Embed Size (px)
Citation preview

1 Investor Relations Department
http ://www .thaiairways .com /about-thai /investor-relations /en/investor .html
THAI AIRWAYS INTERNATIONAL PCLUpdated on May 2012

2 Investor Relations Department
DISCLAIMER
The information contained herein is intended to represent the Company’s operating and financial position at a given point in time and may also contain forward looking information which only reflects expectations based on the prevailing geo-political, economic and non-controllable factors. Such information has been obtained from sources believed to be most reliable and the means in analyzing and preparation of such information for disclosure are based on approved practices and principles in the investment industry. The views are based on assumptions subject to various risks and uncertainties and no assurance is made as to whether such future events will occur, that projections will be achieved, or that the assumptions here-in are correct. Consequently no assurance is made as to the accuracy or completeness of information presented in this document.
This document should not be construed as an investm ent guide or as an offer or solicitation of an offer to buy or sell the Company ’s equity shares.

3 Investor Relations Department
Budget Airline
49%
THAI Airways International PLC.
Tour Eurng Luang
49% 49% 49%55%
Thailand
Business Overview
GroundServices
Business Units
Passenger and excess baggage ~ 80 %Freight and mail ~ 15 %
Other activities ~ 5 %
Total Revenue 54,505 MTHB (1Q/2012)

4 Investor Relations Department
Air Transportation
Core BusinessTechnical Department
Able to Maintain Over 90% of Aircraft Availability
• Staff: 4,390 persons
• Outsource: 347 persons
Business Overview
• Total Rev. 755 MTHB
(2011 Performance)

5 Investor Relations Department
THAI Ground Services
CateringCargo Handling
หนว่ยธุรกจิการบนิราคาประหยดั
Ground Service
THAI Smile
Ground Support Equipment
• Production ~66,000 Meal /day
• Total Rev. 6,030 MTHB
(External Rev. 30.7%)
• Staff 1,952 Persons
• Outsource 1,898 Persons
• Total Rev. 2,544 MTHB
(External Rev. 35.3% )
• Staff 1,679 Persons
• Outsource 1,158 Persons
Total Rev. 7,567 MTHB
(External Rev. 34.8% )
• Staff 4,328 Persons
• Outsource 3,437 Persons• Ticket Sale: 27 April 2012• Inauguration: 7 July 2012
Business Overview
Business Units (2011 Performance)

6 Investor Relations Department
Thailand’s National Flag Carrier
51% directly, 68% indirectly owned
by the Royal Thai Government
Market Capitalization:
1,475 MUSD(As of June 2012)
Major ShareholdersMajor Shareholders
Company Facts
MINISTRY OF FINANCE, 51.03%
VAYUPAK (MFC), 7.75%
VAYUPAK (KTAM), 7.75%THAI NVDR, 4.03%
GOVERNMENT SAVING FUND
2.13%
STATE STREET BANK AND TRUST COMPANY , 1.91%
THE BANK OF NEW YORK MELLON-CGT
TAXABLE, 1.15%
HSBC (SINGAPORE)
NOMINEES PTE LTD, 1.13%
STATE STREET BANK EUROPE
LIMITED, 0.81%
OTHERS, 22.31%
As of Mar 12

7 Investor Relations Department
Factors Affecting Aviation Business
Headwinds
ASEAN Open Sky and
Liberalization Policy
Competition fromLCCs / Traditional Airlines / New Full Network Carriers
Rapid Rise inFuel Price
Rate of EconomicGrowth
FX Fluctuation
EU Carbon Emissions Guideline
New Aircraft
Technology/Trend
Natural Disasters
Availability of New Aircraft Acquisition,
Aging Fleet & Seat
THAI is taking precautionary actions to mitigate all risk factors
Global Politics Health
Availability of Aircraft Financing

8 Investor Relations Department
Snap Shot
1Q’2012 MTHB USD mn.
Equivalent% Change YoY
Assets 281,397 9,077 +2.5%
Total Revenue 54,505 1,758 +5.1%
Net Profit (Include FX) 3,645 118 +489.3%
2012 MAY
# of Aircraft 88*
Destinations Served 69
Countries Served 35
*Excluding 4 B 737-400 & 2 ATR-72 leased to Nok Air2 B 747-400 Freighters
2012 MAY%
Change YoY
JAN.– MAY% Change
YoY
Passenger carried (Million) 1,587 +17.6% 8,435 +8.8%
Million Revenue Passenger Kilometers (MRPK)
4,477 +12.4% 25,040 +6.8%
Freight carried (tons) 56,336 -3.4% 281,958 -2.8%
Million Revenue Freight Ton Kilometers (MRFTK)
219 -9.1% 1,083 -8.7%

9 Investor Relations Department
Units 2012 2011%
ChangeYoY
2012 2011%
ChangeYoY
Passenger Production MASK 6,259 6,434 -2.7% 32,547 32,385 +0.5%
Passenger Traffic MRPK 4,477 3,982 +12.4% 25,040 23,442 +6.8%
Cabin Factor % 71.5 61.9 +15.6% 76.9 72.4 +6.3%
Passenger carried Million 1,587 1,350 +17.6% 8,345 7,751 +8.8%
Passenger Yield* THB/km 2.62 2.78 -5.8% 2.72 2.77 -1.8%
Freight Production MADTK 392 418 -6.0% 1,966 2,076 -5.3%
Freight Traffic MRFTK 219 241 -9.1% 1,083 1,187 -8.7%
Freight Factor % 55.9 57.8 -3.3% 55.1 57.2 -3.6%
Freight carried Tons 56,336 58,296 -3.4% 281,958 289,948 -2.8%
Freight Yield* THB/km 9.95 10.09 -1.4% 10.04 9.77 +2.8%
Avg. Fuel Price** USD/BBL 138.6 143.0 -3.1% (May) 138.6 (May) 143.0 -3.1%
Operation Summary
Note : * Yield includes fuel surcharge** Price into plane
JANUARY-MAYMAY

10 Investor Relations Department
RPK by Region
RPK Total Domestic Indo China Western Southern Northern North Paci fic Middle East Europe AustraliaAfrica & Others
% RPK Jan-Apr'12 100.00% 6.04% 1.03% 7.01% 3.94% 25.43% 2.04% 1.9 9% 38.64% 12.64% 1.23%
Jan -11 (3.10)% (15.70)% 0.70% (5.60)% 1.80% 1.80% 4.90% (28.47)% (5.20)% (3.10)% 423.08%
Feb-11 (3.00)% (16.10)% 8.30% 3.10% 2.10% 1.70% 4.30% (5.51)% (5.40)% (3.50)% 285.71%
Mar-11 (4.40) % (12.70)% 1.50% 4.70% 10.30% (2.70)% 3.70% (30.53)% (6.60)% (13.30)% 570.00%
Apr-11 7.50% 5.60% 18.70% 4.70% 24.00% (1.80)% (5.10)% 1.10% 10.20% 6.70% 611.11%
May-11 13.90% 18.20% 23.10% 8.90% 38.80% 22.80% 11.20% (5.49)% 1.30% 19.60% 950.00%
Jun-11 8.20% 24.90% 21.90% 2.00% 8.50% 23.60% 0.30% 32.86% (0.70)% 8.70% (22.64)%
Jul-11 7.60% 21.70% 15.50% 1.80% 1.20% 15.70% (8.70)% 11.46% 2.90% 11.90% (1.79)%
Aug-11 4.70% 21.05% 7.27% (5.50)% (3.95) % 11.27% (9.29)% (9.88)% (0.89)% 18.99% (3.64)%
Sep-11 0.40% 13.66% 4.35% 4.43% 4.15% 9.60% (14.41)% 40.00% (11.28)% 9.39% (12.33)%
Oct-11 (7.53)% 13.64% (20.37)% (10.72)% (11.81)% (4.39)% (16.42)% (4.05)% (13.32)% (0.16)% 3.13%
Nov-11 (16.86)% 6.15% (33.33)% (24.87)% (25.91)% (29.66)% (19.70)% (32.47)% (11.10)% (9.40)% 15.38%
Dec-11 (8.91)% 7.07% (22.41)% (7.83)% (3.98)% (8.57)% (14.67)% (9.68)% (9.29)% (11.08)% (35.64)%
% YoY of Year 2011 (0.74)% 3.98% 0.32% (2.64)% 2.44% 2.11% (5.67)% (8.87)% (4.36)% 2.32% 5.21%
% YoY of Jan-Apr 2012 5.67% 10.98% (2.30)% 2.05% (3.11)% 12.91% (22.41)% 13.57% 3.18% 8.84% 0.40%

11 Investor Relations Department
Total passengers in May 2011 = 1.35 mn.
# of PAX
By Class By Area
Total passengers in May 2012 = 1.59 mn.
May 2012
Regional54.4%
Australia5.3%
Europe10.1%North Pacific
0.8%
Africa & Others0.4%
Domestic29.0%
Royal First0.3%
Royal Silk8.2%
Premium Economy
0.1%
Economy88.4%
Non Revenue3.0%

12 Investor Relations Department
Revenue
Passenger revenue * = 11,680 MTHB
By Class By Area
* Schedule flight only
Regional54%
Australia9%
Europe24%
North Pacific2%
Africa1%
Domestic10%
Royal First2%
Royal Silk20%
Premium Economy1%
Economy77%
May 2012

13 Investor Relations Department
Competitors Have Increased Significantly
Low Cost Carriers
Newly established full service airlines
Traditional full service airlines

14 Investor Relations Department
Domestic Market Regional Market
Market Share of LCCs Up Dramatically
0
5
10
15
254625472548254925502551255225532554
0
5
10
15
20
25
Domestic Market Regional Market
36.2%
48.9%
14.9%
30.1%
20.1%
49.8%
-2.3%
29.9%
7.1%
Avg. Growth Rate (2003-2011)
3.0%
42.9%
6.0%
83.8%
16.2%
42.2%
55.7%
2.1%
Mn Passengers Market Share Market ShareMn Passengers
Avg. Growth Rate (2003-2011)
2003 2011 2003 2011
THAI Airways
LCCs
THAI Airways
Others
LCCs
Others

15 Investor Relations Department
Middle East HUBEtihadEmiratesQatar
New Strong Competitors from Middle East

16 Investor Relations Department
Pacific
Pacific
LCC Fleet Order
AirAsia 106 284
Cebu Pacific 33 55
Indigo 43 232
Jetstar 79 32
Lion Air 65 360
Silk Air 19 -
SpiceJet 34 44
Tiger Airways 17 -
Total 396 1,007
THAI surrounded by LCC
Note:
• Fleets shown only effected to THAI
• Leased aircraft not included
17 Investor Relations Department
Competitors’ Fleet Expansion Plan
Existing/Awaiting delivery 15/75 -/5 -/10 11/8 - -/6 -/4 -/6
Competitors’ Fleet and Expansion Plan
Existing
Awaiting delivery
0
50
100
150
200
250
300
350
400
Number
AIRBUS 380

18 Investor Relations Department
2009
2010
2011
2012
2013-2017 Ensure strength
and stability
Strengthen internal organization
Build strategic competitiveness
Seek growth opportunities
Build operational stability
Overarching Strategic Plan

19 Investor Relations Department
Core Values Corporate StrategiesEnvironment &
Competition Analysis
A 380-800
Customer-oriented
Competitive
Dynamic
Corporate Portfolio 1
Customer Value2
Commercial 4
Corporate Social Responsibility 5
IT 6
Strategic Cost Management 7
Human Capital and Organization Effectiveness
8
Financial 9
Route Network and Fleet3
Synthesizing Environmental Factors into Strategies

20 Investor Relations Department
THAI Smile to complement THAI’s product offering
Brand positioning matrix for THAI and affiliated co mpanies
Note: * NOK focuses on DMK only; ** Possibilities surrounding expanding fleet to include wide-body aircraft will be evaluated as opportunities arise
Product Offering
Stage lengthsmall* Regional Intercontinentalconnecting
Premium 2 class
Premium 3 class
Premium regional
(wide body)
Domestic
No frills
Premiumfull service
big
Strategy to close THAI’s business gap
Intercontinental
THAI LCC
Launch July 2012
2 Class2 Class

21 Investor Relations Department
LOW to MEDIUM
• Domestic focus with some added value and maintaining very low cost
Domestic value-for-moneycarrier
LOW to MEDIUM
• Low cost base achieved through aspects of LCC model, such as single aircraft type, new fleet, etc.
MEDIUM to HIGH
• Minor improvements could be made in cost efficiency
Cost base
Regional carrier
Premium network carrier
Brand positioningBrand
Product by Cost Base
THAI’s Portfolio

22 Investor Relations Department
Reliable
Enjoyable
Valuable
Trendy
Friendly
Worthy
Good Price
High Value
Affordable
Light
Premium
Positioning Differentiation Character ValueBRAND
THAI Smile’s first flight has commenced on July 7, 2012Ticket Sale: April 27, 2012
THAI Smile – A New Chapter
Light Premium
Fly SMART with

23 Investor Relations Department
THAI Smile Fleet Plan & Routes Network
Brand new narrow body aircraft# of aircraft
Fleet Plan(2012F-2018F)
4
6
8
11
11
11
11
2012
2013
2014
2015
2016
2017
2018
EFFECTIVE FREQUENCY Destination
JUL 2012 14 Flights/ week Bangkok- Macau V .V.
AUG 2012 14 Flights / week Bangkok -Chiang Mai V. V.
AUG 2012 7 Flights / week Bangkok- Phuket V.V.
AUG 2012 7 Flights / week Chiang Mai - Phuket V .V
AUG 2012 28 Flights / week Bangkok - Krabi V.V.
SEP 2012 14 Flights / week Bangkok - Suratthani V.V.
TPI Summer 2012*
THAI Smile base at BKK,operates in domestic and regional secondary
routes and synchronize with TG network.
* Effective : July 7 - October 27, 2012
Bangkok
Macau
Chiang Mai
Phuket
Suratthani
Krabi

24 Investor Relations Department
Nok Air base at DMK,operates only domestic point-to-point
Nok Air Routes Network
Chiangmai
Phuket
Mae Hong Son
Surat Thani
Mae Sot Nan
PhitsanulokLoei
Udon Thani
Nakon Phanom
Trang
Hat YaiNarathiwat
Nakon Si Thammarat
Sakon Nakhon
Ubon Ratchathani
Buri Ram
Roi Et
Bangkok DMK
TG’s Proportion of Shareholding increased from 39% to 49%

25 Investor Relations Department
Competition for THAI Smile
Full-service carriersRegional FSCLow-cost carriers

26 Investor Relations Department
Ongoing enhancement and improvement in products and services at all touch points and the use of KPIs to ensure consistent qua lity service
Building Customer Value
Call Center
Premium Lounges
Increase Selection of Entertainment
Food & Beverage Minimize Time for Baggage Claim
Royal Orchid PlusE-ServiceInternet check-in with home print boarding
pass

27 Investor Relations Department
Current Fleet: 88 Aircraft42% of O 15% of OL 43% of FLO=Owned OL=Operating lease FL=Financial lease
Excluding: 4 B 737-400 & 2 ATR-72 leased to Nok2 B 747-400 Freighters
(Note: Approximately)
Current Fleet
Note: N.A.. = Not available
First Business Premium Economy Economy Total
36R1 4 N.A. 46 N.A. 201 247
3452 5 N.A. 28 N.A. 232 260
A340-500 3452 4 N.A. 60 42 113 215 1 O, 3 FL
A340-600 3461 6 8 60 N.A. 199 267 6 FL
3302 12 N.A. 42 N.A. 263 305
3303 11 N.A. 36 N.A. 263 299
B737-400 7341 5 N.A. 12 N.A. 137 149 2 FL, 3 OL
7442 6 14 50 N.A. 325 389
7443 10 10 40 N.A. 325 375
B777-200 7723 8 N.A. 30 N.A. 279 309 6 O, 2 OL
B777-200ER 77E1 6 N.A. 30 N.A. 262 292 6 FL
7732 5 N.A. 34 N.A. 330 364
7732 TKE 1 N.A. 34 N.A. 325 359
B777-300ER 7739 5 8 30 N.A. 274 312 5 OL
Total 88 40 532 42 3,528 4,142 37 O, 38 FL, 13 OL
A300-600
A330-300
B747-400
Aircraft Type Version# of
AircraftFinancial Method
# of Seat
6 FLB777-300
9 O
10 O, 10 FL ,3 OL
11 O, 5 FL
As of APR12
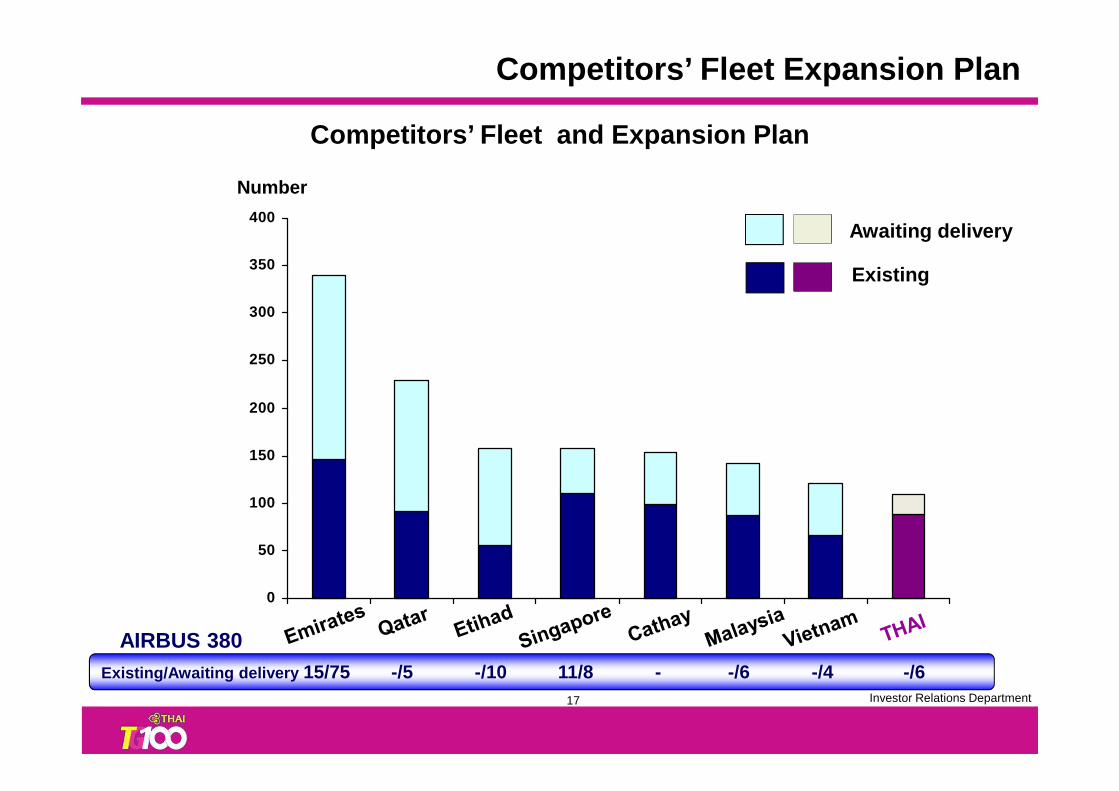
28 Investor Relations Department
Hours / Day / Aircraft
Aircraft Utilization
Aircraft Utilization
12.0
11.7 11.6
11.3 11.1
10.0
11.0
12.0
13.0
Jan Feb Mar Apr May Jun Jul Aug Sep Oct Nov Dec
2009 2010 2011 2012

29 Investor Relations Department
Aircraft Delivery Plan
Note : OL = Operating leas / FL = Financia l leaseI = Intercontinental / R = Regional
NEW A/C DELIVERY
2012 2013 2014 2015 2016 2017 TOTAL
A380-8003 (FL)
(SEP/NOV/DEC)
3 (FL)(JAN/SEP/OCT)
- - - - 6
B777-300ER2 (OL)
(AUG/OCT)
6 (OL)(MAR/APR/JUN/JUL/AUG/OCT)
3 (FL) 3 (FL) - - 14
A330-3003 (FL)
(FEB/SEP/OCT)
2 (FL)(JAN/APR)
- - - - 5
A350-900 - - - -2 (FL) I2 (OL) R
2 (FL) I6 (OL) R
12
B787-9 - - - - - 2 (OL) 2
B787-8 - - 4 (OL) 2 (OL) - - 6
A320 (Thai Smile)4 (OL)
(JUN/AUG(2)/SEP)
2 (OL)(JAN/MAR)
2 (FL) 3 (FL) - - 11
TOTAL 12 13 9 8 4 10 56

30 Investor Relations Department
Phase Out Plan
PHASE-OUT PLAN 2012 2013 2014 2015 2016 2017 TOTAL
B747-400 2 2 - - 2 2 8
B777-300ER (Jet Airways)
- 5 - - - - 5
A340-500 4 - - - - - 4
B777-200 - - - - - 4 4
A330-300 - - 2 4 - 2 8
A300-600 2 4 5 - - - 11
B737-400 3* 1*+2 2 1 - - 9
ATR-72 - 2* - - - - 2
TOTAL 11 16 9 5 2 8 51
Note : *Return from Nok Air

31 Investor Relations Department
2 of Freighters have launched on April and May 2012 between 3 conti nents
100 tons / flight
Asia
9 Cities
: Bangkok
: Taipei
: Tokyo
: Hyderabad
: Shennai
: Delhi
: Bangkok
: Taipei
: Tokyo
: Hyderabad
: Shennai
: Delhi
: Frankfurt
: Amsterdam
: Frankfurt
: Amsterdam
: Sydney: Sydney
Europe
Australia
B747-400 to be Converted to Freighter

32 Investor Relations Department
2011 2012 2013 2014 2015 2016 2017 TOTAL
# of Aircraft 89 93 97 102 105 107 109
Total Seats in operation 26,691 28,313 29,272 29,784 30,525 31,119 31,859
Seat Growth 5.8% 6.1% 3.4% 5.0% 2.5% 1.9% 2.4% 3.9%
Fleet Strategy Through 2017
AgeFleet Age
11.0
9.38.6
10.3
8.9 9.1 8.4
0.0
2.0
4.0
6.0
8.0
10.0
12.0
2011 2012 2013 2014 2015 2016 2017
*
*Note: Count at end of each yearExclude aircraft leased to NOK AIR

33 Investor Relations Department
0.266 0.265 0.263 0.261
0.246
0.2590.256
0.20
0.21
0.22
0.23
0.24
0.25
0.26
0.27
0.28
0.29
0.30
2011 2012 2013 2014 2015 2016 2017
Litre / ATK
% Change –0.2 -0.7 -1.0 -0.5 -1.3 -4.1
Fuel Consumption per ATK Improvement
1.35
1.3
1.23
1.2
1.15
1.11
1.21
1.00
1.05
1.10
1.15
1.20
1.25
1.30
1.35
1.40
2011 2012 2013 2014 2015 2016 2017
THB / ATK
% Change -3.9 -5.2 -2.7 0.9 -4.7 -3.5
Maintenance Cost per ATK Improvement
New aircraft will bring cost benefits in terms of f uel per ATK and maintenance cost per ATK
Fuel efficiency improve ~-1.3% per year from 2012 - 2017
Efficiency Derived from New Aircraft
Maintenance cost per ATK decrease –3.2% from 2012-2017
Save 5,823 MTHB Save 3,460 MTHB

34 Investor Relations Department
� FEB. – DEC. 2012
� One has been completed
B747-400No. 7-12 6
B747-400No. 13-18
6
First Business Economy# of Aircraft Tentative Completion
� All have been completed
� DEC. 2011 - OCT. 2012
Upgrades and Retrofit Schedule
8B777-200No. 1-8

35 Investor Relations Department
The New LookThe New Look
Synchronization with Touches of Thai and Green concept
• Cabin interior,
On-board products &
services master
design by
Priestmangoode

36 Investor Relations Department
New Aircraft A330 & A380
New Airbus A330-300
Royal Silk Class
Economy Class
New Airbus A380-800
Royal First class
Royal Silk Class
Economy Class

37 Investor Relations Department
A350
B787
New Generation Aircraft: A350 & B787
• 53 % Composite• Lower fuel burn (Compare to today generation)• Lower maintenance costs (Compare to today generation)
• 50 % Composite• Lower fuel burn (Compare to today generation)• Lower maintenance costs (Compare to today generation)
Family• B787-9• B787-8
Family
• A350-1000• A350-900• A350-800

38 Investor Relations Department
New In-Flight Entertainment Interactive
Entertainment- Movies: 100 titles- Short program: 150 programs- CD Album: 500 albums- Games: 60 games- USB plug and play
Entertainment- Movies: 100 titles- Short program: 150 programs- CD Album: 500 albums- Games: 60 games- USB plug and play
Onboard Services- E-Meal Menu - E-Duty Free Shopping
- E-Magazine - Seat Chat
Onboard Services- E-Meal Menu - E-Duty Free Shopping
- E-Magazine - Seat Chat
E-Duty Free Shopping
E-Meal Menu
Full Audio Video on Demand (AVOD) in all classes* (* Except A330-300, A300-600 and B737-400)
Connectivity
- Voice Call - SMS Text Messaging- GPRS Email - Internet Access’
Connectivity
- Voice Call - SMS Text Messaging- GPRS Email - Internet Access’
Infotainment
- About THAI
- Airport Information
- Window on Thailand
- Travel Destination Information
Infotainment
- About THAI
- Airport Information
- Window on Thailand
- Travel Destination Information
E-Duty Free Shopping

39 Investor Relations Department
Food and BeverageFood and Beverage
Chef gallery
๏ More varieties , more menus
๏ Introduce special occasion menus
๏ Online Pre-order meal for First and Business class

40 Investor Relations Department
ROP: Royal Orchid PlusROP: Royal Orchid Plus
� Global Tour Management System
� New Loyalty System
• ROP Consumer Mile & Ancillary Services
Market & Customer Analysis
� Better understand market outlook and customer profile in each market

41 Investor Relations Department
CSR : Corporate Social Responsibilities
Clear CSR’s Policy & Process
CSR Project
CSR Communication & Sustainability Report
integrate to all proce ss & all touch points
Social Contribution
Environment Engagement
Flood Donation
Society Support
Youth Sports program
Bio Jet FuelCarbon Footprint

42 Investor Relations Department
• Develop Bangkok and Thailand as main hub by implementing more direct flights into Thailand, focus on increasing frequency and hub connectivity
• Enhance network strength in key markets to maintain leading market positioning and build network strength around home base
• Expand network to secondary regional routes, operating narrow body aircraft with light premium service
• Establish THAI LCC to compete in price sensitive market
• Leverage of alliances and strategic partners to expand network and cover all market segments
• Increase flight schedule flexibility in response to demand dynamic, seasonality and competitive environment
• Develop HKT into a 2 nd key point of interest
• Improve fleet efficiency to lower maintenance and fuel expense, reduce environmental impact and increase asset utilization
• Secure long-term fleet delivery positions to ensure young & fuel efficient fleet and support growth
• Implement fleet simplification over the long-term to reduce operating cost and improve operating efficiency
• Match aircraft size with demand and competition
• Design proper seat configuration to maximize competitive advantage
Route Network Strategy Fleet Strategy
Route Network and Fleet

43 Investor Relations Department
Seoul
Bangkok
Phuket
Hong Kong
Taipei
Seoul
Bangkok
Phuket
Hong Kong
Taipei
Los Angeles
Sapporo
BangkokMacau
Route Development SummaryRoute Development Summary

44 Investor Relations Department
THAI’s Route Network
World Route Network
Route Total
( Based on TPI Summer 2012 ) International
Countries 35
Cities 59
Freq./Week 596
Seats/Week 359,556

45 Investor Relations Department
THAI’s Route Network
Domestic Route Network
Nok Air (Code Share)
THAI
CHIANG RAI
MAE HONG SON
UDON THANI
KHON KAEN
PHUKET KRABIHAT YAI
PHITSANULOK
CHIANG MAI
UBON RATCHATHANI
SAMUI
SURAT THANI
NAKHON PHANOM
BURIRAM
BANGKOK
Route Total
( Based on TPI Summer 2012 ) Domestic
Cities 10
Freq./Week 272
Seats/Week 133,710

46 Investor Relations Department
Intra-Asia Secondary Destination
Network Sales Ancillary Revenue
Explore ancillary revenue options i.e. travel insurance, car rental, hotel accommodation, consumer miles.
Explore revenue in other markets. Developing new routes that show strong potential in business and leisure traffic by exercising 5 th Freedom rights.
i.e. HKT-HKG-TPE, BKK-TPE-CTS
Widen coverage to secondary cities both regional and intercontinental routes using “Everywhere Non-Stop to Bangkok or Phuket” concept.
i.e. BKK-BRU-BKK, HKT-ICN-HKT,CPH-HKT
Boost Revenue and mitigate any downside effects in Bangkok and within Thailand.
Commercial StrategyCommercial Strategy

47 Investor Relations Department
IT Development
InfrastructureRedesign and Migrate to Cloud
E-Payment GatewayMobile Capability
Revenue Enhancement
Data Management
Internal Cooperation
CRM / Cross Function Database
Enterprise Resource Planning (ERP)
E-Collaboration / Knowledge management

48 Investor Relations Department
Statistic on e-Service
Check-in via Internet Ticket Sales Via Internet
7.33
8.27
8.20
11.02
8.09
8.69
7.797.32
8.77
7.78
7.26
7.77
8.58
7.638.03
8.89
11.44
5.8
5.164.8
5.314.98 5.00
5.34
5.975.69
6.01
6.76
8.76
3.553.34 3.28
3.813.25
3.634.15
4.514.26 4.15
4.68
6.03
2.00
4.00
6.00
8.00
10.00
12.00
Jan Feb Mar Apr May Jun Jul Aug Sep Oct Nov Dec
%
7.287.357.376.987.02
7.49
6.716.56.576.5
6.236.15
5.665.93
5.465.355.475.95
5.365.165.084.904.86
4.63
4.094.10
3.663.653.754.01
3.453.363.262.862.8
2.672.312.151.971.871.78
0.00
2.00
4.00
6.00
8.00
Jan Feb Mar Apr May Jun Jul Aug Sep Oct Nov Dec
%
Year 2010Year 2009 Year 2011 Year 2012 Year 2010Year 2009 Year 2011 Year 2012

49 Investor Relations Department
Check-in via Mobile (http://m.thaiairways.com )
# of PAX
Statistic on e-Service

50 Investor Relations Department
Risk Mitigation

51 Investor Relations Department
>20<30%
1m 2m 3m 4m 5m 6m 7m 8m 9m 10m 11m 12m 13m 14m 15m 16m 17m 18m >18 months
>80%
<=20%
>60<=80%
>30<=60% VP, Director and Department Level Decision
Board Authority
Board Authority
Fuel Price Risk Management Committee
(President, EVP Finance & Accounting, VP, Director and Department)
Hedging Volume
Contract Period
Minimum 20% fuel hedging requirement to mitigate ri sk of rapid fuel cost riseMinimum 20% fuel hedging requirement to mitigate ri sk of rapid fuel cost rise
Fuel Management

52 Investor Relations Department
Rising Fuel Cost
139 USD/BBL(May 12)
0
40
80
120
160
200
Price of Jet Fuel (USD/BBL)(Singapore Spot Price)
3% Lower YoY
Iran still a hot potato

53 Investor Relations Department
Proactive Fuel Hedging Benefit

54 Investor Relations Department
Monthly fuel hedging 2008-2011 - % of consumption by month
Fuel Management
Hedging combined with fuel surcharge greatly mitiga tes fuel price fluctuation risk0% 0% 0% 0%
3%17
%38
% 41%
44%
44% 49
%35
%27
%20
%23
%3% 3%7%
13%
13% 17
% 20% 27
% 30%
44%
44%
44% 47%
47%
47%
69%
69%
69%
69%
69%
69%
51%
51%
51%
50%
50% 56
%80
%80
%80
%80
%80
%80
%73
%76
% 79% 83%
83%
83% 92
%92
%92
%88
%88
%88
%22
%
22%
22%
15%
15%
15%
3% 3%3%
Jan-
08F
eb-0
8M
ar-0
8A
pr-0
8M
ay-0
8Ju
n-08
Jul-0
8A
ug-0
8S
ep-0
8O
ct-0
8N
ov-0
8D
ec-0
8Ja
n-09
Feb
-09
Mar
-09
Apr
-09
May
-09
Jun-
09Ju
l-09
Aug
-09
Sep
-09
Oct
-09
Nov
-09
Dec
-09
Jan-
10F
eb-1
0M
ar-1
0A
pr-1
0M
ay-1
0Ju
n-10
Jul-1
0A
ug-1
0S
ep-1
0O
ct-1
0N
ov-1
0D
ec-1
0Ja
n-11
Feb
-11
Mar
-11
Apr
-11
May
-11
Jun-
11Ju
l-11
Aug
-11
Sep
-11
Oct
-11
Nov
-11
Dec
-11
Jan-
12F
eb-1
2M
ar-1
2A
pr-1
2M
ay-1
2Ju
n-12
Jul-1
2A
ug-1
2S
ep-1
2O
ct-1
2N
ov-1
2D
ec-1
2Ja
n-13
Feb
-13
Mar
-13
Apr
-13
May
-13
Jun-
13Ju
l-13
Aug
-13
Sep
-13

55 Investor Relations Department
THAI is the first Asian airline with IATA to find means to offset fuel burn
Carbon FootprintCarbon Footprint
1st
airline
Emissions TradingEmissions Trading
Amount of Shortfall Carbon Credit ~200 MTHB
• CERs 60%
• EUAs 40%
•Determined the carbon footprint of 2 meals and provided labeling declaring carbon quantity for customers as their choice
2012 Monetary Value
Emissions Control
IATA Carbon Offset Program

56 Investor Relations Department
0.63130.64470.64470.65130.6685 0.6750
0.6107
0.23
0.28
0.33
0.38
0.43
0.48
0.53
0.58
0.63
0.68
0.73
2011 2012 2013 2014 2015 2016 2017
% Change 0.97 -3.51 –1.01 –0.01 –2.07 –3.26
CO2 (Kgs / ATK)
Carbon emission in Europe will be averagely reduced by -1.5 % (2012-2017)
CO2 emission improvement

57 Investor Relations Department
EC Rescinded all charges against THAI US Cargo DOJ Stopped further proceedings US Cargo Class Action Settled by paying USD 3.5 mn Korea Pending charges is for KW 2.85 mn
Pending Legal Issues
In 2008 Put in reserve 4,290
MTHB
In 2010 Wrote back 1,783
Outstanding in reserve 1,465
In 2011 Wrote back 1,042

58 Investor Relations Department
Financial Performance

59 Investor Relations Department
Performance Summary (Q1’2011 & Q1’2012) THAI and its subsidiary
(Units : MTHB) Q1'2011 Q1'2012
Total Revenue 51,851 54,505
Total Expense (51,097) (50,637)
Foreign currency exchange (Loss) (3,358) 527
Financial Cost (1,309) (1,481)
Profit before income tax expense 754 3,868
Net tax expense (income) (121) (200)
Net profits (loss) 618 3,645
Financial Performance

60 Investor Relations Department
EBIT, EBITDA and Net Profit (Q1’2011 & Q1’2012)
Units : MTHB
Financial Performance
Factors Impacting Q1’2012 Results
• Recovery in travel demand
• Relatively healthy contribution from BU’s & related businesses
• Slightly higher ASK but greater RPK growth
• Fuel cost 16% higher than last year
• Greater production capacity
• US & European economic slowdown
• Low ticket price from last year promotions
(Exclude FX& tax impact)
EBIT EBITDA NET PROFIT NET PROFIT

61 Investor Relations Department
Operating / Total Revenue (Q1’2011 & Q1’2012)
41,93544,957
6,7516,500
2042232,319
2,135
119120
706387
0
20,000
40,000
60,000
Q1'2011 Q1'2012
Passenger Freight Mail Other activities Interest income Other income
Revenue % Change % to Tot. Rev.Passenger 7.21 82.48
Freight 3.72- 11.93
Mail 8.91 0.41
Other activities 8.63 4.25
Interest income 0.22 0.22
Other income 0.71 0.71
Total Income 5.12 100.00
Operating Revenue Total Revenue
*Excludes Interest & Other income- Operating revenue Q1’2011 = 51,025 MTHB - Operating revenue Q1’2012 = 53,999 MTHB
Total revenue Q1’2011 = 51,851 MTHB Total revenue Q1’2012 = 54,505 MTHB
Units : MTHB
Financial Performance

62 Investor Relations Department
34313706
7,739 7,094
17,51020,326
5,0915,1112,352
2,220
1,4661,3472,494
2,9774,7955,147
1,185
1,436
0
15,000
30,000
45,000
60,000
Q1'2011 Q1'2012
Personnel Fuel and Oil Flight Service Expense
Inventory&Supply Crew Expense Aircraft Maintenance
Depreciation Lease of a/c Other
Total ExpenseOperating Expense
% Change % of
Expense YoY Tot. Exp.Personnel expense 8.33- 14.01
Fuel and oil 16.08 40.14
Flight service expense 0.40 10.09
Inventories and supplies 5.93 4.65
Crew expense 8.80 2.89
Maintenance/overhual 19.35 5.88
Depreciation/amortisation 7.33 10.16
Aircraft lease/spare parts 17.46- 2.34
Other expense 41.18- 9.84
Total Expense 0.90- 100.00
Operating / Total Expense (Q1’2011 & Q1’2012)
** Excludes FX, Impairment losses and Share of profit of investments by the equity method- Operating expense Q1’2011 = 46,065 MTHB - Operating expense Q1’2012 = 49,365 MTHB
Total expense Q1’2011 = 51,097 MTHBTotal expense Q1’2012 = 50,637 MTHB
Units : MTHB
Financial Performance

63 Investor Relations Department
Estimated Cost Reduction
Cost Reduction ApproachEstimated Cost Reduction
(MTHB)
1. Implemented personnel cost reduction (EMM resolution) 2,026.35
2. Estimated personnel cost reduction under negotia tion 189.96
3.... Estimated cost reduction from strategic initiatives 2,076.20
4. Estimated cost reduction from DO’s additional me asures 400.00
Total estimated cost reduction 4,692.51
Note: Excluded estimated cost reduction from some projects that are specified as percentage
The company is rigorously controlling and reducing expenses to achieve full efficiency and sustainability

64 Investor Relations Department
Raised 15,000 MTHB in new equity
Raised 15,000 MTHB in new equity
Received additional borrowing from financial
institutions
Received additional borrowing from financial
institutions
Obtained Revolving Credit Lines
Obtained Revolving Credit Lines
% of Cash to Total Revenue
3.88.72
20.916.8 16.7
0
10
20
30
2009 20102008
Net Interest Bearing Debt to Equity (Times)
Improved Cash Position
Stable Capital Structure
Improved Capital Structure
8,000 MTHB Debentureissued in May 13, 20118,000 MTHB Debentureissued in May 13, 2011
2011
3.212.93
1.92 2.24 1.86
0
1
2
3
4
5
2009 20102008 2011 1Q12
1Q12

65 Investor Relations Department
Ratios – Q1’2011 & Q1/2012
Ratios units Q1’2011 Q1’2012Earnings Per Share (THB) 0.28 1.67
Book Value per Share (THB) 28.94 30.64
Price / Book Value (Times) 1.3 0.84
P/E Ratio (Times) 133.2 16.0
Return on Total Assets (%) 0.2 1.3
Return on Total Equity (%) 0.8 5.6
EBIT (MTHB) 4,960 4,633
EBITDA (MTHB) 9,755 9,780
EBITDAR (MTHB) 11,191 10,966
IBD to Equity (Times) 1.9 2.1
Net IBD to Equity * (Times) 1.88 1.86
Debt Service Coverage** (Times) 1.5 1.8
Interest Coverage (Times) 7.5 6.6
EBITDA Margin (%) 19.1 18.1
Operating Profit Margin (%) 9.7 8.6
Net Profit Margin (%) 1.2 6.7
Cash to Total Revenue (%) - 16.7
Financial Performance
* (Interest Bearing Debt – Cash and Cash Equivalent) / Equity** EBITDAR – TAX / Interest + Rent + Long Term Debt Repayment - Refinance

66 Investor Relations Department
Current Price 21.10 THB / Share
-
10.00
20.00
30.00
40.00
50.00
60.00
Price Volatility from External Events
Peaked at 57.75 THB
Unrest in Middle East Earthquake and Tsunamiin Japan
Flood Crisis in Thailand
A+ Rating
Thai Political Unrest
Iceland Volcano Eruption
138.69 USD/BBL
(Apr. 11)
European Economic Crisis

67 Investor Relations Department
THAI continued to do well in the first quarter
Taking aggressive actions to enhance competitivenes s
Right sizing aircraft with demand to lower operatin g cost with lower unit cost
5% capacity shift from long-haul to shorter sectors improving yields & margins
Thai Smile’s debut flight in July 2012, to enhance competitiveness
New aircraft & retrofitting to commonise product to increase fuel efficiency, improve customer value & enhance pricing power
Selecting secondary city pairs to serve from Bangko k to diversify market & improve yield
Developing Phuket as second point of interest to di versify market & improve yield
Key Take Aways

68 Investor Relations Department
Converted 2 B747-400 aircraft to lower cost of carg o operations instead of leasing freighter aircraft
Launching SAP ERP financial modules to improve fina ncial reporting process and enhance information availability for de cision making
Business units are increasingly being measured more independently on their stand alone performance
Wingspan enhancing THAI’s HR cost competitiveness t hrough outsourcing staff requirement
Key Take Aways
Diversifying & improving on e-channels to improve e fficiency & better suit customer needs

69 Investor Relations Department
Mitigating risks
Significantly higher amount of fuel hedging through 2012
Pro-active management of liquidity & FX exposure
Maintaining at least 15% cash & committed credit li nes to total revenue ratio during global uncertainty
Capacity adjustment made regularly to meet demand
Studying alternative funding options to ensure flex ibility
Studying means to manage FX exposure more effective ly
Developing long-term fleet plan to ensure availabil ity of aircraft for fleet renewal & growth
Key Take Aways
THAI received a national award in 2012 on safety, h ygiene and working environment condition

70 Investor Relations Department
74.8 73.0 73.670.4
77.3 79.0 78.4 78.371.5 74.4
65.4
74.9
50.0
60.0
70.0
80.0
90.0
2008 2009 2010 2011 Jan-12 Feb-12 Mar-12 Apr-12 May-12 Jun-1 2 Jul-12 2012 B*
Booking BudgetActual
55.252.1
61.5
54.0
49.7
54.754.4
56.4 55.8 54.8
59.3
45.0
50.0
55.0
60.0
65.0
70.0
2008 2009 2010 2011 Jan-12 Feb-12 Mar-12 Apr-12 May-12 Jun-1 2 2012 B*
* B = Budget
Budget
Estimated
Actual Estimated
Looking Ahead
Freight Factor
Cabin Factor

71 Investor Relations Department
Looking Ahead into 2012
Stronger travel demand for 3 months with cabin fact or averaging 78.3%, 72.0% and 73.7% for April, May and June 2012.
Higher level and longer period of hedging provides greater protection against fuel price fluctuation
Financial performance in 1 st quarter 2012 improved significantly over 4th quarter 2011
May face greater operating uncertainty with respect to global economic growth, domestic politics, fluctuation in fuel cost and foreign currency exchange
Looking Ahead
72 Investor Relations Department
Appendix

73 Investor Relations Department
Foreign Currency Exposure (As of Mar 2012)
Surplusor Deficit
Amount % Amount % Amount Amount % Amount %
USD BASED 19,201 37 29,135 66 9,934- 1,240 1 1,240 1
USD 4,951 27,328
Others(1) 14,250 1,807
EUR BASED 15,883 30 3,369 8 12,514 47,460 33 47,460 33
EUR 4,658 1,715 Others(2) 11,225 1,654
JPY 5,202 10 1,259 3 3,943 9,499 7 14,310 10
THB 11,918 23 8,541 23 3,377 86,993 60 81,852 56
TOTAL 52,204 100.00 42,304 100.00 9,900 145,192 100 144,862 100
Outstanding BorrowingsAfter Swap
Revenue ExpenseBefore Swap
Unit : MTHB
Revenue Expense Outstanding
USD BASED EUR BASED JPY THB
Financial Performance

74 Investor Relations Department
-7,448
-9,934
12,282 12,514
3,5333,943
1,552
3,377
-15,000
-10,000
-5,000
0
5,000
10,000
15,000
2010 2011
USD EUR JPY THB
TG continued to be net long Euro & Yen(MTHB)
Jan – Mar 2011
Financial Performance
Jan – Mar 2012

75 Investor Relations Department
Proportion of Fixed and Float
Percentage of TOTAL (TOTAL = 142,015 MTHB)
Percentage of TOTAL (TOTAL = 142,059 MTHB)
Before Swap After Swap
Financial Performance
Cost of funding = 3.61% Cost of funding = 3.77%
(As of MAY 2012)

76 Investor Relations Department
Proportion of Total Borrowing
Percentage of Total(Total of on Balance Sheet = 142,015 MTHB)
Percentage of Total(Total of on Balance Sheet = 142,059 MTHB)
Before Swap After Swap
(As of MAY 2012)
Financial Performance

77 Investor Relations Department
Achieved Top 5 in the World and Targeting Top 3 in Asia
Business Traveler’s Award 2011
2nd for Best Airline
2nd for Best Asia-Pacific Airline
3rd for Best Business Class
3rd for Best Economy Class
2nd for Best Frequent-Flyer Programme
3rd for Best Airline Lounge in Asia-Pacific
Norwegian Grand Travel Award 2011
Best Intercontinental Airline
TTG Award 2011
Best Business Class
Best Southeast Asian carrier
Awards and Accolades
The World’s Top Ten Airlines – Skytrax
2010 2009
Go Asia Award
Best Asian carrier
Skytrax 2011
Best Airline Seat - Economy ClassBest On Board Catering – Economy Class
2011
1111
2222
3333
4444
6666
7777
8888
9999
10101010
3333
2222
1111
4444
6666
5555
7777
8888
4444
2222
3333
1111
7777
8888
6666
5555
5555 9999 10101010

78 Investor Relations Department
TG ForecastActual
27.3M
21.7M
5.5M
10.8M
4.2%
3.7%
6.1%
4.3%
ThailandPassengers
(Millions)
50.9M
40.3M
17.8M
10.5M
3.9%5.3%
5.4%
5.4%
Thailand Passengers Forecast
IATA International Passenger Forecast 2010 2011 2012 2013 2014 CAGR2011-2014(As September 2010) World 7.9% 4.9% 5.4% 5.4% 5.4% 5.3%
Asia Pacific 11.6% 7.2% 6.9% 6.5% 6.1% 6.7%
Estimate
36.8M
29.0M
13.9M
7.7M
62.8M
49.8M
21.0M
13.0M
3.3%4.3%
4.3%
4.3%
20.7M
16.1M
4.7M7.5M
Inter. 5.6%
Reg. 6.2%
Intercont. 3.5%Dom. 7.5%
33.5M
26.0M
13.3M
7.5M
0
10
20
30
40
50
60
70
99/00 00/01 01/02 02/03 03/04 04/05 05/06 06/07 2008 2009 2010 F
2011
F
2012
F
2013
F
2014
F
2015
F
2016
F
2017
F
2018
F
2019
F
2020
F
2021
F
2022
Passenger from / to Thailand Forecast 2011-2022
Industry Outlook

79 Investor Relations Department
Passengers Carried
5,167
3,6624,414
4,833 4,9234,201
4,771 4,5025,161
1,000
3,000
5,000
7,000
Q1'10 Q2'10 Q3'10 Q4'10 Q1'11 Q2'11 Q3'11 Q4'11 Q1'12
(’000)
Freight Carried
166,155179,329 180,341 188,109
172,749 174,570 168,199 170,625175,708
100,000
130,000
160,000
190,000
Q1'10 Q2'10 Q3'10 Q4'10 Q1'11 Q2'11 Q3'11 Q4'11 Q1'12
(Tons)
Year 2010
Operating Statistics
Year 2011
Q1/12 = 5.2 million (Increased 4.8% YoY)
Q1/12 = 170,625 tons (Decreased 1.2% YoY)
Year 2012
Year 2010 Year 2011 Year 2012

80 Investor Relations Department
C/FRPKASK
Passenger 82
.0
82.3
78.8
72.1
56.7
65.3
76.3
74.6
73.1
74.3
71.8
75.3
77.8
77.6
73.0
71.8
61.9
65.7
77.2
74.8
69.9
65.7
61.0
68.1
77.3
79.0
78.4
78.3
71.5
-
20.0
40.0
60.0
80.0
100.0
-
2,000
4,000
6,000
8,000
Jan-
10
Fe
b-1
0
Ma
r-1
0
Apr
-10
Ma
y-10
Jun-
10
Jul-1
0
Aug
-10
Sep
-10
Oct
-10
Nov
-10
De
c-10
Jan-
11
Fe
b-1
1
Ma
r-1
1
Apr
-11
Ma
y-11
Jun-
11
Jul-1
1
Aug
-11
Sep
-11
Oct
-11
Nov
-11
De
c-11
Jan-
12
Fe
b-1
2
Ma
r-1
2
Apr
-12
Ma
y-12
(%)Year 2010 Year 2011
(Million)
MAY'12 MAY'11 YoY% Q1'12 Q1'11 YoY% JAN-MAY'12 JAN-MAY '11 YoY%
MASK 6,259 6,434 2.7- 19,953 19,571 2.0 32,547 32,385 0.5
MRPK 4,477 3,982 12.4 15,605 14,881 4.9 25,040 23,442 6.8
Cabin factor% 71.5 61.9 15.6 78.2 76.0 2.9 76.9 72.4 6.3
YoY (Month) YoY (Year to date) YoY (Quarter)
Operating Statistics
Year 2012

81 Investor Relations Department
54.4
60.5
63.9
62.4
66.9
65.0
61.3
60.4
62.2
62.5
60.8
57.9
53.7
56.6
60.1
58.0
57.8
57.7
55.1
54.2
56.1
56.3
55.2
54
.3
49.7
54.7
59.8
56.4
55.9
-
20.0
40.0
60.0
80.0
-
200
400
600
Jan-
10
Feb-
10
Mar
-10
Apr
-10
May
-10
Jun-
10
Jul-1
0
Aug
-10
Sep
-10
Oct
-10
Nov
-10
Dec
-10
Jan-
11
Feb-
11
Mar
-11
Apr
-11
May
-11
Jun-
11
Jul-1
1
Aug
-11
Sep
-11
Oct
-11
Nov
-11
Dec
-11
Jan-
12
Feb-
12
Mar
-12
Apr
-12
May
-12
(Million)(%)
Freight
F/FRFTKADTK
Operating Statistics
Year 2010 Year 2011
YoY (Month)MAY'12 MAY'11 YoY% Q1'12 Q1'11 YoY% JAN-MAY'12 JAN- MAY'11 YoY%
MADTK 392 418 6.2- 1,196 1,233 3.0- 1,966 2,076 5.3-
MRFTK 219 241 9.1- 651 698 6.7- 1,083 1,187 8.7-
Freight factor% 55.9 57.8 3.3- 54.4 56.6 3.8- 55.1 57.2 3.6-
YoY (Quarter) YoY (Year to date)
Year 2012

82 Investor Relations Department
2.22
2.05
2.08
2.13
1.90
1.81
1.92
2.05
1.85
2.02
2.14
2.35
2.26
2.16
2.07
2.23
2.03
1.99
2.01
2.11
1.97
2.12
2.16
2.29
2.42
2.42
2.36
2.41
2.35
2.21
2.19
2.29
2.22
2.32
2.34
2.31
2.38
2.21
2.14 2.18
2.12
1.00
2.00
3.00
Jan Feb Mar Apr May Jun Jul Aug Sep Oct Nov Dec
Year 2009 Year 2010 Year 2011 Year 2012
(THB/Km)
Passenger Yield (Excluding Fuel Surcharge)
Passenger Yield (Including Fuel Surcharge)2.
72
2.49
2.54
2.56
2.32
2.21
2.30
2.44
2.27
2.51
2.64
2.84
2.73
2.63
2.54
2.68
2.44
2.42
2.45
2.55
2.40
2.56
2.60
2.72
2.87
2.82
2.70
2.82
2.78
2.64
2.63
2.75
2.70
2.81
2.81
2.82
2.87
2.73
2.67
2.69
2.62
2.00
2.50
3.00
Jan Feb Mar Apr May Jun Jul Aug Sep Oct Nov Dec
Year 2009 Year 2010 Year 2011 Year 2012
(THB/Km)
Operating Statistics

83 Investor Relations Department
Freight Yield (Excluding Fuel Surcharge)
7.72
7.01
6.62
7.13
7.47
6.67
6.98
6.69
7.01
7.08
7.48
7.53
7.33
6.91
6.96
7.44
7.51
7.18
7.30
6.89
7.37
7.12
7.42
7.01
7.08
6.94
7.02
6.77
6.86
6.75
6.84
6.75
6.96
6.85
6.94
7.02
7.02
6.71 6.84 6.99
6.70
6.00
7.00
8.00
Jan Feb Mar Apr May Jun Jul Aug Sep Oct Nov Dec
Year 2009 Year 2010 Year 2011 Year 2012
(THB/Km)
Freight Yield (Including Fuel Surcharge)9.
74
8.71
8.02
8.50
9.17
8.19
8.90
8.61
8.88
9.04
9.35
9.43
9.66
9.08
9.10
9.30
9.89
9.65
9.53
9.30
9.84
9.37
9.65
9.44
9.70
9.45
9.85
9.65
9.82
10.0
0
9.80
9.87
9.95
9.95
7.00
8.00
9.00
10.00
Jan Feb Mar Apr May Jun Jul Aug Sep Oct Nov Dec
Year 2009 Year 2010 Year 2011 Year 2012
(THB/Km)
Operating Statistics
10.1
1
10.1
5
10.1
7