Embed Size (px)
Citation preview

Thai Beverage PLC9M18 Financial Results(Nine-month ended 30 June 2018)
1Thai Beverage PLC9M18 (Nine-month ended 30 June 2018)

9M18 (Nine-month ended 30 June 2018) Thai Beverage PLC 2
Note on Forward Looking Statements• The following presentation may contain forward looking statements by the management of Thai Beverage Public
Company Limited (“ThaiBev"), relating to financial or other trends for future periods, compared to the resultsfor previous periods.
• Some of the statements contained in this presentation that are not historical facts are statements of futureexpectations with respect to the financial conditions, results of operations and businesses, and related plans andobjectives.
• Forward looking information is based on management's current views and assumptions including, but not limitedto, prevailing economic and market conditions. These statements involve known and unknown risks anduncertainties that could cause actual results, performance or events to differ materially from those in thestatements as originally made. Such statements are not, and should not be construed as a representation as tofuture performance of ThaiBev. In particular, such targets should not be regarded as a forecast or projection offuture performance of ThaiBev. It should be noted that the actual performance of ThaiBev may vary significantlyfrom such targets.

9M18 (Nine-month ended 30 June 2018) Thai Beverage PLC 3
Understanding this PresentationAcquisitions
• In the second quarter ended 31 March 2018, the Company completed an acquisition of
• 75% shareholding interest in Havi Logistic Co.,Ltd. (Havi), which operates logistic businesses for food services in Thailand, byThai Beverage Logistics Co.,Ltd., a wholly owned subsidiary of the Company on 28 February 2018.
• The Company has included the assets and liabilities of Havi in the consolidated statements of financial position and the resultsof operations and cash flows in the consolidated statement of income and cash flows respectively from March 2018 onwards.
• Havi’s operations were recognized under the food business segment.
• In the first quarter ended 31 December 2017, the Company completed 4 acquisitions of
1. 76% shareholding interest in Spice of Asia Co.,Ltd. (SOA) on 3 October 2017 to operate 10 stores of restaurants serving hotpotand Thai food
2. 75% shareholding interest in Myanmar Supply Chain and Marketing Services Co.,Ltd. and Myanmar Distillery Co.,Ltd. (MSC &MDC), which incorporated in the Republic of the Union of Myanmar, on 12 October 2017 to operate spirits business inMyanmar
3. 252 existing KFC stores in Thailand by The QSR of Asia Co.,Ltd. (QSA), a wholly-owned subsidiary of the Company on1 December 2017
4. a 53.59% shareholding interest in Saigon Beer – Alcohol – Beverage Joint Stock Corporation (Sabeco), a company incorporatedin The Socialist Republic of Vietnam and currently listed in Ho Chi Minh Stock Exchange (HOSE), on 29 December 2017 tooperate mainly in beer business.

9M18 (Nine-month ended 30 June 2018) Thai Beverage PLC 4
Understanding this PresentationAcquisitions
• The Company has included the assets and liabilities of SOA, MSC & MDC and QSA in the consolidated statements of financialposition as at 31 December 2017. The results of operations and cash flows for the period of October to December 2017 of SOA,MSC & MDC and QSA were included in the consolidated statements of income and cash flows respectively.
• Due to the acquisition of Sabeco was incurred close to the end of December 2017, only assets and liabilities were included in theconsolidated statements of financial position of the first quarter, but results of operations and cash flows were included in theconsolidated statements of income and cash flows of the second quarter ended 31 March 2018 onwards.
• SOA and QSA’s operations were recognized under food business. MSC & MDC’s operations were recognized under spirits business.Sabeco’s operations were recognized under beer business.
• The Company obtained bridging loans from various local and foreign banks to fund the acquisition in the first quarter ended 31December 2017. The Company has managed to take out short term debts to long term debts in March 2018 about Baht 50,000million which lowered short term debts and turned current ratio from under 1.0 in the first quarter to be over 1.0 since the secondquarter.

9M18 (Nine-month ended 30 June 2018) Thai Beverage PLC 5
Understanding this PresentationExcise tax
• Effective from 26 January 2018, all alcoholic beverages and tobacco products, both imported and domesticallyproduced, have been charged an additional 2% of excise tax by law to contribute to the Elderly Fund.
• The new Excise Tax Act is effective from 16 September 2017. The key change to alcoholic beverages is the tax collection method based on a suggested retail price instead of the last wholesale price. However, the excise tax calculation is still based on both ad valorem rates (a percentage of suggested retail price) and specific rates (Baht per litre of pure alcohol content). The excise tax rate is also changed per below:Beer- Prior: 155 Baht per litre of pure alcohol content and 48% of the last wholesale price exclude VAT.- New: 430 Baht per litre of pure alcohol content and 22% of the suggested retail price exclude VAT.White spirits- Prior: 145 Baht per litre of pure alcohol content and 4% of the last wholesale price exclude VAT.- New: 155 Baht per litre of pure alcohol content and 2% of the suggested retail price exclude VAT.Other distilled liquor- Prior: 250 Baht per litre of pure alcohol content and 25% of the last wholesale price exclude VAT.- New: 255 Baht per litre of pure alcohol content and 20% of the suggested retail price exclude VAT.
• For non-alcoholic beverages - artificial mineral water, soda water, carbonated soft drinks, fruit and vegetable juice which have no alcohol or have alcohol content not exceed 0.5% and are in airtight packaging, the key change is the tax collection method based on a suggested retail price instead of the ex-factory price and the excise sugar tax which is implemented for the first time ever. The excise tax is based on both ad valorem rates (a percentage of suggested retail price) and specific rates (Baht per gram of sugar content). The beverage with over 6 grams of sugar per 100 ml. will be subject to the new specific sugar tax which the rate will be increased every two years onwards until 1 October 2023 onwards.

9M18 (Nine-month ended 30 June 2018) Thai Beverage PLC 6
Understanding this Presentation• Current operations by business segments consist of spirits, beer, non-alcoholic beverages and food
• All monetary amounts in millions of Thai Baht unless otherwise stated
• Volumes in millions of liters unless otherwise stated
• EBITDA = Earnings from total revenues before interest expense, income tax, depreciation, and amortization

Thai Beverage PLC 79M18 (Nine-month ended 30 June 2018)
Highlights
9M18 (Nine-month ended 30 June 2018) Thai Beverage PLC 8
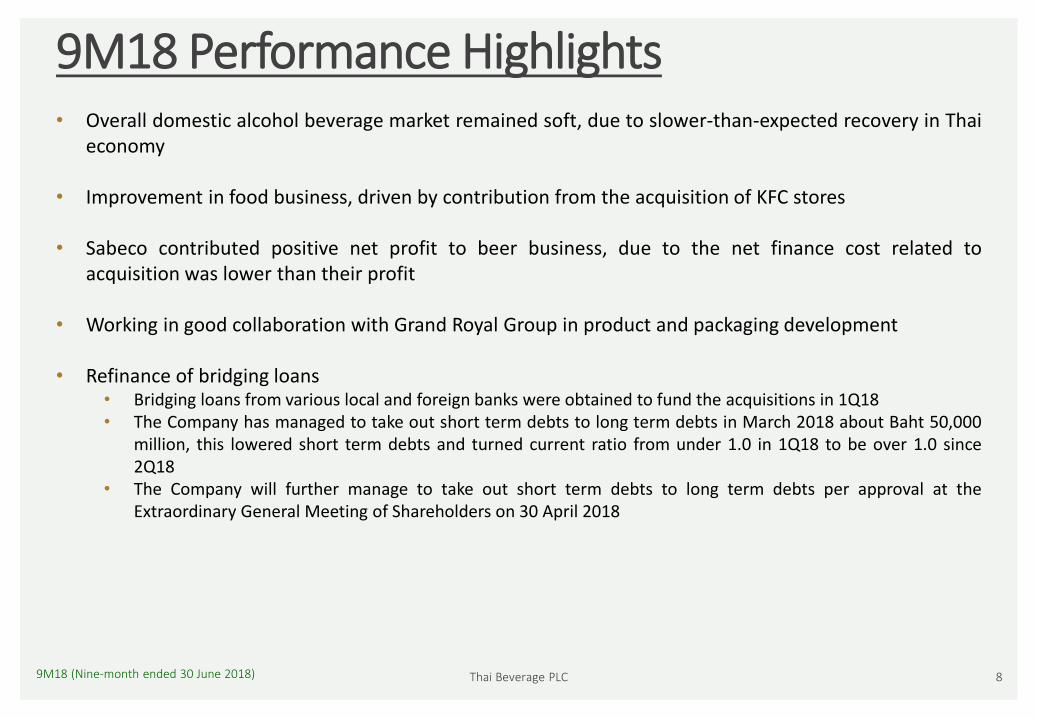
9M18 Performance Highlights• Overall domestic alcohol beverage market remained soft, due to slower-than-expected recovery in Thai
economy
• Improvement in food business, driven by contribution from the acquisition of KFC stores
• Sabeco contributed positive net profit to beer business, due to the net finance cost related toacquisition was lower than their profit
• Working in good collaboration with Grand Royal Group in product and packaging development
• Refinance of bridging loans• Bridging loans from various local and foreign banks were obtained to fund the acquisitions in 1Q18• The Company has managed to take out short term debts to long term debts in March 2018 about Baht 50,000
million, this lowered short term debts and turned current ratio from under 1.0 in 1Q18 to be over 1.0 since2Q18
• The Company will further manage to take out short term debts to long term debts per approval at theExtraordinary General Meeting of Shareholders on 30 April 2018

9M18 (Nine-month ended 30 June 2018) Thai Beverage PLC 9
Group Financial Highlights 3Q18
EBITDA(before recognition of fair value gain on financial assets*)
(million Baht)
10,80016.7%
EBITDA
(million Baht)
10,800-39.2%
Net profit(exclude non-recurring expense and before recognition of fair value gain on financial assets*)
(million Baht)
6,698-1.4%
Net profit
(million Baht)
6,647-56.5%
EPS (basic)(exclude non-recurring expense and before recognition of fair value gain on financial assets*)
(Baht)
0.24-10.3%
EPS (basic)
(Baht)
0.24-60.7%
Revenue from sales (million Baht) 60,708 34.1%
Attributable Profit (exclude non-recurring expense and before recognition of fair value gain on financial assets*)
(million Baht)
6,042-10.3%
Attributable Profit
(million Baht)
5,991-60.7%
* Non-recurring expense relating to deferred tax utilization from food business restructuring of Bt 51 million in 3Q18
* Recognition of fair value gain on financial assets of Bt 8,498 million in 3Q17

9M18 (Nine-month ended 30 June 2018) Thai Beverage PLC 10
Group Financial Highlights 9M18
EBITDA(excluded non-recurring expenses relating to business acquisitions and before recognition of fair value gain on financial assets*)
(million Baht)
30,6385.5%
EBITDA
(million Baht)
28,286-24.6%
Net profit(excluded all non-recurring expenses and before recognition of fair value gain on financial assets*)
(million Baht)
19,608-7.1%
Net profit
(million Baht)
17,098-42.3%
EPS (basic)(excluded all non-recurring expenses and before recognition of fair value gain on financial assets*)
(Baht)
0.71-15.5%
EPS (basic)
(Baht)
0.61-48.3%
Revenue from sales (million Baht) 173,916 22.1%
Attributable Profit (excluded all non-recurring expenses and before recognition of fair value gain on financial assets*)
(million Baht)
17,757-15.5%
Attributable Profit
(million Baht)
15,247-48.3%
* Non-recurring expenses relating to business acquisitions of Bt 2,352 million, finance cost before taking Sabeco results of Bt 107 million and deferred tax utilization from food business restructuring of Bt 51 million in 9M18
* Recognition of fair value gain on financial assets of Bt 8,498 million in 9M17

Thai Beverage PLC 119M18 (Nine-month ended 30 June 2018)
Consolidated: 3Q18 Highlights
(M Baht)3Q17 3Q18
Apr17 - Jun17 Apr18 - Jun18 Change
Sales Revenue 45,284 60,708 34.1%
COGS (31,189) (44,005) % of Sales Revenue 68.9% 72.5%
SG&A (7,854) (10,078) % of Sales Revenue 17.3% 16.6%
EBITDA (exclude F&N/FPL, non-recurring expenses) 7,530 8,795 16.8%
Net Profit (exclude F&N/FPL, non-recurring expenses) 5,180 4,768 -8.0%
Non-recurring cost relating to deferred tax utilization from food business restructuring - (51)
EBITDA (exclude F&N/FPL) 7,530 8,795 16.8%
Net Profit (exclude F&N/FPL) 5,180 4,717 -8.9%
F&N/FPL EBITDA (from normal operation) 1,727 2,005
F&N/FPL Net Profit (from normal operation) 1,615 1,930
EBITDA (before recognition of fair value gain on financial assets) 9,257 10,800 16.7%
Net Profit (before recognition of fair value gain on financial assets) 6,795 6,647 -2.2%
Recognition of fair value gain on financial assets 8,498 -
EBITDA 17,755 10,800 -39.2%
Net Profit 15,293 6,647 -56.5%
Attributable Profit to:
Owners of the Company 15,232 5,991 -60.7%
Non-controlling interests 61 656
Attributable Profit (from normal operation) 6,734 6,042 -10.3%
Margin*EBITDA (exclude F&N/FPL, non-recurring expenses) 16.6% 14.5%
Net Profit (exclude F&N/FPL, non-recurring expenses) 11.4% 7.9%
EBITDA (exclude F&N/FPL) 16.6% 14.5%
Net Profit (exclude F&N/FPL) 11.4% 7.8%
EBITDA (before recognition of fair value gain on financial assets) 20.4% 17.8%
Net Profit (before recognition of fair value gain on financial assets) 15.0% 10.9%
EBITDA 39.2% 17.8%
Net Profit 33.8% 10.9%
* margins are % of sales revenue

Thai Beverage PLC 129M18 (Nine-month ended 30 June 2018)
Consolidated: 9M18 Highlights
(M Baht)9M17 9M18
Oct16 - Jun17 Oct17 - Jun18 Change
Sales Revenue 142,460 173,916 22.1%
COGS (98,518) (123,458) % of Sales Revenue 69.2% 71.0%
SG&A (22,821) (29,940) % of Sales Revenue 16.0% 17.2%
EBITDA (exclude F&N/FPL, non-recurring expenses) 25,039 27,281 9.0%
Net Profit (exclude F&N/FPL, non-recurring expenses) 17,546 16,511 -5.9%
Non-recurring cost relating to acquisitions - (2,352)
Non-recurring cost relating to deferred tax utilization from food business restructuring - (51)
Finance cost relating to Sabeco acquisition before results taken - (107)
EBITDA (exclude F&N/FPL) 25,039 24,929 -0.4%
Net Profit (exclude F&N/FPL) 17,546 14,001 -20.2%
F&N/FPL EBITDA (from normal operation) 4,002 3,357
F&N/FPL Net Profit (from normal operation) 3,571 3,097
EBITDA (before recognition of fair value gain on financial assets) 29,041 28,286 -2.6%
Net Profit (before recognition of fair value gain on financial assets) 21,117 17,098 -19.0%
Recognition of fair value gain on financial assets 8,498 -
EBITDA 37,539 28,286 -24.6%
Net Profit 29,615 17,098 -42.3%
Attributable Profit to:
Owners of the Company 29,505 15,247 -48.3%
Non-controlling interests 110 1,851
Attributable Profit (from normal operation) 21,007 17,757 -15.5%
Margin*EBITDA (exclude F&N/FPL, non-recurring expenses) 17.6% 15.7%
Net Profit (exclude F&N/FPL, non-recurring expenses) 12.3% 9.5%
EBITDA (exclude F&N/FPL) 17.6% 14.3%
Net Profit (exclude F&N/FPL) 12.3% 8.1%
EBITDA (before recognition of fair value gain on financial assets) 20.4% 16.3%
Net Profit (before recognition of fair value gain on financial assets) 14.8% 9.8%
EBITDA 26.4% 16.3%
Net Profit 20.8% 9.8%
* margins are % of sales revenue

Thai Beverage PLC 139M18 (Nine-month ended 30 June 2018)
Consolidated: 3Q18 Highlights
ThaiBev F&N / FPL Total (M Baht)
3Q18
Sales 60,708 - 60,708
Gross Profit 16,703 - 16,703
EBITDA 8,795 2,005 10,800
Net Profit 4,717 1,930 6,647
Attributable Profit (Loss) by Business: 4,061 1,930 5,991 Spirits 3,924 - 3,924
Beer 465 - 465
Non-Alcohol (316) - (316)
Food 39 - 39
Non-recurring cost (51) - (51)
F&N/FPL - 1,930 1,930
3Q17
Sales 45,284 - 45,284
Gross Profit 14,095 - 14,095
EBITDA before recognition of fair value gain on financial assets 7,530 1,727 9,257
Net Profit before recognition of fair value gain on financial assets 5,180 1,615 6,795
Recognition of fair value gain on financial assets - 8,498 8,498
EBITDA 7,530 10,225 17,755
Net Profit 5,180 10,113 15,293
Attributable Profit (Loss) by Business: 5,119 10,113 15,232 Spirits 4,757 - 4,757
Beer 606 - 606
Non-Alcohol (264) - (264)
Food 20 - 20
Recognition of fair value gain on financial assets - 8,498 8,498
F&N/FPL - 1,615 1,615

Thai Beverage PLC 149M18 (Nine-month ended 30 June 2018)
Consolidated: 3Q18 Highlights
ThaiBev F&N / FPL Total (M Baht)
Increase (Decrease)
Sales 15,424 - 15,424
Gross Profit 2,608 - 2,608
EBITDA before recognition of fair value gain on financial assets 1,265 278 1,543
Net Profit before recognition of fair value gain on financial assets (463) 315 (148)
Recognition of fair value gain on financial assets - (8,498) (8,498)
EBITDA 1,265 (8,220) (6,955)
Net Profit (463) (8,183) (8,646)
Attributable Profit (Loss) by Business: (1,058) (8,183) (9,241) Spirits (833) - (833)
Beer (141) - (141)
Non-Alcohol (52) - (52)
Food 19 - 19
Non-recurring cost (51) - (51)
Recognition of fair value gain on financial assets - (8,498) (8,498)
F&N/FPL - 315 315
% Increase (Decrease)
Sales 34.1% - 34.1%
Gross Profit 18.5% - 18.5%
EBITDA before recognition of fair value gain on financial assets 16.8% 16.1% 16.7%
Net Profit before recognition of fair value gain on financial assets (8.9%) 19.5% (2.2%)
Recognition of fair value gain on financial assets - (100.0%) (100.0%)
EBITDA 16.8% (80.4%) (39.2%)
Net Profit (8.9%) (80.9%) (56.5%)
Attributable Profit (Loss) by Business: (20.7%) (80.9%) (60.7%) Spirits (17.5%) - (17.5%)
Beer (23.3%) - (23.3%)
Non-Alcohol (19.7%) - (19.7%)
Food 95.0% - 95.0%
Recognition of fair value gain on financial assets - (100.0%) (100.0%)
F&N/FPL - 19.5% 19.5%

Thai Beverage PLC 159M18 (Nine-month ended 30 June 2018)
Consolidated: 9M18 Highlights
ThaiBev F&N / FPL Total (M Baht)
9M18
Sales 173,916 - 173,916
Gross Profit 50,431 - 50,431
EBITDA 24,929 3,357 28,286
Net Profit 14,001 3,097 17,098 -
Attributable Profit (Loss) by Business: 12,150 3,097 15,247 Spirits 13,455 - 13,455
Beer 1,772 - 1,772
Non-Alcohol (913) - (913)
Food 346 - 346
Non-recurring cost (2,510) - (2,510)
F&N/FPL - 3,097 3,097
9M17
Sales 142,460 - 142,460
Gross Profit 43,942 - 43,942
EBITDA before recognition of fair value gain on financial assets 25,039 4,002 29,041
Net Profit before recognition of fair value gain on financial assets 17,546 3,571 21,117
Recognition of fair value gain on financial assets - 8,498 8,498
EBITDA 25,039 12,500 37,539
Net Profit 17,546 12,069 29,615
Attributable Profit (Loss) by Business: 17,436 12,069 29,505 Spirits 15,411 - 15,411
Beer 2,789 - 2,789
Non-Alcohol (817) - (817)
Food 53 - 53
Recognition of fair value gain on financial assets - 8,498 8,498
F&N/FPL - 3,571 3,571

Thai Beverage PLC 169M18 (Nine-month ended 30 June 2018)
Consolidated: 9M18 Highlights
ThaiBev F&N / FPL Total (M Baht)
Increase (Decrease)
Sales 31,456 - 31,456
Gross Profit 6,489 - 6,489
EBITDA before recognition of fair value gain on financial assets (110) (645) (755)
Net Profit before recognition of fair value gain on financial assets (3,545) (474) (4,019)
Recognition of fair value gain on financial assets - (8,498) (8,498)
EBITDA (110) (9,143) (9,253)
Net Profit (3,545) (8,972) (12,517)
Attributable Profit (Loss) by Business: (5,286) (8,972) (14,258) Spirits (1,956) - (1,956)
Beer (1,017) - (1,017)
Non-Alcohol (96) - (96)
Food 293 - 293
Non-recurring cost (2,510) - (2,510)
Recognition of fair value gain on financial assets - (8,498) (8,498)
F&N/FPL - (474) (474)
% Increase (Decrease)
Sales 22.1% - 22.1%
Gross Profit 14.8% - 14.8%
EBITDA before recognition of fair value gain on financial assets (0.4%) (16.1%) (2.6%)
Net Profit before recognition of fair value gain on financial assets (20.2%) (13.3%) (19.0%)
Recognition of fair value gain on financial assets - (100.0%) (100.0%)
EBITDA (0.4%) (73.1%) (24.6%)
Net Profit (20.2%) (74.3%) (42.3%)
Attributable Profit (Loss) by Business: (30.3%) (74.3%) (48.3%) Spirits (12.7%) - (12.7%)
Beer (36.5%) - (36.5%)
Non-Alcohol (11.8%) - (11.8%)
Food 552.8% - 552.8%
Recognition of fair value gain on financial assets - (100.0%) (100.0%)
F&N/FPL - (13.3%) (13.3%)

Thai Beverage PLC 179M18 (Nine-month ended 30 June 2018)
Contribution per Business Segment
* Exclude F&N/FPL and non-recurring expenses
9M18

Thai Beverage PLC 189M18 (Nine-month ended 30 June 2018)
Total Sales Volume 3Q18
* est and 100Plus ** Energy drink, sports drink and other beverages
3Q18

Thai Beverage PLC 199M18 (Nine-month ended 30 June 2018)
Total Sales Volume 9M18
* est and 100Plus ** Energy drink, sports drink and other beverages
9M18
242
779
197
11
207
839
204
8
RTD Tea and Jubjai Drinking Water Carbonated Soft Drink * Others **
NAB - Volume (M Liters)9M17 9M18
-14.4% 3.8% -28.9%7.7%

Thai Beverage PLC 209M18 (Nine-month ended 30 June 2018)
Business Segments

9M18 (Nine-month ended 30 June 2018) Thai Beverage PLC 21
Spirits
(M Baht)
Sales Revenue DOWN a decrease of sales volume COGS (%) UP a product mixSG&A (%) UP an increase in advertising and promotion expenses and staff costsEBITDA DOWN a decrease in gross profit, and an increase in advertising and promotion
expenses and staff costsNet Profit DOWN a decrease in EBITDAAttributable Profit DOWN a decrease in net profit from Company’s existing spirits although there was an increase in net
profit from MSC & MDC’s spirits
3Q17 3Q18
Spirits Apr17 - Jun17 Apr18 - Jun18 Change
Sales Revenue 25,477 24,626 -3.3%
COGS (16,969) (16,478) % of Sales Revenue 66.6% 66.9%
SG&A (2,576) (3,227) % of Sales Revenue 10.1% 13.1%
EBITDA 6,388 5,484 -14.2%
Net Profit 4,757 4,016 -15.6%
Attributable Profit to Shareholders 4,757 3,924 -17.5%
Margin*
EBITDA 25.1% 22.3%
Net Profit 18.7% 16.3%
* margins are % of sales revenue

9M18 (Nine-month ended 30 June 2018) Thai Beverage PLC 22
Spirits
(M Baht)
Sales Revenue UP an increase of sales volume COGS (%) DOWN a product mixSG&A (%) UP an increase in advertising and promotion expenses and staff costsEBITDA DOWN an increase in advertising and promotion expenses and staff costs although there was an
increase in gross profitNet Profit DOWN a decrease in EBITDAAttributable Profit DOWN a decrease in net profit from the Company’s existing spirits although there was an increase in
net profit from MSC & MDC’s sprits
9M17 9M18
Spirits Oct16 - Jun 17 Oct17 - Jun 18 Change
Sales Revenue 80,672 82,439 2.2%
COGS (53,749) (54,852) % of Sales Revenue 66.6% 66.5%
SG&A (7,693) (10,147) % of Sales Revenue 9.5% 12.3%
EBITDA 20,587 19,044 -7.5%
Net Profit 15,411 14,092 -8.6%
Attributable Profit to Shareholders 15,411 13,455 -12.7%
Margin*
EBITDA 25.5% 23.1%
Net Profit 19.1% 17.1%
* margins are % of sales revenue

9M18 (Nine-month ended 30 June 2018) Thai Beverage PLC 23
Spirits: Revenue-Cost Break Down
(% of total revenue) 9M18

9M18 (Nine-month ended 30 June 2018) Thai Beverage PLC 24
Beer
Sales Revenue UP an increase in sales volume from SabecoCOGS (%) UP a product mix and excise tax for Elderly FundSG&A (%) DOWN sales increased at a higher rate than the increase in SG&AEBITDA UP an increase in gross profit although there was an increase in advertising and promotion
expenses and staff costsNet Profit UP an increase in EBITDA Attributable Profit DOWN a decrease in net profit from the Company’s existing beer although there was an increase in
net profit from Sabeco’s beer caused from net finance cost related to acquisition was lowerthan the profit
(M Baht)
3Q17 3Q18
Beer Apr17 - Jun17 Apr18 - Jun18 Change
Sales Revenue 13,781 28,283 105.2%
COGS (10,519) (22,579) % of Sales Revenue 76.3% 79.8%
SG&A (2,584) (3,613) % of Sales Revenue 18.7% 12.8%
EBITDA 937 2,992 219.3%
Net Profit 606 1,006 66.0%
Attributable Profit to Shareholders 606 465 -23.3%
Margin*
EBITDA 6.8% 10.6%
Net Profit 4.4% 3.6%
* margins are % of sales revenue

9M18 (Nine-month ended 30 June 2018) Thai Beverage PLC 25
Beer
Sales Revenue UP an increase in sales volume from SabecoCOGS (%) UP a product mix and excise tax for Elderly Fund SG&A (%) DOWN sales increased at a higher rate than the increase in SG&AEBITDA UP an increase in gross profit although there was an increase in advertising and promotion
expenses and staff costsNet Profit UP an increase in EBITDA although there was an increase in finance costAttributable Profit DOWN a decrease in net profit from the Company’s existing beer although there was an increase in
net profit from Sabeco’s beer caused from net finance cost related to acquisition was lowerthan the profit
(M Baht)
9M17 9M18
Beer Oct16 - Jun 17 Oct17 - Jun 18 Change
Sales Revenue 44,341 69,794 57.4%
COGS (33,963) (55,122) % of Sales Revenue 76.6% 79.0%
SG&A (7,206) (9,943) % of Sales Revenue 16.3% 14.2%
EBITDA 3,926 7,164 82.5%
Net Profit 2,789 2,914 4.5%
Attributable Profit to Shareholders 2,789 1,772 -36.5%
Margin*
EBITDA 8.9% 10.3%
Net Profit 6.3% 4.2%
* margins are % of sales revenue

9M18 (Nine-month ended 30 June 2018) Thai Beverage PLC 26
Beer: Revenue-Cost Break Down
(% of total revenue) 9M18
4.1% 4.0%
14.0%
41.7%
9.2%
21.5%
1.1% 1.1% 3.3%
NET PROFIT INT. EXP.+ INC. TAX
SG&A EXCISE TAX PACKAGING RAW MATERIAL
DEPRECIATION LABOR OTHER

9M18 (Nine-month ended 30 June 2018) Thai Beverage PLC 27
Non-alcoholic Beverages
(M Baht)
Sales Revenue DOWN a product mix and there was a decrease in sales volumeCOGS (%) UP a product mix and a decrease of sale volume
SG&A (%) DOWN a decrease in advertising and promotion expensesEBITDA Loss UP a decrease in gross profit although there was a decrease in advertising and promotion expensesNet Loss UP due to EBITDA lossAttributable Loss UP an increase in net loss
3Q17 3Q18
Non-Alcoholic Beverages Apr17 - Jun17 Apr18 - Jun18 Change
Sales Revenue 4,349 4,231 -2.7%
COGS (2,791) (2,856) % of Sales Revenue 64.2% 67.5%
SG&A (1,996) (1,906) % of Sales Revenue 45.9% 45.0%
EBITDA (Loss) 43 (24) -155.8%
Net Profit (Loss) (215) (286) -33.0%
Attributable Profit (Loss) to Shareholders (264) (316) -19.7%
Margin*
EBITDA (-Loss) 1.0% -0.6%
Net Profit (-Loss) -4.9% -6.8%
* margins are % of sales revenue

9M18 (Nine-month ended 30 June 2018) Thai Beverage PLC 28
Non-alcoholic Beverages
(M Baht)
Sales Revenue DOWN a product mix although there was an increase in sales volumeCOGS (%) UP a product mix and a cost increase from sugar tax
SG&A (%) UP property damages from fire incident at UHT RTD tea plant while insurance claims recoveryin other income, although there was a decrease in advertising and promotion expenses
EBITDA Loss UP a decrease in gross profit, although there was a decrease in advertising and promotion expensesNet Loss UP a decrease in EBITDAAttributable Loss UP an increase in net loss
9M17 9M18
Non-Alcoholic Beverages Oct16 - Jun 17 Oct17 - Jun 18 Change
Sales Revenue 12,530 12,433 -0.8%
COGS (8,107) (8,335) % of Sales Revenue 64.7% 67.0%
SG&A (5,865) (6,400) % of Sales Revenue 46.8% 51.5%
EBITDA (Loss) 50 (71) -242.0%
Net Profit (Loss) (726) (853) -17.5%
Attributable Profit (Loss) to Shareholders (817) (913) -11.8%
Margin*
EBITDA (-Loss) 0.4% -0.6%
Net Profit (-Loss) -5.8% -6.9%
* margins are % of sales revenue

9M18 (Nine-month ended 30 June 2018) Thai Beverage PLC 29
Food
(M Baht)
Sales Revenue UP an increase in the number of restaurants from SOA & QSACOGS (%) UP the sales promotions impacted the marginSG&A (%) DOWN sales increased at a higher rate than the increase in SG&AEBITDA UP an increase in gross profitNet Profit - no change in net profitAttributable Profit UP an increase in net profit
3Q17 3Q18
Food Apr17 - Jun17 Apr18 - Jun18 Change
Sales Revenue 1,727 3,622 109.7%
COGS (942) (2,126) % of Sales Revenue 54.5% 58.7%
SG&A (759) (1,384) % of Sales Revenue 44.0% 38.3%
EBITDA 162 343 111.7%
Net Profit 32 32 0.0%
Attributable Profit to Shareholders 20 39 95.0%
Margin*
EBITDA 9.4% 9.5%
Net Profit 1.9% 0.9%
* margins are % of sales revenue

9M18 (Nine-month ended 30 June 2018) Thai Beverage PLC 30
Food
(M Baht)
Sales Revenue UP an increase in the number of restaurants from SOA &QSACOGS (%) UP the sales promotions in 3Q18 impacted the marginSG&A (%) DOWN sales increased at a higher rate than the increase in SG&AEBITDA UP an increase in gross profitNet Profit UP an increase in EBITDAAttributable Profit UP an increase in net profit
9M17 9M18
Food Oct16 - Jun 17 Oct17 - Jun 18 Change
Sales Revenue 5,010 9,371 87.0%
COGS (2,764) (5,256) % of Sales Revenue 55.2% 56.1%
SG&A (2,189) (3,582) % of Sales Revenue 43.7% 38.3%
EBITDA 476 1,144 140.3%
Net Profit 72 358 397.2%
Attributable Profit to Shareholders 53 346 552.8%
Margin*
EBITDA 9.5% 12.2%
Net Profit 1.4% 3.8%
* margins are % of sales revenue

Update: International Business
31Thai Beverage PLC9M18 (Nine-month ended 30 June 2018)
• International spirits- Sales revenue reported a growth of 298% driven by Grand Royal Group- Bulk sales still maintained a significant growth in UK and some Asia Pacific countries - Premium brands and OEM continued to grow strong double digit- Performance in Chinese spirits remained weak
• Beer- Sales revenue reported a growth of 1,438% driven by Sabeco- Beer sales in ASEAN, exclude Sabeco, continued to slow down
9M18 sales revenue of Baht 39.1 Bn improved 737% from last year as a result of the consolidation of Grand Royal Group (9 months) and Sabeco (6 months)

Thai Beverage PLC 329M18 (Nine-month ended 30 June 2018)
Financials

9M18 (Nine-month ended 30 June 2018) Thai Beverage PLC 33
Statement of Financial Position
Current assets UP an increase in cash and cash equivalents and current investmentsNon-current assets UP an increase in goodwill from the acquisitionsCurrent liabilities DOWN a decrease in current portion of bill of exchanges and long-terms loans from
financial institutionsNon-current liabilities UP an increase in long term loans from financial institutions for acquisitionsTotal equity UP an increase in net retained earnings from the net profit of the period which have
deducted with dividend payment
Statement of Financial Position 30-Sep-17 30-Jun-18 Change
(Million Baht)
Assets
Current assets 55,921 76,025 20,104
Non-current assets 138,319 331,353 193,034
Total assets 194,240 407,378 213,138
Liabilities
Current liabilities 47,670 38,837 (8,833)
Non-current liabilities 14,057 225,685 211,628
Total liabilities 61,727 264,522 202,795
Shareholders' Equity
Total equity 132,513 142,856 10,343

9M18 (Nine-month ended 30 June 2018) Thai Beverage PLC 34
Interest Bearing Debt
The periods to maturity of interest-bearing debts were as follows*
Million Baht
Within one year (June 2019) 13,891 After one year but within two years (June 2020) 167,419After two years 53,969Total 235,279
* The Company obtained bridging loans from various local and foreign banks to fund the acquisition in the first quarter ended 31 December 2017. The Company has managed to take out short term debts to long term debts in March 2018 about Baht 50,000 million. The Company will further manage to take out short term debts to long term debts per approval at the Extraordinary General Meeting of Shareholders on 30 April 2018.
Interest Bearing Debt 30-Sep-17 30-Jun-18
(Million Baht)
Current
Bank overdrafts - 257
Short-term loans from financial institutions 5,703 4,618
Current portion of bill of exchanges and long-term loans 24,950 8,016
Current Portion of debentures - 1,000
Other short-term loan 5 -
30,658 13,891
Non-current
Debentures 2,000 50,963
Long-term loans from financial institutions 8,000 170,425
10,000 221,388
Total 40,658 235,279
Cash and cash equivalents 9,929 13,033
Net Interest Bearing Debt 30,729 222,246

9M18 (Nine-month ended 30 June 2018) Thai Beverage PLC 35
Financial Ratios
Current Ratio UP an increase in cash and cash equivalents, current investment and a decrease in current portion of bill of exchanges and long-terms loans from financial institutions
Liability to Equity Ratio UP an increase in loans from financial institutions for acquisitions
Note: use 365 days to calculate turnover
Ratios 30-Sep-17 30-Jun-18
Current Ratio (times) 1.17 1.96
Liability to Equity Ratio (Gearing Ratio) (times) 0.47 1.85
Interest Bearing Debt to Equity Ratio (times) 0.31 1.65
Net Interest Bearing Debt to Equity Ratio (times) 0.23 1.56
Net Interest Bearing Debt to EBITDA (times) 0.68 5.36
Net asset value per share (Baht) 5.13 4.96
Net asset value per share (SGD)* 0.21 0.21
* exchange rate at THB 24.03905 : SGD 1
EPS 30-Jun-17 30-Jun-18
Earnings per share for the quarter (Baht) 0.61 0.24
Earnings per share for the nine-months period (Baht) 1.18 0.61
Turnover Oct 16 - Sep 17 Oct 17 - Jun 18
A/R Turnover (days) 5 6
Inventory Turnover (days)
Spirit Business: finished goods 56 56
Beer Business: finished goods 14 12
Non-alcohol Business: finished goods 26 22
Food Business: finished goods 2 3

Thai Beverage PLC 369M18 (Nine-month ended 30 June 2018)
Thank You