Embed Size (px)
Citation preview
i
THAILAND ECONOMIC MONITOR DECEMBER 2008
World Bank Office - Bangkok Country Director: Annette Dixon Chief Economist: Vikram Nehru
Comments to: Mathew A. Verghis
[email protected] Kirida Bhaopichitr
30th Floor, Siam Tower 989 Rama I Road, Pathumwan
Bangkok 10330, Thailand (662) 686-8300
www.worldbank.or.th
Acknowledgements
This report was prepared by Kirida Bhaopichitr (Task Team Leader), Frederico Gil Sander, and Vatcharin Sirimaneetham under the overall supervision of Mathew A. Verghis.. Angkanee Luangpenthong and Ruangrong Thongampai expertly handled the processing of the document. We would like to acknowledge input from Thomas Rose and Ratchada Anantavrasilpa (Financial Sector), Chanin Manopiniwes (Infrastructure), Nattaporn Triratanasirikul and Shabih Mohib (Public Sector Reform), Toomas Palu, Sutayut Osomprasop and Ilaria Regondi (Social Protection and Health). Valuable comments and information were provided by officials of the Bank of Thailand, Board of Investment, Customs Department, Department of Trade Negotiations, EXIM Bank, Federation of Thai Industries, Fiscal Policy Office, the National Economic and Social Development Board, National Statistics Office, Office of Agricultural Economics, Office of Industrial Economics, Office of the Civil Service Commission, Office of the Public Sector Development Commission, Public Debt Management Office, Securities and Exchange Commission, Stock Exchange of Thailand, Thai Chamber of Commerce as well as by World Bank staff including Vikram Nehru and Ivailo Izvorski.
ii
ABBREVIATIONS
ACMECS Ayeyawady-Chao Phraya-Mekong Economic Corporation Strategy ARMS Advanced Resilient Matching System ASEAN Association of Southeast Asian Nations ASSET Automated System for the Stock Exchange of Thailand BAAC Bank for Agriculture and Agricultural Cooperatives BIMSTEC Bay of Bengal Initiative for MultiSectoral Technical and Economic Cooperation BIS Bank for International Settlement BOB Bureau of Budget BOI Board of Investment BOP Balance of Payments BOT Bank of Thailand CDS Credit Default Swaps CMDF Capital Market Development Fund CPI Consumer Price Index CSMBS Civil Service Medical Benefit Scheme DALY Disability-adjusted Life Year DPA Deposit Protection Agency ETF Exchange-traded Fund EU European Union EXIM Bank Export-Import Bank of Thailand FDI Foreign Direct Investments FIBA Financial Institution Business Act FIDF Financial Institutions Development Fund FPO Fiscal Policy Office FSMP Financial Sector Master Plan FTA Free Trade Agreements FY Fiscal Year GDP Gross Domestic Product ICT Information and Communications Technology JTEPA Japan-Thailand Economic Partnership Agreement KEI Knowledge Economy Index KPIs Key Performance Indicators LGO Local Government Organizations LTF Long Term Fund MOC Ministry of Commerce MOPH Ministry of Public Health MTEF Medium Term Expenditure Framework NCB National Credit Bureau
iii
NCD Non-Communicable Diseases NEER Nominal Effective Exchange Rate NESDB National Economic and Social Development Board NHSO National Health Security Office NPLs Non-performing loans NSO National Statistic Office OCSC Office of Civil Service Commission OECD Organization for Economic Cooperation and Development OPDC Office of Public Development Commission REER Real Effective Exchange Rate RMF Retirement Mutual Fund ROH Regional Operating Headquarters SET Stock Exchange of Thailand SMEs Small and Medium Enterprises SML Small-Medium-Large SOEs State-owned Enterprises SSO Social Security Office SSS Social Security Scheme TCH Thailand Clearing House Co., Ltd. TFEX Thailand Futures Exchange TSD Thailand Security Depositary Co., Ltd. UC Universal Coverage Scheme WB World Bank WTO World Trade Organization yoy Year-on-year
iv
TABLE OF CONTENTS
SECTION 1 Overview................................................................................................................... 1
SECTION 2 Recent Developments and Outlok ............................................................................ 5 2.1 Real GDP Growth and Macroeconomic Developments ....................................................... 5 2.2 Poverty................................................................................................................................ 15 2.3 External Environment ......................................................................................................... 20 2.4 Export Performance ............................................................................................................ 22
2.4.1 Merchandise Exports ................................................................................................... 22 2.4.2 Services Exports........................................................................................................... 28
2.5 Household Consumption .................................................................................................... 29 2.6 Investment........................................................................................................................... 31
2.6.1 Private Investment ....................................................................................................... 32 2.6.2 Public Investment......................................................................................................... 35
2.7 Financial and Corporate Sector Developments .................................................................. 36 2.8 Medium Term Development............................................................................................... 41
SECTION 3 Implementation of Reforms ..................................................................................... 46
3.1 Financial and Corporate Sector Reforms and Restructuring .............................................. 46 3.2 Recent Trade Reforms ........................................................................................................ 49 3.3 Public Sector Reform.......................................................................................................... 53
Appendix 1: Key Indicator Table ................................................................................................ 54
Appendix 2: Monitoring Matrices for Structural Reform Implementation .................................. 56
1. Poverty Reduction ............................................................................................................... 57 2. Financial and Corporate Sectors Reforms ........................................................................... 58 3. Reforms to Improve Business and Investment Environment and Trade Regime................ 62 4. Public Sector and Governance Reform................................................................................ 65 5. Social Protection.................................................................................................................. 67
1
SECTION 1
OVERVIEW The Thai economy remained resilient through the first three quarters of this year, amidst the sharp rise in food and fuel prices. In the first three quarters of the year, real GDP expanded by 5.1 percent year-on-year, compared to 4.6 percent in the same period of 2007. This was led by the robust export growth of 25 percent year-on-year in US dollar terms and 9 percent in real terms, not withstanding the continuous appreciation of the baht. Private consumption and investment also grew by more than they did in 2007, despite the sharp increase in food and fuel prices. On the other hand, public consumption and investments in real terms have contracted in the first three quarters as a result of slow disbursement rates amidst political instability and slow project completion as raw material prices rose sharply. Real GDP growth in 2008 is expected to be 3.9 percent as the global economic slowdown and domestic political unrest weigh upon growth in the last quarter. Growth in the last quarter is expected to slow down to less than 1 percent year-on-year as exports of goods are negatively affected by the deceleration in demand of Thailand’s major export markets. Exports of services, of which more than half are tourism receipts, have also been severely affected by the political unrest since October. As a result, manufacturing and services growth in the last quarter of this year will slow down considerably. Layoffs and work hour reduction, particularly in the manufacturing sector, have also started to rise, while private investment slows. As job security and income growth uncertainties increase, consumer confidence is falling and household consumption growth has shown clear signs of a deceleration. These trends will extend into next year as the global economy continues to slow. Thailand’s real GDP is projected to grow by 2 percent next year. This will be the lowest growth Thailand has seen since 1998, when real GDP contracted. The major factor weighing down growth next year is the sharp slow down in the global economy, particularly the contraction of the economies that are Thailand’s major export markets – US, EU, and Japan. This will have a large negative impact on Thailand’s exports of both goods and services which has been the major source of income and the driver of the output growth in the past few years. The US dollar value of exports of goods is expected to expand by only 8 percent in 2009, compared to around 20 percent this year. The political unrest in the last quarter of 2008 will continue to dampen tourist confidence into at least the first half of 2009. In addition, the slow down in growth of the economies from which a large number of tourists come to Thailand, such as EU and Japan, will reduce tourist receipts next year. With the slow down in exports capacity utilization is expected to fall; which will negatively affect private investment. Household consumption growth will also continue to be dampened as income growth will be slower next year with employment increasing minimally, and consumer confidence falling, even though inflation will be significant lower at only around 2 percent compared to 6 percent this year. Significant downside risks remain to the growth projection should political instability heighten, the global economy decelerate faster than projected, and implementation of the fiscal stimulus is delayed. The impact of the global financial crisis on the Thai financial sector, on the other hand, has so far been limited. Although risk-sensitive indicators have risen since Lehman Brothers announced its bankruptcy on September 15th, they have been lower in Thailand compared to those in its East Asian peers – prior to the airport closure. Credit default swaps (CDS) spiked in line with global conditions and the stock market is down over 50 percent year-to-date. These were however, less than those in other East Asia economies. From September 15th to November 25th before the takeover of the airports, the baht has
2
depreciated by 2 percent against the US dollar. It has, however, appreciated against regional currencies by 6 percent. Similarly, the nominal effective exchange rate (NEER) had appreciated by 2 percent. During the closure of the airports in Bangkok from November 26th to December 2nd, the CDS rose and was on par with regional peers, while the stock market fell further below that of regional peers. As discussed earlier, the impact of the global financial crisis has been started to be felt in the real sector, particularly that of exports. Strong external accounts have enabled Thailand to withstand the contraction in global liquidity. International reserves remain relatively large and external debt – especially short-term debt – is low. International reserves stood at US$106 billion in early December 2008 compared to US$87.5 billion at end-2007. This is due to the large capital inflows in the first quarter of the year and again in the last quarter of the year. External debt is low at around US$66 billion or 30 percent of GDP, of which two-fifths are short-term debt. Three quarters of the short term debt are trade credits and inter-company loans. Public external debt (government and state-owned enterprises) make up one-fifth of total external debt and less than 1 percent of it is short-term. Overall, external debt service ratios are manageable at 6.1 percent of exports. The banking sector remains sound, but individual banks needs to be closely monitored. Banks’ foreign investments are less than 2 percent of their total asset with investment in foreign debt instruments being around 13 percent of total debt-instrument holdings. Foreign banks account for about 12 percent of the Thai market (although this figure goes up to 30-40 percent through equity holdings in Thai banks). Non-performing loans (NPLs) have been declining and stood at 3.3 percent of total loans in the third quarter of 2008, compared to 4.4 percent in same quarter of 2007. The adjusted loan-to-deposit ratio is around 90 percent. Average capital adequacy ratios are over 15 percent compared to Bank for International Settlement (BIS) requirement of 8.5. While these ratios suggest that the banking system as a whole is relatively sound, it is important to monitor individual banks, however. Loan growth, however, will slow down next year. As the economy slows down, liquidity in the global markets tightened, and corporate balance sheets weaken, commercial banks have signaled that they will focus more on risk management than on loan growth. Commercial banks’ loan growth next year will likely be in a single digit after registering 11.2 percent growth as of October this year. A large share of loans in 2008 was for working capital as the cost of raw materials and fuel increased significantly in the first half of the year. Next year, loans will be more scrutinized for credit quality. Large corporations will increasingly turn to domestic borrowing as the cost of off-shore borrowing increases rapidly. Bank loans to large corporations will therefore to continue to expand, as their credit quality is generally high, but those to small and medium enterprises (SMEs) may not. Expansionary monetary has been employed to help to mitigate the impact of the global financial crisis. As inflation rose rapidly in the first half of the year, the Bank of Thailand (BOT) raised its policy rate by 0.5 percentage points to 3.75 percent. With inflation less of a concern in the coming year, the Bank of Thailand has lowered its policy rate from 3.75 percent to 2.75 percent in early December. Moreover, the Bank of Thailand also has the capacity to inject additional liquidity when needed. Commercial banks’ interest rates are expected to decline next year, but probably by not as much as the policy rate, as banks will be cautious about maintaining their liquidity. Measures will be needed to mitigate the short-term impact of the global crisis on low-income groups and small and medium enterprises (SMEs). As economic growth slows down, there have been reduction in work hours and the rise in layoffs of workers from the manufacturing sector since September. It is expected that almost 1 million employees (or 2.6 percent of the workforce) will be laid off next year1. 1 Source: Federation of Thai Industries and Thai Chamber of Commerce
3
These will lead to unemployment for some, while most will move to the informal sector. There will need to be targeted measures to assist these groups of people as well as programs to improve their skills, so that they are able to return to the formal sector employment when manufacturing growth rebounds in the next couple of years. Similarly, the impact of an economic downturn on SMEs will be greater than on larger firms, as SMEs generally have less excess cash and ability to borrow from banks. Loan extension to SMEs as well as measures to increase their productivity and risk management are necessary for them to maintain their operations in the next few years, as well as remain competitive in the longer term. The government has implemented several measures in 2008 to mitigate the short run impact of rising inflation and falling incomes. In 2008, the government issued four sets of measures – three of them are aimed at mitigating the impact of the rise in food and oil prices on households and businesses and one in October aimed at mitigating the impact of the global financial crisis. They include personal income and corporate tax reduction, tax deductions for investment, reduction in property sales transaction fees, subsidies on gasoline, water, electricity, and public buses and train services, direct transfers from the government to administrations at the grassroot level, as well as loans by specialized state-owned financial institutions to SMEs and households. However, additional measures to assist affected workers and SMEs in improving their productivity and capacity would enable them to better cope and withstand future shocks. However, measures for the medium term that will enable Thailand to poise itself for higher and sustainable growth as the global economy recovers in the next few years are no less important. While coping and mitigating with the impact of the financial crisis in the short-run, it is equally important for all stake holders in Thailand to prepare for a recovery in global demand and ensure sustainable growth thereafter. The global economy is projected to recover over the next few years and, thereafter competition will intensify. Thailand should take the opportunity during the next few years to strengthen its productivity and competitiveness so that when demand resumes, Thailand will be in a position to jump the band wagon of global recovery. To do so requires serious efforts of all stakeholders in Thailand including the government, private sector, and academia. As these improvements take time, for Thailand to achieve them in time for the projected global recovery, the efforts must start right away. In order to ensure Thailand’s competitiveness in the near future, Thailand needs to improve its productivity and investment climate. Experience from countries that have managed to increase productivity and rise up the value chain such as South Korea and Taiwan have shown that productivity improvements at the national level are achievable with a concerted efforts by the private sector, government, and academia. Firms need to raise their productivity and adaptability to the rapidly changing macroeconomic environment and intensifying competition through greater product and service development, higher efficiency, and better risk management. Government should take measures to improve the country’s investment climate such as streamlining the regulatory environment and improving public infrastructure which will help stimulate private investments as they help to reduce operating costs for firms. At the heart of productivity improvement is the quality of the country’s human resource2. Examples from Korea, Taiwan, and Singapore above have shown that improving the skills and knowledge of their human resource has enabled them to move towards a knowledge economy, which has in turn raised and sustain their productivity and competitiveness. However, these were possible through the collaborative efforts of the government, private sector, and academic institutions3.
2 A survey of firms in 2007 showed that in addition to the macroeconomic environment, other aspects of the investment climate that needs to be improved in order to promote greater investment and productivity improvements by firms are skills of the workforce, regulatory environment and public infrastructure. See Thailand Investment Climate Assessment Update report (forthcoming). 3 See World Bank, Moving Thailand Towards a Knowledge Economy report (2008)
4
Clarity and continuity in policy directions and greater public infrastructure investments are needed not only to help stimulate growth in the short-run, but also improve productivity for the longer-term growth. Political stability would help to regain investors as well as assure them the clarity and continuity of policy directions. These could help promote investments by the private sector amidst the unfavorable external environment. Greater public investments in infrastructure will also boost investor confidence and investments. Public investments would not only inject funds directly into the economy, but better infrastructure services will stimulate further investments and productivity of firms. Firms in the 2007 survey4 indicated that inadequate infrastructure services have led to increased costs, such as logistics costs, which have discouraged them from investing. This is consistent with the fact that public investment levels in Thailand have been relatively low with its share in real GDP at only 5-6 percent in recent years. This is because public investment was contracting since the 1998 crisis and only expanded in 2004-2007, before contracting again this year with delays in disbursement and project completion as a result of the sharp rise in construction material prices and political uncertainties. Starting next year, the government needs to speed up disbursements on public investments. The government could also raise the amount of public investment. It has the fiscal capacity to do so as public debt levels and debt repayments remain well below the fiscal sustainability guidelines.
4 See Thailand Investment Climate Assessment Update report (forthcoming)
5
SECTION 2
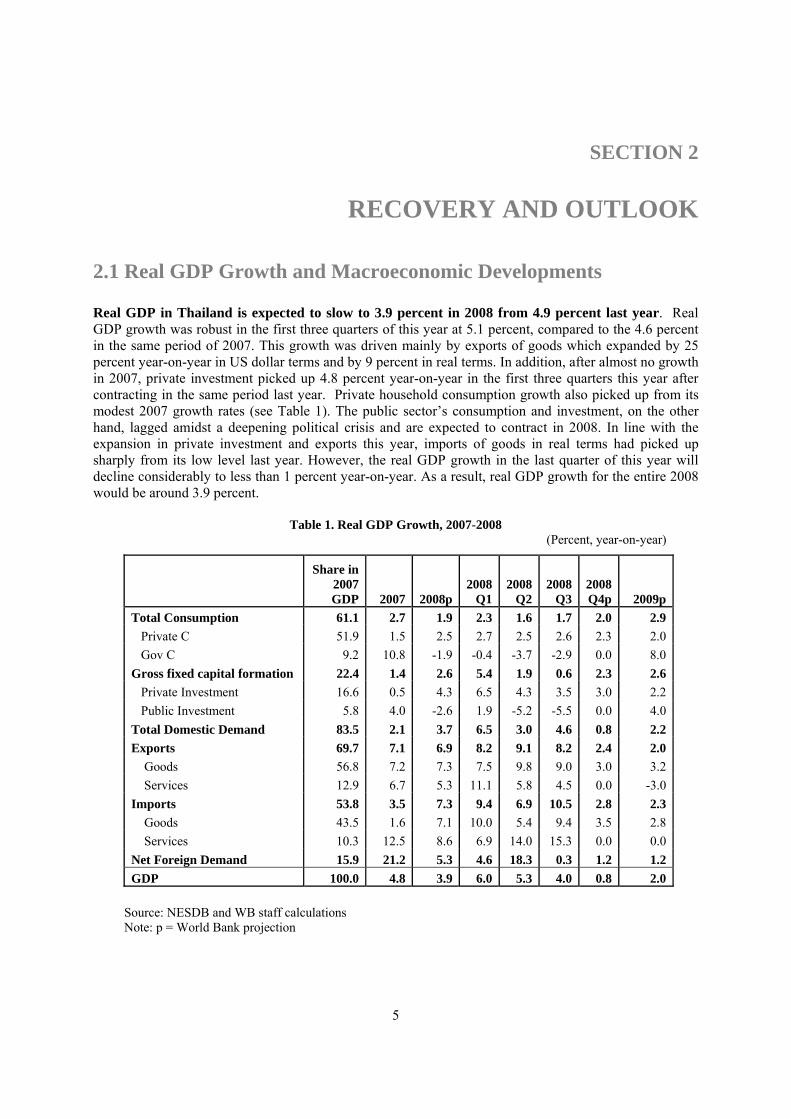
RECOVERY AND OUTLOOK 2.1 Real GDP Growth and Macroeconomic Developments Real GDP in Thailand is expected to slow to 3.9 percent in 2008 from 4.9 percent last year. Real GDP growth was robust in the first three quarters of this year at 5.1 percent, compared to the 4.6 percent in the same period of 2007. This growth was driven mainly by exports of goods which expanded by 25 percent year-on-year in US dollar terms and by 9 percent in real terms. In addition, after almost no growth in 2007, private investment picked up 4.8 percent year-on-year in the first three quarters this year after contracting in the same period last year. Private household consumption growth also picked up from its modest 2007 growth rates (see Table 1). The public sector’s consumption and investment, on the other hand, lagged amidst a deepening political crisis and are expected to contract in 2008. In line with the expansion in private investment and exports this year, imports of goods in real terms had picked up sharply from its low level last year. However, the real GDP growth in the last quarter of this year will decline considerably to less than 1 percent year-on-year. As a result, real GDP growth for the entire 2008 would be around 3.9 percent.
Table 1. Real GDP Growth, 2007-2008 (Percent, year-on-year)
Share in 2007 GDP 2007 2008p
2008Q1
2008Q2
2008 Q3
2008 Q4p 2009p
Total Consumption 61.1 2.7 1.9 2.3 1.6 1.7 2.0 2.9 Private C 51.9 1.5 2.5 2.7 2.5 2.6 2.3 2.0 Gov C 9.2 10.8 -1.9 -0.4 -3.7 -2.9 0.0 8.0Gross fixed capital formation 22.4 1.4 2.6 5.4 1.9 0.6 2.3 2.6 Private Investment 16.6 0.5 4.3 6.5 4.3 3.5 3.0 2.2 Public Investment 5.8 4.0 -2.6 1.9 -5.2 -5.5 0.0 4.0Total Domestic Demand 83.5 2.1 3.7 6.5 3.0 4.6 0.8 2.2Exports 69.7 7.1 6.9 8.2 9.1 8.2 2.4 2.0 Goods 56.8 7.2 7.3 7.5 9.8 9.0 3.0 3.2 Services 12.9 6.7 5.3 11.1 5.8 4.5 0.0 -3.0Imports 53.8 3.5 7.3 9.4 6.9 10.5 2.8 2.3 Goods 43.5 1.6 7.1 10.0 5.4 9.4 3.5 2.8 Services 10.3 12.5 8.6 6.9 14.0 15.3 0.0 0.0Net Foreign Demand 15.9 21.2 5.3 4.6 18.3 0.3 1.2 1.2GDP 100.0 4.8 3.9 6.0 5.3 4.0 0.8 2.0
Source: NESDB and WB staff calculations Note: p = World Bank projection
6
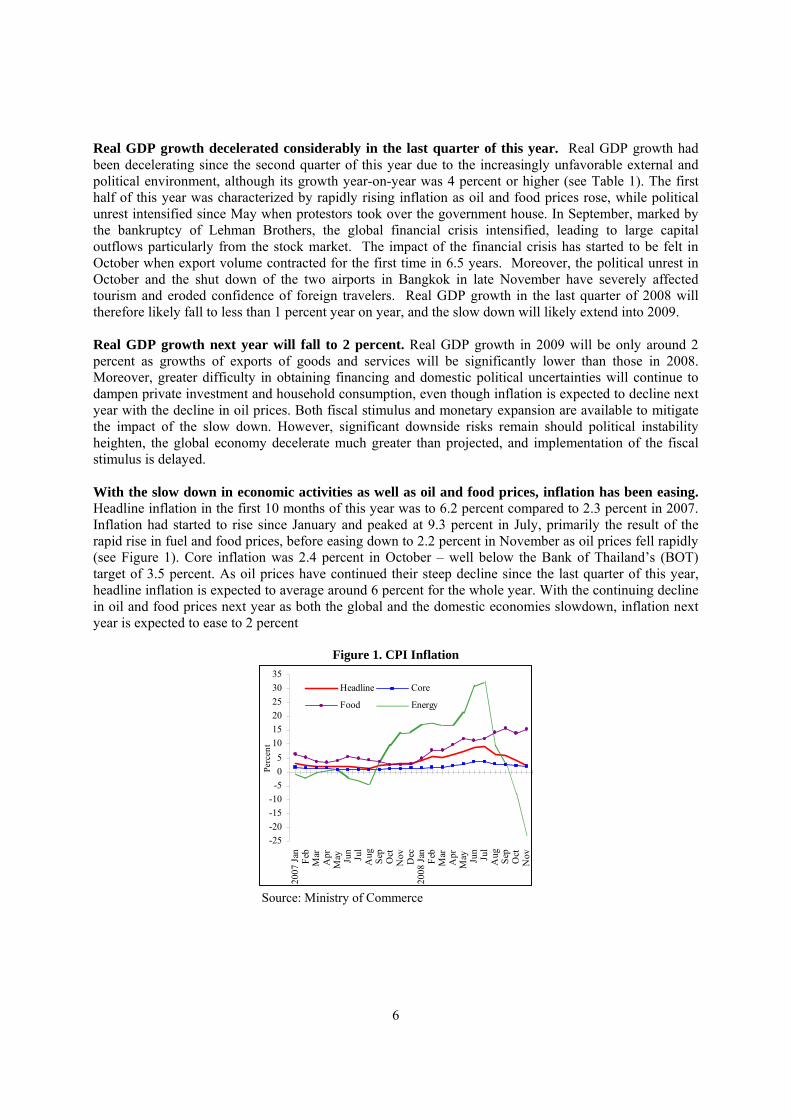
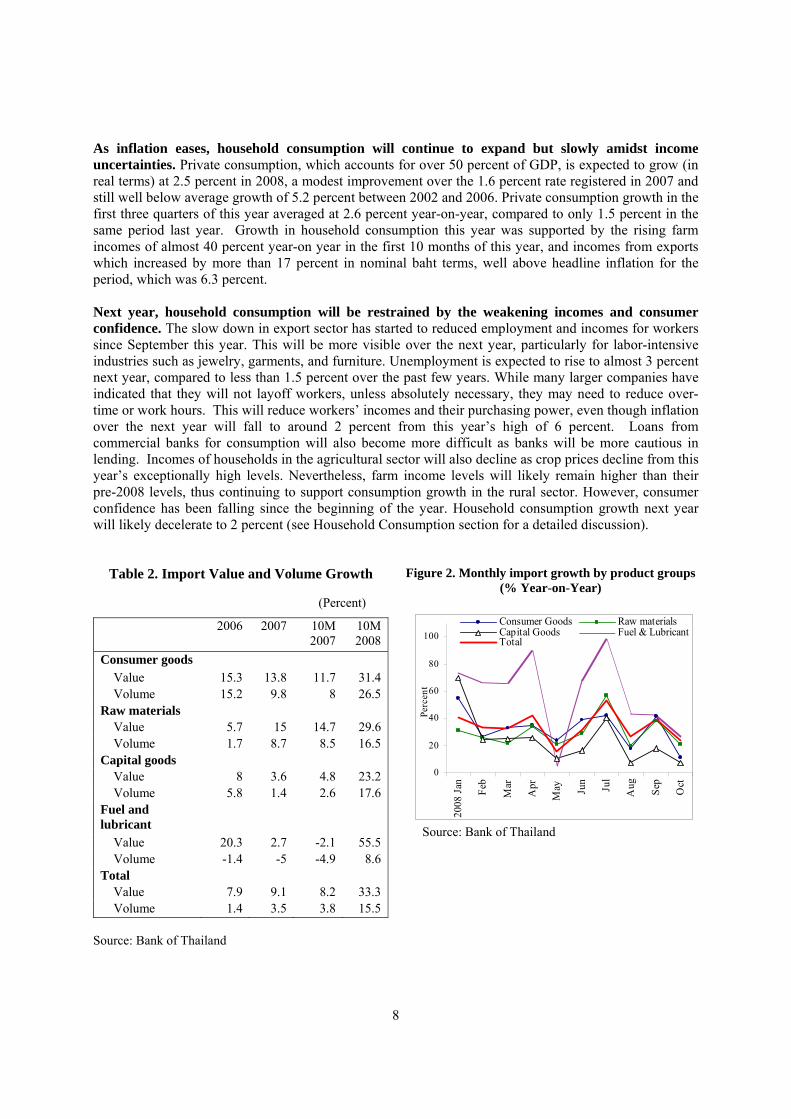
Real GDP growth decelerated considerably in the last quarter of this year. Real GDP growth had been decelerating since the second quarter of this year due to the increasingly unfavorable external and political environment, although its growth year-on-year was 4 percent or higher (see Table 1). The first half of this year was characterized by rapidly rising inflation as oil and food prices rose, while political unrest intensified since May when protestors took over the government house. In September, marked by the bankruptcy of Lehman Brothers, the global financial crisis intensified, leading to large capital outflows particularly from the stock market. The impact of the financial crisis has started to be felt in October when export volume contracted for the first time in 6.5 years. Moreover, the political unrest in October and the shut down of the two airports in Bangkok in late November have severely affected tourism and eroded confidence of foreign travelers. Real GDP growth in the last quarter of 2008 will therefore likely fall to less than 1 percent year on year, and the slow down will likely extend into 2009. Real GDP growth next year will fall to 2 percent. Real GDP growth in 2009 will be only around 2 percent as growths of exports of goods and services will be significantly lower than those in 2008. Moreover, greater difficulty in obtaining financing and domestic political uncertainties will continue to dampen private investment and household consumption, even though inflation is expected to decline next year with the decline in oil prices. Both fiscal stimulus and monetary expansion are available to mitigate the impact of the slow down. However, significant downside risks remain should political instability heighten, the global economy decelerate much greater than projected, and implementation of the fiscal stimulus is delayed. With the slow down in economic activities as well as oil and food prices, inflation has been easing. Headline inflation in the first 10 months of this year was to 6.2 percent compared to 2.3 percent in 2007. Inflation had started to rise since January and peaked at 9.3 percent in July, primarily the result of the rapid rise in fuel and food prices, before easing down to 2.2 percent in November as oil prices fell rapidly (see Figure 1). Core inflation was 2.4 percent in October – well below the Bank of Thailand’s (BOT) target of 3.5 percent. As oil prices have continued their steep decline since the last quarter of this year, headline inflation is expected to average around 6 percent for the whole year. With the continuing decline in oil and food prices next year as both the global and the domestic economies slowdown, inflation next year is expected to ease to 2 percent
Figure 1. CPI Inflation
-25-20-15-10
-505
101520253035
2007
Jan Feb
Mar
Apr
May Ju
nJu
lA
ug Sep
Oct
Nov Dec
2008
Jan Feb
Mar
Apr
May Ju
nJu
lA
ug Sep
Oct
Nov
Perc
ent
Headline Core
Food Energy
Source: Ministry of Commerce
7
The impact of the global financial crisis on the Thai economy has already been felt mainly through exports. At almost 70 percent of GDP, exports of goods and services have been the driver of real GDP growth in 2006 and 2007. In the first 9 months of this year, export of all categories of goods (high-tech, labor intensive, and resource based manufacturing products and agricultural produce) expanded robustly. Export growth year-on-year peaked at 44 percent in July before decelerating to lower than 20 percent since August. Exports of goods in the first three quarters of this year expanded by 25 percent in US dollar terms. In October, export year-on-year growth in US dollar terms declined to its 6.5-year low of 5.2 percent with its volume contracting by 3.1 percent. This is particularly true for export products that go to ASEAN such as computers, integrated circuits, and air-conditioners. For the entire year, exports in US dollar terms will expand by around 19.5 percent, while its volume growth will be around 7.3 percent. On the other hand, impacts of the global financial crisis on Thailand’s financial sector and external accounts have so far been fairly limited and appear to be less than that on other regional economies (see Box 2). The sharp deceleration of demand from developed countries next year will further affect Thai exports of goods and services. Traditional export markets, namely, US, Europe, and Japan, purchase a little over one-third of Thai exports, while emerging markets (notably China and ASEAN) which represents another one-third also have large trade shares with the traditional markets. In 2009, growth of export volume of goods will sharply decelerate to 3.2, compared to 7.3 percent this year, while its value growth decline to 8 percent year-on-year from 19.5 percent this year. Exports of services, of which more than half are tourist receipts (around 7 percent of GDP) will also be heavily impacted by the slow down in the incomes of developed countries (which represents around 40 percent of tourists in Thailand each year) and the dampened tourist confidence amidst Thailand’s internal political unrest. Exports of services are projected to contract next year, after registering no growth in the last quarter of this year (see Table 1). Private investments, particularly foreign direct investments, have also been affected by the global financial crisis and political uncertainties. Private investment or investment by firms is expected to grow by 4.3 percent in real terms in 2008, mostly driven by domestic investment. Private investment has picked up this year from its almost zero growth last year (see Table 1). This growth in private investment came mainly from Thai investors as gross foreign direct investment (FDI) inflows have declined from that of last year. In the first 9 months of this year, gross FDI was US$16 billion compared to US$19.2 billion in the same period last year. Amidst the intensifying global financial crisis and heightened political unrest beginning in October, gross FDI in the final quarter of this year will most likely continue to decline from its level in the last quarter of 2007. Foreign direct investment is expected to decline further next year. The four largest foreign direct investors to Thailand have been for many years from Japan, Singapore, EU, and US. But as the global economy and those of the four large investors to Thailand slow down and Thailand’s political uncertainties continue, FDI could remain sluggish next year. Investments by local firms, on the other hand, will be adversely affected by the slow down in demand as well as the slower commercial bank loan growth. As a result, private investment in real terms is projected to grow at only around 2.2 percent next year (see Private Investment section for a detailed discussion). As the economy slows down, liquidity in the global markets tightens, and corporate balance sheets weaken, banks will become increasingly cautious in extending loans. Commercial banks have signaled that they, over the next year, will focus more on risk management than on loan growth. Loan growth to businesses next year will likely slow down after registering 7.2 percent growth as of September this year. A large share of loans in 2008 was for working capital as the cost of raw materials and fuel increased significantly in the first three quarters of the year. Next year, loans for working capital, particularly to small and medium enterprises (SMEs), will be more scrutinized for credit quality. Large corporations, on the other hand, will increasingly turn to domestic borrowing as the cost of off-shore borrowing increases rapidly. Bank loans to large corporations will therefore to continue to expand, as their credit quality is generally high. Banks will similarly be more scrutinizing in extending loans to households for consumption and mortgages, which has expanded by 11 percent by end-September 2008.
8
As inflation eases, household consumption will continue to expand but slowly amidst income uncertainties. Private consumption, which accounts for over 50 percent of GDP, is expected to grow (in real terms) at 2.5 percent in 2008, a modest improvement over the 1.6 percent rate registered in 2007 and still well below average growth of 5.2 percent between 2002 and 2006. Private consumption growth in the first three quarters of this year averaged at 2.6 percent year-on-year, compared to only 1.5 percent in the same period last year. Growth in household consumption this year was supported by the rising farm incomes of almost 40 percent year-on year in the first 10 months of this year, and incomes from exports which increased by more than 17 percent in nominal baht terms, well above headline inflation for the period, which was 6.3 percent. Next year, household consumption will be restrained by the weakening incomes and consumer confidence. The slow down in export sector has started to reduced employment and incomes for workers since September this year. This will be more visible over the next year, particularly for labor-intensive industries such as jewelry, garments, and furniture. Unemployment is expected to rise to almost 3 percent next year, compared to less than 1.5 percent over the past few years. While many larger companies have indicated that they will not layoff workers, unless absolutely necessary, they may need to reduce over-time or work hours. This will reduce workers’ incomes and their purchasing power, even though inflation over the next year will fall to around 2 percent from this year’s high of 6 percent. Loans from commercial banks for consumption will also become more difficult as banks will be more cautious in lending. Incomes of households in the agricultural sector will also decline as crop prices decline from this year’s exceptionally high levels. Nevertheless, farm income levels will likely remain higher than their pre-2008 levels, thus continuing to support consumption growth in the rural sector. However, consumer confidence has been falling since the beginning of the year. Household consumption growth next year will likely decelerate to 2 percent (see Household Consumption section for a detailed discussion).
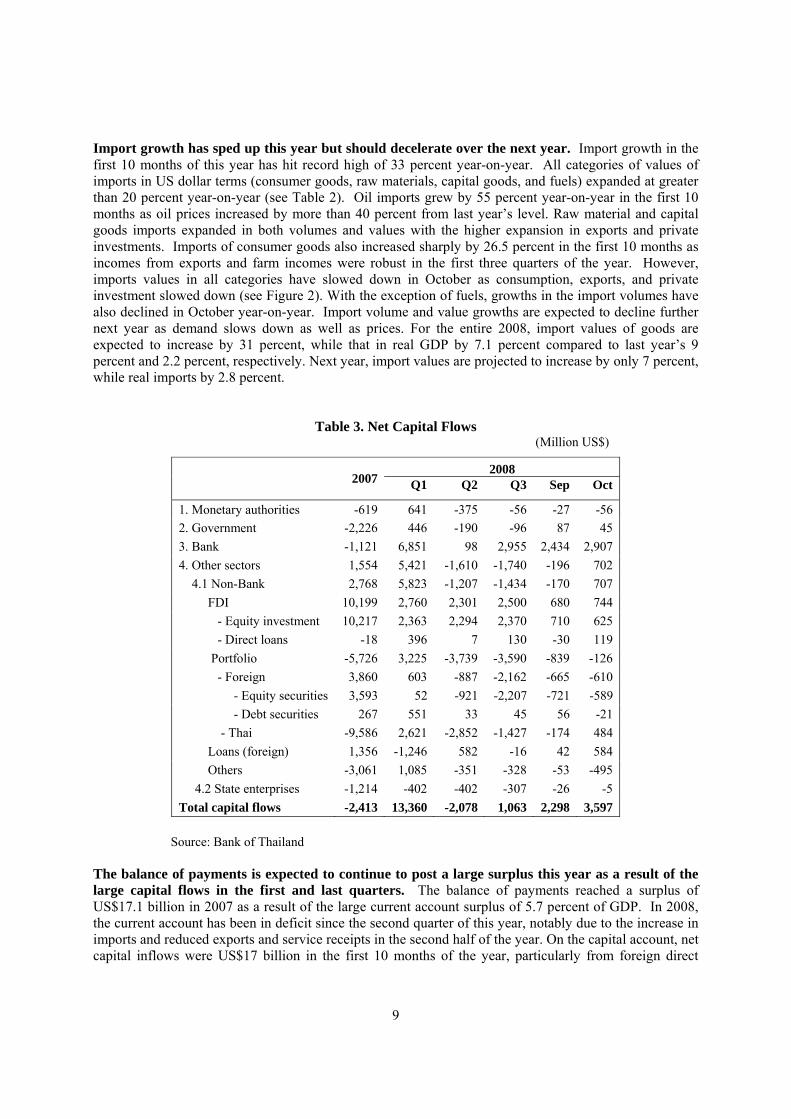
Table 2. Import Value and Volume Growth Figure 2. Monthly import growth by product groups (% Year-on-Year)
(Percent)
2006 2007 10M 2007
10M 2008
Consumer goods Value 15.3 13.8 11.7 31.4 Volume 15.2 9.8 8 26.5 Raw materials Value 5.7 15 14.7 29.6 Volume 1.7 8.7 8.5 16.5 Capital goods Value 8 3.6 4.8 23.2 Volume 5.8 1.4 2.6 17.6 Fuel and lubricant
Value 20.3 2.7 -2.1 55.5 Volume -1.4 -5 -4.9 8.6 Total Value 7.9 9.1 8.2 33.3 Volume 1.4 3.5 3.8 15.5
Source: Bank of Thailand
0
20
40
60
80
100
2008
Jan Feb
Mar
Apr
May Ju
n
Jul
Aug Sep
Oct
Perc
ent
Consumer Goods Raw materialsCapital Goods Fuel & LubricantTotal
Source: Bank of Thailand
9
Import growth has sped up this year but should decelerate over the next year. Import growth in the first 10 months of this year has hit record high of 33 percent year-on-year. All categories of values of imports in US dollar terms (consumer goods, raw materials, capital goods, and fuels) expanded at greater than 20 percent year-on-year (see Table 2). Oil imports grew by 55 percent year-on-year in the first 10 months as oil prices increased by more than 40 percent from last year’s level. Raw material and capital goods imports expanded in both volumes and values with the higher expansion in exports and private investments. Imports of consumer goods also increased sharply by 26.5 percent in the first 10 months as incomes from exports and farm incomes were robust in the first three quarters of the year. However, imports values in all categories have slowed down in October as consumption, exports, and private investment slowed down (see Figure 2). With the exception of fuels, growths in the import volumes have also declined in October year-on-year. Import volume and value growths are expected to decline further next year as demand slows down as well as prices. For the entire 2008, import values of goods are expected to increase by 31 percent, while that in real GDP by 7.1 percent compared to last year’s 9 percent and 2.2 percent, respectively. Next year, import values are projected to increase by only 7 percent, while real imports by 2.8 percent.
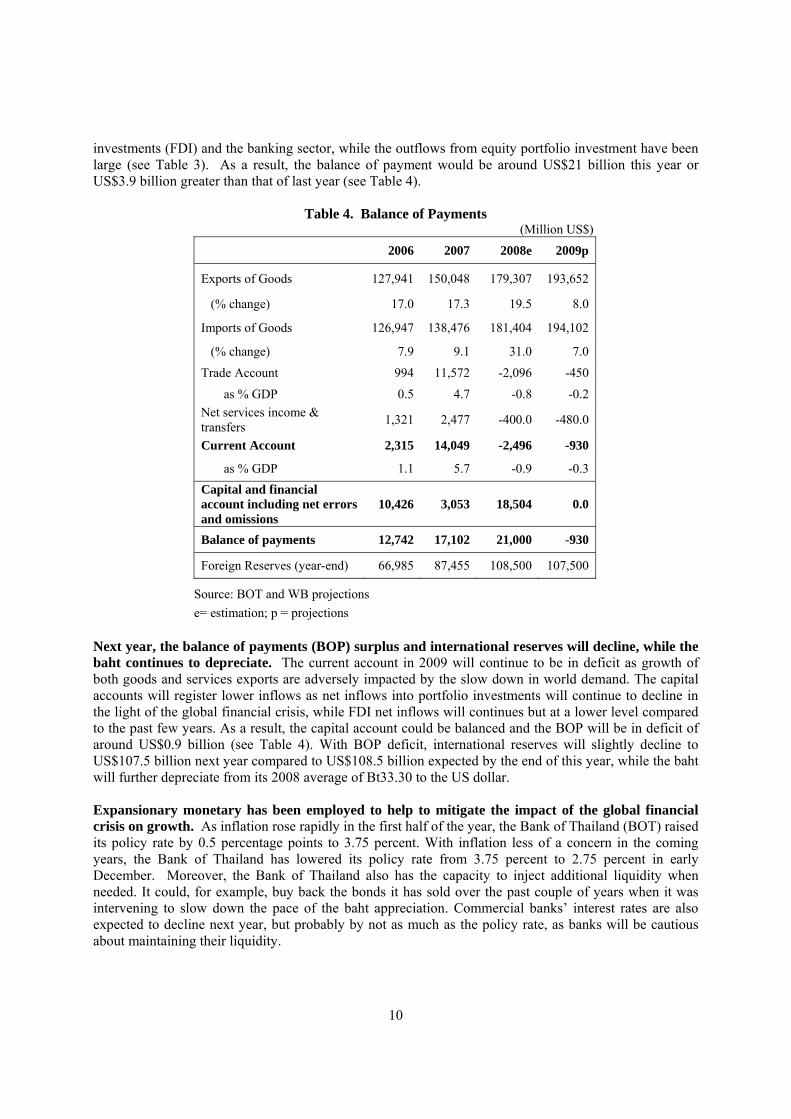
Table 3. Net Capital Flows (Million US$)
2008 2007 Q1 Q2 Q3 Sep Oct
1. Monetary authorities -619 641 -375 -56 -27 -56 2. Government -2,226 446 -190 -96 87 45 3. Bank -1,121 6,851 98 2,955 2,434 2,907 4. Other sectors 1,554 5,421 -1,610 -1,740 -196 702 4.1 Non-Bank 2,768 5,823 -1,207 -1,434 -170 707 FDI 10,199 2,760 2,301 2,500 680 744 - Equity investment 10,217 2,363 2,294 2,370 710 625 - Direct loans -18 396 7 130 -30 119 Portfolio -5,726 3,225 -3,739 -3,590 -839 -126 - Foreign 3,860 603 -887 -2,162 -665 -610 - Equity securities 3,593 52 -921 -2,207 -721 -589 - Debt securities 267 551 33 45 56 -21 - Thai -9,586 2,621 -2,852 -1,427 -174 484 Loans (foreign) 1,356 -1,246 582 -16 42 584 Others -3,061 1,085 -351 -328 -53 -495 4.2 State enterprises -1,214 -402 -402 -307 -26 -5 Total capital flows -2,413 13,360 -2,078 1,063 2,298 3,597
Source: Bank of Thailand
The balance of payments is expected to continue to post a large surplus this year as a result of the large capital flows in the first and last quarters. The balance of payments reached a surplus of US$17.1 billion in 2007 as a result of the large current account surplus of 5.7 percent of GDP. In 2008, the current account has been in deficit since the second quarter of this year, notably due to the increase in imports and reduced exports and service receipts in the second half of the year. On the capital account, net capital inflows were US$17 billion in the first 10 months of the year, particularly from foreign direct
10
investments (FDI) and the banking sector, while the outflows from equity portfolio investment have been large (see Table 3). As a result, the balance of payment would be around US$21 billion this year or US$3.9 billion greater than that of last year (see Table 4).
Table 4. Balance of Payments (Million US$)
2006 2007 2008e 2009p
Exports of Goods 127,941 150,048 179,307 193,652
(% change) 17.0 17.3 19.5 8.0
Imports of Goods 126,947 138,476 181,404 194,102
(% change) 7.9 9.1 31.0 7.0
Trade Account 994 11,572 -2,096 -450
as % GDP 0.5 4.7 -0.8 -0.2 Net services income & transfers 1,321 2,477 -400.0 -480.0
Current Account 2,315 14,049 -2,496 -930
as % GDP 1.1 5.7 -0.9 -0.3 Capital and financial account including net errors and omissions
10,426 3,053 18,504 0.0
Balance of payments 12,742 17,102 21,000 -930
Foreign Reserves (year-end) 66,985 87,455 108,500 107,500
Source: BOT and WB projections e= estimation; p = projections
Next year, the balance of payments (BOP) surplus and international reserves will decline, while the baht continues to depreciate. The current account in 2009 will continue to be in deficit as growth of both goods and services exports are adversely impacted by the slow down in world demand. The capital accounts will register lower inflows as net inflows into portfolio investments will continue to decline in the light of the global financial crisis, while FDI net inflows will continues but at a lower level compared to the past few years. As a result, the capital account could be balanced and the BOP will be in deficit of around US$0.9 billion (see Table 4). With BOP deficit, international reserves will slightly decline to US$107.5 billion next year compared to US$108.5 billion expected by the end of this year, while the baht will further depreciate from its 2008 average of Bt33.30 to the US dollar. Expansionary monetary has been employed to help to mitigate the impact of the global financial crisis on growth. As inflation rose rapidly in the first half of the year, the Bank of Thailand (BOT) raised its policy rate by 0.5 percentage points to 3.75 percent. With inflation less of a concern in the coming years, the Bank of Thailand has lowered its policy rate from 3.75 percent to 2.75 percent in early December. Moreover, the Bank of Thailand also has the capacity to inject additional liquidity when needed. It could, for example, buy back the bonds it has sold over the past couple of years when it was intervening to slow down the pace of the baht appreciation. Commercial banks’ interest rates are also expected to decline next year, but probably by not as much as the policy rate, as banks will be cautious about maintaining their liquidity.
11
Box 1. Government Measures in 2008 to Mitigate the Impacts of the Rise in Inflation and Financial Global Crisis
The government has issued several measures this year aimed at mitigating the impacts of the rise in fuel and food prices as well as of the global financial crisis. These were implemented through tax reduction, direct transfers from the government to institutions at the grassroot level, as well as loans by specialized state-owned financial institutions. The first package announced on March this year aimed at reducing taxes to boost consumption and investment. It included a higher deductible for personal income taxes, a reduction in corporate income tax rates, increased tax deduction on machines and equipment for investment purposes, and reduced property sales transaction fees. The total package is worth Bt40 billion (0.4 percent of GDP). The second package announced in April aimed to assist low income households through grant transfers, reduction in debt for farmers, and increasing extension of micro-credit to the grassroot level. Two additional sets of measures were issued in the second half of this year which aims help reduce household expenditures as well as inject more resources in to the economy. In July, the government introduced a ‘six measures for six months’ policy package which lasts from mid-July 2008 to January 2009 aimed at mitigating the impact of the then rapidly rising inflation on households. Under this package, a total subsidy of around 50 billion baht was divided among six measures, from subsidy of gasoline, water, and electricity to bus and train services. In October, the government has also introduced additional measures to mitigate the impact of the global financial crisis on the financial sector and the tourism sector. This includes injection of liquidity in to the credit market through state-owned specialized financial institutions, injection of investment to the stock market, support the tourism industry, instill confidence in insurance market, and prevent capital outflows through limiting the issuance of baht bonds in Thailand by foreign entities. These measures will add up to around Bt950 billion (US$27 billion). In addition, the government has recently announced the increase in budget deficit by Bt100 billion (US$2.86 billion or 1 percent of GDP) to cover ten areas of expenditures. The additional deficit is now waiting to be approved by the Parliament and is expected to be disbursed by April 2009.
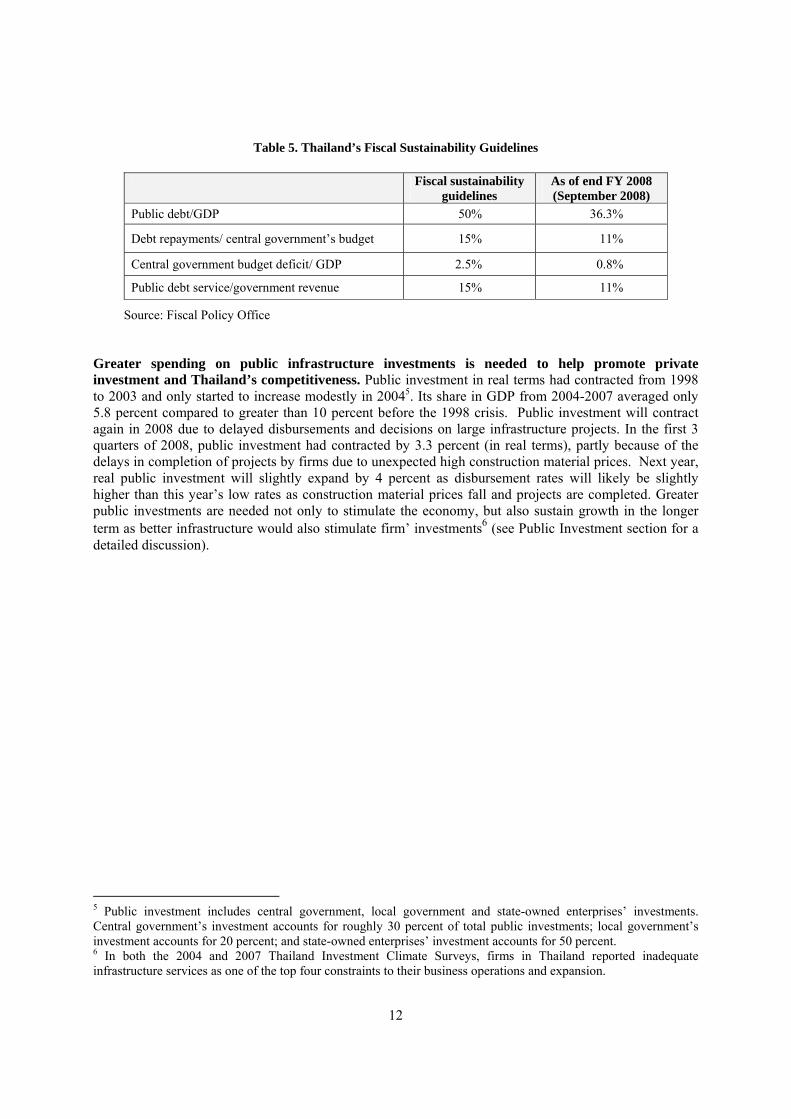
The government’s current fiscal stance allows room for additional fiscal stimulus and stepping up investments over the next few years. In 2008, the government issued four sets of measures – three of them are aimed at mitigating the impact of the rise in food and oil prices on households and businesses and one in October aimed at mitigating the impact of the global financial crisis. It also plans for an additional budget deficit equivalent to 1 percent of GDP (see Box 1). Nevertheless, the Thai government’s fiscal ratios have been within the fiscal sustainability guidelines which have been established since the 1998 Asian financial crisis (see Table 5). At the end of fiscal year 2008 (September 2008), the fiscal ratios remain lower than the guidelines. There is therefore room for the government to pursue additional fiscal stimulus and implemented the needed public investments. With the slow disbursements in both the current and capital expenditures since last year, central government budget deficits was 0.8 percent of GDP in FY2008, which was lower than budgeted (October 2007-September 2008). The Government has set a budget deficit at Bt249.5 billion or 2.5 percent of GDP for the upcoming FY2009. Public debt (includes central government and state-owned enterprises’ guaranteed and non-guaranteed debt) has been falling over the years and was 36.3percent of GDP at end-FY2008.
12
Table 5. Thailand’s Fiscal Sustainability Guidelines
Fiscal sustainability guidelines
As of end FY 2008 (September 2008)
Public debt/GDP 50% 36.3%
Debt repayments/ central government’s budget 15% 11%
Central government budget deficit/ GDP 2.5% 0.8%
Public debt service/government revenue 15% 11%
Source: Fiscal Policy Office Greater spending on public infrastructure investments is needed to help promote private investment and Thailand’s competitiveness. Public investment in real terms had contracted from 1998 to 2003 and only started to increase modestly in 20045. Its share in GDP from 2004-2007 averaged only 5.8 percent compared to greater than 10 percent before the 1998 crisis. Public investment will contract again in 2008 due to delayed disbursements and decisions on large infrastructure projects. In the first 3 quarters of 2008, public investment had contracted by 3.3 percent (in real terms), partly because of the delays in completion of projects by firms due to unexpected high construction material prices. Next year, real public investment will slightly expand by 4 percent as disbursement rates will likely be slightly higher than this year’s low rates as construction material prices fall and projects are completed. Greater public investments are needed not only to stimulate the economy, but also sustain growth in the longer term as better infrastructure would also stimulate firm’ investments6 (see Public Investment section for a detailed discussion).
5 Public investment includes central government, local government and state-owned enterprises’ investments. Central government’s investment accounts for roughly 30 percent of total public investments; local government’s investment accounts for 20 percent; and state-owned enterprises’ investment accounts for 50 percent. 6 In both the 2004 and 2007 Thailand Investment Climate Surveys, firms in Thailand reported inadequate infrastructure services as one of the top four constraints to their business operations and expansion.
13
Box 2. Impact of the Global Financial Crisis
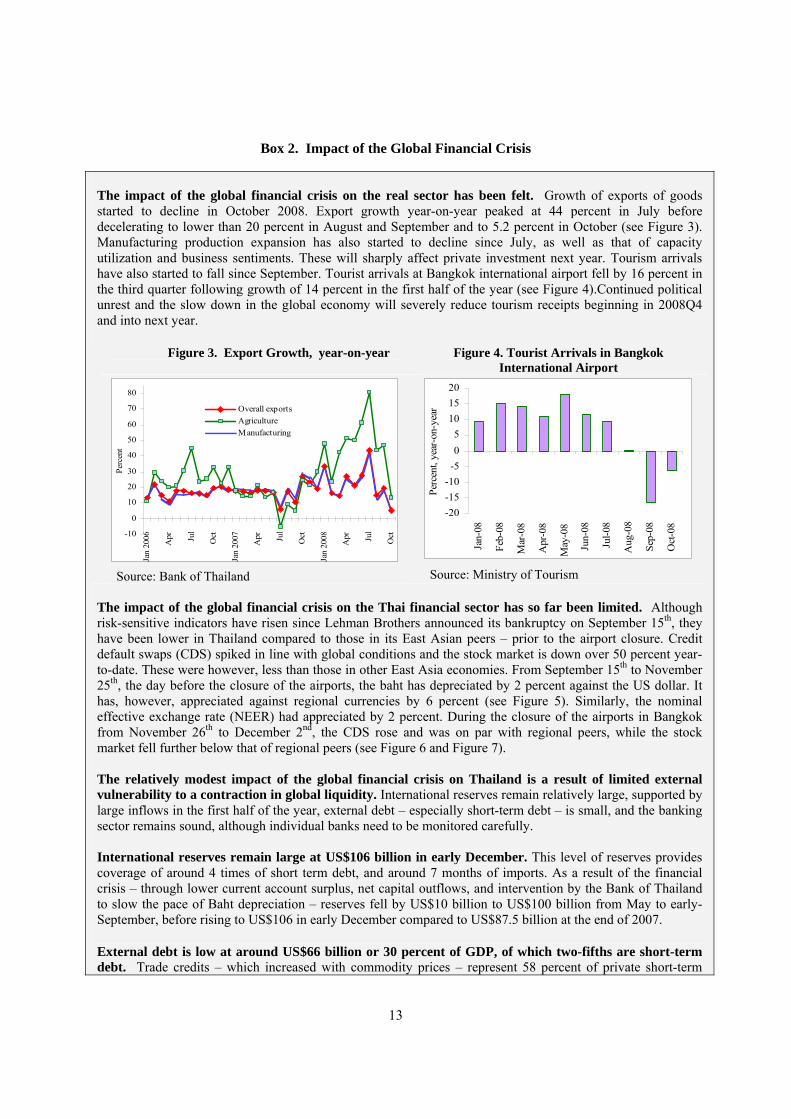
The impact of the global financial crisis on the real sector has been felt. Growth of exports of goods started to decline in October 2008. Export growth year-on-year peaked at 44 percent in July before decelerating to lower than 20 percent in August and September and to 5.2 percent in October (see Figure 3). Manufacturing production expansion has also started to decline since July, as well as that of capacity utilization and business sentiments. These will sharply affect private investment next year. Tourism arrivals have also started to fall since September. Tourist arrivals at Bangkok international airport fell by 16 percent in the third quarter following growth of 14 percent in the first half of the year (see Figure 4).Continued political unrest and the slow down in the global economy will severely reduce tourism receipts beginning in 2008Q4 and into next year.
Figure 3. Export Growth, year-on-year Figure 4. Tourist Arrivals in Bangkok
International Airport
-10
0
10
20
30
40
50
60
70
80
Jan
2006
Apr Ju
l
Oct
Jan
2007
Apr Ju
l
Oct
Jan
2008
Apr Ju
l
Oct
Perc
ent
Overall exportsAgricultureManufacturing
Source: Bank of Thailand
-20-15-10
-505
101520
Jan-
08
Feb-
08
Mar
-08
Apr
-08
May
-08
Jun-
08
Jul-0
8
Aug
-08
Sep-
08
Oct
-08
Perc
ent,
year
-on-
year
Source: Ministry of Tourism
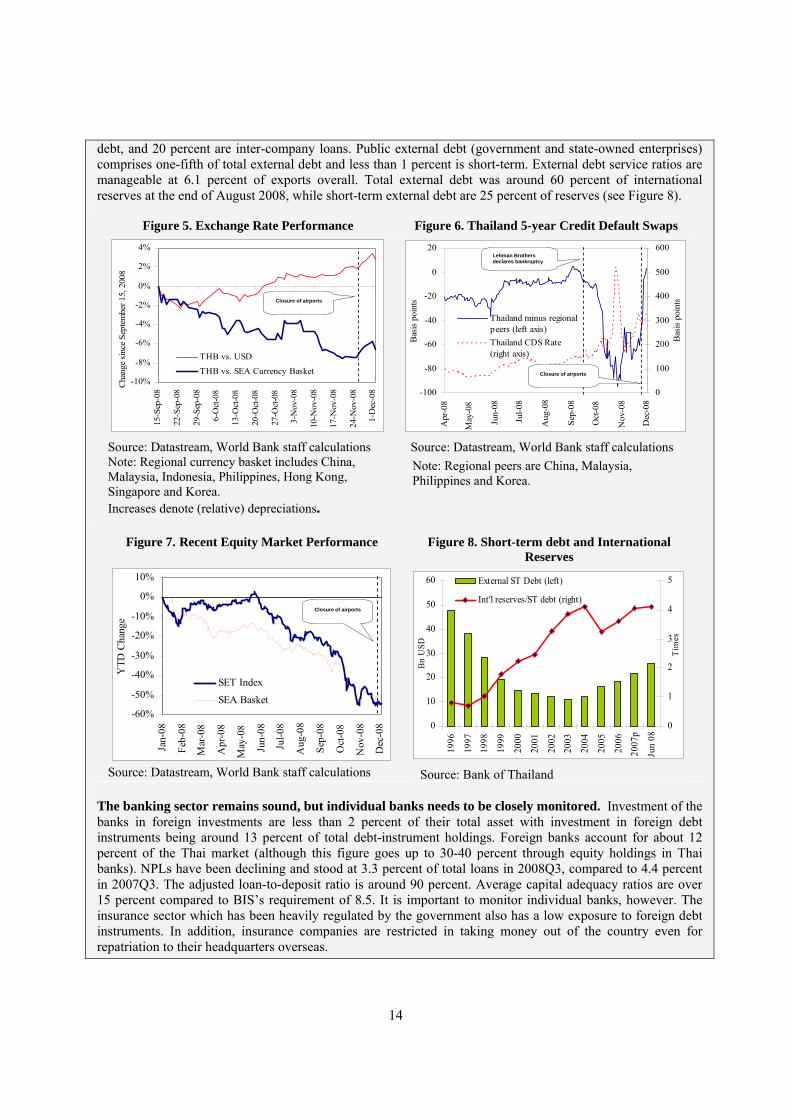
The impact of the global financial crisis on the Thai financial sector has so far been limited. Although risk-sensitive indicators have risen since Lehman Brothers announced its bankruptcy on September 15th, they have been lower in Thailand compared to those in its East Asian peers – prior to the airport closure. Credit default swaps (CDS) spiked in line with global conditions and the stock market is down over 50 percent year-to-date. These were however, less than those in other East Asia economies. From September 15th to November 25th, the day before the closure of the airports, the baht has depreciated by 2 percent against the US dollar. It has, however, appreciated against regional currencies by 6 percent (see Figure 5). Similarly, the nominal effective exchange rate (NEER) had appreciated by 2 percent. During the closure of the airports in Bangkok from November 26th to December 2nd, the CDS rose and was on par with regional peers, while the stock market fell further below that of regional peers (see Figure 6 and Figure 7). The relatively modest impact of the global financial crisis on Thailand is a result of limited external vulnerability to a contraction in global liquidity. International reserves remain relatively large, supported by large inflows in the first half of the year, external debt – especially short-term debt – is small, and the banking sector remains sound, although individual banks need to be monitored carefully. International reserves remain large at US$106 billion in early December. This level of reserves provides coverage of around 4 times of short term debt, and around 7 months of imports. As a result of the financial crisis – through lower current account surplus, net capital outflows, and intervention by the Bank of Thailand to slow the pace of Baht depreciation – reserves fell by US$10 billion to US$100 billion from May to early-September, before rising to US$106 in early December compared to US$87.5 billion at the end of 2007.
External debt is low at around US$66 billion or 30 percent of GDP, of which two-fifths are short-term debt. Trade credits – which increased with commodity prices – represent 58 percent of private short-term
14
debt, and 20 percent are inter-company loans. Public external debt (government and state-owned enterprises) comprises one-fifth of total external debt and less than 1 percent is short-term. External debt service ratios are manageable at 6.1 percent of exports overall. Total external debt was around 60 percent of international reserves at the end of August 2008, while short-term external debt are 25 percent of reserves (see Figure 8).
Figure 5. Exchange Rate Performance Figure 6. Thailand 5-year Credit Default Swaps
-10%
-8%
-6%
-4%
-2%
0%
2%
4%
15-S
ep-0
8
22-S
ep-0
8
29-S
ep-0
8
6-O
ct-0
8
13-O
ct-0
8
20-O
ct-0
8
27-O
ct-0
8
3-N
ov-0
8
10-N
ov-0
8
17-N
ov-0
8
24-N
ov-0
8
1-D
ec-0
8
Cha
nge
sinc
e Se
ptem
ber 1
5, 2
008
THB vs. USD
THB vs. SEA Currency Basket
Source: Datastream, World Bank staff calculations Note: Regional currency basket includes China, Malaysia, Indonesia, Philippines, Hong Kong, Singapore and Korea. Increases denote (relative) depreciations.
-100
-80
-60
-40
-20
0
20
Apr
-08
May
-08
Jun-
08
Jul-0
8
Aug
-08
Sep-
08
Oct
-08
Nov
-08
Dec
-08
Bas
is p
oint
s
0
100
200
300
400
500
600
Bas
is p
oint
s
Thailand minus regionalpeers (left axis)Thailand CDS Rate(right axis)
Source: Datastream, World Bank staff calculations Note: Regional peers are China, Malaysia, Philippines and Korea.
Figure 7. Recent Equity Market Performance Figure 8. Short-term debt and International
Reserves
-60%
-50%
-40%
-30%
-20%
-10%
0%
10%
Jan-
08
Feb-
08
Mar
-08
Apr
-08
May
-08
Jun-
08
Jul-0
8
Aug
-08
Sep-
08
Oct
-08
Nov
-08
Dec
-08
YTD
Cha
nge
SET Index
SEA Basket
Source: Datastream, World Bank staff calculations
0
10
20
30
40
50
60
1996
1997
1998
1999
2000
2001
2002
2003
2004
2005
2006
2007
p
Jun
08
Bn U
SD
0
1
2
3
4
5
Tim
es
External ST Debt (left)
Int'l reserves/ST debt (right)
Source: Bank of Thailand
The banking sector remains sound, but individual banks needs to be closely monitored. Investment of the banks in foreign investments are less than 2 percent of their total asset with investment in foreign debt instruments being around 13 percent of total debt-instrument holdings. Foreign banks account for about 12 percent of the Thai market (although this figure goes up to 30-40 percent through equity holdings in Thai banks). NPLs have been declining and stood at 3.3 percent of total loans in 2008Q3, compared to 4.4 percent in 2007Q3. The adjusted loan-to-deposit ratio is around 90 percent. Average capital adequacy ratios are over 15 percent compared to BIS’s requirement of 8.5. It is important to monitor individual banks, however. The insurance sector which has been heavily regulated by the government also has a low exposure to foreign debt instruments. In addition, insurance companies are restricted in taking money out of the country even for repatriation to their headquarters overseas.
Lehman Brothers declares bankruptcy
Closure of airports
Closure of airports
Closure of airports
15
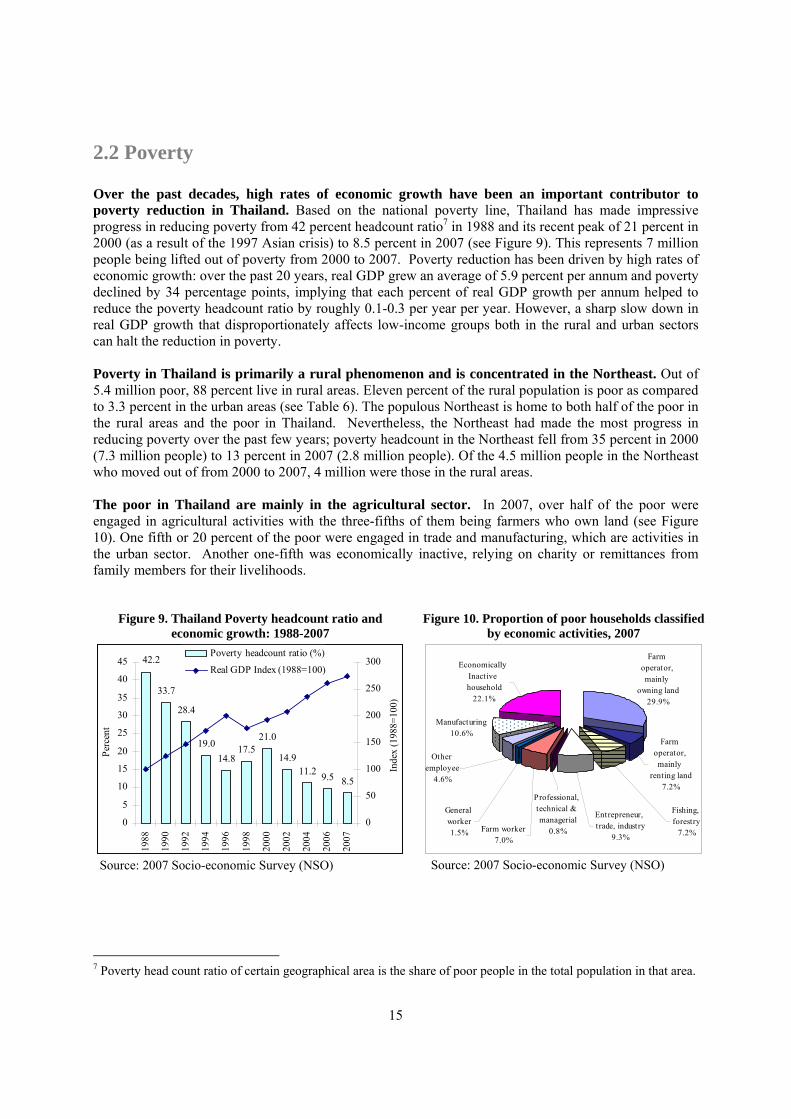
2.2 Poverty Over the past decades, high rates of economic growth have been an important contributor to poverty reduction in Thailand. Based on the national poverty line, Thailand has made impressive progress in reducing poverty from 42 percent headcount ratio7 in 1988 and its recent peak of 21 percent in 2000 (as a result of the 1997 Asian crisis) to 8.5 percent in 2007 (see Figure 9). This represents 7 million people being lifted out of poverty from 2000 to 2007. Poverty reduction has been driven by high rates of economic growth: over the past 20 years, real GDP grew an average of 5.9 percent per annum and poverty declined by 34 percentage points, implying that each percent of real GDP growth per annum helped to reduce the poverty headcount ratio by roughly 0.1-0.3 per year per year. However, a sharp slow down in real GDP growth that disproportionately affects low-income groups both in the rural and urban sectors can halt the reduction in poverty. Poverty in Thailand is primarily a rural phenomenon and is concentrated in the Northeast. Out of 5.4 million poor, 88 percent live in rural areas. Eleven percent of the rural population is poor as compared to 3.3 percent in the urban areas (see Table 6). The populous Northeast is home to both half of the poor in the rural areas and the poor in Thailand. Nevertheless, the Northeast had made the most progress in reducing poverty over the past few years; poverty headcount in the Northeast fell from 35 percent in 2000 (7.3 million people) to 13 percent in 2007 (2.8 million people). Of the 4.5 million people in the Northeast who moved out of from 2000 to 2007, 4 million were those in the rural areas. The poor in Thailand are mainly in the agricultural sector. In 2007, over half of the poor were engaged in agricultural activities with the three-fifths of them being farmers who own land (see Figure 10). One fifth or 20 percent of the poor were engaged in trade and manufacturing, which are activities in the urban sector. Another one-fifth was economically inactive, relying on charity or remittances from family members for their livelihoods.
Figure 9. Thailand Poverty headcount ratio and economic growth: 1988-2007
Figure 10. Proportion of poor households classified by economic activities, 2007
33.7
28.4
19.014.8
17.521.0
14.911.2 9.5 8.5
42.2
0
5
10
15
20
25
30
35
40
45
1988
1990
1992
1994
1996
1998
2000
2002
2004
2006
2007
Perc
ent
0
50
100
150
200
250
300
Inde
x (1
988=
100)
Poverty headcount ratio (%)
Real GDP Index (1988=100)
Source: 2007 Socio-economic Survey (NSO)
Farm operator, mainly
owning land29.9%
Economically Inactive household
22.1%
Manufacturing10.6%
Other employee
4.6%
Entrepreneur, trade, industry
9.3%
Professional, technical & managerial
0.8%
General worker1.5% Farm worker
7.0%
Fishing, forestry
7.2%
Farm operator, mainly
renting land7.2%
Source: 2007 Socio-economic Survey (NSO)
7 Poverty head count ratio of certain geographical area is the share of poor people in the total population in that area.
16
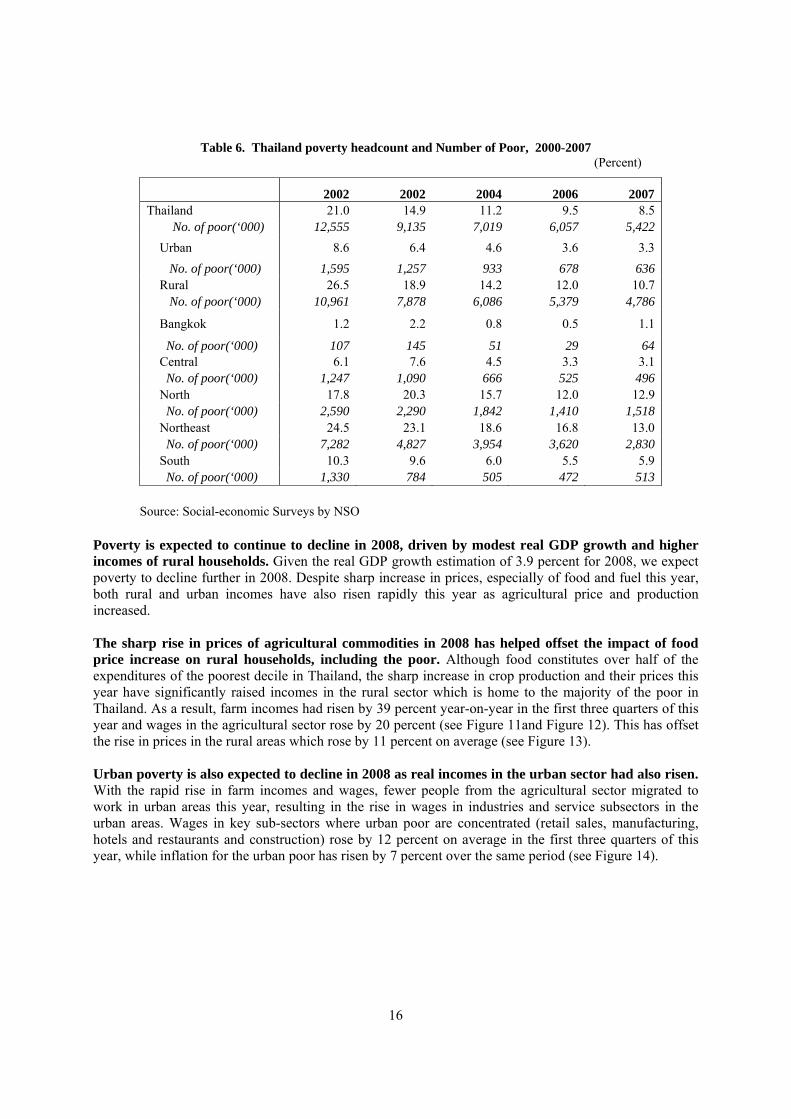
Table 6. Thailand poverty headcount and Number of Poor, 2000-2007 (Percent)
2002 2002 2004 2006 2007 Thailand 21.0 14.9 11.2 9.5 8.5 No. of poor(‘000) 12,555 9,135 7,019 6,057 5,422
Urban 8.6 6.4 4.6 3.6 3.3 No. of poor(‘000) 1,595 1,257 933 678 636 Rural 26.5 18.9 14.2 12.0 10.7 No. of poor(‘000) 10,961 7,878 6,086 5,379 4,786
Bangkok 1.2 2.2 0.8 0.5 1.1
No. of poor(‘000) 107 145 51 29 64 Central 6.1 7.6 4.5 3.3 3.1 No. of poor(‘000) 1,247 1,090 666 525 496 North 17.8 20.3 15.7 12.0 12.9 No. of poor(‘000) 2,590 2,290 1,842 1,410 1,518 Northeast 24.5 23.1 18.6 16.8 13.0 No. of poor(‘000) 7,282 4,827 3,954 3,620 2,830 South 10.3 9.6 6.0 5.5 5.9
No. of poor(‘000) 1,330 784 505 472 513
Source: Social-economic Surveys by NSO
Poverty is expected to continue to decline in 2008, driven by modest real GDP growth and higher incomes of rural households. Given the real GDP growth estimation of 3.9 percent for 2008, we expect poverty to decline further in 2008. Despite sharp increase in prices, especially of food and fuel this year, both rural and urban incomes have also risen rapidly this year as agricultural price and production increased.
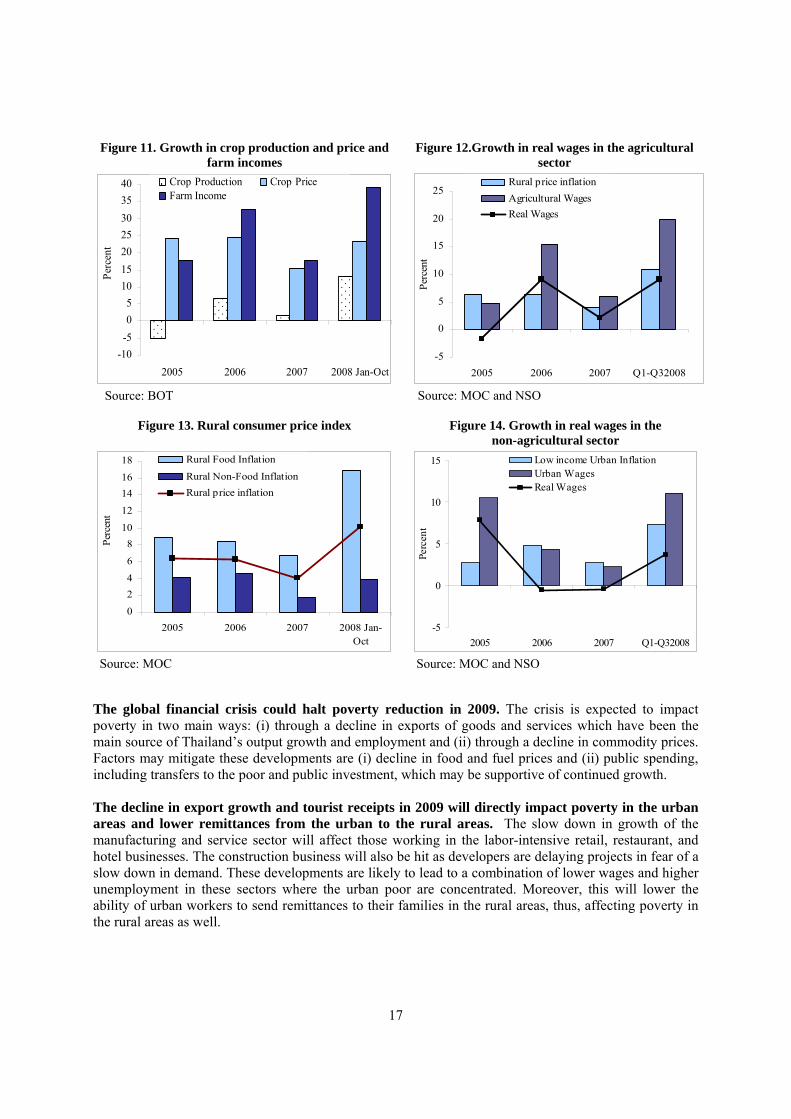
The sharp rise in prices of agricultural commodities in 2008 has helped offset the impact of food price increase on rural households, including the poor. Although food constitutes over half of the expenditures of the poorest decile in Thailand, the sharp increase in crop production and their prices this year have significantly raised incomes in the rural sector which is home to the majority of the poor in Thailand. As a result, farm incomes had risen by 39 percent year-on-year in the first three quarters of this year and wages in the agricultural sector rose by 20 percent (see Figure 11and Figure 12). This has offset the rise in prices in the rural areas which rose by 11 percent on average (see Figure 13). Urban poverty is also expected to decline in 2008 as real incomes in the urban sector had also risen. With the rapid rise in farm incomes and wages, fewer people from the agricultural sector migrated to work in urban areas this year, resulting in the rise in wages in industries and service subsectors in the urban areas. Wages in key sub-sectors where urban poor are concentrated (retail sales, manufacturing, hotels and restaurants and construction) rose by 12 percent on average in the first three quarters of this year, while inflation for the urban poor has risen by 7 percent over the same period (see Figure 14).
17
Figure 11. Growth in crop production and price and farm incomes
Figure 12.Growth in real wages in the agricultural sector
-10-505
10152025303540
2005 2006 2007 2008 Jan-Oct
Perc
ent
Crop Production Crop PriceFarm Income
Source: BOT
-5
0
5
10
15
20
25
2005 2006 2007 Q1-Q32008
Perc
ent
Rural price inflationAgricultural WagesReal Wages
Source: MOC and NSO
Figure 13. Rural consumer price index Figure 14. Growth in real wages in the non-agricultural sector
0
24
6
810
12
1416
18
2005 2006 2007 2008 Jan-Oct
Perc
ent
Rural Food Inflation
Rural Non-Food InflationRural price inflation
Source: MOC
-5
0
5
10
15
2005 2006 2007 Q1-Q32008
Perc
ent
Low income Urban InflationUrban WagesReal Wages
Source: MOC and NSO
The global financial crisis could halt poverty reduction in 2009. The crisis is expected to impact poverty in two main ways: (i) through a decline in exports of goods and services which have been the main source of Thailand’s output growth and employment and (ii) through a decline in commodity prices. Factors may mitigate these developments are (i) decline in food and fuel prices and (ii) public spending, including transfers to the poor and public investment, which may be supportive of continued growth. The decline in export growth and tourist receipts in 2009 will directly impact poverty in the urban areas and lower remittances from the urban to the rural areas. The slow down in growth of the manufacturing and service sector will affect those working in the labor-intensive retail, restaurant, and hotel businesses. The construction business will also be hit as developers are delaying projects in fear of a slow down in demand. These developments are likely to lead to a combination of lower wages and higher unemployment in these sectors where the urban poor are concentrated. Moreover, this will lower the ability of urban workers to send remittances to their families in the rural areas, thus, affecting poverty in the rural areas as well.
18
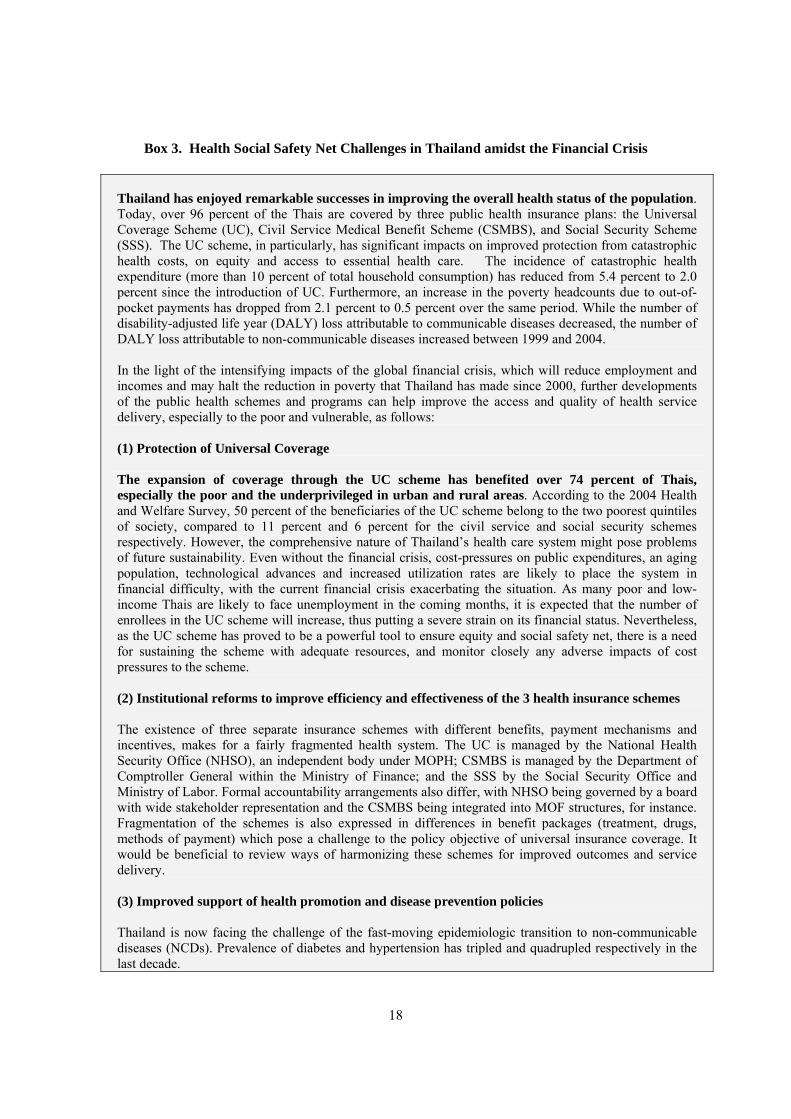
Box 3. Health Social Safety Net Challenges in Thailand amidst the Financial Crisis
Thailand has enjoyed remarkable successes in improving the overall health status of the population. Today, over 96 percent of the Thais are covered by three public health insurance plans: the Universal Coverage Scheme (UC), Civil Service Medical Benefit Scheme (CSMBS), and Social Security Scheme (SSS). The UC scheme, in particularly, has significant impacts on improved protection from catastrophic health costs, on equity and access to essential health care. The incidence of catastrophic health expenditure (more than 10 percent of total household consumption) has reduced from 5.4 percent to 2.0 percent since the introduction of UC. Furthermore, an increase in the poverty headcounts due to out-of-pocket payments has dropped from 2.1 percent to 0.5 percent over the same period. While the number of disability-adjusted life year (DALY) loss attributable to communicable diseases decreased, the number of DALY loss attributable to non-communicable diseases increased between 1999 and 2004. In the light of the intensifying impacts of the global financial crisis, which will reduce employment and incomes and may halt the reduction in poverty that Thailand has made since 2000, further developments of the public health schemes and programs can help improve the access and quality of health service delivery, especially to the poor and vulnerable, as follows: (1) Protection of Universal Coverage The expansion of coverage through the UC scheme has benefited over 74 percent of Thais, especially the poor and the underprivileged in urban and rural areas. According to the 2004 Health and Welfare Survey, 50 percent of the beneficiaries of the UC scheme belong to the two poorest quintiles of society, compared to 11 percent and 6 percent for the civil service and social security schemes respectively. However, the comprehensive nature of Thailand’s health care system might pose problems of future sustainability. Even without the financial crisis, cost-pressures on public expenditures, an aging population, technological advances and increased utilization rates are likely to place the system in financial difficulty, with the current financial crisis exacerbating the situation. As many poor and low-income Thais are likely to face unemployment in the coming months, it is expected that the number of enrollees in the UC scheme will increase, thus putting a severe strain on its financial status. Nevertheless, as the UC scheme has proved to be a powerful tool to ensure equity and social safety net, there is a need for sustaining the scheme with adequate resources, and monitor closely any adverse impacts of cost pressures to the scheme. (2) Institutional reforms to improve efficiency and effectiveness of the 3 health insurance schemes The existence of three separate insurance schemes with different benefits, payment mechanisms and incentives, makes for a fairly fragmented health system. The UC is managed by the National Health Security Office (NHSO), an independent body under MOPH; CSMBS is managed by the Department of Comptroller General within the Ministry of Finance; and the SSS by the Social Security Office and Ministry of Labor. Formal accountability arrangements also differ, with NHSO being governed by a board with wide stakeholder representation and the CSMBS being integrated into MOF structures, for instance. Fragmentation of the schemes is also expressed in differences in benefit packages (treatment, drugs, methods of payment) which pose a challenge to the policy objective of universal insurance coverage. It would be beneficial to review ways of harmonizing these schemes for improved outcomes and service delivery. (3) Improved support of health promotion and disease prevention policies Thailand is now facing the challenge of the fast-moving epidemiologic transition to non-communicable diseases (NCDs). Prevalence of diabetes and hypertension has tripled and quadrupled respectively in the last decade.
19
Like many other industrial, middle and upper lower-income countries, NCDs in Thailand are no longer exclusively affecting the wealthier segments of society, but also hitting the poor. Thailand is currently spending about 0.25 percent of its GDP on disease prevention and health promotion (P&P). Given the sharp rise in NCDs incidence, there is an on-going discussion about the need to double public expenditure on P&P as well as on sustaining HIV prevention efforts. Less disabilities and chronic diseases will increase productivity and labor participation, as well as contribute to economic growth, and the long-term sustainability of the UC scheme.
A decline in the prices of key crops in 2009 is likely to have a negative net impact on poor rural households. The prices of key crops are expected to fall from their 2008 record high levels by around 25-30%, while their production is estimated to continue growing by around 15%. This will likely reduce farm incomes from their high levels this year by more than the decline in inflation. Thus, real farm incomes will likely decline from that in 208. This will affect the poor or low-income households that are engaged in farming activities. The government has issued several set of measures in 2008 aimed at mitigating the negative impacts of the crises on low income households. These were implemented through tax reduction, direct transfers from the government to grassroot levels, as well as loan extension by the state-owned specialized financial institutions. The first package announced on March 2008 was aimed at reducing taxes to boost consumption and investment. It included a higher deductible for personal income taxes, a reduction in corporate income tax rates, increased tax deduction on machines and equipment for investment purposes, and reduced property sales transaction fees. The total package is worth Bt40 billion (US$1.14 billion or 0.4 percent of GDP). The second package announced in April aimed to assist low income households through grant transfers, reduction in debt for farmers, and increasing extension of micro-credit to the grassroot level totaling up to Bt445.8 billion (US$12.7 billion). In July, the government introduced a third set of ‘six measures for six months’ policy package which lasts from mid-July 2008 to January 2009 aimed at mitigating the impact of the then rapidly rising inflation on poor households. Under this package, a total subsidy of around 50 billion baht (US$1.4 billion) was divided among six measures, from subsidy of transportation fuel, water, and electricity to bus and train services. These policy responses are helpful, but more needs to be done to address the potential for urban unemployment and declining rural and urban incomes of the poorest households. The Government may also take this opportunity to accelerate the implementation of certain social safety net policies, such as increasing the length of eligibility for unemployment insurance benefits, targeted transfers to the poorest districts in the poorest regions, and transfers targeted at schools in poor districts. Since poverty in Thailand is geographically concentrated, geographical targeting, such as through the use of poverty maps, may help direct the benefits on those most vulnerable. Transfers targeted at schools in poor districts, such as though a generous school feeding program, may prevent parents from removing children from schools when income declines. Further development of public health schemes can also help provide a strong social safety net for the poor (see Box 3).
20
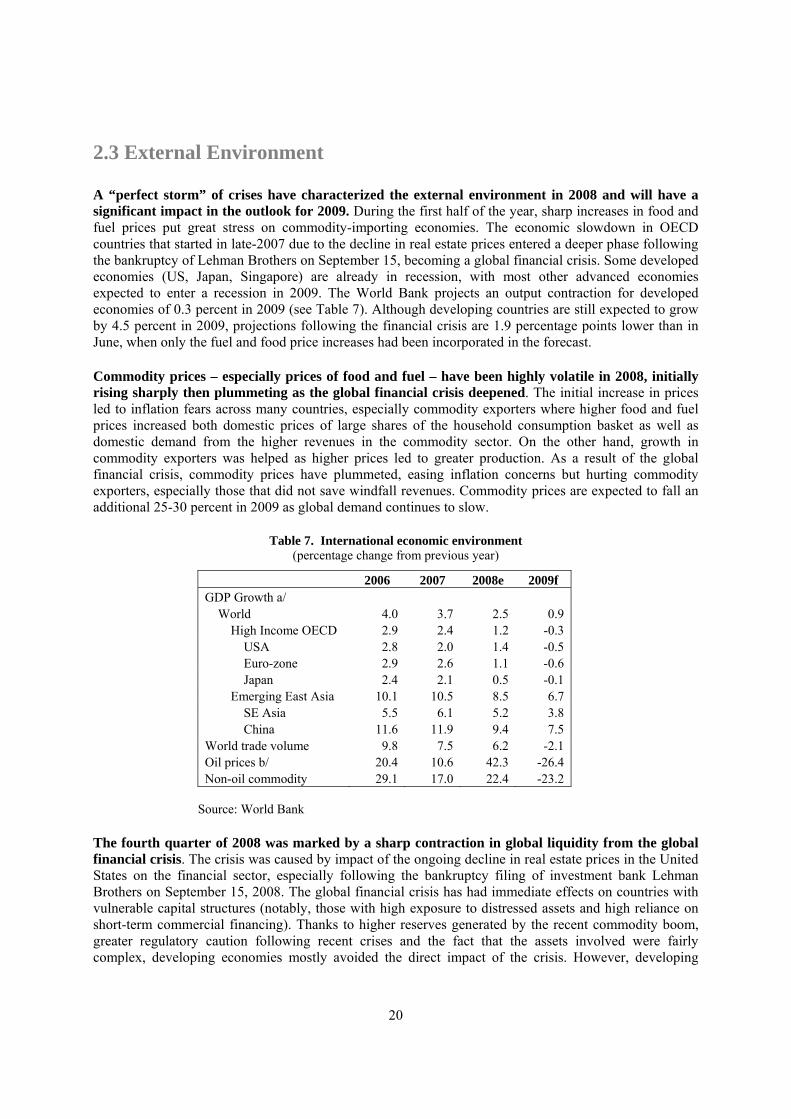
2.3 External Environment A “perfect storm” of crises have characterized the external environment in 2008 and will have a significant impact in the outlook for 2009. During the first half of the year, sharp increases in food and fuel prices put great stress on commodity-importing economies. The economic slowdown in OECD countries that started in late-2007 due to the decline in real estate prices entered a deeper phase following the bankruptcy of Lehman Brothers on September 15, becoming a global financial crisis. Some developed economies (US, Japan, Singapore) are already in recession, with most other advanced economies expected to enter a recession in 2009. The World Bank projects an output contraction for developed economies of 0.3 percent in 2009 (see Table 7). Although developing countries are still expected to grow by 4.5 percent in 2009, projections following the financial crisis are 1.9 percentage points lower than in June, when only the fuel and food price increases had been incorporated in the forecast. Commodity prices – especially prices of food and fuel – have been highly volatile in 2008, initially rising sharply then plummeting as the global financial crisis deepened. The initial increase in prices led to inflation fears across many countries, especially commodity exporters where higher food and fuel prices increased both domestic prices of large shares of the household consumption basket as well as domestic demand from the higher revenues in the commodity sector. On the other hand, growth in commodity exporters was helped as higher prices led to greater production. As a result of the global financial crisis, commodity prices have plummeted, easing inflation concerns but hurting commodity exporters, especially those that did not save windfall revenues. Commodity prices are expected to fall an additional 25-30 percent in 2009 as global demand continues to slow.
Table 7. International economic environment
(percentage change from previous year)
2006 2007 2008e 2009f GDP Growth a/
World 4.0 3.7 2.5 0.9 High Income OECD 2.9 2.4 1.2 -0.3
USA 2.8 2.0 1.4 -0.5 Euro-zone 2.9 2.6 1.1 -0.6 Japan 2.4 2.1 0.5 -0.1
Emerging East Asia 10.1 10.5 8.5 6.7 SE Asia 5.5 6.1 5.2 3.8 China 11.6 11.9 9.4 7.5
World trade volume 9.8 7.5 6.2 -2.1 Oil prices b/ 20.4 10.6 42.3 -26.4 Non-oil commodity 29.1 17.0 22.4 -23.2
Source: World Bank
The fourth quarter of 2008 was marked by a sharp contraction in global liquidity from the global financial crisis. The crisis was caused by impact of the ongoing decline in real estate prices in the United States on the financial sector, especially following the bankruptcy filing of investment bank Lehman Brothers on September 15, 2008. The global financial crisis has had immediate effects on countries with vulnerable capital structures (notably, those with high exposure to distressed assets and high reliance on short-term commercial financing). Thanks to higher reserves generated by the recent commodity boom, greater regulatory caution following recent crises and the fact that the assets involved were fairly complex, developing economies mostly avoided the direct impact of the crisis. However, developing
21
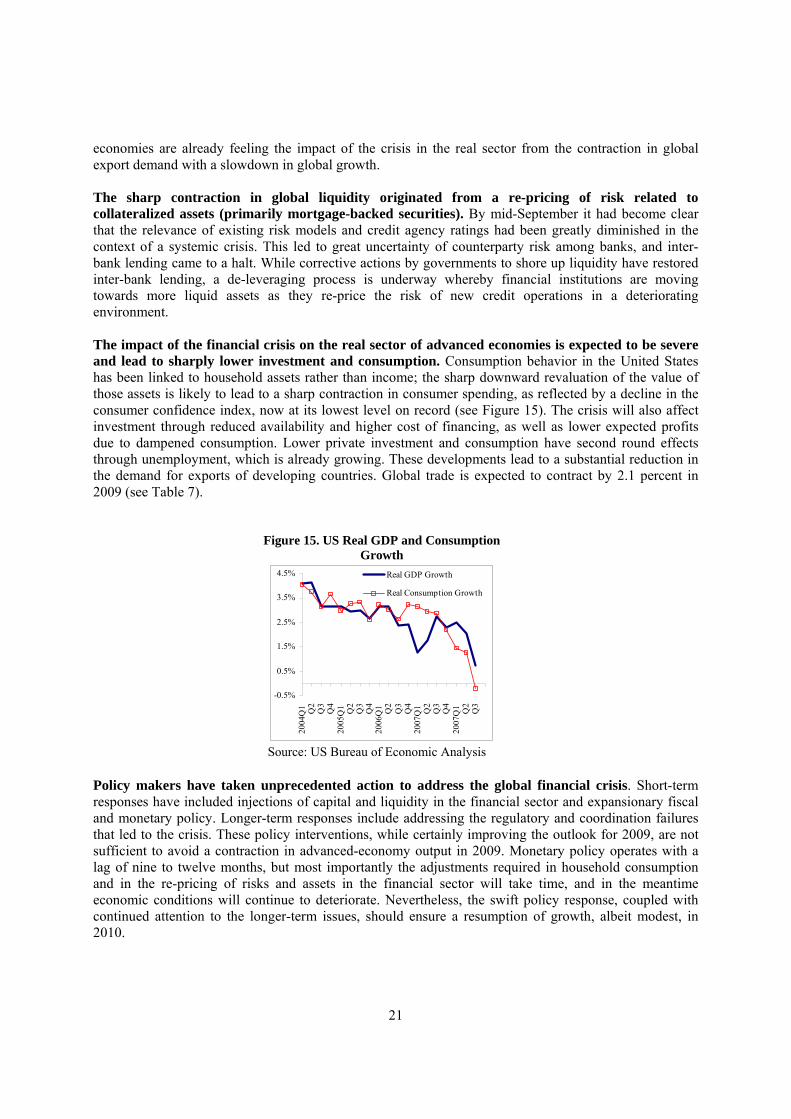
economies are already feeling the impact of the crisis in the real sector from the contraction in global export demand with a slowdown in global growth. The sharp contraction in global liquidity originated from a re-pricing of risk related to collateralized assets (primarily mortgage-backed securities). By mid-September it had become clear that the relevance of existing risk models and credit agency ratings had been greatly diminished in the context of a systemic crisis. This led to great uncertainty of counterparty risk among banks, and inter-bank lending came to a halt. While corrective actions by governments to shore up liquidity have restored inter-bank lending, a de-leveraging process is underway whereby financial institutions are moving towards more liquid assets as they re-price the risk of new credit operations in a deteriorating environment. The impact of the financial crisis on the real sector of advanced economies is expected to be severe and lead to sharply lower investment and consumption. Consumption behavior in the United States has been linked to household assets rather than income; the sharp downward revaluation of the value of those assets is likely to lead to a sharp contraction in consumer spending, as reflected by a decline in the consumer confidence index, now at its lowest level on record (see Figure 15). The crisis will also affect investment through reduced availability and higher cost of financing, as well as lower expected profits due to dampened consumption. Lower private investment and consumption have second round effects through unemployment, which is already growing. These developments lead to a substantial reduction in the demand for exports of developing countries. Global trade is expected to contract by 2.1 percent in 2009 (see Table 7).
Figure 15. US Real GDP and Consumption Growth
-0.5%
0.5%
1.5%
2.5%
3.5%
4.5%
200
4Q1 Q2
Q3
Q4
200
5Q1 Q2
Q3
Q4
200
6Q1 Q2
Q3
Q4
200
7Q1 Q2
Q3
Q4
200
7Q1 Q2
Q3
Real GDP Growth
Real Consumption Growth
Source: US Bureau of Economic Analysis
Policy makers have taken unprecedented action to address the global financial crisis. Short-term responses have included injections of capital and liquidity in the financial sector and expansionary fiscal and monetary policy. Longer-term responses include addressing the regulatory and coordination failures that led to the crisis. These policy interventions, while certainly improving the outlook for 2009, are not sufficient to avoid a contraction in advanced-economy output in 2009. Monetary policy operates with a lag of nine to twelve months, but most importantly the adjustments required in household consumption and in the re-pricing of risks and assets in the financial sector will take time, and in the meantime economic conditions will continue to deteriorate. Nevertheless, the swift policy response, coupled with continued attention to the longer-term issues, should ensure a resumption of growth, albeit modest, in 2010.
22
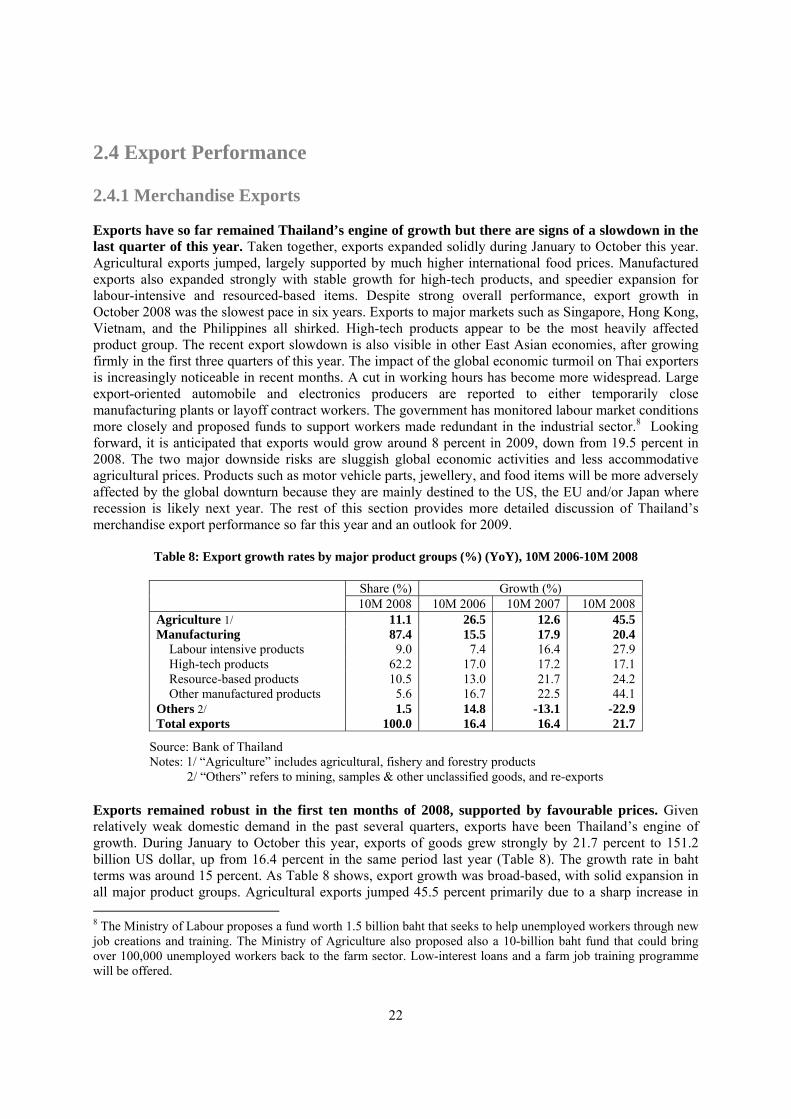
2.4 Export Performance 2.4.1 Merchandise Exports Exports have so far remained Thailand’s engine of growth but there are signs of a slowdown in the last quarter of this year. Taken together, exports expanded solidly during January to October this year. Agricultural exports jumped, largely supported by much higher international food prices. Manufactured exports also expanded strongly with stable growth for high-tech products, and speedier expansion for labour-intensive and resourced-based items. Despite strong overall performance, export growth in October 2008 was the slowest pace in six years. Exports to major markets such as Singapore, Hong Kong, Vietnam, and the Philippines all shirked. High-tech products appear to be the most heavily affected product group. The recent export slowdown is also visible in other East Asian economies, after growing firmly in the first three quarters of this year. The impact of the global economic turmoil on Thai exporters is increasingly noticeable in recent months. A cut in working hours has become more widespread. Large export-oriented automobile and electronics producers are reported to either temporarily close manufacturing plants or layoff contract workers. The government has monitored labour market conditions more closely and proposed funds to support workers made redundant in the industrial sector.8 Looking forward, it is anticipated that exports would grow around 8 percent in 2009, down from 19.5 percent in 2008. The two major downside risks are sluggish global economic activities and less accommodative agricultural prices. Products such as motor vehicle parts, jewellery, and food items will be more adversely affected by the global downturn because they are mainly destined to the US, the EU and/or Japan where recession is likely next year. The rest of this section provides more detailed discussion of Thailand’s merchandise export performance so far this year and an outlook for 2009.
Table 8: Export growth rates by major product groups (%) (YoY), 10M 2006-10M 2008
Share (%) Growth (%) 10M 2008 10M 2006 10M 2007 10M 2008 Agriculture 1/ 11.1 26.5 12.6 45.5 Manufacturing 87.4 15.5 17.9 20.4
Labour intensive products 9.0 7.4 16.4 27.9 High-tech products 62.2 17.0 17.2 17.1 Resource-based products 10.5 13.0 21.7 24.2 Other manufactured products 5.6 16.7 22.5 44.1
Others 2/ 1.5 14.8 -13.1 -22.9 Total exports 100.0 16.4 16.4 21.7
Source: Bank of Thailand Notes: 1/ “Agriculture” includes agricultural, fishery and forestry products
2/ “Others” refers to mining, samples & other unclassified goods, and re-exports Exports remained robust in the first ten months of 2008, supported by favourable prices. Given relatively weak domestic demand in the past several quarters, exports have been Thailand’s engine of growth. During January to October this year, exports of goods grew strongly by 21.7 percent to 151.2 billion US dollar, up from 16.4 percent in the same period last year (Table 8). The growth rate in baht terms was around 15 percent. As Table 8 shows, export growth was broad-based, with solid expansion in all major product groups. Agricultural exports jumped 45.5 percent primarily due to a sharp increase in 8 The Ministry of Labour proposes a fund worth 1.5 billion baht that seeks to help unemployed workers through new job creations and training. The Ministry of Agriculture also proposed also a 10-billion baht fund that could bring over 100,000 unemployed workers back to the farm sector. Low-interest loans and a farm job training programme will be offered.
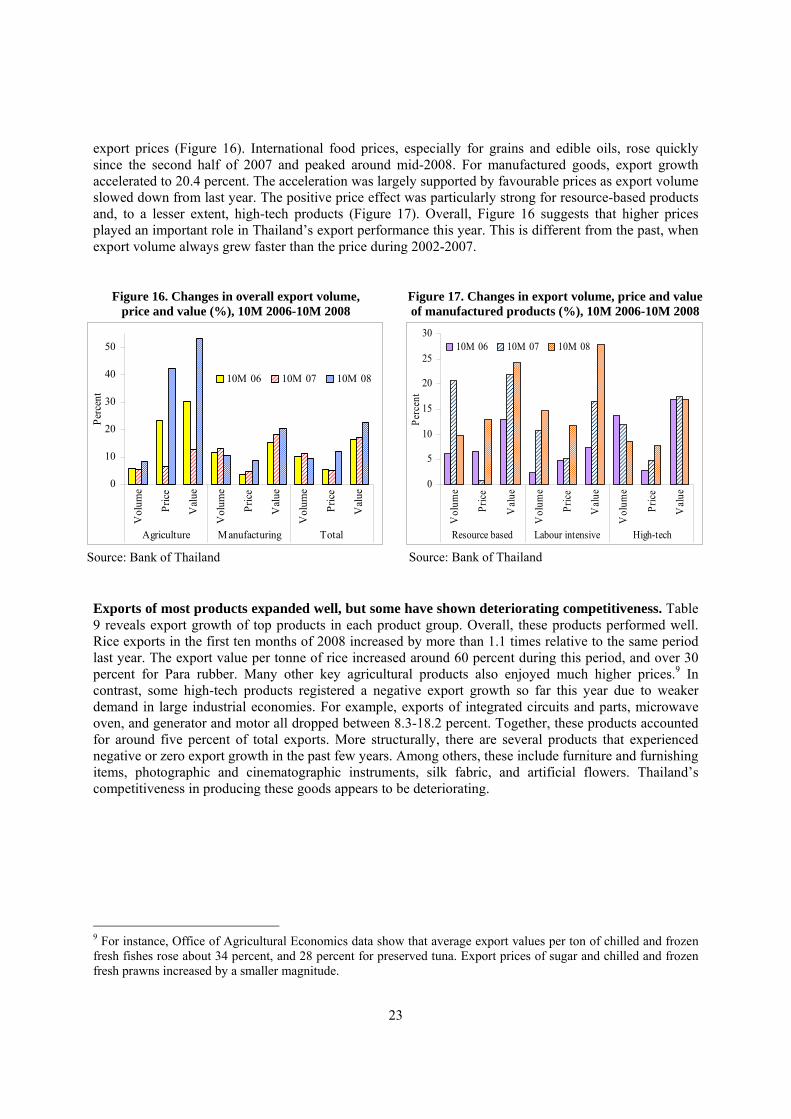
23
export prices (Figure 16). International food prices, especially for grains and edible oils, rose quickly since the second half of 2007 and peaked around mid-2008. For manufactured goods, export growth accelerated to 20.4 percent. The acceleration was largely supported by favourable prices as export volume slowed down from last year. The positive price effect was particularly strong for resource-based products and, to a lesser extent, high-tech products (Figure 17). Overall, Figure 16 suggests that higher prices played an important role in Thailand’s export performance this year. This is different from the past, when export volume always grew faster than the price during 2002-2007.
Figure 16. Changes in overall export volume, price and value (%), 10M 2006-10M 2008
0
10
20
30
40
50
Vol
ume
Pric
e
Val
ue
Vol
ume
Pric
e
Val
ue
Vol
ume
Pric
e
Val
ue
Agriculture Manufacturing Total
Perc
ent
10M 06 10M 07 10M 08
Source: Bank of Thailand
Figure 17. Changes in export volume, price and value of manufactured products (%), 10M 2006-10M 2008
0
5
10
15
20
25
30
Vol
ume
Pric
e
Val
ue
Vol
ume
Pric
e
Val
ue
Vol
ume
Pric
e
Val
ue
Resource based Labour intensive High-tech
Perc
ent
10M 06 10M 07 10M 08
Source: Bank of Thailand
Exports of most products expanded well, but some have shown deteriorating competitiveness. Table 9 reveals export growth of top products in each product group. Overall, these products performed well. Rice exports in the first ten months of 2008 increased by more than 1.1 times relative to the same period last year. The export value per tonne of rice increased around 60 percent during this period, and over 30 percent for Para rubber. Many other key agricultural products also enjoyed much higher prices.9 In contrast, some high-tech products registered a negative export growth so far this year due to weaker demand in large industrial economies. For example, exports of integrated circuits and parts, microwave oven, and generator and motor all dropped between 8.3-18.2 percent. Together, these products accounted for around five percent of total exports. More structurally, there are several products that experienced negative or zero export growth in the past few years. Among others, these include furniture and furnishing items, photographic and cinematographic instruments, silk fabric, and artificial flowers. Thailand’s competitiveness in producing these goods appears to be deteriorating.
9 For instance, Office of Agricultural Economics data show that average export values per ton of chilled and frozen fresh fishes rose about 34 percent, and 28 percent for preserved tuna. Export prices of sugar and chilled and frozen fresh prawns increased by a smaller magnitude.
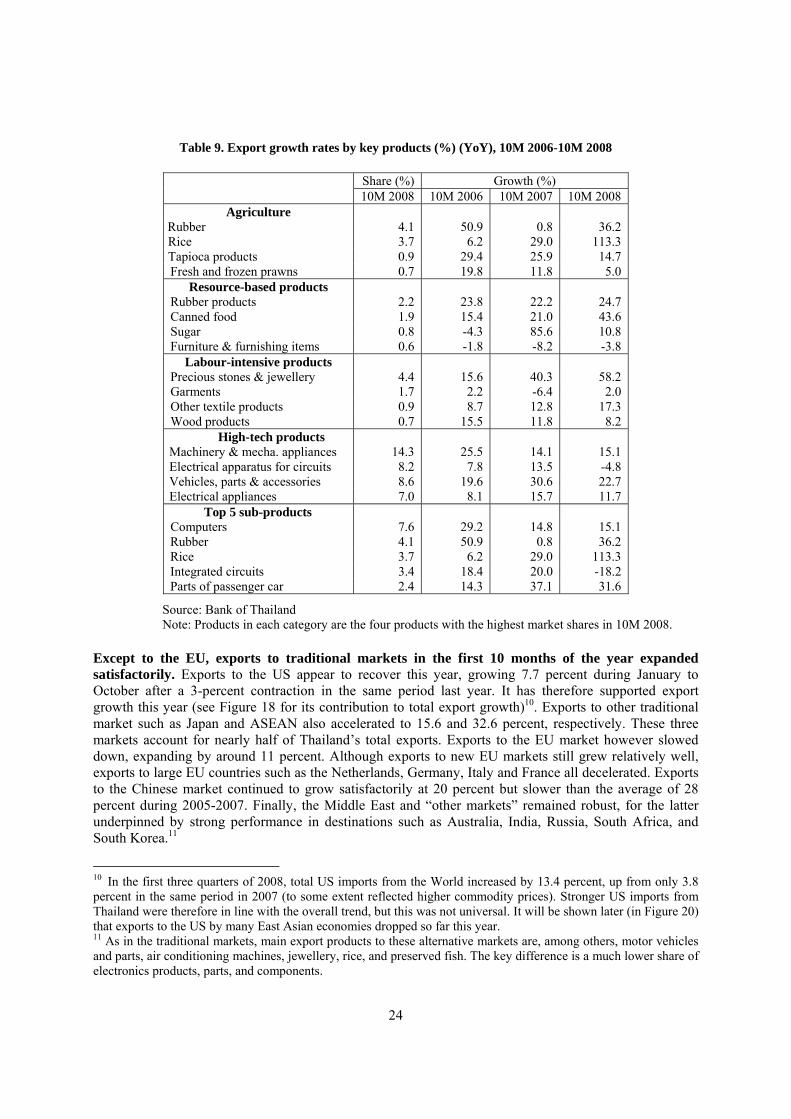
24
Table 9. Export growth rates by key products (%) (YoY), 10M 2006-10M 2008
Share (%) Growth (%) 10M 2008 10M 2006 10M 2007 10M 2008
Agriculture Rubber 4.1 50.9 0.8 36.2 Rice 3.7 6.2 29.0 113.3 Tapioca products 0.9 29.4 25.9 14.7 Fresh and frozen prawns 0.7 19.8 11.8 5.0
Resource-based products Rubber products 2.2 23.8 22.2 24.7 Canned food 1.9 15.4 21.0 43.6 Sugar 0.8 -4.3 85.6 10.8 Furniture & furnishing items 0.6 -1.8 -8.2 -3.8
Labour-intensive products Precious stones & jewellery 4.4 15.6 40.3 58.2 Garments 1.7 2.2 -6.4 2.0 Other textile products 0.9 8.7 12.8 17.3 Wood products 0.7 15.5 11.8 8.2
High-tech products Machinery & mecha. appliances 14.3 25.5 14.1 15.1 Electrical apparatus for circuits 8.2 7.8 13.5 -4.8 Vehicles, parts & accessories 8.6 19.6 30.6 22.7 Electrical appliances 7.0 8.1 15.7 11.7
Top 5 sub-products Computers 7.6 29.2 14.8 15.1 Rubber 4.1 50.9 0.8 36.2 Rice 3.7 6.2 29.0 113.3 Integrated circuits 3.4 18.4 20.0 -18.2 Parts of passenger car 2.4 14.3 37.1 31.6
Source: Bank of Thailand Note: Products in each category are the four products with the highest market shares in 10M 2008.
Except to the EU, exports to traditional markets in the first 10 months of the year expanded satisfactorily. Exports to the US appear to recover this year, growing 7.7 percent during January to October after a 3-percent contraction in the same period last year. It has therefore supported export growth this year (see Figure 18 for its contribution to total export growth)10. Exports to other traditional market such as Japan and ASEAN also accelerated to 15.6 and 32.6 percent, respectively. These three markets account for nearly half of Thailand’s total exports. Exports to the EU market however slowed down, expanding by around 11 percent. Although exports to new EU markets still grew relatively well, exports to large EU countries such as the Netherlands, Germany, Italy and France all decelerated. Exports to the Chinese market continued to grow satisfactorily at 20 percent but slower than the average of 28 percent during 2005-2007. Finally, the Middle East and “other markets” remained robust, for the latter underpinned by strong performance in destinations such as Australia, India, Russia, South Africa, and South Korea.11
10
In the first three quarters of 2008, total US imports from the World increased by 13.4 percent, up from only 3.8 percent in the same period in 2007 (to some extent reflected higher commodity prices). Stronger US imports from Thailand were therefore in line with the overall trend, but this was not universal. It will be shown later (in Figure 20) that exports to the US by many East Asian economies dropped so far this year. 11 As in the traditional markets, main export products to these alternative markets are, among others, motor vehicles and parts, air conditioning machines, jewellery, rice, and preserved fish. The key difference is a much lower share of electronics products, parts, and components.
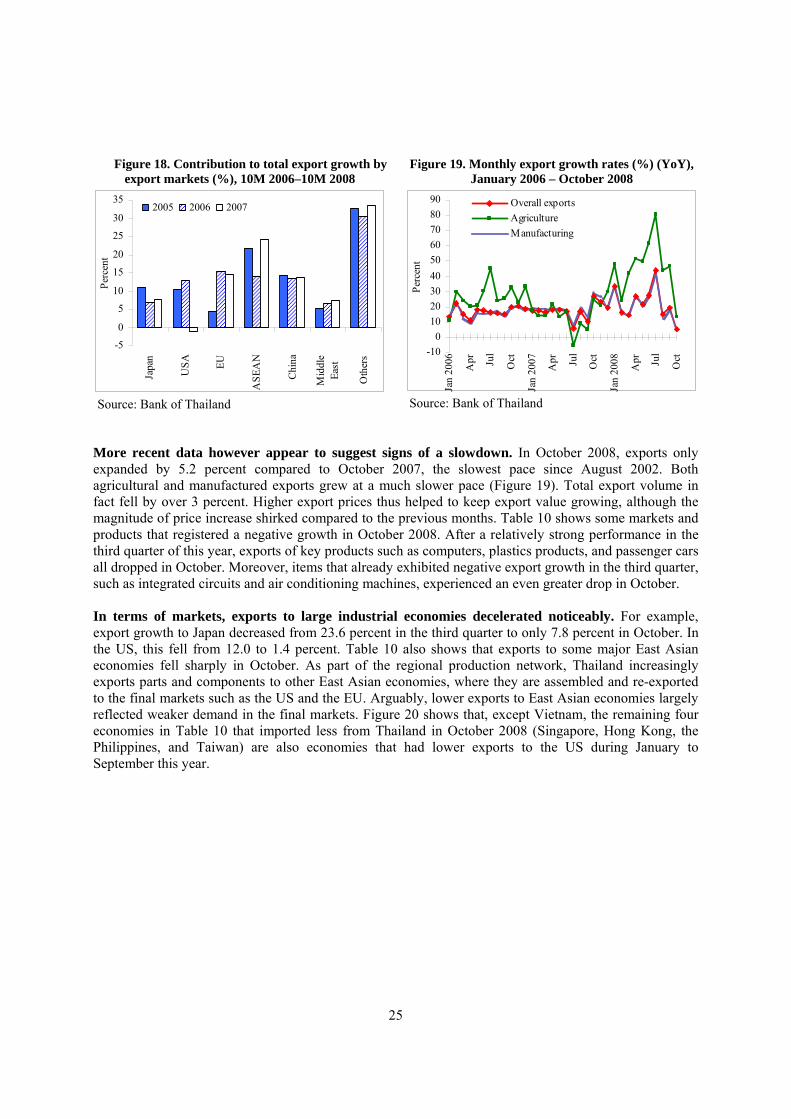
25
Figure 18. Contribution to total export growth by
export markets (%), 10M 2006–10M 2008
-5
0
5
10
15
20
25
30
35
Japa
n
USA EU
ASE
AN
Chi
na
Mid
dle
East
Oth
ers
Perc
ent
2005 2006 2007
Source: Bank of Thailand
Figure 19. Monthly export growth rates (%) (YoY), January 2006 – October 2008
-100
102030405060708090
Jan
2006
Apr Ju
l
Oct
Jan
2007
Apr Ju
l
Oct
Jan
2008
Apr Ju
l
Oct
Perc
ent
Overall exportsAgricultureManufacturing
Source: Bank of Thailand
More recent data however appear to suggest signs of a slowdown. In October 2008, exports only expanded by 5.2 percent compared to October 2007, the slowest pace since August 2002. Both agricultural and manufactured exports grew at a much slower pace (Figure 19). Total export volume in fact fell by over 3 percent. Higher export prices thus helped to keep export value growing, although the magnitude of price increase shirked compared to the previous months. Table 10 shows some markets and products that registered a negative growth in October 2008. After a relatively strong performance in the third quarter of this year, exports of key products such as computers, plastics products, and passenger cars all dropped in October. Moreover, items that already exhibited negative export growth in the third quarter, such as integrated circuits and air conditioning machines, experienced an even greater drop in October. In terms of markets, exports to large industrial economies decelerated noticeably. For example, export growth to Japan decreased from 23.6 percent in the third quarter to only 7.8 percent in October. In the US, this fell from 12.0 to 1.4 percent. Table 10 also shows that exports to some major East Asian economies fell sharply in October. As part of the regional production network, Thailand increasingly exports parts and components to other East Asian economies, where they are assembled and re-exported to the final markets such as the US and the EU. Arguably, lower exports to East Asian economies largely reflected weaker demand in the final markets. Figure 20 shows that, except Vietnam, the remaining four economies in Table 10 that imported less from Thailand in October 2008 (Singapore, Hong Kong, the Philippines, and Taiwan) are also economies that had lower exports to the US during January to September this year.
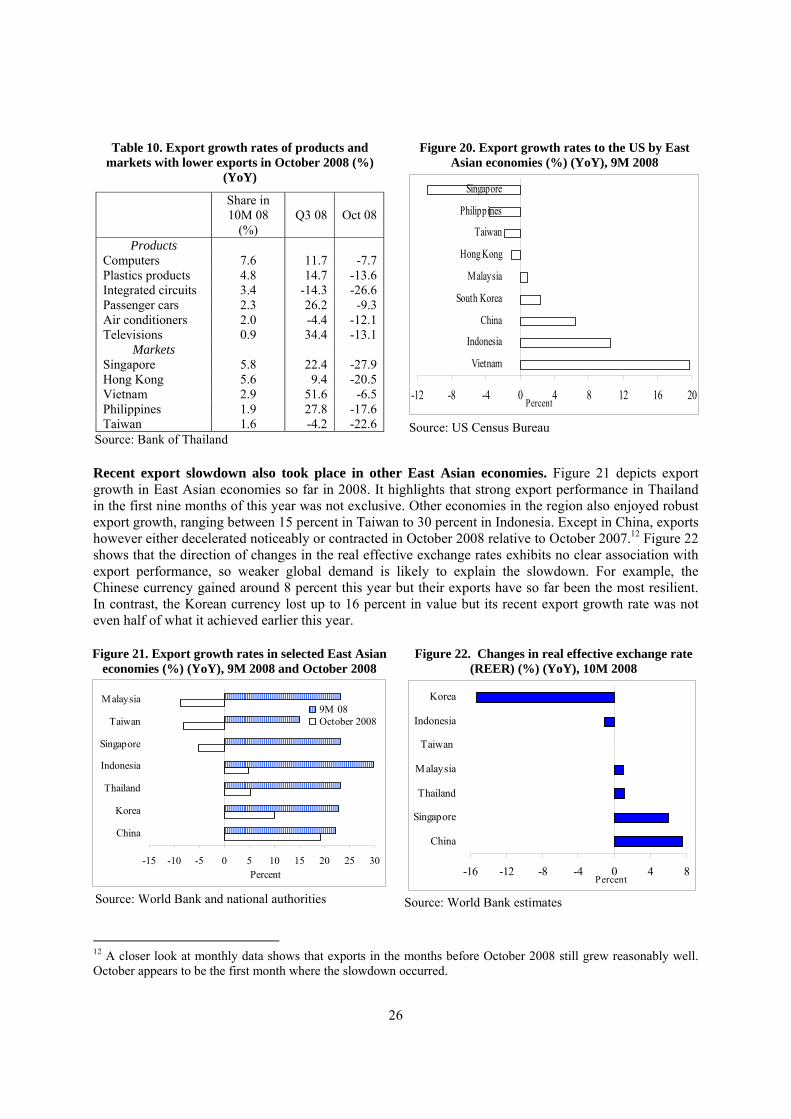
26
Table 10. Export growth rates of products and markets with lower exports in October 2008 (%)
(YoY)
Share in 10M 08
(%) Q3 08 Oct 08
Products Computers 7.6 11.7 -7.7 Plastics products 4.8 14.7 -13.6 Integrated circuits 3.4 -14.3 -26.6 Passenger cars 2.3 26.2 -9.3 Air conditioners 2.0 -4.4 -12.1 Televisions 0.9 34.4 -13.1
Markets Singapore 5.8 22.4 -27.9 Hong Kong 5.6 9.4 -20.5 Vietnam 2.9 51.6 -6.5 Philippines 1.9 27.8 -17.6 Taiwan 1.6 -4.2 -22.6
Source: Bank of Thailand
Figure 20. Export growth rates to the US by East Asian economies (%) (YoY), 9M 2008
-12 -8 -4 0 4 8 12 16 20
Vietnam
Indonesia
China
South Korea
Malaysia
Hong Kong
Taiwan
Philippines
Singapore
Percent
Source: US Census Bureau
Recent export slowdown also took place in other East Asian economies. Figure 21 depicts export growth in East Asian economies so far in 2008. It highlights that strong export performance in Thailand in the first nine months of this year was not exclusive. Other economies in the region also enjoyed robust export growth, ranging between 15 percent in Taiwan to 30 percent in Indonesia. Except in China, exports however either decelerated noticeably or contracted in October 2008 relative to October 2007.12 Figure 22 shows that the direction of changes in the real effective exchange rates exhibits no clear association with export performance, so weaker global demand is likely to explain the slowdown. For example, the Chinese currency gained around 8 percent this year but their exports have so far been the most resilient. In contrast, the Korean currency lost up to 16 percent in value but its recent export growth rate was not even half of what it achieved earlier this year. Figure 21. Export growth rates in selected East Asian
economies (%) (YoY), 9M 2008 and October 2008
-15 -10 -5 0 5 10 15 20 25 30
China
Korea
Thailand
Indonesia
Singapore
Taiwan
Malaysia
Percent
9M 08October 2008
Source: World Bank and national authorities
Figure 22. Changes in real effective exchange rate (REER) (%) (YoY), 10M 2008
-16 -12 -8 -4 0 4 8
China
Singapore
Thailand
Malaysia
Taiwan
Indonesia
Korea
Percent
Source: World Bank estimates 12 A closer look at monthly data shows that exports in the months before October 2008 still grew reasonably well. October appears to be the first month where the slowdown occurred.
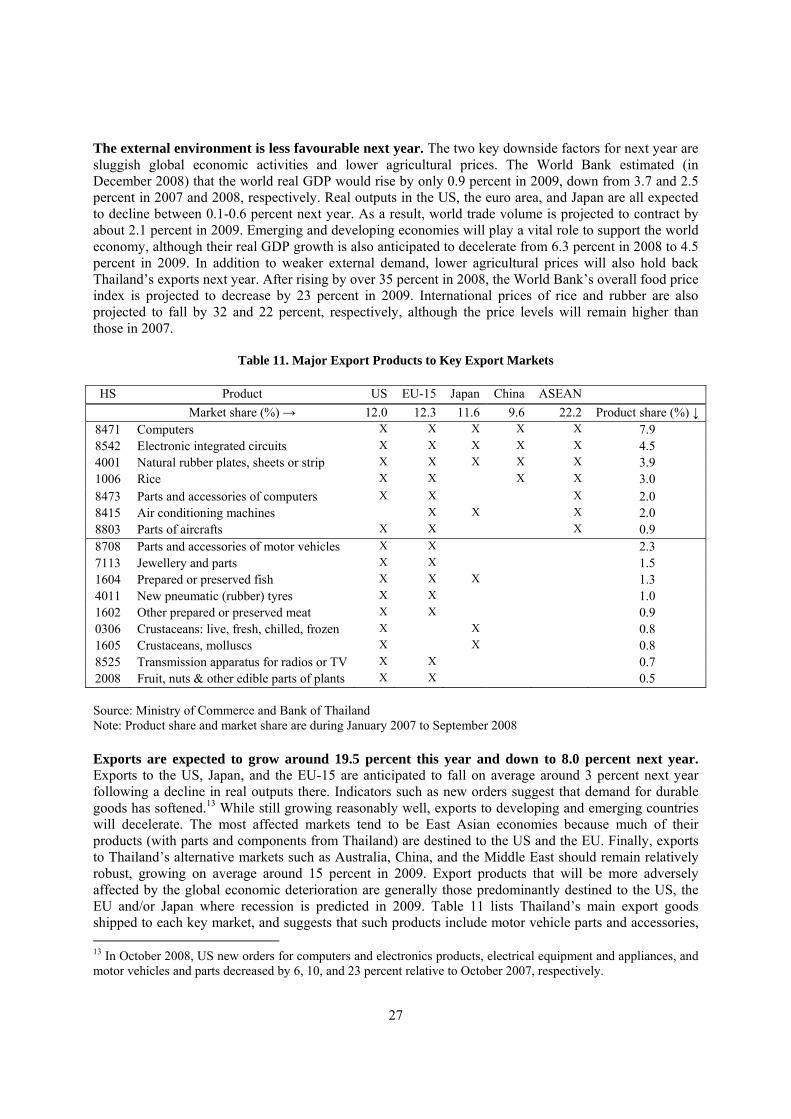
27
The external environment is less favourable next year. The two key downside factors for next year are sluggish global economic activities and lower agricultural prices. The World Bank estimated (in December 2008) that the world real GDP would rise by only 0.9 percent in 2009, down from 3.7 and 2.5 percent in 2007 and 2008, respectively. Real outputs in the US, the euro area, and Japan are all expected to decline between 0.1-0.6 percent next year. As a result, world trade volume is projected to contract by about 2.1 percent in 2009. Emerging and developing economies will play a vital role to support the world economy, although their real GDP growth is also anticipated to decelerate from 6.3 percent in 2008 to 4.5 percent in 2009. In addition to weaker external demand, lower agricultural prices will also hold back Thailand’s exports next year. After rising by over 35 percent in 2008, the World Bank’s overall food price index is projected to decrease by 23 percent in 2009. International prices of rice and rubber are also projected to fall by 32 and 22 percent, respectively, although the price levels will remain higher than those in 2007.
Table 11. Major Export Products to Key Export Markets
HS Product US EU-15 Japan China ASEAN Market share (%) → 12.0 12.3 11.6 9.6 22.2 Product share (%) ↓
8471 Computers X X X X X 7.9 8542 Electronic integrated circuits X X X X X 4.5 4001 Natural rubber plates, sheets or strip X X X X X 3.9 1006 Rice X X X X 3.0 8473 Parts and accessories of computers X X X 2.0 8415 Air conditioning machines X X X 2.0 8803 Parts of aircrafts X X X 0.9 8708 Parts and accessories of motor vehicles X X 2.3 7113 Jewellery and parts X X 1.5 1604 Prepared or preserved fish X X X 1.3 4011 New pneumatic (rubber) tyres X X 1.0 1602 Other prepared or preserved meat X X 0.9 0306 Crustaceans: live, fresh, chilled, frozen X X 0.8 1605 Crustaceans, molluscs X X 0.8 8525 Transmission apparatus for radios or TV X X 0.7 2008 Fruit, nuts & other edible parts of plants X X 0.5 Source: Ministry of Commerce and Bank of Thailand Note: Product share and market share are during January 2007 to September 2008 Exports are expected to grow around 19.5 percent this year and down to 8.0 percent next year. Exports to the US, Japan, and the EU-15 are anticipated to fall on average around 3 percent next year following a decline in real outputs there. Indicators such as new orders suggest that demand for durable goods has softened.13 While still growing reasonably well, exports to developing and emerging countries will decelerate. The most affected markets tend to be East Asian economies because much of their products (with parts and components from Thailand) are destined to the US and the EU. Finally, exports to Thailand’s alternative markets such as Australia, China, and the Middle East should remain relatively robust, growing on average around 15 percent in 2009. Export products that will be more adversely affected by the global economic deterioration are generally those predominantly destined to the US, the EU and/or Japan where recession is predicted in 2009. Table 11 lists Thailand’s main export goods shipped to each key market, and suggests that such products include motor vehicle parts and accessories, 13 In October 2008, US new orders for computers and electronics products, electrical equipment and appliances, and motor vehicles and parts decreased by 6, 10, and 23 percent relative to October 2007, respectively.
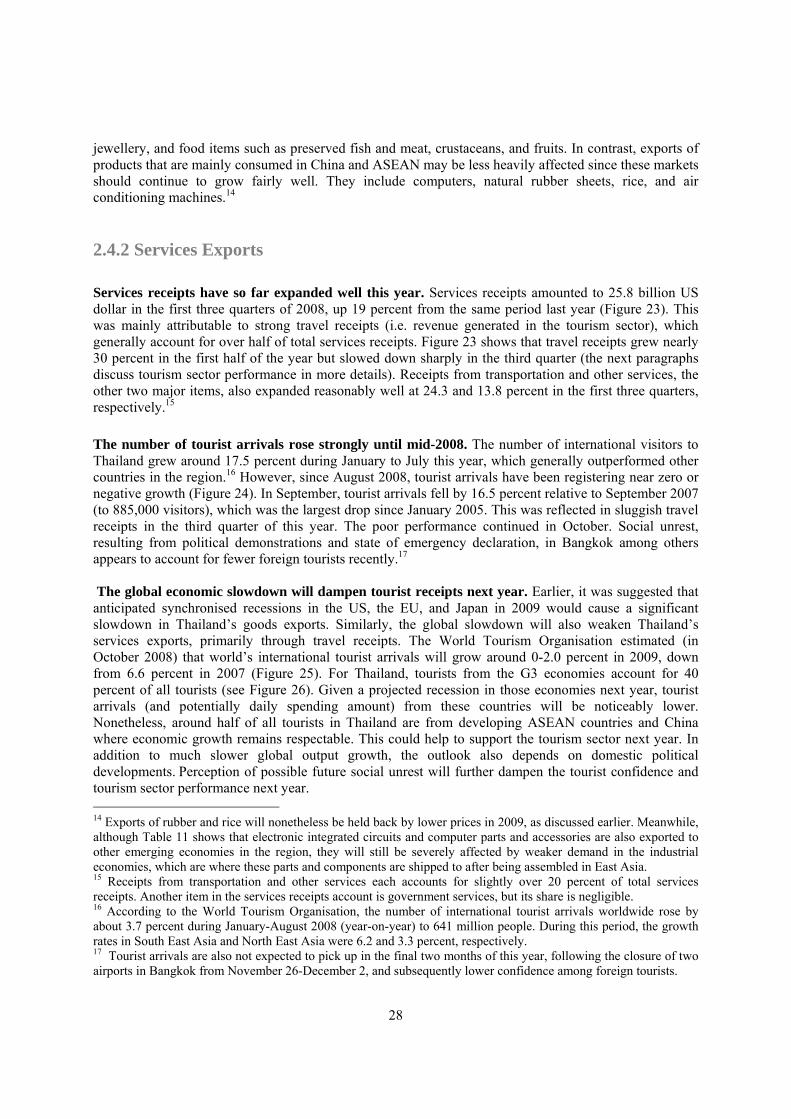
28
jewellery, and food items such as preserved fish and meat, crustaceans, and fruits. In contrast, exports of products that are mainly consumed in China and ASEAN may be less heavily affected since these markets should continue to grow fairly well. They include computers, natural rubber sheets, rice, and air conditioning machines.14
2.4.2 Services Exports Services receipts have so far expanded well this year. Services receipts amounted to 25.8 billion US dollar in the first three quarters of 2008, up 19 percent from the same period last year (Figure 23). This was mainly attributable to strong travel receipts (i.e. revenue generated in the tourism sector), which generally account for over half of total services receipts. Figure 23 shows that travel receipts grew nearly 30 percent in the first half of the year but slowed down sharply in the third quarter (the next paragraphs discuss tourism sector performance in more details). Receipts from transportation and other services, the other two major items, also expanded reasonably well at 24.3 and 13.8 percent in the first three quarters, respectively.15 The number of tourist arrivals rose strongly until mid-2008. The number of international visitors to Thailand grew around 17.5 percent during January to July this year, which generally outperformed other countries in the region.16 However, since August 2008, tourist arrivals have been registering near zero or negative growth (Figure 24). In September, tourist arrivals fell by 16.5 percent relative to September 2007 (to 885,000 visitors), which was the largest drop since January 2005. This was reflected in sluggish travel receipts in the third quarter of this year. The poor performance continued in October. Social unrest, resulting from political demonstrations and state of emergency declaration, in Bangkok among others appears to account for fewer foreign tourists recently.17 The global economic slowdown will dampen tourist receipts next year. Earlier, it was suggested that anticipated synchronised recessions in the US, the EU, and Japan in 2009 would cause a significant slowdown in Thailand’s goods exports. Similarly, the global slowdown will also weaken Thailand’s services exports, primarily through travel receipts. The World Tourism Organisation estimated (in October 2008) that world’s international tourist arrivals will grow around 0-2.0 percent in 2009, down from 6.6 percent in 2007 (Figure 25). For Thailand, tourists from the G3 economies account for 40 percent of all tourists (see Figure 26). Given a projected recession in those economies next year, tourist arrivals (and potentially daily spending amount) from these countries will be noticeably lower. Nonetheless, around half of all tourists in Thailand are from developing ASEAN countries and China where economic growth remains respectable. This could help to support the tourism sector next year. In addition to much slower global output growth, the outlook also depends on domestic political developments. Perception of possible future social unrest will further dampen the tourist confidence and tourism sector performance next year.
14 Exports of rubber and rice will nonetheless be held back by lower prices in 2009, as discussed earlier. Meanwhile, although Table 11 shows that electronic integrated circuits and computer parts and accessories are also exported to other emerging economies in the region, they will still be severely affected by weaker demand in the industrial economies, which are where these parts and components are shipped to after being assembled in East Asia. 15 Receipts from transportation and other services each accounts for slightly over 20 percent of total services receipts. Another item in the services receipts account is government services, but its share is negligible. 16 According to the World Tourism Organisation, the number of international tourist arrivals worldwide rose by about 3.7 percent during January-August 2008 (year-on-year) to 641 million people. During this period, the growth rates in South East Asia and North East Asia were 6.2 and 3.3 percent, respectively. 17 Tourist arrivals are also not expected to pick up in the final two months of this year, following the closure of two airports in Bangkok from November 26-December 2, and subsequently lower confidence among foreign tourists.
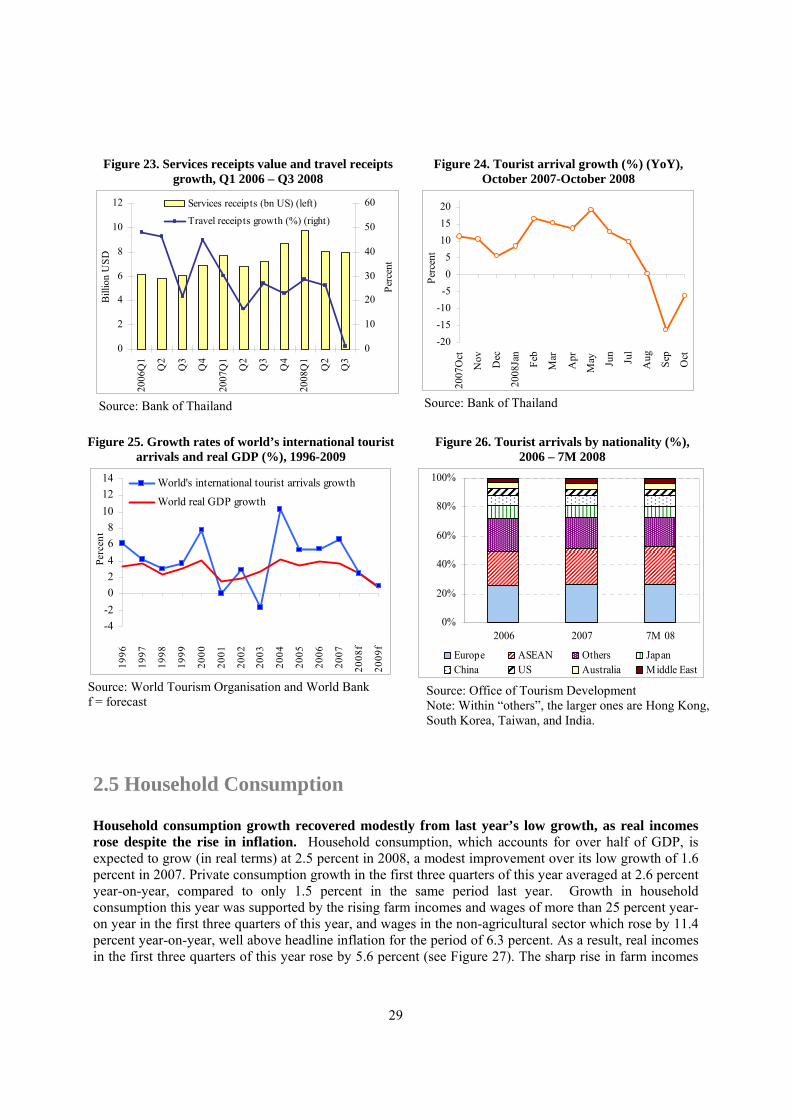
29
Figure 23. Services receipts value and travel receipts
growth, Q1 2006 – Q3 2008
0
2
4
6
8
10
12
2006
Q1
Q2
Q3
Q4
2007
Q1
Q2
Q3
Q4
2008
Q1
Q2
Q3
Bill
ion
USD
0
10
20
30
40
50
60
Perc
ent
Services receipts (bn US) (left)
Travel receipts growth (%) (right)
Source: Bank of Thailand
Figure 24. Tourist arrival growth (%) (YoY), October 2007-October 2008
-20-15-10
-505
101520
2007
Oct
Nov Dec
2008
Jan
Feb
Mar
Apr
May Ju
n
Jul
Aug Sep
Oct
Perc
ent
Source: Bank of Thailand
Figure 25. Growth rates of world’s international tourist
arrivals and real GDP (%), 1996-2009
-4-202468
101214
1996
1997
1998
1999
2000
2001
2002
2003
2004
2005
2006
2007
2008
f
2009
f
Perc
ent
World's international tourist arrivals growth
World real GDP growth
Source: World Tourism Organisation and World Bank f = forecast
Figure 26. Tourist arrivals by nationality (%), 2006 – 7M 2008
0%
20%
40%
60%
80%
100%
2006 2007 7M 08
Europe ASEAN Others JapanChina US Australia Middle East
Source: Office of Tourism Development Note: Within “others”, the larger ones are Hong Kong, South Korea, Taiwan, and India.
2.5 Household Consumption Household consumption growth recovered modestly from last year’s low growth, as real incomes rose despite the rise in inflation. Household consumption, which accounts for over half of GDP, is expected to grow (in real terms) at 2.5 percent in 2008, a modest improvement over its low growth of 1.6 percent in 2007. Private consumption growth in the first three quarters of this year averaged at 2.6 percent year-on-year, compared to only 1.5 percent in the same period last year. Growth in household consumption this year was supported by the rising farm incomes and wages of more than 25 percent year-on year in the first three quarters of this year, and wages in the non-agricultural sector which rose by 11.4 percent year-on-year, well above headline inflation for the period of 6.3 percent. As a result, real incomes in the first three quarters of this year rose by 5.6 percent (see Figure 27). The sharp rise in farm incomes
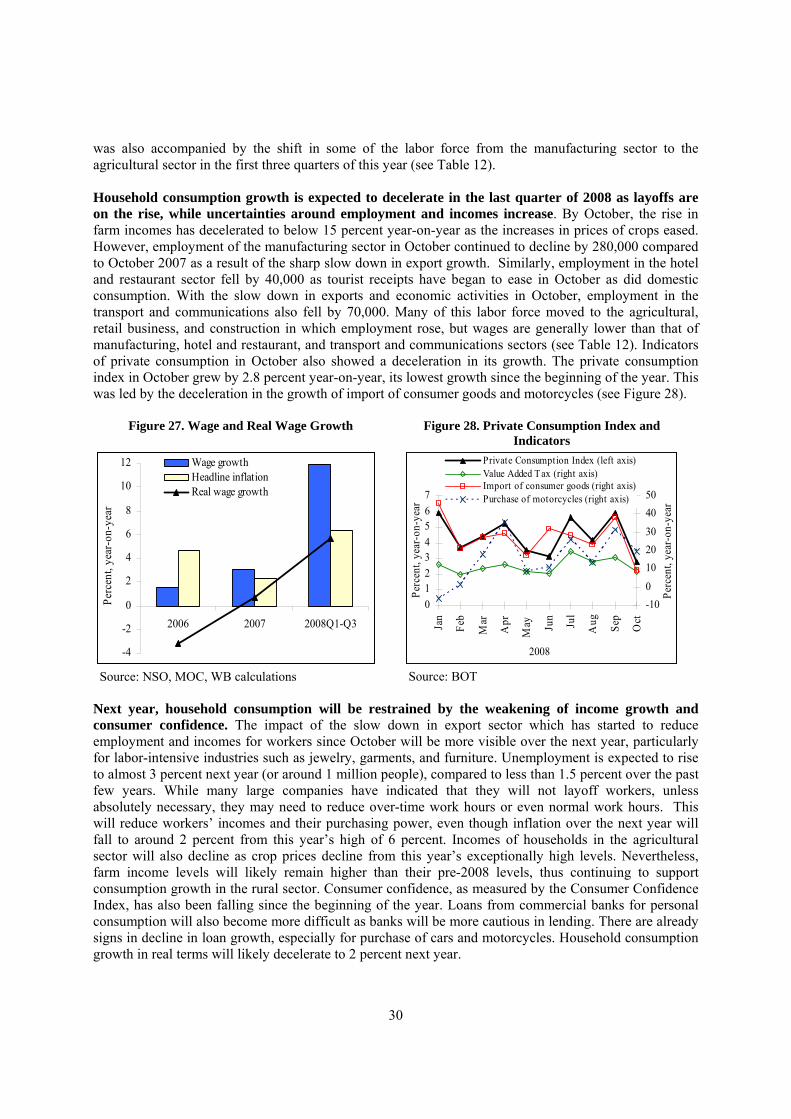
30
was also accompanied by the shift in some of the labor force from the manufacturing sector to the agricultural sector in the first three quarters of this year (see Table 12). Household consumption growth is expected to decelerate in the last quarter of 2008 as layoffs are on the rise, while uncertainties around employment and incomes increase. By October, the rise in farm incomes has decelerated to below 15 percent year-on-year as the increases in prices of crops eased. However, employment of the manufacturing sector in October continued to decline by 280,000 compared to October 2007 as a result of the sharp slow down in export growth. Similarly, employment in the hotel and restaurant sector fell by 40,000 as tourist receipts have began to ease in October as did domestic consumption. With the slow down in exports and economic activities in October, employment in the transport and communications also fell by 70,000. Many of this labor force moved to the agricultural, retail business, and construction in which employment rose, but wages are generally lower than that of manufacturing, hotel and restaurant, and transport and communications sectors (see Table 12). Indicators of private consumption in October also showed a deceleration in its growth. The private consumption index in October grew by 2.8 percent year-on-year, its lowest growth since the beginning of the year. This was led by the deceleration in the growth of import of consumer goods and motorcycles (see Figure 28).
Figure 27. Wage and Real Wage Growth Figure 28. Private Consumption Index and Indicators
-4
-2
0
2
4
6
8
10
12
2006 2007 2008Q1-Q3
Perc
ent,
year
-on-
year
Wage growthHeadline inflationReal wage growth
Source: NSO, MOC, WB calculations
01234567
Jan
Feb
Mar
Apr
May Ju
n
Jul
Aug Sep
Oct
2008
Perc
ent,
year
-on-
year
-100
102030
4050
Perc
ent,
year
-on-
year
Private Consumption Index (left axis)Value Added Tax (right axis)Import of consumer goods (right axis)Purchase of motorcycles (right axis)
Source: BOT
Next year, household consumption will be restrained by the weakening of income growth and consumer confidence. The impact of the slow down in export sector which has started to reduce employment and incomes for workers since October will be more visible over the next year, particularly for labor-intensive industries such as jewelry, garments, and furniture. Unemployment is expected to rise to almost 3 percent next year (or around 1 million people), compared to less than 1.5 percent over the past few years. While many large companies have indicated that they will not layoff workers, unless absolutely necessary, they may need to reduce over-time work hours or even normal work hours. This will reduce workers’ incomes and their purchasing power, even though inflation over the next year will fall to around 2 percent from this year’s high of 6 percent. Incomes of households in the agricultural sector will also decline as crop prices decline from this year’s exceptionally high levels. Nevertheless, farm income levels will likely remain higher than their pre-2008 levels, thus continuing to support consumption growth in the rural sector. Consumer confidence, as measured by the Consumer Confidence Index, has also been falling since the beginning of the year. Loans from commercial banks for personal consumption will also become more difficult as banks will be more cautious in lending. There are already signs in decline in loan growth, especially for purchase of cars and motorcycles. Household consumption growth in real terms will likely decelerate to 2 percent next year.
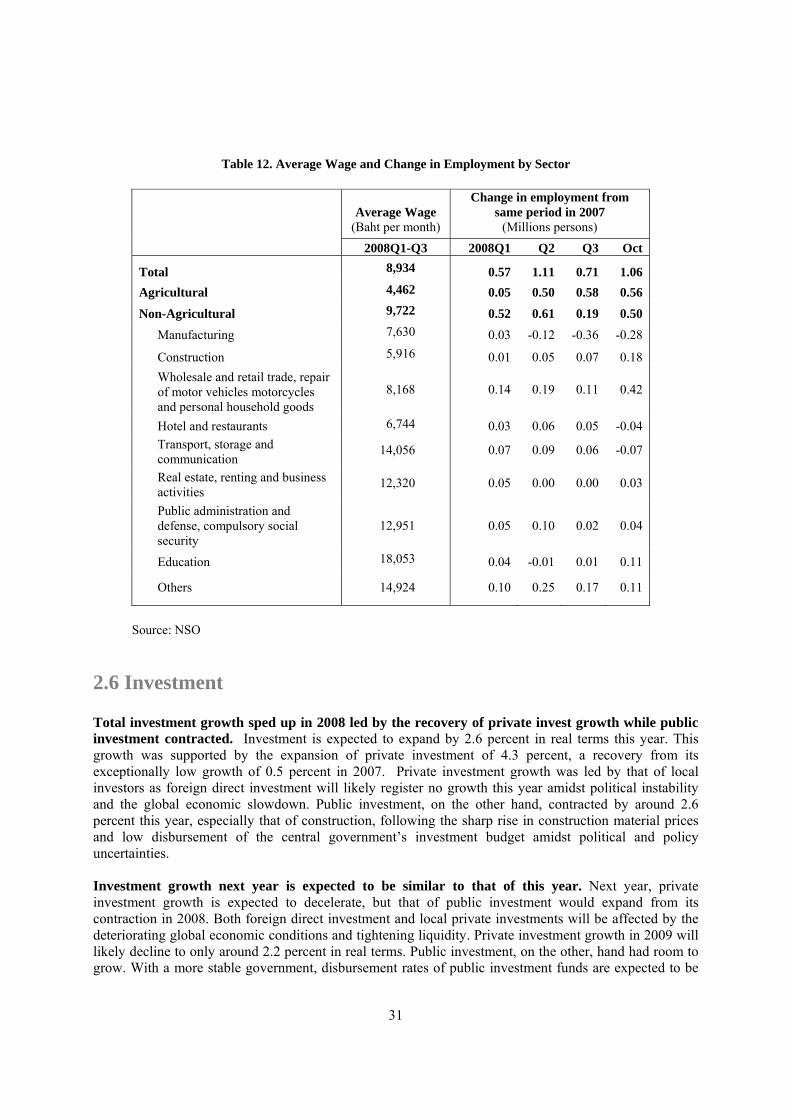
31
Table 12. Average Wage and Change in Employment by Sector
Average Wage
(Baht per month)
Change in employment from same period in 2007
(Millions persons) 2008Q1-Q3 2008Q1 Q2 Q3 Oct
Total 8,934 0.57 1.11 0.71 1.06 Agricultural 4,462 0.05 0.50 0.58 0.56
Non-Agricultural 9,722 0.52 0.61 0.19 0.50 Manufacturing 7,630 0.03 -0.12 -0.36 -0.28
Construction 5,916 0.01 0.05 0.07 0.18 Wholesale and retail trade, repair of motor vehicles motorcycles and personal household goods
8,168 0.14 0.19 0.11 0.42
Hotel and restaurants 6,744 0.03 0.06 0.05 -0.04 Transport, storage and communication
14,056 0.07 0.09 0.06 -0.07
Real estate, renting and business activities
12,320 0.05 0.00 0.00 0.03
Public administration and defense, compulsory social security
12,951 0.05 0.10 0.02 0.04
Education 18,053 0.04 -0.01 0.01 0.11
Others 14,924 0.10 0.25 0.17 0.11
Source: NSO
2.6 Investment Total investment growth sped up in 2008 led by the recovery of private invest growth while public investment contracted. Investment is expected to expand by 2.6 percent in real terms this year. This growth was supported by the expansion of private investment of 4.3 percent, a recovery from its exceptionally low growth of 0.5 percent in 2007. Private investment growth was led by that of local investors as foreign direct investment will likely register no growth this year amidst political instability and the global economic slowdown. Public investment, on the other hand, contracted by around 2.6 percent this year, especially that of construction, following the sharp rise in construction material prices and low disbursement of the central government’s investment budget amidst political and policy uncertainties. Investment growth next year is expected to be similar to that of this year. Next year, private investment growth is expected to decelerate, but that of public investment would expand from its contraction in 2008. Both foreign direct investment and local private investments will be affected by the deteriorating global economic conditions and tightening liquidity. Private investment growth in 2009 will likely decline to only around 2.2 percent in real terms. Public investment, on the other, hand had room to grow. With a more stable government, disbursement rates of public investment funds are expected to be
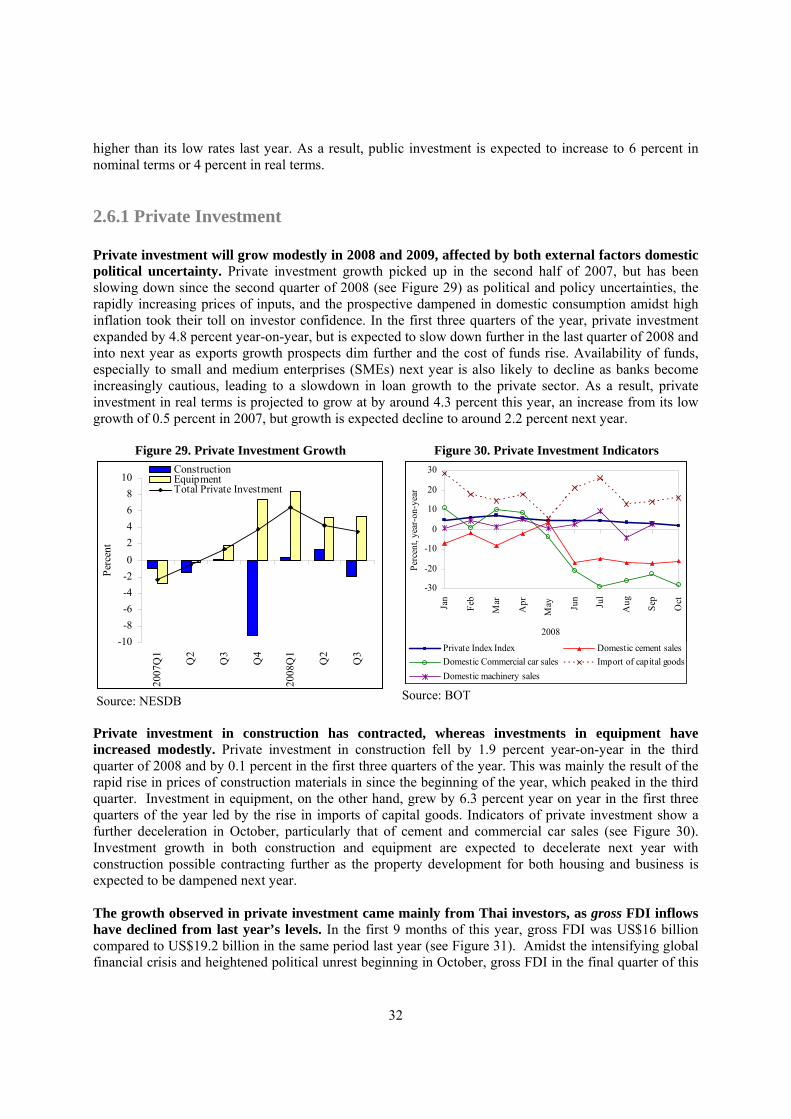
32
higher than its low rates last year. As a result, public investment is expected to increase to 6 percent in nominal terms or 4 percent in real terms. 2.6.1 Private Investment Private investment will grow modestly in 2008 and 2009, affected by both external factors domestic political uncertainty. Private investment growth picked up in the second half of 2007, but has been slowing down since the second quarter of 2008 (see Figure 29) as political and policy uncertainties, the rapidly increasing prices of inputs, and the prospective dampened in domestic consumption amidst high inflation took their toll on investor confidence. In the first three quarters of the year, private investment expanded by 4.8 percent year-on-year, but is expected to slow down further in the last quarter of 2008 and into next year as exports growth prospects dim further and the cost of funds rise. Availability of funds, especially to small and medium enterprises (SMEs) next year is also likely to decline as banks become increasingly cautious, leading to a slowdown in loan growth to the private sector. As a result, private investment in real terms is projected to grow at by around 4.3 percent this year, an increase from its low growth of 0.5 percent in 2007, but growth is expected decline to around 2.2 percent next year.
Figure 29. Private Investment Growth Figure 30. Private Investment Indicators
-10-8-6-4-202468
10
2007
Q1
Q2
Q3
Q4
2008
Q1
Q2
Q3
Perc
ent
ConstructionEquipmentTotal Private Investment
Source: NESDB
-30
-20
-10
0
10
20
30
Jan
Feb
Mar
Apr
May Ju
n
Jul
Aug Sep
Oct
2008
Perc
ent,
year
-on-
year
Private Index Index Domestic cement salesDomestic Commercial car sales Import of capital goodsDomestic machinery sales
Source: BOT
Private investment in construction has contracted, whereas investments in equipment have increased modestly. Private investment in construction fell by 1.9 percent year-on-year in the third quarter of 2008 and by 0.1 percent in the first three quarters of the year. This was mainly the result of the rapid rise in prices of construction materials in since the beginning of the year, which peaked in the third quarter. Investment in equipment, on the other hand, grew by 6.3 percent year on year in the first three quarters of the year led by the rise in imports of capital goods. Indicators of private investment show a further deceleration in October, particularly that of cement and commercial car sales (see Figure 30). Investment growth in both construction and equipment are expected to decelerate next year with construction possible contracting further as the property development for both housing and business is expected to be dampened next year. The growth observed in private investment came mainly from Thai investors, as gross FDI inflows have declined from last year’s levels. In the first 9 months of this year, gross FDI was US$16 billion compared to US$19.2 billion in the same period last year (see Figure 31). Amidst the intensifying global financial crisis and heightened political unrest beginning in October, gross FDI in the final quarter of this
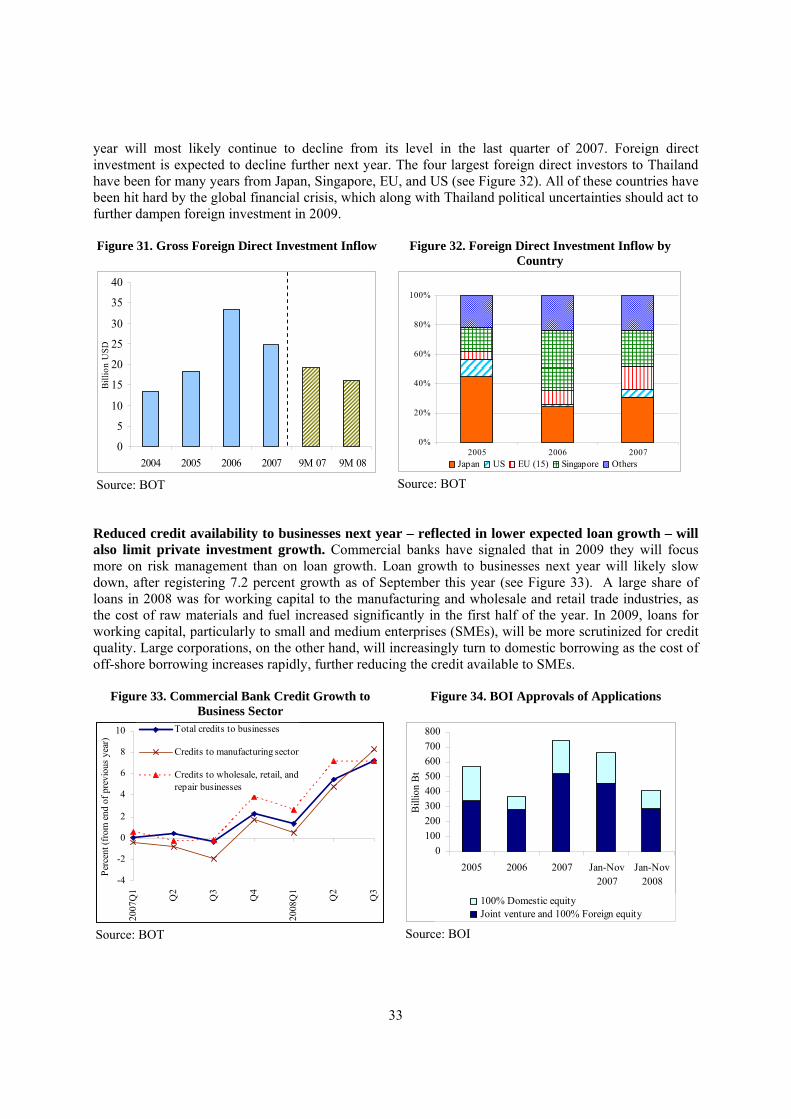
33
year will most likely continue to decline from its level in the last quarter of 2007. Foreign direct investment is expected to decline further next year. The four largest foreign direct investors to Thailand have been for many years from Japan, Singapore, EU, and US (see Figure 32). All of these countries have been hit hard by the global financial crisis, which along with Thailand political uncertainties should act to further dampen foreign investment in 2009. Figure 31. Gross Foreign Direct Investment Inflow Figure 32. Foreign Direct Investment Inflow by
Country
0
5
10
15
20
25
30
35
40
2004 2005 2006 2007 9M 07 9M 08
Billi
on U
SD
Source: BOT
0%
20%
40%
60%
80%
100%
2005 2006 2007Japan US EU (15) Singapore Others
Source: BOT Reduced credit availability to businesses next year – reflected in lower expected loan growth – will also limit private investment growth. Commercial banks have signaled that in 2009 they will focus more on risk management than on loan growth. Loan growth to businesses next year will likely slow down, after registering 7.2 percent growth as of September this year (see Figure 33). A large share of loans in 2008 was for working capital to the manufacturing and wholesale and retail trade industries, as the cost of raw materials and fuel increased significantly in the first half of the year. In 2009, loans for working capital, particularly to small and medium enterprises (SMEs), will be more scrutinized for credit quality. Large corporations, on the other hand, will increasingly turn to domestic borrowing as the cost of off-shore borrowing increases rapidly, further reducing the credit available to SMEs.
Figure 33. Commercial Bank Credit Growth to Business Sector
Figure 34. BOI Approvals of Applications
-4
-2
0
2
4
6
8
10
2007
Q1
Q2
Q3
Q4
2008
Q1
Q2
Q3
Perc
ent (
from
end
of p
revi
ous
year
)
Total credits to businesses
Credits to manufacturing sector
Credits to wholesale, retail, andrepair businesses
Source: BOT
0100200300400500600700800
2005 2006 2007 Jan-Nov2007
Jan-Nov2008
Bill
ion
Bt
100% Domestic equityJoint venture and 100% Foreign equity
Source: BOI
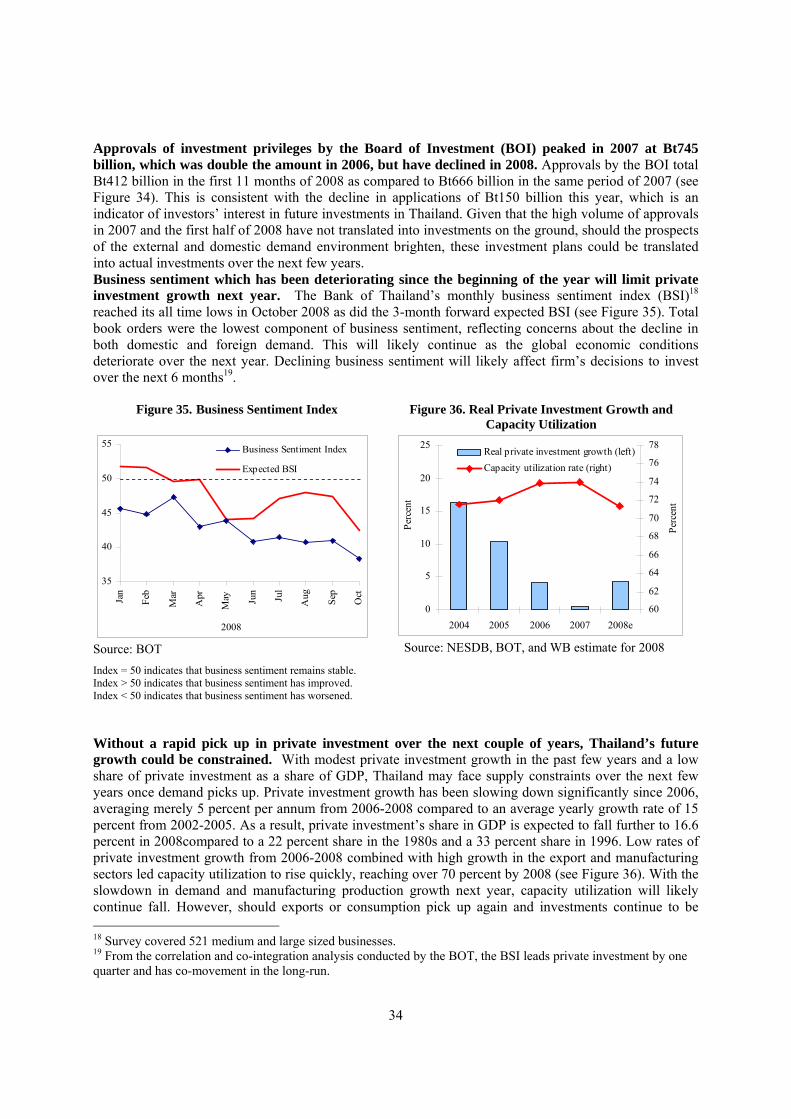
34
Approvals of investment privileges by the Board of Investment (BOI) peaked in 2007 at Bt745 billion, which was double the amount in 2006, but have declined in 2008. Approvals by the BOI total Bt412 billion in the first 11 months of 2008 as compared to Bt666 billion in the same period of 2007 (see Figure 34). This is consistent with the decline in applications of Bt150 billion this year, which is an indicator of investors’ interest in future investments in Thailand. Given that the high volume of approvals in 2007 and the first half of 2008 have not translated into investments on the ground, should the prospects of the external and domestic demand environment brighten, these investment plans could be translated into actual investments over the next few years. Business sentiment which has been deteriorating since the beginning of the year will limit private investment growth next year. The Bank of Thailand’s monthly business sentiment index (BSI)18 reached its all time lows in October 2008 as did the 3-month forward expected BSI (see Figure 35). Total book orders were the lowest component of business sentiment, reflecting concerns about the decline in both domestic and foreign demand. This will likely continue as the global economic conditions deteriorate over the next year. Declining business sentiment will likely affect firm’s decisions to invest over the next 6 months19.
Figure 35. Business Sentiment Index Figure 36. Real Private Investment Growth and Capacity Utilization
35
40
45
50
55
Jan
Feb
Mar
Apr
May Ju
n
Jul
Aug Sep
Oct
2008
Business Sentiment Index
Expected BSI
Source: BOT Index = 50 indicates that business sentiment remains stable. Index > 50 indicates that business sentiment has improved. Index < 50 indicates that business sentiment has worsened.
0
5
10
15
20
25
2004 2005 2006 2007 2008e
Perc
ent
60
62
64
66
68
70
72
74
76
78
Perc
ent
Real private investment growth (left)Capacity utilization rate (right)
Source: NESDB, BOT, and WB estimate for 2008
Without a rapid pick up in private investment over the next couple of years, Thailand’s future growth could be constrained. With modest private investment growth in the past few years and a low share of private investment as a share of GDP, Thailand may face supply constraints over the next few years once demand picks up. Private investment growth has been slowing down significantly since 2006, averaging merely 5 percent per annum from 2006-2008 compared to an average yearly growth rate of 15 percent from 2002-2005. As a result, private investment’s share in GDP is expected to fall further to 16.6 percent in 2008compared to a 22 percent share in the 1980s and a 33 percent share in 1996. Low rates of private investment growth from 2006-2008 combined with high growth in the export and manufacturing sectors led capacity utilization to rise quickly, reaching over 70 percent by 2008 (see Figure 36). With the slowdown in demand and manufacturing production growth next year, capacity utilization will likely continue fall. However, should exports or consumption pick up again and investments continue to be 18 Survey covered 521 medium and large sized businesses. 19 From the correlation and co-integration analysis conducted by the BOT, the BSI leads private investment by one quarter and has co-movement in the long-run.
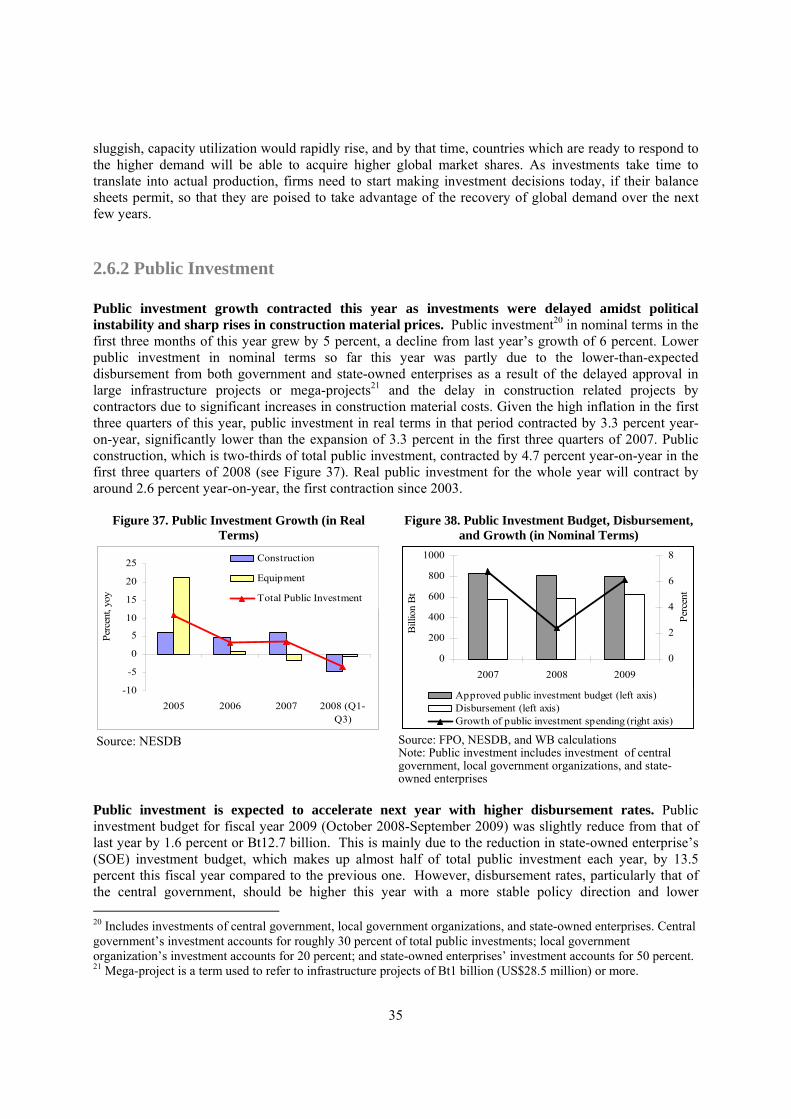
35
sluggish, capacity utilization would rapidly rise, and by that time, countries which are ready to respond to the higher demand will be able to acquire higher global market shares. As investments take time to translate into actual production, firms need to start making investment decisions today, if their balance sheets permit, so that they are poised to take advantage of the recovery of global demand over the next few years. 2.6.2 Public Investment Public investment growth contracted this year as investments were delayed amidst political instability and sharp rises in construction material prices. Public investment20 in nominal terms in the first three months of this year grew by 5 percent, a decline from last year’s growth of 6 percent. Lower public investment in nominal terms so far this year was partly due to the lower-than-expected disbursement from both government and state-owned enterprises as a result of the delayed approval in large infrastructure projects or mega-projects21 and the delay in construction related projects by contractors due to significant increases in construction material costs. Given the high inflation in the first three quarters of this year, public investment in real terms in that period contracted by 3.3 percent year-on-year, significantly lower than the expansion of 3.3 percent in the first three quarters of 2007. Public construction, which is two-thirds of total public investment, contracted by 4.7 percent year-on-year in the first three quarters of 2008 (see Figure 37). Real public investment for the whole year will contract by around 2.6 percent year-on-year, the first contraction since 2003.
Figure 37. Public Investment Growth (in Real Terms)
Figure 38. Public Investment Budget, Disbursement, and Growth (in Nominal Terms)
-10
-5
0
5
10
15
20
25
2005 2006 2007 2008 (Q1-Q3)
Perc
ent,
yoy
Construction
Equipment
Total Public Investment
Source: NESDB
0
200
400
600
800
1000
2007 2008 2009
Bill
ion
Bt
0
2
4
6
8
Perc
ent
Approved public investment budget (left axis)Disbursement (left axis)Growth of public investment spending (right axis)
Source: FPO, NESDB, and WB calculations Note: Public investment includes investment of central government, local government organizations, and state-owned enterprises
Public investment is expected to accelerate next year with higher disbursement rates. Public investment budget for fiscal year 2009 (October 2008-September 2009) was slightly reduce from that of last year by 1.6 percent or Bt12.7 billion. This is mainly due to the reduction in state-owned enterprise’s (SOE) investment budget, which makes up almost half of total public investment each year, by 13.5 percent this fiscal year compared to the previous one. However, disbursement rates, particularly that of the central government, should be higher this year with a more stable policy direction and lower 20 Includes investments of central government, local government organizations, and state-owned enterprises. Central government’s investment accounts for roughly 30 percent of total public investments; local government organization’s investment accounts for 20 percent; and state-owned enterprises’ investment accounts for 50 percent. 21 Mega-project is a term used to refer to infrastructure projects of Bt1 billion (US$28.5 million) or more.
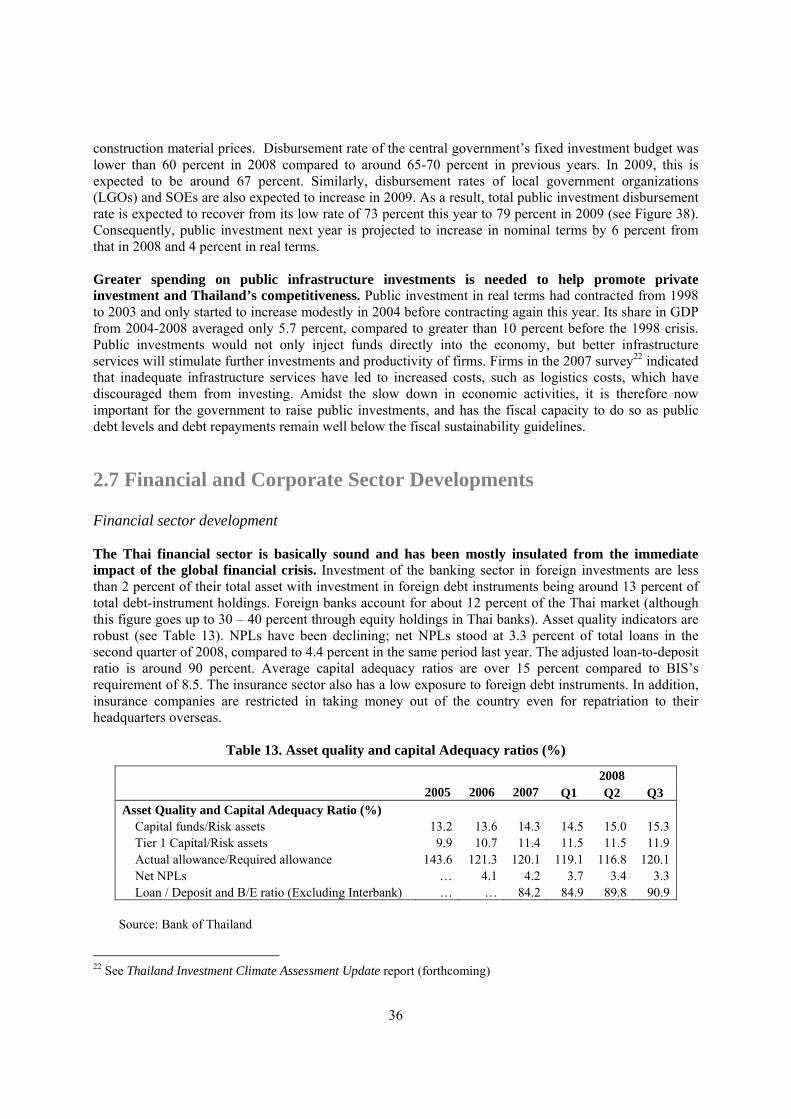
36
construction material prices. Disbursement rate of the central government’s fixed investment budget was lower than 60 percent in 2008 compared to around 65-70 percent in previous years. In 2009, this is expected to be around 67 percent. Similarly, disbursement rates of local government organizations (LGOs) and SOEs are also expected to increase in 2009. As a result, total public investment disbursement rate is expected to recover from its low rate of 73 percent this year to 79 percent in 2009 (see Figure 38). Consequently, public investment next year is projected to increase in nominal terms by 6 percent from that in 2008 and 4 percent in real terms. Greater spending on public infrastructure investments is needed to help promote private investment and Thailand’s competitiveness. Public investment in real terms had contracted from 1998 to 2003 and only started to increase modestly in 2004 before contracting again this year. Its share in GDP from 2004-2008 averaged only 5.7 percent, compared to greater than 10 percent before the 1998 crisis. Public investments would not only inject funds directly into the economy, but better infrastructure services will stimulate further investments and productivity of firms. Firms in the 2007 survey22 indicated that inadequate infrastructure services have led to increased costs, such as logistics costs, which have discouraged them from investing. Amidst the slow down in economic activities, it is therefore now important for the government to raise public investments, and has the fiscal capacity to do so as public debt levels and debt repayments remain well below the fiscal sustainability guidelines. 2.7 Financial and Corporate Sector Developments Financial sector development The Thai financial sector is basically sound and has been mostly insulated from the immediate impact of the global financial crisis. Investment of the banking sector in foreign investments are less than 2 percent of their total asset with investment in foreign debt instruments being around 13 percent of total debt-instrument holdings. Foreign banks account for about 12 percent of the Thai market (although this figure goes up to 30 – 40 percent through equity holdings in Thai banks). Asset quality indicators are robust (see Table 13). NPLs have been declining; net NPLs stood at 3.3 percent of total loans in the second quarter of 2008, compared to 4.4 percent in the same period last year. The adjusted loan-to-deposit ratio is around 90 percent. Average capital adequacy ratios are over 15 percent compared to BIS’s requirement of 8.5. The insurance sector also has a low exposure to foreign debt instruments. In addition, insurance companies are restricted in taking money out of the country even for repatriation to their headquarters overseas.
Table 13. Asset quality and capital Adequacy ratios (%)
2008 2005 2006 2007 Q1 Q2 Q3
Asset Quality and Capital Adequacy Ratio (%) Capital funds/Risk assets 13.2 13.6 14.3 14.5 15.0 15.3 Tier 1 Capital/Risk assets 9.9 10.7 11.4 11.5 11.5 11.9 Actual allowance/Required allowance 143.6 121.3 120.1 119.1 116.8 120.1 Net NPLs … 4.1 4.2 3.7 3.4 3.3 Loan / Deposit and B/E ratio (Excluding Interbank) … … 84.2 84.9 89.8 90.9
Source: Bank of Thailand
22 See Thailand Investment Climate Assessment Update report (forthcoming)
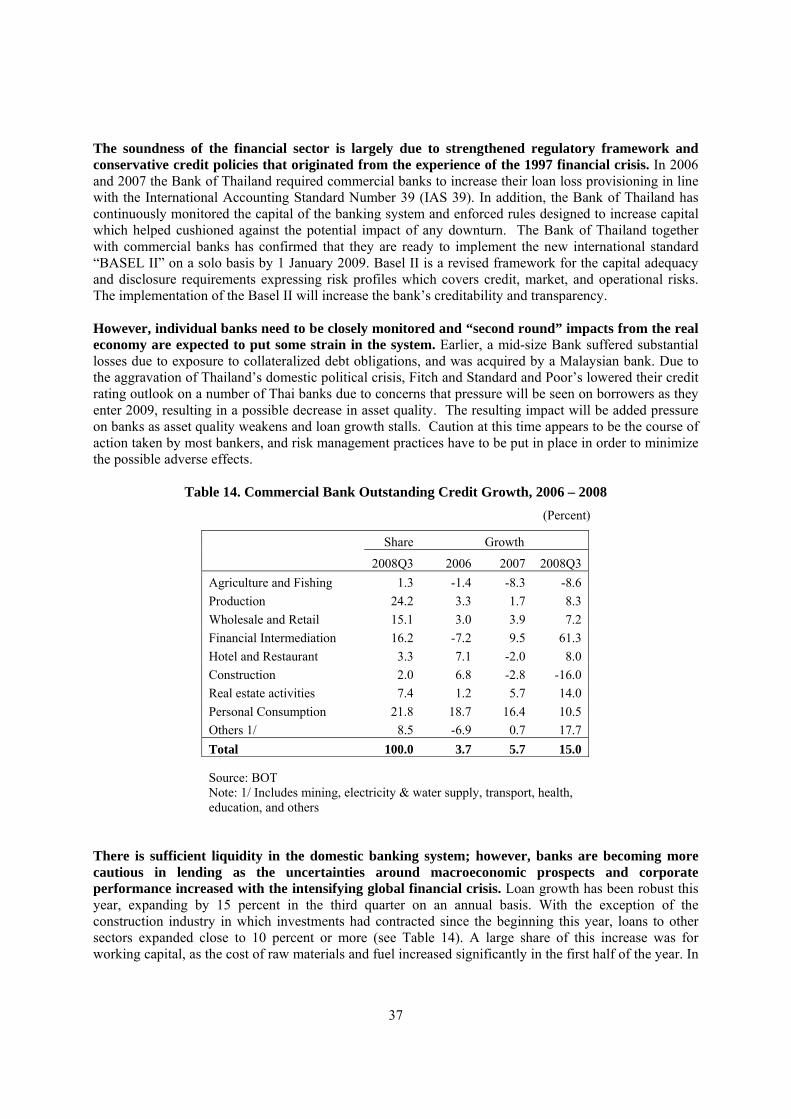
37
The soundness of the financial sector is largely due to strengthened regulatory framework and conservative credit policies that originated from the experience of the 1997 financial crisis. In 2006 and 2007 the Bank of Thailand required commercial banks to increase their loan loss provisioning in line with the International Accounting Standard Number 39 (IAS 39). In addition, the Bank of Thailand has continuously monitored the capital of the banking system and enforced rules designed to increase capital which helped cushioned against the potential impact of any downturn. The Bank of Thailand together with commercial banks has confirmed that they are ready to implement the new international standard “BASEL II” on a solo basis by 1 January 2009. Basel II is a revised framework for the capital adequacy and disclosure requirements expressing risk profiles which covers credit, market, and operational risks. The implementation of the Basel II will increase the bank’s creditability and transparency. However, individual banks need to be closely monitored and “second round” impacts from the real economy are expected to put some strain in the system. Earlier, a mid-size Bank suffered substantial losses due to exposure to collateralized debt obligations, and was acquired by a Malaysian bank. Due to the aggravation of Thailand’s domestic political crisis, Fitch and Standard and Poor’s lowered their credit rating outlook on a number of Thai banks due to concerns that pressure will be seen on borrowers as they enter 2009, resulting in a possible decrease in asset quality. The resulting impact will be added pressure on banks as asset quality weakens and loan growth stalls. Caution at this time appears to be the course of action taken by most bankers, and risk management practices have to be put in place in order to minimize the possible adverse effects.
Table 14. Commercial Bank Outstanding Credit Growth, 2006 – 2008 (Percent)
Share Growth
2008Q3 2006 2007 2008Q3 Agriculture and Fishing 1.3 -1.4 -8.3 -8.6 Production 24.2 3.3 1.7 8.3 Wholesale and Retail 15.1 3.0 3.9 7.2 Financial Intermediation 16.2 -7.2 9.5 61.3 Hotel and Restaurant 3.3 7.1 -2.0 8.0 Construction 2.0 6.8 -2.8 -16.0 Real estate activities 7.4 1.2 5.7 14.0 Personal Consumption 21.8 18.7 16.4 10.5 Others 1/ 8.5 -6.9 0.7 17.7 Total 100.0 3.7 5.7 15.0
Source: BOT Note: 1/ Includes mining, electricity & water supply, transport, health, education, and others
There is sufficient liquidity in the domestic banking system; however, banks are becoming more cautious in lending as the uncertainties around macroeconomic prospects and corporate performance increased with the intensifying global financial crisis. Loan growth has been robust this year, expanding by 15 percent in the third quarter on an annual basis. With the exception of the construction industry in which investments had contracted since the beginning this year, loans to other sectors expanded close to 10 percent or more (see Table 14). A large share of this increase was for working capital, as the cost of raw materials and fuel increased significantly in the first half of the year. In
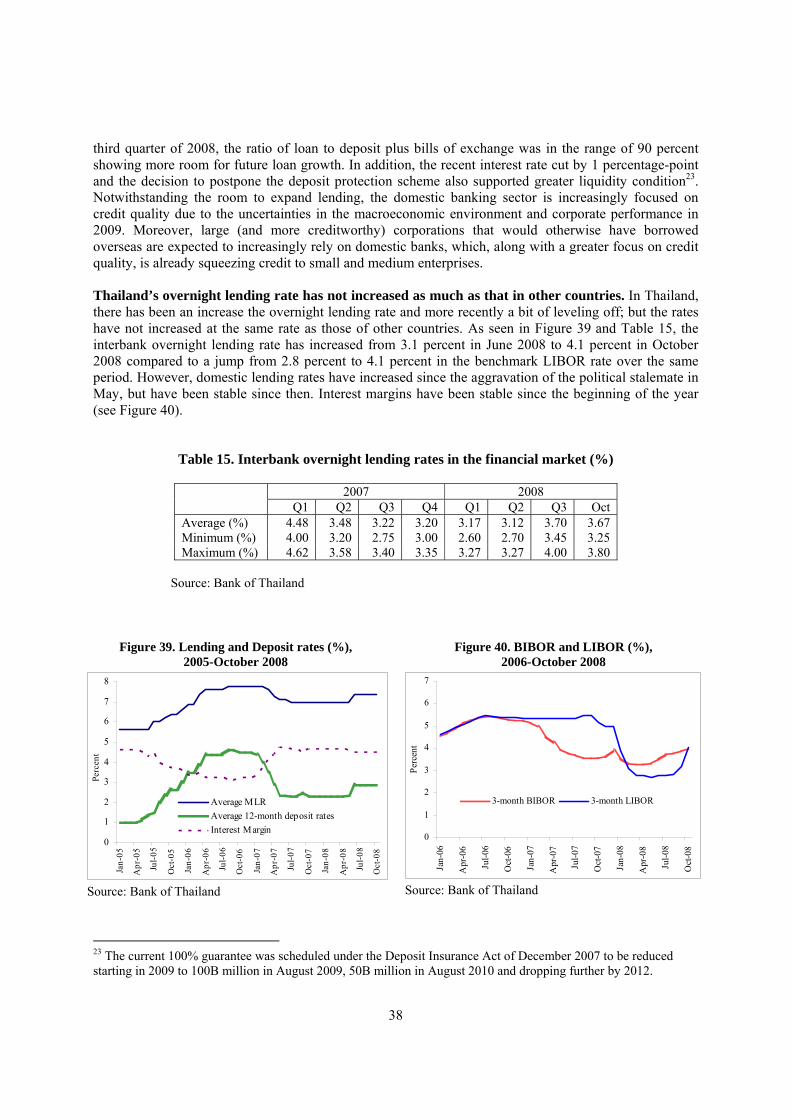
38
third quarter of 2008, the ratio of loan to deposit plus bills of exchange was in the range of 90 percent showing more room for future loan growth. In addition, the recent interest rate cut by 1 percentage-point and the decision to postpone the deposit protection scheme also supported greater liquidity condition23. Notwithstanding the room to expand lending, the domestic banking sector is increasingly focused on credit quality due to the uncertainties in the macroeconomic environment and corporate performance in 2009. Moreover, large (and more creditworthy) corporations that would otherwise have borrowed overseas are expected to increasingly rely on domestic banks, which, along with a greater focus on credit quality, is already squeezing credit to small and medium enterprises. Thailand’s overnight lending rate has not increased as much as that in other countries. In Thailand, there has been an increase the overnight lending rate and more recently a bit of leveling off; but the rates have not increased at the same rate as those of other countries. As seen in Figure 39 and Table 15, the interbank overnight lending rate has increased from 3.1 percent in June 2008 to 4.1 percent in October 2008 compared to a jump from 2.8 percent to 4.1 percent in the benchmark LIBOR rate over the same period. However, domestic lending rates have increased since the aggravation of the political stalemate in May, but have been stable since then. Interest margins have been stable since the beginning of the year (see Figure 40).
Table 15. Interbank overnight lending rates in the financial market (%)
2007 2008 Q1 Q2 Q3 Q4 Q1 Q2 Q3 Oct
Average (%) 4.48 3.48 3.22 3.20 3.17 3.12 3.70 3.67 Minimum (%) 4.00 3.20 2.75 3.00 2.60 2.70 3.45 3.25 Maximum (%) 4.62 3.58 3.40 3.35 3.27 3.27 4.00 3.80
Source: Bank of Thailand
Figure 39. Lending and Deposit rates (%), 2005-October 2008
0
1
2
3
4
5
6
7
8
Jan-
05
Apr
-05
Jul-0
5
Oct
-05
Jan-
06
Apr
-06
Jul-0
6
Oct
-06
Jan-
07
Apr
-07
Jul-0
7
Oct
-07
Jan-
08
Apr
-08
Jul-0
8
Oct
-08
Perc
ent
Average MLRAverage 12-month deposit ratesInterest Margin
Source: Bank of Thailand
Figure 40. BIBOR and LIBOR (%), 2006-October 2008
0
1
2
3
4
5
6
7
Jan-
06
Apr
-06
Jul-0
6
Oct
-06
Jan-
07
Apr
-07
Jul-0
7
Oct
-07
Jan-
08
Apr
-08
Jul-0
8
Oct
-08
Perc
ent
3-month BIBOR 3-month LIBOR
Source: Bank of Thailand
23 The current 100% guarantee was scheduled under the Deposit Insurance Act of December 2007 to be reduced starting in 2009 to 100B million in August 2009, 50B million in August 2010 and dropping further by 2012.
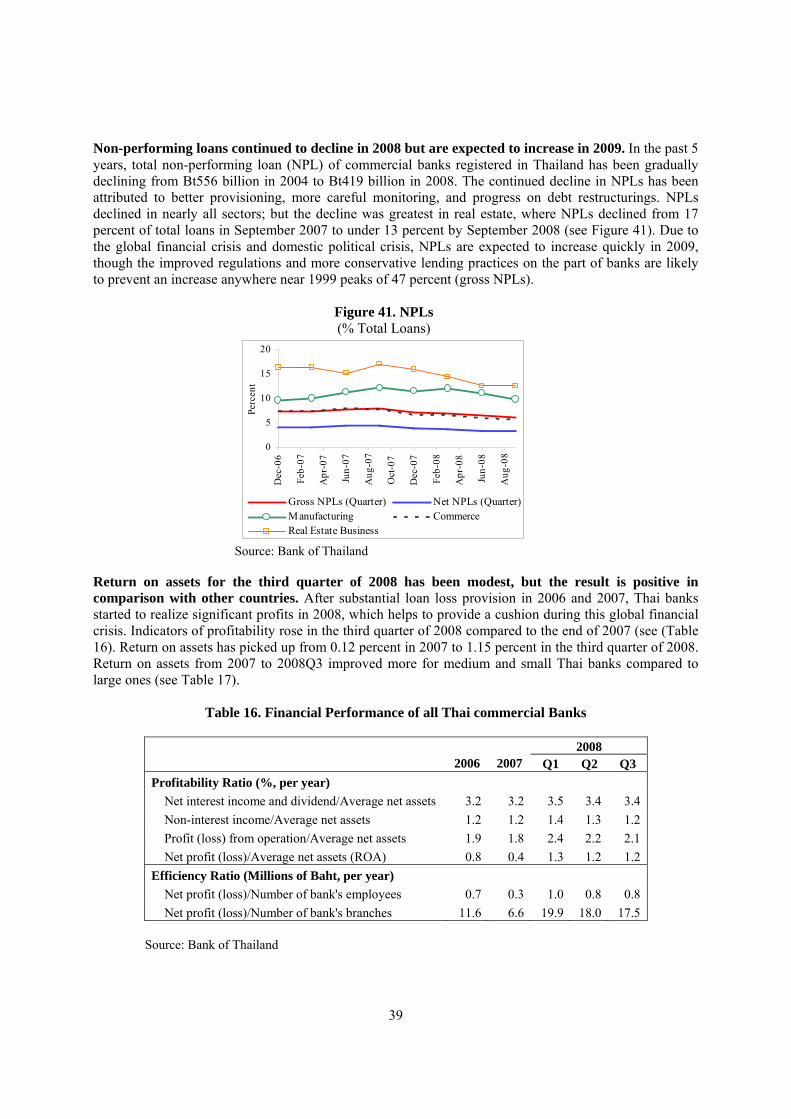
39
Non-performing loans continued to decline in 2008 but are expected to increase in 2009. In the past 5 years, total non-performing loan (NPL) of commercial banks registered in Thailand has been gradually declining from Bt556 billion in 2004 to Bt419 billion in 2008. The continued decline in NPLs has been attributed to better provisioning, more careful monitoring, and progress on debt restructurings. NPLs declined in nearly all sectors; but the decline was greatest in real estate, where NPLs declined from 17 percent of total loans in September 2007 to under 13 percent by September 2008 (see Figure 41). Due to the global financial crisis and domestic political crisis, NPLs are expected to increase quickly in 2009, though the improved regulations and more conservative lending practices on the part of banks are likely to prevent an increase anywhere near 1999 peaks of 47 percent (gross NPLs).
Figure 41. NPLs (% Total Loans)
0
5
10
15
20
Dec
-06
Feb-
07
Apr
-07
Jun-
07
Aug
-07
Oct
-07
Dec
-07
Feb-
08
Apr
-08
Jun-
08
Aug
-08
Perc
ent
Gross NPLs (Quarter) Net NPLs (Quarter)Manufacturing CommerceReal Estate Business
Source: Bank of Thailand
Return on assets for the third quarter of 2008 has been modest, but the result is positive in comparison with other countries. After substantial loan loss provision in 2006 and 2007, Thai banks started to realize significant profits in 2008, which helps to provide a cushion during this global financial crisis. Indicators of profitability rose in the third quarter of 2008 compared to the end of 2007 (see (Table 16). Return on assets has picked up from 0.12 percent in 2007 to 1.15 percent in the third quarter of 2008. Return on assets from 2007 to 2008Q3 improved more for medium and small Thai banks compared to large ones (see Table 17).
Table 16. Financial Performance of all Thai commercial Banks
2008 2006 2007 Q1 Q2 Q3
Profitability Ratio (%, per year) Net interest income and dividend/Average net assets 3.2 3.2 3.5 3.4 3.4 Non-interest income/Average net assets 1.2 1.2 1.4 1.3 1.2 Profit (loss) from operation/Average net assets 1.9 1.8 2.4 2.2 2.1 Net profit (loss)/Average net assets (ROA) 0.8 0.4 1.3 1.2 1.2 Efficiency Ratio (Millions of Baht, per year) Net profit (loss)/Number of bank's employees 0.7 0.3 1.0 0.8 0.8 Net profit (loss)/Number of bank's branches 11.6 6.6 19.9 18.0 17.5
Source: Bank of Thailand
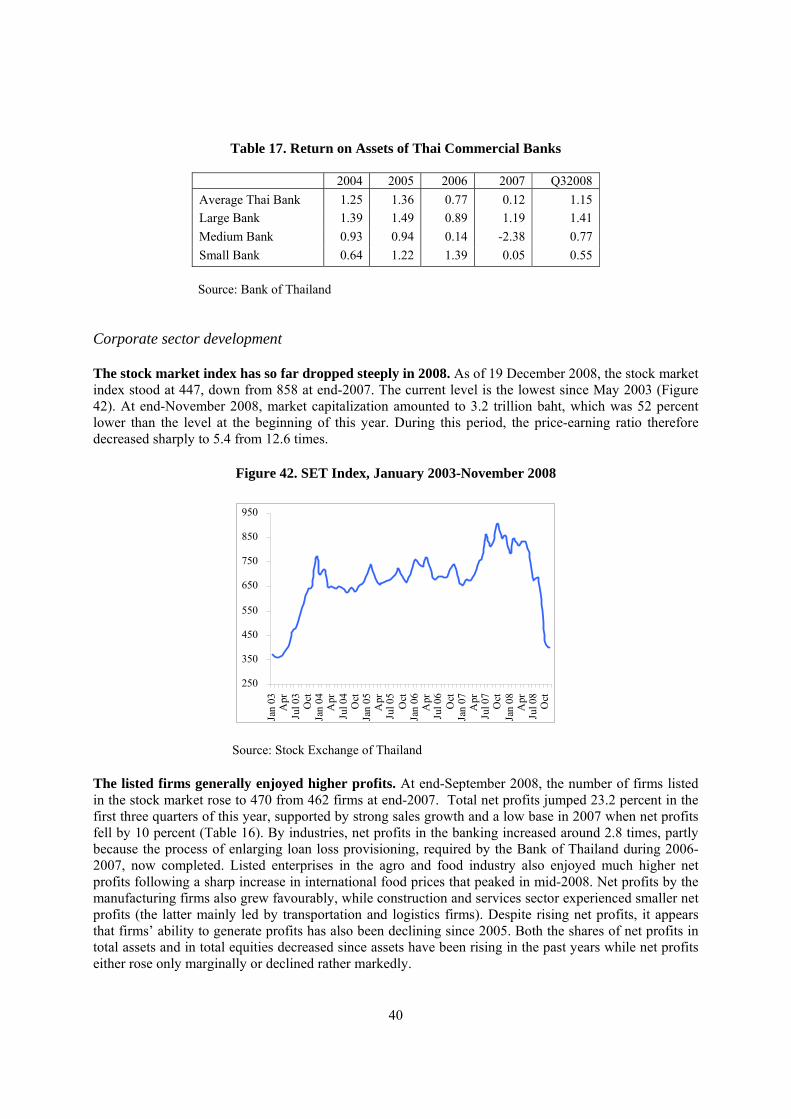
40
Table 17. Return on Assets of Thai Commercial Banks
2004 2005 2006 2007 Q32008 Average Thai Bank 1.25 1.36 0.77 0.12 1.15 Large Bank 1.39 1.49 0.89 1.19 1.41 Medium Bank 0.93 0.94 0.14 -2.38 0.77 Small Bank 0.64 1.22 1.39 0.05 0.55
Source: Bank of Thailand
Corporate sector development The stock market index has so far dropped steeply in 2008. As of 19 December 2008, the stock market index stood at 447, down from 858 at end-2007. The current level is the lowest since May 2003 (Figure 42). At end-November 2008, market capitalization amounted to 3.2 trillion baht, which was 52 percent lower than the level at the beginning of this year. During this period, the price-earning ratio therefore decreased sharply to 5.4 from 12.6 times.
Figure 42. SET Index, January 2003-November 2008
250
350
450
550
650
750
850
950
Jan
03A
prJu
l 03
Oct
Jan
04A
prJu
l 04
Oct
Jan
05A
prJu
l 05
Oct
Jan
06A
prJu
l 06
Oct
Jan
07A
prJu
l 07
Oct
Jan
08A
prJu
l 08
Oct
Source: Stock Exchange of Thailand The listed firms generally enjoyed higher profits. At end-September 2008, the number of firms listed in the stock market rose to 470 from 462 firms at end-2007. Total net profits jumped 23.2 percent in the first three quarters of this year, supported by strong sales growth and a low base in 2007 when net profits fell by 10 percent (Table 16). By industries, net profits in the banking increased around 2.8 times, partly because the process of enlarging loan loss provisioning, required by the Bank of Thailand during 2006-2007, now completed. Listed enterprises in the agro and food industry also enjoyed much higher net profits following a sharp increase in international food prices that peaked in mid-2008. Net profits by the manufacturing firms also grew favourably, while construction and services sector experienced smaller net profits (the latter mainly led by transportation and logistics firms). Despite rising net profits, it appears that firms’ ability to generate profits has also been declining since 2005. Both the shares of net profits in total assets and in total equities decreased since assets have been rising in the past years while net profits either rose only marginally or declined rather markedly.
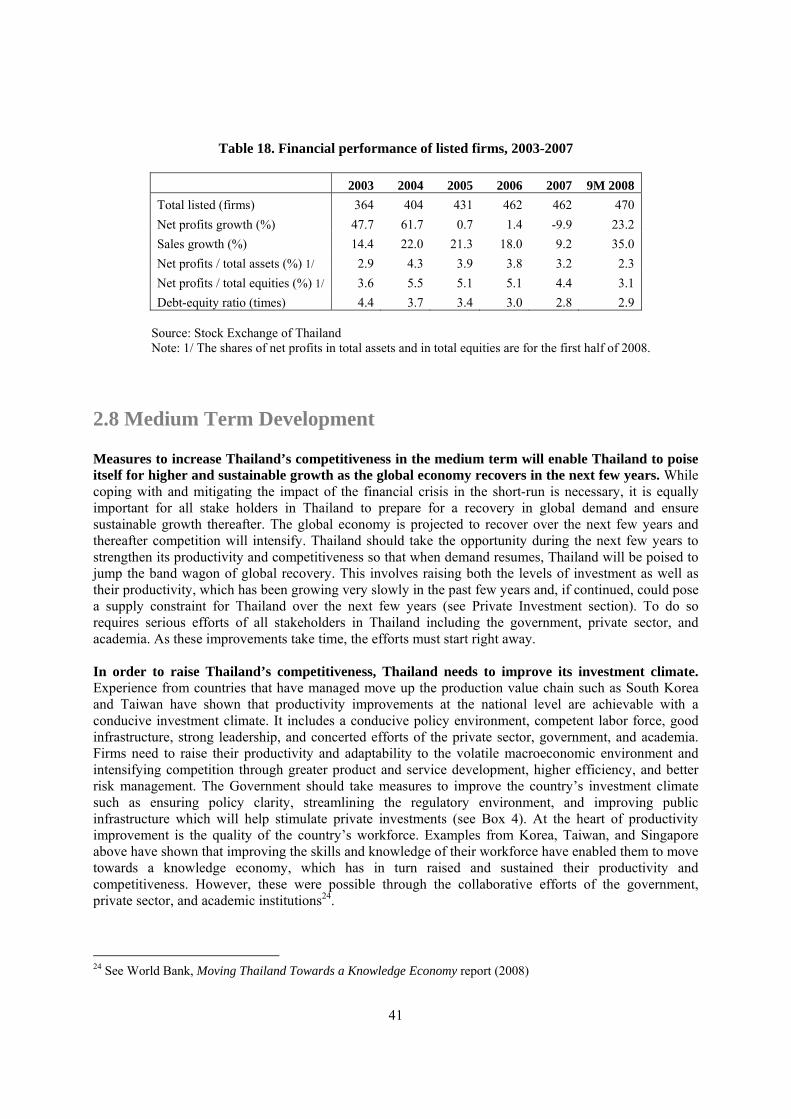
41
Table 18. Financial performance of listed firms, 2003-2007
2003 2004 2005 2006 2007 9M 2008 Total listed (firms) 364 404 431 462 462 470 Net profits growth (%) 47.7 61.7 0.7 1.4 -9.9 23.2 Sales growth (%) 14.4 22.0 21.3 18.0 9.2 35.0 Net profits / total assets (%) 1/ 2.9 4.3 3.9 3.8 3.2 2.3 Net profits / total equities (%) 1/ 3.6 5.5 5.1 5.1 4.4 3.1 Debt-equity ratio (times) 4.4 3.7 3.4 3.0 2.8 2.9
Source: Stock Exchange of Thailand Note: 1/ The shares of net profits in total assets and in total equities are for the first half of 2008.
2.8 Medium Term Development Measures to increase Thailand’s competitiveness in the medium term will enable Thailand to poise itself for higher and sustainable growth as the global economy recovers in the next few years. While coping with and mitigating the impact of the financial crisis in the short-run is necessary, it is equally important for all stake holders in Thailand to prepare for a recovery in global demand and ensure sustainable growth thereafter. The global economy is projected to recover over the next few years and thereafter competition will intensify. Thailand should take the opportunity during the next few years to strengthen its productivity and competitiveness so that when demand resumes, Thailand will be poised to jump the band wagon of global recovery. This involves raising both the levels of investment as well as their productivity, which has been growing very slowly in the past few years and, if continued, could pose a supply constraint for Thailand over the next few years (see Private Investment section). To do so requires serious efforts of all stakeholders in Thailand including the government, private sector, and academia. As these improvements take time, the efforts must start right away. In order to raise Thailand’s competitiveness, Thailand needs to improve its investment climate. Experience from countries that have managed move up the production value chain such as South Korea and Taiwan have shown that productivity improvements at the national level are achievable with a conducive investment climate. It includes a conducive policy environment, competent labor force, good infrastructure, strong leadership, and concerted efforts of the private sector, government, and academia. Firms need to raise their productivity and adaptability to the volatile macroeconomic environment and intensifying competition through greater product and service development, higher efficiency, and better risk management. The Government should take measures to improve the country’s investment climate such as ensuring policy clarity, streamlining the regulatory environment, and improving public infrastructure which will help stimulate private investments (see Box 4). At the heart of productivity improvement is the quality of the country’s workforce. Examples from Korea, Taiwan, and Singapore above have shown that improving the skills and knowledge of their workforce have enabled them to move towards a knowledge economy, which has in turn raised and sustained their productivity and competitiveness. However, these were possible through the collaborative efforts of the government, private sector, and academic institutions24.
24 See World Bank, Moving Thailand Towards a Knowledge Economy report (2008)
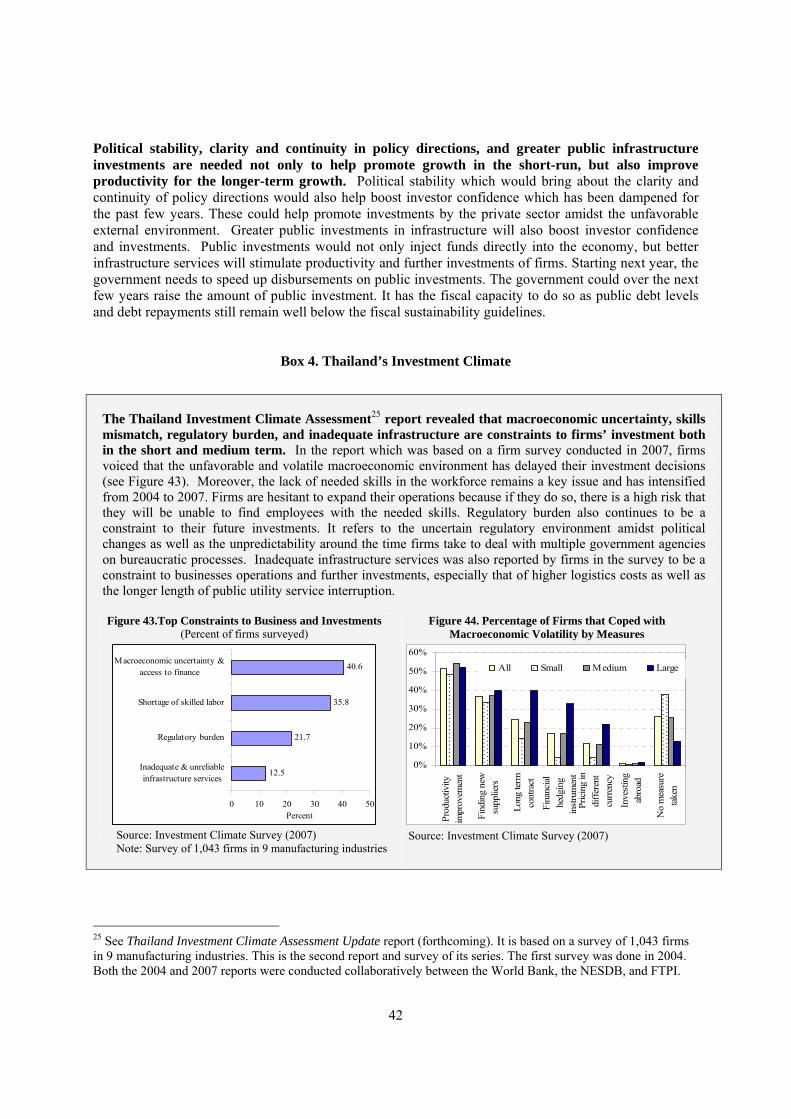
42
Political stability, clarity and continuity in policy directions, and greater public infrastructure investments are needed not only to help promote growth in the short-run, but also improve productivity for the longer-term growth. Political stability which would bring about the clarity and continuity of policy directions would also help boost investor confidence which has been dampened for the past few years. These could help promote investments by the private sector amidst the unfavorable external environment. Greater public investments in infrastructure will also boost investor confidence and investments. Public investments would not only inject funds directly into the economy, but better infrastructure services will stimulate productivity and further investments of firms. Starting next year, the government needs to speed up disbursements on public investments. The government could over the next few years raise the amount of public investment. It has the fiscal capacity to do so as public debt levels and debt repayments still remain well below the fiscal sustainability guidelines.
Box 4. Thailand’s Investment Climate
The Thailand Investment Climate Assessment25 report revealed that macroeconomic uncertainty, skills mismatch, regulatory burden, and inadequate infrastructure are constraints to firms’ investment both in the short and medium term. In the report which was based on a firm survey conducted in 2007, firms voiced that the unfavorable and volatile macroeconomic environment has delayed their investment decisions (see Figure 43). Moreover, the lack of needed skills in the workforce remains a key issue and has intensified from 2004 to 2007. Firms are hesitant to expand their operations because if they do so, there is a high risk that they will be unable to find employees with the needed skills. Regulatory burden also continues to be a constraint to their future investments. It refers to the uncertain regulatory environment amidst political changes as well as the unpredictability around the time firms take to deal with multiple government agencies on bureaucratic processes. Inadequate infrastructure services was also reported by firms in the survey to be a constraint to businesses operations and further investments, especially that of higher logistics costs as well as the longer length of public utility service interruption.
Figure 43.Top Constraints to Business and Investments
(Percent of firms surveyed) Figure 44. Percentage of Firms that Coped with
Macroeconomic Volatility by Measures
12.5
21.7
35.8
40.6
0 10 20 30 40 50
Inadequate & unreliableinfrastructure services
Regulatory burden
Shortage of skilled labor
Macroeconomic uncertainty &access to finance
Percent
Source: Investment Climate Survey (2007) Note: Survey of 1,043 firms in 9 manufacturing industries
0%
10%
20%
30%
40%
50%
60%
Prod
uctiv
ityim
prov
emen
t
Find
ing
new
supp
liers
Long
term
cont
ract
Fina
ncia
lhe
dgin
gin
stru
men
tPr
icin
g in
diff
eren
tcu
rren
cy
Inve
stin
gab
road
No
mea
sure
take
nAll Small Medium Large
Source: Investment Climate Survey (2007)
25 See Thailand Investment Climate Assessment Update report (forthcoming). It is based on a survey of 1,043 firms in 9 manufacturing industries. This is the second report and survey of its series. The first survey was done in 2004. Both the 2004 and 2007 reports were conducted collaboratively between the World Bank, the NESDB, and FTPI.
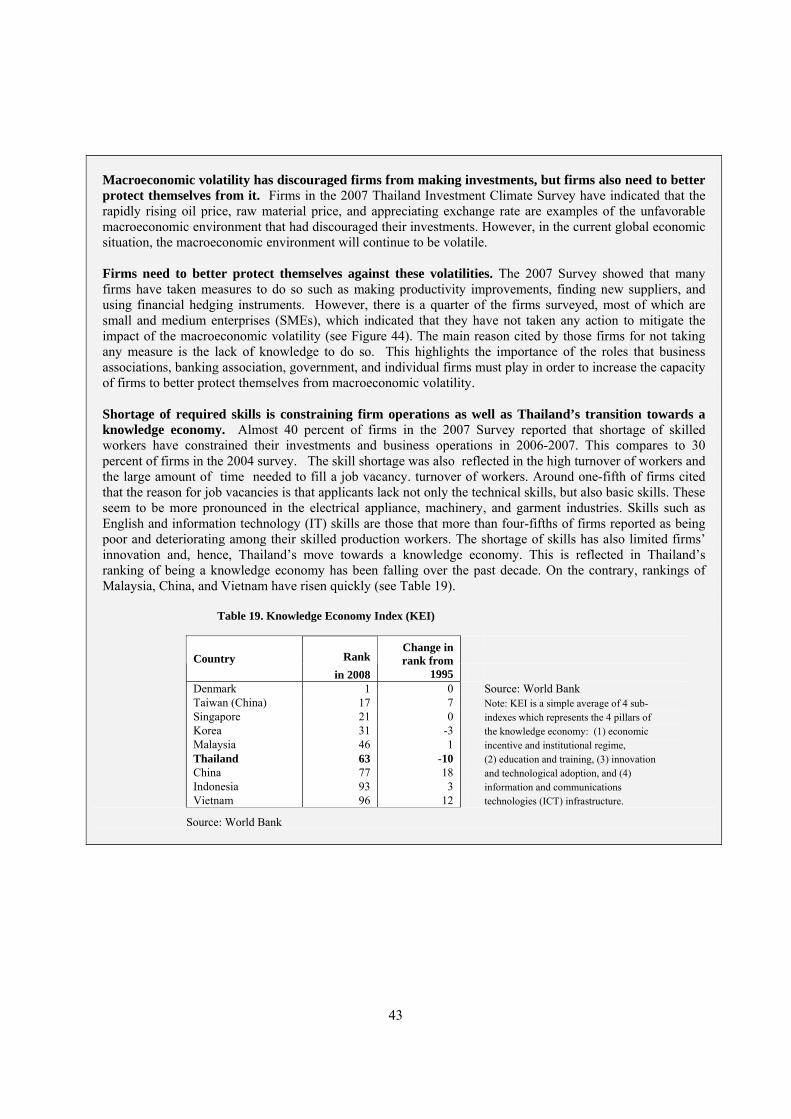
43
Macroeconomic volatility has discouraged firms from making investments, but firms also need to better protect themselves from it. Firms in the 2007 Thailand Investment Climate Survey have indicated that the rapidly rising oil price, raw material price, and appreciating exchange rate are examples of the unfavorable macroeconomic environment that had discouraged their investments. However, in the current global economic situation, the macroeconomic environment will continue to be volatile. Firms need to better protect themselves against these volatilities. The 2007 Survey showed that many firms have taken measures to do so such as making productivity improvements, finding new suppliers, and using financial hedging instruments. However, there is a quarter of the firms surveyed, most of which are small and medium enterprises (SMEs), which indicated that they have not taken any action to mitigate the impact of the macroeconomic volatility (see Figure 44). The main reason cited by those firms for not taking any measure is the lack of knowledge to do so. This highlights the importance of the roles that business associations, banking association, government, and individual firms must play in order to increase the capacity of firms to better protect themselves from macroeconomic volatility. Shortage of required skills is constraining firm operations as well as Thailand’s transition towards a knowledge economy. Almost 40 percent of firms in the 2007 Survey reported that shortage of skilled workers have constrained their investments and business operations in 2006-2007. This compares to 30 percent of firms in the 2004 survey. The skill shortage was also reflected in the high turnover of workers and the large amount of time needed to fill a job vacancy. turnover of workers. Around one-fifth of firms cited that the reason for job vacancies is that applicants lack not only the technical skills, but also basic skills. These seem to be more pronounced in the electrical appliance, machinery, and garment industries. Skills such as English and information technology (IT) skills are those that more than four-fifths of firms reported as being poor and deteriorating among their skilled production workers. The shortage of skills has also limited firms’ innovation and, hence, Thailand’s move towards a knowledge economy. This is reflected in Thailand’s ranking of being a knowledge economy has been falling over the past decade. On the contrary, rankings of Malaysia, China, and Vietnam have risen quickly (see Table 19).
Table 19. Knowledge Economy Index (KEI)
Rank
Country in 2008
Change in rank from
1995 Denmark 1 0 Source: World Bank Taiwan (China) 17 7 Note: KEI is a simple average of 4 sub- Singapore 21 0 indexes which represents the 4 pillars of Korea 31 -3 the knowledge economy: (1) economic Malaysia 46 1 incentive and institutional regime, Thailand 63 -10 (2) education and training, (3) innovation China 77 18 and technological adoption, and (4) Indonesia 93 3 information and communications Vietnam 96 12 technologies (ICT) infrastructure.
Source: World Bank
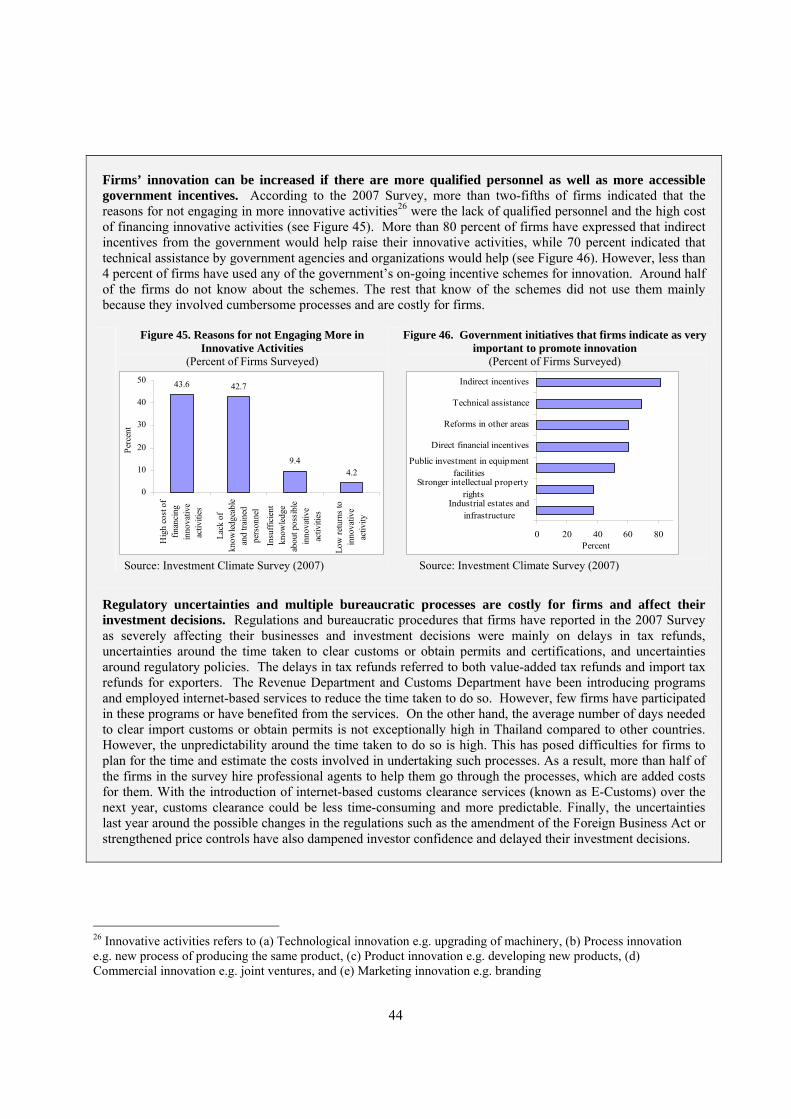
44
Firms’ innovation can be increased if there are more qualified personnel as well as more accessible government incentives. According to the 2007 Survey, more than two-fifths of firms indicated that the reasons for not engaging in more innovative activities26 were the lack of qualified personnel and the high cost of financing innovative activities (see Figure 45). More than 80 percent of firms have expressed that indirect incentives from the government would help raise their innovative activities, while 70 percent indicated that technical assistance by government agencies and organizations would help (see Figure 46). However, less than 4 percent of firms have used any of the government’s on-going incentive schemes for innovation. Around half of the firms do not know about the schemes. The rest that know of the schemes did not use them mainly because they involved cumbersome processes and are costly for firms.
Figure 45. Reasons for not Engaging More in
Innovative Activities (Percent of Firms Surveyed)
Figure 46. Government initiatives that firms indicate as very important to promote innovation
(Percent of Firms Surveyed)
43.6 42.7
9.44.2
0
10
20
30
40
50
Hig
h co
st o
ffin
anci
ngin
nova
tive
activ
ities
Lack
of
know
ledg
eabl
ean
d tra
ined
pers
onne
l
Insu
ffic
ient
know
ledg
eab
out p
ossi
ble
inno
vativ
eac
tiviti
es
Low
retu
rns
toin
nova
tive
activ
ity
Perc
ent
Source: Investment Climate Survey (2007)
0 20 40 60 80
Industrial estates andinfrastructure
Stronger intellectual propertyrights
Public investment in equipmentfacilities
Direct financial incentives
Reforms in other areas
Technical assistance
Indirect incentives
Percent
Source: Investment Climate Survey (2007)
Regulatory uncertainties and multiple bureaucratic processes are costly for firms and affect their investment decisions. Regulations and bureaucratic procedures that firms have reported in the 2007 Survey as severely affecting their businesses and investment decisions were mainly on delays in tax refunds, uncertainties around the time taken to clear customs or obtain permits and certifications, and uncertainties around regulatory policies. The delays in tax refunds referred to both value-added tax refunds and import tax refunds for exporters. The Revenue Department and Customs Department have been introducing programs and employed internet-based services to reduce the time taken to do so. However, few firms have participated in these programs or have benefited from the services. On the other hand, the average number of days needed to clear import customs or obtain permits is not exceptionally high in Thailand compared to other countries. However, the unpredictability around the time taken to do so is high. This has posed difficulties for firms to plan for the time and estimate the costs involved in undertaking such processes. As a result, more than half of the firms in the survey hire professional agents to help them go through the processes, which are added costs for them. With the introduction of internet-based customs clearance services (known as E-Customs) over the next year, customs clearance could be less time-consuming and more predictable. Finally, the uncertainties last year around the possible changes in the regulations such as the amendment of the Foreign Business Act or strengthened price controls have also dampened investor confidence and delayed their investment decisions.
26 Innovative activities refers to (a) Technological innovation e.g. upgrading of machinery, (b) Process innovation e.g. new process of producing the same product, (c) Product innovation e.g. developing new products, (d) Commercial innovation e.g. joint ventures, and (e) Marketing innovation e.g. branding
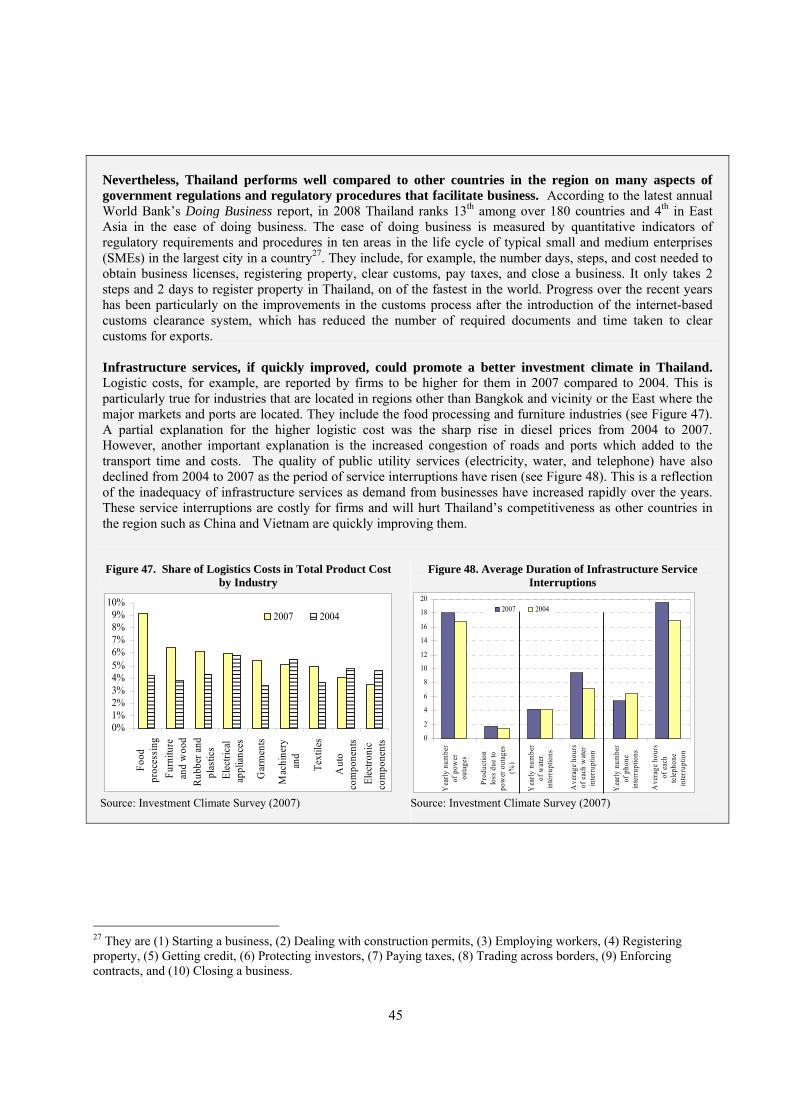
45
Nevertheless, Thailand performs well compared to other countries in the region on many aspects of government regulations and regulatory procedures that facilitate business. According to the latest annual World Bank’s Doing Business report, in 2008 Thailand ranks 13th among over 180 countries and 4th in East Asia in the ease of doing business. The ease of doing business is measured by quantitative indicators of regulatory requirements and procedures in ten areas in the life cycle of typical small and medium enterprises (SMEs) in the largest city in a country27. They include, for example, the number days, steps, and cost needed to obtain business licenses, registering property, clear customs, pay taxes, and close a business. It only takes 2 steps and 2 days to register property in Thailand, on of the fastest in the world. Progress over the recent years has been particularly on the improvements in the customs process after the introduction of the internet-based customs clearance system, which has reduced the number of required documents and time taken to clear customs for exports. Infrastructure services, if quickly improved, could promote a better investment climate in Thailand. Logistic costs, for example, are reported by firms to be higher for them in 2007 compared to 2004. This is particularly true for industries that are located in regions other than Bangkok and vicinity or the East where the major markets and ports are located. They include the food processing and furniture industries (see Figure 47). A partial explanation for the higher logistic cost was the sharp rise in diesel prices from 2004 to 2007. However, another important explanation is the increased congestion of roads and ports which added to the transport time and costs. The quality of public utility services (electricity, water, and telephone) have also declined from 2004 to 2007 as the period of service interruptions have risen (see Figure 48). This is a reflection of the inadequacy of infrastructure services as demand from businesses have increased rapidly over the years. These service interruptions are costly for firms and will hurt Thailand’s competitiveness as other countries in the region such as China and Vietnam are quickly improving them.
Figure 47. Share of Logistics Costs in Total Product Cost
by Industry Figure 48. Average Duration of Infrastructure Service
Interruptions
0%1%2%3%4%5%6%7%8%9%
10%
Food
proc
essi
ngFu
rnitu
rean
d w
ood
Rub
ber a
ndpl
astic
sEl
ectri
cal
appl
ianc
es
Gar
men
ts
Mac
hine
ryan
d
Text
iles
Aut
oco
mpo
nent
sEl
ectro
nic
com
pone
nts
2007 2004
Source: Investment Climate Survey (2007)
0
2
4
6
8
10
12
14
16
18
20
Yea
rly n
umbe
rof
pow
erou
tage
s
Prod
uctio
nlo
ss d
ue to
pow
er o
utag
es(%
)
Yea
rly n
umbe
rof
wat
erin
terr
uptio
ns
Ave
rage
hou
rsof
eac
h w
ater
inte
rrup
tion
Yea
rly n
umbe
rof
pho
nein
terr
uptio
ns
Ave
rage
hou
rsof
eac
hte
leph
one
inte
rrup
tion
2007 2004
Source: Investment Climate Survey (2007)
27 They are (1) Starting a business, (2) Dealing with construction permits, (3) Employing workers, (4) Registering property, (5) Getting credit, (6) Protecting investors, (7) Paying taxes, (8) Trading across borders, (9) Enforcing contracts, and (10) Closing a business.
46
SECTION 3
IMPLEMENTATION OF STRUCTURAL REFORMS
3.1 Financial and Corporate Sector Reforms and Restructuring Thailand continues to reform its financial and corporate sectors in order to be better prepared in the greater competitive market. There are laws that were enacted and effective in the second half of 2008. There are some acts waiting to be effective next year where some are delayed. These laws are summarized in Appendix 2: Monitoring Matrices for Structural Reform Implementation. However this section will elaborate some in more details. The Demutualization of the Stock Exchange of Thailand (SET) was approved for implementation in 2009 and aims to restructure the SET organization by 2013. The Stock Exchange of Thailand (SET)’s Board of Governors approved the Demutualization of the SET group in principal. The demutualization will encourage customer’s satisfaction by promoting effective resource management, cost efficiency and maximize returns from fund-raising in the capital market. Under this plan, the SET will become a listed company on the Exchange by 2011, by which time it will have achieved its 5-year strategic targets including doubling capitalization of the cash equity market and its revenue by 2013 – with 25 percent of this income coming from new products. In addition the Exchange will increase foreign listings to not less than 5 percent of total market capitalization. The new structure proposes 2 major groups: (1) The Stock Exchange of Thailand and (2) the Capital Market Development Fund (CMDF). The SET will focus mainly on the capital market functions while the CMDF will deal with long-term capital development through investor education, capital market personnel development and support for SET Research Institute, corporate governance and corporate social responsibility. The SET installed new Trading System to facilitate future growths. The SET has replaced the Automated System for the Stock Exchange of Thailand (ASSET) with the new automated trading system named the Advanced Resilient Matching System (ARMS). This new system, which matches with those used by leading global stock market, can accommodate higher trade volumes and new products and support the planned ASEAN Linkage project. The SET expanded its products range. In 2008, the SET officially launched new products in the market in order to widen the variety of investment tools available on the market place which consists of the followings: 1. FTSE SET Index Series: SET has launched the FTSE SET Index Series to facilitate the future product innovation for both local and foreign investors. The Index Series consists of 6 separate indices: (1) FTSE SET Large Cap, (2) FTSE SET Mid Cap, (3) FTSE SET Small Cap, (4) FTSE SET Mid/Small Cap, (5) FTSE SET All-Share and (6) FTSE SET Fledgling.
2. MTrack Energy ETF: SET introduced exchange-traded fund (ETF) based on the SET Energy & Utility Sector Index, namely the ENGY, in addition to the TDEX which based on the SET 50 Index. The ETF provides investors with risk management instrument. Because the ETF is underpinned by diverse stocks
47
in sector with large market capitalization and high liquidity, it will attract investors wishing to avoid the risks entailed in individual stock investment.
3. Stock Futures: The Thailand Futures Exchange (TFEX) launched its first 3 single stock futures in order to better manage risks. The underlying stocks are PTT Public Company Limited (PTT), PTT Exploration and Production Public Company Limited (PTTEP) and Advanced Info Service Public Company Limited (ADVANC).
4. Gold Futures: The Finance Ministry granted an approval for gold futures to be traded in 2009 while the Securities and Exchange Commission (SEC) endorsed the requisite regulatory amendments and contract specifications. The underlying of the gold future is the 96.5 percent gold bar which is commonly traded in Thailand. The gold future will be traded by cash settlement via the Thailand Clearing House Co., Ltd. (TCH). Gold futures will be first introduced with the contract size of 50 baht gold.
E-Dividend is introduced to replace current dividend payment system. The Thailand Securities Depository Co., Ltd. (TSD) has introduced the e-dividend system to increase the speed of the dividend payment to shareholders and the efficiency of the system by reducing the number of returned checks. Currently Bank of Thailand (BOT) sets the limit of dividend transferred via bank account at BT 2 million per account. TSD plans to relax this guideline. The Cabinet approved some measures to support the stock market during the current financial crisis. A Matching Fund aimed to invest in SET market is being set up in order to support the stock market if foreign investors continue to repatriate their investment back home during this financial crisis. In addition, the Cabinet approved the increase in tax allowance limit for taxpayers who wish to invest in Retirement Mutual Fund (RMF) and Long Term Fund (LTF) from Bt500,000 to Bt700,000. The Cabinet approved the schemes for Grassroots Economy to curb with current financial turmoil. The cabinet approved in principle of direct funding schemes for grassroots people and grassroots economy which includes the following 6 strategies: (i) Guidelines to oversee and examine the capacity of the villages and communities (SML), (ii) Measures on fund raising and knowledge management of the village fund and urban community, (iii) The program to restore and to relieve small scale debt of farmers and the poor, (iv) People’s bank project by the Government Savings Bank, (v) Project of housing loans by the Bank of Agriculture and Agricultural Cooperatives (BAAC), and (vi) Loan project for farmers by the Bank for Agriculture and Agricultural Cooperatives (BAAC). The Financial Sector Master Plan (FSMP) Phase II is expected to be implemented next year. The Financial Sector Master Plan (FSMP) Phase II, which is a five-year plan ranging from 2009-2013, will be implemented in 2009. This plan aims to reduce operating costs of financial institutions; increase competition among financial institutions and non-bank entities through expanding the business scope permitted banks and greater foreign participation; and improve market architecture with the development of limited deposit insurance and greater variety in risk-management instruments. The new plan allows greater competition in the banking industry. The plan would strengthen the banking system by lowering the NPL ratio to less than 2 percent in 5 years (2013). The BOT will introduce three practices to abolish NPLs; (1) create incentives to promote asset-sales transactions; (2) encourage debtors to participate in debt restructuring and hasten the legal process for asset foreclosures; and (3) promote asset-backed financial instruments to boost assets’ liquidity. Lower NPLs would improve the banks’ efficiency to generate more income and reduce costs due to the declining burden from provision. The approved Financial Institution Business Act (FIBA) facilitates increase in foreign ownership in Thai foreign institutions. The Financial Institution Business Act (FIBA) became effective on 3 August 2008 as planned. The FIBA allows financial institutions to raise the foreign limit from 25 percent to 49
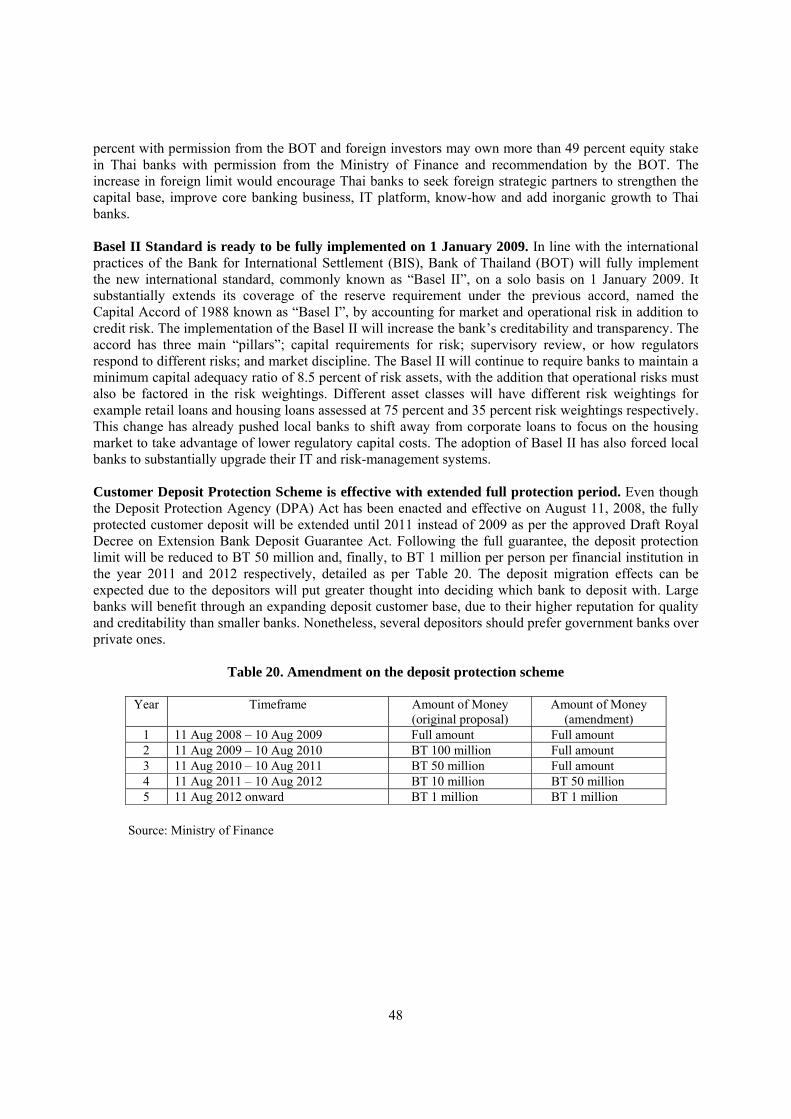
48
percent with permission from the BOT and foreign investors may own more than 49 percent equity stake in Thai banks with permission from the Ministry of Finance and recommendation by the BOT. The increase in foreign limit would encourage Thai banks to seek foreign strategic partners to strengthen the capital base, improve core banking business, IT platform, know-how and add inorganic growth to Thai banks. Basel II Standard is ready to be fully implemented on 1 January 2009. In line with the international practices of the Bank for International Settlement (BIS), Bank of Thailand (BOT) will fully implement the new international standard, commonly known as “Basel II”, on a solo basis on 1 January 2009. It substantially extends its coverage of the reserve requirement under the previous accord, named the Capital Accord of 1988 known as “Basel I”, by accounting for market and operational risk in addition to credit risk. The implementation of the Basel II will increase the bank’s creditability and transparency. The accord has three main “pillars”; capital requirements for risk; supervisory review, or how regulators respond to different risks; and market discipline. The Basel II will continue to require banks to maintain a minimum capital adequacy ratio of 8.5 percent of risk assets, with the addition that operational risks must also be factored in the risk weightings. Different asset classes will have different risk weightings for example retail loans and housing loans assessed at 75 percent and 35 percent risk weightings respectively. This change has already pushed local banks to shift away from corporate loans to focus on the housing market to take advantage of lower regulatory capital costs. The adoption of Basel II has also forced local banks to substantially upgrade their IT and risk-management systems. Customer Deposit Protection Scheme is effective with extended full protection period. Even though the Deposit Protection Agency (DPA) Act has been enacted and effective on August 11, 2008, the fully protected customer deposit will be extended until 2011 instead of 2009 as per the approved Draft Royal Decree on Extension Bank Deposit Guarantee Act. Following the full guarantee, the deposit protection limit will be reduced to BT 50 million and, finally, to BT 1 million per person per financial institution in the year 2011 and 2012 respectively, detailed as per Table 20. The deposit migration effects can be expected due to the depositors will put greater thought into deciding which bank to deposit with. Large banks will benefit through an expanding deposit customer base, due to their higher reputation for quality and creditability than smaller banks. Nonetheless, several depositors should prefer government banks over private ones.
Table 20. Amendment on the deposit protection scheme
Year Timeframe Amount of Money (original proposal)
Amount of Money (amendment)
1 11 Aug 2008 – 10 Aug 2009 Full amount Full amount 2 11 Aug 2009 – 10 Aug 2010 BT 100 million Full amount 3 11 Aug 2010 – 10 Aug 2011 BT 50 million Full amount 4 11 Aug 2011 – 10 Aug 2012 BT 10 million BT 50 million 5 11 Aug 2012 onward BT 1 million BT 1 million
Source: Ministry of Finance
49
3.2 Recent Trade Reforms Tariff reform Thailand continues to reduce import tariff rates for various products. These include both universal tariff reductions, which are applicable to goods from all countries, and specific tariff reductions that result from free trade agreements (FTAs) with other countries and regions. For example, since June 2008, a wide range of agricultural and manufactured products from ASEAN member countries, China, India, and New Zealand enjoy lower or no tariffs. Among others, they are butter, vegetable extracts and fats, pharmaceutical products, paper and tubes for a medical use, pumps for liquid, air and vacuum pumps, commercial trucks, steel tubes, iron wires, aluminium structures, dishwashing machines, weighting machines, and switching circuits and boards parts. In addition, the government will also cut or cancel tariffs for three types of animal feeds (soybean, corn, and fish meals) in 2009. The magnitude of changes varies across different trade agreements, such as those with the WTO, ASEAN, ACMECS28, Japan, Australia, and New Zealand. Imports from new ASEAN member countries also have lower import duties. As part of ASEAN Integration System of Preferences (AISP), tariffs of products such as vinegar, chilli, certain vegetables, wood products, and electronic switchboards imported from Cambodia, Myanmar and Lao PDR are either reduced or abolished from September 2008. Import tariffs on machinery are waived for regional operating headquarters. The Board of Investment cancels import tariffs on machinery used in conducting research and development activities by regional operating headquarters (ROHs). This is in addition to the existing privileges such as a permission to own land and remit foreign currency abroad as well as preferential corporate and income tax rates. Looking forward, related agencies such as the Revenue Department, the Bank of Thailand, and the Department of Business Development plan to streamline other rules and regulations that help to promote ROHs in Thailand. The government also uses tariff measures as a tool to promote energy policy. To encourage the use of natural gas as an alternative fuel for vehicles, the government has exempted import duties of many natural gas-related tools and equipment such as bio-fuel conversion kits, natural gas containers, and chasses. Many of these tax privileges were scheduled to expire at the end of this year, but now extended for another one to three years, depending on whether such tools and equipment can be currently locally produced. The government also cancels many parts and components required in assembling chasses used in vehicles that are fuelled entirely by natural gas. The bilateral free trade agreement between Thailand and India showed noticeable progress.29 On bilateral agreements, after the Japan-Thailand Economic Partnership Agreement (JTEPA) became effective in November 2007, Thailand and India now reached a preliminary agreement that could be effective in early 2009. The number of goods that the two countries agreed to cut or cancel import duties are about 5,000 products. There are around 500 items in the negative list (no tariff reduction) such as textiles and vehicles parts for Thailand, and vehicles and agricultural products for India. This is in addition to the Early Harvest Scheme, which waived tariffs on products such as tropical fruits, canned seafood, jewellery, and electrical appliances since September 2006.
28 The member countries of the Ayeyawady-Chao Phraya-Mekong Economic Cooperation Strategy (ACMECS) are Cambodia, Lao PDR, Myanmar, Thailand, and Vietnam. 29 Table 21 reviews the recent progress on free trade agreements that involve Thailand in more details.
50
Multilateral FTAs between ASEAN and other economies also marked significant development. For the pact between ASEAN, Australia, and New Zealand, tariff rates under the normal track for the six ASEAN foundation members will be cancelled in 2013 for most products, and 2015 for the rest. Most details on trade in services, investments, and rules of origin also agreed. The Ministry of Commerce will then seek approval from the parliament. Similarly, the cabinet approved Thailand’s participation into the ASEAN-Korea agreement in August 2008. Korea will cancel over 90 percent of all tariff lines that are being traded by 1 January 2010. For Thailand, this share stood at around 81 percent. The agreement also covers various areas of services trade and economic cooperation. The pact between ASEAN and India is also agreed. Over 70 percent of goods that are being traded between the two parties will enjoy no tariffs by end-2012, and another 9 percent by end-2015. Tariff rates on items in the sensitive list will be reduced to 5 percent or lower by end-2015. These are expected to be effective in early 2009. Finally, Thailand signed the ASEAN-Japan agreement in April 2008. Japan will abolish 90 percent of tariff lines that are being traded with an immediate effect, while Thailand will eliminate import tariffs that worth 93 percent of imports from Japan within 10 years. The pact will also result in closer economic cooperation in a range of issues, such as intellectual property, energy, ICT, and agriculture. Export promotion and assistance The Customs Department significantly extended the application of e-Customs in 2008. The paperless customs aims to speed up customs procedures, enhance the transparency of these processes, and reduce the transaction costs incurred to exporters. The paperless customs procedure for exports or e-Export has been used at the Leam Chabang seaport and the Suvarnabhumi airport since 2007. This year, the e-Customs system is now used for both import and export transactions at most customs points (large and small seaports and airports) nationwide. The Export-Import Bank of Thailand works more closely with other banks to support exporters. Earlier this year, the EXIM bank offered the export insurance services, which guarantee to pay Thai exporters in case of a default by foreign buyers, to Siam City Bank customers30. The insurance services are now also available for clients of the SME Bank, Government Savings Bank, and Krung Thai Bank. Current and potential exporters will benefit from both traditional financial services provided by these three banks and trade finance offered by the EXIM bank. For example, the EXIM bank will issue domestic letter of credit (L/C) and standby letter of credit that can be used as an assurance in auctions and foreign investments. The banks will also co-finance loans. The EXIM bank also provides non-financial services to promote exports. In June 2008, the bank introduced the online Exports and Foreign Investment Information Centre. Available information include (i) weekly macroeconomic and business updates that cover both the Thai economy and its key trading partners; (ii) country information data that contains, for each country, the latest developments, interesting articles, and a list of traders; (iii) products data that provides news summary and analytical work on export trends for various agricultural and manufactured products as well as services (e.g. hotels and Thai restaurants); and (iv) a practical guide on procedures for exports and foreign investments, and links to other government and private agencies that provide services to local exporters and investors. Risk information is more widely shared among export credit agencies in Asia. The EXIM bank and other eight export credit agencies in the region (Australia, Indonesia, Japan, South Korea, Malaysia,
30 The EXIM Bank has offered export insurance services since 1995. In February 2008, the bank introduced the enhanced export insurance services that offer lower premiums, faster implementation process, and higher compensation rate compared to the previous schemes. Since its inception, the insurance services have over 270 million baht worth of compensation. Around 60 percent of this was paid to affected exporters in the jewellery industry, and the remaining in the furniture, canned food, and plastic products industries.
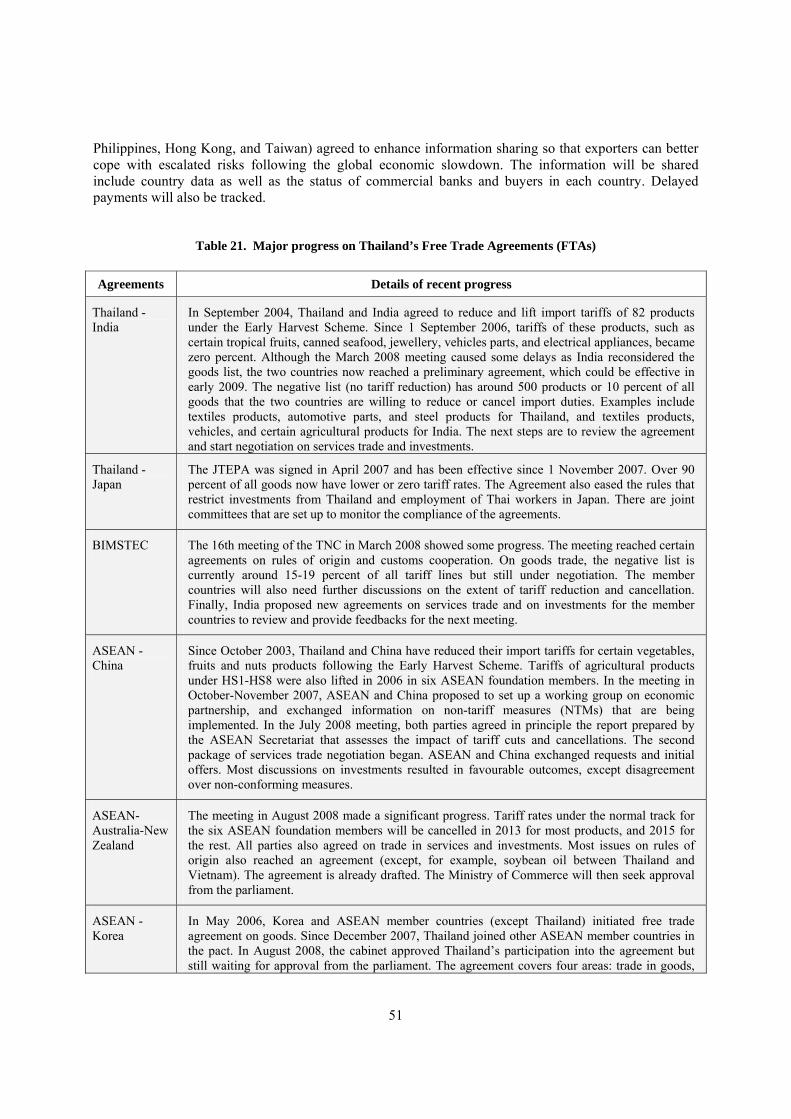
51
Philippines, Hong Kong, and Taiwan) agreed to enhance information sharing so that exporters can better cope with escalated risks following the global economic slowdown. The information will be shared include country data as well as the status of commercial banks and buyers in each country. Delayed payments will also be tracked.
Table 21. Major progress on Thailand’s Free Trade Agreements (FTAs) Agreements Details of recent progress
Thailand - India
In September 2004, Thailand and India agreed to reduce and lift import tariffs of 82 products under the Early Harvest Scheme. Since 1 September 2006, tariffs of these products, such as certain tropical fruits, canned seafood, jewellery, vehicles parts, and electrical appliances, became zero percent. Although the March 2008 meeting caused some delays as India reconsidered the goods list, the two countries now reached a preliminary agreement, which could be effective in early 2009. The negative list (no tariff reduction) has around 500 products or 10 percent of all goods that the two countries are willing to reduce or cancel import duties. Examples include textiles products, automotive parts, and steel products for Thailand, and textiles products, vehicles, and certain agricultural products for India. The next steps are to review the agreement and start negotiation on services trade and investments.
Thailand - Japan
The JTEPA was signed in April 2007 and has been effective since 1 November 2007. Over 90 percent of all goods now have lower or zero tariff rates. The Agreement also eased the rules that restrict investments from Thailand and employment of Thai workers in Japan. There are joint committees that are set up to monitor the compliance of the agreements.
BIMSTEC The 16th meeting of the TNC in March 2008 showed some progress. The meeting reached certain agreements on rules of origin and customs cooperation. On goods trade, the negative list is currently around 15-19 percent of all tariff lines but still under negotiation. The member countries will also need further discussions on the extent of tariff reduction and cancellation. Finally, India proposed new agreements on services trade and on investments for the member countries to review and provide feedbacks for the next meeting.
ASEAN - China
Since October 2003, Thailand and China have reduced their import tariffs for certain vegetables, fruits and nuts products following the Early Harvest Scheme. Tariffs of agricultural products under HS1-HS8 were also lifted in 2006 in six ASEAN foundation members. In the meeting in October-November 2007, ASEAN and China proposed to set up a working group on economic partnership, and exchanged information on non-tariff measures (NTMs) that are being implemented. In the July 2008 meeting, both parties agreed in principle the report prepared by the ASEAN Secretariat that assesses the impact of tariff cuts and cancellations. The second package of services trade negotiation began. ASEAN and China exchanged requests and initial offers. Most discussions on investments resulted in favourable outcomes, except disagreement over non-conforming measures.
ASEAN- Australia-New Zealand
The meeting in August 2008 made a significant progress. Tariff rates under the normal track for the six ASEAN foundation members will be cancelled in 2013 for most products, and 2015 for the rest. All parties also agreed on trade in services and investments. Most issues on rules of origin also reached an agreement (except, for example, soybean oil between Thailand and Vietnam). The agreement is already drafted. The Ministry of Commerce will then seek approval from the parliament.
ASEAN - Korea
In May 2006, Korea and ASEAN member countries (except Thailand) initiated free trade agreement on goods. Since December 2007, Thailand joined other ASEAN member countries in the pact. In August 2008, the cabinet approved Thailand’s participation into the agreement but still waiting for approval from the parliament. The agreement covers four areas: trade in goods,
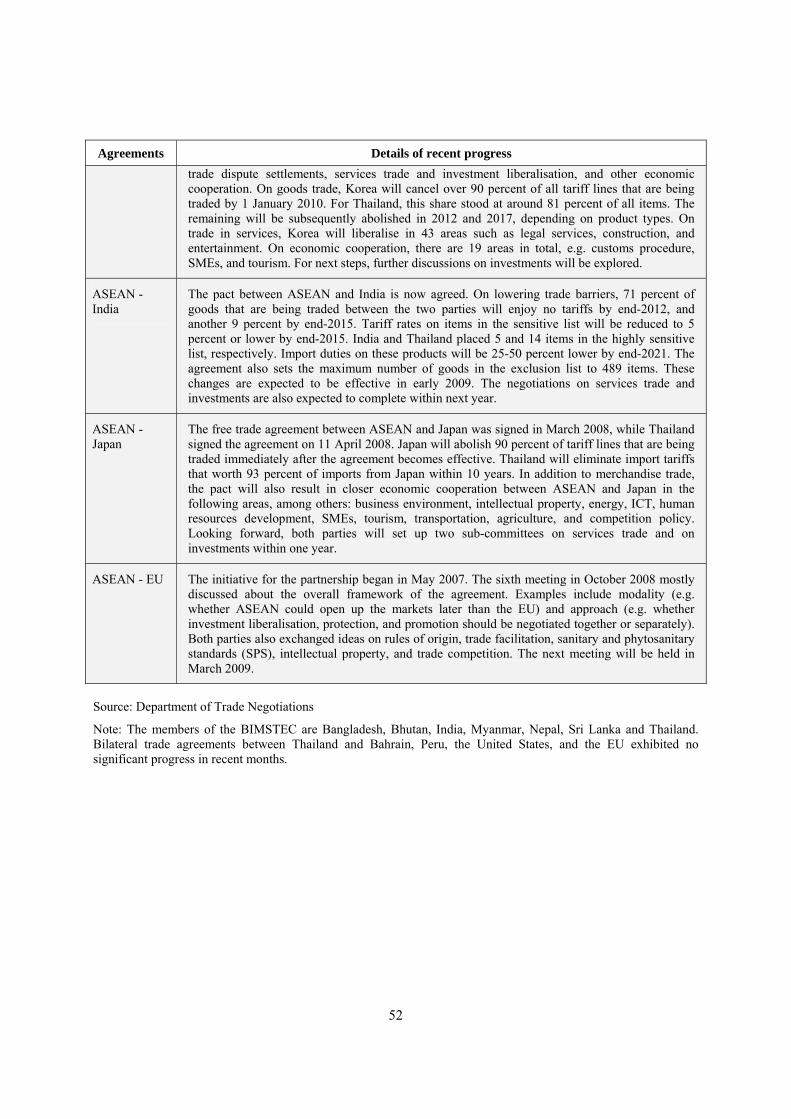
52
Agreements Details of recent progress trade dispute settlements, services trade and investment liberalisation, and other economic cooperation. On goods trade, Korea will cancel over 90 percent of all tariff lines that are being traded by 1 January 2010. For Thailand, this share stood at around 81 percent of all items. The remaining will be subsequently abolished in 2012 and 2017, depending on product types. On trade in services, Korea will liberalise in 43 areas such as legal services, construction, and entertainment. On economic cooperation, there are 19 areas in total, e.g. customs procedure, SMEs, and tourism. For next steps, further discussions on investments will be explored.
ASEAN - India
The pact between ASEAN and India is now agreed. On lowering trade barriers, 71 percent of goods that are being traded between the two parties will enjoy no tariffs by end-2012, and another 9 percent by end-2015. Tariff rates on items in the sensitive list will be reduced to 5 percent or lower by end-2015. India and Thailand placed 5 and 14 items in the highly sensitive list, respectively. Import duties on these products will be 25-50 percent lower by end-2021. The agreement also sets the maximum number of goods in the exclusion list to 489 items. These changes are expected to be effective in early 2009. The negotiations on services trade and investments are also expected to complete within next year.
ASEAN - Japan
The free trade agreement between ASEAN and Japan was signed in March 2008, while Thailand signed the agreement on 11 April 2008. Japan will abolish 90 percent of tariff lines that are being traded immediately after the agreement becomes effective. Thailand will eliminate import tariffs that worth 93 percent of imports from Japan within 10 years. In addition to merchandise trade, the pact will also result in closer economic cooperation between ASEAN and Japan in the following areas, among others: business environment, intellectual property, energy, ICT, human resources development, SMEs, tourism, transportation, agriculture, and competition policy. Looking forward, both parties will set up two sub-committees on services trade and on investments within one year.
ASEAN - EU The initiative for the partnership began in May 2007. The sixth meeting in October 2008 mostly discussed about the overall framework of the agreement. Examples include modality (e.g. whether ASEAN could open up the markets later than the EU) and approach (e.g. whether investment liberalisation, protection, and promotion should be negotiated together or separately). Both parties also exchanged ideas on rules of origin, trade facilitation, sanitary and phytosanitary standards (SPS), intellectual property, and trade competition. The next meeting will be held in March 2009.
Source: Department of Trade Negotiations
Note: The members of the BIMSTEC are Bangladesh, Bhutan, India, Myanmar, Nepal, Sri Lanka and Thailand. Bilateral trade agreements between Thailand and Bahrain, Peru, the United States, and the EU exhibited no significant progress in recent months.
53
3.3 Public Sector Reform The second Strategic Plan for the Thai Public Sector Development (2008-2012) aims to improve quality of services delivered by the public sector. The vision is to transform the public sector to support the knowledge economy and be capable to provide a quick response to both internal and external changes. The Strategic Plan has four key strategies: (i) develop service quality and work process to best respond to public needs (ii) enhance a comprehensive work modality with involvement of all stakeholders, (iii) raise public sector’s competency and productivity to be on par with international standards, and (iv) strengthen ethics and good governance. Implementation of the Civil Service Act (2008) resulted in all civil servants being transferred to the new structure from December 11th, 2008. This new structure will bring about a change in landscape and management of the Thai civil service. Under the new structure, the civil servants are classified into one of the four groups which will replace the single classification, known as the eleven common levels (C1 to C11). The four groups consist of (i) operations staff, (ii) knowledge workers, (iii) middle management and (iv) executives. The Office of Civil Service Commission (OCSC) has prepared the new range-based salary structure that is aligned with the new position classification system. The Public Financial Act is expected to be approved by the Cabinet by the first half of 2009. This Act, mandated by the 2007 Constitution, aims at improving public financial management to be more transparent with higher degree of disclosure. One of the key important reforms is to establish a permanent Fiscal Policy Board chaired by the Prime Minister. The committee comprises of key economic agencies such as the Ministry of Finance, Bureau of the Budget, Bank of Thailand, National Economic and Social Development Board in order to (i) scrutinize the budget; (ii) to set criteria for transferring funds, including the central fund; and (iii) supervise state agencies, including local government’s on fiscal and monetary matters. In May, the Cabinet has approved the set up the Committee Implementing the National Anti-Corruption Strategy in the Public Sector. The Committee has the following responsibilities and authority: 1) Supervise and monitor agencies in the public sector to formulate their strategies and action plans in line with the National Anti-Corruption Strategy; 2) Allocate resources to support programs and projects in the strategies and action plans that are in line with National Strategy on Anti-Corruption; 3) Direct and coordinate action in the prevention and suppression of corruption in the public sector; and 4) Monitor, evaluate and resolve obstacles and problems that arise in implementing the National Anti-Corrupting Strategy in the Public Sector. The Cabinet approved new framework for the planning of 4-years Public Operational Plan as proposed by OPDC on November 4, 2008. Under the new framework, each ministry will have to improve and integrate the 4-years plan in the form of rolling plan. The 4-years plan will be revised each year so that it is more flexible to any change and forward-looking. This rolling plan will also be consistent to the medium term expenditure framework (MTEF) which entails sector ministries preparing budget requests annually with projected resource needs for three outer years. With the cooperation between the Office of the Public Sector Development Commission and Bureau of the Budget, a reference code will be created in order to ensure the consistency of implementing the strategy, key performance indicators (KPIs), and target of each agency.
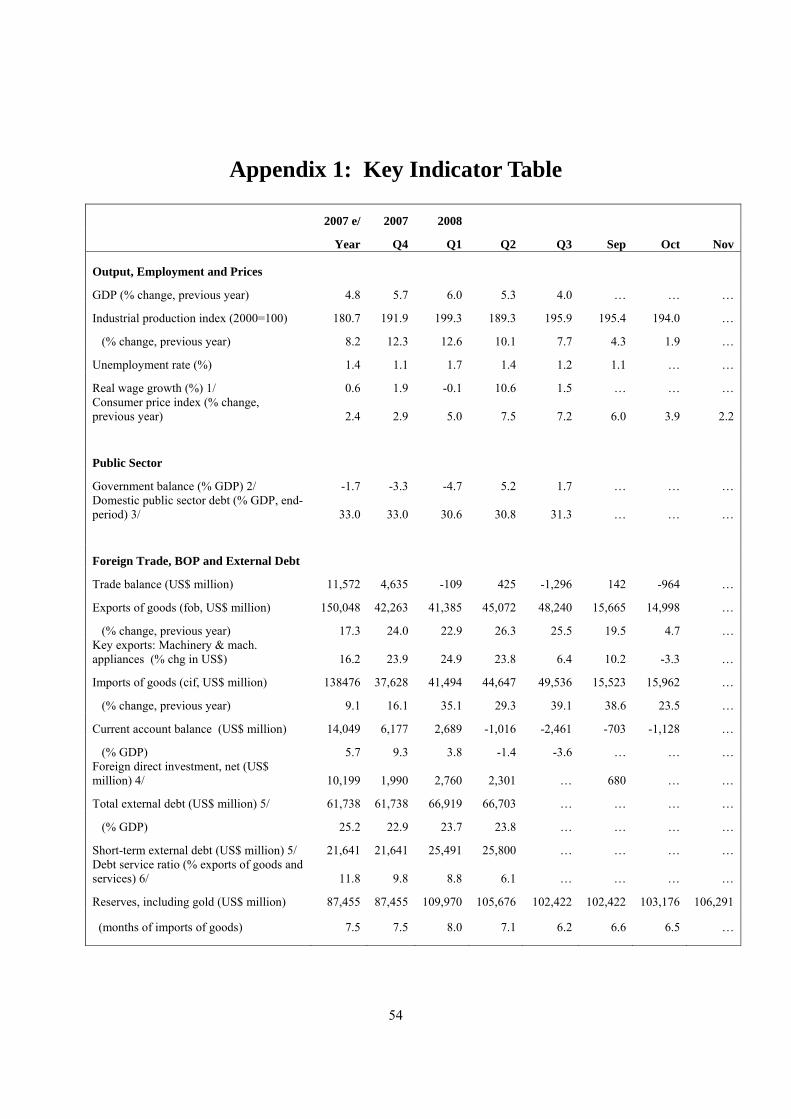
54
Appendix 1: Key Indicator Table
2007 e/ 2007 2008
Year Q4 Q1 Q2 Q3 Sep Oct Nov
Output, Employment and Prices
GDP (% change, previous year) 4.8 5.7 6.0 5.3 4.0 … … …
Industrial production index (2000=100) 180.7 191.9 199.3 189.3 195.9 195.4 194.0 …
(% change, previous year) 8.2 12.3 12.6 10.1 7.7 4.3 1.9 …
Unemployment rate (%) 1.4 1.1 1.7 1.4 1.2 1.1 … …
Real wage growth (%) 1/ 0.6 1.9 -0.1 10.6 1.5 … … … Consumer price index (% change, previous year) 2.4 2.9 5.0 7.5 7.2 6.0 3.9 2.2
Public Sector
Government balance (% GDP) 2/ -1.7 -3.3 -4.7 5.2 1.7 … … … Domestic public sector debt (% GDP, end-period) 3/ 33.0 33.0 30.6 30.8 31.3 … … …
Foreign Trade, BOP and External Debt
Trade balance (US$ million) 11,572 4,635 -109 425 -1,296 142 -964 …
Exports of goods (fob, US$ million) 150,048 42,263 41,385 45,072 48,240 15,665 14,998 …
(% change, previous year) 17.3 24.0 22.9 26.3 25.5 19.5 4.7 … Key exports: Machinery & mach. appliances (% chg in US$) 16.2 23.9 24.9 23.8 6.4 10.2 -3.3 …
Imports of goods (cif, US$ million) 138476 37,628 41,494 44,647 49,536 15,523 15,962 …
(% change, previous year) 9.1 16.1 35.1 29.3 39.1 38.6 23.5 …
Current account balance (US$ million) 14,049 6,177 2,689 -1,016 -2,461 -703 -1,128 …
(% GDP) 5.7 9.3 3.8 -1.4 -3.6 … … … Foreign direct investment, net (US$ million) 4/ 10,199 1,990 2,760 2,301 … 680 … …
Total external debt (US$ million) 5/ 61,738 61,738 66,919 66,703 … … … …
(% GDP) 25.2 22.9 23.7 23.8 … … … …
Short-term external debt (US$ million) 5/ 21,641 21,641 25,491 25,800 … … … … Debt service ratio (% exports of goods and services) 6/ 11.8 9.8 8.8 6.1 … … … …
Reserves, including gold (US$ million) 87,455 87,455 109,970 105,676 102,422 102,422 103,176 106,291
(months of imports of goods) 7.5 7.5 8.0 7.1 6.2 6.6 6.5 …
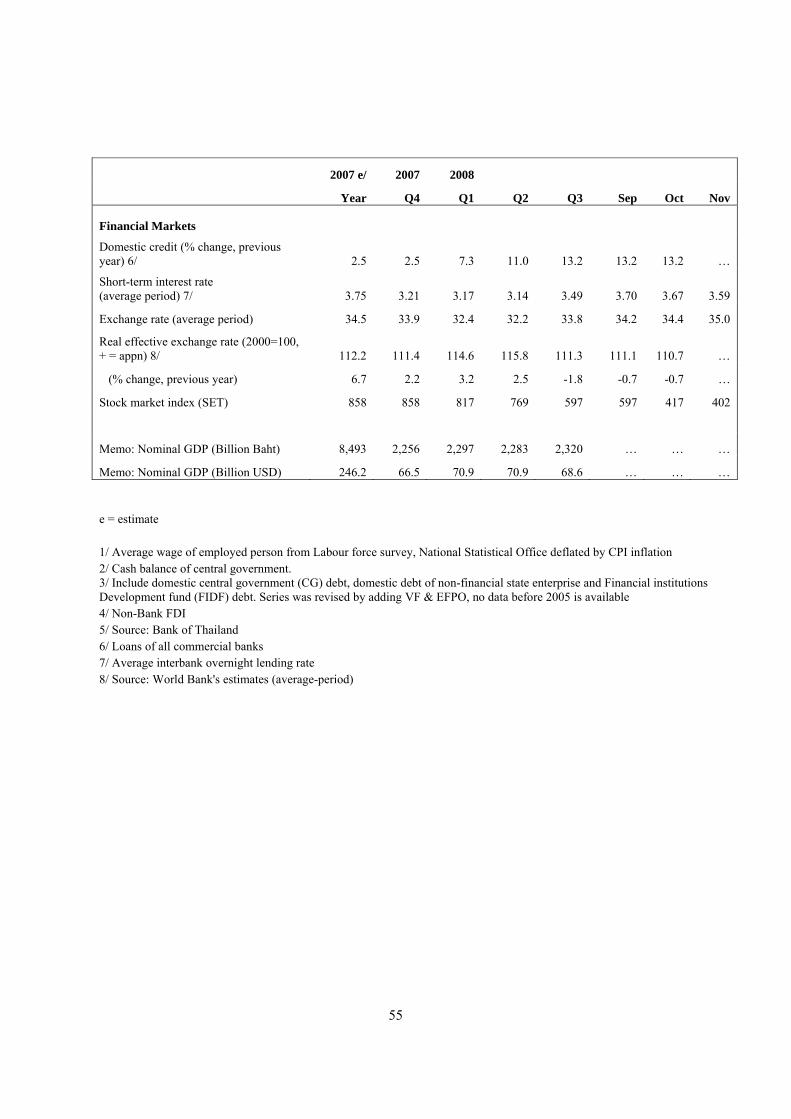
55
2007 e/ 2007 2008
Year Q4 Q1 Q2 Q3 Sep Oct Nov
Financial Markets
Domestic credit (% change, previous year) 6/ 2.5 2.5 7.3 11.0 13.2 13.2 13.2 …
Short-term interest rate (average period) 7/ 3.75 3.21 3.17 3.14 3.49 3.70 3.67 3.59
Exchange rate (average period) 34.5 33.9 32.4 32.2 33.8 34.2 34.4 35.0
Real effective exchange rate (2000=100, + = appn) 8/ 112.2 111.4 114.6 115.8 111.3 111.1 110.7 …
(% change, previous year) 6.7 2.2 3.2 2.5 -1.8 -0.7 -0.7 …
Stock market index (SET) 858 858 817 769 597 597 417 402
Memo: Nominal GDP (Billion Baht) 8,493 2,256 2,297 2,283 2,320 … … …
Memo: Nominal GDP (Billion USD) 246.2 66.5 70.9 70.9 68.6 … … … e = estimate 1/ Average wage of employed person from Labour force survey, National Statistical Office deflated by CPI inflation 2/ Cash balance of central government. 3/ Include domestic central government (CG) debt, domestic debt of non-financial state enterprise and Financial institutions Development fund (FIDF) debt. Series was revised by adding VF & EFPO, no data before 2005 is available 4/ Non-Bank FDI 5/ Source: Bank of Thailand 6/ Loans of all commercial banks 7/ Average interbank overnight lending rate 8/ Source: World Bank's estimates (average-period)
56
Appendix 2: Monitoring Matrices for Structural Reform Implementation 1. Poverty Reduction 2. Financial and Corporate Sector Reforms 3. Reforms to Improve Business and Investment Environment and Trade Regime 4. Public Sector and Governance Reform 5. Social Protection
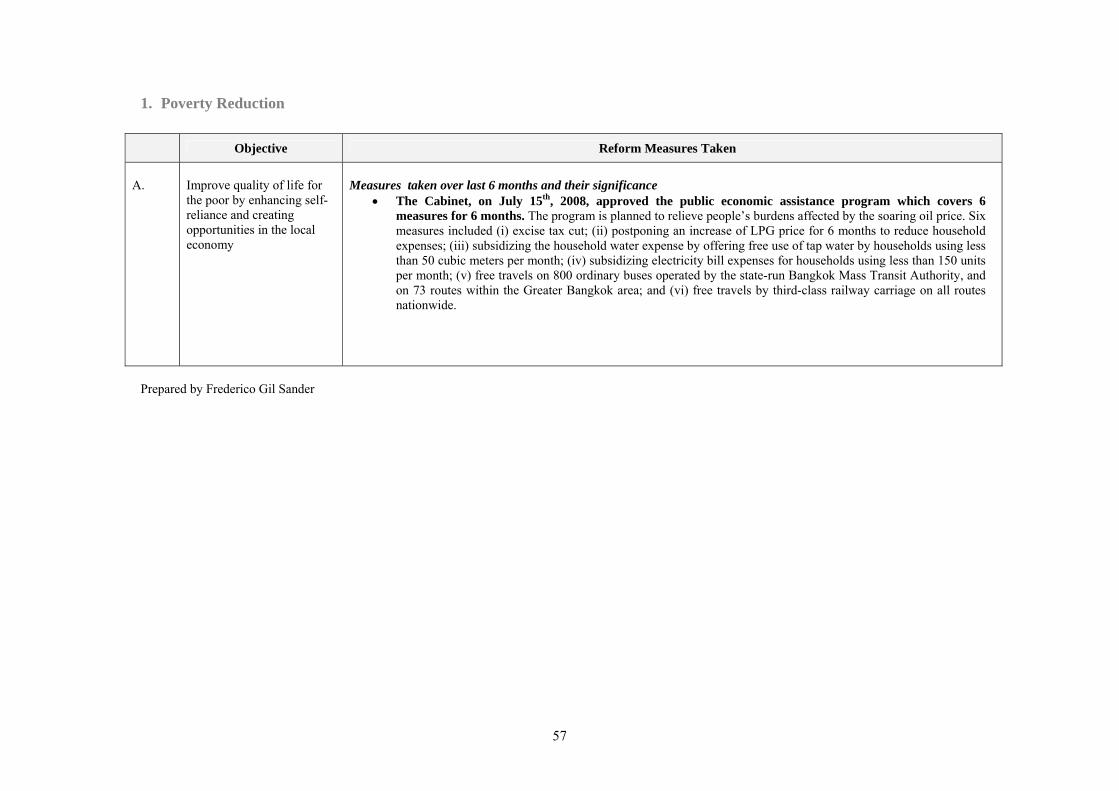
57
1. Poverty Reduction
Objective Reform Measures Taken
A.
Improve quality of life for the poor by enhancing self-reliance and creating opportunities in the local economy
Measures taken over last 6 months and their significance
• The Cabinet, on July 15th, 2008, approved the public economic assistance program which covers 6 measures for 6 months. The program is planned to relieve people’s burdens affected by the soaring oil price. Six measures included (i) excise tax cut; (ii) postponing an increase of LPG price for 6 months to reduce household expenses; (iii) subsidizing the household water expense by offering free use of tap water by households using less than 50 cubic meters per month; (iv) subsidizing electricity bill expenses for households using less than 150 units per month; (v) free travels on 800 ordinary buses operated by the state-run Bangkok Mass Transit Authority, and on 73 routes within the Greater Bangkok area; and (vi) free travels by third-class railway carriage on all routes nationwide.
Prepared by Frederico Gil Sander
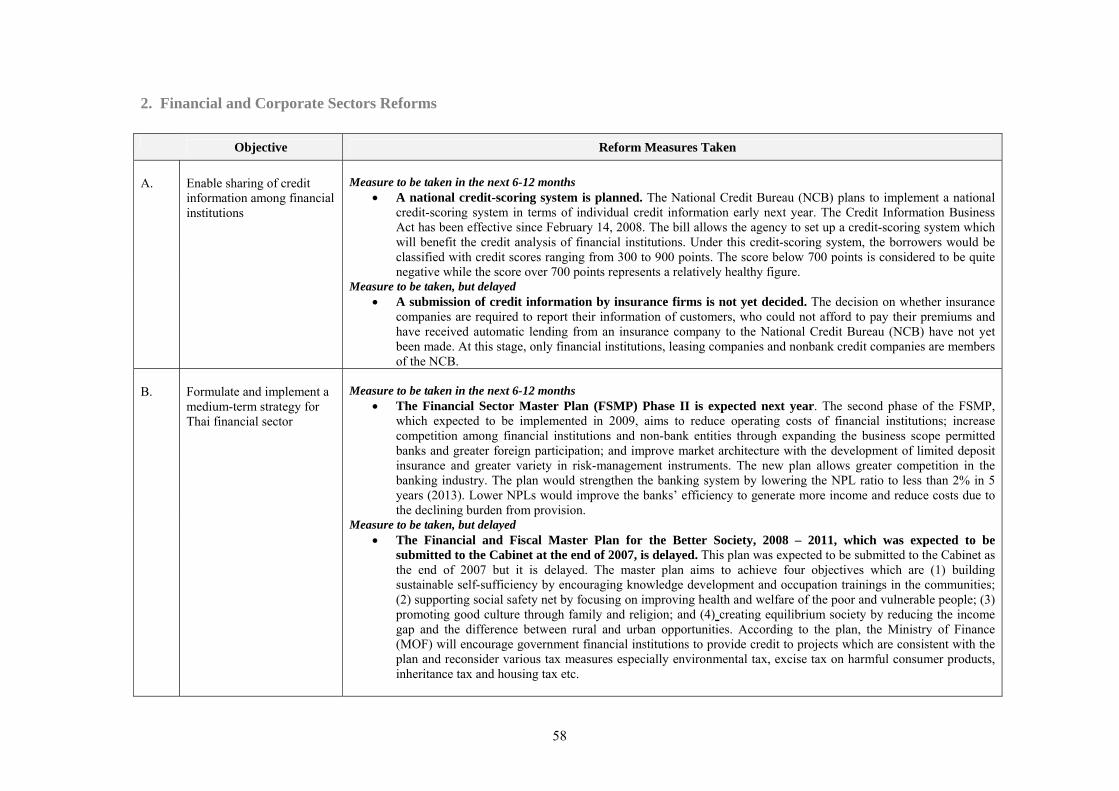
58
2. Financial and Corporate Sectors Reforms
Objective Reform Measures Taken A.
Enable sharing of credit information among financial institutions
Measure to be taken in the next 6-12 months
• A national credit-scoring system is planned. The National Credit Bureau (NCB) plans to implement a national credit-scoring system in terms of individual credit information early next year. The Credit Information Business Act has been effective since February 14, 2008. The bill allows the agency to set up a credit-scoring system which will benefit the credit analysis of financial institutions. Under this credit-scoring system, the borrowers would be classified with credit scores ranging from 300 to 900 points. The score below 700 points is considered to be quite negative while the score over 700 points represents a relatively healthy figure.
Measure to be taken, but delayed • A submission of credit information by insurance firms is not yet decided. The decision on whether insurance
companies are required to report their information of customers, who could not afford to pay their premiums and have received automatic lending from an insurance company to the National Credit Bureau (NCB) have not yet been made. At this stage, only financial institutions, leasing companies and nonbank credit companies are members of the NCB.
B.
Formulate and implement a medium-term strategy for Thai financial sector
Measure to be taken in the next 6-12 months
• The Financial Sector Master Plan (FSMP) Phase II is expected next year. The second phase of the FSMP, which expected to be implemented in 2009, aims to reduce operating costs of financial institutions; increase competition among financial institutions and non-bank entities through expanding the business scope permitted banks and greater foreign participation; and improve market architecture with the development of limited deposit insurance and greater variety in risk-management instruments. The new plan allows greater competition in the banking industry. The plan would strengthen the banking system by lowering the NPL ratio to less than 2% in 5 years (2013). Lower NPLs would improve the banks’ efficiency to generate more income and reduce costs due to the declining burden from provision.
Measure to be taken, but delayed • The Financial and Fiscal Master Plan for the Better Society, 2008 – 2011, which was expected to be
submitted to the Cabinet at the end of 2007, is delayed. This plan was expected to be submitted to the Cabinet as the end of 2007 but it is delayed. The master plan aims to achieve four objectives which are (1) building sustainable self-sufficiency by encouraging knowledge development and occupation trainings in the communities; (2) supporting social safety net by focusing on improving health and welfare of the poor and vulnerable people; (3) promoting good culture through family and religion; and (4) creating equilibrium society by reducing the income gap and the difference between rural and urban opportunities. According to the plan, the Ministry of Finance (MOF) will encourage government financial institutions to provide credit to projects which are consistent with the plan and reconsider various tax measures especially environmental tax, excise tax on harmful consumer products, inheritance tax and housing tax etc.
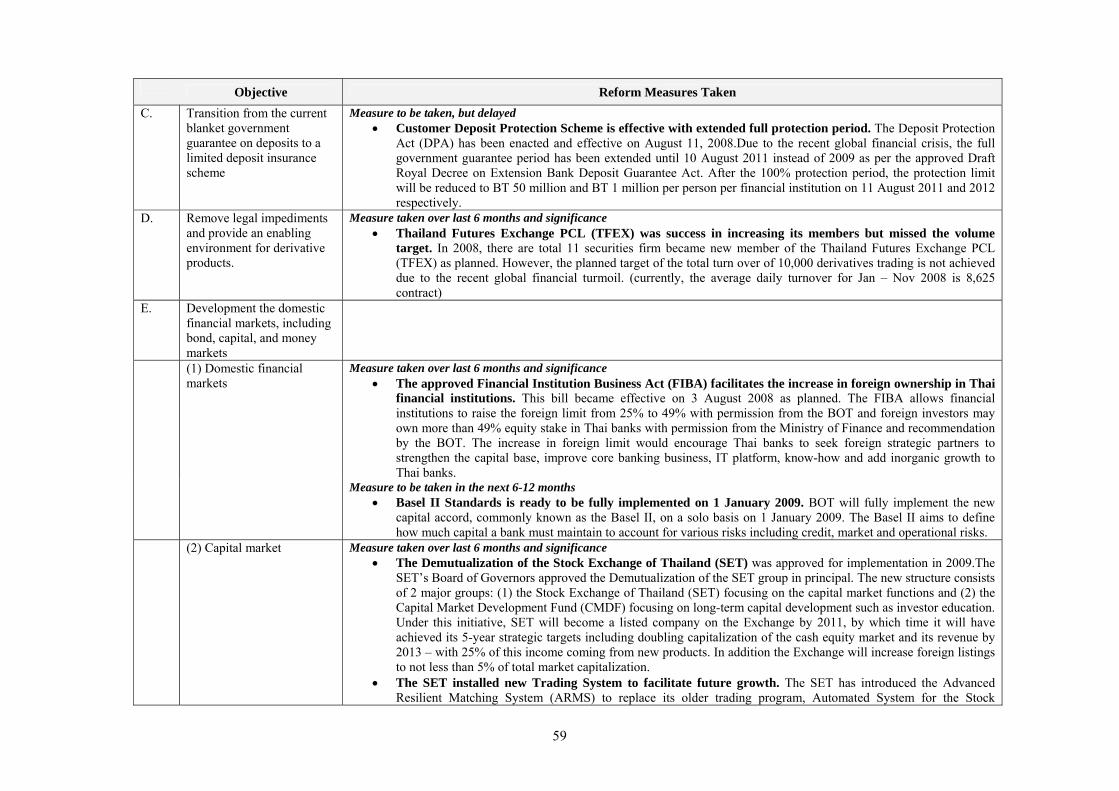
59
Objective Reform Measures Taken C. Transition from the current
blanket government guarantee on deposits to a limited deposit insurance scheme
Measure to be taken, but delayed • Customer Deposit Protection Scheme is effective with extended full protection period. The Deposit Protection
Act (DPA) has been enacted and effective on August 11, 2008.Due to the recent global financial crisis, the full government guarantee period has been extended until 10 August 2011 instead of 2009 as per the approved Draft Royal Decree on Extension Bank Deposit Guarantee Act. After the 100% protection period, the protection limit will be reduced to BT 50 million and BT 1 million per person per financial institution on 11 August 2011 and 2012 respectively.
D. Remove legal impediments and provide an enabling environment for derivative products.
Measure taken over last 6 months and significance • Thailand Futures Exchange PCL (TFEX) was success in increasing its members but missed the volume
target. In 2008, there are total 11 securities firm became new member of the Thailand Futures Exchange PCL (TFEX) as planned. However, the planned target of the total turn over of 10,000 derivatives trading is not achieved due to the recent global financial turmoil. (currently, the average daily turnover for Jan – Nov 2008 is 8,625 contract)
E. Development the domestic financial markets, including bond, capital, and money markets
(1) Domestic financial markets
Measure taken over last 6 months and significance • The approved Financial Institution Business Act (FIBA) facilitates the increase in foreign ownership in Thai
financial institutions. This bill became effective on 3 August 2008 as planned. The FIBA allows financial institutions to raise the foreign limit from 25% to 49% with permission from the BOT and foreign investors may own more than 49% equity stake in Thai banks with permission from the Ministry of Finance and recommendation by the BOT. The increase in foreign limit would encourage Thai banks to seek foreign strategic partners to strengthen the capital base, improve core banking business, IT platform, know-how and add inorganic growth to Thai banks.
Measure to be taken in the next 6-12 months • Basel II Standards is ready to be fully implemented on 1 January 2009. BOT will fully implement the new
capital accord, commonly known as the Basel II, on a solo basis on 1 January 2009. The Basel II aims to define how much capital a bank must maintain to account for various risks including credit, market and operational risks.
(2) Capital market Measure taken over last 6 months and significance • The Demutualization of the Stock Exchange of Thailand (SET) was approved for implementation in 2009.The
SET’s Board of Governors approved the Demutualization of the SET group in principal. The new structure consists of 2 major groups: (1) the Stock Exchange of Thailand (SET) focusing on the capital market functions and (2) the Capital Market Development Fund (CMDF) focusing on long-term capital development such as investor education. Under this initiative, SET will become a listed company on the Exchange by 2011, by which time it will have achieved its 5-year strategic targets including doubling capitalization of the cash equity market and its revenue by 2013 – with 25% of this income coming from new products. In addition the Exchange will increase foreign listings to not less than 5% of total market capitalization.
• The SET installed new Trading System to facilitate future growth. The SET has introduced the Advanced Resilient Matching System (ARMS) to replace its older trading program, Automated System for the Stock
60
Objective Reform Measures Taken Exchange of Thailand (ASSET). The new ARMS system will manage increasing trade volumes and new financial products and support the planned ASEAN Linkage project.
• New Index Series was introduced in addition to current SET Index Series. The SET launched FTSE SET Index Series in addition to the existing SET Index Series. The new series consists of six separate indices: (1) FTSE SET Large Cap, (2) FTSE SET Mid Cap, (3) FTSE SET Small Cap, (4) FTSE SET Mid/Small Cap, (5) FTSE SET All-Share and (6) FTSE SET Fledgling. The Index is a benchmark index for portfolio management and for measuring the performance of listed companies in the Thai stock market. This index series uses February 29,2008 as its base date, starting at 1,000 points. Index constituents will be reviewed in June and December each year by the index advisory committee.
• The SET adjusted the price spreads. The SET adjusted the price spreads to eight from 10 intervals and narrow the interval for stocks worth over BT 50 to reduce costs for investors, while boosting trading liquidity. This is part of SET’s strategy to build competitiveness by helping investors to reduce trading costs.
• The SET expanded its products range. SET launched the first exchange-traded fund (ETF) tracking the rate of return of the Stock Exchange of Thailand (SET) Energy and Utility Sector Index into the Unit Trust group.
• The cabinet approved some measures to support the stock market during the existing financial crisis. The cabinet approved the Matching Fund arrangement and the increase in tax allowance limit. The Matching Fund aims to invest in SET market in order to support the stock market if foreign investors continue to repatriate their investment back. The tax allowance limit for investment in the Retirement Mutual Fund (RMF) and Long Term Fund (LTF) has been increased from BT 500,000 to BT 700,000.
• The cabinet approved the schemes for Grassroots Economy to curb with current financial turmoil. The cabinet approved in principle of direct funding schemes for grassroots people and grassroots economy.
Measure to be taken in the next 6-12 months • The SET Demutualization Plan aims to restructure the SET organization by the year 2013. The new structure
of the SET group under the Demutualization plan will come into effect in 1 January 2009. The SET are preparing its five-year strategic plans to ensure that it achieves its target of becoming a listed company on schedule. The strategic target of the SET include doubling the Exchange’s market capitalization and revenue by the year 2013, with 25% of this income came from new products and increase the foreign listing to not less than 5% of total market capitalization.
• The Thailand Securities Depository Co., Ltd. (TSD) plans to adjust its regulation to comply with the amended Securities and Exchange Act. In response to the potential impact of the Securities and Exchange Act B.E.2535 (1991) which was amended in March 5th, 2008, the TSD will adjust its rules and regulations to comply with the Capital Market Supervisory Board’s conditions and modify its processes and system accordingly.
• Some regulations will be amended to accommodate the Share Repurchase Program. After the stock value severely plunged, the SET encourage the share repurchase program and is approaching the Ministry of Commerce for an approval to amend related regulations to facilitate share buy-back program. Under the existing regulation, the firms are banned to sell their bought shares which have been bought back during the first six months. Also, such shares must be sold within 3 years, or else the firm must decrease its capital.
• E-Dividend is introduced to replace current dividend payment system. TSD plans to persuade the BOT to review set limit of dividend transferred via bank account of BT of maximum BT 2 million per account, in order to encourage the e-dividend system. The e-dividend system has increased the speed of the dividend payment to
61
Objective Reform Measures Taken shareholders and the efficiency of the payment system.
Measure to be taken, but delayed • New Settlement Cycle, which planned to be implemented by the end of 2008, is delayed. Thailand Securities
Depository Co., Ltd. (TSD) has delayed the introduction of the proposed shortened trading settlement cycle – from three days after the trading day (T+3) to two days (T+2), which was originally planned for implementation by end-2008. The T+2 settlement cycle is part of SET’s strategy to reduce investors’ trading costs.
(3) Derivative markets Measure taken over last 6 months and significance • The TFEX expanded its product range. The Thailand Futures Exchange PCL (TFEX) launched its first 3 single
stock futures with the following underlying: PTT Public Company Limited (PTT), PTT Exploration and Production Public Company Limited (PTTEP) and Advanced Info Service Public Company Limited (ADVANC). These 3 selected underlying stocks are the Big-Cap stocks with high liquidity and popularity among investors, particularly institutional investors.
Measure to be taken in the next 6-12 months • Gold Future is expected to be traded in TFEX in the first quarter of 2009. The Finance Ministry granted an
approval for gold futures to be traded in 2009 while the Securities and Exchange Commission (SEC) endorsed the requisite regulatory amendments and contract specifications. The underlying of the gold future is the 96.5% Gold Bar which is commonly traded in Thailand. The gold future will be traded by cash settlement via the Thailand Clearing house Co., Ltd. (TCH). Gold futures will be first introduced with the contract size of 50 baht gold.
(4) Bond market Measure taken over last 6 months and significance • The SET has approved the reduction in the transaction costs of the Bond Trading. The SET terminated the
listing fee for bonds to promote bond listing on the local market. In addition, the SET also extended the waiver of trading fees for bond of 0.005% on trading value in order to boost bond trade and lower costs.
F. Rationalize state holding of specialized financial institutions, state-owned enterprises, and state commercial banks
Measure taken over last 6 months and significance • No significant measures taken
G. Enable corporate sector restructuring through out-of-court mediation, streamline the legal execution process for old foreclosed properties, and reduce the fees on the sale of foreclosed assets
Measure taken over last 6 months and significance • The Escrow Account Law was enacted and effective but is not compulsory. The Law will help protect property
buyers by preventing property developers that do not have proper creditability or secured financial status to channel down-payments made by property buyers to cash flows for developing their projects. According to this Law, approved financial institutions shall act as the third-party guarantor. If a developer fails to deliver the promised developed property, the financial institutions will return the down payment plus interest to the property buyers. Since this law is on a voluntary basis like first-class automobile insurance, the large developers will have more advantages as they are reliable by themselves and don’t need to use an escrow account. However this law will help screen out irresponsible developers.
Prepared by Ratchada Anantavrasilpa
62
3. Reforms to Improve Business and Investment Environment and Trade Regime
Objective Reform Measures Taken
A. Improve competitiveness of business sector
Measures taken over last 6 months and significance • The Board of Investment offers maximum investment incentives to six priority industries. As part of Thailand
Investment Year 2008-2009, the BOI offers special investment benefits to approved investments in six priority industries that are located in any provinces except Bangkok. The incentives include, among others, zero import tariffs on imported machinery, 8-year corporate income tax exemption, 50-percent reduction in corporate income tax for another 5 years, and a double deduction of transportation, electricity, and water supply costs. The six target sectors are businesses that are related to (i) energy saving and alternative energy, (ii) high-technology, (iii) environmental-friendly materials and products, (iv) mega projects, (v) tourism and real estates, and (vi) high-technology, material-based agriculture. In addition to these, the BOI also waives import duties on raw materials needed in producing export goods by non-BOI firms operating in 14 industries.
• A working group on labour shortages in the industrial sector is set up. The working group comprises of representatives from five related agencies, namely the Federation of Thai Industries, Vocational Education Commission (Ministry of Education), Thai Chamber of Commerce, Ministry of Industry, and Ministry of Labour. The working group has so far set up sub-working groups at a provincial level, conducted pilot projects in 20 provinces, and provides e-services on labour demand by linking local authority websites with the database that shows the demand for vocational graduates. The working group also plans to link Department of Employment’s job vacancy database with the Federation of Thai Industries, and drafts manpower plan for each province.
• The cabinet passed the revised Fertiliser Act. Proposed by the Ministry of Agriculture and Cooperatives, the revised Act seeks to remedy the overpricing of fertilisers that many farmers face. The Act will empower the existing fertiliser committee in regulating the prices. It requires licensed fertiliser traders to inform the committee the quantity, location, and cost of fertilisers, while penalty for overpricing is higher. The revised Act will extend the original Act (1975) that mainly sought to ensure the quality of chemical fertiliser.
• The government approved a pilot project on biomass energy. The project, managed by the Thailand Institute of Scientific and Technological Research (under the Ministry of Science and Technology), will serve as an advanced research centre on biomass technology. Among others, it will review and propose technology that Thailand should adopt in producing biomass energy. The total budget of 300 million baht is allocated for 2009-2012. Biomass gas can provide energy used directly by industrial sectors and households.
• The Ministry of Labour carried out reforms to improve labour market management system. First, the Ministry of Labour operation centre and provincial labour operation centres in all provinces are established. These help to equip the Ministry with up-to-date labour market conditions that should result in a concrete analysis and more responsive government policies. Second, the Ministry is working on a project to improve the standard of national labour data. In line with Thailand e-Government Interoperability Framework, the project aims to link together all available labour data, both from within and outside the Ministry. This will be used as a key input in the labour market’s early-warning system that is being created. The warning system will rely on data such as unemployment and job retrenchments.
63
Objective Reform Measures Taken
• Preventing intellectual property infringement is strengthened. Following Prime Minister’s approval, the Department of Intellectual Property now serves as a coordinating unit that works with other agencies to prevent and suppress intellectual property violation. The Prevention and Suppression of Intellectual Property Infringement Committee, a joint public-private committee, was set up. Among others, its key responsibility is to enhance public awareness and knowledge on intellectual property in order to minimise the offense. The Director General of Department of Intellectual Property will also chair the working group that aims to revise Prime Minister Office’s rules and regulations on intellectual property.
Measure to be taken in the next 6-12 months • The government is reviewing rules and regulations to attract more foreign experts. The Board of Investment is
working closely with the Ministry of Labour and the Immigration Bureau in deregulating immigration rules and regulations to attract more foreign experts, especially in the information technology field. In addition to executives and science and technology researchers, IT specialists now have an access to services provided by the one-stop visa and work permit centre. The Immigration Bureau is also revising the criteria used to renew non-immigrant visa, from shareholders’ equity and corporate income to financial strength and reliability of firms.
B. Reform of legal and judicial regime
Measures taken over last 6 months and significance • The cabinet agreed in principle to set up a legal reform agency. Proposed by the committee on legal reforms, the
two acts will introduce a new agency responsible for future legal reforms. The reforms will focus on the laws themselves and more broadly on justice procedures. The legal reforms committee was set up earlier this year to study and propose new laws and/or desirable changes in the current laws.
• Six Acts to reform Office of the Attorney General are approved. Together, the Acts will transform Office of the Attorney General to an independent agency, as stated by the constitution. Office of the Attorney General is currently under the Ministry of Justice. The Office will then have a power to dependently manage its human resources policy, budgeting, and other operations.
C. Improve the skills and quality of labor
Measure taken over last 6 months and significance • A memorandum of understanding to enhance labour skills in the ACMECS countries was signed. Thailand and
Vietnam signed the MOU that aims for a closer collaboration among the Ayeyawady-Chao Phraya-Mekong Economic Cooperation Strategy countries (Cambodia, Lao PDR, Myanmar, Thailand, and Vietnam) in improving workers’ technical skills. The focuses will be on enhancing technical and planning skills, through exchange programmes, workshops, seminars, and visits to Thailand and Vietnam by participants from the ACMECS countries. The programme will also promote closer links between academic institutions in the member countries.
D. Reduce tariff to improve Thailand’s competitiveness 1/
Measures taken over last 6 months and significance • Thailand continues to reduce import tariff rates for various products. Since June 2008, a wide range of agricultural
and manufactured products from ASEAN member countries, China, India, and New Zealand enjoy lower or no tariffs. Examples of goods include vegetable extracts and fats, pharmaceutical products, pumps for liquid, commercial trucks, steel tubes, iron wires, aluminium structures, dishwashing machines, weighting machines, and switching circuits and boards parts. The government will also cut or cancel tariffs for three types of animal feeds (soybean, corn, and fish
64
Objective Reform Measures Taken meals) in 2009. The magnitude of reductions varies across different trade agreements. Finally, the government also lowered or waived tariffs of vinegar, chilli, certain vegetables, wood products, and electronic switchboards imported from Cambodia, Myanmar and Lao PDR since September 2008.
• Tariff reductions are also used to promote investment policy and energy policy. On investment policy, the Board of Investment cancels import tariffs on machinery used in conducting research and development activities by regional operating headquarters. This is in addition to other privileges that ROHs are entitled to such as a permission to own land and remit foreign currency abroad as well as preferential corporate and income tax rates. On energy policy, the government has exempted import duties of many natural gas-related tools and equipment to encourage the use of natural gas as an alternative fuel in vehicles. Many of these tax privileges were scheduled to expire this year are now extended for another one to three years.
E. Promote Thai exports to new markets 2/
Measures taken over last 6 months and significance • The free trade agreement between Thailand and India showed marked progress. Thailand and India now
reached a preliminary agreement that could be effective in early 2009. The number of goods that the two countries agreed to cut or cancel import duties are about 5,000 products. There are around 500 items in the negative list (no tariff reduction) such as textiles and vehicles parts for Thailand, and vehicles and agricultural products for India. This is in addition to the Early Harvest Scheme, which waived tariffs on products such as tropical fruits, canned seafood, jewellery, and electrical appliances since September 2006.
• FTAs between ASEAN and other economies also moved forward. For the pact between ASEAN, Australia, and New Zealand, tariff rates under the normal track for the six ASEAN foundation members will be cancelled in 2013 for most products. Most details on trade in services, investments, and rules of origin also agreed. The cabinet also approved Thailand’s participation into the ASEAN-Korea agreement. South Korea will cancel over 90 percent of all tariff lines that are being traded by January 2010. For Thailand, this share stood at around 81 percent. The agreement also covers various areas of services trade and economic cooperation. The pact between ASEAN and India is agreed. Over 70 percent of goods that are being traded between the two parties will enjoy no tariffs by end-2012. Tariff rates on items in the sensitive list will be reduced to 5 percent or lower by end-2015. These are expected to be effective in early 2009. Finally, Thailand signed the ASEAN-Japan agreement in April 2008. Japan will abolish 90 percent of tariff lines that are being traded with an immediate effect, while Thailand will eliminate import tariffs that worth 93 percent of imports from Japan within 10 years.
Prepared by Vatcharin Sirimaneetham Note: 1/ See Tariff Reform in Section 3.2 on Recent Trade Reforms for a more detailed discussion. 2/ See Table 21 for more details.
65
4. Public Sector and Governance Reform31
Objectives Reform Measures Taken
A.
Improving public service quality by streamlining and redesigning work processes and procedures
Measure taken over the last 6 months and their significance
• The Public Sector Development Commission prepared the second Strategic Plan for the Thai Public Sector Development (2008-2012), which was approved by the cabinet in July 2008. The second plan has four key strategies: (i) develop service quality and work process to best respond to public needs (ii) enhance a comprehensive work modality with involvement of all stakeholders, (iii) raise public sector’s competency and productivity to be on par with international standards, and (iv) strengthen ethics and good governance.
• Thailand has been ranked 13th out of 181 economies assessed by Doing Business 2009 which are current as of June 1, 2008. Doing Business 2009 is the sixth in a series of annual reports assessing the regulations that enhance business activity and those that constrain it. Regulations affecting 10 stages of the life of a business are measured: starting a business, dealing with construction permits, employing workers, registering property, getting credit, protecting investors, paying taxes trading across borders, enforcing contracts and closing a business. The indicators are used to analyze economic outcomes and identify what reforms have worked, where and why.
B.
Changing roles, responsibilities, and rightsizing the government bureaucracy by restructuring public administration and improving intergovernmental relations at all levels
Measures taken over the last 6 months and their significance
• As mandated by the Civil Service Act (2008), all civil servants are transferred to the new structure, effective December 11th, 2008. Under the new structure, the civil servants are classified into one of the four groups which will replace the single classification, known as the eleven common levels (C1 to C11). The four groups consist of (1) operations staff, (2) knowledge workers, (3) middle management, and (4) executives. The Office of Civil Service Commission (OCSC) has prepared the new range-based salary structure that is aligned with the new position classification.
• The Cabinet approved new framework for the planning of 4-years Public Operational Plan as proposed by OPDC on November 4, 2008. Under the new framework, each ministry will have to improve and integrate the 4-years plan in the form of rolling plan. The 4-years plan will be revised each year so that it is more flexible to any change and forward-looking. This rolling plan will also be consistent to the medium term expenditure framework (MTEF) which entails sector ministries preparing budget requests annually with projected resource needs for three outer years. With the cooperation between OPDC and BOB, a reference code will be created in order to link the consistency of implementing strategy, KPIs, and target of each agency.
C.
Enhancing capacity and performance of
Measures to be taken in the next 6-12 months
• Public Finance Act is expected to be approved by the cabinet by the first half of 2009. One of the key 31 The objectives detailed in this matrix are consistent with the Government’s Public Sector Development Strategy (2003-2007) and the more recent Public Affairs Management Plan.
66
Objectives Reform Measures Taken
public sector to efficiently and effectively perform their functions by reforming financial and budgetary system, reviewing system of human resource management and compensation, developing a new mindset, work culture and value, and modernizing government operation.
important reforms is to establish a permanent Fiscal Policy Board chaired by the Prime Minister. The committee comprises of key economic agencies such as the Bureau of Budget, Bank of Thailand, National Economic and Social Development Board in order to (i) scrutinize the budget; (ii) to set criteria for transferring funds, including the central fund; and (iii) supervise state agencies, including local government’s on fiscal and monetary matters.
D.
Improving governance in public sector through participation, accountability, and transparency
Measures taken over the last 6 months and their significance • The Committee Implementing the National Anti-Corruption Strategy in the Public Sector was set up by
Cabinet’s resolution on May 6, 2008. The committee has the following responsibilities and authority: 1) Supervise and monitor agencies in the public sector to formulate their strategies and action plans in line with the National Anti-Corruption Strategy; 2) Allocate resources to support programs and projects in the strategies and action plans that are in line with National Strategy on Anti-Corruption; 3) Direct and coordinate action in the prevention and suppression of corruption in the public sector; and 4) Monitor, evaluate and resolve obstacles and problems that arise in implementing the National Anti-Corrupting Strategy in the Public Sector.
• Citizen Participation has been initiated to help reform Public Sector. The benefits from citizen participation are
not limited to only financial oversight, but transparency and accountability. It is a new way to ensure effective and responsive government. A service unit that deals with job placement and healthcare at Patumthani province has been initiated. This unit has incorporated people, worker, private business, hospitals, and other relevant public agencies to jointly design, plan, and implement the program.
* Prepared by Nattaporn Triratanasirikul
67
5. Social Protection
Objectives Reform Measures Taken
A.
Develop social insurance mechanisms for the elderly and those affected by unemployment, work-related injuries or other shocks to income.
Measure to be taken in the next 6 months and their significance
• The Cabinet, on August 19th, 2008, approved the draft Beggars Act, as proposed by the Ministry of Social Development and Human Security. According to this Act, all persons who wish to be beggars need to be registered at local government authority and carry permits to be given by such government authority. Beggars need to meet the following requirements: (1) be legal resident of Thailand, (2) be disabled, homeless, or old age, and cannot work. The Act also stipulates penalties for those who force, coax, or persuade others to become beggars for their own benefits. The Act is likely to help reduce the number of forced beggars, and encourage beggars who are fit to work to return to the job market.
• The Cabinet, on August 19th, 2008, approved the strategy to promote the potential and protect rights of the underprivileged. According to this strategy, Thailand’s laws and regulations will be changed or adjusted to provide social insurance mechanisms for the underprivileged, including the elderly and the disabled (including those who become disabled due to work).
• The Social Security Office (SSO), which manages the Social Security Fund, has announced in early December that it will use Bt10 billion from the retirement fund to lend to workers who want to start their own business. This is expected to be done through financial institutions, including Bank for Agriculture and Agricultural Cooperatives and Government Savings Bank, from January 1, 2009. Nine million workers covered by the fund could tap it for their independent businesses. The SSO had earlier announced it will extend the unemployment-benefit period from 120 days to 240.
B. Establish a safe work environment through standards and enforcement and increase labor market efficiency by facilitating job matches and placement.
Measures taken in the last 6 months and their significance • The Cabinet, on October 28th, 2008, approved the Ministerial Regulation stipulating fees for foreign workers
and hiring of foreign workers, as proposed by the Ministry of Labor. The Ministerial Regulation will stipulate fees on the employment of foreign workers, fees to be paid by foreign workers, and fees imposed on employers of foreign workers. This Ministerial Act would increase the cost of hiring foreign workers, and may work in favor of Thai workers.
C. Provide effective poverty alleviation and social assistance programs for those with limited or no other means of support
Measures taken in the last 6 months and their significance • The Cabinet, on November 4th, 2008, endorsed the draft regulation to promote civil society for development,
as proposed by the Ministry of Social Development and Human Security. Governmental agencies will be required to cooperate and involve civil society organizations and community volunteers in their work. Active involvement of civil society organizations will support the government’s social assistance programs to help the poor and the vulnerable at the grass-root level.
68
Objectives Reform Measures Taken
• The Cabinet, on October 28th, 2008, approved the increase of the minimum wage rates for 2008 as proposed by the Ministry of Labor, for Chaiyapoom, Uttaradit and Sukhothai provinces. Minimum daily wage for Chaiyapoom and Uttaradit is set at 152 baht. Minimum daily wage for Sukhothai is set at 153 baht.
• The Cabinet, on August 19th, 2008, acknowledged support activities for poor and underprivileged students. The Ministry of Education has set up a system that allows schools and teachers to support poor and underprivileged students. Teachers are asked to take special care of underprivileged students and to visit their homes and support the students. The Ministry of Social Development and Human Security plans to use the Children’s Protection Fund to support underprivileged students. Ministry of Interior, Ministry of Public Health, and Ministry of Transportation also plan to organize programs to support poor and underprivileged students.
Prepared by Sutayut Osornprasop