Embed Size (px)
Citation preview

Thailand food security and nutrition case study Successes and next steps
Draft report for South-South Learning Workshop to Accelerate Progress to End Hunger and Undernutrition 20 June, 2017, Bangkok, Thailand Prepared by the Compact2025 team
1
Thailand is a middle-income country that rapidly reduced hunger and undernutrition. Its immense
achievement is widely regarded as one of the best examples of a successful nutrition program, and its
experiences could provide important lessons for other countries facing hunger and malnutrition (Gillespie,
Tontisirin, and Zseleczky 2016).
This report describes Thailand’s progress, how it achieved success, remaining gaps and challenges, and
the lessons learned from its experience. Along with the strategies, policies, and investments that set the
stage for Thailand’s success, the report focuses on its community-based approach for designing,
implementing, and evaluating its integrated nutrition programs. Finally, key action and research gaps are
discussed, as Thailand aims to go the last mile in eliminating persistent undernutrition while contending
with emerging trends of overweight and obesity.
The report serves as an input for discussion at the “South-South Learning to Accelerate Progress to End
Hunger and Undernutrition” meeting, taking place in Bangkok, Thailand on June 20. Both the European
Commission funded project, the Food Security Portal (www.foodsecuritypotal.org) and IFPRI’s global
initiative Compact2025 (www.compact2025.org) in partnership with others are hosting the meeting,
which aims to promote knowledge exchange on how to accelerate progress to end hunger and
undernutrition through better food and nutrition security information.
The case of Thailand can provide insight for other countries facing similar hunger and malnutrition
problems as those Thailand faced 30 years ago. In 1990, nearly 35 percent of the Thai population was
undernourished—a higher prevalence than seen in all but three African countries in 2014/16 (FAO 2017).
Undernutrition in similar forms to those currently seen in Africa and South Asia (e.g. iron, iodine, and
vitamin A deficiency, as well as child stunting and wasting) was also an alarming and widespread problem
that affected human growth and potential, as well as economic development in Thailand.
The South-South Learning event will bring together leading representatives from the public and private
sector, civil society and nongovernmental organizations, academia, and development and donor
communities at country, regional, and global levels to share important lessons learned from southern
countries that address these challenges. The event will highlight what works and build a critical knowledge
base for setting priorities and fine-tuning actions to accelerate progress. This report will be revised
following the meeting.

2
Overview of progress in food security and nutrition in Thailand Thailand has made great progress in improving food security and nutrition, and relatedly, reducing
poverty and promoting relatively inclusive economic growth. Yet recent data on nutrition outcomes point
to persistent challenges that must be addressed for Thailand to eliminate hunger and undernutrition for
all. At the same time, dietary and lifestyle shifts are driving increases in overweight and obesity, as well
as an increase of non-communicable diseases, which are causes of concern (Gillespie et al. 2016).
This section discusses the poverty, food security, and nutrition situation in Thailand, along with past trends
and progress.
Poverty reduction and economic growth Thailand is an upper-middle income country with low rates of poverty. The population living under $1.90
a day fell drastically from 20 percent to less than one percent from 1981 to 2004 (See Figure 1). Poverty
has remained below one percent since then. However, using the national poverty line, 10.5 percent of the
population lives in poverty as of 2014. Moreover, there is a significant rural-urban disparity in poverty:
While the country is rapidly urbanizing, with half the population living in urban centers and many more
projected to join them, over 80 percent of the country's 7.1 million poor live in rural areas (World Bank
2017). While Thailand is more egalitarian than many other countries—its GINI coefficient has remained
below 40 since 20091—significant disparities in income and consumption can be seen in Thailand, with
pockets of poverty remaining in the Northeast, North, and South (World Bank 2017).
Driving poverty reduction in Thailand has been impressive and sustained economic growth, which grew
at an average annual rate of 7.5 percent from 1960 to 1996 and 5 percent following the Asian crisis during
1999-2005. GDP per capita rose steadily: from 1980 to 2015, GDP per capita rose from $1,605 to $16,180
(in purchasing power parity). However, GDP growth has diminished over the last few years, growing at
only 1.7 percent on average from 2014-2016.
Figure 1 GDP per capita and poverty headcount ratio at $1.90 a day, 1980–2015
Source: IMF 2017 and World Bank 2017
From 2011-2015, agriculture has grown by an average of 1.3 percent, and contributed a share of 10
percent toward overall GDP while employing 38 percent of the country’s labor force. The average annual
1 The GINI index, estimated by the World Bank, measures the extent to which income distribution among households in the country deviates from a perfectly equal distribution, with an index of 0 representing perfect equality and 100 implying perfect inequality. Thailand’s Gini coefficient of 39.26 in 2012 was 73 lowest among 154 countries’ most recent scores.
0
5
10
15
20
25
0
2,000
4,000
6,000
8,000
10,000
12,000
14,000
16,000
18,000
1980 1985 1990 1995 2000 2005 2010 2015
Po
vert
y h
ead
cou
nt
rati
o
(% o
f p
op
ula
tio
n)
GD
P p
er c
apit
a (P
PP
cu
rren
t in
tl d
olla
r)
GDP per capita (PPP current intl dollar)
Poverty headcount ratio at (% of population)
3
share of government agricultural expenditure in total expenditure in Thailand was 5.2 percent from 2005-
2014.
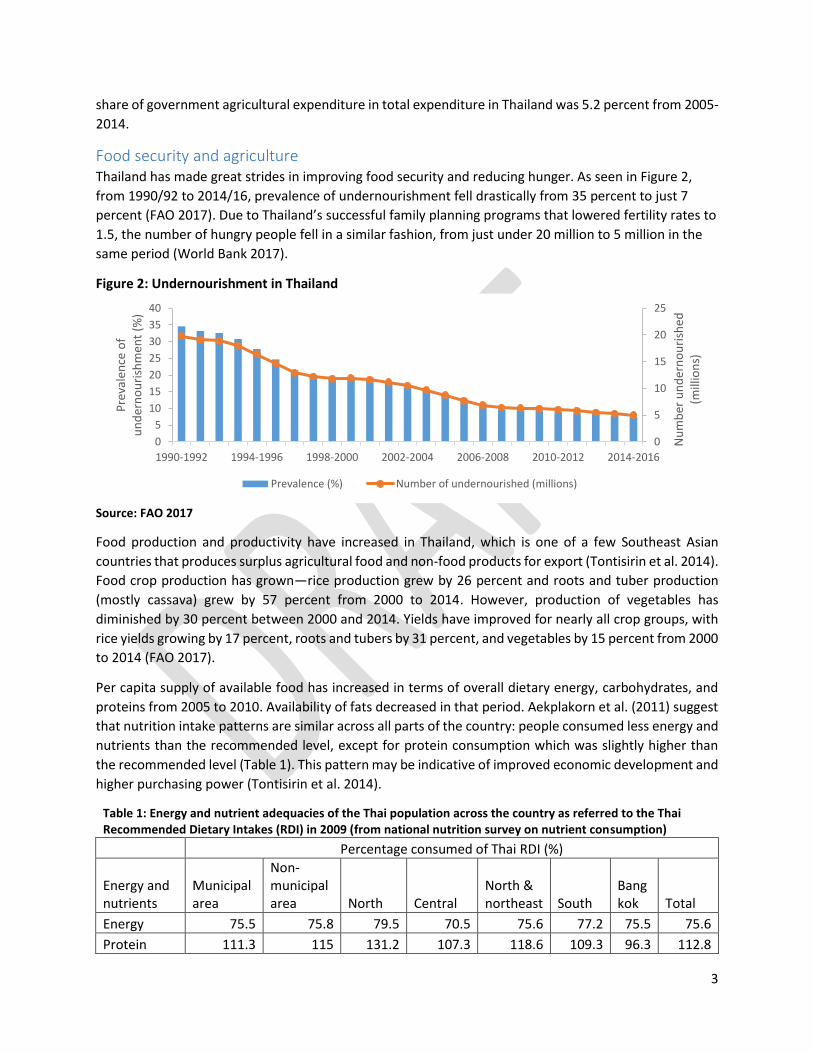
Food security and agriculture Thailand has made great strides in improving food security and reducing hunger. As seen in Figure 2,
from 1990/92 to 2014/16, prevalence of undernourishment fell drastically from 35 percent to just 7
percent (FAO 2017). Due to Thailand’s successful family planning programs that lowered fertility rates to
1.5, the number of hungry people fell in a similar fashion, from just under 20 million to 5 million in the
same period (World Bank 2017).
Figure 2: Undernourishment in Thailand
Source: FAO 2017
Food production and productivity have increased in Thailand, which is one of a few Southeast Asian
countries that produces surplus agricultural food and non-food products for export (Tontisirin et al. 2014).
Food crop production has grown—rice production grew by 26 percent and roots and tuber production
(mostly cassava) grew by 57 percent from 2000 to 2014. However, production of vegetables has
diminished by 30 percent between 2000 and 2014. Yields have improved for nearly all crop groups, with
rice yields growing by 17 percent, roots and tubers by 31 percent, and vegetables by 15 percent from 2000
to 2014 (FAO 2017).
Per capita supply of available food has increased in terms of overall dietary energy, carbohydrates, and
proteins from 2005 to 2010. Availability of fats decreased in that period. Aekplakorn et al. (2011) suggest
that nutrition intake patterns are similar across all parts of the country: people consumed less energy and
nutrients than the recommended level, except for protein consumption which was slightly higher than
the recommended level (Table 1). This pattern may be indicative of improved economic development and
higher purchasing power (Tontisirin et al. 2014).
Table 1: Energy and nutrient adequacies of the Thai population across the country as referred to the Thai Recommended Dietary Intakes (RDI) in 2009 (from national nutrition survey on nutrient consumption)
Percentage consumed of Thai RDI (%)
Energy and nutrients
Municipal area
Non-municipal area North Central
North & northeast South
Bangkok Total
Energy 75.5 75.8 79.5 70.5 75.6 77.2 75.5 75.6
Protein 111.3 115 131.2 107.3 118.6 109.3 96.3 112.8
0
5
10
15
20
25
0
5
10
15
20
25
30
35
40
1990-1992 1994-1996 1998-2000 2002-2004 2006-2008 2010-2012 2014-2016
Nu
mb
er u
nd
ern
ou
rish
ed
(mill
ion
s)
Pre
vale
nce
of
un
der
no
uri
shm
ent
(%)
Prevalence (%) Number of undernourished (millions)

4
Calcium 40.4 38.6 48 38.9 33.4 42.7 36.2 39.7
Phosphorus 84.9 84.7 97 82.4 80.9 87.3 76.9 84.9
Iron 83.7 81.4 90.6 81.8 79.3 86.3 75.8 82.8
Vitamin A 79.1 67.7 76.6 69.7 78.3 83.1 64.4 74.6
Thiamine 112.3 104.6 120.2 105.4 103.8 116.8 100.3 109.2
Riboflavin 100 91.9 109.1 93.9 94.2 101.3 89.3 97.5
Niacin 84 87.8 94.8 80.8 89.2 87.5 74.5 85.5
Vitamin C 93.6 84.7 85.4 95.8 75.9 98.7 96.2 90.1 Source: Adapted from Tontisirin et al. 2014
In terms of food access, the average share of expenditures to food (61 Baht per day) was 7.8 percent of
total income in 2011 (Tontisirin et al. 2014). For a person making the minimum wage of 300 Baht per day,
the expenditure for food would be a 20.3 percent.
Investment in agricultural R&D has helped drive agricultural productivity in Thailand (Suphannachart and
Warr 2011). Yet public agricultural R&D spending in Thailand has been shrinking, from 236 million (in 2005
PPP dollars) to 171 million from 1996 to 2008. Furthermore, the intensity of agricultural R&D—the public
agricultural R&D spending as a share of agricultural GDP—has shrunk from 0.69 to 0.32 from 1996 to 2008.
Along with this decline in public expenditures to agricultural R&D has been an elevated role of universities
and the private sector. According to Suphannachart (2016), the government provides the largest share in
total agricultural R&D spending, universities are increasingly important.
Nutrition outcomes and drivers Thailand’s successes and remaining challenges in nutrition are reflected against key nutrition outcome
indicators, which along with trends and the current state of key drivers of nutrition, are discussed in this
section.
Outcomes Child malnutrition: From the late 1980s Thailand made notable progress on child nutrition. The
prevalence of stunting (low height-for-age) among children under age 5 declined significantly from 23
percent to around 16 percent from 1987 to 2006. However, such impressive progress experienced some
stagnation between 2006 and 2012. Nevertheless, recent survey results indicate progress in reducing
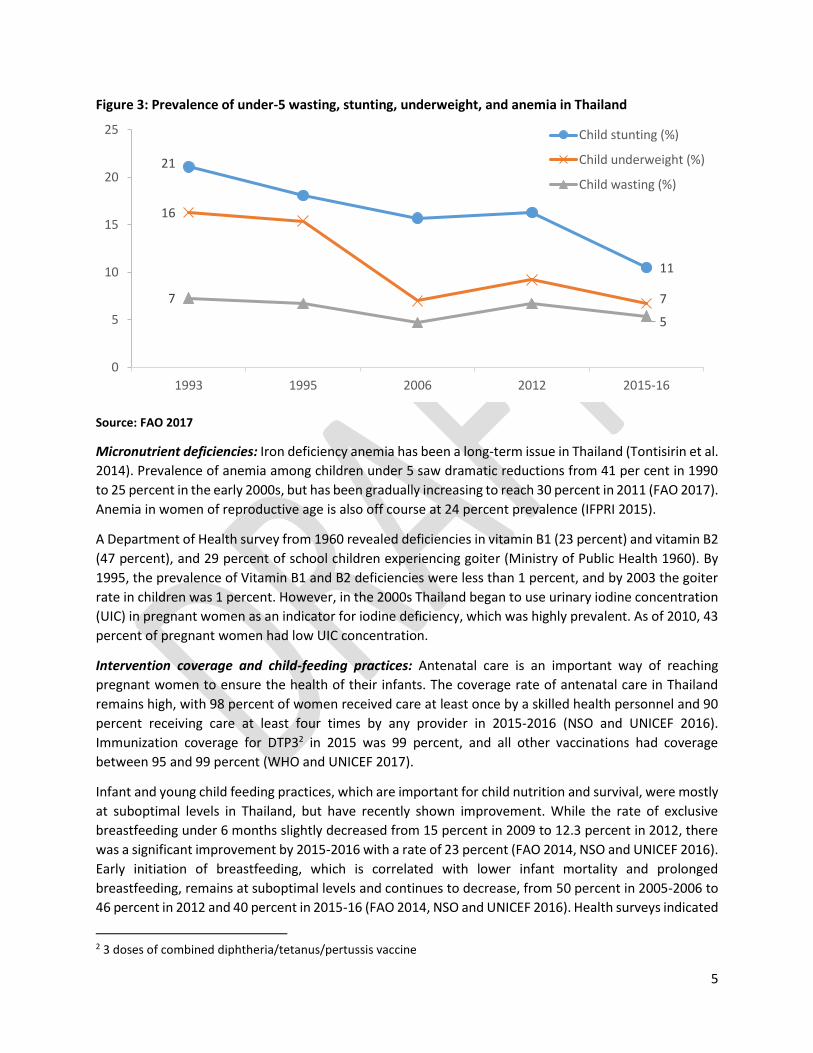
stunting prevalence (Figure 3). In 2015-2016 stunting prevalence among children under age 5 was under
11 percent.
In a similar trend, the prevalence of child underweight (low weight-for-age) fell drastically from 16 percent
to 7 percent from 1993 to 2006, and prevalence of wasting (low weight-for-height) fell from 7 percent to
5 percent in the same period. Yet from 2006 to 2012, prevalence of both underweight and wasting rose
slightly before seeing modest declines in 2015-2016 (Figure 3).
5
Figure 3: Prevalence of under-5 wasting, stunting, underweight, and anemia in Thailand
Source: FAO 2017
Micronutrient deficiencies: Iron deficiency anemia has been a long-term issue in Thailand (Tontisirin et al.
2014). Prevalence of anemia among children under 5 saw dramatic reductions from 41 per cent in 1990
to 25 percent in the early 2000s, but has been gradually increasing to reach 30 percent in 2011 (FAO 2017).
Anemia in women of reproductive age is also off course at 24 percent prevalence (IFPRI 2015).
A Department of Health survey from 1960 revealed deficiencies in vitamin B1 (23 percent) and vitamin B2
(47 percent), and 29 percent of school children experiencing goiter (Ministry of Public Health 1960). By
1995, the prevalence of Vitamin B1 and B2 deficiencies were less than 1 percent, and by 2003 the goiter
rate in children was 1 percent. However, in the 2000s Thailand began to use urinary iodine concentration
(UIC) in pregnant women as an indicator for iodine deficiency, which was highly prevalent. As of 2010, 43
percent of pregnant women had low UIC concentration.
Intervention coverage and child-feeding practices: Antenatal care is an important way of reaching
pregnant women to ensure the health of their infants. The coverage rate of antenatal care in Thailand
remains high, with 98 percent of women received care at least once by a skilled health personnel and 90
percent receiving care at least four times by any provider in 2015-2016 (NSO and UNICEF 2016).
Immunization coverage for DTP32 in 2015 was 99 percent, and all other vaccinations had coverage
between 95 and 99 percent (WHO and UNICEF 2017).
Infant and young child feeding practices, which are important for child nutrition and survival, were mostly
at suboptimal levels in Thailand, but have recently shown improvement. While the rate of exclusive
breastfeeding under 6 months slightly decreased from 15 percent in 2009 to 12.3 percent in 2012, there
was a significant improvement by 2015-2016 with a rate of 23 percent (FAO 2014, NSO and UNICEF 2016).
Early initiation of breastfeeding, which is correlated with lower infant mortality and prolonged
breastfeeding, remains at suboptimal levels and continues to decrease, from 50 percent in 2005-2006 to
46 percent in 2012 and 40 percent in 2015-16 (FAO 2014, NSO and UNICEF 2016). Health surveys indicated
2 3 doses of combined diphtheria/tetanus/pertussis vaccine
21
11
16
77
5
0
5
10
15
20
25
1993 1995 2006 2012 2015-16
Child stunting (%)
Child underweight (%)
Child wasting (%)

6
that factors contributing to unsuccessful breastfeeding were in adequate breast milk, mother’s working
status, and early introduction of semi-solid and solid food with traditional practices (Winichagoon 2013).
Additionally, 85 percent of children between 6 and 8 months are introduced to solid, semi-solid, or soft
foods, 33 percent received continued breastfeeding at 1 year and 16 percent at 2 years (NSO and UNICEF
2016).
Overweight and obesity: While Thailand has made great strides in reducing hunger and undernutrition,
enormous challenges have also come to the forefront. Among them is rising overweight and obesity
throughout the country, in part driven by changes in diets along with increasingly urban lifestyles.
Childhood obesity is a growing concern in Thailand (Figure 4). Overweight among children under 5 has
been steadily rising, from 1 percent in 1987 to 8 percent in 2006 and 11 percent in 2012, though with a
recent decline to 8 percent in 2015-2016 (IFPRI 2015, WB 2017, NSO and UNICEF 2016). Adult overweight
and obesity have also been on the rise, with prevalence among women higher than men. While 12 percent
of men and 17 percent of women were overweight in 1990, the prevalence is now 26 percent and 33
percent respectively as of 2014 (WHO 2017). In 1990, only 1 percent of men and 3 percent of women
were obese, now 6 percent men and 11 percent women were obese in 2014 (WHO 2017).
Figure 4: Prevalence of overweight and obesity in Thailand, 1995-2016
Source: World Bank 2017, WHO 2017, and NSO and UNICEF 2016
Drivers Underlying these nutrition outcomes are drivers from various sectors:
Nutrition-sensitive agriculture: Agriculture played an important part for alleviating malnutrition. Special
efforts were given to promoting and supporting the production and consumption of nutritious foods;
developing and promoting supplementary foods from local nutritious snacks for pregnant women; and
producing and disseminating community-based complementary foods for infant and young children
4.7
13.4
19.9
8
19.4
27.4
10.9
24.2
31.7
26
33.1
8.2
0
5
10
15
20
25
30
35
Children under 5 Adult male Adult female
1995 2006 2012 2014 2015-16

7
through active community participation. Resulting from these actions helped all but eliminate severe child
underweight. Agriculture can also be promoted in schools to contribute to the School Lunch Program (SLP)
and School Milk Program (SMP) (Tontisirin et al. 2014).
Gender: Women played a major role in the community-led movement to improve nutrition in Thailand,
with 80 percent of the volunteers being women (Heaver and Kachondam 2002). Gender was not
considered an issue in development in Thailand, particularly in agriculture, nutrition, health, education,
and employment (Tontisirin et al. 2014). Women had a strong advantage over men in serving as a source
of maternal and child health and nutrition educator, due to their accessibility and credibility among
mothers. Furthermore, the relative independence of women in Thailand – who traditionally manage
household finances, for example – allowed for large scale mobilization of women at the community level
(Heaver and Kachondam 2002). The fact that rural women were literate and therefore able to provide
nutrition outreach also contributed to the movement’s success (Heaver and Kachondam 2002).
Water, Sanitation, and Hygiene (WASH): Access to improved water, sanitation, and hygiene (WASH) is
linked with better nutrition, especially reductions in child stunting (Spears and Haddad 2015). Thailand’s
success in water and sanitation coverage is notable. The Village Health Sanitation Project and the
subsequent Rural Environmental Sanitation Program from the 1960s played a major role in Thailand’s
progress in water and sanitation (Luong, Chanacharnmongkol, and Thatsanatheb 2000). Access to
improved sanitation increased from 82 percent to 96 percent between 1990 and 2012. Rural-urban
disparities in access have been reversed with 96 percent of rural areas having access to improved
sanitation while 89 percent of urban areas have access. Disparities in access to improved water sources
have been eliminated, with 97 percent urban areas with access and 95 percent of rural areas (FAO 2014).
Fortification: Food fortification policies have been important in addressing deficiencies in iron, vitamin A,
and other micronuritients in Thailand. While efforts began on a voluntary basis, the Ministry of Public
Health established the National Food Fortification Committee in 1993 to iron fortification of staple foods,
namely wheat for noodles and bread, as well as fish and soy sauce (Wasantwisut [no date], Chavasit and
Tontisirin 1998). The government supported manufacturers through market regulations and reduced
taxes on premixes utilized for food fortification, created simpler registration processes for new products,
and standardized labelling of products (Wasantwisut [no date], Chavasit and Tontisirin 1998). Universal
Salt Iodization implemented by the National IDD Control Committee has also been important, as Thailand
lags on Ministry targets (Tontisirin et al. 2014). Collaboration with other stakeholders, including with the
World Food Programme on rice fortification, have also been successful (WFP and Government of Odisha
2017).
Social protection: Thailand’s social protection system has been fragmented in its development, but
continue to be strengthened, particularly following the East Asian economic crisis. Various health
schemes, including the Medical Welfare Scheme and Low Income Health Card Scheme for the poor, were
established alongside those for private sector employees and civil servants, yet 30 percent of the
population remained uninsured (Blomquist et al. 2001, Tangcharoensathien et al. 2010). In 2001, the
government merged existing health care schemes under the Universal Coverage Scheme, which left less
than 2 percent of the population uninsured (CGD 2017). Nevertheless, national social protection outside
of healthcare is limited to the Government Pension Fund for government employees and the Old Age
Living Allowance for the elderly (Paitoonpong, Chawla, and Akkarakul 2010).

8
Education: Education is associated with lower rates of child stunting, and mother’s education is an
important driver of improved child nutrition (Semba et al. 2008). Gross enrollment ratio for second
education in Thailand increased rapidly from 29 percent in 1990 to 87 percent in 2012 (World Bank 2017).
Female secondary education enrollment also remained high over the last decade, growing more gradually
from 81 percent in 2008 to 89 percent in 2012 (IFPRI 2015).
The integration of nutrition and education has contributed to improvements in Thailand as well. The
School Lunch Program (SLP) and School Milk Program (SMP) not only alleviated undernourishment among
students, but also served as a platform for nutrition education for healthy and nutritious diets. Launched
in 1992, the program eventually expanded its objective to include promotion of growth and holistic
development by learning to raise bland and animal foods using sound agricultural, food and nutrition
knowledge. The SMP also began in 1992 to encourage milk drinking among children and youth for
improved physical and intellectual development. As a result, per capital milk consumption by school
children increased from 24 liters per year in 1992 to 52 liters per year in 2009. A study also found that
child malnutrition in schools declined from 18 percent in 1992 to 5 percent in 2006 along with increases
in average height (Tontisirin et al. 2014).
Nutrition education has also played a key role in building expertise around applied nutrition issues. For
example, the Institute of Nutrition at Mahidol University (INMU) helped strengthen the National Food and
Nutrition Plan in the 4th National Economic and Social Development Plan. Studies by INMU may also have
helped shift strategies during the 5th NESDP toward village-based supplementary food processing to
overcome distribution issues (Kachandam et al. 1993).
Thailand’s integrated nutrition program The Government of Thailand has been firmly committed to ending hunger and undernutrition. Thailand
set the stage for accelerated progress in nutrition through national development strategies, policies, and
investments. As awareness on the issue grew, so did momentum to integrate nutrition into national
plans, as well as capacity to understand underlying problems and design and implement its community-
based nutrition program.
This section first focuses on Thailand’s integrated nutrition program and how it was formulated
beginning in the 1960s, and then implemented beginning in the 1980s. For information on Thailand’s
current strategies, policies, and programs, see Annex A.
Building momentum: Integrating nutrition in national strategies and policies Many years of concerted efforts were required to get nutrition elevated on the national agenda with
policy direction from the first two National Economic and Social Development Plans (NESDP). From 1961-
1976, during this preparatory phase before the first National Food and Nutrition Plan (NFNP), nutrition
problems and target groups were identified and prioritized, pilot projects were tested, a critical mass in
terms of manpower in various ministries was formed, and tremendous international support obtained.
There were certain developmental processes that helped in gaining momentum:
1. Building awareness of the nutrition problem: In 1960, a team of experts from Thailand and the
United States conducted a national nutrition survey, which was critical for building public and
government awareness of the nutrition problem. It also helped inspire many nutrition scientists
to shift to more applied work on nutrition.
9
2. Piloting nutrition programs: The Expanded Nutrition Project, a pilot project of 10 villages in the
north-east, was initiated in 1961. This project was an Applied Nutrition Program that focused on
production and consumption of nutrition-rich foods. While nutrition was still not seen as a major
development issue in nutrition planning, the pilot program was an important step in that direction
(Kachandam et al. 1993).
3. Influencing policy and shifting perspectives: Key venues were created to discuss ideas among
various ministries and review existing and proposed nutrition programmes in the Third NESDP.
Stakeholders urged a shift in perspective to view nutrition as a critical investment for the
economy, and that the national planning authority should oversee food and nutrition policy and
align it with national development policy. A critical mass of experts from various ministries and
universities—including the Institute of Nutrition at Mahidol University, which was established as
a national planning and implementation body—formed a task force to develop the First National
Food and Nutrition Plan, which was incorporated in the Fourth NESDP (Nondasuta 1991).
4. Building capacity with strong national and international support: To train the next generation
and to strengthen the existing personnel for future tasks, many short and long term scholarships
were awarded to study food and nutrition planning abroad under the sponsorship of MOPH,
UNICEF, WHO, and others. Overall, there was strong support from multilateral and bilateral
agencies.
The fifth National Development Plan, introduced in 1982, was a turning point (Figure 5). The plan fully
recognized undernutrition not only as a development issue but also as a symptom of poverty. Accordingly,
a Poverty Alleviation Program (PAP) was introduced to improve nutrition and promote development. The
PAP covered about half of the country with focus on the poorest districts (Heaver and Kachondam 2002).
A multisectoral National Nutrition Committee, with members from health, agriculture, education, rural
administration, planning, and academic sectors, was established to give input on nutrition indicators and
actions for the PAP. Thailand also introduced the basic minimum needs (BMN) approach as part of the
PAP. Under this approach, communities conducted BMN surveys to identify priority areas for
development and appropriate actions to address local issues.

10
Figure 5. Timeline of selected nutrition indicators and key policy and strategies in Thailand during the
1st to 11th national Economic Social Development Plans
Source: Adapted from Tontisirin et al. 2014
Community movement to accelerate progress With nutrition high on the national development agenda, Thailand’s community-based nutrition program
achieved great success. Driving the success of its program in tackling undernutrition was largely due to
three key factors: strategic planning, community-led social mobilization, and local action-oriented
monitoring.
Strategic planning
The basic minimum needs (BMN) approach guided the planning process at the micro and macro levels,
whereby communities identified priorities based on a survey with 32 indicators in eight major thematic
areas. The indicators on food and nutrition included outcome indicators: (e.g. child malnutrition, low
birth-weight, and micronutrient deficiencies) and process indicators (e.g. immunization coverage,
antenatal care coverage, availability of potable water, and sanitary services).
According to Tontisirin and Gillespie (1999), these indicators functioned to
- Set locally valid program goals
- Empower people to participate in community development activities
- Balance the roles of community and government
- Promote integration of multisectoral services at the community level
- Target appropriate resources to areas of greatest need
- Provide a framework for evaluation

11
At the local level, community leaders, experts in nutrition and health, nongovernmental organization
(NGO) representatives, and district and sub-district sector chiefs led community planning to identify needs
and community-specific BMN indicators . Service providers and community leaders together established
nutrition-relevant action plans targeted to vulnerable and disadvantaged groups to address gaps and
challenges shown through the indicators (Gillespie et al. 2016). These plans were tested for feasibility,
process of operation, and application to areas with the greatest need (Tontisirin and Gillespie 1999).
At the macro level, key representatives from the nutrition and health sectors, government, and
international agencies supported the community-led processes by promoting collaboration and
integration of nutrition programs between health, agriculture, education, and rural development sectors.
Furthermore, training and workshops for community- based nutrition programs were organized by district
chiefs, reinforced by field visits to communities, and were also supported by international agencies
(Gillespie et al. 2016).
Community-led social mobilization
With needs assessed and community-specific plans in place, Thailand was primed to implement its
nutrition program. To do so, a high degree of local level organization, namely though village nutrition
committees or women’s groups, was key for successful mobilization (Tontisirin and Gillespie 1999).
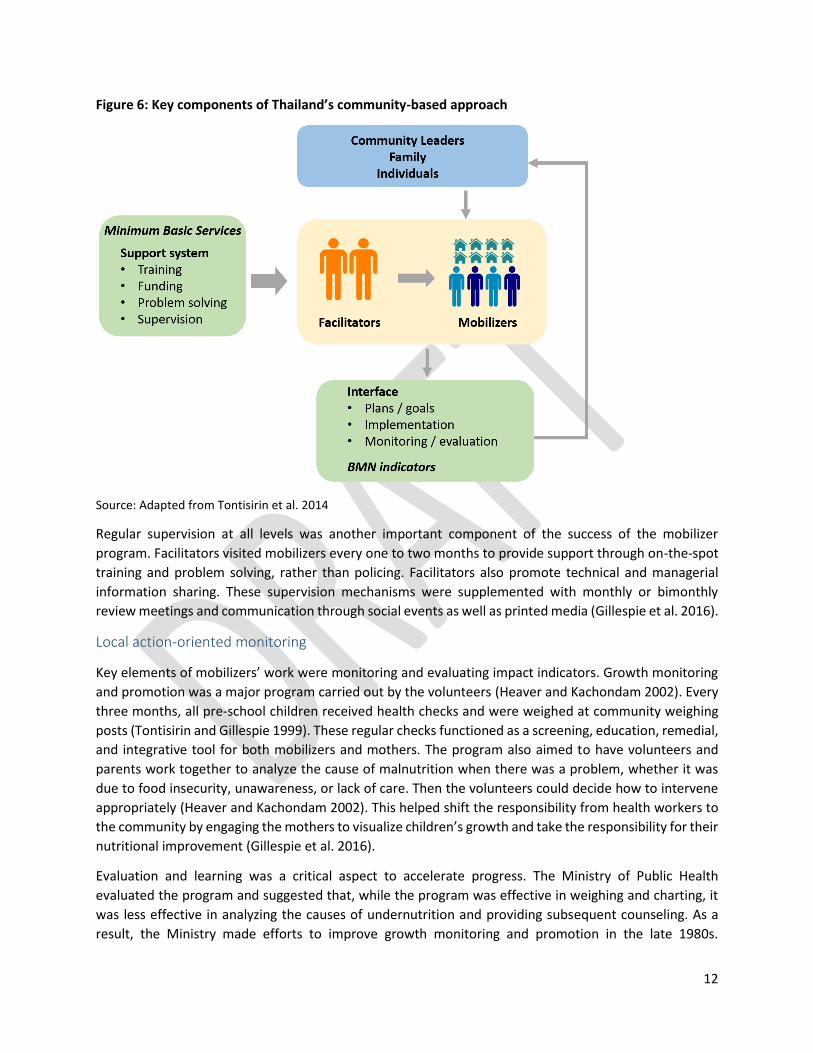
Figure 6 presents the key components of the successful community-based approach. Minimum basic
services in health, education, and agriculture are delivered by local service providers—mobilizers and
facilitators, described below—who also facilitate community leaders in planning and implementing
community action plans. Mass mobilization enabled increased service coverage as well as health and
nutrition communication with the public. Volunteers were provided ‘menus’ or remedial actions and best
practices to address health and nutrition problems (Tontisirin et al. 2014).
Community health and nutrition volunteers, or “mobilizers,” were selected by their communities and
supported service delivery systems. Mobilizers were mostly women who displayed qualities of leadership
and commitment capable of instilling confidence in community members and encouraging involvement
(Tontisirin and Gillespie 1999). One major criteria in selecting volunteers was to be someone whom local
people in the community turned to for advice (Heaver and Kachondam 2002). A ration of one mobilizer
per 10 to 20 households was considered the optimal level of outreach and effectiveness. While these
mobilizers were unpaid, they received free medical services for themselves and their families, and were
public recognized for their work with awards and certificates (Gillespie et al. 2016).
Training and support was a critical part of the program. Mobilizers were trained to work with service
providers, or “facilitators”, who were paid healthcare workers, NGO employees, or university and research
staff, to implement the nutrition programs. Mobilizers initially participated in a two-week training
focusing on the theory and practical application of basic nutrition and health facts, particularly prenatal
antenatal and postnatal care, maternal and childcare practices, birth spacing, breastfeeding,
immunization, complementary feeding, and growth monitoring and promotion. The training also placed
emphasis on communication to effectively provide information on nutrition and care for women and
children, and to build interest in self-help activities, especially among women’s groups (Gillespie et al.
2016).
12
Figure 6: Key components of Thailand’s community-based approach
Source: Adapted from Tontisirin et al. 2014
Regular supervision at all levels was another important component of the success of the mobilizer
program. Facilitators visited mobilizers every one to two months to provide support through on-the-spot
training and problem solving, rather than policing. Facilitators also promote technical and managerial
information sharing. These supervision mechanisms were supplemented with monthly or bimonthly
review meetings and communication through social events as well as printed media (Gillespie et al. 2016).
Local action-oriented monitoring
Key elements of mobilizers’ work were monitoring and evaluating impact indicators. Growth monitoring
and promotion was a major program carried out by the volunteers (Heaver and Kachondam 2002). Every
three months, all pre-school children received health checks and were weighed at community weighing
posts (Tontisirin and Gillespie 1999). These regular checks functioned as a screening, education, remedial,
and integrative tool for both mobilizers and mothers. The program also aimed to have volunteers and
parents work together to analyze the cause of malnutrition when there was a problem, whether it was
due to food insecurity, unawareness, or lack of care. Then the volunteers could decide how to intervene
appropriately (Heaver and Kachondam 2002). This helped shift the responsibility from health workers to
the community by engaging the mothers to visualize children’s growth and take the responsibility for their
nutritional improvement (Gillespie et al. 2016).
Evaluation and learning was a critical aspect to accelerate progress. The Ministry of Public Health
evaluated the program and suggested that, while the program was effective in weighing and charting, it
was less effective in analyzing the causes of undernutrition and providing subsequent counseling. As a
result, the Ministry made efforts to improve growth monitoring and promotion in the late 1980s.

13
Evaluations following these efforts saw an increase in accurate weighing, but also found that analyses of
the cause of undernutrition remained relatively low at 46 percent of the time, as was the case for nutrition
education at 64 percent provision (Gillespie et al. 2016).
Nevertheless, by the mid-1990s, the BMN indicators were used in over 95 percent of villages to monitor
progress and guide development activities. In rapidly improving villages, modifications were made to add
new indicators or to raise the criteria of success (Gillespie et al. 2016).
Remaining challenges and gaps Thailand’s success in the 1980s and 1990s remains a prime example of how to accelerate progress in
reducing hunger and undernutrition. However, several challenges remain (i.e. persistent undernutrition),
while new challenges are emerging (i.e. overweight and obesity). Therefore, to go the last mile and
eliminate malnutrition from Thailand, these challenges must be tackled.
This section describes the current and emerging challenges in Thailand, and proposes key action and
knowledge gaps that must be filled to address these challenges.
The double burden: Persistent undernutrition and emerging obesity According to the 2015 Global Nutrition Report (GNR), Thailand is off course for all World Health Assembly
(WHA) nutrition targets (IFPRI 2015).3 This is due to the existence of a double burden of malnutrition—
that is, persistent undernutrition and emerging overweight and obesity.
On the one hand, segments of the country still face undernutrition. The GNR highlights that 7 percent of
children under five suffer from wasting and 2 percent from severe wasting. Furthermore, 24 percent of
reproductive age women are anemic, and exclusive breastfeeding of infants under six months is at 12
percent. In a sign of progress, the latest data from UNICEF show that stunting has declined to 10.5 percent
in 2015-16—a significant drop from 16 percent in 2012 (UNICEF 2016). However, geographic disparities
in undernutrition remain: Child stunting, underweight, and wasting are higher in rural areas than urban
areas, and are concentrated in the Southern region (stunting is also high in the Central region) (UNICEF
2016).
Meanwhile, the prevalence of overweight, obesity, and related noncommunicable diseases have been on
the rise, with some progress made in most recent years. As of 2016, 8.2 percent of children under five are
overweight, a drop from 11 percent in 2012, and similar to rates seen in 2006 (See Figure 7). The trend
for adults is concerning as well—as of 2014, nearly one third of adults are overweight and 9 percent are
obese (Gillespie et al. 2016).
3 The WHA targets (to be achieved by 2025) are: 40% reduction in the number of under-5 children stunted; 50% reduction of anemia in women of reproductive age; 30% reduction in low birth weight; no increase in child overweight; increased rate of exclusive breastfeeding in the first 6 months up to at least 50%; and reduce and maintain childhood wasting to less than 5%

14
Figure 7: Child stunting and child overweight in Thailand (%)
Source: UNICEF 2016
Several factors could be contributing to the new challenges in Thailand’s nutrition progress. Hindering
reductions in child undernutrition could be:
- Income inequality and extreme poverty (Haddad 2016, Gillespie et al. 2016)
- Disparities among vulnerable groups, such as families of illegal immigrants, families suffering from
AIDS, and among children of seasonal migrant workers could impact nutritional status (Heaver
and Kachondam 2002)
- Diminished policy attention on undernutrition due to rising overweight and obesity (Haddad 2016,
Gillespie et al. 2016)
- Difficulties in raising awareness and buy-in from women regarding iron deficiency and the value
of consistent daily supplements (Heaver and Kachondam 2002)
The factors that may be driving the increase of overweight and obesity include:
- Increase in incomes and lifestyle changes associated with urbanization, leading to reduced
physical activity and increased access to processed foods (Gillespie et al. 2016)
- Lack of communication and service delivery systems encouraging dietary habits targeted for
overnutrition, especially in urban areas (Heaver and Kachondam 2002)
Knowledge and action gaps The main knowledge gaps identified in this study are around how to address the double burden of
malnutrition seen in Thailand. Many of these gaps are drawn from Tontisirin et al. (2014) and Gillespie et
al. (2016).
More research, analysis, and data are needed to address the double burden seen in Thailand, particularly
around the following questions:
- What are the drivers of persistent undernutrition in the poorest members of society, and how can
the country’s nutrition program better support them?
- Why and how child stunting, wasting, and overweight persist, especially with regards to the
impact of child feeding in the first 24 months of children under five?
- Nutrition education programs are falling short of improving breastfeeding rates—what are the
underlying factors (e.g. increasing labor force participation of women, working conditions for
women) and how can strategies be put in place to increase good breast feeding practices?
21
1816 16
11
5
8
11
8
0
5
10
15
20
25
1993 1995 2006 2012 2016
Stunting
Overweight
15
- How can unhealthy foods high in processed sugar, fat, or salt be formulated or reformulated with
less of these nutrients?
- What is the impact of the labelling on nutrition outcomes and consumption behaviors?
- How to design win-win programs to address the double burden, e.g. programs to combat
overnutrition that also consider undernutrition in early life, as emerging evidence indicates
significant contribution of early life nutrition to the occurrence of obesity and chronic diseases
later in life (Winichagoon 2013)?
- How to ensure accuracy and timeliness of nutrition data, which in recent years has been a source
of debate due to discrepancies in undernutrition outcomes among different sources?
Some programmatic or action gaps include:
- Revitalizing the community-based approach used under the PAP in both rural and urban settings
to address undernutrition and overnutrition
- For ethnic minorities and geographically remote peoples:
o Developing additional programmes targeted to their needs
o Building capacity to assess and monitor food and nutrition in these areas, with
appropriate actions that fit community cultures
- Strengthen local agri-food systems to support the elevated demand for quality, nutritious foods
driven by the School Lunch Programme and School Milk Programme
- Improve food safety for fruits and vegetable consumption through multisectoral efforts
- Continue to raise public awareness (and therefore demand) for diverse, healthy, nutritious diets
- Improve effectiveness of interventions to reduce consumption of unhealthy (sugary, fatty, salty,
and processed) foods
- Build capacity of Local Administrative Organizations (LAOs) in administration, budgetary and
programmatic planning, and monitoring and evaluation, and increase support for LAOs from all
central government agencies in charge of food
Conclusion: Lessons learned Thailand has made demonstrable, rapid strides to reduce hunger and undernutrition. Its achievement has
been widely regarded as a prime example of a successful nutrition program. With nutrition well-integrated
in strategies and policies, Thailand was able to mobilize people at the community level to implement and
monitor its program. However, some challenges remain, such as persistent undernutrition, and new
challenges are emerging. Most notably, rising rates of overweight and obesity and noncommunicable
diseases is an area of concern.
It is fully understood that one country’s experience cannot be simply reproduced in other countries—each
country’s context is unique. Yet, as is the aim of this report, the lessons learned in Thailand can be adapted
to have an impact in other countries. Among the many lessons learned from Thailand’s successes, some
include:
- Advocacy and research: Raising local and national awareness of nutrition as key for health, social,
and economic development is critical. Research plays a major role in understanding the main
causes of malnutrition.
- Nutrition as priority: From the highest levels of the political system down and across multiple
sectors, nutrition was recognized as critical for economic and social development. Indeed, nearly

16
20 percent of total government expenditure was invested in health, alongside similar investments
in education (Gillespie et al. 2016)
- Setting measurable targets: Explicit nutrition goals and indicators were embedded into policies,
strategies, and action plans. This is a critical for accountability and should be applied beyond solely
the lead agency (in this case, MOPH). The Poverty Action Plan (PAP) went beyond the MOPH to
build accountability across agencies and help them work together to implement plans at the
national and community levels.
- Community action: What makes Thailand’s success unique is the mass mobilization of community
leaders and volunteers to implement and monitor their nutrition program. Establishing a
volunteer system (1 mobilizer to every 10-20 households) to help deliver basic minimum services
and monitor community-based programs with nutrition indicators is recommended in countries
with high levels of malnutrition.
- Institutional support: Under the PAP, the administrative structure for rural development
coordinated and harmonized goals, indicators, and action plans among various sectors (e.g.
agriculture, health, education, local administration). This helped streamline efforts from national
level to the community level. Research institutions were developed to provide technical services
and trainings for food and nutrition development.
- Nutrition education: Communicating good nutrition through food-based dietary guidelines and
food labeling; nutrition campaigns through mass media and local activities; and food and dietetic
education information during health counselling have helped to improve maternal and child
nutrition.
Thailand is on its way toward eliminating hunger and malnutrition. By learning from its successes and
challenges, other countries may be able to shorten the learning curve and accelerate the pace of progress
toward ending hunger and undernutrition.

17
References
Blomquist, J., Verhoeven, M., Cordoba, J.P., et al. 2001. Social Safety Nets in Response to Crisis: Lessons and
Guidelines from Asia and Latin America. (Washington, DC: World Bank).
http://siteresources.worldbank.org/SAFETYNETSANDTRANSFERS/Resources/APECEnglish.pdf
Center for Global Development. 2017.Thailand’s Universal Coverage Scheme. Millions Saved. Accessed May 2017.
http://millionssaved.cgdev.org/case-studies/thailands-universal-coverage-scheme
Chavasit, V. and Tontisirin, K. 1998. Micronutrient-deficiency problems in Thailand. In t. U. Nations, Food and
Nutrition Bulletin. Tokyo: the United Nations University Press
Cherdchuchai, S., and K. Otsuka. 2006. “Rural Income Dynamic and Poverty Reduction in Thai Villages from 1987 to 2004.” Agricultural Economics 35(Supplement s3): pp. 409–423.
Food and Agriculture Organization (FAO). 2017. FAOSTAT. Accessed May 2017 http://faostat3.fao.org/download/Q/QC/E.
______. 2014. Thailand Food and Nutrition Security Profile. Accessed May 2017 http://www.fao.org/3/a-at703e.pdf.
Gillespie, S., Tontisirin, K., and Zseleczky, Laura. 2016. Local to National: Thailand’s Integrated Nutrition Program.
In Nourishing millions: Stories of change in nutrition. Gillespie, Stuart; Hodge, Judith; Yosef, Sivan; and
Pandya-Lorch, Rajul (Eds.) Ch. 10 Pp. 91-98. Washington, D.C.: International Food Policy Research Institute
(IFPRI). http://dx.doi.org/10.2499/9780896295889_10.
Gillespie, S., ed., Hodge, J., ed., Yosef, S., ed., and Pandya-Lorch, R., ed. 2016. Nourishing millions: Stories of change
in nutrition. Washington, D.C.: International Food Policy Research Institute (IFPRI).
http://dx.doi.org/10.2499/9780896295889.
Haddad, L., 2016. Can Thailand write us a new story for nutrition improvement in the 21st century?. January 24,
2016, http://bit.ly/1LXPzZf.
Heaver and Kachondam. 2002. Thailand’s National Nutrition Program: Lessons in Management and Capacity
Development. Health, Nutrition, and Population Discussion Paper (Washington, DC: World Bank)
International Food Policy Research Institute (IFPRI). 2015. Global Nutrition Report 2015, Nutrition Country Profile:
Thailand 2015, http://bit.ly/1ZJaVMe.
Kachondam, Y., Winichagoon, P., and Tontisirin, K. 1993. Nutrition and Health in Thailand: Trends and action. Case
study for XV Congress of the International Union of Nutrition Sciences, September 26 to October 1, 1993.
Luong, T.V., Chanacharnmongkol, O., and Thatsanatheb, T. 2000. Universal Sanitation – Thailand Experiences. 26th
Water, Engineering, and Development Centre Conference. Dhaka, Bangladesh.
http://wedc.lboro.ac.uk/resources/conference/26/Luong.pdf
National Statistical Office and United Nations Children’s Fund. 2016. Thailand Multiple Indicator Cluster Survey
2015- 2016. Final Report. (Bangkok: NSO and UNICEF).
Nondasuta A. Thailand Food and Nutrition Planning and Programme. Proceedings of the Special Nutrition Study
Seminar for Policy Makers and High level Officers in Nutrition Programmes, 25-30 November 1991.
Institute of Nutrition, Mahidol University, Thailand, 1991.
Paitoonpong, S., Chawla, A., and Akkarakul, N. 2010. Social Protection in Thailand – Current State and Challenges,
in Asher, M. G., S. Oum and F. Parulian (eds.), Social Protection in East Asia – Current State and
Challenges. ERIA Research Project Report 2009-9, Jakarta: ERIA. pp.265-291.

18
Semba, R. D., et al. 2008. "Effect of Parental Formal Education on Risk of Child Stunting in Indonesia and Bangladesh: A Cross-sectional Study." Lancet 371(9609): 322–328.
Spears, D., and L. J. Haddad. 2015. "The Power of WASH: Why Sanitation Matters for Nutrition." In 2014-2015 Global Food Policy Report, 19–23. Washington, DC: International Food Policy Research Institute (IFPRI). http://ebrary.ifpri.org/cdm/ref/collection/p15738coll2/id/129074.
Suphannachart, W. 2016. Returns to Major Agricultural R&D Sources in Thailand. American Journal of Economics.
Vol. 6 No. 1, pp. 22-26. doi: 10.5923/j.economics.20160601.03.
Suphannachart, W., and Warr, P. 2011. Research and productivity in Thai agriculture. Australian Journal of
Agricultural and Resource Economics. Vol. 55, No. 1, pp. 35-52. doi: 10.1111/j.1467-8489.2010.00519.x.
Tangcharoensathien, V., Swasdiworn, W., Jongudomsuk, P. et al. 2010. Universal Coverage Scheme in Thailand:
Equity Outcomes and Future Agendas to Meet Challenges. World Health Report Background Paper 43.
(World Health Organization).
http://www.who.int/healthsystems/topics/financing/healthreport/43ThaiFINAL.pdf
Thailand, Department of Health, First National Nutrition Survey of Thailand (Bangkok: Ministry of Public Health,
1960)
Tontisirin, K. and Gillespie, S. 1999. Linking community-based programs and service delivery for improving maternal
and child nutrition. Asian Development Review. 17, 1-2: 33-65.
Tontisirin, K., Chavasit, V., Parinyasiri, T., et al. 2014. Nutrition Impact of Agriculture and Food Systems: Thailand.
Country Policy Analysis (Geneva: UN System Standing Committee on Nutrition).
Unakul S. 1985. An Economic Planner's View of the Nutrition Problem in Thailand. In: Panayotou T, ed. Food Policy
Analysis in Thailand. (New York: Agricultural Development Council. 157-187.)
Wasantwisut, E. [no date]. Food Fortification: Thailand’s Experience. Retrieved from FDA - Ministry of Public Health
(iodine Thailand): http://iodinethailand.fda.moph.go.th/kmfood/file/266.pdf
Winichagoon, P., 2013. Thailand nutrition in transition: situation and challenges of maternal and child nutrition.
Asia Pacific journal of clinical nutrition, 22(1), pp.6-15.
World Food Programme (WFP) and Government of Odisha. (2017). A Case for Fortified Rice. New Delhi: WFP.
World Health Organization. 2017. Global Health Observatory Data, accessed May 2017.
World Health Organization and United Nations Children’s Fund. 2017. WHO-UNICEF estimates of DPT3 Coverage.
Accessed May 2017.
http://apps.who.int/immunization_monitoring/globalsummary/timeseries/tswucoveragedtp3.html
World Bank. 2017. World Development Indicators Database, accessed May 2017.
http://databank.worldbank.org/data/reports.aspx?source=world-development-indicators.

19
Annex A: Recent and current food security and nutrition strategies,
policies, and programs in Thailand The section, adapted from Tontisirin et al. (2014) and Gillespie et al. (2016), describes Thailand’s current
major strategies, policies, and programs related to food security and nutrition.
National plans Thailand’s National Economic and Social Development Plans have guided strategic development in
Thailand since 1962. As mentioned above, the country began integrating nutrition with its 4th plan, and
fully integrated nutrition in the 5th plan. Regarding agriculture, the 11th NESDP (2012-2016) advocated for
a balance between food, animal feed and energy plant production, as well as efficient utilization of
production resources through various initiative, such as the expansion of irrigation and water facility
construction. It had greater focus on natural resource management for sustainable agricultural
production, as well as information systems and research. The current 12th NESDP (2017-2021) aims to
reduce income inequality and poverty, strengthen the Thai economy and enhance the country’s
competitiveness, promote natural capital and environmental quality, and further boost the confidence of
Thailand in the international community.
Under the previous (11th) NESDP, the Strategic Framework for Food Management (SFFM) was integrated
into the plan, covering the food chain from the household to the national level: food security; food quality
and safety; food education; and food management. Thematic committees were appointed to facilitate
and coordinate the framework at the national level, while implementation takes place at the local and
workplace levels.
Like the Poverty Alleviation Program, the Strategic Framework identified actions and mobilizes community
volunteers to address the double burden of malnutrition, including the provision of basic health,
education, agriculture, and other social services. Nutrition indicators went beyond undernutrition to
measure overweight, obesity, and other factors contributing to NCDs. The framework integrated several
programs, including efforts to promote production and marketing of nutritious foods; reduce sugar and
salt consumption; improve food labeling and safety; and promote physical activity, exercise, and nutrition
education. For example, programs to control overweight and obesity among schoolchildren through
nutritious food promotion, monitoring, and physical exercise were tested in 27 schools in Bangkok and
600 schools throughout the country (Gillespie et al. 2016).
Ministerial-level plans and policies Ministries have integrated the 11th NESDP and the SFFM into their action plans for food security, food
quality and safety, and in linking food, nutrition, and health.
Ministry of Public Health (MOPH) MOPH is responsible for nutrition and health related issues. The MOPH’s recent major strategic policies
and plans related to food and nutrition are:
The 11th Health Development Plan (2012-2016), which aimed to ensure good health for all and a fair and
sufficient health system, leading to a healthy society. The main policies were to strengthen health partners
and self-reliance in health; develop a monitoring and response system (especially for disaster
management); strengthen and standardize the health service system; and strengthen mechanisms to
regulate health services.

20
Thailand Healthy Lifestyle Strategic Plans (2011-2020) provides guidance for a healthy lifestyle based on
the Sufficiency Economy Philosophy and a moderate life path. It emphasized healthy lifestyles and eating
habits to avoid overweight, obesity, and NCDs. It promoted a sufficiency lifestyle, balanced diet, physical
exercise, and emotional management.
The National Nutrition Plan (2010-2013) promoted a healthy diet around obesity prevention, iodine
deficiency prevention and control, and optimal growth and development of children. To address obesity,
the plan focused on a balanced diet by age group, and worked with provincial health offices and local
government organizations to conduct behavior change campaigns.
The Food Safety Strategy (2012-2016) involved defining food standards and regulating and monitoring
national food safety for consumer protection. The four main strategies are (1) law development and
standardization; (2) monitoring and enforcement based on risk assessment; (3) database development;
and (4) knowledge management and development to raise awareness among all sectors and groups along
the food chain.
Ministry of Agriculture and Cooperatives (MOAC) MOAC’s strategies and plans related to nutrition-sensitive agri-food systems are:
The 11th Agricultural Development Plan (2012-2016) had three key aims:
1. Improve the quality of life of farmers by stabilizing jobs and income; rehabilitating damage caused
by natural disasters; encourage youth in agriculture; and support institutes and networks in policy
development. One highlight of this strategy was to support farmers to become “smart farmers”
in terms of knowledge of products, food safety, and social and environmental friendliness.
2. Increase efficiency in production, management, and food security by balancing production
between food and energy crops; promoting green production and technology; supporting R&D
for value-added products; enhancing safe production and reducing food loss; and developing
agricultural trade and logistical systems.
3. Efficiently develop and balance agricultural resources for sustainability through better
management of sustainable production resources (i.e. soil, forest, water, and biodiversity).
The Strategic framework for food security (2013-2016) aimed to for Thailand to produce safe and high
quality food and have sustainable security for all. It did so through four main strategies: (1) produce
adequate food for sustainable domestic demand; (2) encourage all Thai people at times to access good
nutritious food; (3) enhance good quality and safe food production, reduce food waste and promote
proper food utilization; and (4) promote sustainable use of natural resources for food production.
The Agricultural Commodity and Food Safety Standards and Strategy (2010-2013) aimed to establish
agricultural commodity and food standards and safety for all. It did so by (1) developing quality agricultural
products; (2) encouraging entrepreneurs to implement safety standards and compliance; (3) research and
development for high quality food products and their markets; (4) creating a food education system and
standards; and (5) ensure confidence in Thai agricultural commodities and food product standards.
Additional Ministerial plans Other ministries play a role in supporting food and nutrition, including:

21
The Ministry of Interior’s (MOI’s) works to standardize Thai food internationally with the aim that over
half of food produced in domestic factories will meet international standards.
The Ministry of Commerce (MOC) monitors food price fluctuation to ensure that vulnerable groups are
not adversely affected, monitors industry for consumer protection, and is involved in regulations and laws
in trade and distribution.
The Ministry of Social Development and Human Security (MSDHS) supports the national welfare system
for disadvantaged groups, including during crisis situations.
The Ministry of Education (MOE) provides basic nutrition education and promotes healthy diets among
students by integrating knowledge in coursework. IT is also in charge of the School Lunch Program and
School Milk Program.
Programs for food security and nutrition Programs that have been key to addressing food security nutrition in Thailand include:
Mobilization of village health volunteers: The village health volunteer program, under the Ministry of
Public Health (MOPH) and the national Primary Health Care system, was critical to alleviating maternal
and child malnutrition in the 1980s. The volunteers played an important role in health and nutrition
communication, antenatal care, growth monitoring of children, immunization, as well as assisting local
health service providers. More recently, the volunteers are being mobilized to prevent and control obesity
and NCDs, as well as providing public health assistance in family planning, control of HIV/AIDS, elimination
of the Avian flu.
Food-based dietary-guidelines and the nutrition flag: The
Thai government, together with academic and private sectors,
developed the food-based dietary guidelines (FBDGs) and the
nutrition flag and 1996 and 1998 respectively to facilitate
communication with consumers. The FBDGs recommend
maintaining proper weight and diet diversity based on the
main five food groups. The nutrition flag (see figure) provides
a quantitative complement to the FBDGs and is also utilized
as an education tool on nutrition. The private sector has aided
in having the FBDGs and nutrition flag on some food labels.
Nutrition labelling: The MOPH first implemented nutrition
labelling on a voluntary basis, except for food products that
make nutrition claims. The labels aim to inform consumers of
the nutritional value of foods to prevent under- and over-
nutrition as well as related NCDs. The impact of the labelling
on nutrition outcomes and consumption behaviors require
further evaluation.
Food fortification: Both voluntary and compulsory food fortification programs exist in Thailand. Iodine
deficiency disorder (IDD) control program has been a high priority, particularly Universal Salt Iodization
under the National IDD Control Committee. Monitoring urine iodine concentration in pregnant mothers
and children as well as research, public communication, and education campaigns have been helpful.
22
“Thai people have no big belly” campaign: The campaign, funded by the Health Promotion Foundation,
raises awareness of growing overweight and obesity and related NCDs, and encourages the public to
monitor their health by checking their waist circumference against the campaign’s cut-off values for
healthy females and males (90 cm and 96 cm, or 32 in and 36 in, respectively). The campaign also
promotes healthy eating practices and increased daily physical activity.
Sweet enough network: The MOPH’s Dental Health Division established the network to raise awareness
on the harmful health consequences of increasing sugar consumption and to lobby for regulations on
reducing added sugar in food products and beverages. The network was successful in banning sugary
carbonated drinks in schools and eliminating added sugar in infant and follow-up formulas.
Campaign for regular exercise and physical activity: Various national campaigns to promote regular
exercise and physical activity have been conducted by the MOPH since 2009, which several public and
private organizations have adopted as well. Many workplaces and communities have arranged public
areas for exercise and most local authorities have allocated budgets for these activities.
School Lunch Program: Following the Agriculture for School Lunch Project, which was launched in 1980
in remote rural schools, the nationwide School Lunch Program (SLP) was implemented in 1992. The SLP
aims to alleviate undernourishment among pre-primary and primary school students while also providing
nutrition education. Building on SLP’s positive outcomes in reducing undernutrition among students, the
program has expanded its objective to promote growth and development, including how to raise plant
and animal foods with sound agricultural, food, and nutrition knowledge. The school lunch menu is subject
to quality control for nutrition and food safety, and use locally available, seasonal foods or foods produced
from school gardens.
School Milk Program: The national School Milk Program (SMP) launched in 1992 to provide 200 ml of milk
initially to kindergarten children, then later to primary school students as well. The SMP seeks to improve
students’ nutritional status and physical and intellectual development, while strengthening the demand
for the local daily industry. After the Office of National Primary Education led to program until 2000,
program administration was transferred to local administrative organizations. The program exemplifies
inter-sectoral linkages between education, agriculture, industry, local administration, and health.

This draft case study has been prepared for the South-South Learning Workshop to Accelerate Progress
to End Hunger and Undernutrition organized by
A partnership between:
With support of: