Embed Size (px)
Citation preview

Thailand Initiating Coverage
See important disclosures at the end of this report 1
Powered by the EFA Platform
31 May 2016 Consumer Cyclical | Consumer Services
Carabao Group PCL Buy
Target Price: THB48.00 Price: THB41.00
Long-term Opportunities In The Overseas Business Market Cap: USD1,149m Bloomberg Ticker: CBG TB
We expect Carabao to have a stronger presence, as its recent production expansion and intensive brand awareness campaigns can make it another Thai global player in the energy drink business. Earnings is expected to grow at a CAGR of 14.1% in 2016-2018 ahead of the industry’s 6%. Thus, we initiate coverage on the stock with a BUY and THB48.00 TP (17% upside) based on weighted average valuations of DCF and FY17F P/E.
Share Data Avg Daily Turnover (THB/USD) 38.3m/1.09m 52-wk Price low/high (THB) 32.3 - 44.0 Free Float (%) 25 Shares outstanding (m) 1,000 Estimated Return 17% Shareholders (%) Sathienthum Holdings Limited 25.0 Ms. Nutchamai Thanombooncharoen 24.0 Mr. Yuenyong Opakul 11.6 Share Performance (%) YTD 1m 3m 6m 12m Absolute 18.8 2.5 12.3 13.1 0.0 Relative 9.1 2.4 7.1 9.5 5.9 Source: Bloomberg
Source: Bloomberg
Source: Bloomberg
Bright export outlook. We opine that Carabao’s earnings can be driven by product exports. Key factors include rising health consciousness that may see energy drinks as an attractive alternative to carbonated drinks; numerous opportunities to penetrate potential new markets coupled with continuous growth in Cambodia, Laos, Myanmar and Vietnam (CLMV markets); and a canning line addition for exports in 2H16 that boosts total production capacity by 25%. Based on our total sales expansion forecast of 14.8% CAGR in 2016-2018, export sales may outperform at an average growth rate of 26% pa and see a rise in contribution to 39% in this period (2015: 29%).
Wider distribution network to boost local sales. Carabao’s domestic sales may see a moderate growth rate of 9% CAGR in 2016-2018 on a larger revenue base than exports. We expect the company to continue enjoying a local market share hike. Key drivers are a 2x increase in its cash van network and distribution centres (end-2015: nine centres and 113 vans) to reach customers in remote areas and traditional retail outlets throughout Thailand; and possible synergies with local modern grocery store CJ Express, which is owned by a key shareholder. This may be another distribution channel to improve its domestic revenue.
Stable margins likely. Typically, export products encounter selling price pressures to gain market share in new destinations. Yet, we expect Carabao’s improving business foundations at home to strengthen local sales, enable economies of scale production and stabilise profit margins. Also, it may be able to control opex, as the Chelsea Football Club (Chelsea FC) sponsorship may enrich brand awareness while costs range at 1.6-2.1% of total sales pa vis-à-vis its total budget of 9%. We expect EBIT and net margins to be stable at 19% and 16% respectively, allowing net profit to grow at 14.1% CAGR in 2016-2018.
BUY on a positive business outlook. Carabao’s overseas growth story seems attractive while its business expansion may solidify its local operations. Growth is likely to be still upbeat in the overall energy drinks business, which may expand 6% over the next three years. Our THB48.00 TP is derived from weighted average valuations of DCF and prospective FY17F P/E. The share price is trading at 24x FY17F P/E, still below the regional beverage sector average of 29x despite having earnings growth on par with peers. Key risks are consumption slowdown, uncertain orders from export markets, expansion plan delays, raw materials price volatility, weaker-than-expected opex controls and a possible increase in sugar tax on beverages.
Source: Company data, RHB
Forecasts and Valuations Dec-14 Dec-15 Dec-16F Dec-17F Dec-18FTotal turnover (THBm) 7,448 7,753 9,298 10,775 11,725Reported net profit (THBm) 913 1,256 1,514 1,717 1,863Recurring net profit (THBm) 913 1,256 1,514 1,717 1,863Recurring net profit growth (%) 78.3 37.5 20.6 13.4 8.5Recurring EPS (THB) 1.13 1.26 1.51 1.72 1.86DPS (THB) 0.28 0.95 1.15 1.30 1.41Recurring P/E (x) 36.4 32.7 27.1 23.9 22.0P/B (x) 6.80 6.47 5.87 5.41 5.00P/CF (x) 156 22 20 20 19Dividend Yield (%) 0.7 2.3 2.8 3.2 3.4EV/EBITDA (x) 22.7 24.2 20.0 17.5 15.9Return on average equity (%) 26.2 20.3 22.8 23.6 23.6Net debt to equity (%) net cash net cash net cash net cash net cashOur vs consensus EPS (adjusted) (%) 4.4 2.2 (0.8)
86
97
107
31
36
41
Carabao Group PCL (CBG TB)Price Close Relative to Stock Exchange of Thailand Index (RHS)
12345678
May
-15
Jul-1
5
Oct
-15
Dec
-15
Feb-
16
Apr
-16
Vol m
26
28
30
32
34
36
38
Jan-13 Jan-14 Jan-15 Jan-16 Jan-17
Core rolling P/E (x)
Analyst Vatcharut Vacharawongsith +662 862 9736 [email protected]

Carabao Group PCL Thailand Initiating Coverage
31 May 2016 Consumer Cyclical | Consumer Services
See important disclosures at the end of this report 2
Financial Exhibits
Financial model updated on: 2016-05-30.
Asia Thailand Consumer Cyclical Carabao Group PCL Bloomberg CBG TB Buy Valuation basis DCF and prospective P/E. Key drivers Rising exports and expansion of its fleet of domestic cash vans. its fleet of domestic cash vans. Key risks
i. Slowdown in domestic consumption; ii. High operating expenses from brand marketing
overseas; iii. Uncertainty in purchasing orders in certain
export destinations. Company Profile Carabao Group (Carabao) is a holding company mainly invested in subsidiaries that are involved in the production, distribution, and sales and marketing of Carabao Dang energy drinks and START Plus Zinc sports drinks.
Source: Company data, RHB
Financial summary Dec-14 Dec-15 Dec-16F Dec-17F Dec-18FRecurring EPS (THB) 1.13 1.26 1.51 1.72 1.86EPS (THB) 1.13 1.26 1.51 1.72 1.86DPS (THB) 0.28 0.95 1.15 1.30 1.41BVPS (THB) 6.03 6.33 6.98 7.58 8.20Weighted avg adjusted shares (m) 810 1,000 1,000 1,000 1,000
Valuation metrics Dec-14 Dec-15 Dec-16F Dec-17F Dec-18FRecurring P/E (x) 36.4 32.7 27.1 23.9 22.0P/E (x) 36.4 32.7 27.1 23.9 22.0P/B (x) 6.80 6.47 5.87 5.41 5.00FCF Yield (%) (2.7) 4.3 3.4 4.7 5.1Dividend Yield (%) 0.7 2.3 2.8 3.2 3.4EV/EBITDA (x) 22.7 24.2 20.0 17.5 15.9EV/EBIT (x) 25.9 28.3 23.4 20.1 18.1
Income statement (THBm) Dec-14 Dec-15 Dec-16F Dec-17F Dec-18FTotal turnover 7,448 7,753 9,298 10,775 11,725Gross profit 2,510 2,860 3,412 3,921 4,260EBITDA 1,409 1,616 1,926 2,158 2,321Depreciation and amortisation (174) (236) (281) (284) (288)Operating profit 1,235 1,380 1,645 1,873 2,032Net interest (112) (2) 0 0 0Pre-tax profit 1,250 1,465 1,782 2,020 2,191Taxation (238) (209) (267) (303) (329)Minority interests (99) 0 0 0 0Recurring net profit 913 1,256 1,514 1,717 1,863
Cash flow (THBm) Dec-14 Dec-15 Dec-16F Dec-17F Dec-18FChange in working capital (79) (12) 219 47 60Cash flow from operations 213 1,877 2,014 2,049 2,211Capex (1,123) (115) (603) (103) (102)Cash flow from investing activities (1,114) (108) (603) (103) (102)Proceeds from issue of shares 4,343 0 0 0 0Dividends paid (279) (950) (964) (1,117) (1,243)Cash flow from financing activities 943 (920) (869) (1,117) (1,243)
Balance sheet (THBm) Dec-14 Dec-15 Dec-16F Dec-17F Dec-18FTotal cash and equivalents 1,428 1,851 2,393 3,222 4,088Tangible fixed assets 4,754 4,667 4,993 4,815 4,632Intangible assets 17 16 16 16 16Total investments 143 108 104 100 97Total other assets 29 29 29 29 29Total assets 7,064 7,361 8,295 9,079 9,842Other liabilities 64 77 77 77 77Total liabilities 1,035 1,028 1,317 1,500 1,643Shareholders' equity 6,029 6,333 6,979 7,579 8,199Total equity 6,029 6,333 6,979 7,579 8,199Net debt (1,428) (1,851) (2,393) (3,222) (4,088)Total liabilities & equity 7,064 7,361 8,295 9,079 9,842
Key metrics Dec-14 Dec-15 Dec-16F Dec-17F Dec-18FRevenue growth (%) 8.5 4.1 19.9 15.9 8.8Recurrent EPS growth (%) (2.6) 11.4 20.6 13.4 8.5Gross margin (%) 33.7 36.9 36.7 36.4 36.3Operating EBITDA margin (%) 18.9 20.8 20.7 20.0 19.8Net profit margin (%) 12.3 16.2 16.3 15.9 15.9Dividend payout ratio (%) 30.6 75.7 75.7 75.7 75.7Capex/sales (%) 15.1 1.5 6.5 1.0 0.9Interest cover (x) 11 842

Carabao Group PCL Thailand Initiating Coverage
31 May 2016 Consumer Cyclical | Consumer Services
See important disclosures at the end of this report 3
Investment Merits We initiate coverage on Carabao with a BUY, based on the following:
i. Potential earnings growth. We expect Carabao to record a 14.1% earnings CAGR over 2016-2018, driven by a favourable outlook for its exports to existing destinations – particularly the CLMV markets. There, the company has strengthened its positioning as it penetrated into new overseas markets. It also increased the production capacity for manufacturing canned energy drinks in order to fulfil potential export demand. Carabao also launches new products such as carbonated energy drinks and flavoured energy drinks to serve new demand, while aggressively expanding its fleet of local cash vans and network of distribution centres throughout Thailand to improve domestic sales. We estimate export sales to increase at a 26% CAGR (2016-2018) vs 9% for domestic sales in the same period – this would still outperform the 6% pa expansion of the global energy drink industry.
ii. Stabilised profit margins. Carabao’s activities to grow overseas sales may pressure profit margins growth, due to both the pricing of its products (as overseas selling prices are lower vis-à-vis local prices) and marketing campaigns. However, we think this could be offset by the group’s improving business foundations domestically and, in our view, we expect economies of scale production levels to escalate on the back of this. We also expect Carabao to book stable EBIT and net profit margins of about 19% and 16% for respectively for 2016-2018.
iii. Undemanding valuations. We believe Carabao is a growth stock following its prospective market expansion. Its valuation has remained cheap. The stock is trading at 24x FY17F P/E, lower than its regional beverage peer mean of 29x. Meanwhile, we expect its 13% EPS growth next year to be level with the peer average. Comparing with other beverage stocks from Thailand, Carabao’s outlook is more positive. It has the potential to become a global player in the energy drinks segment. Hence, it deserves to be traded at premium valuation levels.
Earnings may surge 21% YoY in 2016
FY16 may be another good year for Carabao, as we expect its net profit to grow by 21% YoY to THB1.51bn, based on revenue growth of 20% YoY to THB9.30bn. However, we expect its EBITDA margin to nudge up by just 0.2ppt due to additional investments made in new production lines, and its net profit margin to grow only 0.1ppt. Sales growth may be delivered from:
i. An increase in production capacity by 25% to 1.78bn units pa from 1.43bn units in 2H16, mainly from exported canned drinks;
ii. Planned expansion of its distribution network in Thailand to boost retail shop coverage and to directly access the end-customers;
iii. Expected improving shipments to Afghanistan and Yemen, as these markets have started to increase their orders for energy drinks from two years ago (when the countries were affected by internal unrest).
Note that the beginning of its sponsorship of the Chelsea FC in the UK in mid-2016 may keep its sales, general and administrative (SG&A) expense-to-sales ratio unchanged at 19%. Expect net profit to grow 13% YoY in 2017
We expect Carabao to continue posting net profit growth of 13% YoY, and book earnings of THB1.72bn next year following the full-year operation of its new production line for canned energy drinks as well as the aggressive expansion of its distribution centre network and fleet of cash vans in 2016. We estimate total sales to increase 16% YoY to THB10.78bn, while its EBIT and net profit margins are maintained.

Carabao Group PCL Thailand Initiating Coverage
31 May 2016 Consumer Cyclical | Consumer Services
See important disclosures at the end of this report 4
Valuation And Recommendation We initiate coverage on Carabao with a BUY rating, and expect it to post strong net profit growth of 21% YoY in 2016 and 13% YoY in 2017 mainly due to improved sales revenue from its domestic and export markets. We also think its long-term earnings prospects remain attractive based on:
i. Solid growth potential for existing export destinations particularly Cambodia, Myanmar, and Vietnam;
ii. Its penetration into more overseas markets, while could make it a new global energy drink manufacturer:
iii. Launching of further new products to meet consumer demand and add value to its owned distribution facilities.
Valuations are still attractive vis-à-vis its peers. The stock is trading at 24x FY17F P/E vs its regional sector average of 29x despite having EPS growth of 13%, ie on par with the regional peer average – and superior ROE of 23% compared with both local and regional peers. Carabao deserves to trade at a premium to its domestic peers due to its stronger EPS growth and long-term prospects to become a global energy drink company. Our TP of THB48.00 is derived from a applying weighted average valuation of the DCF (WACC: 8.2%, TG: 3%) and P/E (29x based on the regional sector average) valuation methodologies. Our TP implies 29x FY17F P/E, which is slightly below its regional peer average and offers an upside of 17%.
We also expect moderate dividend yields of 2.8-3.4% over FY16F-18F, assuming a payout ratio of 70% based on its payment record of 66% for FY14 and 71% for FY15 performances (vs the company’s policy of net less than 40% of net profit after tax). There is still room to take positions on the stock for the long-term.
Figure 1: Carabao’s DCF valuation
Source: RHB
THBm 2017F 2018F 2019F 2020F 2021F 2022F 2023F 2024F 2025F 2025FEBIT (1-t) 1,717 1,863 2,023 2,176 2,311 2,443 2,515 2,584 2,642 2,704 Depreciation & Amortization 284 288 292 296 300 305 309 313 317 322 Net working capital 47 60 35 25 32 22 5 5 (3) (3) Capex (103) (102) (102) (101) (101) (101) (101) (100) (100) (100) Net free cash flow to firm 1,852 1,989 2,179 2,346 2,479 2,625 2,717 2,792 2,862 2,928
Terminal value 60,930
PV 1,712 1,699 1,720 1,712 1,672 1,636 1,565 1,486 1,408 29,037
Terminal growth 3.0%
WACC 8.2%Total discounted firm value 43,646 Less: Net debt (2,749) Less: Minority interest 0Equity value 46,395 Number of shares (m) 1,000 Equity value per share (THB) 46.40
Carabao Group PCL Thailand Initiating Coverage
31 May 2016 Consumer Cyclical | Consumer Services
See important disclosures at the end of this report 5
Figure 2: Peer comparison
Note: Price data as of 27 May 2016. Valuations in red and with asterisk are from RHB. Consensus valuations are in black. Source: Bloomberg, RHB
Figure 3: Weighted average valuation
Source: RHB
Figure 4: Carabao’s P/E band
Source: RHB
Name Ticker Mkt. Cap.(USDm) 2016F 2017F 2016F 2017F 2016F 2017F 2016F 2017F 2016F 2017F 2016F 2017F
Regional peerSUNTORY BEVERAGE & FOOD LTD 2587 JP 14,588 2.8 18.7 36.6 30.8 2.7 2.6 10.9 10.5 1.4 1.5 7.5 8.2KAGOME CO LTD 2811 JP 2,413 23.4 0.0 52.9 52.9 2.2 2.1 20.8 20.1 0.9 0.9 3.7 3.7LOTTE CHILSUNG BEVERAGE CO 005300 KS 2,027 -17.6 11.1 26.8 24.1 1.1 1.1 8.5 7.7 0.4 0.4 4.0 4.3UNI-PRESIDENT CHINA HOLDINGS 220 HK 3,743 17.9 10.6 24.1 21.8 2.0 1.8 9.5 8.8 1.0 1.1 8.6 8.9VITASOY INTL HOLDINGS LTD 345 HK 2,055 29.7 15.2 31.7 27.5 7.2 6.4 17.3 15.1 2.1 2.5 24.5 25.5HEBEI CHENGDE LOLO CO-A 000848 CH 1,440 13.1 2.2 17.8 17.4 4.9 4.3 11.4 10.6 3.2 3.7 25.5 23.7FRASER & NEAVE HOLDINGS BHD FNH MK 2,135 42.1 8.8 20.5 18.8 4.2 3.9 14.3 13.4 3.1 3.2 21.4 21.3CARABAO GROUP CBG TB 1,149 20.6 13.4 27.1 23.9 5.9 5.4 19.9 17.8 2.6 2.9 21.7 22.7Average 7.3 13.1 32.9 29.0 3.8 3.5 14.1 13.0 1.8 2.0 14.6 14.8Domestic peerICHITAN GROUP ICHI TB 419 -3.7 6.6 17.2 16.1 2.4 2.3 11.1 10.6 4.0 4.2 13.7 13.8MALEE SAMPRAN MALEE TB 178 20.7 17.6 14.7 13.0 4.6 4.0 11.6 10.4 3.2 3.8 30.4 30.8SAPPE SAPPE TB 121 3.0 19.7 12.6 10.3 2.2 2.0 7.7 7.4 4.0 4.5 18.4 17.9CARABAO GROUP CBG TB 1,149 20.6 13.4 27.1 23.9 5.9 5.4 19.9 17.8 2.6 2.9 21.7 22.7Average 10.2 12.7 21.3 18.9 3.8 3.4 12.6 11.5 3.4 3.9 21.0 21.3
EPS growth (%) Net P/E (x) P/BV (x) EV/EBITDA (x) Dividend yield (%) ROE (%)
Valuation Criteria TP Weight Weighted (THB) TP (THB)
DCF 8.2% WACC, 3% long-term growth 46.40 50% 23.20P/E 29x FY17F prospective P/E, equivalent to regional 49.60 50% 24.80
beverage peer's current average tradingTotal 48.00
0
10
20
30
40
50
60
70
Dec-13 Dec-14 Dec-15 Dec-16 Dec-17
Price (THB) P/E(x)
25
29
33
37
41
F F

Carabao Group PCL Thailand Initiating Coverage
31 May 2016 Consumer Cyclical | Consumer Services
See important disclosures at the end of this report 6
Business Overview Carabao’s story began on 22 Aug 2001 when a joint-venture company, Carabao Tawandang Ltd, was established by the owner of the German Tawandang Brewery Restaurant and Mr Yuenyong Opakul (popularly known as Aed Carabao, founder and lead singer of the popular Thai rock band Carabao). Its major business includes manufacturing and distributing energy drinks under the Carabao Dang brand, with an initial registered capital of THB1m. Its product was launched in Oct 2002 and hit the export market in 2004.
Due to its continual and consistent growth, the group’s major shareholders set up Carabao Group Co Ltd on 28 Aug 2013. This was to meet strategic expansion goals for an integrated business model that included material sourcing, production, marketing and distribution. Carabao became a public company on 8 Jul 2014 and was listed on the SET on 21 Nov 2014.
Carabao consists of three wholly-owned subsidiaries:
i. Carabao Tawandang Co Ltd, its beverage manufacturing and marketing arm;
ii. Tawandang DCM Co Ltd, which operates product distribution activities via traditional and modern trades;
iii. Asia Pacific Glass Co Ltd, which produces glass bottles for energy drinks and other beverages.
The group’s current product includes Carabao Dang – a bottled non-carbonated, canned non-carbonated, and sleek canned carbonated energy drink – and the Start Plus electrolyte beverage. It also recently launched Carabao Drinking Water, which is produced by an outsourced manufacturer, and became a local distributor of a seaweed snack under the Koriko brand. 71% of total sales in 2015 were generated domestically. Of this figure, approximately three-fourths were from the traditional trade channel. The rest came from the modern trade channel. Carabao’s recent strategy of using a cash van distribution network contributed only 3% of domestic sales last year. Its energy drink products are currently exported to more than 30 nations, with the biggest markets being Afghanistan, Cambodia, Myanmar, Vietnam and Yemen. Overseas sales now represent 29% of revenue generated.
At end-2015, Carabao’s total production capacity was 1.08m units pa for bottled energy drinks and 350m units pa for canned energy drinks. Total utilisation rate stood at 70% and 80.6% respectively. The group is also planning to double its production capacity for the canned energy drink segment to serve an expansion of its carbonated products business. This is expected to be completed in 2H16.
Figure 5: Carabao’s group structure Figure 6: Carabao’s products
Source: Company, RHB Source: Company
Carabao Group PCL.
Carabao Tawandang Co.,Ltd.(100%)
Tawandang DCM Co., Ltd.(100%)
Asia Pacific Glass Co.,Ltd.(100%)

Carabao Group PCL Thailand Initiating Coverage
31 May 2016 Consumer Cyclical | Consumer Services
See important disclosures at the end of this report 7
Figure 7: Revenue breakdown (by product) Figure 8: Revenue breakdown (by destination)
Source: Company data, RHB Source: Company data, RHB
Industry Overview Based on data from Statista and Research And Markets, and our own extrapolation, we expect the c.USD44bn energy drinks market to contribute a minimal 2% share of the 2015 global beverage sales, which was valued at USD1,980bn. However, the segment’s outlook seems stronger than that of the beverage industry as a whole. This is given its sales growth CAGR of 5% in 2013-2015, which is estimated to increase by 5.6% pa in 2016-2018. By comparison, global beverage sales grew at a slower pace of 3.7% pa in 2013-2015 and may continue expanding by 4.3% per year in 2016-2018.
Based on increasing health concerns, energy drinks could also be an alternative to carbonated drinks. This is because health-benefiting ingredients contained in energy drinks could attract consumers and help such products to gain more popularity amongst most age groups.
Key markets for energy drinks are:
i. North America (c.30% contribution);
ii. Asia-Pacific (c.20% contribution);
iii. Western Europe (c.15% contribution).
In terms of 2015 market share, the segment has been dominated by few brands, namely:
i. Red Bull (28%);
ii. Monster (11%);
iii. Rock Star (2%).
Carabao has less than 0.5% market share. This is less than another non-listed Thai brand M-150 (0.7%).
Having only five major export destinations, ie Afghanistan, Cambodia, Myanmar, Vietnam and Yemen, we believe there are many potential markets for the group to penetrate into over the longer term. This is apart from China and the UK, where Carabao is undertaking marketing initiatives currently.
100% 100% 100% 99% 96% 94% 94% 94%
1% 4% 4% 4%1% 3% 1% 1% 1%
2011 2012 2013 2014 2015 2016F 2017F 2018F
Drinking water Start PlusSleek can carbonated energy drink Carabao Dang energy drink
76% 76% 77% 72% 71%
5% 8% 9%14% 20%
14.7% 9.5% 7.2% 7.1% 2.1%0.5% 1.9% 1.8% 3.3% 2.9%
0%
10%
20%
30%
40%
50%
60%
70%
80%
90%
100%
2011 2012 2013 2014 2015
OthersVietnamYemenMyanmarAfghanistanCambodiaThailand

Carabao Group PCL Thailand Initiating Coverage
31 May 2016 Consumer Cyclical | Consumer Services
See important disclosures at the end of this report 8
Figure 9: Global beverage sales Figure 10: Global energy drinks sales
Source: Statista, RHB Source: Research And Markets, RHB
The 2015 energy drink market in Thailand was valued at THB35bn (c.USD1bn), with a mild expansion rate of 3-5% pa. Carabao Dang was ranked the second-largest brand after M-150 while Red Bull came in third in its own country. Being in a growth stage, we opine that Carabao has become successful in penetrating the domestic market via the:
i. Popularity of major shareholder Aed Carabao who is an idol of “song for life” music genre among Thailand’s middle- to primary-income earners;
ii. Growth of its owned distribution network that allows it to have direct access to end-consumers upcountry.
Rival brands M-150 and Red Bull, meanwhile, utilise standard strategies, such as lucky draw promotions and music marketing campaigns, to raise brand recognition and keep their domestic revenue from this cash cow business growing. This is as the level of competition gets stronger as a result of new entrants into the local market. As a result of these factors, Carabao has enjoyed a rise in market share over the past five years. By comparison, the market share of two others players gradually shrank over the same period.
Figure 11: Worldwide energy drinks market share Figure 12: Thailand energy drinks market share
Source: Euromonitor, RHB Source: Nielsen, Company data
1,500
1,700
1,900
2,100
2,300
2012 2013 2014 2015 2016F 2017F 2018F
(USDbn)
30
35
40
45
50
55
2012 2013 2014 2015 2016F 2017F 2018F
(USDbn)
Red Bull 28%
Monster 11%
Rockstar 2%Lucozade 2%NOS 1%
Burn 1%M-150 1%
Others 54%
48.7% 47.7% 46.9% 46.8% 44.4%
15.9% 17.5% 21.1% 21.5% 21.7%
11.8% 11.8% 11.2% 11.8% 10.3%
8.1% 8.3% 7.9% 7.9% 8.2%
15.5% 14.7% 12.9% 12.0% 15.4%
2011 2012 2013 2014 2015
M-150 Carabao Dang Red Bull Lipovitan-D Others

Carabao Group PCL Thailand Initiating Coverage
31 May 2016 Consumer Cyclical | Consumer Services
See important disclosures at the end of this report 9
Investment Highlights Production capacity to improve 25% by 3Q16 Carabao’s existing production facilities have a total annual capacity of 1.04bn units. Of this figure, three-fourths is for bottled energy drinks while the remainder is for canned products. Production utilisation rate for the bottling line was stable at 70% at end-2015 compared to the previous year’s, while the utilisation rate for the canning line surged rapidly to 81% at end-2015 from 52% two years ago, thanks to accelerated export sales over the period. The company plans to install new machines for canned energy drinks by end-3Q16, which may raise its total annual production capacity by 25% to 1.78bn units. The higher capacity would meet rising demand and launches of new canning products in the pipeline starting with carbonated and flavoured energy drinks to serve overseas markets. With an extensive local distribution network and market penetration overseas, we assume a rise in capacity utilisation rates in both its bottling and canning lines as shown in Figure 13.
Figure 13: Carabao’s production capacity and utilisation rate Figure 14: Distribution centre and cash van expansion plan
Source: Company data, RHB Source: Company
Aggressive expansion on cash vans and distribution centres this year In order to gain more market share, Carabao works to boost domestic sales by having direct access to end-consumers in Thailand provinces. It has set up its owned distribution network via the establishment of a subsidiary, Tawandang DCM. Besides approaching traditional wholesalers and modern trade retailers, it has its own in-house on-the-ground marketing event team known as the “Carabao Dang Ladies”, who sell and deliver the company’s products to individuals at their homes. To enhance its sales coverage in remote areas, Carabao last year launched its cash-van caravan and built distribution centres (DCs) across the country. It owned 113 cash vans in nine DCs at end-2015 and aggressively plans to raise the number of DCs to 27 with c.300 cash vans covering 300,000 retail outlets throughout Thailand by 3Q16. Such an expansive fleet may add value to Carabao by supporting distribution of its new products (eg private label drinking water) and may possibly allow it to distribute consumable products for other suppliers (such as food snacks). We expect the opening of new DCs and its cash van fleet expansion to materialise in 1H16, which could be another key catalyst to boost Carabao’s domestic turnover in the near term.
Encouraging signs in existing export markets Apart from its strong market positioning in Cambodia, we expect to see improving purchase orders from other existing key export destinations including Myanmar, Afghanistan and Yemen. Carabao’s Myanmar business accounted for 9.8% of total export sales and only 2.7% of total sales in 2015. To achieve more growth, the company recently assigned another new distributor to expand its coverage areas throughout the country and to penetrate both traditional and modern trade channels. It may also hold more marketing campaigns, including a sponsorship deal with Chelsea FC to promote the brand. We expect its Myanmar sales to expand by a strong 35% CAGR over 2016-2018 (vs the company’s guidance of 50% this year), potentially increasing its contribution to 12% of total exports and 5% of total sales by FY18F.
730 730
850
1,080 1,080 1,080 1,080 1,080
205 205
350 350 350
700 700 700
67%
81%
89%
69%70% 75%
79%
83%
57%
68%
52%
72%
81%
55%
71%
77%
50%
55%
60%
65%
70%
75%
80%
85%
90%
95%
0
200
400
600
800
1,000
1,200
2011 2012 2013 2014 2015 2016F 2017F 2018F
Bottling line (m units per annum) Canning line (m units per annum)Bottling utilization rate - RHS Canning utilization rate - RHS

Carabao Group PCL Thailand Initiating Coverage
31 May 2016 Consumer Cyclical | Consumer Services
See important disclosures at the end of this report 10
Meanwhile, the company’s sales from Afghanistan and Yemen were sluggish in 2013-2014 (Figure 8) due to the countries’ internal unrest and sporadic/infrequent ordering patterns compared to other key destinations. Nonetheless, management is positive on attaining better sales in these two countries this year.
Chelsea FC sponsorship to create brand recognition in global platform Carabao stepped up its marketing activities by becoming the principal partner of English Premier League’s Chelsea FC starting May this year, for a period of three years from 2016/2017 to 2018/2019 seasons. Carabao would spend GBP11m (c.THB560m) in total sponsorship fees or GBP3.67m (c.THB190m) pa over the 3-year period. It will also begin its mass product selling in the UK in 2Q16, which could help create brand awareness worldwide and facilitate its product shipments to new market destinations in the longer term. We expect its promotional budget to remain under control despite incurring additional costs from the sponsorship.
Figure 15: Carabao’s partner sponsorship for Chelsea FC over 2016/2017-2018/2019 seasons
Source: Company
Potential synergies with CJ Express Supermarket The group of Carabao’s management individually became major shareholders of CJ Express, a local modern trade retail grocery with a strong network of 230 stores in the community areas in Thailand’s central, western and eastern provinces, and a plan to open more new stores in the future. Unlike convenience stores, CJ Express offers a wide range of consumer necessities and promotional campaigns to attract customers. During our channel check at a CJ Express outlet in the western Bangkok suburb, we found that Carabao’s key products (ie energy drinks and drinking water) were prominently displayed at the front of the store and priced lower than other brands. However, patronage visit here may not be as frequent as in convenience stores. We still expect CJ Express to be another effective distribution channel for Carabao’s products at competitive prices and help sustain its domestic sales revenue in the longer term.
Figure 16: CJ Express store Figure 17: CJ Express: a mini supermarket format
Source: RHB Source: RHB

Carabao Group PCL Thailand Initiating Coverage
31 May 2016 Consumer Cyclical | Consumer Services
See important disclosures at the end of this report 11
Figure 18: Carabao products were promoted at CJ Express with lower prices than other competitive brands
Figure 19: Company management, Aed Carabao, promotes his drinking water – a new locally-distributed product
Source: RHB
Source: RHB
Financial Analysis Carabao’s total revenue moderately grew 9% in 2014 and 5% in 2015 due to weak consumption, which led to sluggish domestic sales and shrinking exports to key destinations of Afghanistan and Yemen. However, we forecast the company’s revenue to grow 20% in 2016 and 16% in 2017, supported by the following:
i. We expect production capacity of canned energy drinks to double this year, allowing the company to meet a possible rise in demand from overseas market penetration;
ii. An increase in the number of distribution centres and cash van fleets to boost domestic sales.
We expect the mix between local and export sales contribution to improve to 61:39 by 2018 from 71:29 in 2015.
Figure 20: Carabao’s total sales revenue (THBm) Figure 21: Profit margin trend
Source: Company data, RHB Source: Company data, RHB
76% 76%77% 72% 71% 66% 62% 61%24%
24%
23% 28% 29%
34%38%
39%
2011 2012 2013 2014 2015 2016F 2017F 2018F
Domestic Exports
4,2764,963
6,8637,448 7,753
9,298
10,77511,725
32.429.4 30.2
33.736.9 36.7 36.4 36.3
7.15.4
13.4
18.3 18.9 19.2 18.7 18.7
4.8 2.8
7.5
12.3
16.2 16.3 15.9 15.9
0%
5%
10%
15%
20%
25%
30%
35%
40%
2011 2012 2013 2014 2015 2016F 2017F 2018F
Gross profit margin SG&A/sales ratio EBIT margin Net profit margin
Carabao Group PCL Thailand Initiating Coverage
31 May 2016 Consumer Cyclical | Consumer Services
See important disclosures at the end of this report 12
Carabao’s export sales generate c.6-7ppts lower GPM compared to domestic sales as it has limited bargaining power on selling prices due to intense competition and its efforts to gain market share in overseas markets. For local sales, GPM may gradually increase driven by its larger distribution network and owned glass bottle material production that may lead to cost savings given operational economies of scale. However, we estimate that the rise in export sales contribution may soften the company’s overall GPM to 36.3% in the next three years from 36.9% in 2015.
Carabao’s sponsorship deal with Chelsea FC for 2016-2019 may be positive to its brand awareness. While operating expense remain high, we expect it to be manageable at 1.6-2.1% of total sales pa in 2016-2018 from the company’s total budget of 9%. We keep sales, general and administrative (SG&A) expense-to-sales ratio unchanged at 19% throughout FY16F-18F, which should help keep EBIT margin and net margin stable at 19% and 16% respectively over the 3-year period.
We expect earnings to grow 21% to THB1.51bn this year, 13% to THB1.72bn in 2017, and 8% to THB1.86bn in 2018 on the back of growing exports, launch of new products, and increased coverage of its owned domestic distribution network.
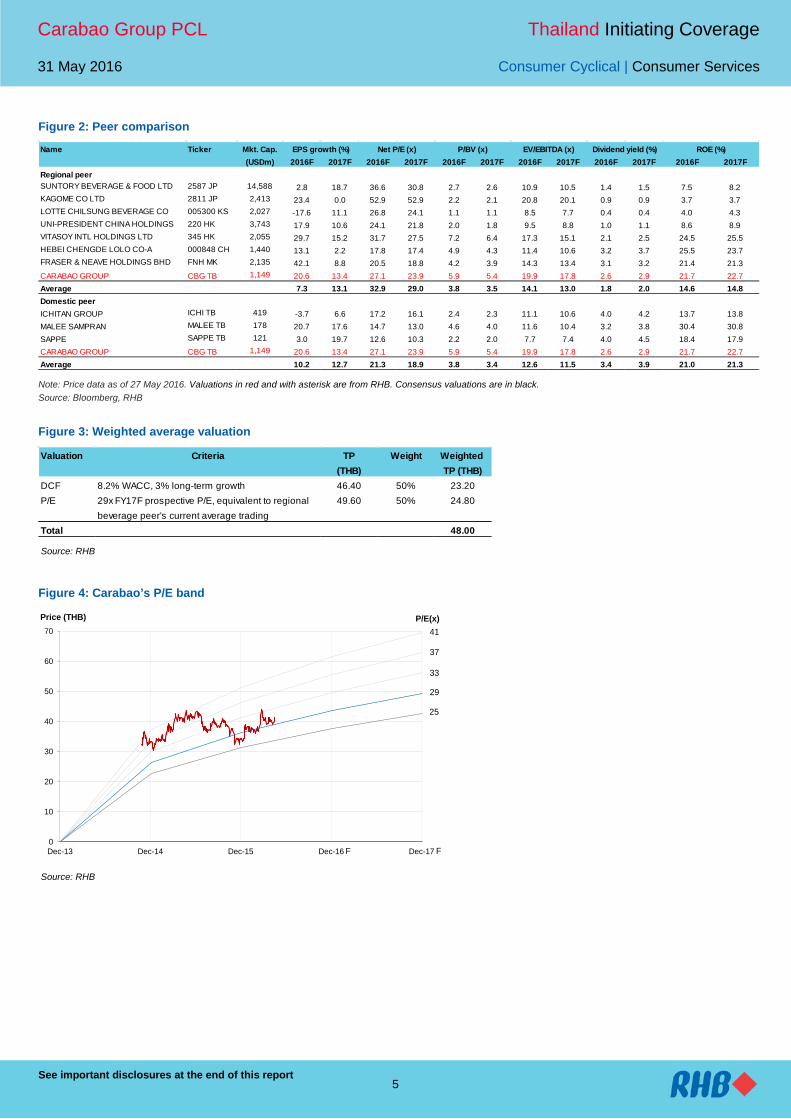
Figure 22: Healthy balance sheet with net cash position Figure 23: Strong cash flow to support future investments
Source: Company data, RHB Source: Company data, RHB
Carabao had no interest-bearing debt and is in a net cash position of THB1.38bn in 2015. We expect its healthy balance sheet position to continue to 2018, leaving ample room to finance major investments in the longer term. Its strong operating cash flow of THB1.9bn-2.2bn pa may be sufficient to support its low investment of THB600m this year and projected maintenance capex of THB100m pa in 2017-2018.
1.52
5.32
3.63
0.17 0.16 0.19 0.20 0.20
0.0
1.0
2.0
3.0
4.0
5.0
6.0
-4,000
-3,000
-2,000
-1,000
0
1,000
2,000
3,000
2011 2012 2013 2014 2015 2016F 2017F 2018F
Net debt D/E ratio - RHS(THBm) (x)
0
500
1,000
1,500
2,000
2,500
3,000
2012 2013 2014 2015 2016F 2017F 2018F
Operating cash flow CAPEX(THBm)

Carabao Group PCL Thailand Initiating Coverage
31 May 2016 Consumer Cyclical | Consumer Services
See important disclosures at the end of this report 13
Risks Volatility in raw materials Approximately 55% of Carabao’s production cost comes from raw materials, which comprise mainly packaging (glass bottle and aluminum can) (c.30%) and sugar (c.10%). The volatility in flint cullet, aluminium and sugar prices may affect the company’s profitability as manufacturers are normally price takers in the energy drink industry.
The annual production capacity of 650m units by Asia Pacific Glass, which is Carabao’s wholly-owned subsidiary, will be reserved or used for production of glass bottles of Carabao Dang energy drink only
Asia Pacific Glass (Carabao’s wholly-owned subsidiary) has annual production capacity of 650m units of amber glass bottles, which are entirely reserved for Carabao Dang energy drink only. This allows the company to potentially enjoy cost savings of 10% compared to a production outsourcing scheme. However, in the unforeseen event of insufficient glass bottles, Carabao may have to source for more packaging from external suppliers, which could undermine its GPM.
Figure 24: Estimated cost breakdown
Source: Company data, RHB
Highly dependent on one single product Carabao Dang energy drink accounted as high as 99% and 96% of total sales in 2014 and 2015 respectively. Changes in consumer preference, consumption trend and government regulations related to production, marketing and distribution activities may significantly impact the company’s sales and/or costs. The company is working to limit such impact in the long run by launching drinking water and carbonated energy drinks with a selection of flavours as part of its diversification strategy.
Successful of overseas distributors There is a risk or uncertainty on the longer-term business relationships between the company and its designated distributors of Carabao Dang in foreign countries. Changes of distributors abroad may severely affect total sales and possible business opportunities during the transition period.
Possible increase in sugar tax on beverages Thailand’s National Reform Steering Assembly’s recent proposal of a new tax rate for beverages with high sugar content reignited concerns among manufacturers as the retail price for beverages may increase by 20-25%. Drinks that have high sugar content include soft drinks, coffee, green tea, energy drinks, fermented milk, soymilk and juices. The measure, if implemented, could adversely affect sales as companies may pass on the cost hike to end-consumers. However, details of the matter remain unclear at this juncture and it may take a long period of time for legal endorsement, in our view.
Packaging30%
Sugar10%
Overheads7%
Taxes40%
Others13%

Carabao Group PCL Thailand Initiating Coverage
31 May 2016 Consumer Cyclical | Consumer Services
See important disclosures at the end of this report 14
SWOT Analysis
• Strong management expertise with active business expansion plans both in local and overseas markets
• Having owned packaging facility and distribution network
• Robust balance sheet ready for investments
• Slow expansion of local energy drink market with mild annualised growth of 3-5%
• Intense competition limits ability to raise selling prices
• Substitution from alternative beverages eg coffee, tea and functional drinks
• Government’s regulatory controls
• Vast room for market penetration abroad
• New product development to meet demand from rising health consciousness
• Highly dependent on the legendary Carabao band as a local marketing gimmick
• Difficulty in penetrating the upper market segment as its brand image is associated with mid- to low-income group
• Product diversification still minimal
Recommendation Chart
Source: RHB, Bloomberg
29
31
33
35
37
39
41
43
45
Nov-14 Apr-15 Sep-15 Feb-16
Price Close
Carabao Group PCL Thailand Initiating Coverage
Consumer Cyclical | Consumer Services
15
RHB Guide to Investment Ratings Buy: Share price may exceed 10% over the next 12 months Trading Buy: Share price may exceed 15% over the next 3 months, however longer-term outlook remains uncertain Neutral: Share price may fall within the range of +/- 10% over the next 12 months Take Profit: Target price has been attained. Look to accumulate at lower levels Sell: Share price may fall by more than 10% over the next 12 months Not Rated: Stock is not within regular research coverage Investment Research Disclaimers RHB has issued this report for information purposes only. This report is intended for circulation amongst RHB and its affiliates’ clients generally or such persons as may be deemed eligible by RHB to receive this report and does not have regard to the specific investment objectives, financial situation and the particular needs of any specific person who may receive this report. This report is not intended, and should not under any circumstances be construed as, an offer or a solicitation of an offer to buy or sell the securities referred to herein or any related financial instruments. This report may further consist of, whether in whole or in part, summaries, research, compilations, extracts or analysis that has been prepared by RHB’s strategic, joint venture and/or business partners. No representation or warranty (express or implied) is given as to the accuracy or completeness of such information and accordingly investors should make their own informed decisions before relying on the same. This report is not directed to, or intended for distribution to or use by, any person or entity who is a citizen or resident of or located in any locality, state, country or other jurisdiction where such distribution, publication, availability or use would be contrary to the applicable laws or regulations. By accepting this report, the recipient hereof (i) represents and warrants that it is lawfully able to receive this document under the laws and regulations of the jurisdiction in which it is located or other applicable laws and (ii) acknowledges and agrees to be bound by the limitations contained herein. Any failure to comply with these limitations may constitute a violation of applicable laws. All the information contained herein is based upon publicly available information and has been obtained from sources that RHB believes to be reliable and correct at the time of issue of this report. However, such sources have not been independently verified by RHB and/or its affiliates and this report does not purport to contain all information that a prospective investor may require. The opinions expressed herein are RHB’s present opinions only and are subject to change without prior notice. RHB is not under any obligation to update or keep current the information and opinions expressed herein or to provide the recipient with access to any additional information. Consequently, RHB does not guarantee, represent or warrant, expressly or impliedly, as to the adequacy, accuracy, reliability, fairness or completeness of the information and opinion contained in this report. Neither RHB (including its officers, directors, associates, connected parties, and/or employees) nor does any of its agents accept any liability for any direct, indirect or consequential losses, loss of profits and/or damages that may arise from the use or reliance of this research report and/or further communications given in relation to this report. Any such responsibility or liability is hereby expressly disclaimed. Whilst every effort is made to ensure that statement of facts made in this report are accurate, all estimates, projections, forecasts, expressions of opinion and other subjective judgments contained in this report are based on assumptions considered to be reasonable and must not be construed as a representation that the matters referred to therein will occur. Different assumptions by RHB or any other source may yield substantially different results and recommendations contained on one type of research product may differ from recommendations contained in other types of research. The performance of currencies may affect the value of, or income from, the securities or any other financial instruments referenced in this report. Holders of depositary receipts backed by the securities discussed in this report assume currency risk. Past performance is not a guide to future performance. Income from investments may fluctuate. The price or value of the investments to which this report relates, either directly or indirectly, may fall or rise against the interest of investors. This report does not purport to be comprehensive or to contain all the information that a prospective investor may need in order to make an investment decision. The recipient of this report is making its own independent assessment and decisions regarding any securities or financial instruments referenced herein. Any investment discussed or recommended in this report may be unsuitable for an investor depending on the investor’s specific investment objectives and financial position. The material in this report is general information intended for recipients who understand the risks of investing in financial instruments. This report does not take into account whether an investment or course of action and any associated risks are suitable for the recipient. Any recommendations contained in this report must therefore not be relied upon as investment advice based on the recipient's personal circumstances. Investors should make their own independent evaluation of the information contained herein, consider their own investment objective, financial situation and particular needs and seek their own financial, business, legal, tax and other advice regarding the appropriateness of investing in any securities or the investment strategies discussed or recommended in this report. This report may contain forward-looking statements which are often but not always identified by the use of words such as “believe”, “estimate”, “intend” and “expect” and statements that an event or result “may”, “will” or “might” occur or be achieved and other similar expressions. Such forward-looking statements are based on assumptions made and information currently available to RHB and are subject to known and unknown risks, uncertainties and other factors which may cause the actual results, performance or achievement to be materially different from any future results, performance or achievement, expressed or implied by such forward-looking statements. Caution should be taken with respect to such statements and recipients of this
Carabao Group PCL Thailand Initiating Coverage
Consumer Cyclical | Consumer Services
16
report should not place undue reliance on any such forward-looking statements. RHB expressly disclaims any obligation to update or revise any forward-looking statements, whether as a result of new information, future events or circumstances after the date of this publication or to reflect the occurrence of unanticipated events. The use of any website to access this report electronically is done at the recipient’s own risk, and it is the recipient’s sole responsibility to take precautions to ensure that it is free from viruses or other items of a destructive nature. This report may also provide the addresses of, or contain hyperlinks to, websites. RHB takes no responsibility for the content contained therein. Such addresses or hyperlinks (including addresses or hyperlinks to RHB own website material) are provided solely for the recipient’s convenience. The information and the content of the linked site do not in any way form part of this report. Accessing such website or following such link through the report or RHB website shall be at the recipient’s own risk. This report may contain information obtained from third parties. Third party content providers do not guarantee the accuracy, completeness, timeliness or availability of any information and are not responsible for any errors or omissions (negligent or otherwise), regardless of the cause, or for the results obtained from the use of such content. Third party content providers give no express or implied warranties, including, but not limited to, any warranties of merchantability or fitness for a particular purpose or use. Third party content providers shall not be liable for any direct, indirect, incidental, exemplary, compensatory, punitive, special or consequential damages, costs, expenses, legal fees, or losses (including lost income or profits and opportunity costs) in connection with any use of their content. The research analysts responsible for the production of this report hereby certifies that the views expressed herein accurately and exclusively reflect his or her personal views and opinions about any and all of the issuers or securities analysed in this report and were prepared independently and autonomously. The research analysts that authored this report are precluded by RHB in all circumstances from trading in the securities or other financial instruments referenced in the report, or from having an interest in the company(ies) that they cover. RHB and/or its affiliates and/or their directors, officers, associates, connected parties and/or employees, may have, or have had, interests in the securities or qualified holdings, in subject company(ies) mentioned in this report or any securities related thereto and may from time to time add to or dispose of, or may be materially interested in, any such securities. Further, RHB and/or its affiliates may have, or have had, business relationships with the subject company(ies) mentioned in this report and may from time to time seek to provide investment banking or other services to the subject company(ies) referred to in this research report. As a result, investors should be aware that a conflict of interest may exist. The contents of this report is strictly confidential and may not be copied, reproduced, published, distributed, transmitted or passed, in whole or in part, to any other person without the prior express written consent of RHB and/or its affiliates. This report has been delivered to RHB and its affiliates’ clients for information purposes only and upon the express understanding that such parties will use it only for the purposes set forth above. By electing to view or accepting a copy of this report, the recipients have agreed that they will not print, copy, videotape, record, hyperlink, download, or otherwise attempt to reproduce or re-transmit (in any form including hard copy or electronic distribution format) the contents of this report. RHB and/or its affiliates accepts no liability whatsoever for the actions of third parties in this respect. The contents of this report are subject to copyright. Please refer to Restrictions on Distribution below for information regarding the distributors of this report. Recipients must not reproduce or disseminate any content or findings of this report without the express permission of RHB and the distributors. The securities mentioned in this publication may not be eligible for sale in some states or countries or certain categories of investors. The recipient of this report should have regard to the laws of the recipient’s place of domicile when contemplating transactions in the securities or other financial instruments referred to herein. The securities discussed in this report may not have been registered in such jurisdiction. Without prejudice to the foregoing, the recipient is to note that additional disclaimers, warnings or qualifications may apply based on geographical location of the person or entity receiving this report. RESTRICTIONS ON DISTRIBUTION Malaysia This report is issued and distributed in Malaysia by RHB Research Institute Sdn Bhd. The views and opinions in this report are our own as of the date hereof and is subject to change. If the Financial Services and Markets Act of the United Kingdom or the rules of the Financial Conduct Authority apply to a recipient, our obligations owed to such recipient therein are unaffected. RHB Research Institute Sdn Bhd has no obligation to update its opinion or the information in this report. Thailand This report is issued and distributed in the Kingdom of Thailand by RHB Securities (Thailand) PCL, a licensed securities company that is authorised by the Ministry of Finance, regulated by the Securities and Exchange Commission of Thailand and is a member of the Stock Exchange of Thailand. The Thai Institute of Directors Association has disclosed the Corporate Governance Report of Thai Listed Companies made pursuant to the policy of the Securities and Exchange Commission of Thailand. RHB Securities (Thailand) PCL does not endorse, confirm nor certify the result of the Corporate Governance Report of Thai Listed Companies.

Carabao Group PCL Thailand Initiating Coverage
Consumer Cyclical | Consumer Services
17
Indonesia This report is issued and distributed in Indonesia by PT RHB Securities Indonesia. This research does not constitute an offering document and it should not be construed as an offer of securities in Indonesia. Any securities offered or sold, directly or indirectly, in Indonesia or to any Indonesian citizen or corporation (wherever located) or to any Indonesian resident in a manner which constitutes a public offering under Indonesian laws and regulations must comply with the prevailing Indonesian laws and regulations. Singapore This report is issued and distributed in Singapore by RHB Research Institute Singapore Pte Ltd and it may only be distributed in Singapore to accredited investors, expert investors and institutional investors as defined in the Financial Advisers Regulations and the Securities and Futures Act (Chapter 289), as amended from time to time. By virtue of distribution to these categories of investors, RHB Research Institute Singapore Pte Ltd and its representatives are not required to comply with Section 36 of the Financial Advisers Act (Chapter 110) (Section 36 relates to disclosure of RHB Research Institute Singapore Pte Ltd ’s interest and/or its representative's interest in securities). Recipients of this report in Singapore may contact RHB Research Institute Singapore Pte Ltd in respect of any matter arising from or in connection with the report. Hong Kong This report is issued and distributed in Hong Kong by RHB Securities Hong Kong Limited (興業金融證券有限公司) (CE No.: ADU220) (“RHBSHK”) which is licensed in Hong Kong by the Securities and Futures Commission for Type 1 (dealing in securities) and Type 4 (advising on securities) regulated activities. Any investors wishing to purchase or otherwise deal in the securities covered in this report should contact RHB Securities Hong Kong Limited. United States This report was prepared by RHB and is being distributed solely and directly to “major” U.S. institutional investors as defined under, and pursuant to, the requirements of Rule 15a-6 under the U.S. Securities and Exchange Act of 1934, as amended (the “Exchange Act”). RHB is not registered as a broker-dealer in the United States and does not offer brokerage services to U.S. persons. Any order for the purchase or sale of the securities discussed herein that are listed on Bursa Malaysia Securities Berhad must be placed with and through Auerbach Grayson (“AG”). Any order for the purchase or sale of all other securities discussed herein must be placed with and through such other registered U.S. broker-dealer as appointed by RHB from time to time as required by the Exchange Act Rule 15a-6. This report is confidential and not intended for distribution to, or use by, persons other than the recipient and its employees, agents and advisors, as applicable. Additionally, where research is distributed via Electronic Service Provider, the analysts whose names appear in this report are not registered or qualified as research analysts in the United States and are not associated persons of Auerbach Grayson AG or such other registered U.S. broker-dealer as appointed by RHB from time to time and therefore may not be subject to any applicable restrictions under Financial Industry Regulatory Authority (“FINRA”) rules on communications with a subject company, public appearances and personal trading. Investing in any non-U.S. securities or related financial instruments discussed in this research report may present certain risks. The securities of non-U.S. issuers may not be registered with, or be subject to the regulations of, the U.S. Securities and Exchange Commission. Information on non-U.S. securities or related financial instruments may be limited. Foreign companies may not be subject to audit and reporting standards and regulatory requirements comparable to those in the United States. The financial instruments discussed in this report may not be suitable for all investors. Transactions in foreign markets may be subject to regulations that differ from or offer less protection than those in the United States. OWNERSHIP AND MATERIAL CONFLICTS OF INTEREST Malaysia RHB does not have qualified shareholding (1% or more) in the subject company (ies) covered in this report except for: a) - RHB and/or its subsidiaries are not liquidity providers or market makers for the subject company (ies) covered in this report except for: a) - RHB and/or its subsidiaries have not participated as a syndicate member in share offerings and/or bond issues in securities covered in this report in the last 12 months except for: a) - RHB has not provided investment banking services to the company/companies covered in this report in the last 12 months except for: a) -

Carabao Group PCL Thailand Initiating Coverage
Consumer Cyclical | Consumer Services
18
Thailand RHB Securities (Thailand) PCL and/or its directors, officers, associates, connected parties and/or employees, may have, or have had, interests and/or commitments in the securities in subject company(ies) mentioned in this report or any securities related thereto. Further, RHB Securities (Thailand) PCL may have, or have had, business relationships with the subject company(ies) mentioned in this report. As a result, investors should exercise their own judgment carefully before making any investment decisions. Indonesia PT RHB Securities Indonesia is not affiliated with the subject company(ies) covered in this report both directly or indirectly as per the definitions of affiliation above. Pursuant to the Capital Market Law (Law Number 8 Year 1995) and the supporting regulations thereof, what constitutes as affiliated parties are as follows: 1. Familial relationship due to marriage or blood up to the second degree, both horizontally or vertically;
2. Affiliation between parties to the employees, Directors or Commissioners of the parties concerned;
3. Affiliation between 2 companies whereby one or more member of the Board of Directors or the Commissioners are the same;
4. Affiliation between the Company and the parties, both directly or indirectly, controlling or being controlled by the Company;
5. Affiliation between 2 companies which are controlled, directly or indirectly, by the same party; or
6. Affiliation between the Company and the main Shareholders.
PT RHB Securities Indonesia is not an insider as defined in the Capital Market Law and the information contained in this report is not considered as insider information prohibited by law. Insider means: a. a commissioner, director or employee of an Issuer or Public Company;
b. a substantial shareholder of an Issuer or Public Company;
c. an individual, who because of his position or profession, or because of a business relationship with an Issuer or Public Company, has access to inside information; and
d. an individual who within the last six months was a Person defined in letters a, b or c, above.
Singapore RHB Research Institute Singapore Pte Ltd and/or its subsidiaries and/or associated companies do not make a market in any securities covered in this report, except for: (a) - The staff of RHB Research Institute Singapore Pte Ltd and its subsidiaries and/or its associated companies do not serve on any board or trustee positions of any issuer whose securities are covered in this report, except for: (a) - RHB Research Institute Singapore Pte Ltd and/or its subsidiaries and/or its associated companies do not have and have not within the last 12 months had any corporate finance advisory relationship with the issuer of the securities covered in this report or any other relationship (including a shareholding of 1% or more in the securities covered in this report) that may create a potential conflict of interest, except for: (a) - Hong Kong RHBSHK or any of its group companies may have financial interests in in relation to an issuer or a new listing applicant (as the case may be) the securities in respect of which are reviewed in the report, and such interests aggregate to an amount equal to or more than (a) 1% of the subject company’s market capitalization (in the case of an issuer as defined under paragraph 16 of the Code of Conduct for Persons Licensed by or Registered with the Securities and Futures Commission (the “Code of Conduct”); and/or (b) an amount equal to or more than 1% of the subject company’s issued share capital, or issued units, as applicable (in the case of a new listing applicant as defined in the Code of Conduct). Further, the analysts named in this report or their associates may have financial interests in relation to an issuer or a new listing applicant (as the case may be) in the securities which are reviewed in the report.

Carabao Group PCL Thailand Initiating Coverage
Consumer Cyclical | Consumer Services
19
RHBSHK or any of its group companies may make a market in the securities covered by this report. RHBSHK or any of its group companies may have analysts or their associates, individual(s) employed by or associated with RHBSHK or any of its group companies serving as an officer of the company or any of the companies covered by this report. RHBSHK or any of its group companies may have received compensation or a mandate for investment banking services to the company or any of the companies covered by this report within the past 12 months. Note: The reference to “group companies” above refers to a group company of RHBSHK that carries on a business in Hong Kong in (a) investment banking; (b) proprietary trading or market making; or (c) agency broking, in relation to securities listed or traded on The Stock Exchange of Hong Kong Limited.
Kuala Lumpur Hong Kong Singapore
RHB Research Institute Sdn Bhd Level 11, Tower One, RHB Centre
Jalan Tun Razak Kuala Lumpur
Malaysia Tel : +(60) 3 9280 2185 Fax : +(60) 3 9284 8693
RHB Securities Hong Kong Ltd.
12th Floor World-Wide House 19 Des Voeux Road Central, Hong Kong
Tel : +(852) 2525 1118 Fax : +(852) 2810 0908
RHB Research Institute Singapore
Pte Ltd. 10 Collyer Quay
#09-08 Ocean Financial Centre Singapore 049315
Tel : +(65) 6533 1818 Fax : +(65) 6532 6211
Jakarta Shanghai Bangkok
PT RHB Securities Indonesia Wisma Mulia, 20th Floor
Jl. Jenderal Gatot Subroto No. 42 Jakarta 12710, Indonesia Tel : +(6221) 2783 0888 Fax : +(6221) 2783 0777
RHB (China) Investment Advisory Co. Ltd.
Suite 4005, CITIC Square 1168 Nanjing West Road
Shanghai 20041 China
Tel : +(8621) 6288 9611 Fax : +(8621) 6288 9633
RHB Securities (Thailand) PCL
10th Floor, Sathorn Square Office Tower 98, North Sathorn Road, Silom
Bangrak, Bangkok 10500 Thailand
Tel: +(66) 2 862 9999 Fax : +(66) 2 862 9799

Thai Institute of Directors Association (IOD) – Corporate Governance Report Rating 2015
Excellent ADVANC CPN GRAMMY KBANK MCOT PS RATCH SCB THCOM WACOAL BAFS DRT HANA KCE MINT PSL ROBINS SCC TISCO BCP DTAC HMPRO KKP MONO PTT SAMART SE-ED TKT BIGC DTC INTUCH KTB NKI PTTEP SAMTEL SIM TMB BTS EASTW IRPC LHBANK PHOL PTTGC SAT SNC TOP CK EGCO IVL LPN PPS QTC SC SPALI VGI
Very Good AAV BBL COL HEMRAJ MC PG SCG SST THIP TPC TWS ACAP BDMS CPF HOTPOT MEGA PJW SEAFCO STA THRE TPCORP UAC AGE BECL CPI HYDRO MFEC PM SFP STEC THREL TRC UT AHC BKI CSL ICC NBC PPP SIAM SVI TICON TRU UV AKP BLA DCC ICHI NCH PR SINGER SWC TIP TRUE VNT AMATA BMCL DELTA INET NINE PRANDA SIS SYMC TIPCO TSC WAVE ANAN BOL DEMCO IRC NSI PREB SITHAI SYNTEC TK TSTE WINNER AOT BROOK ECF KSL NTV PT SMK TASCO TKS TSTH YUASA APCS BWG EE KTC OCC PTG SMPC TBSP TMI TTA ZMICO ARIP CENTEL ERW LANNA OGC Q-CON SMT TCAP TMILL TTCL ASIMAR CFRESH GBX LH OISHI QH SNP TF TMT TTW ASK CHO GC LOXLEY OTO RS SPI TGCI TNDT TU ASP CIMBT GFPT LRH PAP S&J SSF THAI TNITY TVD BANPU CM GLOBAL MACO PDI SABINA SSI THANA TNL TVO BAY CNT GUNKUL MBK PE SAMCO SSSC THANI TOG TWFP* * On Oct 1,2015 TWFP TWFP merged with TWS resulting in a new company, TWPC
Good 2S AS CBG DNA GCAP ITD LHK MK PATO PTL SEAOIL STPI AEC ASIA CGD EARTH GENCO JSP LIT MODERN PB PYLON SIRI SUC AEONTS AUCT CHG EASON GL JTS LIVE MOONG PCA QLT SKR SUSCO AF AYUD CHOW ECL GLAND JUBILE LST MPG PCSGH RCL SMG SUTHA AH BA CI EFORL GLOW KASET M MSC PDG RICHY SOLAR SYNTEC AIRA BEAUTY CITY ESSO GOLD KBS MAJOR MTI PF RML SORKON TAE AIT BEC CKP FE GYT KCAR MAKRO MTLS PICO RPC SPA TAKUNI AJ BFIT CNS FIRE HTC KGI MATCH NC PL S SPC TCC AKR BH CPALL FOCUS HTECH KKC MATI NOK PLANB SALEE SPCG TCCC AMANAH BIG CPL FORTH IEC KTIS MBKET NUSA PLAT SAPPE SPPT TCJ AMARIN BJC CSC FPI IFEC KWC M-CHAI NWR PPM SAWAD SPVI TEAM AP BJCHI CSP FSMART IFS KYE MFC NYT PRG SCCC SRICHA TFD APCO BKD CSS FSS IHL L&E MILL OCEAN PRIN SCN SSC TFI AQUA BTNC CTW FVC IRCP LALIN MJD PACE PSTC SCP STANLY TIC TIW TPIPL UPF VPO TLUXE TRT UPOIC WHA TMC TSE UREKA WIN TMD TSR UWC XO TOPP UMI VIBHA TPCH UP VIH
IOD (IOD Disclaimer)
การเปิดเผลผลการสํารวจของสมาคมสง่เสริมสถาบนักรรมการบริษัทไทย (IOD) ในเร่ืองการกํากบัดแูลกิจการ (Corporate Governance) นีเ้ป็นการ
ดําเนินการตามนโยบายของสํานกังานคณะกรรมการกํากบัหลกัทรัพย์และตลาดหลกัทรัพย์ โดยการสํารวจของ IOD เป็นการสํารวจและประเมินจากข้อมลูของบรษัทจด
ทะเบียนในตลาดหลกัทรัพย์แหง่ประเทศไทยและตลาดหลกัทรัพย์เอ็มเอไอ ที่มีการเปิดเผยตอ่สาธารณะและเป็นข้อมลูที่ผู้ลงทนุทัว่ไปสามารถเข้าถงึได้ ดงันัน้ผลสํารวจ
ดงักลา่วจงึเป็นการนําเสนอในมมุมองของบคุคลภายนอกโดยไมไ่ด้เป็นการประเมินการปฏิบตัิและมิได้มีการใช้ข้อมลูภายในในการประเมิน
อนึ่ง ผลการสาํรวจดงักลา่ว เป็นผลการสํารวจ ณ วนัที่ปรากฎในรายงานการกํากบัดแูละกิจการบริษัทจดทะเบียนไทยเทา่นัน้ ดงันัน้ผลการสํารวจจงึอาจ
เปลี่ยนแปลงได้ภายหลงัวนัดงักลา่ว ทัง้นีบ้ริษัทหลกัทรัพย์ อาร์เอชบี จํากดั (มหาชน) มิได้ยืนยนัหรือรับรองถึงความถกูต้องของผลการสํารวจดงักลา่วแตอ่ยา่งใด

การเปิดเผยข้อมูล Anti-corruption Progress Indicator
ข้อมูล Anti-corruption Progress Indicator จากสถาบนัไทยพฒัน์ (ข้อมูล ณ วนัที ่6 พฤศจิกายน 2558)