Embed Size (px)
Citation preview
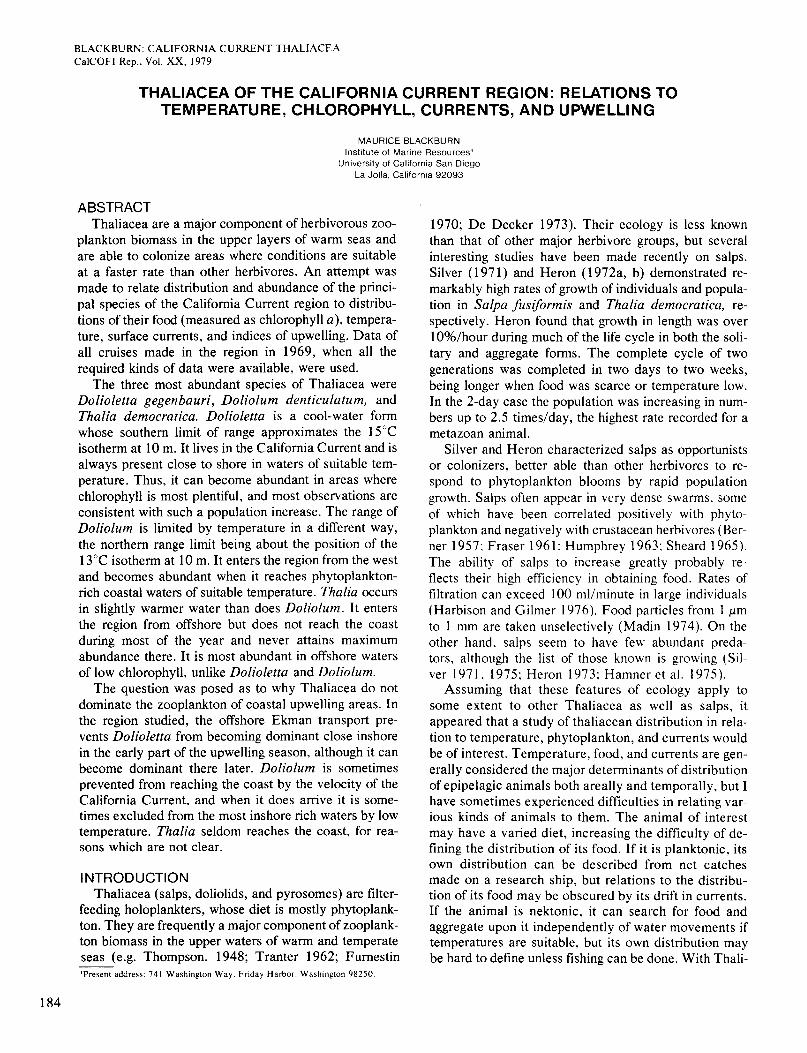
BLACKBURN: CALIFORNIA CURRENT THALIACEA CalCOFI Rep., Vol. XX, 1979
THALIACEA OF THE CALIFORNIA CURRENT REGION: RELATIONS TO TEMPERATURE, CHLOROPHYLL, CURRENTS, AND UPWELLING
MAURICE BLACKBURN Institute of Marine Resources'
University of California San Diego La Jolla. California 92093
ABSTRACT Thaliacea are a major component of herbivorous zoo-
plankton biomass in the upper layers of warm seas and are able to colonize areas where conditions are suitable at a faster rate than other herbivores. An attempt was made to relate distribution and abundance of the princi- pal species of the California Current region to distribu- tions of their food (measured as chlorophyll a) , tempera- ture, surface currents, and indices of upwelling. Data of all cruises made in the region in 1969, when all the required kinds of data were available, were used.
The three most abundant species of Thaliacea were Dolioletta gegenbauri, Doliolum denticulatum, and Thalia democratica. Dolioletta is a cool-water form whose southern limit of range approximates the 15°C isotherm at 10 m. It lives in the California Current and is always present close to shore in waters of suitable tem- perature. Thus, it can become abundant in areas where chlorophyll is most plentiful, and most observations are consistent with such a population increase. The range of Doliolum is limited by temperature in a different way, the northern range limit being about the position of the 13°C isotherm at 10 m. It enters the region from the west and becomes abundant when it reaches phytoplankton- rich coastal waters of suitable temperature. Thalia occurs in slightly warmer water than does Doliolum. It enters the region from offshore but does not reach the coast during most of the year and never attains maximum abundance there. It is most abundant in offshore waters of low chlorophyll, unlike Dolioletta and Doliolum.
The question was posed as to why Thaliacea do not dominate the zooplankton of coastal upwelling areas. In the region studied, the offshore Ekman transport pre- vents Dolioletta from becoming dominant close inshore in the early part of the upwelling season, although it can become dominant there later. Doliolum is sometimes prevented from reaching the coast by the velocity of the California Current, and when it does arrive it is some- times excluded from the most inshore rich waters by low temperature. Thalia seldom reaches the coast, for rea- sons which are not clear.
I NTROD U CTlO N Thaliacea (salps, doliolids, and pyrosomes) are filter-
feeding holoplankters, whose diet is mostly phytoplank- ton. They are frequently a major component of zooplank- ton biomass in the upper waters of warm and temperate seas (e.g. Thompson, 1948; Tranter 1962; Furnestin 'Present address: 741 Washington Way, Friday Harbor. Washington 98250
1970; De Decker 1973). Their ecology is less known than that of other major herbivore groups, but several interesting studies have been made recently on salps. Silver (1971) and Heron (1972a, b) demonstrated re- markably high rates of growth of individuals and popula- tion in Salpa fusformis and Thalia democratica, re- spectively. Heron found that growth in length was over lO%/hour during much of the life cycle in both the soli- tary and aggregate forms. The complete cycle of two generations was completed in two days to two weeks, being longer when food was scarce or temperature low. In the 2-day case the population was increasing in num- bers up to 2.5 times/day, the highest rate recorded for a metazoan animal.
Silver and Heron characterized salps as opportunists or colonizers, better able than other herbivores to re- spond to phytoplankton blooms by rapid population growth. Salps often appear in very dense swarms. some of which have been correlated positively with phyto- plankton and negatively with crustacean herbivores (Ber- ner 1957; Fraser 1961: Humphrey 1963: Sheard 1965). The ability of salps to increase greatly probably re- flects their high efficiency in obtaining food. Rates of filtration can exceed 100 ml/minute in large individuals (Harbison and Gilmer 1976). Food particles from 1 pm to 1 mm are taken unselectively (Madin 1974). On the other hand, salps seem to have few abundant preda- tors. although the list of those known is growing (Sil- ver 1971. 1975; Heron 1973: Hamner et al. 1975).
Assuming that these features of ecology apply to some extent to other Thaliacea as well as salps, it appeared that a study of thaliacean distribution in rela- tion to temperature, phytoplankton, and currents would be of interest. Temperature, food, and currents are gen- erally considered the major determinants of distribution of epipelagic animals both areally and temporally, but I have sometimes experienced difficulties in relating var- ious kinds of animals to them. The animal of interest may have a varied diet, increasing the difficulty of de- fining the distribution of its food. If it is planktonic, its own distribution can be described from net catches made on a research ship, but relations to the distribu- tion of its food may be obscured by its drift in currents. If the animal is nektonic, it can search for food and aggregate upon it independently of water movements if temperatures are suitable, but its own distribution may be hard to define unless fishing can be done. With Thali-
184
BLACKBURN: CALIFORNIA CURRENT THALIACEA CslCOFI Rep., Vol. XX, 1979
acea it seemed for reasons given above that food dis- tributions could be defined approximately from mea- surements of chlorophyll a and that the animals should remain abundant in the presence of plentiful food (and suitable temperature) even though subject to drift. High abundance of Thaliacea in an area of high phytoplank- ton concentration would not necessarily signify the drift- ing in of a swarm but more probably its generation in situ from a diffused “seed” population.
It was hoped that the proposed study would answer a special question; namely, why Thaliacea do not domi- nate the zooplankton of coastal upwelling areas since they are such efficient herbivores. Charts of their abun- dance in the California Current region show that they are dominant only occasionally in upwelling areas although Thaliacea is the principal taxon on a biomass basis for the whole region in the upwelling season (Berner 1967; Isaacs et al. 1969, 197 1 ; Fleminger et al. 1974). They tend to be less abundant close inshore, a situation also observed off northwest Africa in the upwelling season (Blackburn 1979).
The material of the 1969 series of CalCOFI cruises appeared suitable for the proposed distribution study. A large part of the California Current region was covered eight times during 1969 with a similar and rather dense station pattern. The cruises yielded collections and mea- surements of several properties including zooplankton, chlorophyll a , temperature, and surface geostrophic cur- rent. Although the CalCOFI program began in 1949, 1969 was the first year of reasonably good coverage for chlorophyll a or any other measure of phytoplankton. Thus the charts by Berner ( 1967) of thaliacean distribu- tions in the period 1949-1958 cannot be related to phyto- plankton.
MATERIAL AND METHODS The materials and data described here refer to all the
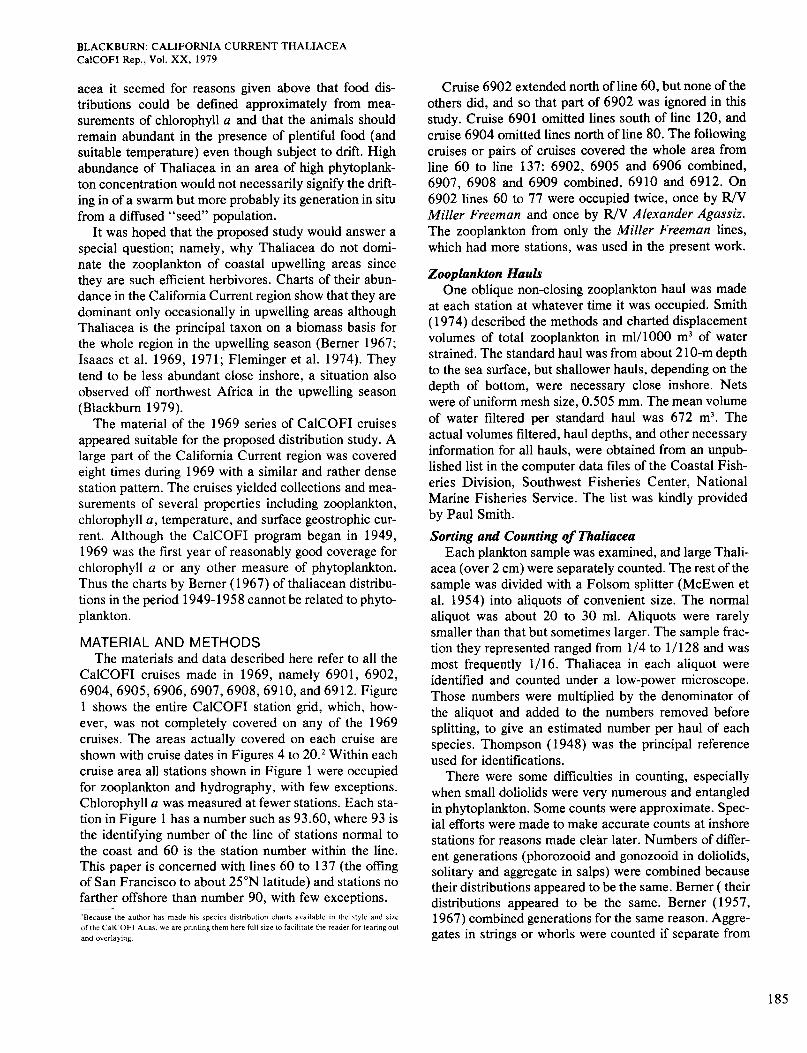
CalCOFI cruises made in 1969, namely 6901, 6902, 6904,6905,6906,6907,6908,6910, and 6912. Figure 1 shows the entire CalCOFI station grid, which, how- ever, was not completely covered on any of the 1969 cruises. The areas actually covered on each cruise are shown with cruise dates in Figures 4 to 20.* Within each cruise area all stations shown in Figure 1 were occupied for zooplankton and hydrography, with few exceptions. Chlorophyll a was measured at fewer stations. Each sta- tion in Figure 1 has a number such as 93.60, where 93 is the identifying number of the line of stations normal to the coast and 60 is the station number within the line. This paper is concerned with lines 60 to 137 (the offing of San Francisco to about 25”N latitude) and stations no farther offshore than number 90, with few exceptions. ’Because the author has made his species distribution charts available in the ctyle and size of the CalCOFl Atlas. we are printing them here full size to facilitate the reader for teanng out and overlaying.
Cruise 6902 extended north of line 60, but none of the others did, and so that part of 6902 was ignored in this study. Cruise 6901 omitted lines south of line 120, and cruise 6904 omitted lines north of line 80. The following cruises or pairs of cruises covered the whole area from line 60 to line 137: 6902, 6905 and 6906 combined, 6907, 6908 and 6909 combined, 6910 and 6912. On 6902 lines 60 to 77 were occupied twice, once by R/V Miller Freeman and once by IW Alexander Agassiz. The zooplankton from only the Miller Freeman lines, which had more stations, was used in the present work.
Zooplankton Hauls One oblique non-closing zooplankton haul was made
at each station at whatever time it was occupied. Smith (1974) described the methods and charted displacement volumes of total zooplankton in ml/l000 m3 of water strained. The standard haul was from about 2 10-m depth to the sea surface, but shallower hauls, depending on the depth of bottom, were necessary close inshore. Nets were of uniform mesh size, 0.505 mm. The mean volume of water filtered per standard haul was 672 m3. The actual volumes filtered, haul depths, and other necessary information for all hauls, were obtained from an unpub- lished list in the computer data files of the Coastal Fish- eries Division, Southwest Fisheries Center, National Marine Fisheries Service. The list was kindly provided by Paul Smith.
Sorting and Counting of Thaliacea Each plankton sample was examined, and large Thali-
acea (over 2 cm) were separately counted. The rest of the sample was divided with a Folsom splitter (McEwen et al. 1954) into aliquots of convenient size. The normal aliquot was about 20 to 30 ml. Aliquots were rarely smaller than that but sometimes larger. The sample frac- tion they represented ranged from 1/4 to 1/128 and was most frequently 1/16. Thaliacea in each aliquot were identified and counted under a low-power microscope. Those numbers were multiplied by the denominator of the aliquot and added to the numbers removed before splitting, to give an estimated number per haul of each species. Thompson (1948) was the principal reference used for identifications.
There were some difficulties in counting, especially when small doliolids were very numerous and entangled in phytoplankton. Some counts were approximate. Spec- ial efforts were made to make accurate counts at inshore stations for reasons made clear later. Numbers of differ- ent generations (phorozooid and gonozooid in doliolids, solitary and aggregate in salps) were combined because their distributions appeared to be the same. Berner ( their distributions appeared to be the same. Berner (1957, 1967) combined generations for the same reason. Aggre- gates in strings or whorls were counted if separate from
185
BLACKBURN: CALIFORNIA CURRENT THALIACEA CalCOFI Rep., Vol. XX, 1979
solitaries but not if attached to them. Doliolid oozooids were counted, although not identifiable by species.
The above-mentioned numbers per haul are used in preference to numbers per standard volume of water strained for some purposes, as explained later. The data summarized in Figures 4 to 20 are in numbers per 1000 m3 of water, however. This was done to facilitate com- parison with the charts of Berner (1967) for the same region. For the same reasons, I used limiting numbers for contours which are the same as some of Berner's limit- ing numbers, although my charts have fewer contour intervals. In effect Figures 4 to 20 have less contour de- tail than similar charts by Berner, but show all important features and can easily be compared with his figures. No contours were drawn around single stations.
Temperature The principal species of Thaliacea in the California
Current region are most abundant near the sea surface, as mentioned later. Berner ( 1957) compared distribu- tions of Thaliacea and temperatures in the mixed layer. He noted that temperatures measured at 10 m below surface were generally close to mixed-layer tempera- tures. Berner and Reid (1961) used 10-m temperatures entirely in a similar study, and I have done the same. Wyllie and Lynn (1971) published charts of 10-m tem- perature for all CalCOFI cruises made in 1969. Surface Currents
Information on surface currents was obtained from charts of dynamic height anomalies (0 over 500 decibars), prepared for each CalCOFI cruise of 1969. Charts for cruises 6901 and 6902 are given and methods described in Scripps Institution of Oceanography (1 976). Those for the other cruises are unpublished and were lent for this study by John Wyllie, who drew them. Chlorophyll a
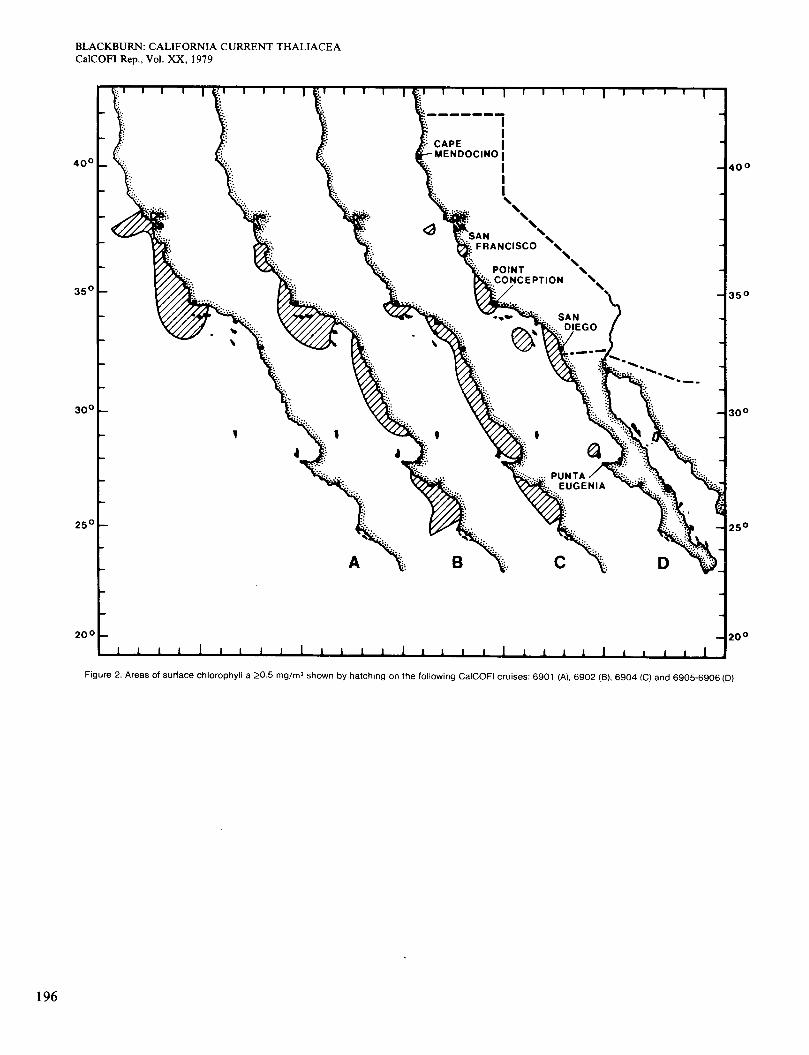
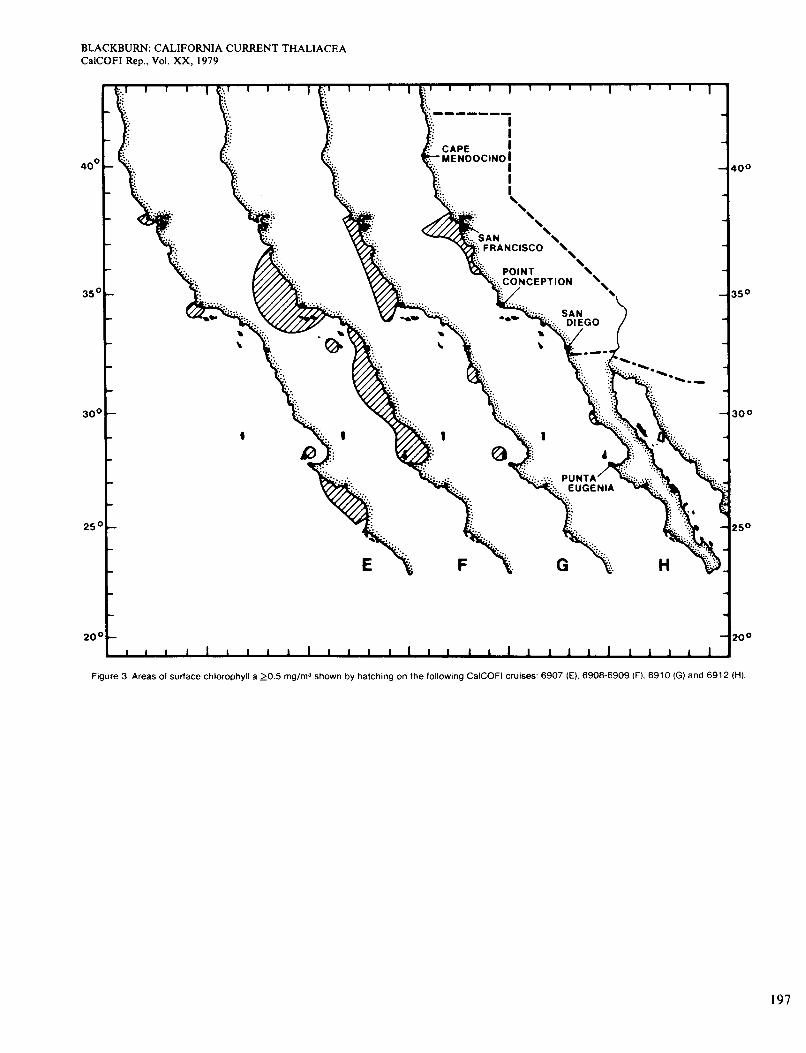
Concentration of chlorophyll a as a convenient mea- surement of total phytoplankton. Owen and Sanchez (1974) listed such concentrations for some stations on each CalCOFI cruise of 1969 and described their meth- ods (fluorometric analysis of acetone extracts). Owen (1 974) gave contoured charts of chlorophyll a at the sea surface and in the 0-150-m layer for the four 3-month periods of 1969 (January-March, etc.). His charts show maxima and minima in similar locations for the two depth levels. Remarks made subsequently about chlorc- phyll distribution refer to the surface data of Owen and Sanchez for the specified cruise. Figures 2 and 3 are based on those data and show areas where surface chlorophyll a was 0.5 mg/m3 or higher on each cruise. Owen and Sanchez also listed data on primary produc- tion (,I4 uptake) from some cruises, but the areal cover- age was too sparse for the measurements to be of use in this study.
Upwelling Indices Bakun ( 1975) calculated mean upwelling indices for
each day in 1969 in several areas along the west coast of North America, and some of them are used in this paper. The upwelling index is the component of computed Ek- man transport directed offshore, in metric tons of water per sec per 100 m of coastline. Upwelling indices for the inshore end of CalCOFI line 60 were taken from Bakun's table for 39"N latitude, since line 60 was closer to that position than any other position given. Similarly indices for lines 63 to 80 were taken from the table for 36"N; lines 83 to 100 from 33"N; lines 103 to 110 from 30"N; lines 1 13 to 130 from 27"N; and lines 1 33 and 137 from 24"N.
RELATIVE ABUNDANCE OF SPECIES Table 1 is a summary of all data showing numbers per
haul by cruise and principal species for northern, cen- tral, and southern parts of the area (A, B, and C). The principal species are Salpidae, except Dolioletta gegen- bauri and Doliolum denticulatum which are Doliolidae.
For the whole area and year the three must abundant forms are Dolioletta gegenbauri, Thalia democratica, and Doliolum denticulatum. They account for 86.4,6.1, and 2.8%, respectively, of all individuals. Oozooids of Doliolidae make up an additional 3.2%, which probably represents the above-mentioned species of that family. Salps other than Thalia democratica, together with neg- ligible numbers of pyrosome fragments, comprise the remaining 1.5%. Most of this residue (1.3% of the total) is the form known as Salpa fusiformis.
In the northern area (San Francisco to Point Concep- tion), the relative abundance of principal species is broadly similar to that for the whole region, except that Doliolum denticulatum is scarcer than Salpa fusiform- is. In the central area (Point Conception to Punta Eugen- ia), Dolioletta gegenbauri is much scarcer than in the north, Doliolum denticulatum much more abundant, Thalia democratica slightly more abundant, and Salpa
fusiformis less abundant. Numbers of the first three spe- cies are comparable for the year as a whole. South of Punta Eugenia, all species are much scarcer than in the other two areas. Thalia democratica and Doliolum den- ticulatum might have been taken in larger numbers if lines of stations had extended as far offshore as in the other areas (Figures 14, 18, and 19). Thalia democrat- ica, Doliolum denticulatum, and oozooids in that order comprise 92.8% of the total numbers per haul, and Doli- oletta gegenbauri is scarcer than Salpa fusiformis.
Although Dolioletta gegenbauri is predominantly a northern form, it is most abundant in the warmer months wherever it occurs. This suggests that seasonal changes in its abundance might be related to upwelling, although temperature may determine the limits of range. The peak
186
BLACKBURN: CALIFORNIA CURRENT THALIACEA CalCOFI Rep., Vol. XX, 1979
TABLE 1
Cruises', Hauls per Cruise, and Mean Numbers of Thaliacea per Haul by Species.
6905 6908 to to
Cruise Number 6901 69026904 6906 6907 6909 6910 6912 Total
A. Station Lines 60-77
Numbers ofHauls . . . . . . . . . . 46 58 0 46 47 48 46 47
Doliolerrafefenbauri . . . . . . . 952 242 43.135 11,871 14,021 1,192 284 71,697 .. Doliolum denriculanrm . . . . . Oozooids of Doliolidae . . . . . Thalia democratica . . . . . . . . Salpa fusformis ........... Cyclosalpa bakeri . . . . . . . . . . Iasis zonaria . . . . . . . . . . . . . . Rirreriella picreti . . . . . . . . . . . Cycloslapa @inis . . . . . . . . . . Pegea corfoederara . . . . . . . . Others] . . . . . . . . . . . . . . . . . . .
Number of Hauls . . . . . . . . Doliolerta gegenbauri . . . . . . . Doliolum denriculatum ..... Oozooids of Doliolidae . . . . . Thalia democratica . . . . . . . . Salpa fusformis . . . . . . . . . . . Cyclosalpa bakeri . . . . . . . . . . Iasis zonaria . . . . . . . . . . . . . . Rirreriella picreri . . . . . . . . . . . Cyclosalpa sflinis . . . . . . . . . . Pegea confoederara . . . . . . . . Others' . . . . . . . . . . . . . . . . . . .
Number of Hauls Doliolerra gegenbauri . . . . . . . Doliolum denriculanrm . . . . . Oozooids of Doliolidae . . . . . Thalia democratica . . . . . . . . Salpa fusformis . . . . . . . . . . . Cyclosalpa bakeri . . . . . . . . . . Iasis zonaria . . . . . . . . . . . . . . Rirreriella picreti . . . . . . . . . . . Cyclosalpa sflinis . . . . . . . . . . Pegea corlfoederara . . . . . . . . Others' . . . . . . . . . . . . . . . . . . .
160 6 < I < I 182 178 279 332
3 38 1 4 9 32 8 7
34 7 1 1 2 2 8 0 0 < I 1 0 1 0 0 0
< I 0 < I 0 < I 1 < I 0
B. Station Lines 80120 133 126 136 132 136
76 68 491 1,069 1,447 184 412 62 25 996 79 89 173 112 393 5 7 4 5 2 2 IO 6 8 18 16 2 I 18 31 0 2 I < I < I < I 2 < I < I 1 < I 0 O < I 0 0
< I < I 0 0 0 < I < I < I 0 < I C. Station Lines 123-137
0 33 31 31 33
0 2 0 I IO 4 0 16 6 37 4 18
10 18 3 38 I I 2 1 0 0 < 1 0 0 0 0 0
< I O 0 0 0 0 0 0 0 0 0 0 0 0 0 0
36 2 I I 215 660 132 28 1,791
5 0 2,119 2,170 8 130 723 917 0 1 4 6 90 1 0 1 1 4 0 0 < 1 I 0 0 1 2 0 0 1 I 0 0 0 I
132 136 133
236 53 2 3,442 296 60 54 2,089
I I 19 IO 887 8 1,235 1.694 2,980
13 47 39 157 < I 7 5 64 < I < I 1 4 <1 < I 0 3
0 1 7 8 0 1 2 3 I l l 3
33 33 25 1 0 0 4
49 14 3 96 15 3 2 85 24 20 3 116 5 3 1 1 4 0 0 0 < 1 0 0 0 0 0 0 0 < 1 0 0 0 0 0 0 0 0 5 0 0 5
~~
'See Figure 1 for location of station lines. 'Cyclosalp strongylenremn, Ihlea puncrata. 7'herys vagina, plus fragments of Pyrosoma colonies. 'Same as in I, plus Doliolina mulleri, Dolioloides ramm. Cyclosalpa pinnara. Cyclosalpa virgula. and Salpa cylindrica. 'Ihlea puncrara, Therys vagina, and S a g a cylindrica.
of the upwelling season in 1969 was March to May in the southern area, April to July in the central area, and June to August in the northern area (Bakun 1975), and this is the usual pattern (Reid et al. 1958). Doliolum denticu- latum is most abundant in the central area. There seem to be two peaks of abundance, July to September and January to February. Thalia democratica is abundant in the central and northern areas but only in October and December. Its peak in the southern area, where it is scarce, in late summer. Salpa fusiformis, predominantly northern, is distributed seasonally like Thalia democrat- ica. If the three last-mentioned species are related to temperature or upwelling, the relations are probably
more complex than for Dolioletta gegenbauri. This matter is discussed later.
The four species mentioned above were also the prin- cipal species in the material of Berner (1957, 1967) from the same region. In the rest of this study, only the three most abundant species are considered. The reason for excluding Salpa fusiformis is that it may represent a mixture of two species, S. fusiformis and S. aspera, in the California Current region. Foxton (1 96 1) held this view although others, including Thompson ( 1948), Ber- ner (1957) and Silver (1975), regarded S aspera as an intergrading variety. I could not use the criteria of Foxton to distinguish fusiformis and aspera under the condi- tions of my work. The principal criteria are smoothness of the test (spiny or not) and numbers of fibers in muscle- bands. It was common for the test to be found separated from the rest of the animal in the preserved samples, and time was insufficient to count the numerous muscle fibres in all specimens. All specimens were identified as S. fusi- formis, but in view of Foxton's opinion I hesitate to re- gard them as one species. Some tests were spiny and some smooth.
Since Dolioletta gegen bauri, Doliolum denticulatum, and Thalia democratica are the only species of those genera considered here, they are henceforth generally referred to by genus only for convenience.
DISTRIBUTION OF PRINCIPAL SPECIES Dolioletta gegenbauri
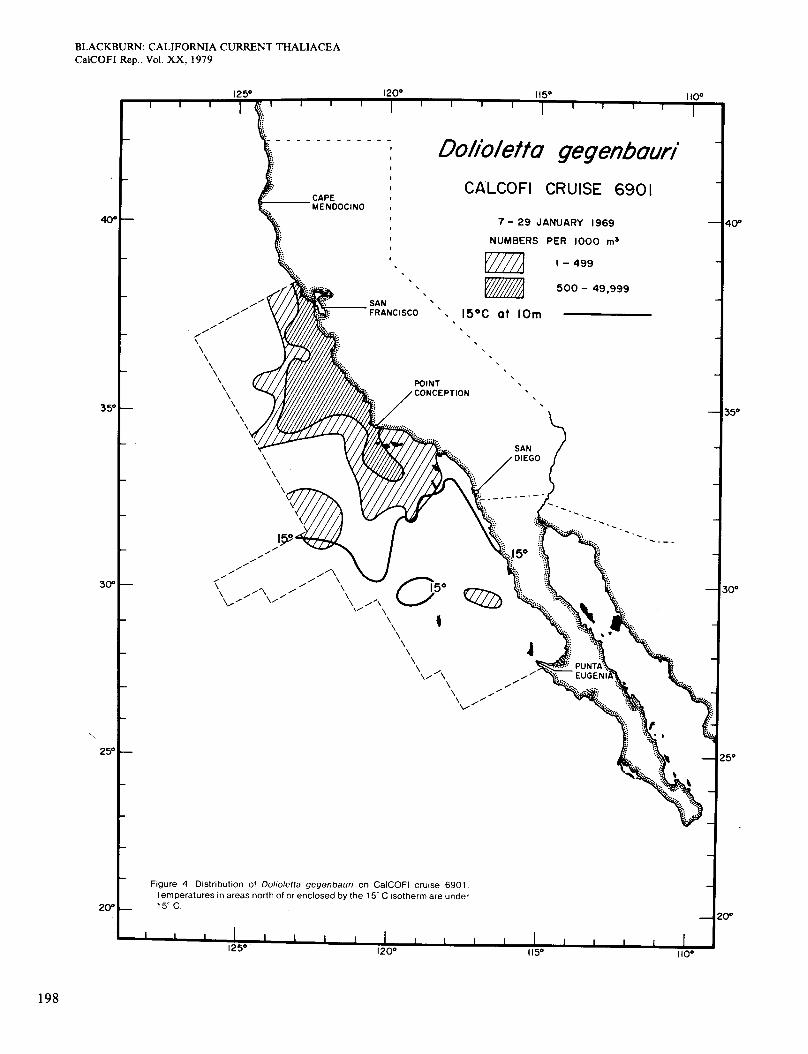
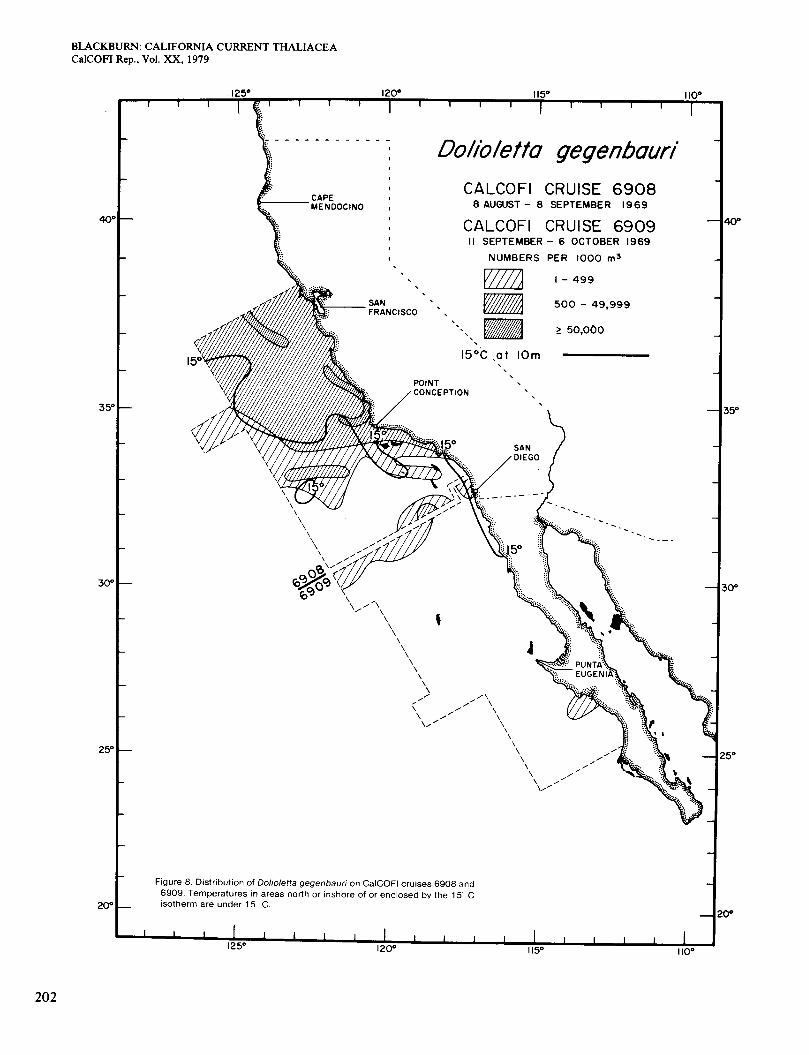
Berner (1 957) regarded this species as characteristic of subarctic or California Current water. In his material from the region shown in Figure 1, it occurred at stations where mixed-layer temperatures ranged from 9.0" to 273°C and averaged 11" to 16°C. Comparing my distri- bution charts with contemporaneous 10-m isotherms, I concluded that the species generally occurred at < 14" in the colder months and <16" in the warmer months. The 15" isotherm seemed to delimit the distribution fairly well on a year-round basis and is shown in Figures 4 to 9.
The non-closing CalCOFI zooplankton hauls give no information on bathymetric distribution of Dolioletta or other Thaliacea. Berner (1 957) reviewed data from vari- ous sources and concluded that Dolioletta is most com- mon in the 0-100-m layer, especially at 0-50 m. similar distributions near the sea surface are discussed later for Doliolum and Thalia. Most hauls were made to about 210 m and strained about 670 m3 of water, as noted earlier. The most inshore one or two hauls on each line were made less deep from necessity, and therefore strained less water. Assuming that each species is concentrated in a layer of more or less uniform depth less than 210 m both offshore and inshore, estimated numbers per 1000 m3 must be high at the inshore stations where shallow
187
BLACKBURN: CALIFORNIA CURRENT THALIACEA CalCOFI Rep., Vol. XX, 1979
TABLE 2 TABLE 3 Rank Correlation Coefficients Between Upwelling Indices and Ratios'
of Numbers of Dolioletta gegenbauri and Doliolurn denticulatum for Two Periods in 1969.
Data From Which the Significant Coefficient in Table 2' Was Calculated.
Cruise Line Ratio Date x Index
x x-1 X-2 X-3 x-4 X-5 X-6
January-June (Cruises 69014906)
Doliolerragegenbauri ...... +0.25 +0.29 f0.46- -0.05 fO.02 + O M f0.07 Doliolum denticulanrm . . . . . +0.21 +0.07 +0.17 +0.22 +0.07 +0.13 f0.19
July-December (Cruises 6907-691 2) Doliolerra gegenbauri ...... +0.02 -0.14 -0.1 1 -0.06 -0.08 -0.17 0.00 Doliolum denrimlarum . . _ _ . +0.03 -0.15 -0.15 0.00 -0.26 +0.05 +0.09
'Each ratio was the number taken at Station 2 divided by the number at Station 1 where Station 1 was the most inshore station on a CalCOFI line and Station 2 the one next offshore. Each ratio was compared with 7 upwelling indices for the area of the line: x was the index for the day on which the earlier of the two stations was occupied, and x-1, x-2, etc., were indices for 1,2, etc., days previously. Coefficients without * are not significant for the numbers of degrees of freedom used.
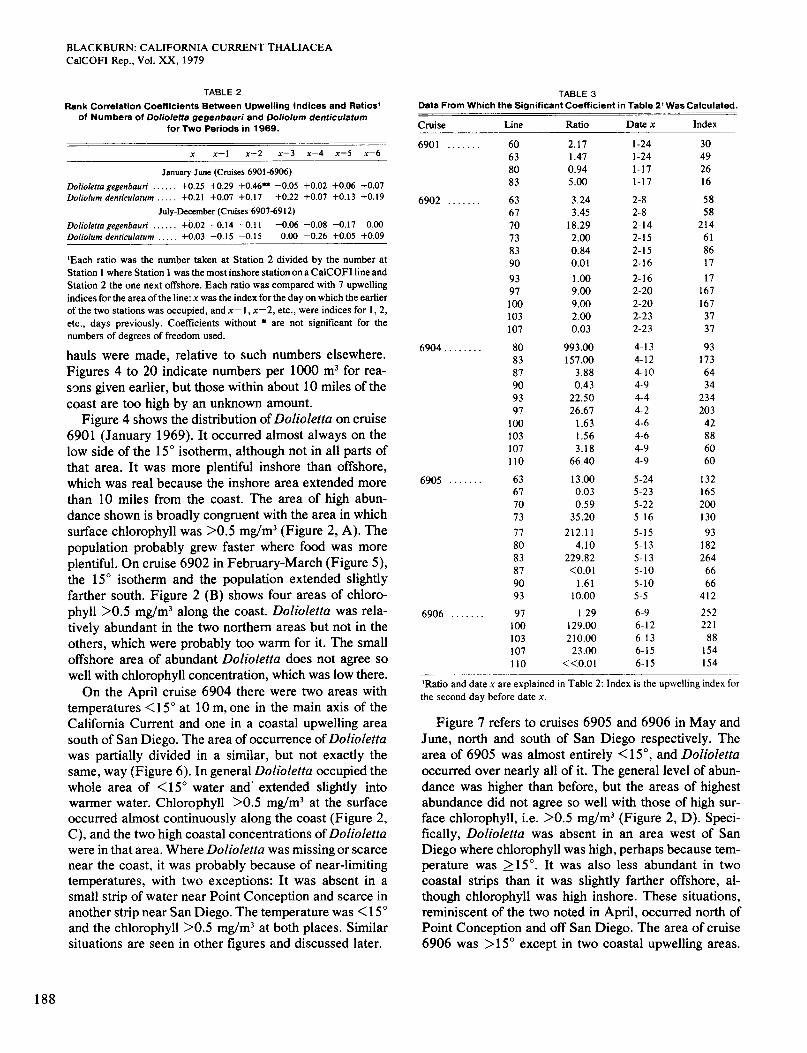
hauls were made, relative to such numbers elsewhere. Figures 4 to 20 indicate numbers per 1000 m3 for rea- s m s given earlier, but those within about 10 miles of the coast are too high by an unknown amount.
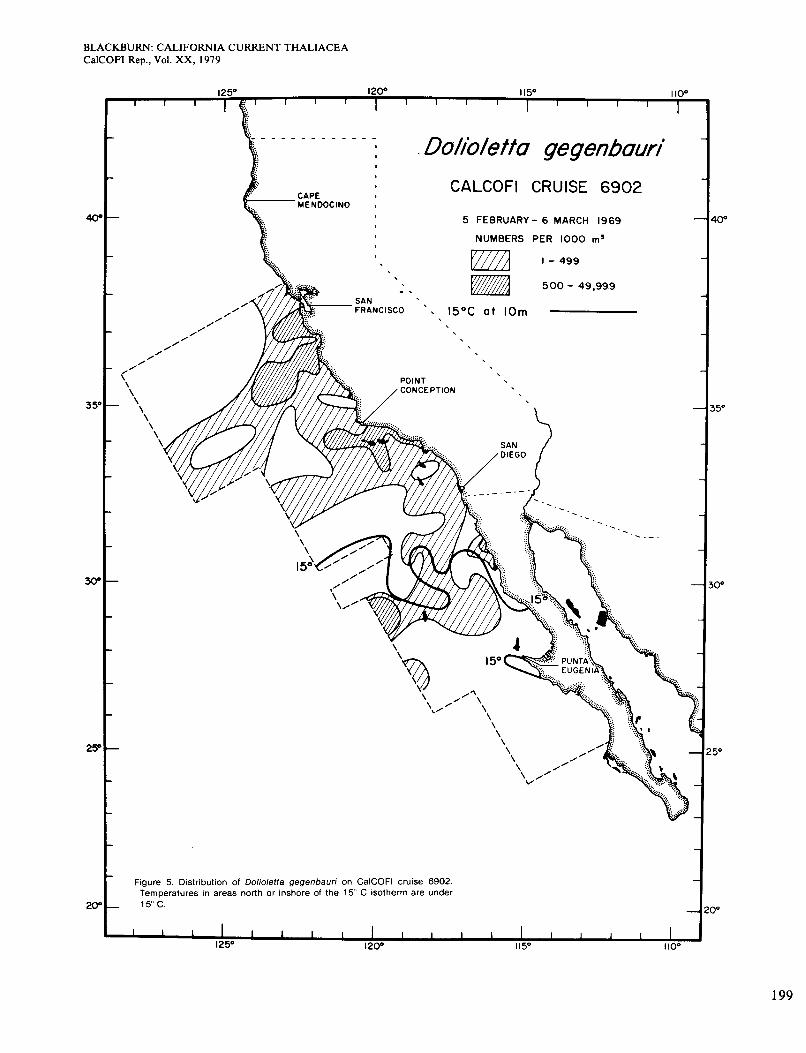
Figure 4 shows the distribution of Dolioletta on cruise 6901 (January 1969). It occurred almost always on the low side of the 15" isotherm, although not in all parts of that area. It was more plentiful inshore than offshore, which was real because the inshore area extended more than 10 miles from the coast. The area of high abun- dance shown is broadly congruent with the area in which surface chlorophyll was >OS mg/m3 (Figure 2, A). The population probably grew faster where food was more plentiful. On cruise 6902 in February-March (Figure 5), the 15" isotherm and the population extended slightly farther south. Figure 2 (B) shows four areas of chloro- phyll >OS mg/m3 along the coast. Dolioletta was rela- tively abundant in the two northern areas but not in the others, which were probably too warm for it. The small offshore area of abundant Dolioletta does not agree so well with chlorophyll concentration, which was low there.
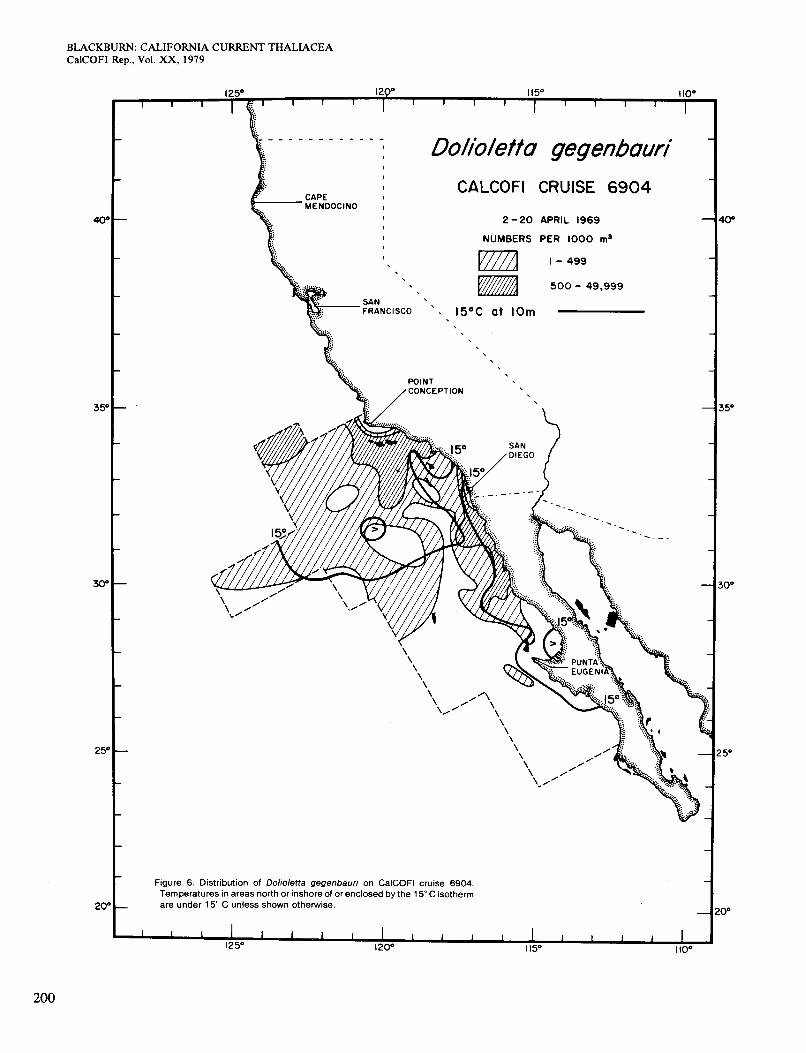
On the April cruise 6904 there were two areas with temperatures <15" at 10 m, one in the main axis of the California Current and one in a coastal upwelling area south of San Diego. The area of Occurrence of Dolioletta was partially divided in a similar, but not exactly the same, way (Figure 6). In general Dolioletta occupied the whole area of <15" water and' extended slightly into warmer water. Chlorophyll >OS mg/m3 at the surface occurred almost continuously along the coast (Figure 2, C), and the two high coastal concentrations of Dolioletta were in that area. Where Dolioletta was missing or scarce near the coast, it was probably because of near-limiting temperatures, with two exceptions: It was absent in a small strip of water near Point Conception and scarce in another strip near San Diego. The temperature was < 15" and the chlorophyll >OS mg/m3 at both places. Similar situations are seen in other figures and discussed later.
6901 . . . . . . . 60 63 80 83
6902 . . . . . . . 63 67 70 73 83 90 93 97 100 103 107
6904 . . . . . . . . 80 83 87 90 93 97 100 103 107 110
6905 . . . . . . . 63 67 70 73 77 80 83 87 90 93
6906 . . . . . . . 97 100 103 107 110
2.17 1.47 0.94 5.00 3.24 3.45 18.29 2.00 0.84 0.01 1 .00 9.00 9.00 2.00 0.03
993.00 157.00 3.88 0.43 22.50 26.67 1.63 1.56 3.18 66.40 13.00 0.03 0.59 35.20 212.1 1 4.10
229.82 <0.01 1.61 10.00
I .29 129.00 210.00 23.00
<<0.01
1-24 1-24 1-17 1-17 2-8 2-8 2-14
2-15 2-16 2-16 2-20 2-20 2-23 2-23 4-13 4-12 4-10 4-9 4-4 4-2 4- 6 4-6 4-9 4-9
5-24
5-22 5-16 5-15 5-13 5-13 5-10 5-10 5-5 6-9
2-15
5-23
6-12 6-13 6-15 6-15
30 49 26 16 58 58 214 61 86 17 17 167 167 37 31
93 173 64 34 234 203 42 88 60 60
132 165 200 130 93 182 264 66 66 412 252 22 1 88 154 154
'Ratio and date x are explained in Table 2: Index is the upwelling index for the second day before date x.
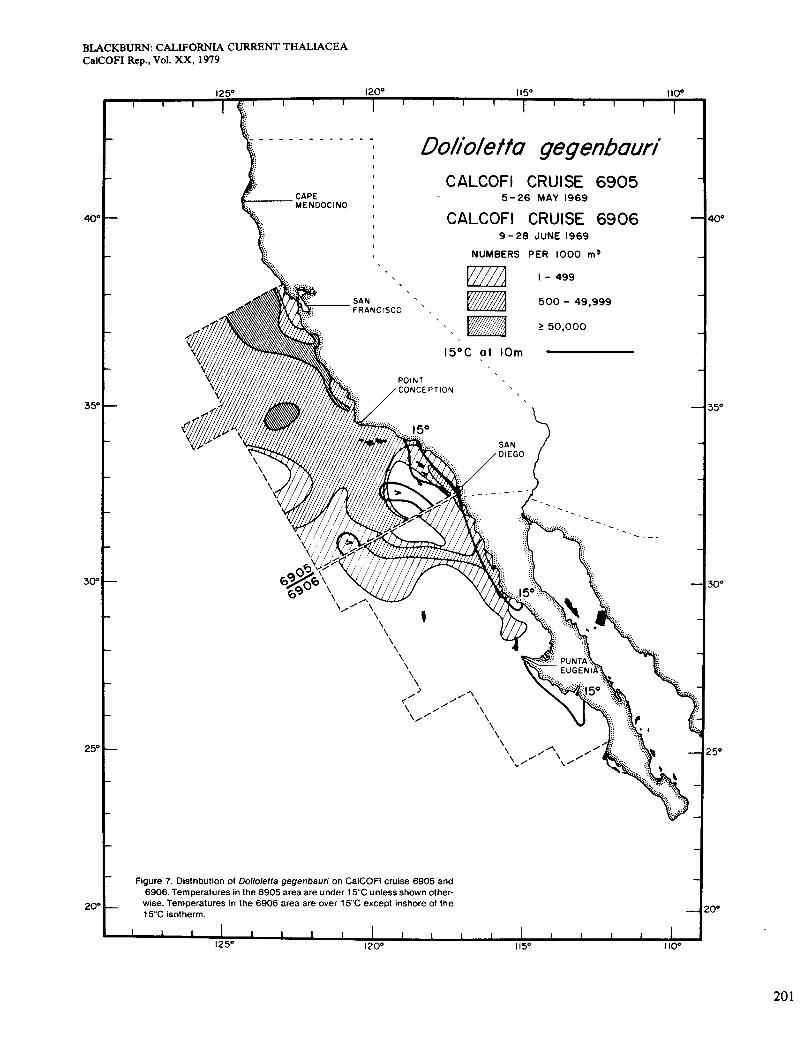
Figure 7 refers to cruises 6905 and 6906 in May and June, north and south of San Diego respectively. The area of 6905 was almost entirely <15", and Dolioletta occurred over nearly all of it. The general level of abun- dance was higher than before, but the areas of highest abundance did not agree so well with those of high sur- face chlorophyll, Le. >OS mg/m3 (Figure 2, D). Speci- fically, Dolioletta was absent in an area west of San Diego where chlorophyll was high, perhaps because tem- perature was 215". It was also less abundant in two coastal strips than it was slightly farther offshore, al- though chlorophyll was high inshore. These situations, reminiscent of the two noted in April, occurred north of Point Conception and off San Diego. The area of cruise 6906 was >15" except in two coastal upwelling areas.
188
BLACKBURN: CALIFORNIA CURRENT THALIACEA CalCOFI Rep., Vol. XX, 1979
Dolioletta occurred in the northern upwelling area but not in the southern one, which it probably did not reach even as a seed population. It was present and even mod- erately abundant in some of the warmer waters as well. The contours run parallel with those of dynamic height. Chlorophyll measurements < 0.5 mg/m3 were in and near the northern upwelling area (Figure 2, D).
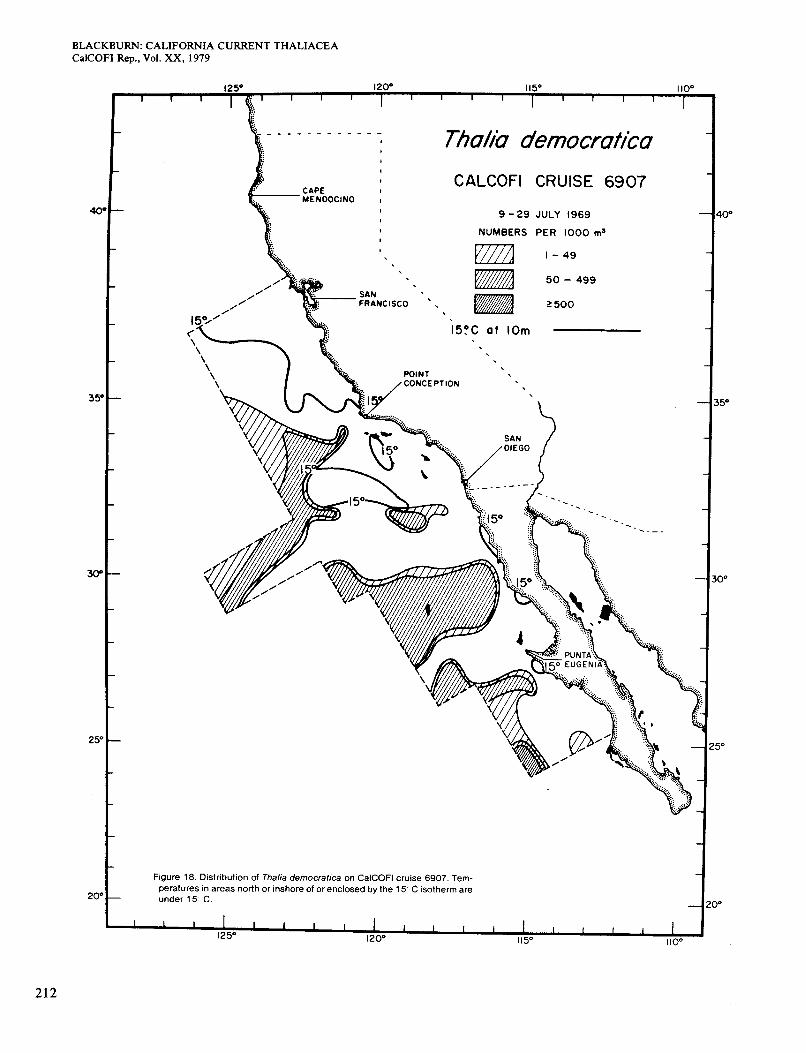
The distribution of Dolioletta on cruise 6907 (July) is not shown because it was similar to Figure 7. The areas <15" were smaller (Figure 18) but included most of the areas where Dolioletta was moderately or very abun- dant. Dolioletta occurred at a low level of abundance in several large areas >15", as in June. The 15" isotherm followed the limit of the range less well in June and July than in other months. Chlorophyll values for cruise 6907 were mostly <OS mg/m3 even along the coast, although higher near the coast than elsewhere (Figure 3, E).
Temperatures on cruise 6908 in August-September (Figure 8) were about the same as on 6907. The south- ern limit of Dolioletta was north of its July position and agreed better with the temperature. A large northern area of relatively high surface chlorophyll (Figure 3, F ) in- cluded some of the highest concentrations of Dolioletta. An elongate area of very abundant Dolioletta touched the coast north of Point Conception. At that point the concentration was one of the highest recorded for Dolio- letta, and the zooplankton was almost entirely that spe- cies. On cruise 6909 (September-October, south of San Diego) almost all waters were > 15", and Dolioletta was scarcely present (Figure 8). High temperature probably excluded it. Surface chlorophyll was high along the coast north of Punta Eugenia (Figure 3, F).
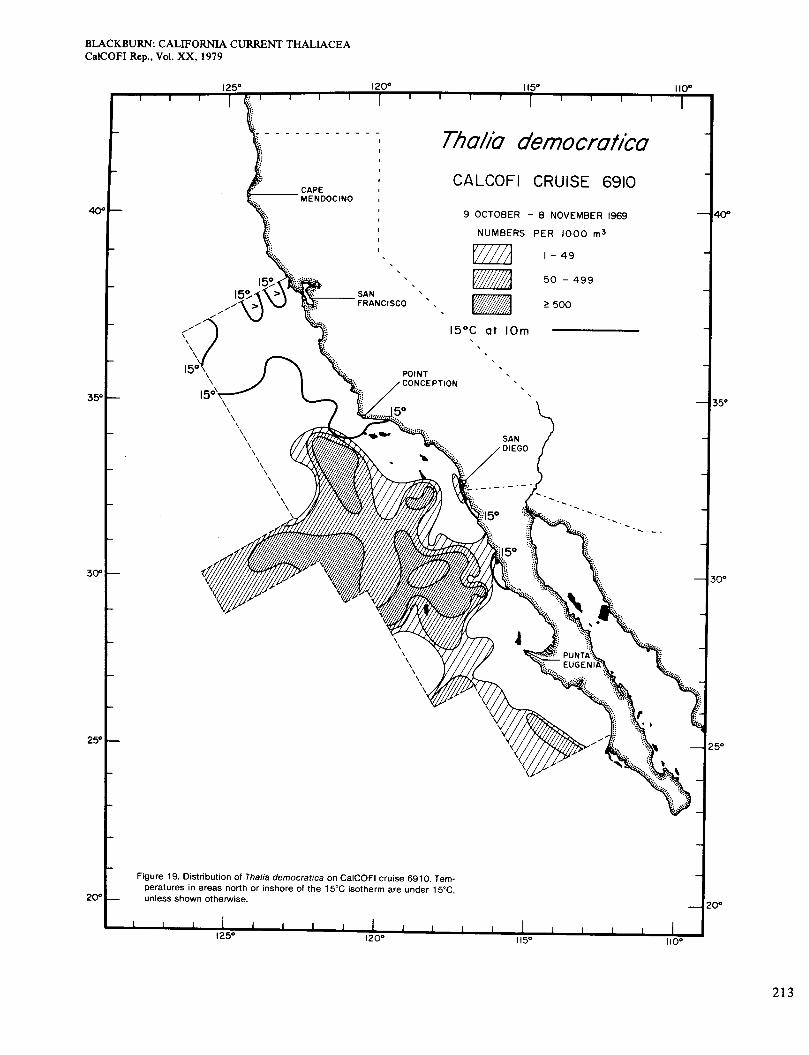
On cruise 6910 (October-November) the total area of Dolioletta and water <15" was about the same as in Figure 8, but Dolioletta was generally scarcer (Figure 9). Figure 3(G) shows the distribution of chlorophyll > O S mg/m3, which agreed fairly well with that of Dolio- lettu in inshore waters. The distribution on cruise 6912 (November-December) is not shown. It was much more restricted than on any other cruise, in an area off San Francisco and a small one of low abundance on the coast east of Point Conception. The first area was in water <15" and the second was not (see temperature in Fig- ure20). Chlorophyll concentrations >0.5 mg/m3 were virtually confined to the San Francisco area (Figure 3,
Figures 4 to 9 are broadly similar to some of the charts of Berner (1967) for Dolioletta at the same periods in other years. For example, Figures 5, 7, and 8 are com- parable with those for the same periods in 1950, 1950, and 1949 respectively. On the other hand, Figures 8 and 9 do not agree well with those for the same periods in 1952, when Dolioletta was fairly abundant south of Punta Eugenia.
H).
Doliolum denticulatum Berner ( 1957) and Berner and Reid (1 96 1) considered
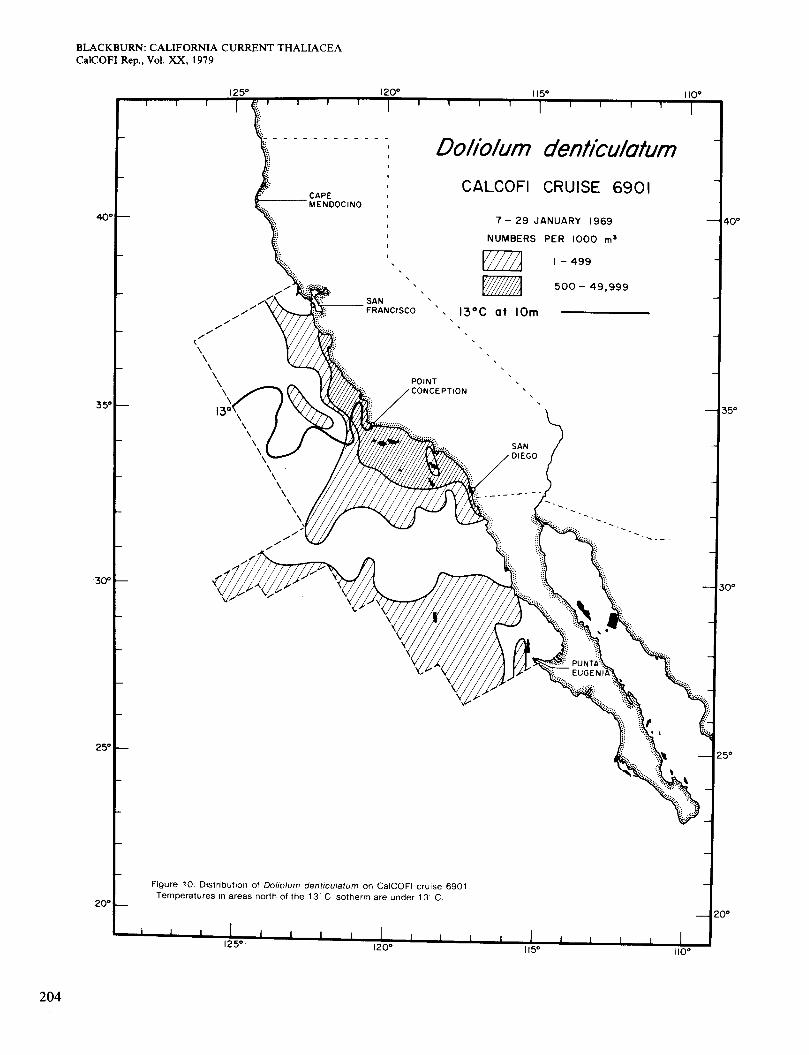
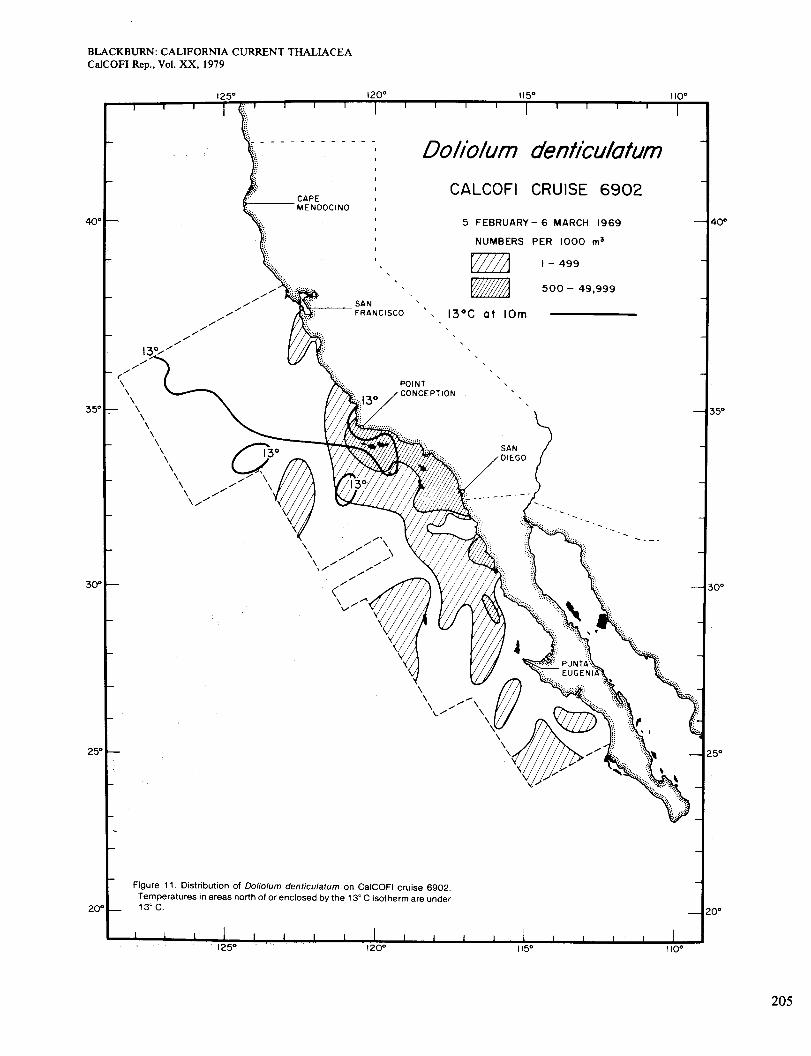
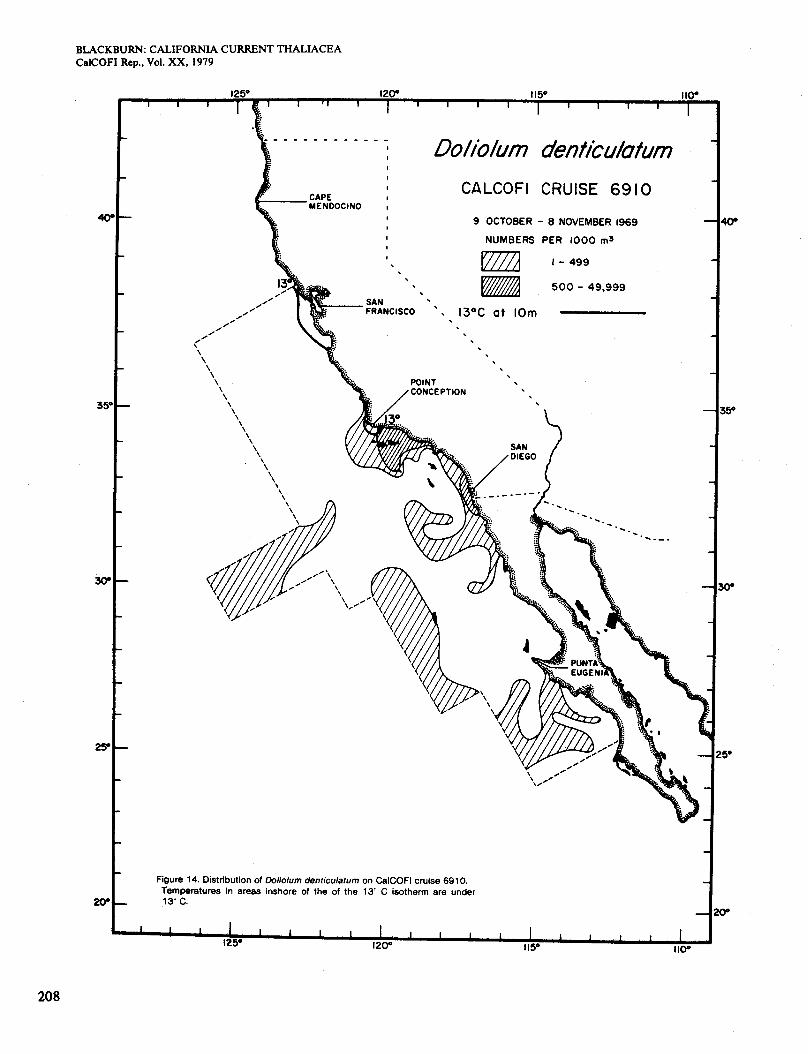
th is species characteristic of Central Pacific water, which contributes to the California Current by horizontal mix- ing from the west (Reid et al. 1958). Thus Doliolum enters the current system from the west, not from the north as Dolioletta does. In Berner's material from the region of Figure 1, it occurred at stations where mixed- layer temperatures ranged from 10.6" to 23.5"C and averaged 15" to 21°C. Berner and Reid considered its areal distribution to be limited by some 10-m tempera- ture slightly below 14" or 15". They used the 14" iso- therm at 10 m as an indicator of the limit of distribution. In their charts and mine, the winter occurrence of Dolio- lum can be quite extensive on the cool side of the 14" and even the 13" isotherm. The 13" isotherm seems to de- limit the distribution better than any other throughout the year and is shown in Figures 10 to 14. Data on vertical distribution from various sources indicate that Doliolum is most common at 0-100 m, especially 0-50 m (Berner 1957; Berner and Reid 1961). Thus concentrations shown in Figures 10 to 14 at stations very close inshore are too high relative to those at other stations for reasons given under Dolioletta.
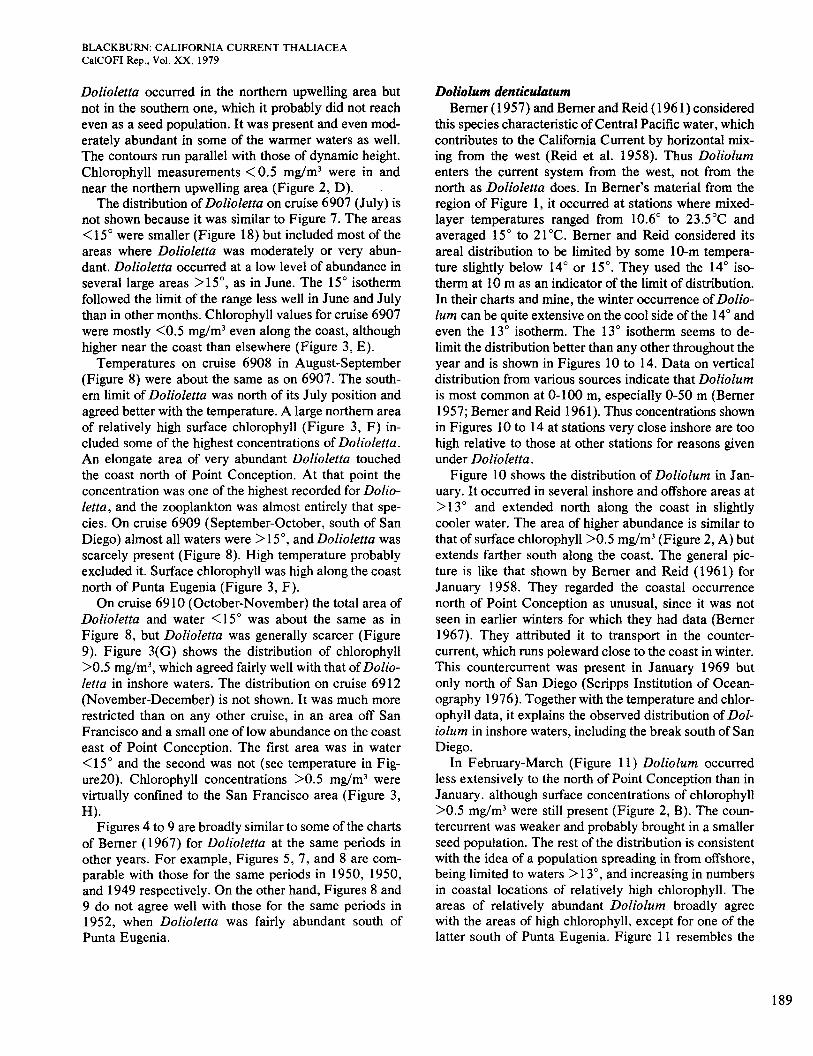
Figure 10 shows the distribution of Doliolum in Jan- uary. It occurred in several inshore and offshore areas at >13" and extended north along the coast in slightly cooler water. The area of higher abundance is similar to that of surface chlorophyll >OS mg/m3 (Figure 2, A) but extends farther south along the coast. The general pic- ture is like that shown by Bemer and Reid (196 1) for January 1958. They regarded the coastal occurrence north of Point Conception as unusual, since it was not seen in earlier winters for which they had data (Berner 1967). They attributed it to transport in the counter- current, which runs poleward close to the coast in winter. This countercurrent was present in January 1969 but only north of San Diego (Scripps Institution of Ocean- ography 1976). Together with the temperature and chlor- ophyll data, it explains the observed distribution of Dol- iolum in inshore waters, including the break south of San Diego.
In February-March (Figure 11) Doliolum occurred less extensively to the north of Point Conception than in January. although surface concentrations of chlorophyll > O S mg/m3 were still present (Figure 2, B). The coun- tercurrent was weaker and probably brought in a smaller seed population. The rest of the distribution is consistent with the idea of a population spreading in from offshore, being limited to waters > 13", and increasing in numbers in coastal locations of relatively high chlorophyll. The areas of relatively abundant Doliolum broadly agree with the areas of high chlorophyll, except for one of the latter south of Punta Eugenia. Figure 11 resembles the
189
BLACKBURN: CALIFORNIA CURRENT THALIACEA CalCOFI Rep., Vol. XX, 1979
chart for March 1958 but is quite unlike that for March 1949 when no Doliolum occurred inshore (Berner and Reid 1961). Berner and Reid pointed out that tempera- tures were higher in 1958 than in the years 1949 to 1956.
The distribution of Doliolum for April is not shown here. The species occurred in patches over most of the area from Point Conception to Punta Eugenia, both off- shore and inshore, where almost all temperatures were >13". Highest concentrations were close to the coast in areas of high chlorophyll, which are shown in Figure 2, C. The chart for April 1958 by Berner and Reid is comparable but shows a more continuous distribution over the same area. Charts for April of 1949 and 1954 show no inshore occurrence (Berner 1967).
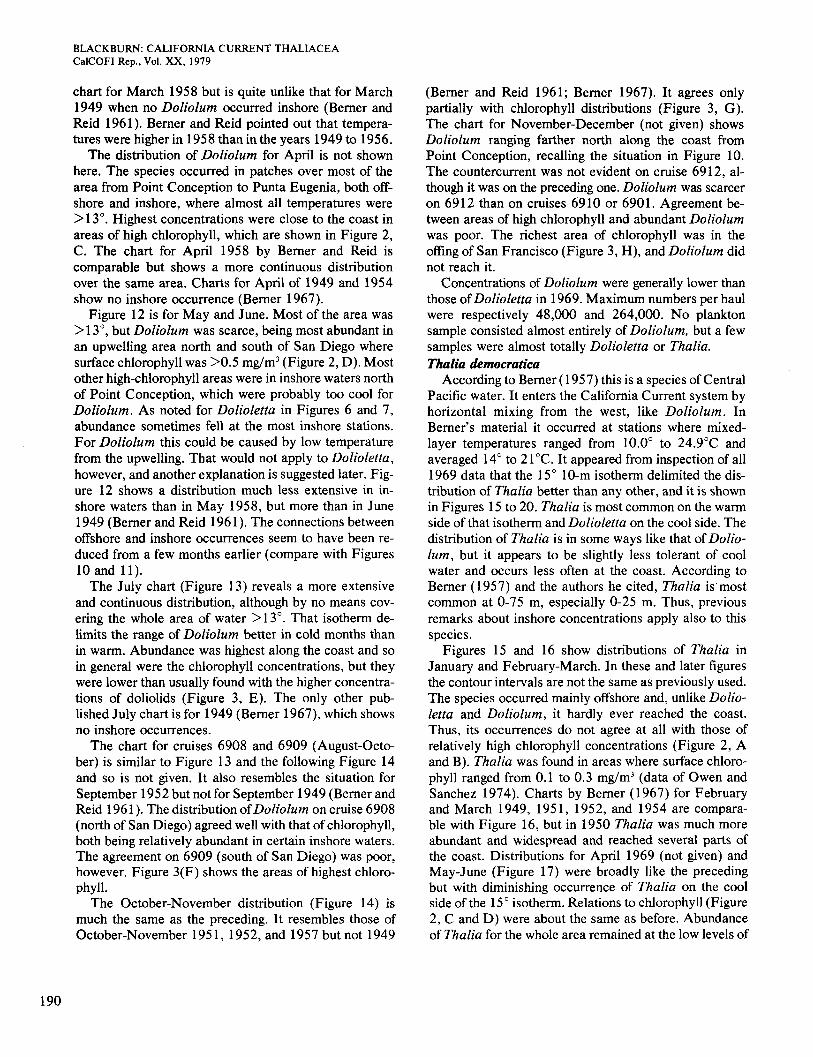
Figure 12 is for May and June. Most of the area was > 1 3", but Doliolum was scarce, being most abundant in an upwelling area north and south of San Diego where surface chlorophyll was >0.5 mg/m3 (Figure 2, D). Most other high-chlorophyll areas were in inshore waters north of Point Conception, which were probably too cool for Doliolum. As noted for Dolioletta in Figures 6 and 7, abundance sometimes fell at the most inshore stations. For Doliolum this could be caused by low temperature from the upwelling. That would not apply to Dolioletta, however, and another explanation is suggested later. Fig- ure 12 shows a distribution much less extensive in in- shore waters than in May 1958, but more than in June 1949 (Berner and Reid 196 1) . The connections between offshore and inshore occurrences seem to have been re- duced from a few months earlier (compare with Figures 10 and 11) .
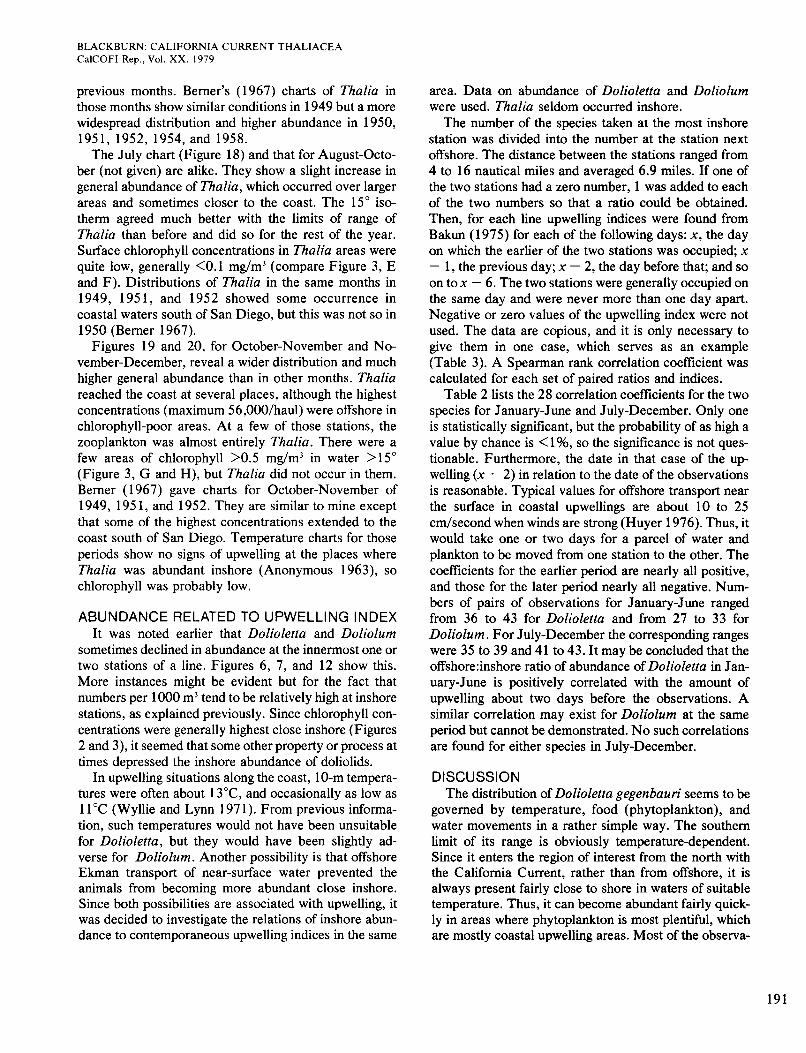
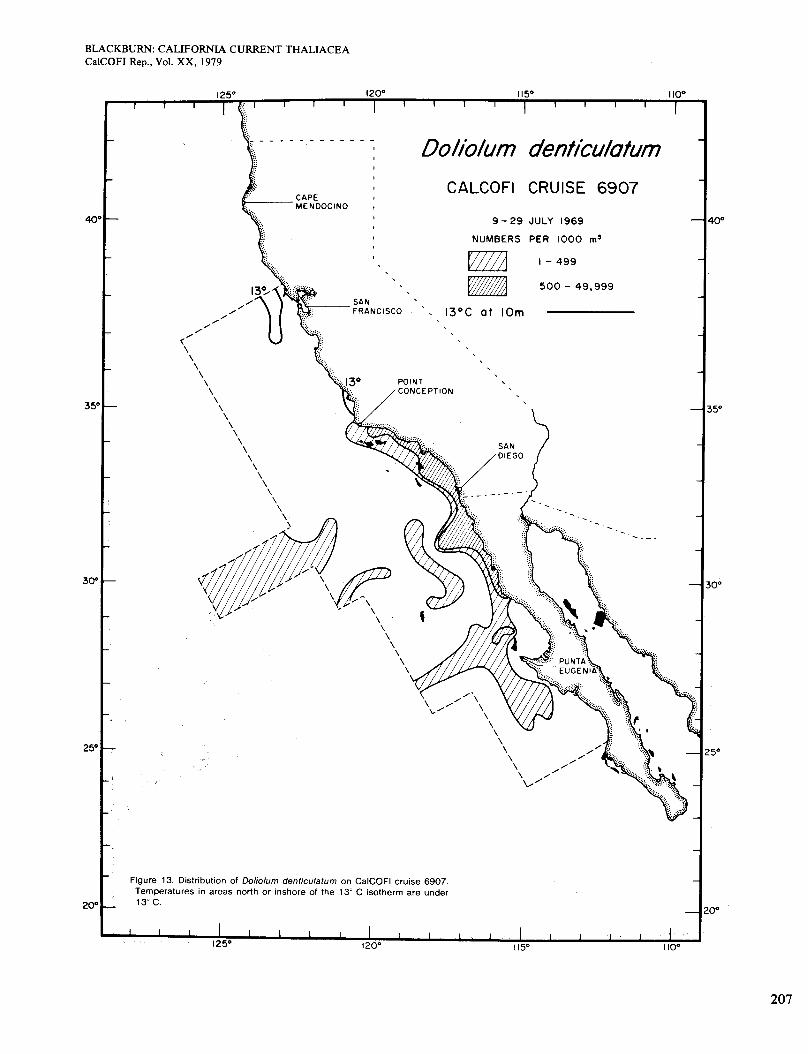
The July chart (Figure 13) reveals a more extensive and continuous distribution, although by no means cov- ering the whole area of water >13". That isotherm de- limits the range of Doliolum better in cold months than in warm. Abundance was highest along the coast and so in general were the chlorophyll concentrations, but they were lower than usually found with the higher concentra- tions of doliolids (Figure 3, E). The only other pub- lished July chart is for 1949 (Berner 1967), which shows no inshore occurrences.
The chart for cruises 6908 and 6909 (August-Octo- ber) is similar to Figure 13 and the following Figure 14 and so is not given. It also resembles the situation for September 1952 but not for September 1949 (Berner and Reid 1961). The distribution ofDoliolum on cruise 6908 (north of San Diego) agreed well with that of chlorophyll, both being relatively abundant in certain inshore waters. The agreement on 6909 (south of San Diego) was poor, however. Figure 3(F) shows the areas of highest chloro- phyll.
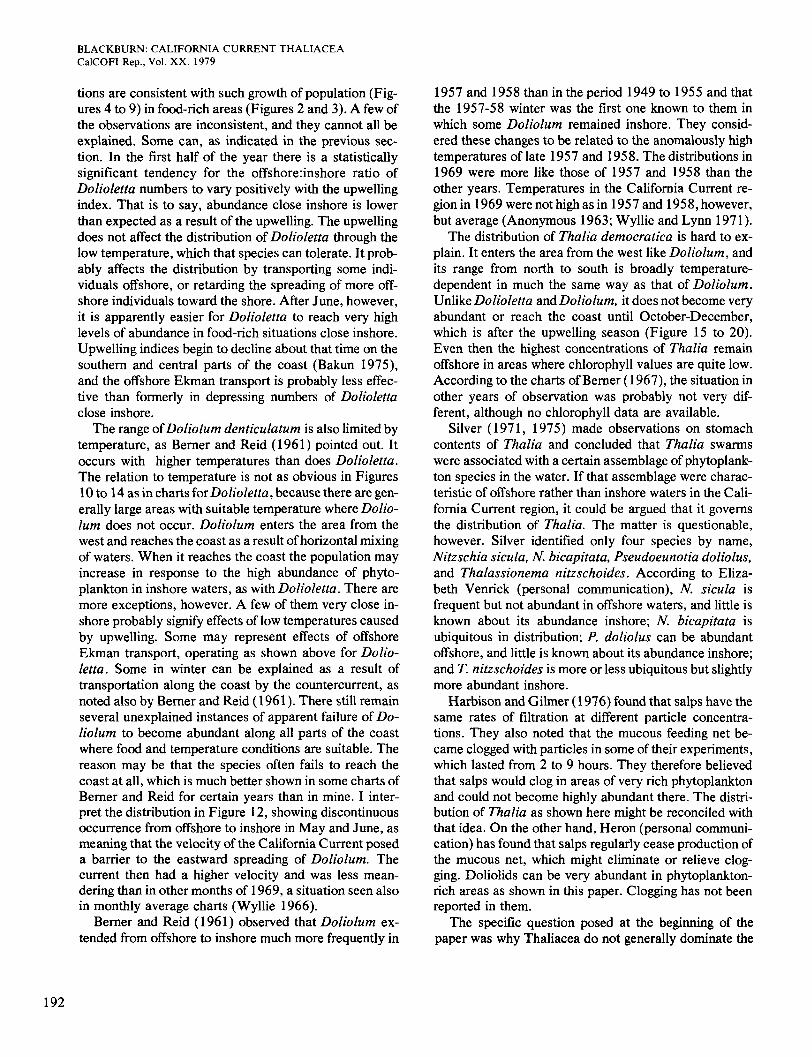
The October-November distribution (Figure 14) is much the same as the preceding. It resembles those of October-November 195 1 , 1952, and 1957 but not 1949
(Berner and Reid 1961; Berner 1967). It agrees only partially with chlorophyll distributions (Figure 3, G). The chart for November-December (not given) shows Doliolum ranging farther north along the coast from Point Conception, recalling the situation in Figure 10. The countercurrent was not evident on cruise 6912, al- though it was on the preceding one. Doliolum was scarcer on 6912 than on cruises 6910 or 6901. Agreement be- tween areas of high chlorophyll and abundant Doliolum was poor. The richest area of chlorophyll was in the offing of San Francisco (Figure 3, H), and Doliolum did not reach it.
Concentrations of Doliolum were generally lower than those of Dolioletta in 1969. Maximum numbers per haul were respectively 48,000 and 264,000. No plankton sample consisted almost entirely of Doliolum, but a few samples were almost totally Dolioletta or Thalia. Thalia democratica
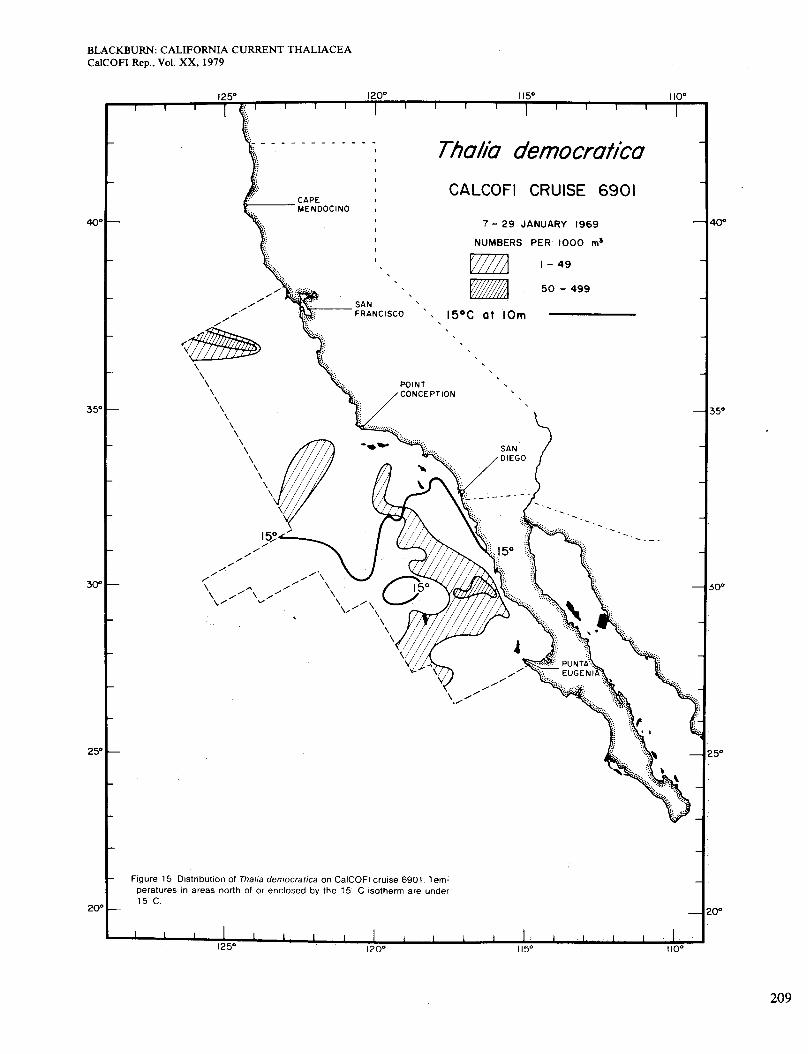
According to Berner ( 195 7) this is a species of Central Pacific water. It enters the California Current system by horizontal mixing from the west, like Doliolum. In Berner's material it occurred at stations where mixed- layer temperatures ranged from 10.0" to 24.9"C and averaged 14" to 2 1 "C. It appeared from inspection of all 1969 data that the 15" 10-m isotherm delimited the dis- tribution of Thalia better than any other, and it is shown in Figures 15 to 20. Thalia is most common on the warn side of that isotherm and Dolioletta on the cool side. The distribution of Thalia is in some ways like that of Dolio- lum, but it appears to be slightly less tolerant of cool water and occurs less often at the coast. According to Berner (1957) and the authors he cited, Thalia is'most common at 0-75 m, especially 0-25 m. Thus, previous remarks about inshore concentrations apply also to this species.
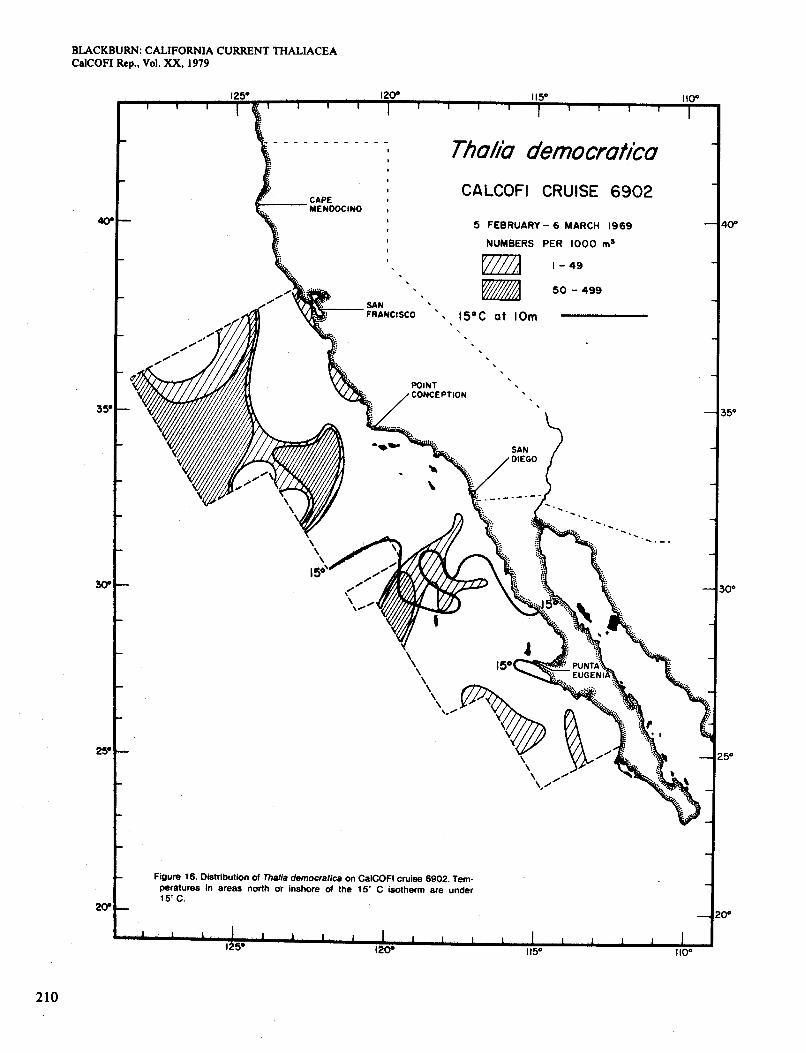
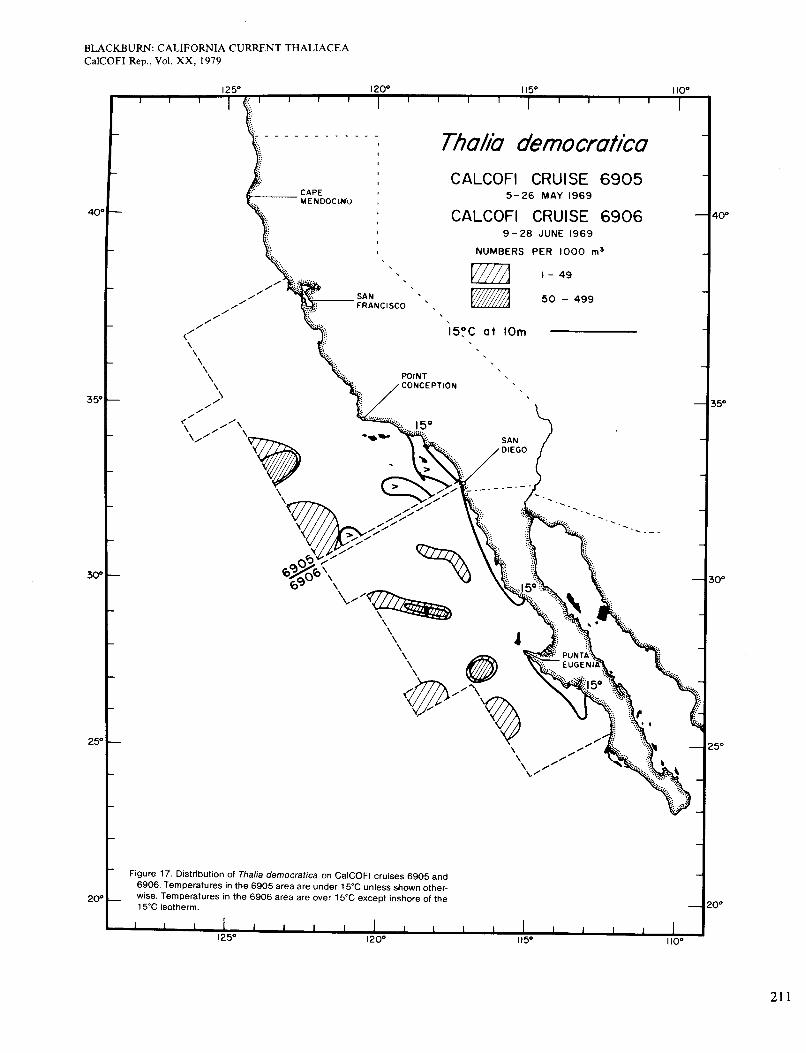
Figures 15 and 16 show distributions of Thalia in January and February-March. In these and later figures the contour intervals are not the same as previously used. The species occurred mainly offshore and, unlike Dolio- letta and Doliolum, it hardly ever reached the coast. Thus, its occurrences do not agree at all with those of relatively high chlorophyll concentrations (Figure 2, A and B). Thalia was found in areas where surface chloro- phyll ranged from 0.1 to 0.3 mg/m3 (data of Owen and Sanchez 1974). Charts by Berner (1967) for February and March 1949, 1951, 1952, and 1954 are compara- ble with Figure 16, but in 1950 Thalia was much more abundant and widespread and reached several parts of the coast. Distributions for April 1969 (not given) and May-June (Figure 17) were broadly like the preceding but with diminishing occurrence of Thalia on the cool side of the 15" isotherm. Relations to chlorophyll (Figure 2, C and D) were about the same as before. Abundance of Thalia for the whole area remained at the low levels of
190
BLACKBURN: CALIFORNIA CURRENT THALIACEA CalCOFI Rep., Vol. XX, 1979
previous months. Berner's (1967) charts of Thalia in those months show similar conditions in 1949 but a more widespread distribution and higher abundance in 1950, 1951, 1952, 1954, and 1958.
The July chart (Figure 18) and that for August-Octo- ber (not given) are alike. They show a slight increase in general abundance of Thalia, which occurred over larger areas and sometimes closer to the coast. The 15" iso- therm agreed much better with the limits of range of Thalia than before and did so for the rest of the year. Surface chlorophyll concentrations in Thalia areas were quite low, generally <0.1 mg/m3 (compare Figure 3, E and F). Distributions of Thalia in the same months in 1949, 1951, and 1952 showed some occurrence in coastal waters south of San Diego, but this was not so in 1950 (Berner 1967).
Figures 19 and 20, for October-November and N e vember-December, reveal a wider distribution and much higher general abundance than in other months. Thalia reached the coast at several places, although the highest concentrations (maximum 56,00O/haul) were offshore in chlorophyll-poor areas. At a few of those stations, the zooplankton was almost entirely Thalia. There were a few areas of chlorophyll > O S mg/m3 in water >15" (Figure 3, G and H), but Thalia did not occur in them. Berner (1967) gave charts for October-November of 1949, 195 1, and 1952. They are similar to mine except that some of the highest concentrations extended to the coast south of San Diego. Temperature charts for those periods show no signs of upwelling at the places where Thalia was abundant inshore (Anonymous 1963), so chlorophyll was probably low.
ABUNDANCE RELATED TO UPWELLING INDEX It was noted earlier that Dolioletta and Doliolum
sometimes declined in abundance at the innermost one or two stations of a line. Figures 6, 7, and 12 show this. More instances might be evident but for the fact that numbers per 1000 m3 tend to be relatively high at inshore stations, as explained previously. Since chlorophyll con- centrations were generally highest close inshore (Figures 2 and 3), it seemed that some other property or process at times depressed the inshore abundance of doliolids.
In upwelling situations along the coast, 10-m tempera- tures were often about 13"C, and occasionally as low as 11°C (Wyllie and Lynn 1971). From previous informa- tion, such temperatures would not have been unsuitable for Dolioletta, but they would have been slightly ad- verse for Doliolum. Another possibility is that offshore Ekman transport of near-surface water prevented the animals from becoming more abundant close inshore. Since both possibilities are associated with upwelling, it was decided to investigate the relations of inshore abun- dance to contemporaneous upwelling indices in the same
area. Data on abundance of Dolioletta and Doliolum were used. Thalia seldom occurred inshore.
The number of the species taken at the most inshore station was divided into the number at the station next offshore. The distance between the stations ranged from 4 to 16 nautical miles and averaged 6.9 miles. If one of the two stations had a zero number, 1 was added to each of the two numbers so that a ratio could be obtained. Then, for each line upwelling indices were found from Bakun (1975) for each of the following days: x, the day on which the earlier of the two stations was occupied; x - 1, the previous day; x - 2, the day before that; and so on to x - 6. The two stations were generally occupied on the same day and were never more than one day apart. Negative or zero values of the upwelling index were not used. The data are copious, and it is only necessary to give them in one case, which serves as an example (Table 3). A Spearman rank correlation coefficient was calculated for each set of paired ratios and indices.
Table 2 lists the 28 correlation coefficients for the two species for January-June and July-December. Only one is statistically significant, but the probability of as high a value by chance is < 1 %, so the significance is not ques- tionable. Furthermore, the date in that case of the u p welling (x - 2) in relation to the date of the observations is reasonable. Typical values for offshore transport near the surface in coastal upwellings are about 10 to 25 cmhecond when winds are strong (Huyer 1976). Thus, it would take one or two days for a parcel of water and plankton to be moved from one station to the other. The coefficients for the earlier period are nearly all positive, and those for the later period nearly all negative. Num- bers of pairs of observations for January-June ranged from 36 to 43 for Dolioletta and from 27 to 33 for Doliolum . For July-December the corresponding ranges were 35 to 39 and 41 to 43. It may be concluded that the 0ffshore:inshore ratio of abundance of Dolioletta in Jan- uary-June is positively correlated with the amount of upwelling about two days before the observations. A similar correlation may exist for Doliolum at the same period but cannot be demonstrated. No such correlations are found for either species in July-December.
DISCUSSION The distribution of Dolioletta gegenbaun' seems to be
governed by temperature, food (phytoplankton), and water movements in a rather simple way. The southern limit of its range is obviously temperature-dependent. Since it enters the region of interest from the north with the California Current, rather than from offshore, it is always present fairly close to shore in waters of suitable temperature. Thus, it can become abundant fairly quick- ly in areas where phytoplankton is most plentiful, which are mostly coastal upwelling areas. Most of the observa-
191
BLACKBURN: CALIFORNIA CURRENT THALIACEA CalCOFI Rep., Vol. XX, 1979
tions are consistent with such growth of population (Fig- ures 4 to 9) in food-rich areas (Figures 2 and 3). A few of the observations are inconsistent, and they cannot all be explained. Some can, as indicated in the previous sec- tion. In the first half of the year there is a statistically significant tendency for the 0ffshore:inshore ratio of Dolioletta numbers to vary positively with the upwelling index. That is to say, abundance close inshore is lower than expected as a result of the upwelling. The upwelling does not affect the distribution of Dolioletta through the low temperature, which that species can tolerate. It prob- ably affects the distribution by transporting some indi- viduals offshore, or retarding the spreading of more off- shore individuals toward the shore. After June, however, it is apparently easier for Dolioletta to reach very high levels of abundance in food-rich situations close inshore. Upwelling indices begin to decline about that time on the southern and central parts of the coast (Bakun 1975), and the offshore Ekman transport is probably less effec- tive than formerly in depressing numbers of Dolioletta close inshore.
The range ofDoliolum denticulatum is also limited by temperature, as Berner and Reid (1961) pointed out. It occurs with higher temperatures than does Dolioletta. The relation to temperature is not as obvious in Figures 10 to 14 as in charts for Dolioletta, because there are gen- erally large areas with suitable temperature where Dolio- lum does not occur. Doliolum enters the area from the west and reaches the coast as a result of horizontal mixing of waters. When it reaches the coast the population may increase in response to the high abundance of phyto- plankton in inshore waters, as with Dolioletta. There are more exceptions, however. A few of them very close in- shore probably signify effects of low temperatures caused by upwelling. Some may represent effects of offshore Ekman transport, operating as shown above for Dolio- letta. Some in winter can be explained as a result of transportation along the coast by the countercurrent, as noted also by Berner and Reid (1961). There still remain several unexplained instances of apparent failure of Do- liolum to become abundant along all parts of the coast where food and temperature conditions are suitable. The reason may be that the species often fails to reach the coast at all, which is much better shown in some charts of Berner and Reid for certain years than in mine. I inter- pret the distribution in Figure 12, showing discontinuous occurrence from offshore to inshore in May and June, as meaning that the velocity of the California Current posed a barrier to the eastward spreading of Doliolum. The current then had a higher velocity and was less mean- dering than in other months of 1969, a situation seen also in monthly average charts (Wyllie 1966).
Berner and Reid (1961) observed that Doliolum ex- tended from offshore to inshore much more frequently in
1957 and 1958 than in the period 1949 to 1955 and that the 1957-58 winter was the first one known to them in which some Doliolum remained inshore. They consid- ered these changes to be related to the anomalously high temperatures of late 1957 and 1958. The distributions in 1969 were more like those of 1957 and 1958 than the other years. Temperatures in the California Current re- gion in 1969 were not high as in 195 7 and 195 8, however, but average (Anonymous 1963; Wyllie and Lynn 1971).
The distribution of Thalia democratica is hard to ex- plain. It enters the area from the west like Doliolum, and its range from north to south is broadly temperature- dependent in much the same way as that of Doliolum. Unlike Dolioletta and Doliolum, it does not become very abundant or reach the coast until October-December, which is after the upwelling season (Figure 15 to 20). Even then the highest concentrations of Thalia remain offshore in areas where chlorophyll values are quite low. According to the charts of Berner (1 967), the situation in other years of observation was probably not very dif- ferent, although no chlorophyll data are available.
Silver (1971, 1975) made observations on stomach contents of Thalia and concluded that Thalia swarms were associated with a certain assemblage of phytoplank- ton species in the water. If that assemblage were charac- teristic of offshore rather than inshore waters in the Cali- fornia Current region, it could be argued that it governs the distribution of Thalia. The matter is questionable, however. Silver identified only four species by name, Nitzschia sicula, N. bicapitata, Pseudoeunotia doliolus, and Thalassionema nitzschoides. According to Eliza- beth Venrick (personal communication), N. sicula is frequent but not abundant in offshore waters, and little is known about its abundance inshore; N. bicapitata is ubiquitous in distribution; P. doliolus can be abundant offshore, and little is known about its abundance inshore; and T. nitzschoides is more or less ubiquitous but slightly more abundant inshore.
Harbison and Gilmer (1976) found that salps have the same rates of filtration at different particle concentra- tions. They also noted that the mucous feeding net be- came clogged with particles in some of their experiments, which lasted from 2 to 9 hours. They therefore believed that salps would clog in areas of very rich phytoplankton and could not become highly abundant there. The distri- bution of Thalia as shown here might be reconciled with that idea. On the other hand, Heron (personal communi- cation) has found that salps regularly cease production of the mucous net, which might eliminate or relieve clog- ging. Doliolids can be very abundant in phytoplankton- rich areas as shown in this paper. Clogging has not been reported in them.
The specific question posed at the beginning of the paper was why Thaliacea do not generally dominate the
192
BLACKBURN: CALIFORNIA CURRENT THALIACEA CalCOFI Rep., Vol. XX, 1979
zooplankton in coastal upwelling situations in the Cali- fornia Current region. For Dolioletta gegenbauri, the answer is that offshore Ekman transport prevents the spe- cies from becoming dominant in the early part of the u p welling season, although it sometimes does become domi- nant later. The answer for Doliolum denticulatum is probably that the velocity of the California Current makes it hard for the species to reach the coast from offshore in the upwelling season; and when it does arrive it is some- times excluded from the inshore waters by very low tem- perature, and perhaps also by the offshore transport. No explanation can be given with confidence for Thalia democrutica, but a possible one is that the most suitable diet consists of species of phytoplankton that generally occur offshore.
ACKNOWLEDGMENTS I am indebted to Leo Berner and Andrew Heron for
critically reading this paper. Some of the sorting of Thali- acea from the plankton was done by staff of the Biomass Laboratory of the Scripps Institution of Oceanography. George Snyder was helpful in bringing plankton samples from storage as needed. The work was supported by National Science Foundation Grant DES75-13843.
REFERENCES Anonymous. 1963. CalCOFI atlas of 10-meter temperatures and salin-
ities, 1949 through 1959. Calif. Coop. Oceanic Fish. Invest., Atlas 1. Bakun, A. 1975. Daily and weekly upwelling indices, west coast of
North America, 1967-73. NOAA Tech. Rep. NMFS SSRF-693, 114 p.
Berner, L.D. 1957. Studies on the Thaliacea of the temperate north- east Pacific Ocean. Doctoral dissertation, Scripps Institution of Oceanography, Univ. Calif. San Diego, La Jolla, CA., 144 p.
Berner, L.D. 1967. Distributional atlas of Thaliacea in the California Current region. Calif. Coop. Oceanic Fish. Invest., Atlas 8, charts
Berner, L.D., and J.L. Reid. 1961. On the response to changing temper- ature of the temperature-limited plankter Doliolum denticulatum Quoy and Gaimard 1835. Limnol. Oceanogr., 6: 205-215.
Blackburn, M. 1979. Zooplankton in an upwelling area off northwest Africa: composition, distribution and ecology. DeepSea Res., 26A:
De Decker, A. 1973. Agulhas Bank plankton. In: The biology of the Indian Ocean, B. Zeitzschel, ed., Springer-Verlag, Berlin, p. 189-219.
Fleminger, A., J.D. Isaacs, and J.G. Wyllie. 1974. Zooplankton bio- mass measurements from CalCOFI cruises of July 1955 to 1959 and remarks on comparison with results from October, January and April cruises of 1955 to 1959. Calif. Coop. Oceanic Fish. Invest., Atlas 21, charts 1-118.
Foxton, P. 1961. Salpa fusiformis Cuvier and related species. Dis- covery Rep. 32: 3-32.
Fraser, J.H. 1961. The role of ctenophores and salps in zooplankton production and standing crop. Cons. Perm. Internat. Explor. Mer, Rapp. Proc. Verb., 153: 121-123.
Furnestin, M.L. 1950. Rapport sur le plancton. Cons. Perm. Internat. Explor. Mer, Rapp. Proc. Verb., 159: 90-115.
1-322.
41-56.
Hamner, W.M., L.P. Madin, A.L. Alldredge, R.W. Gilmer, and P.P. Hamner. 1975. Underwater observations of gelatinous zooplankton: sampling problems, feeding biology, and behavior. Limnol. Oceanogr.,
Harbison, G.R., and R.W. Gilmer. 1976. The feeding rates of the pelagic tunicate Pegea confoederafa and two other salps. Limnol. Oceanogr., 21: 517-528.
Heron, A.C. 1972a. Population ecology of a colonizing species: the pelagic tunicate Thalia democratica. I. Individual growth rate and generation time. Oecologia, 10: 269-293.
Heron, A.C. 1972b. Population ecology of a colonizing species: the pelagic tunicate Thalia democratica. 11. Population growth rate. Oecologia, 10: 294-312.
Heron, A.C. 1973. A specialized predator-prey relationship between the copepod Sapphirina angusfa and the pelagic tunicate Thalia democrutica. J . Mar. Biol. Assoc. U.K., 53: 429-435.
Humphrey, G.F. 1963. Seasonal variations in plankton pigments in waters off Sydney. Aust. J. Mar. Freshw. Res., 14: 24-36.
Huyer, A. 1976. A comparison of upwelling events in two locations: Oregon and northwest Africa. J. Mar. Res., 34: 531-546.
Isaacs, J.D., A. Fleminger, and J.K. Miller. 1969. Distributional atlas of zooplankton biomass in the California Current region: winter 1955- 1959. Calif. Coop. Oceanic Fish. Invest., Atlas 10 charts 1-252.
Isaacs, J.D., A. Fleminger, and J.K. Miller. 1971. Distributional atlas of zooplankton biomass in the California Current region: winter 1955- 1959. Calif. Coop. Oceanic Fish. Invest., Atlas 14, charts 1-122.
McEwen, G.F., M.W. Johnson, and T.R. Folsom. 1954. A statistical analysis of the performance of the Folsom Plankton Sample Splitter, based on test observations. Arch. Meteor. Geophys. Bioklim., Ser. A:
Meteor. Geophys., 7: 502-527. Madin, L.P. 1974. Field observations on the feeding behavior of salps
(Tunicata: Thaliacea). Mar. Biol., 25: 143-147. Owen, R.W. 1974. Distribution of primary production, plant pigments
and Secchi depth in the California Current region, 1969. Calif. Coop. Oceanic Fish. Invest., Atlas 20, charts 98-117.
Owen, R.W., and C.K. Sanchez. 1974. Phytoplankton pigment and p r e duction measurements in the California Current region, 1969-72. Nat. Mar. Fish. Serv., Data Rep. 91, 185 p.
Reid, J.L., G.I. Roden, and J.G. Wyllie. 1958. Studies of the California Current system. Calif. Coop. Oceanic Fish. Invest. Progr. Rep. 1956-
Scripps Institution of Oceanography. 1976. Physical and chemical data, CalCOFI cruise 6901 and CalCOFI cruise 6902. Data Rep., SI0 Ref. 76-14, 196 p.
Sheard, K. 1965. Species groups in the zooplankton of eastern Australian slope waters, 1938-41. Aust. J. Mar. Freshw. Res., 16: 219-254.
Silver, M.W. 1971. The habitat ofSalpafitsiformis (Ch0rdata:Tunicata) in the California Current as defined by stomach content studies, and the effect of salp swarms on the food supply of the plankton commun- ity. Doctoral dissertation, Scripps Institution of Oceanography, Univ. Calif. San Diego, La Jolla, CA. 135 p.
Silver, M.W. 1975. The habitat of Salpa fusiformis in the California Current as defined by indicator assemblages. Limnol. Oceanogr.,
Smith, P.E. 1974. Distribution of zooplankton volumes in the California Current region, 1969. Calif. Coop. Oceanic Fish. Invest., Atlas 20, charts 118-125.
Thompson. H. 1948. Pelagic Tunicates of Australia, C.S.I.R. Mel- bourne, Australia, 196 p., 75 pl.
Tranter, D.J. 1962. Zooplankton abundance in Australasian waters. Aust. J . Mar. Freshw. Res., 13: 106-142.
2 0 907-917.
1958: 27-56.
2 0 230-237.
193
BLACKBURN: CALIFORNIA CURRENT THALIACEA CalCOFI Rep., Vol. XX, 1979
Wyllie, J.G. 1966. Geostrophic flow of the California Current at the surface and at 200 meters. Calif. Coop. Oceanic Fish. Invest., Atlas 4, charts 1-288.
Wyllie, J.G. and R.J. Lynn. 1971. Distribution of temperature and salinity at 10 meters, 1960-1969 and mean temperature, salinity and oxygen at 150 meters, 1950-1968 in the California Current. Calif. Coop. Oceanic Fish. Invest., Atlas 15, charts 1-188.
194

BLACKBURN: CALIFORNIA CURRENT THALIACEA CalCOFI Rep., Vol. XX, 1979
10
15
io'
15
!O
130' 125' I200 115' 1100 1
1 I I I I I I
I \ ' 1 I I 1 I I 1 1 I I I 1
Figure 1 -
I
I
I \
\
\
\
\
\
\
\
\
, Station positions occupied on CalCOFl cruises.
CALCOFI
B A S I C STATION P L A N SINCE 1950
I I I I I I I I 125. I200 115. I I C 130'
CALCOFI B A S I C S T A T I O N P L A N SINCE 1950
100
35'
30'
25"
200
195
BLACKBURN: CALIFORNIA CURRENT THALIACEA CalCOFI Rep., Vol. XX, 1979
Figure 2. Areas of surface chlorophyll a 20.5 mg/m3 shown by hatching on the following CalCOFl cruises: 6901 (A), 6902 (B), 6904 (C) and 6905-6906 (D)
196
BLACKBURN: CALIFORNIA CURRENT THALIACEA CalCOFI Rep., Vol. XX, 1979
197
BLACKBURN: CALIFORNIA CURRENT THALIACEA CalCOFI Rep., Vol. XX, 1979
I I I
40
3 5'
304
\
25'
20(
I
125O I200 115O I100 1 I I I I I I 1 I I I I I I 1 I
Do/io/effu gegenbuuri CALCOFI CRUISE 6901
7 - 2 9 JANUARY 1969
NUMBERS PER 1000 ms
Figure 4 Distribution of Doliolefta gegenbaun on CalCOFl cruise 6901 Temperatures in areas north of or enclosed by the 15 C isotherm are under 15 C
198
BLACKBURN: CALIFORNIA CURRENT T H A L I A C E A CalCOFI Rep., Vol. XX, 1979
4c
35
30
25
20
125O I200 1 1 5 O I100 I I I 1 1 I I I 1 I 1 1 1 1
Figure 5. Distribution of Dolioletta gegenbauri on CalCOFl cruise 6902. Temperatures in areas north or inshore of the 15" C isotherm are under
- 15°C.
I I I I I I 1 1 I I I 1 1 I 1 I I 125O 1200 115" I100
199
BLACKBURN: CALIFORNIA CURRENT THALIACEA CalCOFI Rep., Vol. XX, 1979
40
35
30
25
2c
125O 1200 115' I100 1 1 I I 1 I I I I I 1 I 1 I 1
I
I CALCOFI CRUISE 6904 CAPE MENDOCINO I
8
0 2 -20 APRIL 1969
NUMBERS PER 1000 ma
m7 1-499
5 0 0 - 49.999
SAN FRANCISCO ' . 15OC at IOm
Figure 6. Distribution of Doliolefta gegenbaun on CalCOFl cruise 6904. Temperatures in areas north or inshore of or enclosed by the 15" C isotherm are under 15" C unless shown otherwise.
1 I I 1 I I I I 1 I 1 I 1 I 1 I I I I200 I I 5 O I100 125"
200
BLACKBURN: CALIFORNIA CURRENT THALIACEA CalCOFI Rep., Vol. XX, 1979
4c
35
30
25
2c
I
, I
CAPE MENOOCINO I
I
I
CALCOFI CRUISE 6905
CALCOFI CRUISE 6906 5 - 2 6 MAY 1969
9 - 2 8 JUNE 1969 , NUMBERS PER 1000 m3
125O I200 115O I100 I I 1 I 1 1 I I I I I I I 1 1 1
I I I 1 I I I I I 1 I 1 I I I I 1 125' I200 115' I I00
Figure 7. Distribution of Dolioletta gegenbauri on CalCOFl cruise 6905 and 6906. Temperatures in the 6905 area are under 15°C unless shown other-
wise. Temperatures in the 6906 area are over 15°C except inshore of the 15°C isotherm.
20 1
BLACKBURN: CALIFORNIA CURRENT THALIACEA CalCOFI Rep., Vol. XX, 1979
40
35
30
25'
20'
125' I200 115O 1100 I I I I I 1 I I I I I 1 I I I I I
I I I I 1 I I I I I 1 1 I I 1 I I I
1200 I I5O I100 125'
Figure 8 Distribution of Dolfoleffa gegenbaun on CalCOFl cruises 6908 and 6909 Temperatures in areas north or inshore of or enclosed by the 15 C isotherm are under 15 C
202

BLACKBURN: CALIFORNIA CURRENT THALIACEA CalCOFI Rep., Vol. XX, 1979
40
35
3c
2:
2(
125' I200 115O I100 I I I I I I 1 I I I I I I I I I
Figure 9 Distrlbutlon of Doholeffa gegenbaun on CalCOFl cruise 6910 Temperatures in areas north or inshore of the 15 C Isotherm are under 15 C
I I I 1 I 1 I I I 1 1 I 1 I I I I 125O 1200 115O I I00
203
BLACKBURN: CALIFORNIA CURRENT THALIACEA CalCOFI Rep., Vol. XX, 1979
4c
3:
30
25
20
125" 1200 I I5O I100 I I I I I I I I I I 1 I I I I 1
, I Do/io/um denficuotum
Figure 10 Distribution of DoOolurn denfwlafurn on CalCOFl cruise 6901 Temperatures in areas north of the 13 C isotherm are under 13 C
-
I I I 1 1 1 1 1 1 I I 1 I I I 1 I 115" i IO" 125O, 120"
40"
350
0"
5'
P
204
BLACKBURN: CALIFORNIA CURRENT THALIACEA CalCOFI Rep., Vol. XX, 1979
40'
3 5'
30
25
20
125" 120" 115" I IO' I I I I 1 I I I I I I 1 I I 1
_ _ _ _ _ _ _ _ _ _ _ _ I
I Doliolum den ficu/u fum
Figure 1 1 Distribution of Dolrolum denbculafum on CalCOFl crulse 6902 Temperatures in areas north of or enclosed by the 13" C isotherm are under
- 13°C
I 1 I I 1 I 1 1 I I I I I 1 I
125' 1200 I I5O I100
205

BLACKBURN: CALIFORNIA CURRENT THALIACEA CalCOFI Rep., Vol. XX, 1979
125" 120' 115O I10
I I I I 1 I 1 I 1 I I I I I 1 1 I
4(
35
30
25
20(
Figure 12. Distribution of Doliolum denticulatum on CalCOFl cruises 6905 and 6906. Temperatures in areas inshore of the 13" C isotherm are under 13" C.
I I I 1 1 I I 1 1 1 I I 1 I , I 1 I I I 5 O 1 1 0 . 1 2 5 O 1200
0
206
BLACKBURN: CALIFORNIA CURRENT THALIACEA CalCOFI Rep., Vol. XX, 1979
_ _ _ _ _ _ _ - - - - - - I Do/io/um denticu/utum I
I
I CALCOFI CRUISE 6907 CAPE MENDOCINO 9
9-29 JULY 1969
125" 1200 115O I100 I I I
-
-
400 - -
-
-
-
350 -
-
-
-
-
300 -
-
-
-
-
25O - - -
-
- Figure 13 Distribution of Doliolurn denficulaturn on CalCOFl cruise 6907 Temperatures in areas north or inshore of the 13" C isotherm are under 13" c 200 -
1 I I I I 1 I I 1 I 1 I I 1 I I 1 125O 1200 115O I100
207
BLACKBURN: CALIFORNIA CURRENT THALIACEA CalCOFI Rep., Vol. XX, 1979
25‘
I
I CALCOFI CRUISE 6910 CAPE I
MENDOCINO I
I
I 9 OCTOBER - 8 NOVEMBER 1969
I NUMBERS PER 1000 m3
I I - 499
I 500-49.999 SAN
”0” FRANCISCO ‘, 13OC at IOm /’
//’
;/’
\ \ \ \ \ POINT
Figure 14. Distribution of Doliolurn denricularum on CalCOFl cruise 6910. Temperatures in areas inshore of the of the 13’ C isotherm are under 13” c. m-
1 I I I I I I 1 I I I 1 1 I 1 1 , I , I I , 1150 1 1 0 . 125O 1200
208
BLACKBURN: CALIFORNIA CURRENT THALIACEA
400
350
30'
! 5"
0"
209
BLACKBURN: CALIFORNIA CURRENT THALIACEA CalCOFI Rep., Vol. XX, 1979
3 5'
3u
25'
2(r
125. 1200 I I5O I100 1 I 1 I I I I I I I I I 1 1 1 1 I
- I Thufiu democruficu - - - _ - - - - - - - - I
Figure 16. Distribution of Thelia dernocratica on CalCOFl cruise 6902. Tem- peratures in areas north or inshore of the 15" C isotherm are under 15" c. -
v ' I I . 1 I , 1 , 1 1 1 1 I 1 1 I I . I 1 I 120. I I 5 O 1 too
125'
,
210
BLACKBURN: CALIFORNIA CURRENT THALIACEA CalCOFI Rep., Vol. XX, 1979
I I I 1 I I
35
3c
125" I200 1 1 5 O I IO" I I 1 I 1 I 1 I I I I 1 I
Thuh democrufica I CALCOFI CRUISE 6905
CALCOFI CRUISE 6906 5-26 MAY 1969
I 9-28 JUNE 1969
I NUMBERS PER 1000 m'
1 - 4 9
SAN 5 0 - 499 , ,
FRANCISCO ' , , , 1': v.,::., _,
":.. .... "?,
15:C a t IOm
POINT CONCEPTION /
21 1
BLACKBURN: CALIFORNIA CURRENT THALIACEA CalCOFI Rep., Vol. XX, 1979
40
3 5'
25'
20c
125O 1200 1 1 5 O I100 I I 1 I I I I I I I I I I I I 1 I
8 Thufiu democraticu _ _ _ _ _ _ - - - - - - , I
CALCOFI CRUISE 6907
9 - 2 9 JULY 1969
NUMBERS PER 1000 m'
CONCEPTION
Figure 18. Distribution of Thalia democratica on CalCOFl cruise 6907. Tem- peratures in areas north or inshore of or enclosed by the 15°C isotherm are under 15 C.
I I I I I 1 1 I 1 I I I I I I I 1 I
1200 115" I IO" 125O
212
BLACKBURN: CALIFORNIA CURRENT THALIACEA CalCOFI Rep., Vol. XX, 1979
3 5'
3v
25'
20a
125O 1200 115O I I 1 1 I I I I I 1 1 1 I I 1
_ _ _ _ - - - - - - - - 0 Thuliu democmticu 6
I
CALCOFI CRUISE 6910 MENDOCINO I
9 OCTOBER - 8 NOVEMBER 1969
NUMBERS PER 1000 m 3
Figure 19. Distribution of Thalia democratica on CalCOFl cruise 6910. Tem- peratures in areas north or inshore of the 15°C isotherm are under 1 5"C, unless shown otherwise.
213

BLACKBURN: CALIFORNIA CURRENT THALIACEA CalCOFI Rep., Vol. XX, 1979
I 1 I 1 1 I
40
35
30
25
20
, I CALCOFI CRUISE 6912
15 NOVEMBER - 17 DECEMBER 1969 CAPE MENDOCINO 8
/ /
/
SAN 'RANCISCO ' ,
NUMBERS PER 1000 m3 vA 1-49
50 - 499
500 - 4,999
Figure 20. Distribution of Thalia democratica on CalCOFl cruise 6912. Tem- peratures in areas north or inshore of the 15°C isotherm are under 15°C.
214