Embed Size (px)
Citation preview
Clemson UniversityTigerPrints
All Theses Theses
12-2006
THATCH CONTROL, WINTER PAINTING,AND PLANT GROWTH REGULATORMANAGEMENT ON GOLF COURSEPUTTING GREENSSteven LongClemson University, [email protected]
Follow this and additional works at: https://tigerprints.clemson.edu/all_theses
Part of the Horticulture Commons
This Thesis is brought to you for free and open access by the Theses at TigerPrints. It has been accepted for inclusion in All Theses by an authorizedadministrator of TigerPrints. For more information, please contact [email protected].
Recommended CitationLong, Steven, "THATCH CONTROL, WINTER PAINTING, AND PLANT GROWTH REGULATOR MANAGEMENT ONGOLF COURSE PUTTING GREENS" (2006). All Theses. 9.https://tigerprints.clemson.edu/all_theses/9
THATCH CONTROL, WINTER PAINTING, AND PLANTGROWTH REGULATOR MANAGEMENT ON GOLF
COURSE PUTTING GREENS______________________________
A ThesisPresented to
the Graduate School ofClemson University
____________________________________
In Partial Fulfillmentof the Requirements for the Degree
Master of SciencePlant and Environmental Science
____________________________________
bySteven Herbert Long
December 2006____________________________________
Accepted by:Dr. Haibo Liu, Committee Chair
Dr. Bert McCartyDr. Ted Whitwell
Dr. Joe Toler
ABSTRACTS
Evaluating ‘Champion’ Bermudagrass in the Field with Various Rates of Nitrogen,Trinexapac-ethyl (Primo), and a Granular Thatch Reducer (Thatch-X)
Golf course putting green grasses normally receive stresses from increased traffic,
low heights of cut, high potentials to pests due to weakened resistance, and frequent
removal of clippings by losing viable food sources. Additionally, in the transition zone,
putting green grasses must cope with a broad range of temperatures which set up a unique
situation for the golf course manager in choosing the best putting green grass for these
stressful weather conditions. Their decision depends on a number of factors, of most
importance the turf management plan. The discovery of the perfect turf management
program drives turfgrass research to identify management practices which will stretch the
adaptation limits associated with both types of turfgrass for the highest quality.
A field experiment was conducted from June 2004 to June 2006 to investigate the
best management practices for reducing thatch accumulation and increasing root mass of
‘Champion’ bermudagrass (C. dactylon (L.) Pers. X C. transvaalensis Burtt-Davy). The
treatments included all factorial combinations of three rates of N [244 (low), 488
(medium), and 732 (high) kg ha-1 yr-1 over 20 applications], with and without
Trinexapac-ethyl (TE), and with and without Thatch-X. Nitrogen was applied biweekly
as ammonium sulfate, TE (1EC) was applied biweekly at 0.025 kg a.i. ha-1 following
each nitrogen application, and Thatch-X was applied once per growing season in July at
the label-recommended rate of 146 kg ha-1.
iii
The combination of TE and N resulted in a significant interaction for turf quality
in year 1. The application of TE with 244 kg N ha-1 yr-1 negatively affected turf quality.
Contrastingly, TE application with medium and high N rates routinely resulted in equal
or higher turf quality than the high N rate without TE. Best turf quality (TQ) was
attained with the high and medium N rates with TE in both years. Thatch-X did not
impact turf quality throughout the two-year study.
TE application initially reduced turf quality within 10 days of initial treatment
with the medium and low N rates in year 1. Four WAIT in year 1, TE applications
improved TQ ratings for the medium and high N rates, which continued for nearly all
ratings the remainder of the year.
The medium and high N rates showed consistently higher turf recovery ratings
than the low N rate, which did not provide adequate turf recovery following aerification.
TE application, however, reduced recovery of turfgrass following three out of four
aerifications. TE reduced recovery by 19 and 40% in July and September of year 1,
respectively, and by 26% in July of year 2.
Root mass was increased by 19% when the high N rate was applied versus the
low N rate in July of year 2. In September of year 2, root mass was increased by 22%
following the medium N rate and by 27% following the high N rate. Root mass increased
gradually over time for all treatments. Additionally, root N concentration increased
linearly with increased N rate. The high N rate consistently provided higher N content in
the root tissue compared to the low N rate. Root mass and root N concentration were not
significantly affected by TE or Thatch-X treatments.
iv
Clippings sampled revealed a linear increase in clipping yield as N rate increased.
Data revealed an average clipping yield increase of 209% for every 244 kg ha-1 yr-1
increase in N rate without TE. TE reduced clippings by an average of 131%. As N rates
increased, TE effectiveness for clipping reduction increased resulting in a curvilinear
relationship. Thatch-X had no impact on clipping yield. Similar to root nutrient analysis,
as N rate increased, N concentration within the leaf tissue increased for nearly all
samplings. TE nor Thatch-X affected N concentration in the leaf tissue.
Application of TE reduced thatch mass accumulation by the end of year 1, but not
in year 2. Conversely, thatch mass increased significantly by the end of year 1 with an
increase in N rate from low to high. Thatch-X produced no significant differences in
thatch mass throughout the two years of study.
Spring green-up was affected by N rate as the low rate provided the fastest
transition to bermudagrass, while green-up for the high rate was slowest. It is unclear
whether late winter, early spring, or both timings contributed to this occurrence. TE nor
Thatch-X had any impact on spring green-up.
Effects of Painting on Dormant Bermudagrass Putting Greens
In another two-year field experiment from November 2004 through June 2006,
the winter management of Champion bermudagrass putting greens with painting was
investigated. Current options for green color during the winter months on bermudagrass
include overseeding and painting. Painting of dormant bermudagrass putting greens has
recently become the number one alternative to overseeding greens for winter color. The
main objective of this study was to evaluate the effects of two brands of turf paints (Titan
v
and Missouri) applied either as 1 or 2 applications per season versus a control (no paint
and no overseed).
Paint application provided immediate, adequate paint quality regardless of brand.
Titan yielded higher paint quality in year 2 than Missouri and provided the most realistic
appearance. Missouri turf paint appeared blue upon application and never provided a
realistic bermudagrass or bentgrass appearance. One application of paint was deemed
unacceptable as paints faded following sun exposure, irrigation, rain, traffic, and mowing.
Two applications of paint per winter season sustained an average paint quality rating of
7.6, acceptable on the 1-9 paint quality scale.
Soil temperatures were increased with each paint brand, however, more
significantly with Titan. Application number affected soil temperatures of Missouri paint
with 2 applications providing increased soil temperatures over one application. Control
treatment consistently had lower soil temperatures than those of the treated plots,
regardless of number of paint applications or brand.
Spring green-up data revealed no differences between paint brands concerning
spring green-up rate. However, paint application of either brand did increase the rate of
spring green-up over the control. Two applications of paint per winter season increased
spring green-up compared to one application.
Evaluating ‘L-93’ Creeping Bentgrass with Various Rates of Potassium and Trinexapac-ethyl (Primo) under Greenhouse Conditions
A greenhouse experiment was conducted on ‘L-93’ creeping bentgrass (Agrostis
palustris subsp. stolonifera L.) to explore the correlation between potassium (K) and the
most commonly used plant growth regulator, trinexapac-ethyl (TE), to reduce summer
vi
stress by increasing rooting and water management within the plant. Treatments included
three annual K rates of 0 (untreated), 97.2 (low), and 194.4 (high) kg K ha-1 and TE
(Primo Maxx, 1EC) applied at 0 or 0.050 kg a.i ha-1; each biweekly over eight weeks.
Data collection for this study comprised of turf quality ratings, clipping and root yields,
and nutrient analyses.
Turf quality never reached the acceptable turf quality rating of 7 on the 1-9 scale,
probably due to high temperatures (≈25 °C) for cool-season bentgrass experienced in the
greenhouse. Potassium nor TE treatments impacted turf quality in this study.
Initial application of the high K rate without TE resulted in a 38% increase in
clipping yields compared to the 0 K rate without TE 2 weeks after initial treatment
(WAIT). Five WAIT this pattern reversed revealing reduced clipping yields following
the high K rate and no K effects on clipping yield were observed at 8 WAIT. TE reduced
clippings in some samplings. At 2 WAIT, clipping reduction of TE increased linearly as
K rate increased. However, at 5 WAIT, the same relationship did not occur. At 8 WAIT,
TE had no impact on clipping production in study 1, but reduced clippings in study 2
when applied with low K.
Potassium concentrations in the leaf tissue were affected by treatments. Data
indicate the high K rate with TE provided higher clipping K concentrations than the low
K rate with TE. TE effects among individual K rates were limited to the high K rate and
increased K concentration in the leaf tissue. Nevertheless, K concentration in leaf tissue
did not occur beyond the 1-2% range in this study, indicating a possible K deficiency
despite K applications.

vii
Root mass exhibited different results between study 1 and study 2. In study 1, no
differences were observed between any combinations of treatments. In study 2, K had no
effects on root mass sampled; however, TE application with high K led to increased root
mass. It was further observed that applying K at any rate (low or high) in combination
with TE resulted in increased K concentrations in the roots compared to the untreated.

ACKNOWLEDGEMENTS
I would like to genuinely thank my advisor and friend of many years, Dr. Haibo
Liu, for this opportunity and for his guidance and support during the research and writing
of this thesis. I truly could not have accomplished this task without your continual
encouragement and patience. I will miss sunrise summer aerifications, irrigation 101 at
the turf plots, and lunches at Monterrey’s. I have cherished my time here and look
forward to future collaborations.
A great deal of acknowledgement is owed to my committee members. Dr. Bert
McCarty, for his advisement in and away from graduate school. I sincerely appreciate
your friendship and the direction you have given me in life. Dr. Ted Whitwell, for his
leadership and support of my graduate research. I’ve enjoyed our time together and hope
to see you often on future Clemson visits. And Dr. Joe Toler, for much of his time,
patience, and explanation of the statistical analysis of my research. I look forward to
using my statistical knowledge in the real-life situations that lie ahead.
Sincere thanks go to my parents, Stevie and Sue Long, for their emotional and
financial support of my career at Clemson. Special thanks are owed to my supervisor and
friend, Mike Echols. Thank you for your spiritual guidance and leadership during my
employment with the Clemson Athletic Department. Additional thanks are owed to
fellow graduate students Bud Sarvis, Jim Thackston, Christian Baldwin, and Ray
McCauley for their noble assistance.

ix
Lastly, to my now wife, Claudia Hook Long, thank you for everything. Your love
and sacrifices have meant the world to me and will mean even more in our future lives
together. Thank you all.
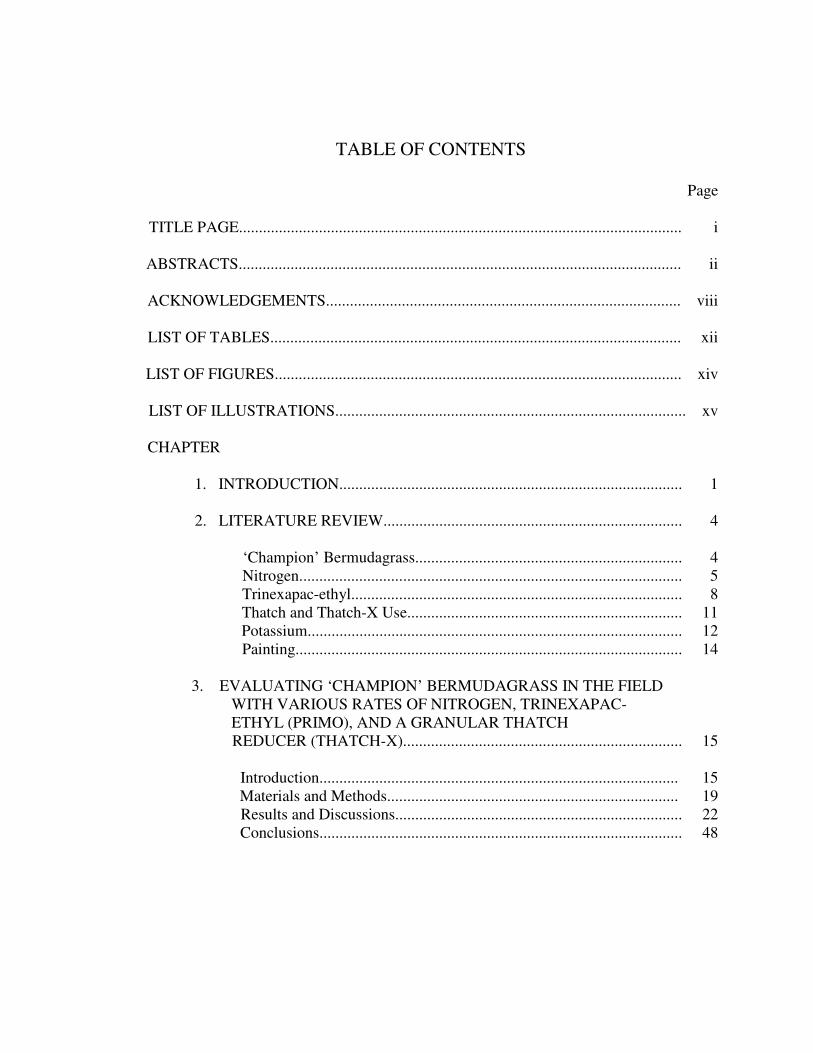
TABLE OF CONTENTS
Page
TITLE PAGE............................................................................................................... i
ABSTRACTS............................................................................................................... ii
ACKNOWLEDGEMENTS......................................................................................... viii
LIST OF TABLES....................................................................................................... xii
LIST OF FIGURES...................................................................................................... xiv
LIST OF ILLUSTRATIONS........................................................................................ xv
CHAPTER
1. INTRODUCTION...................................................................................... 1
2. LITERATURE REVIEW........................................................................... 4
‘Champion’ Bermudagrass................................................................... 4Nitrogen................................................................................................ 5Trinexapac-ethyl................................................................................... 8Thatch and Thatch-X Use..................................................................... 11Potassium.............................................................................................. 12Painting................................................................................................. 14
3. EVALUATING ‘CHAMPION’ BERMUDAGRASS IN THE FIELDWITH VARIOUS RATES OF NITROGEN, TRINEXAPAC-ETHYL (PRIMO), AND A GRANULAR THATCHREDUCER (THATCH-X)...................................................................... 15
Introduction.......................................................................................... 15Materials and Methods......................................................................... 19Results and Discussions........................................................................ 22Conclusions........................................................................................... 48
xi
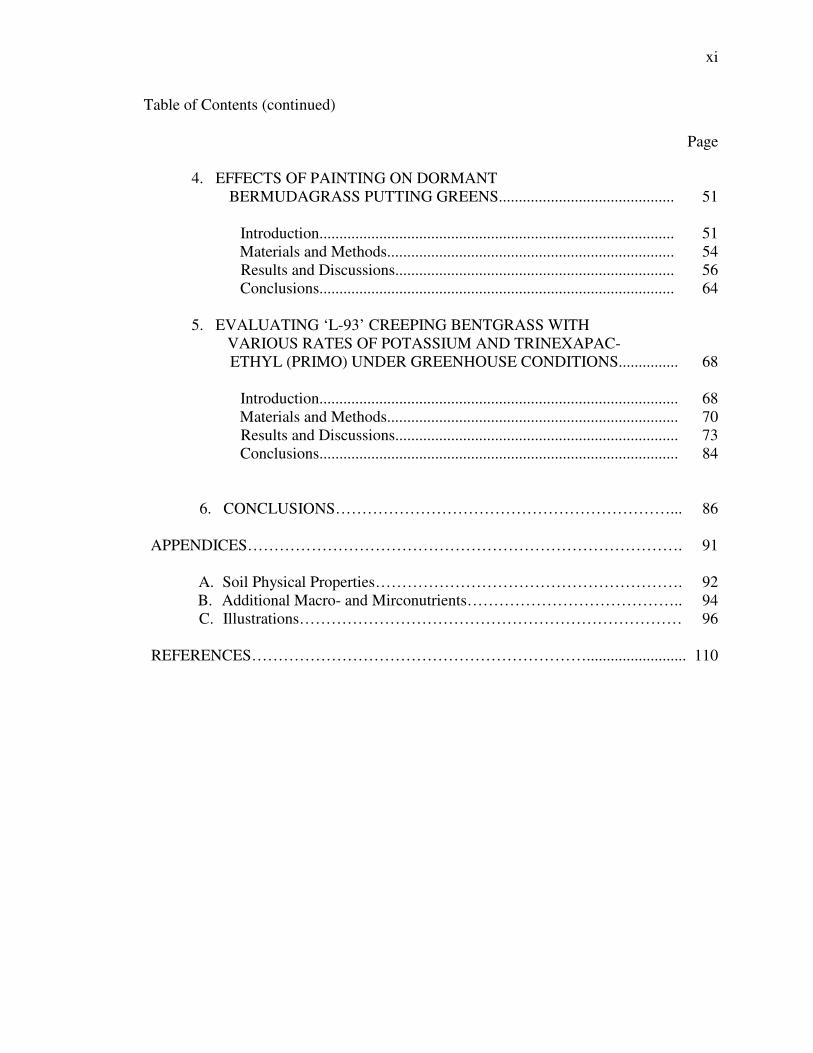
Table of Contents (continued)
Page
4. EFFECTS OF PAINTING ON DORMANTBERMUDAGRASS PUTTING GREENS............................................ 51
Introduction......................................................................................... 51Materials and Methods........................................................................ 54Results and Discussions...................................................................... 56Conclusions......................................................................................... 64
5. EVALUATING ‘L-93’ CREEPING BENTGRASS WITHVARIOUS RATES OF POTASSIUM AND TRINEXAPAC-ETHYL (PRIMO) UNDER GREENHOUSE CONDITIONS............... 68
Introduction.......................................................................................... 68Materials and Methods......................................................................... 70Results and Discussions....................................................................... 73Conclusions.......................................................................................... 84
6. CONCLUSIONS………………………………………………………... 86
APPENDICES………………………………………………………………………. 91
A. Soil Physical Properties…………………………………………………. 92B. Additional Macro- and Mirconutrients………………………………….. 94C. Illustrations……………………………………………………………… 96
REFERENCES………………………………………………………......................... 110
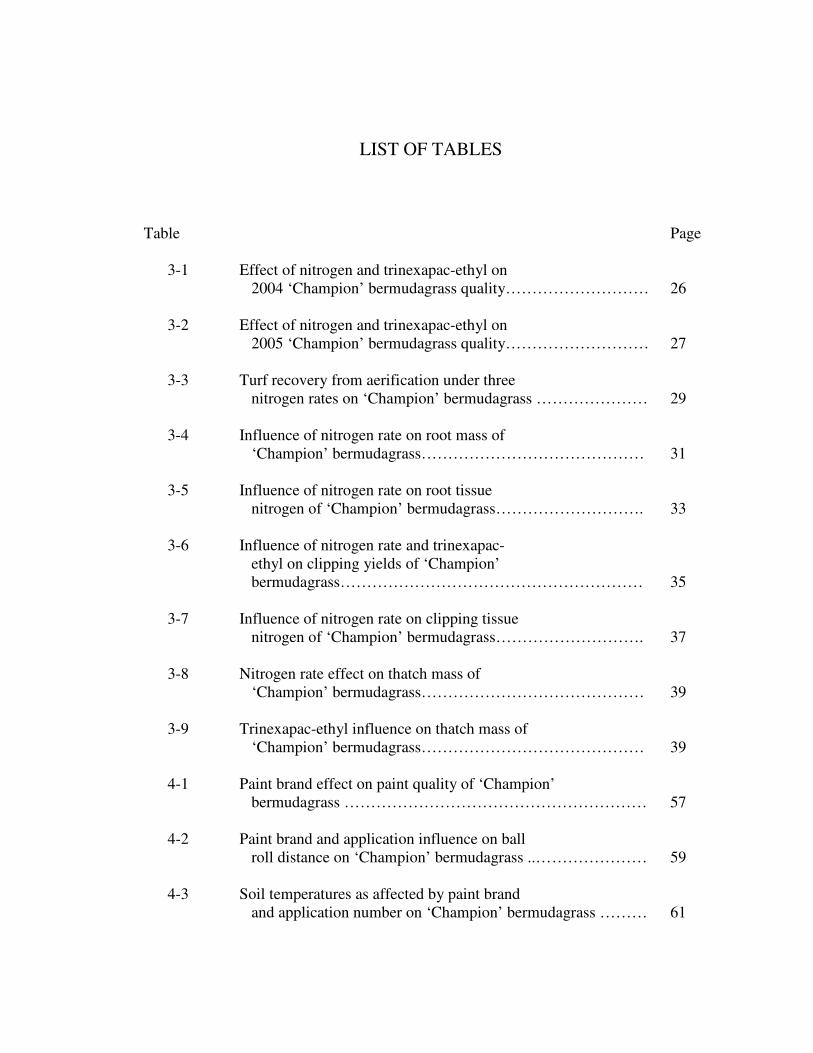
LIST OF TABLES
Table Page
3-1 Effect of nitrogen and trinexapac-ethyl on2004 ‘Champion’ bermudagrass quality……………………… 26
3-2 Effect of nitrogen and trinexapac-ethyl on2005 ‘Champion’ bermudagrass quality……………………… 27
3-3 Turf recovery from aerification under threenitrogen rates on ‘Champion’ bermudagrass ………………… 29
3-4 Influence of nitrogen rate on root mass of‘Champion’ bermudagrass…………………………………… 31
3-5 Influence of nitrogen rate on root tissuenitrogen of ‘Champion’ bermudagrass………………………. 33
3-6 Influence of nitrogen rate and trinexapac-ethyl on clipping yields of ‘Champion’bermudagrass………………………………………………… 35
3-7 Influence of nitrogen rate on clipping tissuenitrogen of ‘Champion’ bermudagrass………………………. 37
3-8 Nitrogen rate effect on thatch mass of‘Champion’ bermudagrass…………………………………… 39
3-9 Trinexapac-ethyl influence on thatch mass of‘Champion’ bermudagrass…………………………………… 39
4-1 Paint brand effect on paint quality of ‘Champion’bermudagrass ………………………………………………… 57
4-2 Paint brand and application influence on ballroll distance on ‘Champion’ bermudagrass ..………………… 59
4-3 Soil temperatures as affected by paint brandand application number on ‘Champion’ bermudagrass ……… 61

xiii
List of Tables (Continued)
Table Page
5-1 Trinexapac-ethyl and potassium effects onturf quality of ‘L-93’ creeping bentgrass................................ 74
5-2 Trinexapac-ethyl and potassium effects onclipping yield of ‘L-93’ creeping bentgrass2 and 5 weeks after initial treatment....................................... 76
5-3 Trinexapac-ethyl and potassium effects onclipping yield of ‘L-93’ creeping bentgrass8 weeks after initial treatment................................................. 77
5-4 Trinexapac-ethyl and potassium effects onpotassium concentration in clippings of‘L-93’ creeping bentgrass........................................................ 79
5-5 Root mass of ‘L-93’ creeping bentgrass asaffected by trinexapac-ethyl and potassiumtreatments................................................................................ 81
5-6 Root potassium concentrations of ‘L-93’creeping bentgrass as affected by trinexapac-ethyl and potassium treatments............................................... 83
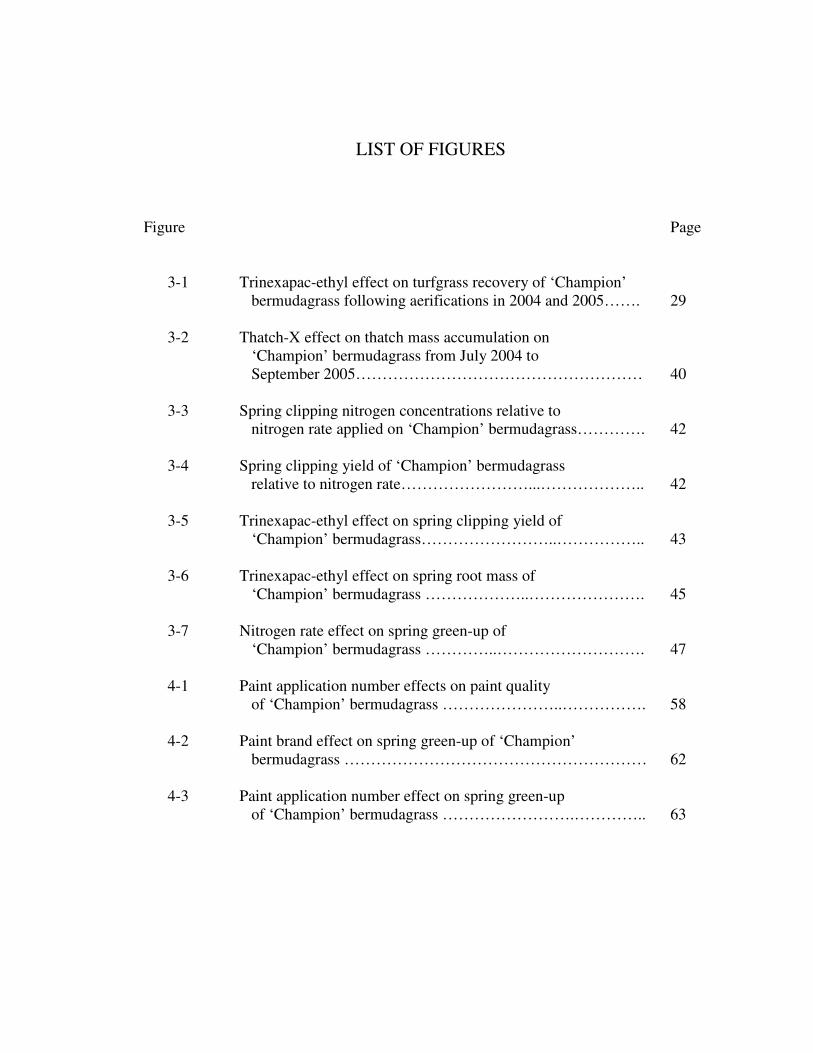
LIST OF FIGURES
Figure Page
3-1 Trinexapac-ethyl effect on turfgrass recovery of ‘Champion’bermudagrass following aerifications in 2004 and 2005……. 29
3-2 Thatch-X effect on thatch mass accumulation on‘Champion’ bermudagrass from July 2004 toSeptember 2005……………………………………………… 40
3-3 Spring clipping nitrogen concentrations relative tonitrogen rate applied on ‘Champion’ bermudagrass…………. 42
3-4 Spring clipping yield of ‘Champion’ bermudagrassrelative to nitrogen rate……………………...……………….. 42
3-5 Trinexapac-ethyl effect on spring clipping yield of‘Champion’ bermudagrass……………………..…………….. 43
3-6 Trinexapac-ethyl effect on spring root mass of‘Champion’ bermudagrass ………………..…………………. 45
3-7 Nitrogen rate effect on spring green-up of‘Champion’ bermudagrass …………..………………………. 47
4-1 Paint application number effects on paint qualityof ‘Champion’ bermudagrass …………………..……………. 58
4-2 Paint brand effect on spring green-up of ‘Champion’bermudagrass ………………………………………………… 62
4-3 Paint application number effect on spring green-upof ‘Champion’ bermudagrass …………………….………….. 63
LIST OF ILLUSTRATIONS
Illustration Page
C-1 World map of the transition zone as it appearsin the United States…………………………………………… 97
C-2 Three stages of gibberellic acid biosynthesis.…………………... 98
C-3 Experimental design and treatment assignmentfor ‘Champion’ bermudagrass field studyfertilized with ammonium sulfate at 244, 488,and 732 kg N ha-1yr-1 with and withouttrinexapac-ethyl at 0.025 kg ha-1 2 wk-1 andwith and without Thatch-X from June 2004to June 2006…………………………………………………... 99
C-4 The ‘Champion’ bermudagrass experimentalputting green at the Turfgrass Service Center,Clemson, SC where field experiments wereconducted from June 2004 to June 2006……………………... 100
C-5 Thatch-X, granular thatch reducing product,applied in ‘Champion’ bermudagrass fieldstudy………………………………………………………….. 101
C-6 Muffle furnace with thatch samples from‘Champion’ bermudagrass field study……………………….. 102
C-7 Thatch accumulation differences in ‘Champion’bermudagrass field study………….........……………………. 103
C-8 Experimental design and treatment assignmentfor ‘Champion’ bermudagrass painting study………………... 104
C-9 The once treated ‘Champion’ bermudagrasspainting study……………...…………………………………. 105
C-10 The air compressor and pneumatic spray gunused in ‘Champion’ bermudagrasspainting study………………………………………………… 106
xvi
List of Illustrations (Continued)
Illustration Page
C-11 Color tone differences between paint brandsused in ‘Champion’ bermudagrass paintingstudy……………………………………………………….. 107
C-12 Greenhouse setup for an experiment investigatingeffects of potassium applied at 0, 97.2, and 194.4kg K ha-1yr-1 with and without trinexapac-ethylat 0.05 kg ha-1 2 wk-1 to ‘L-93’ creeping bentgrassgrown in containers built approximately to UnitedStates Golf Association Specifications…………………….. 108
C-13 Spraying chamber used for application oftreatments for ‘L-93’ creeping bentgrassgreenhouse study…………………………………………… 109
CHAPTER 1
INTRODUCTION
Golf courses have been constructed throughout the world; with the only limitation
for use has been where turfgrasses simply cannot survive under the existing
environmental conditions. Turfgrass survival depends upon many environmental and
physiological factors. One of these factors is temperature and the physiological ability or
inability of the turf to withstand temperature extremes. The transition zone, in the United
States of America, is a 322 kilometer-wide belt at 37° north latitude (Appendix C-1)
where a broad range of weather extremes may frequently occur, which creates this
paradox for golf course superintendents without a perfect turfgrass: plant a warm-season
turfgrass and have quality turf from April to October dealing with overseeding and
transition from overseeded grasses annually; or plant a cool-season turfgrass and reap the
benefits through the cooler months from October to May while suffering through summer
heat stress to keep the turf alive. This paradox drives turfgrass research to discover
management practices which will stretch the adaptation limits associated with both types
of turfgrasses to reach higher turf quality.
While all warm- and cool-season grasses are similar in appearance, they are
dissimilar physiologically. Because of differing photosynthetic pathways, cool-season
grasses are classified as C3 plants and warm-season grasses are classified as C4 plants.
The C3 carbon fixation pathway acquired its name as an explanation of its first step of
carbon fixation where a three-carbon sugar is formed. However, the C4 carbon fixation
2
pathway forms a four-carbon sugar by requiring different leaf anatomy and enzymes
(McCarty, 2005; Taiz and Zeiger, 2006).
C3 plants are adapted for cooler climates because as temperature rises, the
photosynthetic efficiency decreases due to high rates of photorespiration at the expense of
photosynthesis. Photorespiration occurs because under higher temperatures and light
intensities as well as drought, CO2 fixation is reduced resulting in increased competition
with O2 for the binding site on rubisco, which facilitates either reaction. If O2 is bound,
photorespiration occurs whereas photosynthesis occurs with bound CO2 (Taiz and Zeiger,
2006). C4 grasses eliminate photorespiration, which is commonly associated with the C3
grasses, by fixing the CO2 as build-up occurs within the plant (McCarty, 2005). A
distinctive trait, referred to as Kranz anatomy, possessed by C4 plants allows for a 12-fold
increase of concentrated CO2 in the bundle sheath cells when compared to the C3 plants
(McCarty, 2005). With two CO2 fixation cycles, the C4 plants are adept at dealing with
high light and high temperature environments. Conversely, C3 plants are able to
withstand near freezing temperatures for a very different reason, however, still related to
its unique pathway. Near the end of the C3 cycle, sucrose is formed which is ultimately
synthesized into fructans (McCarty, 2005). These fructans, or fructose polymers, are the
key for low-temperature survival of cool-season turfgrasses. In C4 grasses, the sucrose
formed is synthesized into starch, which does not have the same cold tolerance traits as
fructans (McCarty, 2005; Taiz and Zeiger, 2006).
The decision to rely on a C3 or C4 grass is further complicated by the transition
zone environment, where each grows well for portions of the year. Advantages of C3
grasses include optimum growth under reduced light intensities created by shade, clouds,
3
and day length, as well as year-round growth and higher putting quality according to
golfers, while C4 advantages include more efficient use of water and nitrogen, high
temperature tolerance, and a much higher resistance to disease. McCarty (2005)
estimated annual management of 18-hole C3 bentgrass putting greens in the transition
zone at 75,000 dollars more annually than C4 bermudagrass. Increased budgeting allows
for increased fungicide use, maintenance, and irrigation associated with management of
C3 turfgrasses in the transition zone.
Though advantageous characteristics exist for both C3 and C4 grasses in the
transition zone, neither exhibit optimum growth nor quality under all environmental
conditions year-round. As a result, continued research is needed on putting green grasses
in the transition zone in efforts to stretch the adaptation limits of each while providing the
best quality putting surface available.
The objectives of this research were:
1. To evaluate N rates, trinexapac-ethyl, and Thatch-X effects on turf
quality and roots of ‘Champion’ bermudagrass.
2. To determine if painting bermudagrass putting greens will provide
acceptable color and quality during the dormant season.
3. To investigate any correlation or synergy between potassium and
trinexapac-ethyl on ‘L-93’ creeping bentgrass performance.
CHAPTER 2
LITERATURE REVIEW
‘Champion’ Bermudagrass
Ultradwarf bermudagrasses [Cynodon dactylon (L.) Pers. X C. transvaalensis
Burtt-Davy], such as ‘Champion’, ‘Floradwarf’, ‘Miniverde’, ‘MS Supreme’, and
‘TifEagle’, have emerged in recent years as the leading warm-season turfgrasses for
putting greens due to their ultra-low uniform growth and faster putting speeds compared
to dwarf bermudagrasses [Cynodon dactylon (L.) Pers. X C. transvaalensis] like
‘Tifdwarf’ and ‘Tifgreen’. These grasses require relatively high fertility regimes to
maintain appearance, yet possess extremely fine leaf texture and excellent density
(McCarty 2005; McCarty and Miller, 2002). Other advantages of bermudagrass putting
greens include vigorous growth, deep rooting, and drought and salt tolerance depending
upon the cultivar used. Ultradwarf bermudagrasses are often chosen over cool-season
grasses (C3 grasses, See Chapter 1), such as bentgrass, for putting greens in the southeast
and the transitional zone due to the inability of C3 grasses to cope with extreme summer
temperatures and high humidity. Ultradwarf bermudagrasses, however, are not flawless.
Limited research indicate they produce excessive thatch and demand a more intense
management plan in relation to their predecessors, Tifdwarf and Tifgreen (Hollingsworth
et. al., 2005; Hanna, 2005). Additionally, the ultradwarf bermudagrasses were shown by
Bunnell et al. (2005) to be intolerant of prolonged shade, which can occur on golf course
greens surrounded by trees, buildings, and other structures.
5
Champion bermudagrass is a relatively new dwarf type bermudagrass that has
quickly become widely used for putting greens across the southern United States. The
variety originated as an off-type mutation from a stand of Tifdwarf originally planted in
the 1960s (Anonymous, 2004a). A mutation refers to the genetic instability that is the
result of an induced or randomly occurring shift in the grass genome (Goatley et al.,
2003). In 1987, Morris Brown noticed the mutation in the stand and selected it as a new
variety. By 1995, it was commercially available, however, not well known. As of late
2005, nearly 300 golf courses across the U.S. had switched to this ultradwarf, with 38 of
those courses being in South Carolina (Anonymous, 2004a). Recent research indicates
Champion possesses dark green color for a longer period of time and higher shoot
densities than other ultradwarf selections (Hollingsworth et. al., 2005). Additionally,
Champion has higher salt tolerance than TifEagle (Baldwin, 2004). However, further
research indicate that Champion bermudagrass, like all grasses, has certain limitations.
For example, McCullough et al. (2004) reported Champion having significantly less root
mass when compared to some of the other ultradwarfs and significantly less root length
compared to Tifdwarf. Hollingsworth et al. (2005) showed Champion consistently
produces more thatch than its ultradwarf relatives. Still, little viable research exists on
Champion bermudagrass concerning nitrogen rates and thatch accumulation.
Nitrogen
Of the mineral elements, nitrogen is required in the largest amount for sustainable
growth and development of turfgrasses. Nitrogen is a mobile element within the plant
and serves as a constituent of plant cell components, including amino acids, enzymes,
6
proteins, nucleic acids, and chlorophyll (Marschner, H., 1995; McCarty, 2005). Turf
managers apply nitrogen more frequently than any other element to increase color,
growth rate, and stand density.
Adequate amounts of nitrogen in the plant lead to high photosynthetic activity,
vigorous vegetative growth, and dark green color. Nitrogen deficiency, however, occurs
readily and rapidly, which inhibits plant growth. Deficiency symptoms initially include
chlorosis of older leaves and a stunted, yellow appearance, followed by necrosis
occurring at the leaf tip and progressing back along the midrib when deficiency becomes
severe (Havlin et.al., 2005). More specifically, in turf, nitrogen deficiencies are usually
observed as an overall pale yellow-green turf color from chlorosis (McCarty, 2005).
Plant growth rate and density generally decrease as well. Deficiencies generally are
easily overcome by application of a nitrogen fertilizer.
Given that nitrogen deficiencies occur frequently, some turf managers use
nitrogen application as a “cure all”, failing to verify nitrogen needs. Excessive amounts
of nitrogen can be detrimental to the plant leading to reduced rooting, increased disease
susceptibility, as well as increasing costs. Excess nitrogen fertilization reduces plant
rooting when carbohydrates stored in the roots are used to support increased shoot
growth. As a result, shoot growth occurs at the expense of the roots, which may lead to
other physiological responses such as cell wall thinning, succulent tissue growth, and
reduced root carbohydrate levels (McCarty, 2005). Leaching can also occur when
excessive amounts of nitrogen are applied, leading to potential problems with ground
water contamination. In a study conducted by Golembiewski and Danneberger (1998),
high concentrations of nitrogen led to excessive thatch accumulation.
7
Most soils contain insufficient nitrogen levels turf plants need to grow and survive
and, therefore, supplemental amounts must be added as inorganic nitrogen by turf
managers. Nitrogen is available for application in an array of forms and from various
sources (McCarty, 2005). Turfgrass roots absorb nitrogen as nitrate (NO3-) or ammonium
(NH4+); with NO3
- usually being the most abundant form in well aerated, moderate pH
soils (Marschner, 1995; Havlin et al., 2005). Absorption of nitrogen mainly occurs in the
meristematic and root hair regions of the roots where functioning xylem and phloem are
located (Bloom et al., 2003). Due to the enlarged surface area in contact with soil
solution, the root hairs are considered to be sites of vast nutrient uptake and likely
enhance the root’s ability to absorb immobile nutrients such as NH4+ (Hull and Liu,
2005). Although NH4+ is immobile in the soil, it becomes a favored N source as its
positive charge allows it to move passively into the negatively charged cytoplasm in the
plant when an electrochemical gradient has been established. Conversely, the negative
charge of NO3- makes it a less efficient source of N as energy expenditure is required for
it to move from the soil solution into the root cell (Hull and Liu, 2005). Additionally,
NO3- cannot be assimilated into amino acids or other organic compounds until it is
reduced to NH4+, requiring added energy requirements of the turf to gain effectiveness
from the incorporation of NO3- as opposed to NH4
+ (Campbell, 1999; Lillo et al., 2004;
Hull and Liu, 2005). The reaction can be viewed in the following equation where an
eight-electron (e-) reduction of NO3- is carried out: NO3
- + 8H+ + 8e- � NH3 + 2H2O
+ OH- (Hull and Liu, 2005).
8
Trinexapac-ethyl (TE)
A commercial plant growth regulator, or PGR, is an organic compound, natural or
synthetic, that modifies or controls one or more specific physiological processes within
the plant (Lemaux, 1999). These compounds generally slow or inhibit cell elongation,
prevent or cause leaf abscission, or affect foliage color by disrupting gibberellic acid
biosynthesis and releasing ethylene in the plant. PGRs are classified by their modes of
action into three distinct groups. Two major groups include cell division inhibitors,
called Type I PGRs, which are herbicides used at low enough rates to inhibit growth
without causing cell death, and Type II PGRs, gibberellin biosynthesis inhibitors. The
gibberellin biosynthesis inhibitors are further divided into two classes. Class A
inhibitors, such as trinexapac-ethyl (TE), inhibit synthesis of gibberellin late in the
biosynthetic pathway while Class B inhibitors, such as paclobutrazol, inhibit gibberellin
synthesis early in the pathway (Taiz and Zeiger, 2006).
Currently, TE, commercially available as Primo in the USA when in liquid form,
is one of the most popular PGRs used in turfgrass. Discovered by the Ciba-Geigy
Corporation, now Syngenta, Primo was registered by the EPA in 1993 as a safe use
pesticide containing 12 percent of the active ingredient cimectacarb 4-(cyclopropyl-
alpha-hydroxy-methylene)-3,5-dioxo-cyclohexanecarboxylic acid ethyl ester labeled for
managing growth, improving quality, and edging of warm- and cool-season turfgrasses
(Anonymous, 2005b).
According to Taiz and Zeiger (2006), gibberellic acid is the plant hormone that is
primarily responsible for plant stature. Gibberellins (GAs) are terpenoid compounds
consisting of 20 carbons, composed from four isoprenoid units. All GAs are formed from
9
a long pathway beginning at photosynthesis. Carbohydrates from photosynthesis fuel
glycolysis, which produces phosphoenol pyruvic acid and acetyl CoA. Mevalonic acid is
formed from this acetyl CoA and is the starting compound for all terpenoid biosynthesis.
Mevalonic acid, a six carbon compound, is decarboxylated to form the first isoprenoid
compound in the pathway (Taiz and Zeiger, 2006). The isoprene units are added together,
resulting in geranylgeranyl pyrophosphate, which is a compound containing twenty
carbon atoms. Geranylgeranyl pyrophosphate is then made into ring structures by closing
the gaps between the isoprene units (Anonymous, 2005a). The compound resulting from
these closures is called ent-karurene (Taiz and Zeiger, 2006). One of the methyl groups
on ent-karurene is oxidized to carboxylic acid. Then one of the six C rings contracts to
become a five C ring that gives GA12-aldehyde. This compound is the first gibberellin
formed in all plants and is the precursor of all the other gibberellins (Taiz and Zeiger,
2006). The above reaction is drawn in Appendix C-2.
TE works by inhibiting active gibberellin production. GAs are formed, but are
not active, until oxidized to the active gibberellin GA1. Inhibition of gibberellic acid
biosynthesis by TE occurs between the steps of GA20 and GA1 (Appendix C-2), resulting
in reduced cell elongation (Anonymous, 2005a).
Use of TE in turf has increased since its introduction in the early 1990s. Its
impacts on turf include its ability to increase ball roll distance (or speed), reduce number
of mowings, provide smoother greens and healthier turf, and allow for bermudagrass
growth suppression prior to overseeding (McCarty, 2005). Increased green speed and
smoothness are desirable during tournament play for better playing conditions and are
attained by TE’s vertical growth suppression. Bermudagrass health is increased through
10
TE use due to the promotion of lateral shoot and root growth. Grasses maintained at low
heights of cut are under highly stressful conditions and deeper roots and additional shoots
can help reduce this stress.
TE is safe for use on many fine turfs, including bahiagrass (Paspalum notatum
Flugge), bermudagrass (Cynodon dactylon L.), centipedegrass (Eremochloa ophiuroides
[Munro] Hack.), creeping bentgrass (Agrostis stolonifera L.), fine fescues (Festuca spp.),
Kentucky bluegrass (Poa pratensis L.), kikuyugrass (Pennisetum clandestinum Hochst ex
Chiov.), perennial ryegrass (Lolium perenne L.), annual bluegrass (Poa annua L.), St.
Augustinegrass (Stenotaphrum secundatum [Walt.] Kuntze.), tall fescue (Festuca
arundinacea Schreb.), and zoysiagrass (Zoysia spp.) (Anonymous, 2006). For clipping
management, TE use is recommended at rates ranging from 0.025 to 0.050 kg a.i. ha-1 for
bermudagrass greens, 0.092 kg a.i. ha-1 for bermudagrass fairways, and 0.180 kg a.i. ha-1
1 to 5 days prior to overseeding (Anonymous, 2006). An additional turf use of TE is
extending the life of painted lines on sports fields. By applying TE at 7.8 ml/liter of paint
used, turfgrass growth under the painted lines can be reduced resulting in extended life of
the painted line by up to 30 days.
There is still much information about the effects of TE on turfgrasses that remains
unknown. As a result, the effects of TE on turf are still being investigated under various
conditions and situations.
On St. Augustinegrass, TE reduced mowing frequency by 50% and reduced
cumulative turfgrass clippings by 63% (McCarty et al., 2004). TE was deemed most
effective of the plant growth regulators used in the study. Another study found that TE
11
application did not increase root mass and poor Kentucky bluegrass turf quality resulted
with TE use under highly trafficked conditions (Ervin and Koski, 2001).
As newer varieties of turfgrass become available, the need for research on PGRs
will continue to increase. TE is only one example of a number of plant growth regulating
chemicals that play an important role in the turfgrass industry and require research to
ensure they are being used to their fullest potential.
Thatch and Thatch-X Use
A problematic component of any turfgrass region occurs in the least visible place,
underground. Thatch, according to McCarty (2005), is the accumulation of organic
material such as stolons, rhizomes, stems, leaves, and clippings within the top layer of the
turfgrass biosphere and is one of the ultradwarfs’ inherent issues. Thatch becomes a
problem to the turf plant when the crowns, stolons, and rhizomes begin growing in this
layer of material instead of the more protective and nutrient-filled soil. The plant is then
exposed to adverse environmental conditions and a variety of pests. Thatch can also pose
a problem with roots by limiting the amounts of water and nutrients that reach them. The
thatch layer acts similarly as a sponge absorbing irrigation water and fertilizers, not
allowing them to roots (McCarty, 2000).
Thatch can be remedied through cultivating (mechanical) or through biological
methods. Mechanical removal of thatch can be performed by means of aerifications,
topdressings, verticutting, and dethatching. While, biological control is thought to be
effective as well. Emerald Isle, LTD (a Milliken company), produces one such biological
thatch control agent sold under the trade name Thatch-X.
12
Thatch-X is a scientific blend of food and feed-grade organics, cold water sea
plants, enzymes, selected microorganisms and other bioactive ingredients formulated to
dramatically accelerate thatch biodegradation (Anonymous, 2004b). Classified as an
organic fertilizer, Thatch-X is a granular product with a guaranteed nutrient analysis of 4-
2-5, nitrogen, phosphorus (P2O5), and potassium (K2O), respectively. The manufacturer
claims research with Thatch-X reduced thatch 37% compared to 19% thatch reduction
following aeration alone with further reporting indicating 50% thatch reduction when
combined with aeration (Anonymous, 2004b). However, other research indicated no
reduction in thatch-mat accumulation on a 2-year study of ‘L-93’ creeping bentgrass
[Agrostis stolonifera L. var palustris (Huds.) Farw.] following Thatch-X application at
the manufacturer’s recommended rate, timing, and frequency (McCarty et al., 2005).
Potassium
Potassium (K) is absorbed by plants in larger quantities than any other nutrient
except nitrogen. Plant roots absorb potassium as a K+ ion and contain an average tissue
concentration between 1.5 to 4.5% dry-matter by weight (Marschner, 1995; Havlin et al.,
2005; McCarty, 2005). Of the total amount of K in the soil, only about 1-10% is
available for plant uptake (Havlin et al., 2005). Furthermore, due to the low CEC, K
content is lowest in sandy soils formed from sandstone or quartzite, which is similar to
most sand-based golf putting greens (Havlin et al., 2005).
Potassium is responsible for the activation of more than 80 enzymes in the plant
and also plays a vital role in the regulation of the osmotic potential of plant cells (Havlin
et al., 2005). More specifically, the osmotic potential of plant cells is affected by an
13
influx of K resulting in increased turgor pressure in the guard cells surrounding each
stoma, allowing increased rates of photosynthesis and efficient use of water. This
regulation of stomatal openings allows K to have a major impact on plant water use as it
relates to water uptake, water transport, and transpiration. Additionally, K is often called
the “health” element due to its ability in high amounts to combat the negative effects
associated with excessive nitrogen fertilization, cold, heat, drought, diseases, and wear
(McCarty, 2005). It does so by the regulation of water uptake in the plant. Many of
these combative effects come as a result of the increased concentration of K in plants,
which according to McCarty (2005), causes cell walls to thicken and tissue water content
to decrease. Since K provides much of the osmotic pressure needed for water entrance
into the plant, K helps improve drought tolerance. Furthermore, thicker cell walls caused
by increased K levels assist the plant in resisting pest pressure better and withstanding
temperature extremes (McCarty, 2005).
Although studies indicate K’s broad range of positive plant effects; inconsistent
results have led to few consistent conclusions about rates and effects of the element.
Sartain (2002) noted increases in ‘Tifway’ bermudagrass shoot growth rate and tissue K
concentrations with K rates up to 7.4 g m-2 90 d-1, however, additional increases among
the remaining five higher K rates were not found. Additionally, K had no impact on root
growth or turf quality. A similar study was conducted by Fitzpatrick and Guillard (2004)
with Kentucky bluegrass (Poa pratensis L.) finding that K had no measurable impact on
clipping yield or turf quality. On Seashore paspalum (Paspalum vaginatum Swartz), K
had no impact on turf quality, density, or turf color following heavy traffic (Trenholm et
al., 2000). With widely varying results following the use of K on turfgrass species, and
14
the inability to find positive K effects involving plant stress, the need for further K
research is evident.
Painting
Painting of dormant bermudagrass putting greens has recently become the
primary alternative to overseeding greens for winter color. The practice is gaining
notoriety because of its cost effectiveness, attractiveness, bermudagrass health
maintenance, and playability (McCarty, 2005).
Shearman et al. (2005) evaluated effects of a turf colorant for the turfgrass color,
quality, and cover on fairway-height, dormant buffalograss (Buchloe dactyloides (Nutt.)
Engelm) in Nebraska. The colorant application improved turfgrass color and quality
compared to untreated, dormant turf. Furthermore, the colorant treatments increased
canopy and soil temperatures and enhanced spring green-up.
More recently, O’Brien and Hartwiger (2005) presented 10 years of painting
dormant bermudagrass greens. Included in the presentation was Rodney Lingle’s
painting experience as superintendent of Memphis Country Club in Tennessee. Lingle
has been successfully painting Champion bermudagrass (Cynodon dactylon (L.) Pers. X
C. transvaalensis Burtt-Davy) putting greens for 15 years.
The practice of painting greens has not yet been well investigated or documented.
Additionally, limited research has been conducted to investigate the effects of these new
“turf paints” on ultradwarf bermudagrasses.
CHAPTER 3
EVALUATING ‘CHAMPION’ BERMUDAGRASS IN THE FIELD WITH
VARIOUS RATES OF NITROGEN, TRINEXAPAC-ETHYL (PRIMO),
AND A GRANULAR THATCH REDUCER (THATCH-X)
Introduction
‘Champion’ bermudagrass [Cynodon dactylon (L.) Pers. X C. transvaalensis
Burtt-Davy] is among the most popular warm-season putting green grasses in use today
(See Chapter 2). However, as a putting green grass, issues include clipping removal,
reduced root production, increased stress, and higher thatching tendencies. Therefore, it
is important to determine an effective maintenance plan for managing these potentially
detrimental impacts.
Maintenance plans start with fertility, focusing on nitrogen (N) in turfgrass
because N is the most frequently deficient element. Among warm-season grasses,
centipedegrass [Eremochloa ophiuroides (Munro) Hack.], carpetgrass (Axonopus spp.),
and bahiagrass (Paspalum notatum Flugge) have a low N demand, St. Augustinegrass
[Stenotaphrum secundatum (Walt.) Kuntze.] and zoysiagrass (Zoysia japonica Steud.)
have a moderate N demand, and bermudagrass [Cynodon dacytlon (L.) Pers.] exhibits
high N demand (Petrovic, 1990). Common N sources for warm-season turfgrass putting
greens include ammonium nitrate (NH4NO3), ammonium sulfate [(NH4)2SO4], calcium
nitrate [Ca(NO3)2], potassium nitrate (KNO3), urea and urea [CA(NH2)2] formulations
(Hull and Liu, 2005; McCarty, 2005; Carrow et al., 2001; Hull, 1996; Turner and
16
Hummel, 1992). Important differences between sources include speed of release,
acidifying effect, percent nitrogen, and nitrogen form (McCarty, 2005; Turgeon, 2005;
Beard, 1973).
Ammonium sulfate is commonly used where a slightly more acidic soil is desired,
particularly for warm-season turfgrasses. Acidic soils have been shown to reduce some
disease occurrences, such as patch diseases (Hill et al., 2002). Furthermore, ammonium
sulfate has a lower percent nitrogen than ammonium nitrate and urea, which may reduce
leaf burn potential. Ammonium sulfate provides N as ammonium which makes it the
preferred N source for C4 turfgrasses (Hull and Liu, 2005; Havlin et. al., 2005;
Marschner, 1995) and requires less energy for uptake than nitrate sources (Forde and
Clarkson, 1999).
Nitrogen application to turfgrass influences all aspects of growth and quality
(Carrow et al., 2001). While the increased application of N to plants increases shoot
growth and quality as a result of increased chlorophyll production, root growth may also
be diminished. Additional consequences of excessive N application include increased
thatch production and reduced lateral shoot production (McCarty, 2005). As a result,
supplying turf with adequate, but not excessive, nitrogen is key to plant health and overall
putting green playability.
In a 3-year study, Hollingsworth et al. (2005) revealed Champion possessing
deeper thatch accumulation on most sampling dates versus other ultradwarf varieties.
The tendency of Champion to accumulate thatch at an increased rate compared to a
previous generation of putting green grasses calls for an addendum to current turfgrass
management strategies. The addendum includes a more strictly followed annual N plan
17
in an effort to limit excessive growth, as well as other cultural and chemical means of
controlling growth such as biological thatch reducers and plant growth regulators
(McCarty, 2005; McCarty and Miller, 2002).
Biological means of reducing thatch offer an environmentally friendly alternative
to physical removal through cultivation practices. However, with little data available
documenting the efficacy of these products, use has not become widespread. McCarty et
al. (2005) concluded Thatch-X, a commercial product manufactured by Ocean Organics
(Ocean Organics/Emerald Isle Ltd., Ann Arbor, MI) as a biological thatch control agent,
did not prevent thatch-mat accumulation on L-93 creeping bentgrass when applied at the
labeled rate but thatch was reduced for A-1 and Crenshaw creeping bentgrass greens by
the same research group (Willis et al., 2006). Research for Thatch-X use on
bermudagrass putting greens is not available. Nevertheless, it is believed that the use of
biological thatch prevention agents can aid in the slowing of thatch accumulation in
bermudagrass when combined with appropriate turfgrass management practices.
Plant growth regulators (PGRs) have a profound impact on turfgrass growth and
are an integral part of the turfgrass managers’ maintenance programs (McCarty, 2005;
Turgeon, 2005). PGRs have such uses as inhibiting vertical growth and promoting lateral
growth, improving turfgrass quality and color, drastically reducing clipping production,
as well as discouraging seedhead production (McCarty, 2005). Some of the most popular
PGRs for turf include Primo Maxx/trinexapac-ethyl, Trimmit/paclobutrazol,
Cutless/flurprimidol, and Proxy/ethephon. The inclusion of PGRs is essential on
bermudagrass putting greens grasses for growth regulation, density improvement, and
18
quality effects. Additionally, PGR use on dwarf bermudagrasses enhances turf quality
with a potential to reduce fertilizer input (McCullough et al., 2006).
Another important constituent of the turfgrass plant is the roots. The roots’
primary functions are to anchor the plant to the soil and take up water and nutrients
(McCarty, 2005; Marschner, 1995). The turfgrass root depth is positively correlated with
mowing height. The lower the mowing height, the less leaf and shoot growth above
ground and the fewer carbohydrates produced by the leaves and shoots, reducing overall
root growth (McCarty, 2005; Turgeon, 2005; Beard, 1973). Therefore, this relationship
ensures that the roots will die back and only become extensive enough to support the
growing plants, as seen in most ultradwarf varieties. In the typical green situation, where
the turf stand is mowed as low as 2.5 mm, roots are greatly reduced and the turf plant
faces starvation. As discussed in Chapter 2, additional factors which can limit rooting
include excessive nitrogen and high thatch levels.
Currently, little research is being performed on Champion bermudagrass that can
enable golf course superintendents and other turf professionals to reduce its thatching
tendency while also increasing the root mass and quality of the turf stand. Research
using different rates of nitrogen with a plant growth regulator and a biological thatch
reducer should help determine the best combination for increasing rooting capability of
the turf while also reducing excessive thatch accumulation which is a common problem
with the ultradwarf bermudagrasses. The objectives of this study were to 1) minimize N
input and thatch mass on Champion bermudagrass, 2) maximize root mass, and 3)
determine required N rate and growth regulator use while maintaining acceptable turf
quality.
19
Materials and Methods
A two year field study was conducted at Clemson University, Clemson, SC from
June 21, 2004 – June 8, 2006 on a newly established (by sprigs July 2003) Champion
bermudagrass research green (Appendix A). This research was designed to investigate a
two-year cumulative effect of nitrogen (N), trinexapac-ethyl (TE), and a granular thatch
reducer (Thatch-X) on turf quality, turf recovery, root mass, clipping yield, thatch levels,
and spring green-up. Plots were 2.7 X 1.8 meters arranged as a complete randomized
block design with four replications (Appendix C-3, C-4).
Initially, all plots received nitrogen at 12.1 kg ha-1 the first week of June 2004
using a greens-grade, or fine, granular fertilizer containing 18% N, 1% P, 15% K, 0.6%
Mg, 7% S, 1% Fe, 0.5% Mn, and 2% Cl. This application was made to ensure equal N
levels prior to the study. Additional potassium and phosphorus requirements were met
with K2HPO4 applied at 98 kg K ha-1 in July, August, and September annually.
Turf was irrigated as needed to prevent plant stress and mowed at 3.2 mm daily 7
times per week during the growing season, but the mowing frequency was reduced during
the winter months to 3 mowing per week with the overseeded roughstalk bluegrass (Poa
travialis L.). Bermudagrass was core cultivated with 1.3 cm diameter hollow tines with
5.0 cm spacing and 10.0 cm lengths on July 15 and September 3 of 2004 and May 25,
July 8, and August 16 of 2005. Cores were removed and holes were filled with sand
(Appendix A). Monthly sand topdressings (Appendix A) were applied in June, July, and
August of each year at approximately 15 m3 ha-1. All plots were overseeded September
30, 2004 and October 5, 2005 with 391 kg ha-1 roughstalk bluegrass with 95-97 %
germination rate. Before overseeding, plots were vertically mowed in two directions with
20
approximately a 2mm wide blade at 2cm spacing to a depth of 2.5 cm. Overseeding was
followed by rolling with a 3-reel Toro greens mower, topdressing at 15 m3 ha-1 and
rolling again, and watering 10 minutes by irrigation. Plots were kept moist through
frequent irrigation for 14 days following overseeding until emergence.
Nitrogen was applied biweekly at 12.2, 24.4, and 36.6 kg N ha-1 from June –
November in 2004, February – November in 2005, and February – June in 2006.
Nitrogen rates 12.2, 24.4, and 36.6 kg N ha-1 were equivalent to 244 (low), 488
(medium), and 732 (high) kg N ha-1 yr-1 over 20 applications, respectively, and are
referred to accordingly. Nitrogen treatments were applied as ammonium sulfate
((NH4)2SO4) with a CO2 backpack sprayer and followed by 10 minutes of irrigation. TE
treatments of 0 and 0.025 kg a.i. ha-1 (1EC) were applied 3-24 hours following all
nitrogen treatments with a CO2 backpack sprayer.
Thatch-X (Appendix C-5) was applied once per growing season in July at the
label-recommended rate of 146 kg ha-1 by hand shaker. Hand shaker was constructed by
drilling 2mm holes in the lid of a plastic medicine bottle. Thatch-X to be applied per plot
was placed into hand shaker and shaken evenly over plot and watered in.
Data Collection
Weekly evaluations of turf quality were made from June 25-September 27, 2004
and from May 30-October 4, 2005. Turf quality was visually evaluated on a scale of 1 to
9 with 1 = brown, dead turf, 7 = minimally acceptable turf, and 9 = dark green, healthy
turf. Turf aerification recovery was rated visually on a 0 to 100% scale where 0 equaled
no recovery and 100 equaled complete aerification recovery and was evaluated weekly
21
from the first aerification of the year until day of overseeding. Data are presented as
average percent recovery over the time periods measured.
Root and thatch samples were collected using a cylinder core sampler with a
diameter of 7.5 cm and a depth of 30 cm in July and September 2004 and 2005. Two
cores were taken from each plot with the average of the two cores representing the plot.
Thatch was separated from the roots after soil washing. Following washing, roots and
thatch were allowed 72 hours for air drying in a glass house before being placed in an
oven at 80 °C for 72 hours. Once dried, samples were weighed to determine total root
and thatch biomass. Root samples were analyzed by the Clemson Agriculture Service
Laboratory for N, P, K, Ca, Mg, S, Zn, Cu, Mn, Fe, and Na concentrations. Nitrogen
concentrations were determined using a LECO FP528 Nitrogen Combustion analyzer
(Warrendale, PA). Other plant tissue nutrients were determined using wet ashing
procedures with a Digestion Block Magnum Series Block Digester (Ivesdale, IL) and an
ICP model TJA-61E autosampler (Madison, WI).
Thatch samples were placed in a muffle furnace for two hours at 550 °C until
completely burned to ash (Appendix C-6). Ashes were weighed and subtracted from the
original thatch sample dry weight to obtain the final thatch biomass.
Clippings were harvested once in July and September 2004 and 2005 using a
walk-behind mower with a clipping collector. Clipping yields were recorded for
September 2004 harvest and both 2005 harvests. Clippings were evaluated for nutrient
content under same procedures described for roots above.
From April 9, 2005 – May 25, 2005 and from April 5, 2006 – April 18, 2006
spring green-up measurements were evaluated. The shortened data collection period in
22
2006 was due to warmer temperatures, which greatly increased the rate of spring green-
up. Biweekly evaluations of transition from overseeded bluegrass to bermudagrass were
visually rated as percent (0-100) bermudagrass green-up. Clippings were harvested on
May 24, 2005 and May 22, 2006 in same manner described above. Clipping yields were
recorded and nutrient analyses were obtained. Root samples were taken on May 25, 2005
and May 17, 2006 for total root biomass. Root biomass was recorded in same manner as
stated above.
Data Analysis
All statistical analyses were performed using the Statistical Analysis System [SAS
Institute, 2003]. Main and interaction effects were examined with ANOVA, and means
were separated by Fisher’s Least Significant Difference (LSD) test with alpha = 0.05.
Results and Discussions
A nitrogen and TE treatment interaction occurred for turfgrass quality (TQ) and
September clipping yield and will be examined as treatment combinations. Interactions
between years were not significant for Thatch-X treatment concerning turf recovery (TR)
or for TE and Thatch-X treatments concerning July clipping N content, September
clipping yield, September clipping N content, root mass, root N concentration, and thatch
mass; therefore, these data for years 1 and 2 were pooled. Shoot growth at July 2004
clipping harvest was not recorded.
23
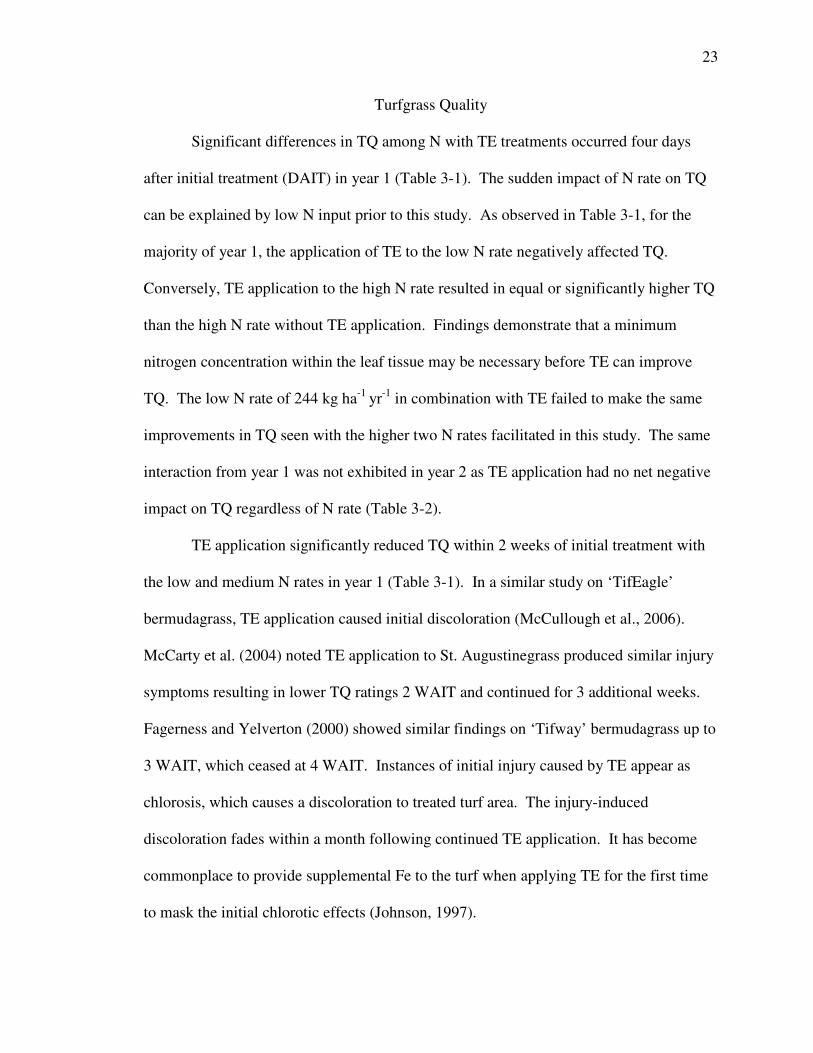
Turfgrass Quality
Significant differences in TQ among N with TE treatments occurred four days
after initial treatment (DAIT) in year 1 (Table 3-1). The sudden impact of N rate on TQ
can be explained by low N input prior to this study. As observed in Table 3-1, for the
majority of year 1, the application of TE to the low N rate negatively affected TQ.
Conversely, TE application to the high N rate resulted in equal or significantly higher TQ
than the high N rate without TE application. Findings demonstrate that a minimum
nitrogen concentration within the leaf tissue may be necessary before TE can improve
TQ. The low N rate of 244 kg ha-1 yr-1 in combination with TE failed to make the same
improvements in TQ seen with the higher two N rates facilitated in this study. The same
interaction from year 1 was not exhibited in year 2 as TE application had no net negative
impact on TQ regardless of N rate (Table 3-2).
TE application significantly reduced TQ within 2 weeks of initial treatment with
the low and medium N rates in year 1 (Table 3-1). In a similar study on ‘TifEagle’
bermudagrass, TE application caused initial discoloration (McCullough et al., 2006).
McCarty et al. (2004) noted TE application to St. Augustinegrass produced similar injury
symptoms resulting in lower TQ ratings 2 WAIT and continued for 3 additional weeks.
Fagerness and Yelverton (2000) showed similar findings on ‘Tifway’ bermudagrass up to
3 WAIT, which ceased at 4 WAIT. Instances of initial injury caused by TE appear as
chlorosis, which causes a discoloration to treated turf area. The injury-induced
discoloration fades within a month following continued TE application. It has become
commonplace to provide supplemental Fe to the turf when applying TE for the first time
to mask the initial chlorotic effects (Johnson, 1997).
24
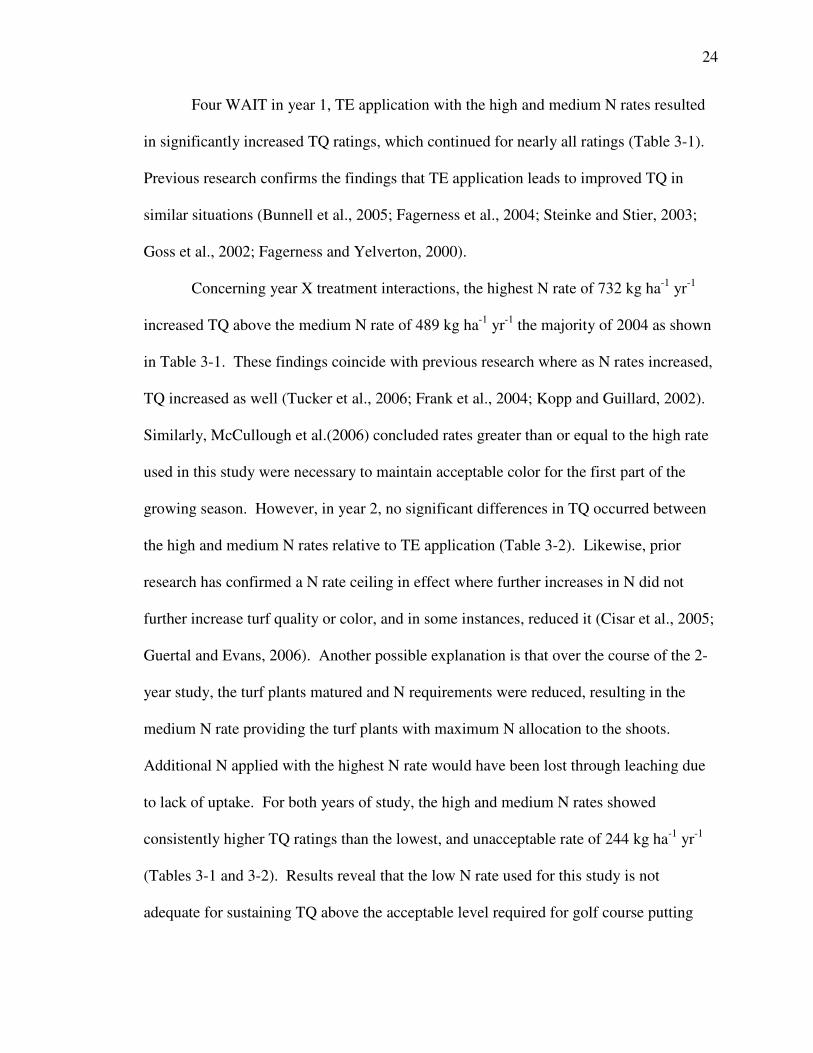
Four WAIT in year 1, TE application with the high and medium N rates resulted
in significantly increased TQ ratings, which continued for nearly all ratings (Table 3-1).
Previous research confirms the findings that TE application leads to improved TQ in
similar situations (Bunnell et al., 2005; Fagerness et al., 2004; Steinke and Stier, 2003;
Goss et al., 2002; Fagerness and Yelverton, 2000).
Concerning year X treatment interactions, the highest N rate of 732 kg ha-1 yr-1
increased TQ above the medium N rate of 489 kg ha-1 yr-1 the majority of 2004 as shown
in Table 3-1. These findings coincide with previous research where as N rates increased,
TQ increased as well (Tucker et al., 2006; Frank et al., 2004; Kopp and Guillard, 2002).
Similarly, McCullough et al.(2006) concluded rates greater than or equal to the high rate
used in this study were necessary to maintain acceptable color for the first part of the
growing season. However, in year 2, no significant differences in TQ occurred between
the high and medium N rates relative to TE application (Table 3-2). Likewise, prior
research has confirmed a N rate ceiling in effect where further increases in N did not
further increase turf quality or color, and in some instances, reduced it (Cisar et al., 2005;
Guertal and Evans, 2006). Another possible explanation is that over the course of the 2-
year study, the turf plants matured and N requirements were reduced, resulting in the
medium N rate providing the turf plants with maximum N allocation to the shoots.
Additional N applied with the highest N rate would have been lost through leaching due
to lack of uptake. For both years of study, the high and medium N rates showed
consistently higher TQ ratings than the lowest, and unacceptable rate of 244 kg ha-1 yr-1
(Tables 3-1 and 3-2). Results reveal that the low N rate used for this study is not
adequate for sustaining TQ above the acceptable level required for golf course putting

25
greens. Sudden decreases in TQ on July 18 and September 20 in year 1 and July 11 and
August 24 of year 2 revealed aerification injuries sustained to turf (Tables 3-1 and 3-2).
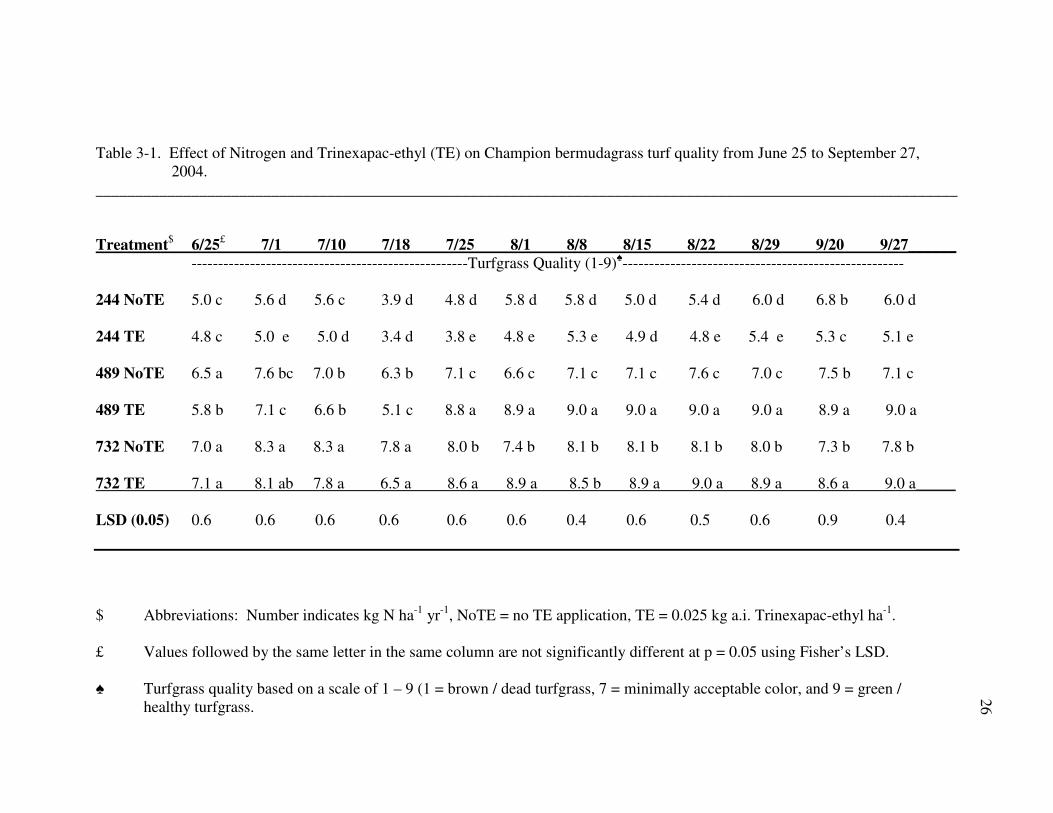
Table 3-1. Effect of Nitrogen and Trinexapac-ethyl (TE) on Champion bermudagrass turf quality from June 25 to September 27,2004.
____________________________________________________________________________________________________________
Treatment$ 6/25£ 7/1 7/10 7/18 7/25 8/1 8/8 8/15 8/22 8/29 9/20 9/27______----------------------------------------------------Turfgrass Quality (1-9)♠-----------------------------------------------------
244 NoTE 5.0 c 5.6 d 5.6 c 3.9 d 4.8 d 5.8 d 5.8 d 5.0 d 5.4 d 6.0 d 6.8 b 6.0 d
244 TE 4.8 c 5.0 e 5.0 d 3.4 d 3.8 e 4.8 e 5.3 e 4.9 d 4.8 e 5.4 e 5.3 c 5.1 e
489 NoTE 6.5 a 7.6 bc 7.0 b 6.3 b 7.1 c 6.6 c 7.1 c 7.1 c 7.6 c 7.0 c 7.5 b 7.1 c
489 TE 5.8 b 7.1 c 6.6 b 5.1 c 8.8 a 8.9 a 9.0 a 9.0 a 9.0 a 9.0 a 8.9 a 9.0 a
732 NoTE 7.0 a 8.3 a 8.3 a 7.8 a 8.0 b 7.4 b 8.1 b 8.1 b 8.1 b 8.0 b 7.3 b 7.8 b
732 TE 7.1 a 8.1 ab 7.8 a 6.5 a 8.6 a 8.9 a 8.5 b 8.9 a 9.0 a 8.9 a 8.6 a 9.0 a_____
LSD (0.05) 0.6 0.6 0.6 0.6 0.6 0.6 0.4 0.6 0.5 0.6 0.9 0.4
$ Abbreviations: Number indicates kg N ha-1 yr-1, NoTE = no TE application, TE = 0.025 kg a.i. Trinexapac-ethyl ha-1.
£ Values followed by the same letter in the same column are not significantly different at p = 0.05 using Fisher’s LSD.
♠ Turfgrass quality based on a scale of 1 – 9 (1 = brown / dead turfgrass, 7 = minimally acceptable color, and 9 = green /healthy turfgrass.
26
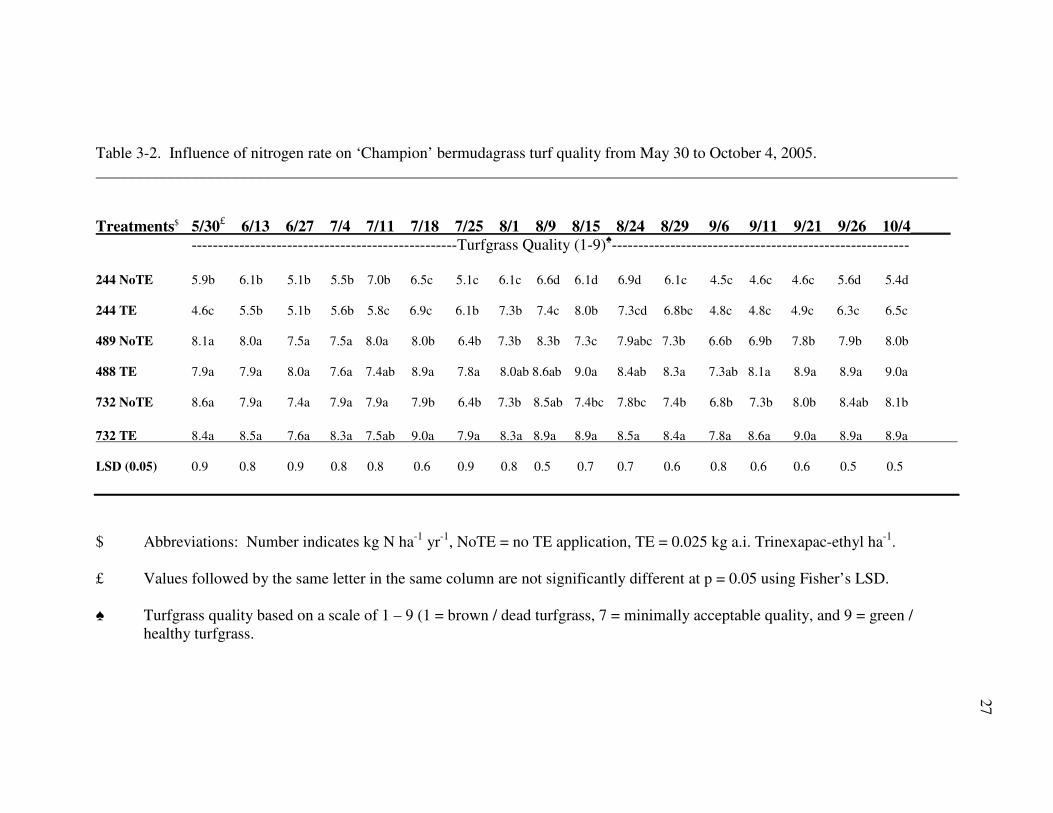
Table 3-2. Influence of nitrogen rate on ‘Champion’ bermudagrass turf quality from May 30 to October 4, 2005.____________________________________________________________________________________________________________
Treatments$ 5/30£ 6/13 6/27 7/4 7/11 7/18 7/25 8/1 8/9 8/15 8/24 8/29 9/6 9/11 9/21 9/26 10/4_____--------------------------------------------------Turfgrass Quality (1-9)♠--------------------------------------------------------
244 NoTE 5.9b 6.1b 5.1b 5.5b 7.0b 6.5c 5.1c 6.1c 6.6d 6.1d 6.9d 6.1c 4.5c 4.6c 4.6c 5.6d 5.4d
244 TE 4.6c 5.5b 5.1b 5.6b 5.8c 6.9c 6.1b 7.3b 7.4c 8.0b 7.3cd 6.8bc 4.8c 4.8c 4.9c 6.3c 6.5c
489 NoTE 8.1a 8.0a 7.5a 7.5a 8.0a 8.0b 6.4b 7.3b 8.3b 7.3c 7.9abc 7.3b 6.6b 6.9b 7.8b 7.9b 8.0b
488 TE 7.9a 7.9a 8.0a 7.6a 7.4ab 8.9a 7.8a 8.0ab 8.6ab 9.0a 8.4ab 8.3a 7.3ab 8.1a 8.9a 8.9a 9.0a
732 NoTE 8.6a 7.9a 7.4a 7.9a 7.9a 7.9b 6.4b 7.3b 8.5ab 7.4bc 7.8bc 7.4b 6.8b 7.3b 8.0b 8.4ab 8.1b
732 TE 8.4a 8.5a 7.6a 8.3a 7.5ab 9.0a 7.9a 8.3a 8.9a 8.9a 8.5a 8.4a 7.8a 8.6a 9.0a 8.9a 8.9a
LSD (0.05) 0.9 0.8 0.9 0.8 0.8 0.6 0.9 0.8 0.5 0.7 0.7 0.6 0.8 0.6 0.6 0.5 0.5
$ Abbreviations: Number indicates kg N ha-1 yr-1, NoTE = no TE application, TE = 0.025 kg a.i. Trinexapac-ethyl ha-1.
£ Values followed by the same letter in the same column are not significantly different at p = 0.05 using Fisher’s LSD.
♠ Turfgrass quality based on a scale of 1 – 9 (1 = brown / dead turfgrass, 7 = minimally acceptable quality, and 9 = green /healthy turfgrass.
27
28
Turfgrass Recovery
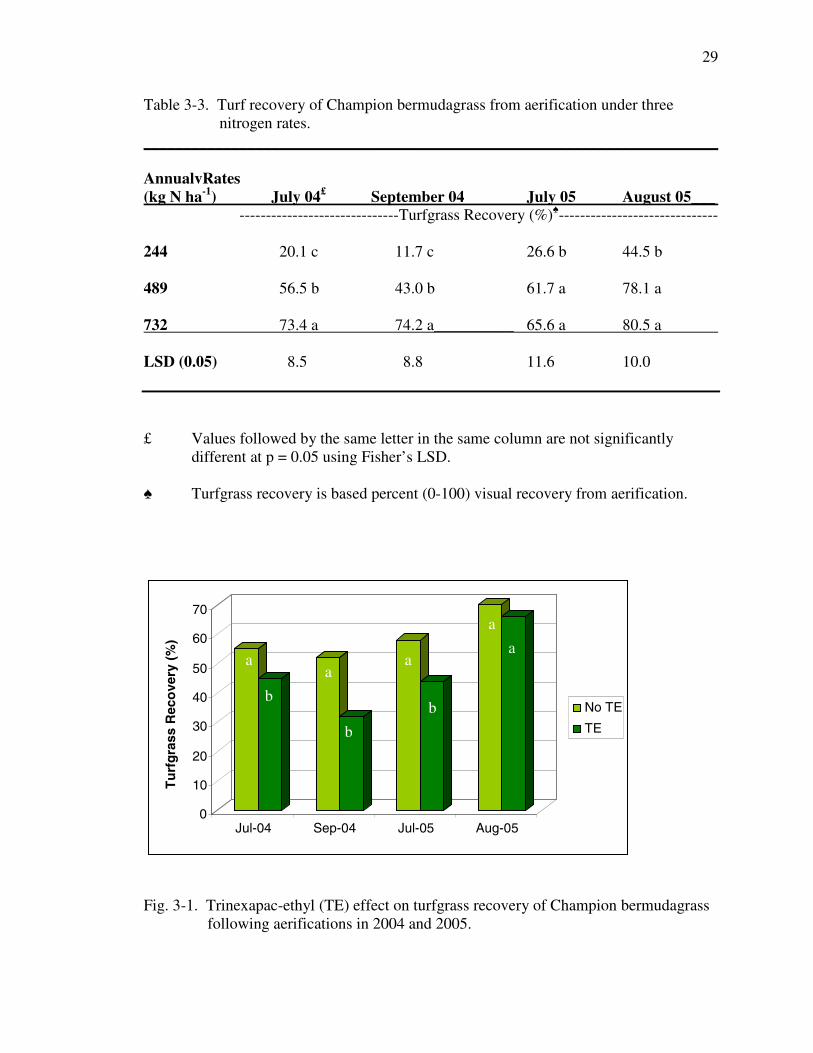
The ability of turfgrass to recover from injury, such as aerification, often dictates
the number of cultural thatch reducing methods used. Champion bermudagrass’ ability to
recover from aerification injury in year 1 directly related to N rate and TE application.
Table 3-3 shows, as N rate increased, the recovery rate of Champion from aerification
injury in year 1 increased as well. This agrees with prior research (McCullough et al.,
2006). In year 2 TR differences were similar between medium and high N rates and
consistently had higher recovery times than the lowest N rate of 244 kg ha-1 yr-1 (Table 3-
3). Again, the low N rate used in this study provided inadequate levels of N needed to
initiate speedy turf recovery.
TE application reduced recovery rate of Champion bermudagrass following three
out of four aerifications measured; two in year 1 and one in year 2 (Fig. 3-1). As evident
in Fig. 3-1, TE application in year 1 reduced turfgrass recovery rate 19% in July and 40%
in September. However, TE application in year 2 was less consistent. Year 2 TE
application following July aerification reduced TR 26%, however, the August aerification
of year 2 did not slow recovery as the previous year (Fig. 3-1). Similar research studying
TE effects under stressful and damaging conditions concluded that turf recovery can be
impeded by TE application (McCullough et al., 2006; Ervin and Koski, 2001). Although
TE has been shown to increase turf density, it does so by increasing the number of lateral
shoots in a given area, not the length (Syngenta Crop Sciences, Inc.). Therefore, TE
application is not recommended in situations where lengthy growth of stolons is
necessary to facilitate a full recovery from injury.
29
Table 3-3. Turf recovery of Champion bermudagrass from aerification under threenitrogen rates.
________________________________________________________________________
AnnualvRates(kg N ha-1) July 04£ September 04 July 05 August 05___
------------------------------Turfgrass Recovery (%)♠------------------------------
244 20.1 c 11.7 c 26.6 b 44.5 b
489 56.5 b 43.0 b 61.7 a 78.1 a
732 73.4 a 74.2 a__________ 65.6 a 80.5 a
LSD (0.05) 8.5 8.8 11.6 10.0
£ Values followed by the same letter in the same column are not significantlydifferent at p = 0.05 using Fisher’s LSD.
♠ Turfgrass recovery is based percent (0-100) visual recovery from aerification.
Fig. 3-1. Trinexapac-ethyl (TE) effect on turfgrass recovery of Champion bermudagrassfollowing aerifications in 2004 and 2005.
0
10
20
30
40
50
60
70
ggg
Jul-04 Sep-04 Jul-05 Aug-05
No TE
TE
a
b
a
b
a
b
a
a
Tu
rfg
rass
Rec
ove
ry(%
)
30
Root Mass
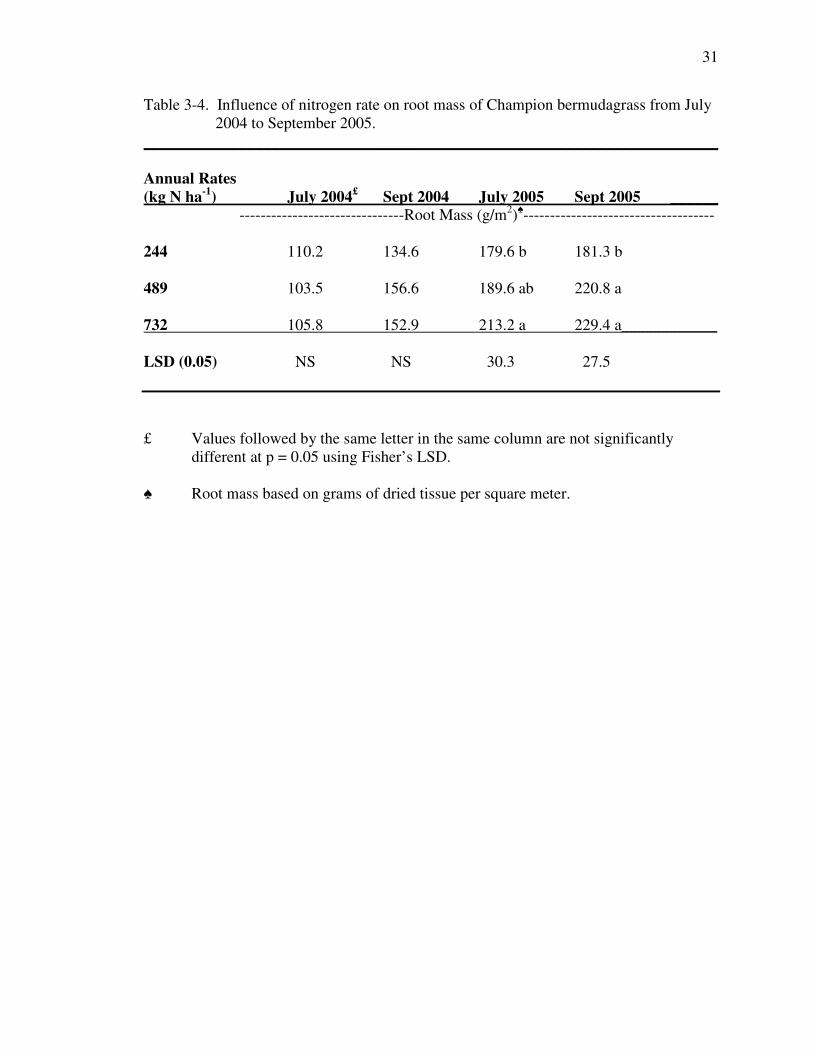
In year 1, N rates did not influence root mass; however, in year 2, increasing
nitrogen rate affected rooting (Table 3-4). Table 3-4 further shows July root sampling in
year 2 confirmed the N rate of 732 kg ha-1 yr-1 increased root mass by 19% over the rate
of 244 kg N ha-1 yr-1 rate. In September of the same year, both rates of 488 and 732 kg N
ha-1 yr-1 increased root mass by 22% and 27% over the rate of 244 kg N ha-1 yr-1,
respectively. In a study conducted by Tucker et al. (2006), an equivalent increase in N
rate from 488 to 976 kg N ha-1 yr-1 substantially increased root length density and root
surface area. Recent research by Guertal and Evans (2006) revealed similar findings.
Alternatively, other studies have shown high rate nitrogen application having no effects
or negative effects on root mass and lower N rates increasing total root biomass
(Bowman et al., 2005; Goss et. al., 2002; Ervin and Koski, 2001). From left to right,
Table 3-4 reveals the gradual increase in root mass over time with all N treatments. Root
mass was not significantly affected by TE or Thatch-X treatments.
31
Table 3-4. Influence of nitrogen rate on root mass of Champion bermudagrass from July2004 to September 2005.
________________________________________________________________________
Annual Rates(kg N ha-1) July 2004£ Sept 2004 July 2005 Sept 2005 ______
-------------------------------Root Mass (g/m2)♠------------------------------------
244 110.2 134.6 179.6 b 181.3 b
489 103.5 156.6 189.6 ab 220.8 a
732 105.8 152.9 213.2 a 229.4 a____________
LSD (0.05) NS NS 30.3 27.5
£ Values followed by the same letter in the same column are not significantlydifferent at p = 0.05 using Fisher’s LSD.
♠ Root mass based on grams of dried tissue per square meter.
32
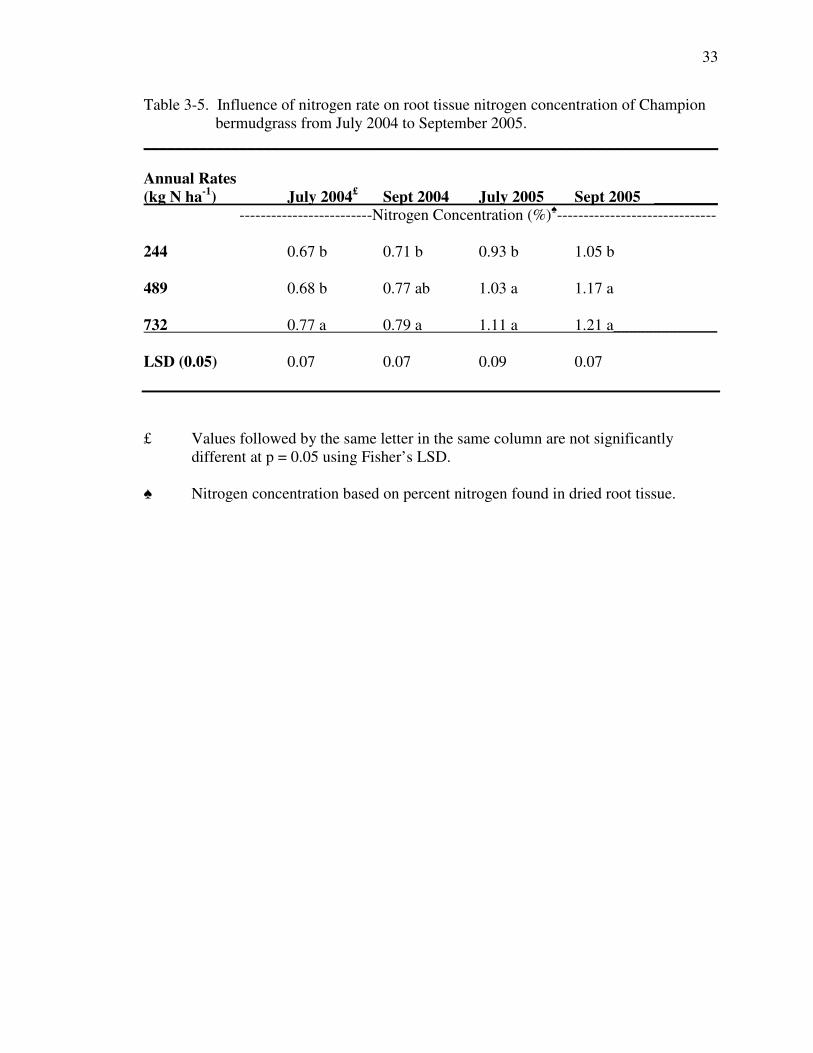
Root Nutrient Analysis
Throughout the study, 732 kg N ha-1 yr-1 rate consistently provided higher N
content in the root tissue than did the lowest N rate of 244 kg N ha-1 yr-1 (Table 3-5).
From left to right, Table 3-5 also reveals either a build-up of N storage within the root
tissues by the second year of study or an increased ability of the turfgrass roots to absorb
N. A build-up of N in the roots would contrast with previous research noting recently
absorbed N is largely allocated to new leaves in a short period of time (Bowman et al.,
2002). However, based on the calculations of a similar study, turf stored 2170 kg N ha-1
following three months of study, 34% of which was in the roots, indicating considerable
nitrogen storage capacity of bermudagrass (Fagerness et al., 2004). Bowman et al.
(2005) found high salinity increased retention of N in the roots; however, salinity levels
were not measured in this study. It is also possible that during the first year of study the
turfgrass root system was underdeveloped, leading to less N uptake. By the second
season of study, the root system may have become much more extensive, providing an
increased rate of N uptake resulting in increased N levels in the root tissue at times of
analysis.
33
Table 3-5. Influence of nitrogen rate on root tissue nitrogen concentration of Championbermudgrass from July 2004 to September 2005.
________________________________________________________________________
Annual Rates(kg N ha-1) July 2004£ Sept 2004 July 2005 Sept 2005 ________
-------------------------Nitrogen Concentration (%)♠------------------------------
244 0.67 b 0.71 b 0.93 b 1.05 b
489 0.68 b 0.77 ab 1.03 a 1.17 a
732 0.77 a 0.79 a 1.11 a 1.21 a_____________
LSD (0.05) 0.07 0.07 0.09 0.07
£ Values followed by the same letter in the same column are not significantlydifferent at p = 0.05 using Fisher’s LSD.
♠ Nitrogen concentration based on percent nitrogen found in dried root tissue.
34
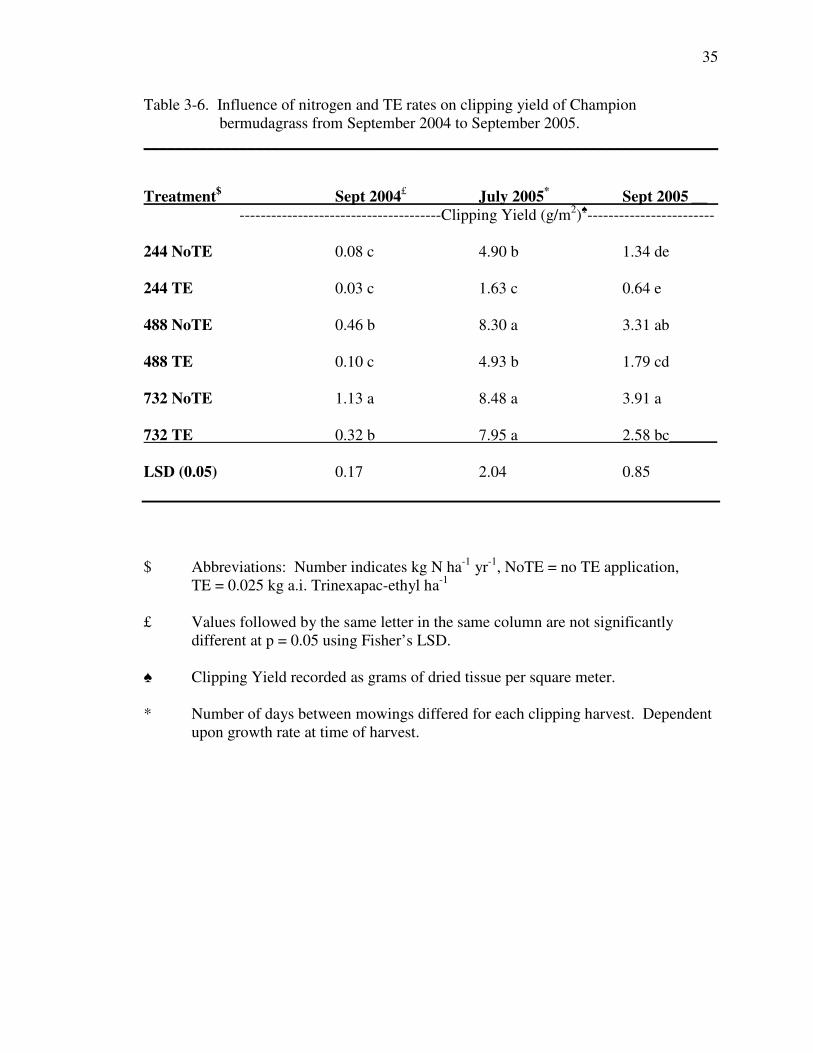
Clipping Yield
An interaction occurred between N and TE in September 2004 and 2005, which
can be readily observed in Table 3-6. As N rates increased, the effectiveness of TE to
reduce clipping production increased, resulting in a curvilinear relationship. As
witnessed with TQ, the application of TE with low N rates may prove ineffective in the
putting green situation where clippings are routinely removed.
Another noteworthy observation was the reduced effectiveness of TE on the high
N rate versus medium N rate in 2005 (Table 3-6). The high and medium N rates
provided significantly equivalent clipping yields in year 2 under no TE treatment;
however, under TE treatment, clippings were more drastically reduced for the medium N
rate. It was unclear whether this occurrence was random or whether another interaction
between N rate and TE occurred.
When significant, TE application resulted in an average clipping reduction of 56%
(Table 3-6). Research on other turfgrasses has resulted in similar findings in clipping
reduction (McCullough et al., 2006; Fagerness et. al., 2004; McCarty et. al., 2004; Goss
et. al., 2002; Fagerness and Yelverton, 2000).
For years 1 and 2, as N rate increased, clipping yield significantly increased for all
clipping harvestings measured with September clipping harvest in year 1 revealing an
average increase in clipping yield of 209% for every 244 kg ha-1 yr-1 increase in N rate
without TE annually (Table 3-6). Subsequent clipping harvests in year 2 revealed similar
results (Table 3-6). These findings were expected given recent research (Bowman et al.,
2005) and that increased N application results in increased allocation of N to shoots
resulting in flushes of growth.
35
Table 3-6. Influence of nitrogen and TE rates on clipping yield of Championbermudagrass from September 2004 to September 2005.
________________________________________________________________________
Treatment$ Sept 2004£ July 2005* Sept 2005 __--------------------------------------Clipping Yield (g/m2)♠------------------------
244 NoTE 0.08 c 4.90 b 1.34 de
244 TE 0.03 c 1.63 c 0.64 e
488 NoTE 0.46 b 8.30 a 3.31 ab
488 TE 0.10 c 4.93 b 1.79 cd
732 NoTE 1.13 a 8.48 a 3.91 a
732 TE 0.32 b 7.95 a 2.58 bc______
LSD (0.05) 0.17 2.04 0.85
$ Abbreviations: Number indicates kg N ha-1 yr-1, NoTE = no TE application,TE = 0.025 kg a.i. Trinexapac-ethyl ha-1
£ Values followed by the same letter in the same column are not significantlydifferent at p = 0.05 using Fisher’s LSD.
♠ Clipping Yield recorded as grams of dried tissue per square meter.
* Number of days between mowings differed for each clipping harvest. Dependentupon growth rate at time of harvest.
36
Clipping Nutrient Analysis
Similar to root nutrient analysis, as N rate increased, N concentration within the
leaf tissue increased for July 2004 and September samplings (Table 3-7). Similar
findings exist in previous research proving that a linear relationship exists between N rate
and N concentration in leaf tissue (Kopp and Guillard, 2002). July 2005 data were
similar, however, lacked statistical difference between the high and medium N rates
(Table 3-7). Adequate nitrogen levels within the leaf tissue are between 2 and 6% dry
weight (McCarty, 2005; Carrow et al., 2002). As shown in Table 3-7, all N treatments
resulted in adequate nitrogen concentration within the leaf tissue. TE provided no
reduction in N allocation to leaf tissue contrary to previous research by Fagerness et al.
(2004) where 25% reduction was observed.

37
Table 3-7. Influence of nitrogen rate on clipping tissue nitrogen concentration ofChampion bermudagrass from July 2004 to September 2005.
________________________________________________________________________
Treatments$ July 2004£ July 2005 Sept (2004 and 2005)--------------------------Nitrogen Concentration (%)♠-----------------------------
244 NoTE 2.7 d 3.8 b 3.5 d
244 TE 2.6 d 3.7 b 3.5 d
488 NoTE 3.7 b 4.3 a 4.2 bc
488 TE 3.2 c 4.1 a 4.1 c
732 NoTE 4.4 a 4.2 a 4.5 a
732 TE 4.2 a 4.4 a 4.4 ab_____________
LSD (0.05) 0.4 0.3 0.3
$ Abbreviations: Number indicates kg N ha-1 yr-1, NoTE = no TE application,TE = 0.025 kg a.i. Trinexapac-ethyl ha-1.
£ Values followed by the same letter in the same column are not significantlydifferent at p = 0.05 using Fisher’s LSD.
♠ Nitrogen Concentration based on percent nitrogen found in dried leaf tissue.
38
Thatch Dry Weight
Table 3-8 indicates by the end of year 1 thatch mass accumulation was 17%
higher with the high versus low N rate. A similar study on TifEagle bermudagrass
established higher N rates led to increased thatch layer depth (Tucker et al., 2006).
Alternatively, year 2 data are less concise and show no relationships concerning N rates
occurring although visual differences between some samples were noticeable (Appendix
C-7). It is unclear why thatch levels for the high N rate was equivalent to that of the
medium and low rates by study’s end.
TE application in year 1 had a significant decrease in thatch mass at September’s
sampling (Table 3-9). However, as observed with N rates, TE had no influence in year 2.
Thatch-X application had no significant impact on thatch mass throughout the two
year study (Fig. 3-2). Recent research has shown Thatch-X effectively reducing thatch
depth in creeping bentgrass (Willis et al., 2006). Application method may have inhibited
Thatch-X activity in our study as granules were applied on the turf surface. In the study
mentioned above, Willis et al. (2006) applied Thatch-X in aerification holes, possibly
increasing product placement efficacy. An additional noteworthy observation was the
rapid rate thatch develops on hybrid bermudagrass putting greens (Fig. 3-2). From the
first thatch sampling in July 2004 to the last sampling in September 2005, thatch mass
increased about 34%.

39
Table 3-8. Influence of nitrogen rate on thatch mass of Champion bermudagrass fromJuly 2004 to September 2005.
____________________________________________________________________ ___
Annual Rates(kg N ha-1) July 2004£ Sept 2004 July 2005 Sept 2005 _________
------------------------------Thatch Mass (g/m2)♠-----------------------------------
244 1256.4 1503.9 b 1652.6 1736.1
489 1330.2 1628.6 ab 1546.3 1796.4
732 1372.8 1761.5 a 1576.2 1786.9 ___________
LSD (0.05) NS 176.0 NS NS
£ Values followed by the same letter in the same column are not significantlydifferent at p = 0.05 using Fisher’s LSD.
♠ Thatch mass based on grams of dried thatch tissue per square meter.
Table 3-9. Influence of Trinexapac-ethyl (TE) on thatch mass of Championbermudagrass from July 2004 to September 2005.
________________________________________________________________________
TE Rate(kg a.i. ha-1) July 2004£ Sept 2004 July 2005 Sept 2005 _________
------------------------------Thatch Mass (g/m2)♠----------------------------------
0 1341.0 1703.7 a 1609.1 1786.9
0.025 1298.6 1559.0 b 1574.3 1759.4 ___________
LSD (0.05) NS 143.7 NS NS
£ Values followed by the same letter in the same column are not significantlydifferent at p = 0.05 using Fisher’s LSD.
♠ Thatch mass based on grams of dried thatch tissue per square meter.
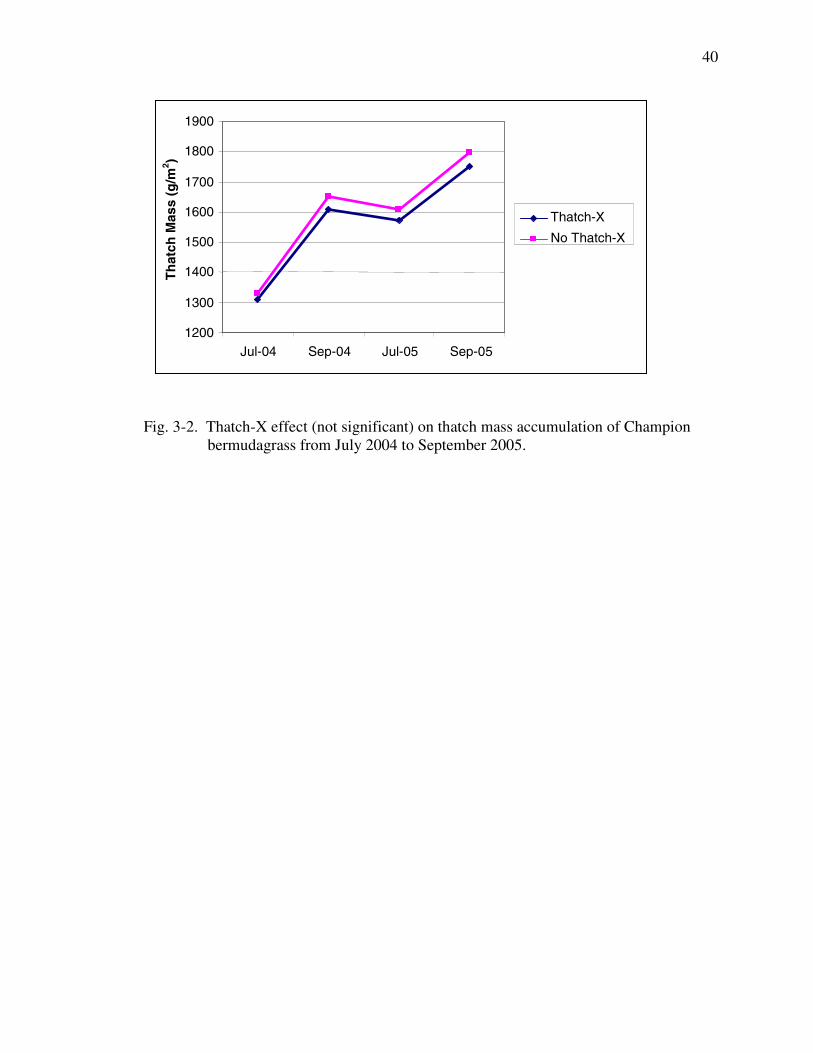
40
Fig. 3-2. Thatch-X effect (not significant) on thatch mass accumulation of Championbermudagrass from July 2004 to September 2005.
1200
1300
1400
1500
1600
1700
1800
1900
Jul-04 Sep-04 Jul-05 Sep-05
Th
atch
Mas
s(g
/m2 )
Thatch-X
No Thatch-X
41
Spring Green-Up Measurements
Spring green-up measurements include turf clippings, rooting, and spring green-
up.
Clippings
Spring 2005 and 2006 had no N rate X year interactions for N concentration;
however, N rate X year interactions did occur for clipping weight, and, consequently,
data for these years will be shown separately.
Data for spring clipping N concentrations were not different from July and
September clippings. Clipping nitrogen content levels were significantly different for the
three N rates. The lowest N rate, as expected, always provided the lowest N
concentration in the leaf tissue while the higher rates each provided significantly higher
N concentrations (Fig. 3-3). TE nor Thatch-X had any significant impact on clipping N
concentrations.
In 2005, as nitrogen increased from the lowest to the highest rate, clipping yield
significantly increased (Fig. 3-4). Fig. 3-4 further shows the medium N rate having no
significant difference from either the low or high N rates in 2005. However, in 2006, the
medium N rate was not found to be significantly different from the high N rate (Fig. 3-4).
The same relationship continued in 2006 with the high N rate providing significantly
higher clipping yield than the low N rate. Differences in clipping yield totals from 2005
to 2006 were most likely associated with weather differences attributing to additional
growth between mowings. TE treatments again reduced clippings in spring throughout
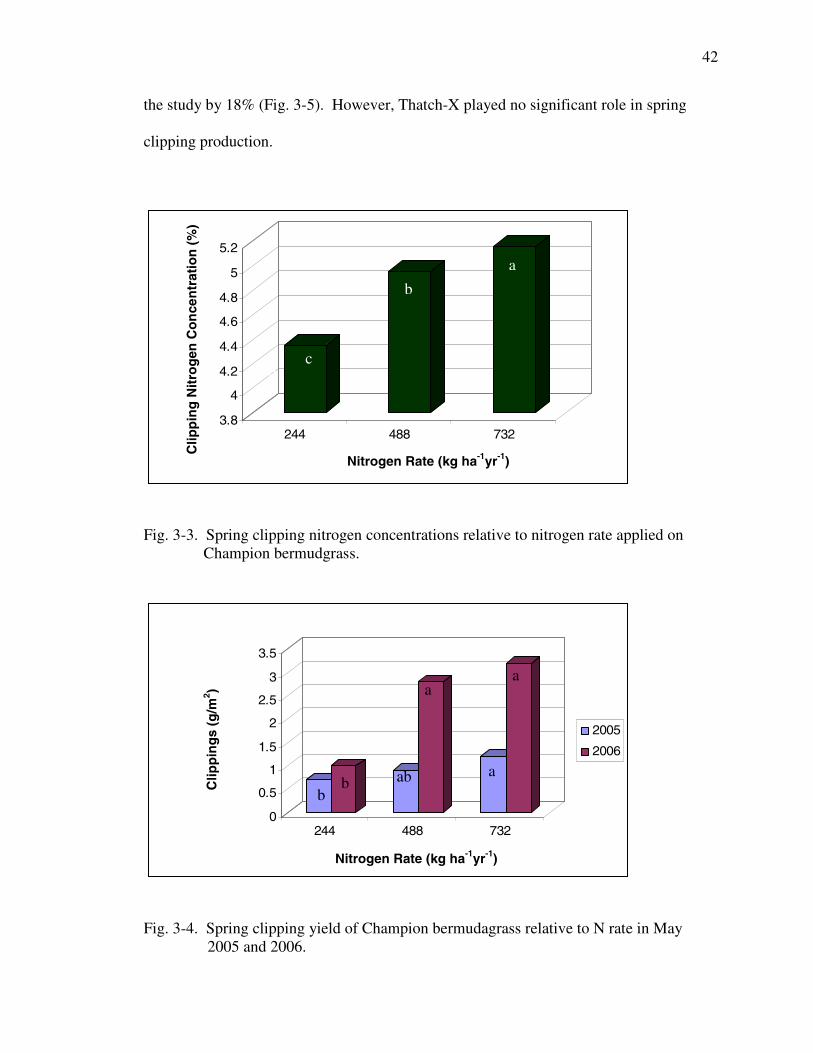
42
the study by 18% (Fig. 3-5). However, Thatch-X played no significant role in spring
clipping production.
3.8
4
4.2
4.4
4.6
4.8
5
5.2
ddd
244 488 732
ddd
Fig. 3-3. Spring clipping nitrogen concentrations relative to nitrogen rate applied onChampion bermudgrass.
0
0.5
1
1.5
2
2.5
3
3.5
Clipping Yield(g/m2)
244 488 732
2005
2006
Fig. 3-4. Spring clipping yield of Champion bermudagrass relative to N rate in May2005 and 2006.
a
b
c
a
bb
a
a
ab
c
Nitrogen Rate (kg ha-1yr-1)
Clip
pin
gs
(g/m
2 )
Nitrogen Rate (kg ha-1yr-1)
Clip
pin
gN
itro
gen
Co
nce
ntr
atio
n(%
)
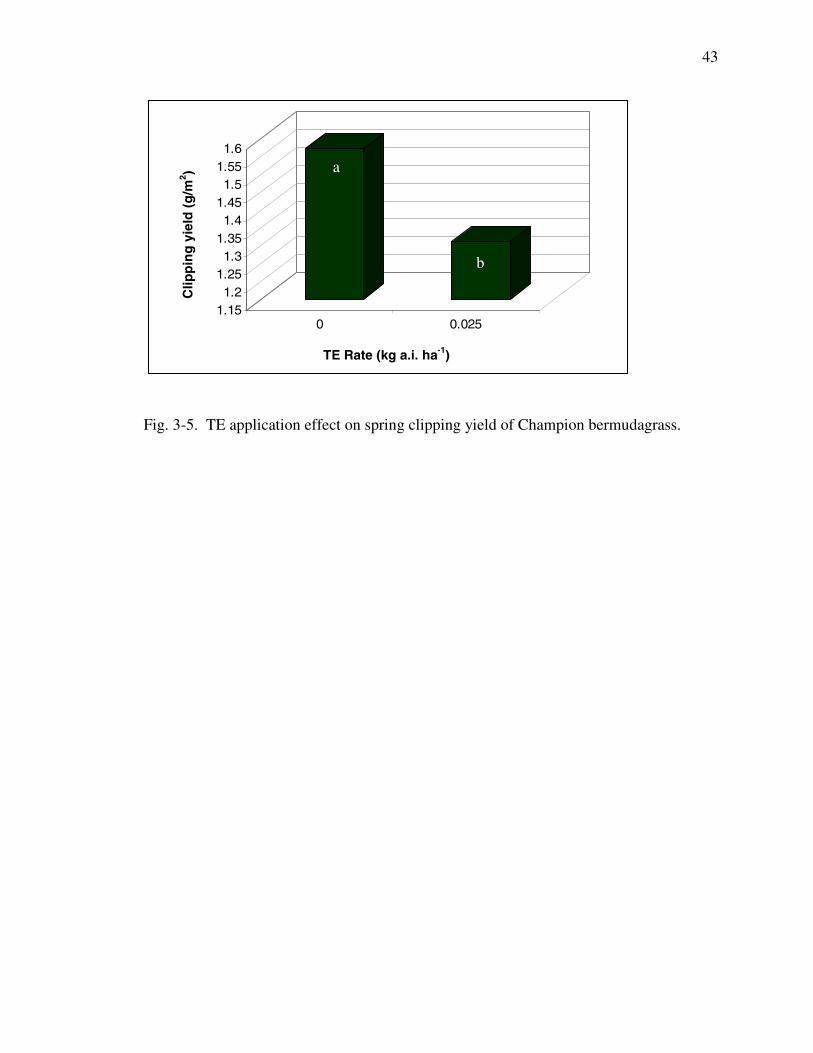
43
1.151.2
1.251.3
1.351.4
1.451.5
1.551.6
dfd
0 0.025
jj
Fig. 3-5. TE application effect on spring clipping yield of Champion bermudagrass.
a
b
TE Rate (kg a.i. ha-1)
Clip
pin
gyi
eld
(g/m
2 )
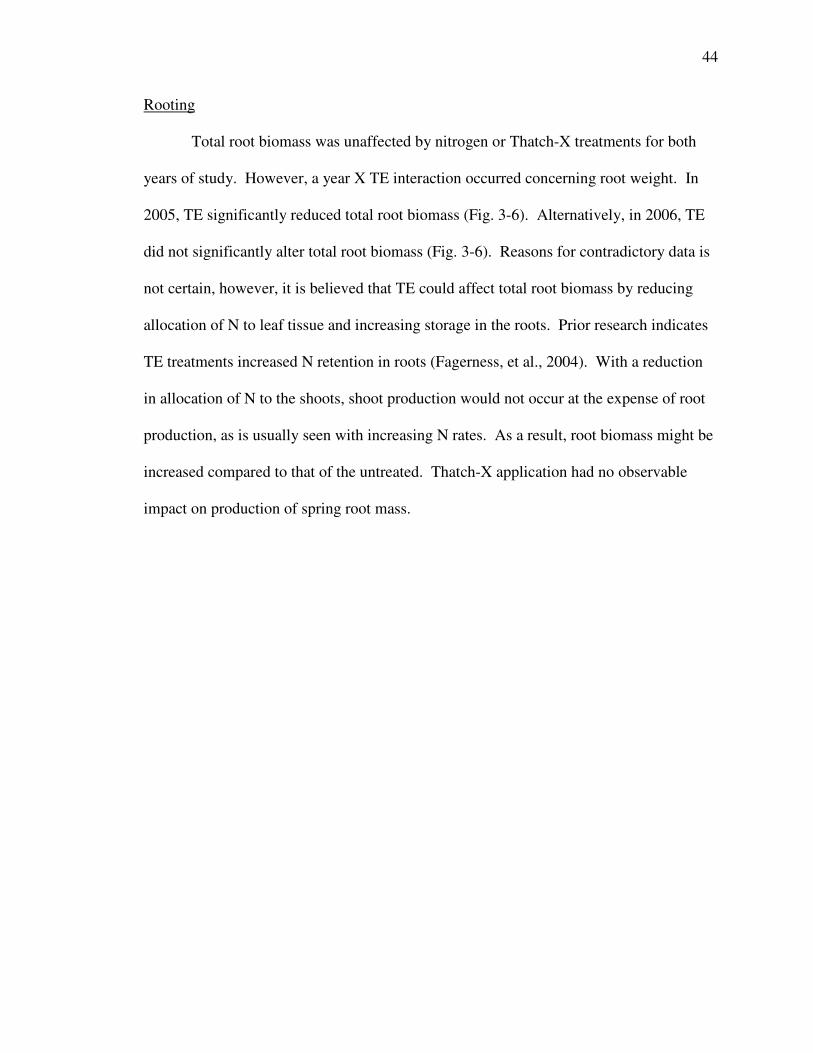
44
Rooting
Total root biomass was unaffected by nitrogen or Thatch-X treatments for both
years of study. However, a year X TE interaction occurred concerning root weight. In
2005, TE significantly reduced total root biomass (Fig. 3-6). Alternatively, in 2006, TE
did not significantly alter total root biomass (Fig. 3-6). Reasons for contradictory data is
not certain, however, it is believed that TE could affect total root biomass by reducing
allocation of N to leaf tissue and increasing storage in the roots. Prior research indicates
TE treatments increased N retention in roots (Fagerness, et al., 2004). With a reduction
in allocation of N to the shoots, shoot production would not occur at the expense of root
production, as is usually seen with increasing N rates. As a result, root biomass might be
increased compared to that of the untreated. Thatch-X application had no observable
impact on production of spring root mass.
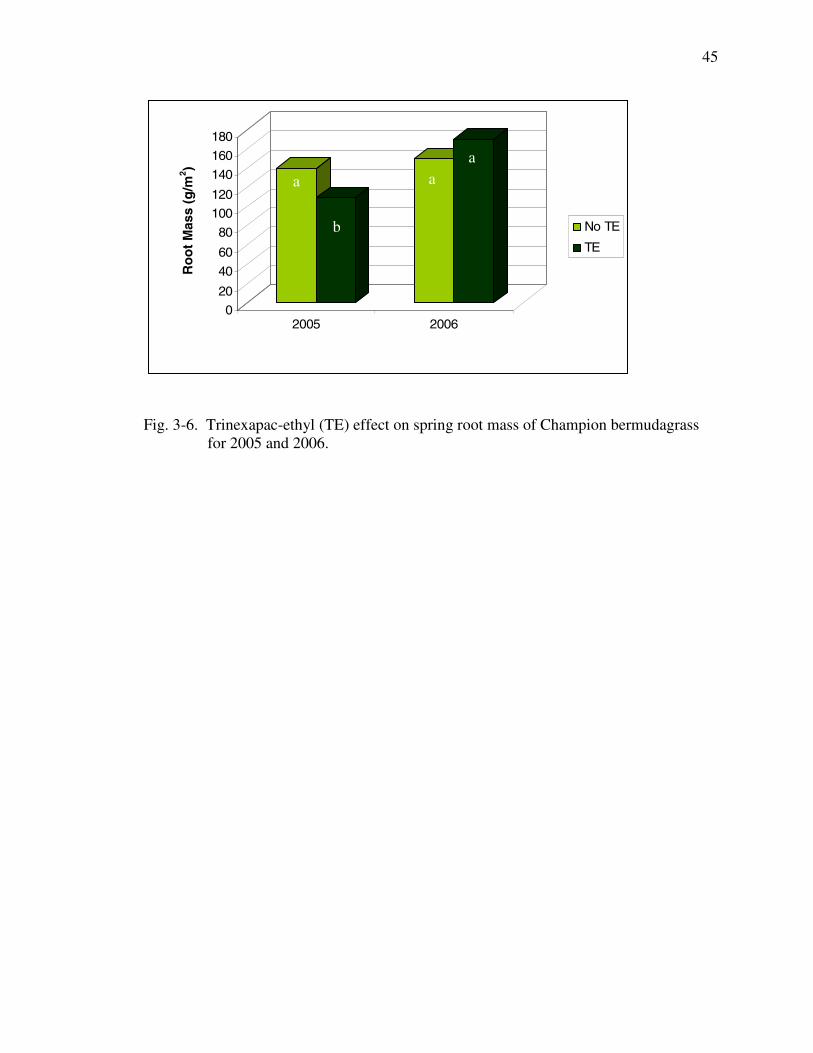
45
0
20
40
60
80
100
120
140
160
180
dddd
2005 2006
ddddd
No TE
TE
Fig. 3-6. Trinexapac-ethyl (TE) effect on spring root mass of Champion bermudagrassfor 2005 and 2006.
a
b
aa
Ro
ot
Mas
s(g
/m2 )

46
Spring Green-Up
Spring green-up from overseeded roughstalk bluegrass to bermudagrass had no
year X treatment interactions, thus yearly data were compiled. Compiled data from
spring 2005 and 2006 revealed N treatments significantly altering the rate of spring
green-up. Unexpectedly, the high N rate significantly inhibited the rate of bermudagrass
green-up, while the medium and low rates each significantly increased the rate of green-
up (Fig. 3-7). The low N rate provided the most rapid increase of transition from
overseed to bermudagrass over the three to six week period of green-up. Conversely,
previous research has disclosed data revealing high late-season N rates promoting color
retention in fall and spring and enhancing spring green-up (Munshaw et al., 2006; Guertal
and Evans, 2006; Goatley, 1998 and 1994; Chalmers, 1993). These studies, however,
provide no evidence of overseeding, and therefore, it is hypothesized that the higher N
rates applied in the late fall months of the prior year and the following spring months of
this study led to delayed spring green up by providing optimal growing conditions for the
roughstalk bluegrass over bermudagrass. An additional explanation is that the higher N
applications caused bermudagrass spring shoot growth at the expense of spring root
growth, which also would have delayed spring green up. TE and Thatch-X did not
significantly affect the rates of spring green-up in this study.
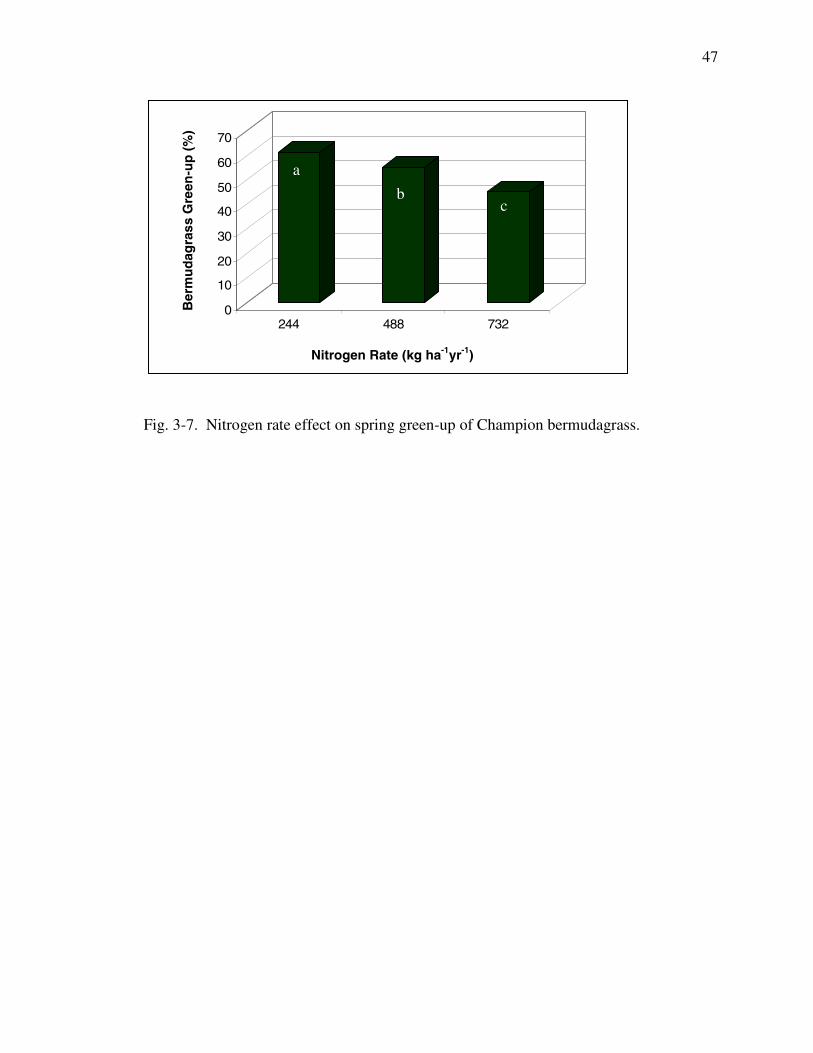
47
0
10
20
30
40
50
60
70
dd
244 488 732
dd
Fig. 3-7. Nitrogen rate effect on spring green-up of Champion bermudagrass.
a
bc
Nitrogen Rate (kg ha-1yr-1)
Ber
mu
dag
rass
Gre
en-u
p(%
)
48
Conclusions
Nitrogen rates play an important role in Champion bermudagrass turf quality in
the transition zone. Year 1 of this study revealed N rate of 732 kg ha-1 yr-1 was preferred
to provide optimal putting and playing conditions in the golf course situation, however
not necessary as N applied at 488 kg ha-1 yr-1 provided adequate playing conditions. Year
2, however, revealed the possibility of N reduction as turfgrass quality peaked with the
medium N rate in combination with TE. Contrary to previous research on TifEagle
bermudagrass with ammonium sulfate as the N source, the medium rate used in this study
consistently provided acceptable turf quality perhaps revealing differences in N
requirements between the two ultradwarfs (Tucker et al., 2006). Alternative TifEagle
research incorporating ammonium nitrate as the N source revealed rates equivalent to the
medium rate used in this study provided adequate turf quality for most of the year
(McCullough et al., 2006). These conflicting data may disclose N source differences
among ultradwarfs which determine N rate required. Further research is needed
concerning N source to confirm this hypothesis. Upon closer examination of turf quality
data for both years of study, it can be concluded that acceptable turf can be obtained with
no more than 488 kg N ha-1
yr-1 with the addition of TE. O’Brien and Hartwiger (2001) made similar conclusions of
ultradwarf bermudagrasses stating that N rates of 293-586 kg N ha-1 yr-1 were optimal in
the southeast United States.
The most notable observation was that the medium N rate, when coupled with TE,
provided increased TQ over the high N rate without TE, resulting in a 33% reduction in
N input. As with previous research, TE reduced or maintained TQ for a short period
49
before providing increased color and quality of turf. Field use indicates the addition of
iron with the first TE applications alleviates most discoloring encountered. TE is not
recommended for use in low N situations as TQ was reduced throughout the study for the
244 kg N ha-1 yr-1 rate.
Time played a significant role in this study as year 1 N rates continually provided
data differing from year 2 N rates concerning turf quality, turf recovery, root N
concentrations, thatch mass, and spring green-up clipping weights. Interestingly, the
same trend occurred across these measurements. In year 1 the high N rate provided
results which significantly differed from the medium N rate, yet in year 2, the high and
medium N rates were not significantly different from one another under each of these
measurements. Data suggest the establishment year for Champion bermudagrass
required a higher input of N than did the following year of study. It is therefore
hypothesized that N rates can continually be reduced as the turf stand matures.
One of the primary objectives of this study was to reduce, or impede thatch
accumulation by altering N rates and incorporating a plant growth regulator and a
granular thatch reducer. Thatch mass was impeded in September of year 1 with the
application of low N and TE. Year 2, however, revealed their impact to be negligible.
These results indicate the ability of thatch to be impacted with N rates and plant growth
regulator application following establishment year may decrease. Thatch-X application
also neglected to provide thatch mass reduction throughout the study. Thatch-X applied
at higher rates or incorporated into aerification holes might have led to increased
efficiency. It was observed that thatch mass increased throughout the study regardless of
treatment or cultural practices.
50
Spring green-up measurements provided insightful data which might prove to be
very useful for golf course superintendents intending to overseed Champion
bermudagrass in the transition zone. Findings illustrated lower N input provided
increased speed of spring green-up while reducing what appeared to be Spring Dead Spot
(SDS) occurrence in year 1, though not sampled. The same irregular patches did not
occur in the spring of year 2, possibly from the acidifying effect of ammonium sulfate
which prevented SDS occurrence (Hill et al., 2002). It is recommended that a more
practical study of spring and fall N rates be established, further investigating N timing
and disease occurrence.
CHAPTER 4
EFFECTS OF PAINTING ON DORMANT BERMUDAGRASS
PUTTING GREENS
Introduction
Bermudagrass growth stops when night time temperatures begin to drop below 10
oC. This is accompanied by discoloration of the turf when temperatures drop below 0 oC
(McCarty, 2005; McCarty and Miller, 2002) and eventually to full dormancy as
temperatures become lower than the freezing point. Superintendents in the south and
transition zone of the USA, therefore, often overseed bermudagrass greens for winter
play, which meets golfers’ desire for play on green grass and increased profits for golf
courses.
The most common overseeded cool-season turfgrasses to dormant bermudagrass
greens are rough bluegrass (Poa trivilias L.) and perennial ryegrass (Lolium perenne L.).
When an overseeding season starts, the bermudagrass is often not fully dormant and is
still competing for water and nutrients. Overseeding is destructive for the existing
bermudagrass turf as it involves a verticutting process or other physical disruption in
order to have a good contact between the new seeds and the soil. In order to form a
quality putting green, the cool-season turfgrass is often overseeded at a high seeding rate.
The new germinated turf and the several months of winter growth may cause weakened
bermudagrass turf and potentially catastrophic problems during spring transition. In
52
severe cases, a golf course will transition from an overseeded cool-season grass to dead
turf, or even dirt.
Other problems include increased susceptibility to spring dead spot and other
diseases, delayed spring green up, and the inability to remove the overseeded grass,
which then becomes a noxious weed. In addition to these management problems, cost
concerns occur. Overseeding is viewed by most golf course professionals as a high-cost
practice necessary to retain winter-play customers. For all these reasons, turf
professionals have searched for alternatives to overseeding and identified one in the
simplest of areas, painting.
Painting of greens has recently become the number one alternative to overseeding
greens for winter color (Shearman et al., 2005). The practice is gaining notoriety because
of its inexpensiveness, attractiveness, bermudagrass health maintenance, and playability
(McCarty, 2005). Memphis Country Club in Tennessee has been successfully painting
‘Champion’ bermudagrass (C. dactylon (L.) Pers. X C. transvaalensis Burtt-Davy)
putting greens for 15 years (Carson, 2004).
Cost savings from painting golf course greens could be applied in other areas of
required maintenance (McCarty, 2005). Costs of painting greens range from $900 to
$3000 total per season for an 18-hole golf course depending on number of applications
and price of paints (Carson, 2004). The average 18-hole course has about 1.2 hectares of
greens and overseeding costs up to $6000 per season plus requires additional labor costs
for mowing, watering, and pest control.
Overseeded greens with rough bluegrass are often susceptible to rapid blight
(Labyrinthula, spp.) and other cool-season turfgrass diseases, which add fungicide costs.

53
In addition to fungicidal applications, herbicide applications are required to remove
overseeded turf from greens and surrounding areas and are often necessary for annual
bluegrass (Poa annua) control in overseeded turf.
Painting golf course putting greens has the potential of becoming a suitable
alternative to overseeding warm-season turfgrasses. A comparison of the two reveals the
following about painting:
• does not require physical disruption of the turf
• requires no additional nitrogen inputs
• does not introduce competition to the warm-season grass
• reduces irrigation inputs
• doesn’t require closing of the golf course
• provides an adequate putting surface
• color can be mixed to desired tone.
However, little research exists of this new practice for golf courses considering painting
best management practices. The objectives of this study were to: 1) determine if various
paint colors and brands provide acceptable putting green color, 2) determine longevity of
these paints, 3) document negative effects, if any, associated with paints, 4) document
putting speeds (distances) obtained following traffic on dormant, painted turf, 5)
determine impact on spring green-up following painting, and 6) ultimately conclude
whether painting is an adequate alternative to overseeding.
54
Materials and Methods
A two year field study was conducted at Clemson University, Clemson, SC from
December 13, 2004 to May 17, 2006 on a recently sprigged (July 2003) ‘Champion’
bermudagrass (Cynodon dactylon Burtt-Davey X C. transvaalensis L. Pers. ‘Champion’)
research green (Appendix A) to evaluate the effects of two painting brands applied either
once or twice per winter season versus a control with no paint or overseeding.
Implemented for this study was a factorial, 3 x 2 randomized complete-block design with
three replications and plot sizes of 1.83 X 1.22 meters (Appendix C-8, C-9). Control
plots within blocks were averaged as one plot.
Turf paint brands Titan Green Turf (Burnett Lime Company) and Missouri
(Missouri Turf Paint) were initially applied to dormant bermudagrass turf in mid-
December for both one and two applications per season for 2004 and 2005. The second,
application was applied in mid-February 2005 and 2006 for both brands. Paints were
applied pneumatically with a portable air compressor and hand gun (Appendix C-10).
Paints were mixed at a label-recommended 10:1 ratio (water:paint). Each plot was
sprayed in two directions to minimize streaking. Approximately 40 ml of paint blended
with 400 ml of water was applied to each painted plot during an application.
Irrigations were applied as needed along with weekly, heavy foot traffic to obtain
more realistic wearing and fading of the turf paints as observed in a golf course situation.
Foot traffic was implemented by one person walking over the plot four times in
alternating directions with soft-spiked golf shoes.
55
Data Collection
Parameters measured included paint quality, ball roll distance, soil temperature,
and spring green-up. Visual paint quality (PQ) ratings were taken biweekly and include
color tone and fading of paints. PQ was measured on a 1 to 9 scale (1 = brown turf, 7 =
acceptable green color, 9 = dark green color) from initial paint application (mid-
December) to initial spring green up (mid-April).
Ball roll distance was measured biweekly from initial mid-December painting to
mid-April spring green-up. Six ball roll measurements (three rolls in opposite directions)
were made with a 38 cm stimpmeter. The stimpmeter was slowly raised off the ground
until gravity caused ball to roll off cleft located on opposite end. Ball roll distances were
obtained with tape measures running parallel with the plots. The six roll readings were
pooled per treatment for data analyses.
Soil temperatures at a depth of 7.6 cm were recorded biweekly using a digital
meat thermometer with metal shaft from mid-December to mid-April.
Spring Green-Up (SGU) was visually rated as percent (0-100) bermudagrass
green-up from initial spring green-up (April) to full green-up.
Data Analysis
All statistical analyses were performed using the Statistical Analysis System [SAS
Institute, 2003]. Main and interaction effects were examined with ANOVA, and means
were separated by Fisher’s Least Significant Difference (LSD) test with alpha = 0.05.

56
Results and Discussions
Interactions between treatments were not significant. Interaction between years
for paint quality concerning paint brand was significant; therefore yearly data are
separated.
Paint Quality
Paint quality (PQ) serves as a subjective means of quantifying the realistic
appearance and coverage of turf paints on the dormant bermudagrass. Both brand and
application number contributed to significant differences in PQ over the course of the 2-
year study. Table 4-1 indicates an expected, significant increase in paint quality in year 1
with the use of turf paints to the acceptable level of 7 with no differences occurring
between paint brands. Year 2 yielded results similar to year 1, however, Titan turf paint
provided significantly higher paint quality characteristics than did Missouri turf paint.
Additional, unquantifiable differences did occur between paint brands. What the data
failed to show, however, was the realistic color of the turf paints. Titan turf paint color
more closely resembled that of an ‘L-93’ creeping bentgrass green that was adjacent to
this study, whereas Missouri turf paint maintained a bluish color throughout the study
(Appendix C-11). The blue color often associated with turf paints shortly after
application was not seen with Titan until approximately 1.5 months after application. By
this time, the paints had drastically faded and reapplication was eminent.
Number of applications played an important role in achieving adequate PQ as
well. As Fig. 4-1 shows, 1 application of turf paints over the entire winter season for 2
consecutive years averaged an unacceptable PQ rating of 6.7. However, the second
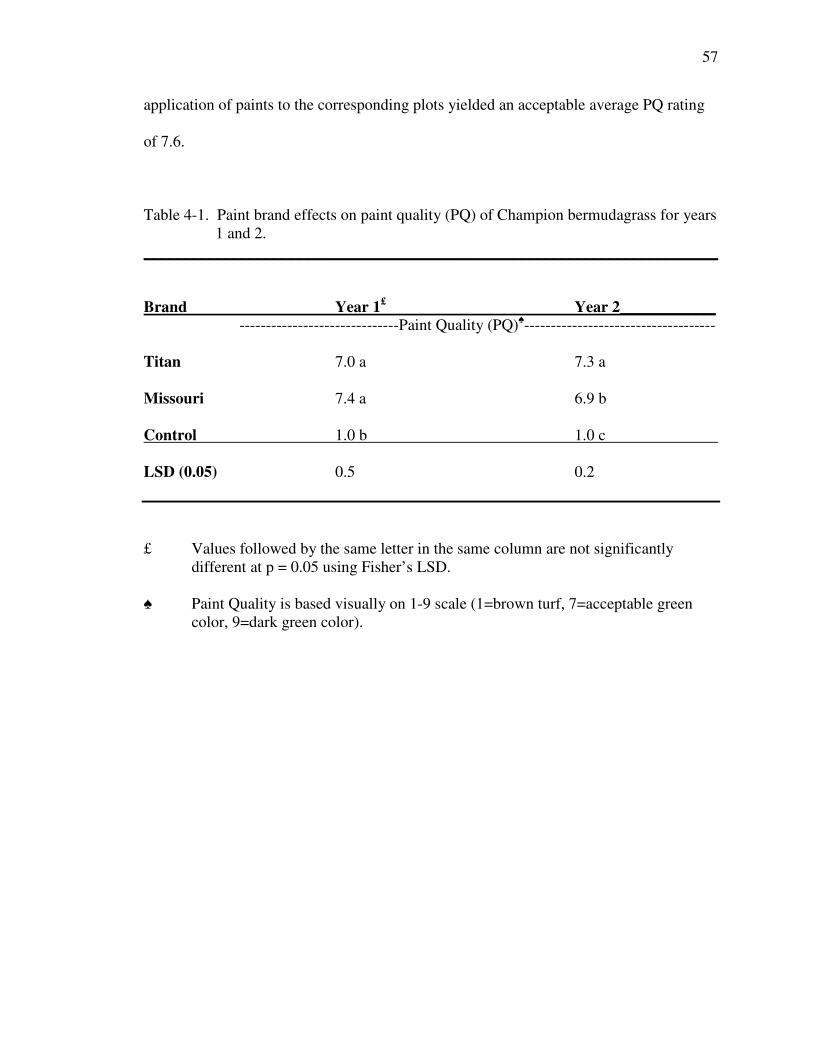
57
application of paints to the corresponding plots yielded an acceptable average PQ rating
of 7.6.
Table 4-1. Paint brand effects on paint quality (PQ) of Champion bermudagrass for years1 and 2.
________________________________________________________________________
Brand Year 1£ Year 2____________------------------------------Paint Quality (PQ)♠------------------------------------
Titan 7.0 a 7.3 a
Missouri 7.4 a 6.9 b
Control 1.0 b 1.0 c
LSD (0.05) 0.5 0.2
£ Values followed by the same letter in the same column are not significantlydifferent at p = 0.05 using Fisher’s LSD.
♠ Paint Quality is based visually on 1-9 scale (1=brown turf, 7=acceptable greencolor, 9=dark green color).
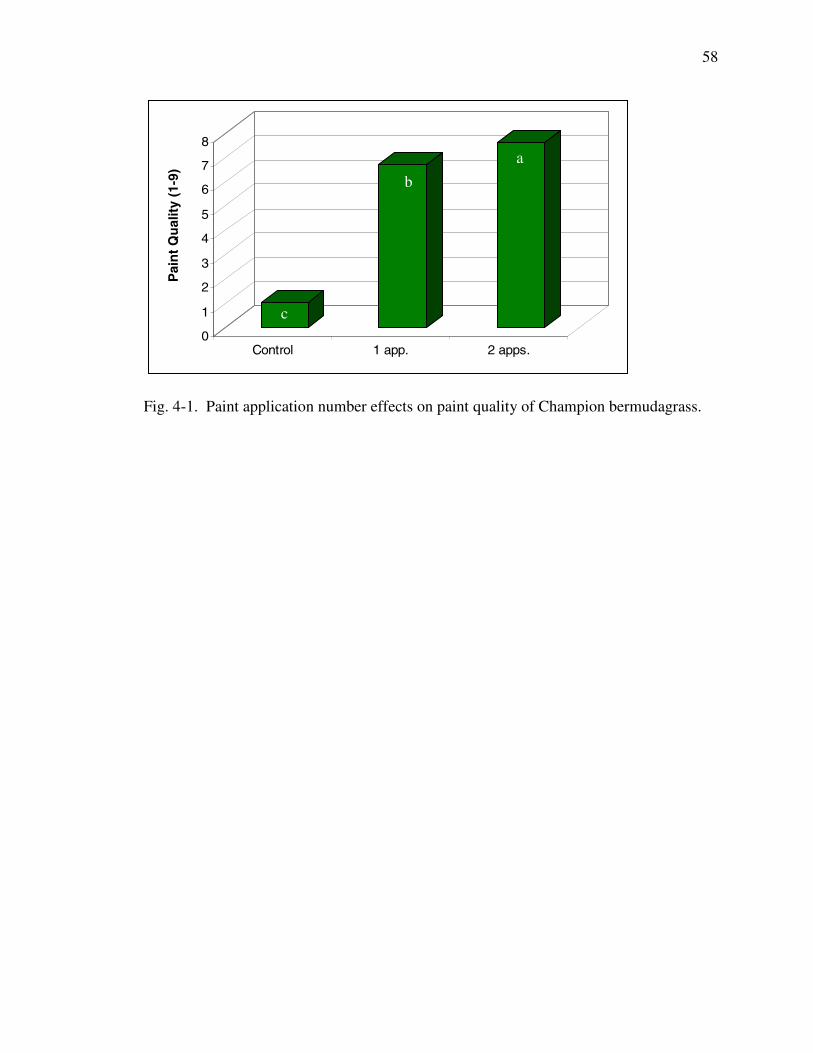
58
0
1
2
3
4
5
6
7
8
ddd
Control 1 app. 2 apps.
Fig. 4-1. Paint application number effects on paint quality of Champion bermudagrass.
a
b
c
Pai
nt
Qu
alit
y(1
-9)
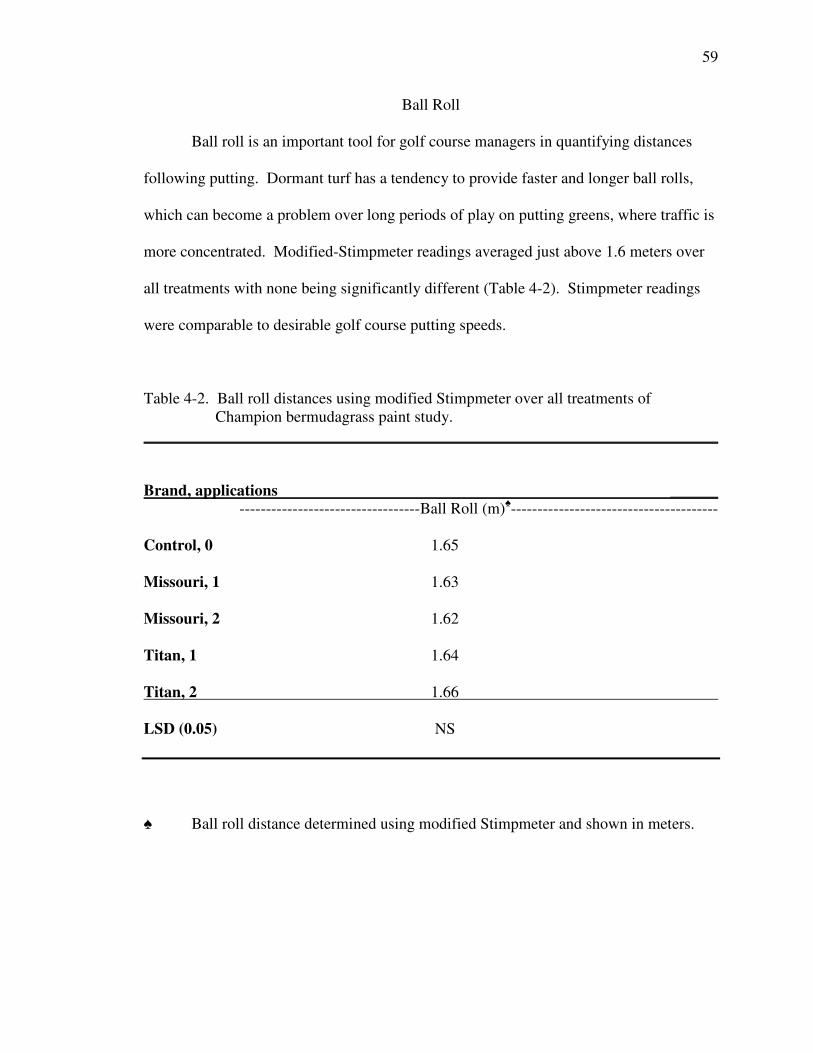
59
Ball Roll
Ball roll is an important tool for golf course managers in quantifying distances
following putting. Dormant turf has a tendency to provide faster and longer ball rolls,
which can become a problem over long periods of play on putting greens, where traffic is
more concentrated. Modified-Stimpmeter readings averaged just above 1.6 meters over
all treatments with none being significantly different (Table 4-2). Stimpmeter readings
were comparable to desirable golf course putting speeds.
Table 4-2. Ball roll distances using modified Stimpmeter over all treatments ofChampion bermudagrass paint study.
________________________________________________________________________
Brand, applications ______----------------------------------Ball Roll (m)♠---------------------------------------
Control, 0 1.65
Missouri, 1 1.63
Missouri, 2 1.62
Titan, 1 1.64
Titan, 2 1.66
LSD (0.05) NS
♠ Ball roll distance determined using modified Stimpmeter and shown in meters.
60
Soil Temperature
Color creates variation in sunlight absorbance, which can increase temperatures
around the colored area. Colored turfgrass is no different. Table 4-3 reveals the affects
of turf paints on soil temperatures 7.62 cm below the surface. Titan provided
significantly increased soil temperatures over Missouri throughout the 2-year study. This
can be explained in part by the longevity of Titan versus Missouri. Missouri turf paint
tended to fade quicker than Titan, leading to reduced influence over time on soil
temperatures. Application number affected soil temperatures of Missouri brand paint,
most likely due to the same reasons of fading stated above. Control plots continuously
provided soil temperatures lower than those of the treated plots, regardless of number of
paint applications.
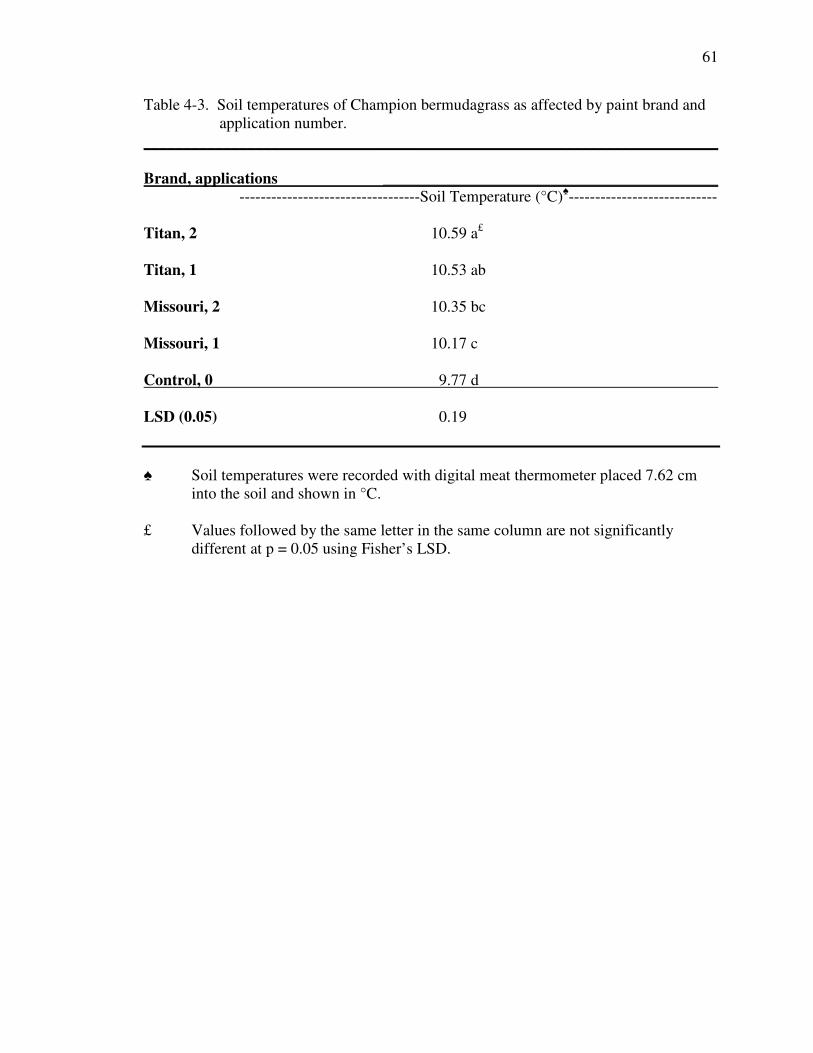
61
Table 4-3. Soil temperatures of Champion bermudagrass as affected by paint brand andapplication number.
________________________________________________________________________
Brand, applications __________________________________________----------------------------------Soil Temperature (°C)♠----------------------------
Titan, 2 10.59 a£
Titan, 1 10.53 ab
Missouri, 2 10.35 bc
Missouri, 1 10.17 c
Control, 0 9.77 d
LSD (0.05) 0.19
♠ Soil temperatures were recorded with digital meat thermometer placed 7.62 cminto the soil and shown in °C.
£ Values followed by the same letter in the same column are not significantlydifferent at p = 0.05 using Fisher’s LSD.
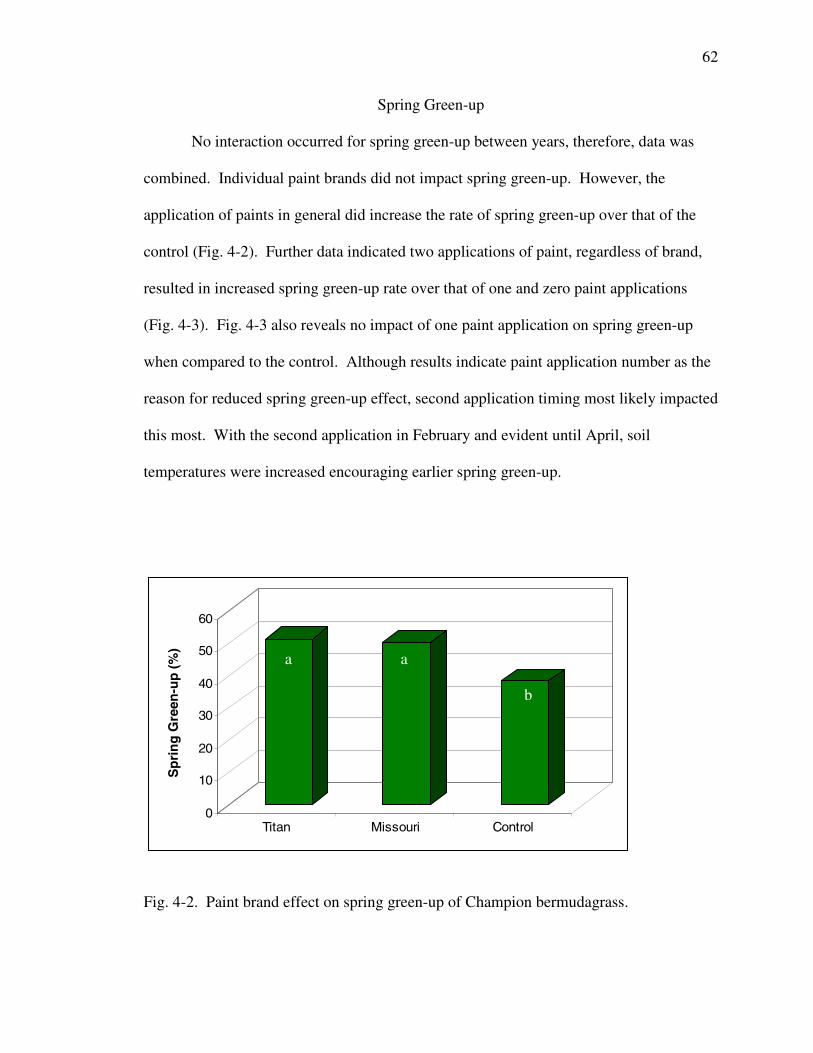
62
Spring Green-up
No interaction occurred for spring green-up between years, therefore, data was
combined. Individual paint brands did not impact spring green-up. However, the
application of paints in general did increase the rate of spring green-up over that of the
control (Fig. 4-2). Further data indicated two applications of paint, regardless of brand,
resulted in increased spring green-up rate over that of one and zero paint applications
(Fig. 4-3). Fig. 4-3 also reveals no impact of one paint application on spring green-up
when compared to the control. Although results indicate paint application number as the
reason for reduced spring green-up effect, second application timing most likely impacted
this most. With the second application in February and evident until April, soil
temperatures were increased encouraging earlier spring green-up.
0
10
20
30
40
50
60
ddd
Titan Missouri Control
Fig. 4-2. Paint brand effect on spring green-up of Champion bermudagrass.
a a
b
Sp
rin
gG
reen
-up
(%)
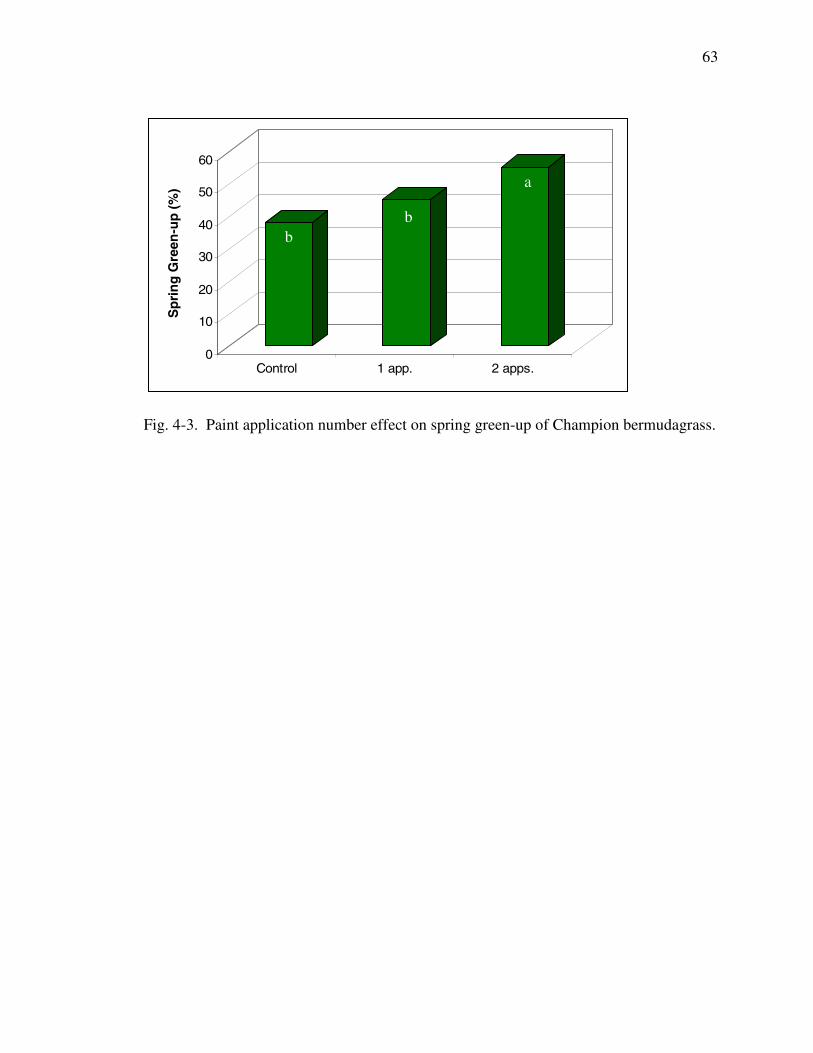
63
0
10
20
30
40
50
60
ddd
Control 1 app. 2 apps.
Fig. 4-3. Paint application number effect on spring green-up of Champion bermudagrass.
a
bb
Sp
rin
gG
reen
-up
(%)
64
Conclusions
The overseeding of golf course putting greens in the transition zone provides
winter color and a smoother putting surface. However, whenever possible, bermudagrass
growing conditions should be improved if culturally and socially acceptable. When
overseeding is not initiated, the turfgrass experiences reduced competition for water and
nutrients, increased sunlight absorbance, and increased spring green-up. Painting of
bermudagrass putting greens which have not been overseeded provide the golf course
with the green winter color desired from overseeding, without the destruction and
competition associated therewith.
Painting of turfgrass for winter color is an effective process in which paint is
simply applied to the turfgrass leaf blades until a green canopy is observed. The method
chosen for this study involved a pneumatic spray gun in which one operator was required
to apply the paints in bands with the gun. Subsequently, the applicator must reapply in an
alternating direction to alleviate streaking which tends to occur with this method. The
method was very effective in applying the paints to the dormant turf, although, timely.
For golf course application, it is estimated total application may require as many as 40
man hours per 18-hole course. This estimation was based on 30 minutes for machine
setup and mixing of paints, 30 minutes for first application, 30 minutes drying time, and a
final 30 minutes for the follow-up streak-eliminating application. Once mastered, the
process might easily be shortened to 20 hours per 18-hole course. Alternative methods
for application, however, have not been well studied or documented for effectiveness and
speed in the golf course situation.
65
Brands of paints appear to have little impact on physiological responses of the
turf; however, visible differences did occur. Most noticeably, Missouri turf paint was
unable to provide paint quality equal to that of Titan due to its inability to resist fading
and its blue color tone. As a result of blue color tone observed, Missouri turf paint would
not make an acceptable substitution for overseeded ryegrass or roughstalk bluegrass.
Titan, on the other hand, provided excellent, long-lasting green color equivalent to color
seen on a nearby creeping bentgrass putting green. Although Titan was deemed an
acceptable turf paint for use in the transition zone, this conclusion is subject to Titan
being applied at least twice over the winter season. Application of either paint brand
below two applications per season was deemed unacceptable as paints faded quickly over
time and paint quality ratings approached that of the dormant, control turf plots plus
heavy traffic impacts. Following this study, it is hypothesized that three paint
applications may provide the best scenario of color retainment throughout the winter
season if winter play is heavy. Obviously, increasing applications per season would
increase input and costs for the golf course. A practical compromise may involve
splitting the applications in an effort to prolong green color over the extended dormant
season experienced in the transition zone by dividing the paint to be applied for the
season over three applications instead of two.
While paints provide color equal to that of overseeding, what they do not provide
is an actively growing putting surface. A growing putting surface has the tendency to
reduce ball roll distance upon putting. An area of concern for golf course superintendents
about painting is that ball roll distances increase as winter traffic on the dormant
bermudagrass turf increases over time. Fears are that the dormant turf will become
66
increasingly matted down, providing ball roll distances in excess of that desired by
golfers, leading to reduced play and reduced income for the course. This study provided
simulated heavy traffic of dormant turf on a weekly basis and failed to encounter
unacceptable putting speeds at any time throughout the study. It was observed, however
not studied, that ball roll distances increased extensively following mowing. Mowing of
dormant turf ultimately removed minute debris and dead turf tissue at the surface which
had been impeding ball roll distance. For the golf course superintendent, it is
recommended that putting speeds and ball roll distances be controlled through managed
mowing and rolling of painted putting greens through the winter season. Furthermore, it
was also noted that increased mowing frequency removed layers of turf paints resulting
in shortened resiliency of paint color on turf. Future research is needed in order to
balance painting frequency, traffic, ball roll, and even mowing for the best play quality.
While paints had no direct effect on ball roll distance when compared to the
control plots, significant differences continually occurred concerning soil temperatures.
At nearly every date recorded, the application of paint, at either rate, resulted in increased
soil temperatures. Previous research has proven that increasing soil temperatures are
directly related to reduced winter kill and increased rate of spring green-up (Chalmers
and Schmidt, 1979; Duble, 1996; Turgeon, 2005). Measurements for this study occurred
at a depth of more than seven centimeters into the soil. Therefore, if differences in soil
temperatures diminish as soil depth increases, then even greater differences in soil
temperatures as a result of paint application might have occurred nearer the soil surface,
where initial root activity in spring would have occurred. Higher soil temperatures may

67
shorten the dormancy period for bermudagrass turf, leading to a healthier, stronger, more
developed turfgrass system during the growing months.
Although no statistical interactions occurred, as soil temperatures significantly
increased with paint application, so did spring green-up rates, regardless of paint brand.
Following the occurrence of increased soil temperatures from paint application, it was no
surprise that spring green-up was also enhanced under the same conditions. More
importantly is that painted turf plots experienced spring green-up much quicker than
nearby overseeded plots, though not a part of this study. If included, however, it is
believed that the painted plots might have still seen earlier spring green-up versus that of
overseed because light penetration to the soil would have been impeded in actively
growing overseeded plots resulting in reduced soil temperatures and reduced spring
green-up.
CHAPTER 5
EVALUATING ‘L-93’ CREEPING BENTGRASS WITH VARIOUS
RATES OF POTASSIUM AND TRINEXAPAC-ETHYL (PRIMO)
UNDER GREENHOUSE CONDITIONS
Introduction
Bentgrass (Agrostis sp.) is a cool-season (See Chapter 1) turf-type grass native to
the cool, moist climate of central Europe and has adapted similarly from the Northeast to
Northwest United States (McCarty, 2005; Dernoedon, 2000). Although bentgrass
adaptations favor cooler growing conditions year-round, use in the transition zone (See
Chapter 1) has become a staple for golf course superintendents seeking year-round green
color without the additional cultivation and overseeding practices necessary with the
bermudagrasses. Creeping bentgrass (Agrostis palustris subsp. stolonifera L.) is among
the most popular bentgrasses incorporated into the transition zone for putting greens
today with popular varieties consisting of “Crenshaw,” “SR 1019/1020,” Penn “A” and
“G” series, and ‘L-93’ (McCarty, 2005).
L-93 is currently one of the more popular variety choices of creeping bentgrass
for its ability to resist dollar spot occurrence and provide optimal putting conditions with
its tolerance of low height of cut, and dark green color. However, like all creeping
bentgrasses, L-93 encounters stressful growing conditions during the transition zone
summers which lead turf managers to question its use in and south of the transition zone.
Challenges include maximizing root growth and sustaining or improving turf color and
69
density, which are reduced during the stressful summer heat and humidity of the
transition zone.
Previously, attempts have been made at alleviating plant stress through elemental
potassium (K) applications. Turner and Hummel (1992) noted that K improved disease
resistance, and drought, heat, and wear tolerance while Beard (1982) reported enhanced
root growth as well as cold-hardiness following K applications. Unfortunately,
contrasting research suggest increasing K relative to nitrogen (N) does not result in
increases in tissue K (Snyder and Cisar, 2000; Ebdon et al., 1999), while still other
research support earlier findings that K provides disease resistance (Carrow et al., 1987),
increased clipping yields (Sartain, 1993), and heat resistance (Pellet and Roberts, 1963).
In 2005, Turgeon recommended a 2:1 (N:K) ratio since turfgrasses accumulate about
twice as much N as K. The application of N may be more attributable to K uptake than
the application of K itself and may also explain the variability in the research noted
above. An interaction between N and K was discovered where shoot growth increased in
response to K at low levels of N input, however, decreased at high N levels (Christians et
al., 1981; Ebdon et al., 1999). Additional research by Goatley et al. (1994) revealed a
linear increase in K concentration following increasing N levels. Again, contrasting
research exist reporting increases in K relative to N above the rate of zero application
having virtually no effect on turfgrass appearance, growth, root weight, or disease
(Snyder and Cisar, 2000).
Little research has been conducted regarding using the plant growth regulator
trinexapac-ethyl (TE, Primo) as a potential stress reliever for creeping bentgrass,
although various research had shown TE improving turf quality under reduced light
70
conditions (Bunnell et al., 2005; Goss et al., 2002), reducing N allocation to leaf tissue
when used in combination with adequate N rates (McCullough et al., 2006; Fagerness et
al., 2004), promoting root growth (McCullough, 2004; Qian and Engelke, 1999), and
improving recovery from traffic (Stier and Rogers, 2001). Furthermore, when applied
with judicious N, TE reduces clippings, which further allocates N and plant growth to the
roots. With increased carbohydrate reserves and growth within the roots, creeping
bentgrass might better tolerate the stresses associated with transition zone summers.
Since previous research varies in conclusions about proper K and N fertilization
rates and ratios, and TE research on creeping bentgrass in combination with these
elements is lacking, further research is warranted as it pertains to plant stress relief. It is
hypothesized that TE, when applied in conjunction with adequate N and moderate K, can
relieve the summer stresses often experienced by L-93 creeping bentgrass by sustaining
or increasing overall root growth and turf quality. The main objective of this study was
to explore the correlation between potassium and the plant growth regulator, TE, on
creeping bentgrass performance in an effort to sustain adequate turf quality and maximize
root growth.
Materials and Methods
A greenhouse study was conducted at Clemson University, Clemson, SC and
replicated twice in 2005. Study 1 was conducted from February 28, 2005 – May 2, 2005
and Study 2 from August 9, 2005 – October 4, 2005. Greenhouse day/night temperatures
averaged 24.4°C/20.5°C and 60-65% relative humidity. A factorial, 3 x 2 randomized
complete block design was implemented for this study under greenhouse conditions using
71
lysimeters (40 cm depth and 15 cm in diameter) with a root zone mix constructed as
USGA putting green specification (Appendix C-12). A mix (by volume) of 85 sand : 15
peatmoss (Appendix A) was the soil medium consisting of 6% coarse sand (0.5 to 1.0
mm), 30% medium sand (0.25 to 0.5 mm), 48% fine sand (0.1 to 0.25 mm), and 16%
very fine sand (<0.1 mm). Containers had 40-cm depths with 177-cm2 surface areas and
had drainage holes cut at about 6 mm at the bottom. L-93 creeping bentgrass plugs were
transplanted to the lysimeters as washed sod from a research green established in 2002 at
Clemson University, South Carolina. Plugs were harvested on February 15, 2005 (Study
1) and July 24, 2005 (Study 2) and allowed to establish two weeks prior to initial
treatments.
Urea was applied at 132 kg N ha-1 biweekly for nitrogen fertility and P2O5 was
applied at 39 kg P ha-1 biweekly for phosphorus fertility, each beginning at week two of
both studies. Additional macronutrients (Appendix B) were applied with P applications
and micronutrients (Appendix B) were applied at weeks three and six of both studies.
Turf was mowed daily at 3.2 mm and watered regularly as needed.
Treatments included three annual K rates of 0 (untreated), 97.2 (low), and 194.4
(high) kg K ha-1 applied biweekly as K2SO4 beginning at week two for both studies.
Trinexapac-ethyl (Primo Maxx 1EC) was applied biweekly at 0 or 0.05 kg a.i ha-1
beginning at week one for both studies. Both K and TE were applied by using a
specialized spraying chamber (Appendix C-13).
72
Data Collection
Data collection for both studies was identical and comprised of turf quality
ratings, clipping and root yields, and nutrient analyses. Weekly evaluations of turf
quality were made visually and evaluated from 1 to 9, 1 = brown, dead turf, 7 =
minimally acceptable turf, 9 = dark green, healthy turf.
Clippings were harvested at weeks two, five, and nine of both studies. Dry
clipping yields were recorded following 72 hours drying at 80 °C and evaluated for
nutrient analysis at the Clemson University testing laboratory for P, K, Ca, Mg, S, Zn,
Cu, Mn, Fe, and Na concentrations. Plant tissue nutrients were determined using wet
ashing procedures with a Digestion Block Magnum Series Block Digester (Ivesdale, IL)
and an ICP model TJA-61E autosampler (Madison, WI).
Roots were harvested from the lysimeters following the ninth week of each study.
Upon harvesting, roots were washed of all soil and separated from shoots. Following
washing, roots were allowed 72 hours air drying in a glass house before being placed in
an oven at 80 °C for 72 hours. Once dried, samples were weighed to determine total root
biomass. Root nutrient analysis was evaluated at the Clemson University testing
laboratory in the same manner as clippings.
Data Analysis
All statistical analyses were performed using the Statistical Analysis System [SAS
Institute, 2003]. Main and interaction effects were examined with ANOVA, and means
were separated by Fisher’s Least Significant Difference (LSD) test with alpha = 0.05.
73
Results and Discussions
Interactions between treatments potassium and TE occurred exclusively with
clipping yields at 5 and 8 weeks after initial treatment (WAIT). Interactions between
studies for turf quality, clipping yield 8 WAIT, and root weight, all concerning TE, were
significant; therefore data for studies 1 and 2 were separated.
Turf Quality
Turf Quality, even in the greenhouse situation, can serve as an appropriate means
of measuring turfgrass performance. For cool-season grasses, such as L-93 creeping
bentgrass, the greenhouse can serve as a stressful environment with sustained
temperatures usually at 21°C or higher. This stress obviously affected turf quality
throughout the study with ratings never averaging above the acceptable turf quality rating
of 7. Potassium treatments did not significantly affect turf quality in this study (Table 5-
1). Recent research concluded no positive effects of K on overall turf quality and
reported decreased quality at high N rates (Fitzpatrick and Guillard, 2004). Although,
Snyder and Cisar (2000) reported significant quality differences following increased
application of K. Data are inconclusive and warrant further investigation of K impact on
turf quality at various N rates.
Data for studies 1 and 2 showed no significant impact of TE on turf quality (Table
5-1). TE neither decreased nor increased turf quality throughout the two studies perhaps
revealing TE-inactivity under the reduced growing conditions studied. Of more
importance concerning this data may be, however, that TE did not adversely affect turf
quality under heat stress whereas previous research reported that TE may result in
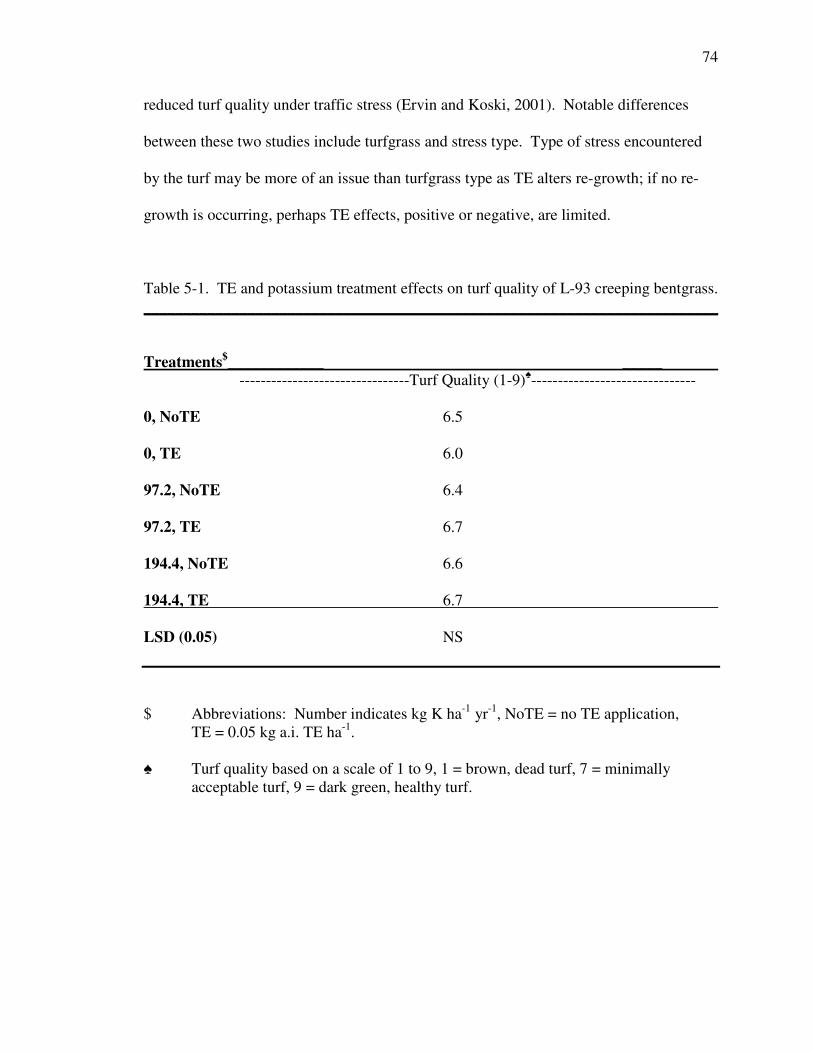
74
reduced turf quality under traffic stress (Ervin and Koski, 2001). Notable differences
between these two studies include turfgrass and stress type. Type of stress encountered
by the turf may be more of an issue than turfgrass type as TE alters re-growth; if no re-
growth is occurring, perhaps TE effects, positive or negative, are limited.
Table 5-1. TE and potassium treatment effects on turf quality of L-93 creeping bentgrass.________________________________________________________________________
Treatments$____________ _____--------------------------------Turf Quality (1-9)♠-------------------------------
0, NoTE 6.5
0, TE 6.0
97.2, NoTE 6.4
97.2, TE 6.7
194.4, NoTE 6.6
194.4, TE 6.7
LSD (0.05) NS
$ Abbreviations: Number indicates kg K ha-1 yr-1, NoTE = no TE application,TE = 0.05 kg a.i. TE ha-1.
♠ Turf quality based on a scale of 1 to 9, 1 = brown, dead turf, 7 = minimallyacceptable turf, 9 = dark green, healthy turf.
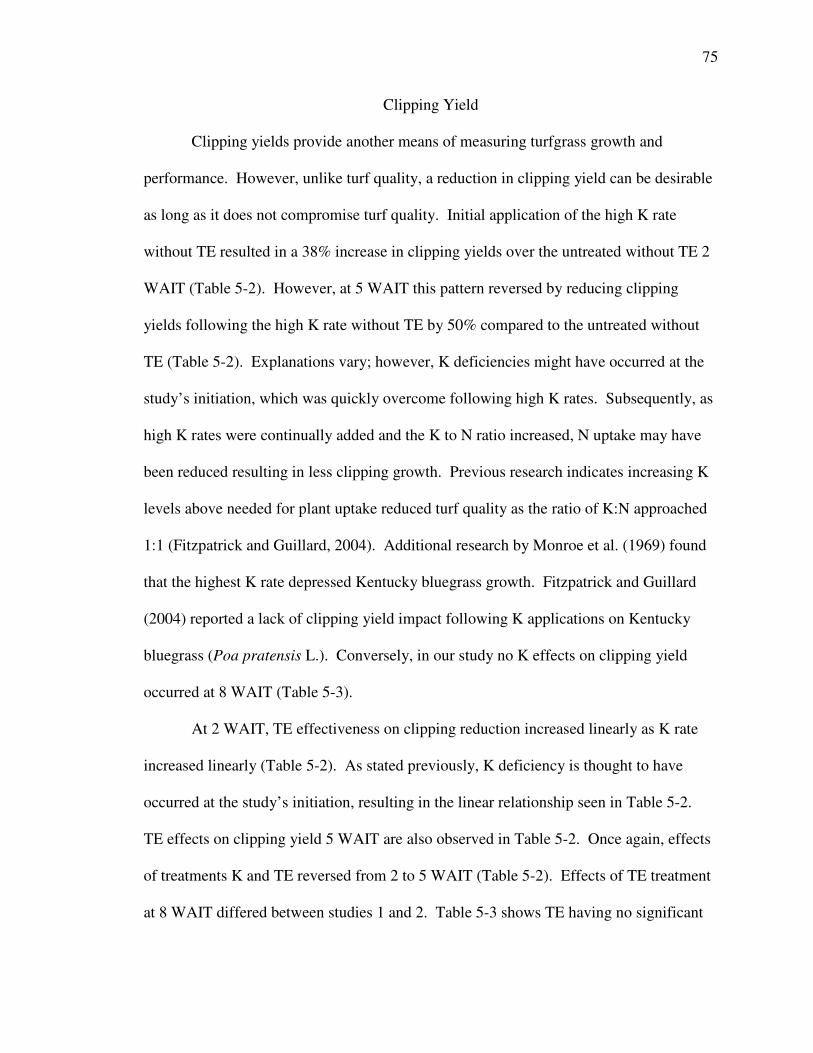
75
Clipping Yield
Clipping yields provide another means of measuring turfgrass growth and
performance. However, unlike turf quality, a reduction in clipping yield can be desirable
as long as it does not compromise turf quality. Initial application of the high K rate
without TE resulted in a 38% increase in clipping yields over the untreated without TE 2
WAIT (Table 5-2). However, at 5 WAIT this pattern reversed by reducing clipping
yields following the high K rate without TE by 50% compared to the untreated without
TE (Table 5-2). Explanations vary; however, K deficiencies might have occurred at the
study’s initiation, which was quickly overcome following high K rates. Subsequently, as
high K rates were continually added and the K to N ratio increased, N uptake may have
been reduced resulting in less clipping growth. Previous research indicates increasing K
levels above needed for plant uptake reduced turf quality as the ratio of K:N approached
1:1 (Fitzpatrick and Guillard, 2004). Additional research by Monroe et al. (1969) found
that the highest K rate depressed Kentucky bluegrass growth. Fitzpatrick and Guillard
(2004) reported a lack of clipping yield impact following K applications on Kentucky
bluegrass (Poa pratensis L.). Conversely, in our study no K effects on clipping yield
occurred at 8 WAIT (Table 5-3).
At 2 WAIT, TE effectiveness on clipping reduction increased linearly as K rate
increased linearly (Table 5-2). As stated previously, K deficiency is thought to have
occurred at the study’s initiation, resulting in the linear relationship seen in Table 5-2.
TE effects on clipping yield 5 WAIT are also observed in Table 5-2. Once again, effects
of treatments K and TE reversed from 2 to 5 WAIT (Table 5-2). Effects of TE treatment
at 8 WAIT differed between studies 1 and 2. Table 5-3 shows TE having no significant

76
impact on clipping yield at the end of study 1. However, in study 2, at 8 WAIT, TE
reduced clipping yield when applied with 97.2 and 194.4 kg K ha-1 yr-1 (Table 5-3).
Reasons for inconsistent TE effects are unknown. It is possible that the method of
application may not have been ideal resulting in varying applications and variable data.
Table 5-2. TE and potassium effects on clipping yield of L-93 creeping bentgrass 2 and 5WAIT.
________________________________________________________________________
Treatment$__ 2 WAIT£ 5 WAIT____--------------------------------Clipping Yield (g/m2)♠------------------------------
0, NoTE 11.94 b 17.26 a
0, TE 11.56 b 4.66 c
97.2, NoTE 13.58 ab 12.37 ab
97.2, TE 9.99 b 11.94 ab
194.4, NoTE 16.45 a 9.52 bc
194.4, TE 9.51 b 7.90 bc
LSD (0.05) 4.33 6.18
$ Abbreviations: Number indicates kg K ha-1 yr-1, NoTE = no TE application,TE = 0.05 kg a.i. TE ha-1
£ Values followed by the same letter in the same column are not significantlydifferent at p = 0.05 using Fisher’s LSD.
♠ Clipping yield recorded as grams of dried tissue per square meter.
77
Table 5-3. TE and potassium effects on clipping yield of L-93 creeping bentgrass 8WAIT for Study 1 and Study 2.
________________________________________________________________________
Treatments$____________ Study 1£ Study 2_____--------------------------------Clipping Yield (g/m2)♠------------------------------
0, NoTE 9.31 7.39 ab
0, TE 7.86 8.39 ab
97.2, NoTE 7.83 10.63 a
97.2, TE 10.25 6.63 b
194.4, NoTE 7.76 10.36 a
194.4, TE 7.39 8.93 ab
LSD (0.05) NS 3.26
$ Abbreviations: Number indicates kg K ha-1 yr-1, NoTE = no TE application,TE = 0.05 kg a.i. TE ha-1
£ Values followed by the same letter in the same column are not significantlydifferent at p = 0.05 using Fisher’s LSD.
♠ Clipping yield recorded as grams of dried tissue per square meter.
78
Clipping Nutrient Concentration
Measurement of K concentrations within the leaf tissue allows the turf manager to
observe uptake and movement of K throughout the plant. Due to drastic reductions in
turfgrass top-growth, clipping samples were combined for proper analysis of nutrients.
Potassium and TE treatments had a small, yet significant impact on clipping K
concentrations throughout the study (Table 5-4). TE plus the highest K rate provided K
tissue concentrations 24% higher than those of the low K rate with TE and 25% higher
than those of the high K rate without TE. Fitzpatrick and Guillard (2004) reported
similar findings where K concentrations peaked with moderate K application, yet
declined thereafter as K rates increased. Further research suggests TE application leads
to reductions in K translocation to leaf tissue (McCullough et al., 2006).
It is uncertain why additional K uptake did not occur beyond the 1-2% range
experienced. According to McCarty (2005), typical K concentrations within turfgrass
leaf tissue reside in the 1.5-3% range. However, our data indicate levels equal to or
lower than the minimum K concentration cited, revealing a mild K deficiency present
throughout our study. A closer investigation of soil structure and exchange sites is
warranted and might reveal insight to varying K levels in plants.
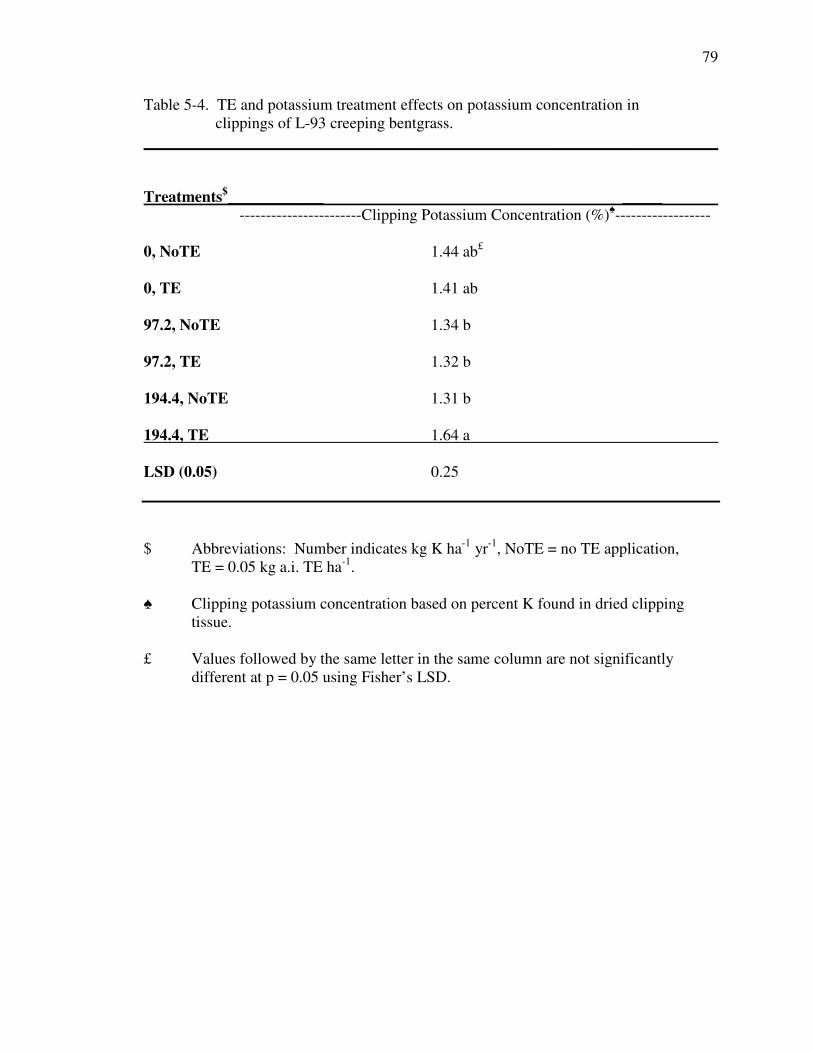
79
Table 5-4. TE and potassium treatment effects on potassium concentration inclippings of L-93 creeping bentgrass.
________________________________________________________________________
Treatments$____________ _____-----------------------Clipping Potassium Concentration (%)♠------------------
0, NoTE 1.44 ab£
0, TE 1.41 ab
97.2, NoTE 1.34 b
97.2, TE 1.32 b
194.4, NoTE 1.31 b
194.4, TE 1.64 a
LSD (0.05) 0.25
$ Abbreviations: Number indicates kg K ha-1 yr-1, NoTE = no TE application,TE = 0.05 kg a.i. TE ha-1.
♠ Clipping potassium concentration based on percent K found in dried clippingtissue.
£ Values followed by the same letter in the same column are not significantlydifferent at p = 0.05 using Fisher’s LSD.
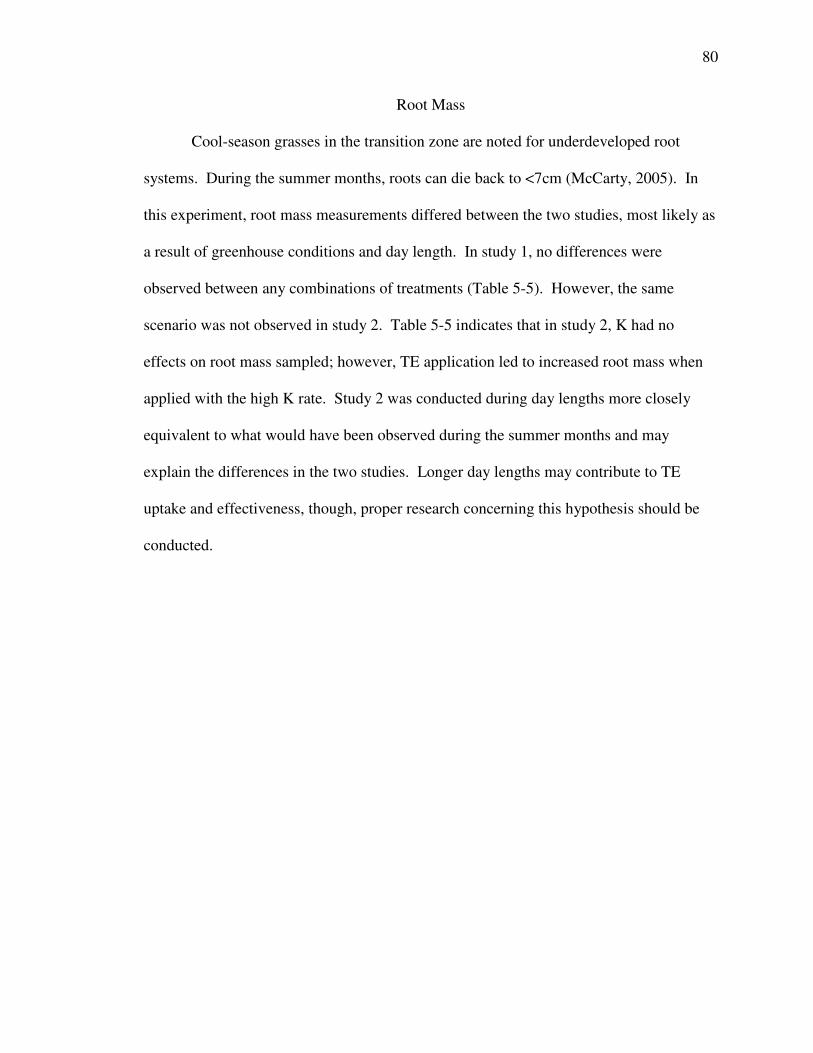
80
Root Mass
Cool-season grasses in the transition zone are noted for underdeveloped root
systems. During the summer months, roots can die back to <7cm (McCarty, 2005). In
this experiment, root mass measurements differed between the two studies, most likely as
a result of greenhouse conditions and day length. In study 1, no differences were
observed between any combinations of treatments (Table 5-5). However, the same
scenario was not observed in study 2. Table 5-5 indicates that in study 2, K had no
effects on root mass sampled; however, TE application led to increased root mass when
applied with the high K rate. Study 2 was conducted during day lengths more closely
equivalent to what would have been observed during the summer months and may
explain the differences in the two studies. Longer day lengths may contribute to TE
uptake and effectiveness, though, proper research concerning this hypothesis should be
conducted.
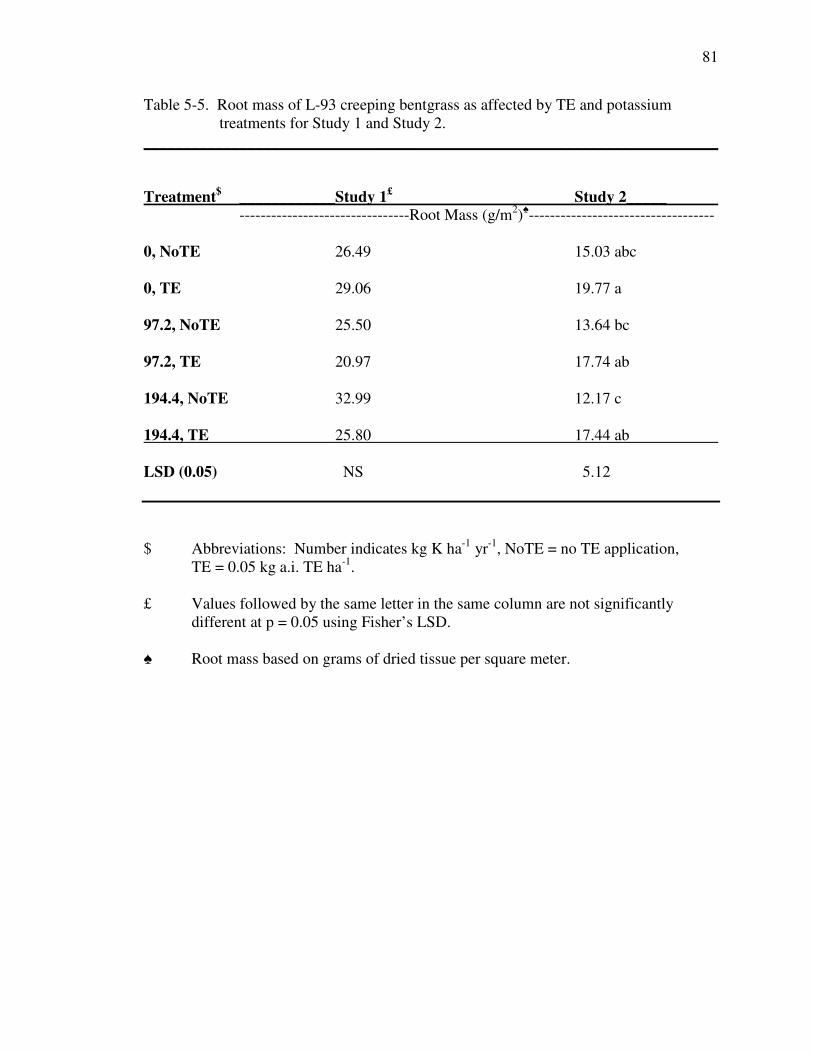
81
Table 5-5. Root mass of L-93 creeping bentgrass as affected by TE and potassiumtreatments for Study 1 and Study 2.
________________________________________________________________________
Treatment$ ____________Study 1£ Study 2_____--------------------------------Root Mass (g/m2)♠-----------------------------------
0, NoTE 26.49 15.03 abc
0, TE 29.06 19.77 a
97.2, NoTE 25.50 13.64 bc
97.2, TE 20.97 17.74 ab
194.4, NoTE 32.99 12.17 c
194.4, TE 25.80 17.44 ab
LSD (0.05) NS 5.12
$ Abbreviations: Number indicates kg K ha-1 yr-1, NoTE = no TE application,TE = 0.05 kg a.i. TE ha-1.
£ Values followed by the same letter in the same column are not significantlydifferent at p = 0.05 using Fisher’s LSD.
♠ Root mass based on grams of dried tissue per square meter.

82
Root Nutrient Concentration
As with clipping nutrient concentrations, root nutrient concentrations allow turf
managers to track the uptake and movement of nutrients through the plant. Table 5-6
indicates applying K at any rate (low or high) results in increased K concentrations in the
roots when applied in combination with TE. Therefore, this study concludes that the
roots are absorbing increasing amounts of available K following K with TE treatment
compared to the untreated. With increased allocation of K in the roots as opposed to the
shoots, increased root growth can occur.
83
Table 5-6. Root potassium concentrations of L-93 creeping bentgrass as affected by TEand potassium treatments.
________________________________________________________________________
Treatments$____________ _____---------------------------Root Potassium Concentration (%)♠--------------------
0, NoTE 0.26 ab£
0, TE 0.20 b
97.2, NoTE 0.27 ab
97.2, TE 0.34 a
194.4, NoTE 0.28 ab
194.4, TE 0.34 a
LSD (0.05) 0.11
$ Abbreviations: Number indicates kg K ha-1 yr-1, NoTE = no TE application,TE = 0.05 kg a.i. TE ha-1.
♠ Root potassium concentration based on percent K found in dried root tissue.
£ Values followed by the same letter in the same column are not significantlydifferent at p = 0.05 using Fisher’s LSD.
84
Conclusions
The ability of turfgrass to withstand environmental physiological stress
determines its use in the transition zone. With a wide range of temperatures, the
transition zone creates a difficult environment for turfgrass growth and development;
especially of turfgrasses native to largely differing climates. Attempts to create optimum
conditions for turfgrass survival under these stresses have proved to be more complicated
and less likely than once believed. Various research has often shown differing results.
This variation drives additional research such as the impact of potassium and plant
growth regulators on creeping bentgrass performance under heat stress. Application of
potassium and plant growth regulators is believed to influence root growth and turf
quality in highly maintained turf, both of which aid in combating plant stress.
Turf quality was not significantly affected with or without the application of K.
Perhaps with a higher K input above the highest rate used here, a significant difference
might have occurred. Effectiveness of plant growth regulator (TE) application was
analyzed and concluded to be inconsistent in this study concerning turf quality.
Greenhouse temperatures and relative humidity during the two studies may have
influenced TE effect; however year X TE interaction never occurred. Even so, TQ was
not held to the acceptable level of 7 under any treatment combinations disproving our
hypothesis that turf quality could be sustained or heightened under these treatment
conditions.
Clipping yields were rarely affected by K treatments, although data were
inconsistent. TE rarely reduced clippings. Largest clipping reductions with TE occurred
85
at 2 and 5 WAIT under 194 and 0 kg ha-1 yr-1 potassium treatments respectively. This
data may reveal a timing effect with K relative to TE treatment
TE may or may not influence clipping K concentrations as significant differences
occurred at the high rate only. Other data were inconsistent. Increasing K with TE may
increase K concentration in clippings.
TE may increase root mass of creeping bentgrass under stress. In study 2, total
root mass was increased 43% following TE application with high K. TE application
played no role in sequestering K in root tissue. Increasing K rate did increase overall root
K levels. When K was applied at any rate (low or high) with TE, root K concentrations
were increased. Significance occurred only between application and no application,
showing that K rate played no significant role in K retention in roots. Root K
concentrations increased an average of 70% when K was applied with TE.
The ultimate goal of this study was to attempt to maximize the rooting and quality
potential of L-93 creeping bentgrass under heat stress. One treatment combatant of
decreasing root mass noted from this research was the application of TE. TE allowed for
increased root mass throughout one of the two studies presented here. From this
research, an overall recommendation for heat stress management of creeping bentgrass
follows a closely managed K regimen with the application of TE, in addition to currently
accepted irrigation, fertility, and cultural management practices.
CHAPTER 6
CONCLUSIONS
Transition zone putting green management presents a unique challenge to the golf
course superintendent. Relative to other parts of the world, the transition zone is where
both C3 and C4 grasses can be grown and managed successfully. However, challenges
exist as temperature ranges are extreme to the area which can hinder each grass at
different times of year. The C3 grasses are acclimated to growth in cooler climates and
fair well during the fall, winter, and spring months of the transition zone. Summers
present problems for C3 grasses as temperatures rise causing CO2 fixation to be reduced
resulting in a declination in photosynthetic rates. C4 grasses, on the other hand,
experience exceptional growth in late-spring, summer, and most of fall. The trying
months for C4 grasses come in winter. During these colder months, declining
temperatures cause the C4 grasses to go dormant. At this time, growth is still occurring,
but at a highly reduced state. The dormant turf may still tolerate moderate to heavy
traffic, but in most instances is temporarily overseeded with a cool-season turf to provide
winter color. Overseeded grasses compete with the dormant grass for sunlight, water,
and nutrients throughout the winter and early spring months and may result in a
weakened or dead C4 turf stand in late spring. For these reasons, continued research of
both C3 and C4 grasses is necessary.
In a two-year field experiment, the best management practices for reducing thatch
accumulation and increasing root mass of ‘Champion’ bermudagrass (C. dactylon (L.)
87
Pers. X C. transvaalensis Burtt-Davy) were investigated by using a thatch reducer
(Thatch-X) along with varying levels of nitrogen (N) and a plant growth regulator,
Trinexapac-ethyl (TE). Nitrogen was applied at annual rates of 244 (low), 488 (medium),
and 732 (high) kg N ha-1 yr-1. The high and medium N rates with TE gave best turf
quality for both years. The low N rate failed to provide adequate turf quality or turf
recovery from aerification. Turf recovery was highest following the high N rate, yet
adequate with the medium N rate. Root mass was increased 19 and 27% over low N rate
root mass following high N applications in July and September of year 2, respectively.
As expected, root and clipping N concentrations increased as N rate increased from low
to high. Clipping data had similar results as roots, though more extreme. The high N rate
provided greatest clipping weights. Clippings were increased 209% for every 244 kg N
ha-1 yr-1 increase without TE. Thatch mass was increased as well by an increase in N rate
from low to high in year 1. Nitrogen rates ultimately affected spring green-up
measurements too. As N rates increased, transition from overseeded grass to Champion
bermudagrass decreased. The low N rate provided the earliest spring-green up among the
N rates.
TE (1EC) was applied at 0.025 kg a.i. ha-1 following each nitrogen application
and provided increased quality ratings from 4 weeks after initial treatment in year 1
through the remainder of the study. TE reduced aerification recovery by 19 and 40% in
year 1 and reduced clippings by an average of 56% compared to no TE treatment.
Additionally, TE application reduced thatch accumulation in year 1. TE did not affect
root mass, root N, clipping N, or spring green-up measurements.
88
Interactions between TE and N treatments occurred for some measured
characteristics. In year 1, TE in combination with the low N rate negatively affected turf
quality, while in the majority of year 1, TE application with the medium and high N rates
improved turf quality compared to no TE. As N rates increased, TE effectiveness for
clipping reduction was increased.
Thatch-X was applied once per growing season in July at the label-recommended
rate of 146 kg ha-1, yet had little impact on parameters measured in this study. Thatch-X
had no significant effect on turf quality, root mass, root N, clipping yield, clipping N,
thatch mass, or spring green-up measurements. However, Thatch-X may reduce thatch
mass accumulation over a longer period of use.
In another two-year field experiment, the winter management of Champion
bermudagrass putting greens with painting was investigated. The main objective of this
study was to evaluate the effects of two brands of turf paints (Titan and Missouri) applied
at two rates (1 and 2 applications per season) versus a control (no paint and no overseed).
Paint quality was affected by brand and application number. Paint application
provided immediate, adequate color quality regardless of brand. Titan brand yielded
significantly higher paint quality in year 2 and provided the most realistic appearance.
Two paint applications per winter season sustained an average paint quality rating of 7.6,
acceptable on the 1-9 paint quality scale.
Compared to the control, soil temperatures were increased with each paint brand,
but were highest with Titan. Application number of Missouri paint affected soil
temperatures with two applications providing increased soil temperatures. Non-painted
control treatment consistently had lower soil temperatures than those of the treated plots.
89
Spring green-up data revealed no differences between paint brands; however,
each brand increased the rate of spring green-up over the control. Two applications of
paint per winter season provided more rapid green-up than one application. Ball roll
distance was investigated and determined to be unaffected by treatments in this study.
A greenhouse experiment was conducted on ‘L-93’ creeping bentgrass (Agrostis
palustris subsp. stolonifera L.) to explore the correlation between potassium (K) and the
most commonly used plant growth regulator, trinexapac-ethyl. Treatments included three
annual K rates of 0 (untreated), 97.2 (low), and 194.4 (high) kg K ha-1 applied biweekly
and TE (Primo Maxx, 1EC) applied biweekly at 0 or 0.050 kg a.i ha-1. Turf quality never
reached the acceptable turf quality rating of 7 on the 1-9 scale. Initial application of the
high K rate without TE resulted in a 38% increase in clipping yields over the 0 K rate
without TE 2 WAIT. Five WAIT this pattern reversed revealing reduced clipping yields
for the high K rate, and no K effects on clipping yield were observed at 8 WAIT.
TE did not impact turf quality in this study; however, did reduce clippings in most
lysimeters. TE clipping reduction increased with application of high K at 2 WAIT and in
study 2 at 8 WAIT. Results varied between studies 1 and 2. TE, when applied in
combination with the high K rate in study 1, provided K tissue concentrations
significantly higher than those of the low K rate with or without TE. In study 2, TE
application with the high K rate led to an increased root mass. It was further observed
that applying K at any rate (low or high) resulted in increased K concentrations in the
roots when applied in combination with TE.
Ultimately, management of putting greens in the transition zone requires the latest
knowledge of fertility input, plant growth regulator (PGR) use, and cultural practices for

90
the newest varieties of C3 and C4 grasses. Though fertility plays the most important role
in creating a quality putting green, the use of PGRs has become commonplace and must
be factored into a good turf management regime. Finally, staying atop the technological
break-throughs and incorporating them into the turf management program is vital in
creating the best outcome for turf and golfers.

APPENDICES

92
Appendix A
Soil Physical Properties
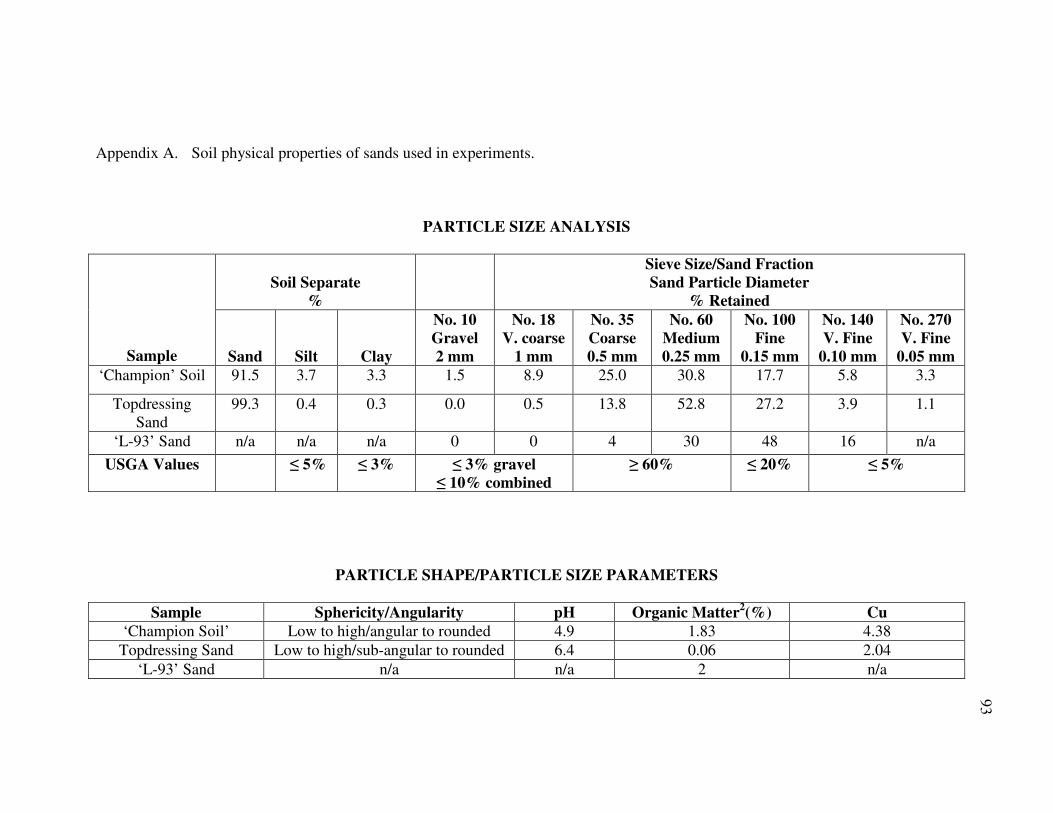
Appendix A. Soil physical properties of sands used in experiments.
PARTICLE SIZE ANALYSIS
Soil Separate%
Sieve Size/Sand FractionSand Particle Diameter
% Retained
Sample Sand Silt Clay
No. 10Gravel2 mm
No. 18V. coarse
1 mm
No. 35Coarse0.5 mm
No. 60Medium0.25 mm
No. 100Fine
0.15 mm
No. 140V. Fine
0.10 mm
No. 270V. Fine
0.05 mm‘Champion’ Soil 91.5 3.7 3.3 1.5 8.9 25.0 30.8 17.7 5.8 3.3
TopdressingSand
99.3 0.4 0.3 0.0 0.5 13.8 52.8 27.2 3.9 1.1
‘L-93’ Sand n/a n/a n/a 0 0 4 30 48 16 n/a
USGA Values ≤ 5% ≤ 3% ≤ 3% gravel≤ 10% combined
≥ 60% ≤ 20% ≤ 5%
PARTICLE SHAPE/PARTICLE SIZE PARAMETERS
Sample Sphericity/Angularity pH Organic Matter2(%) Cu‘Champion Soil’ Low to high/angular to rounded 4.9 1.83 4.38Topdressing Sand Low to high/sub-angular to rounded 6.4 0.06 2.04
‘L-93’ Sand n/a n/a 2 n/a
93

94
Appendix B
Additional Macro- and Micronutrients for ‘L-93’ Creeping Bentgrass Greenhouse Study
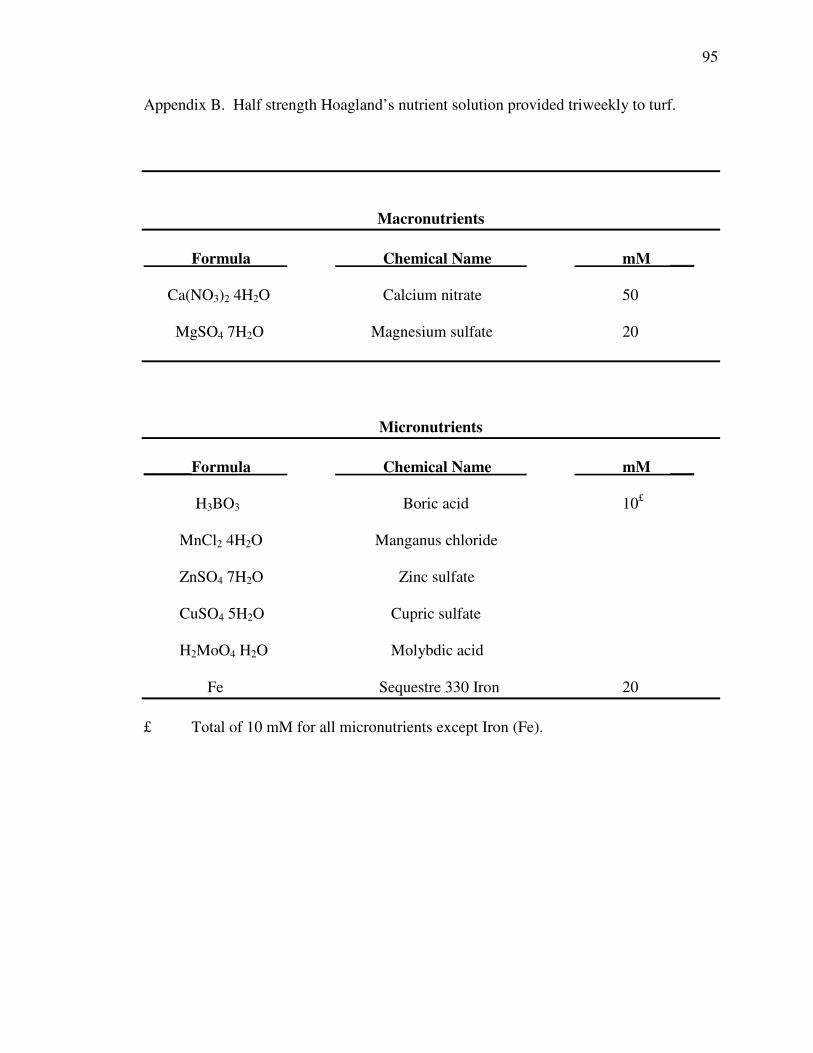
95
Appendix B. Half strength Hoagland’s nutrient solution provided triweekly to turf.
Macronutrients
Formula Chemical Name mM ___
Ca(NO3)2 4H2O Calcium nitrate 50
MgSO4 7H2O Magnesium sulfate 20
Micronutrients
______Formula Chemical Name mM ___
H3BO3 Boric acid 10£
MnCl2 4H2O Manganus chloride
ZnSO4 7H2O Zinc sulfate
CuSO4 5H2O Cupric sulfate
H2MoO4 H2O Molybdic acid
Fe Sequestre 330 Iron 20
£ Total of 10 mM for all micronutrients except Iron (Fe).

96
Appendix C
Illustrations

97
C-1. World map of transition zone as it exists in the United States of America.
Courtesy: Google Images
(www.lowes.com)
Transition Zone
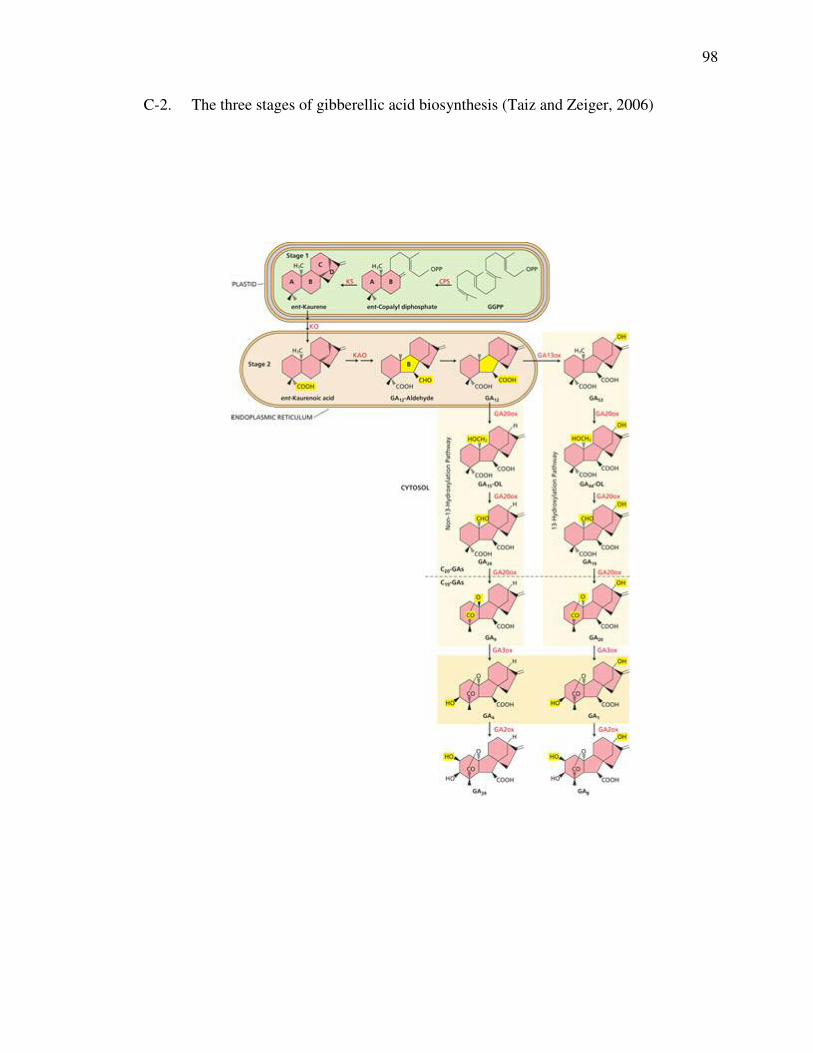
98
C-2. The three stages of gibberellic acid biosynthesis (Taiz and Zeiger, 2006)

99
C-3. Experimental design of ‘Champion’ bermudagrass study where 244, 488, and 732
indicate kg N ha-1 yr-1, No TE = no trinexapac-ethyl, TE = trinexapac-ethyl at
0.025 kg ha-1 2 wk-1, No T-X = no Thatch-X, and T-X = Thatch-X at 146 kg ha-1
yr-1.
488No TENo T-X
244TE
No T-X
732TET-X
244No TE
T-X
488TE
No T-X
488No TENo T-X
244No TENo T-X
488TET-X
732No TENo T-X
244TET-X
732No TE
T-X
732TE
No T-X 244
No TENo T-X
488No TENo T-X
488TET-X
732No TE
T-X
244TE
No T-X
244TET-X
244No TE
T-X
732TET-X
732No TENo T-X
732TE
No T-X
488No TE
T-X
488TE
No T-X 732TE
No T-X
732TET-X
732No TE
T-X
244No TE
T-X
488No TENo T-X
732No TENo T-X
244TET-X
488TE
No T-X
244TE
No T-X
244No TENo T-X
488No TE
T-X
488TET-X
732No TENo T-X
488TET-X
488No TENo T-X
732TET-X
732TE
No T-X
732No TE
T-X 244TET-X
244No TE
T-X
488No TE
T-X
244No TENo T-X
488TE
No T-X
244TE
No T-X
Block 1
Block 2
Block 3
Block 4
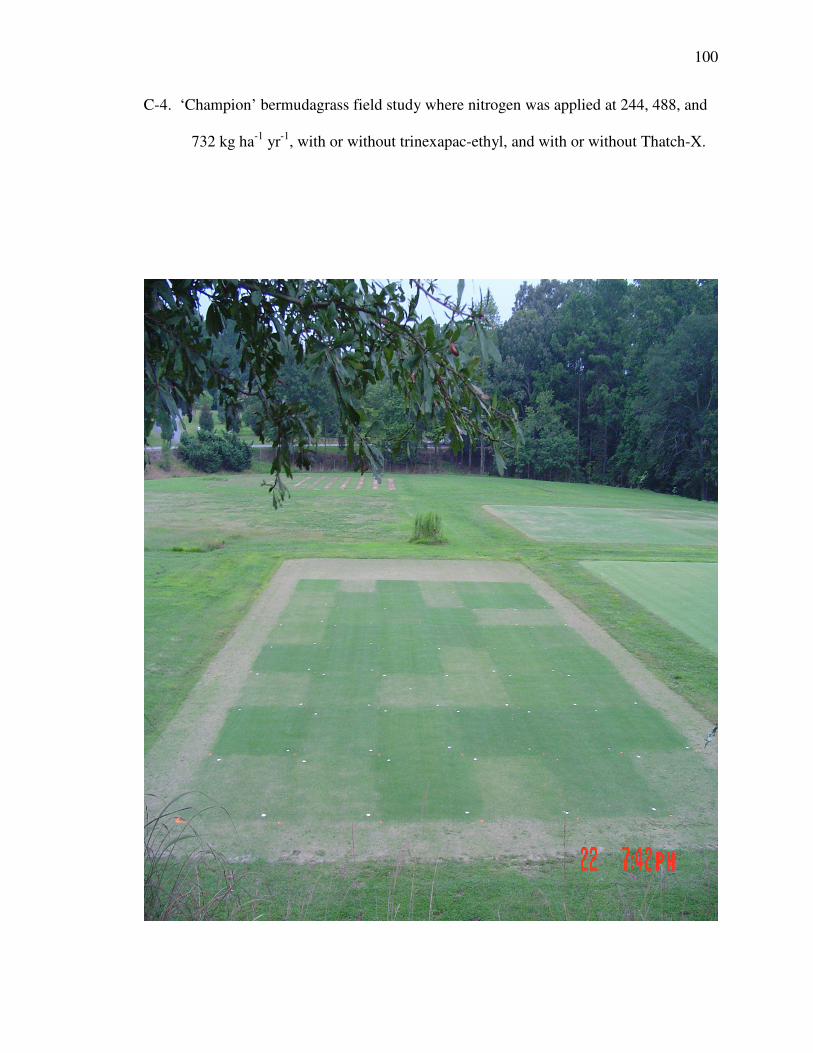
100
C-4. ‘Champion’ bermudagrass field study where nitrogen was applied at 244, 488, and
732 kg ha-1 yr-1, with or without trinexapac-ethyl, and with or without Thatch-X.
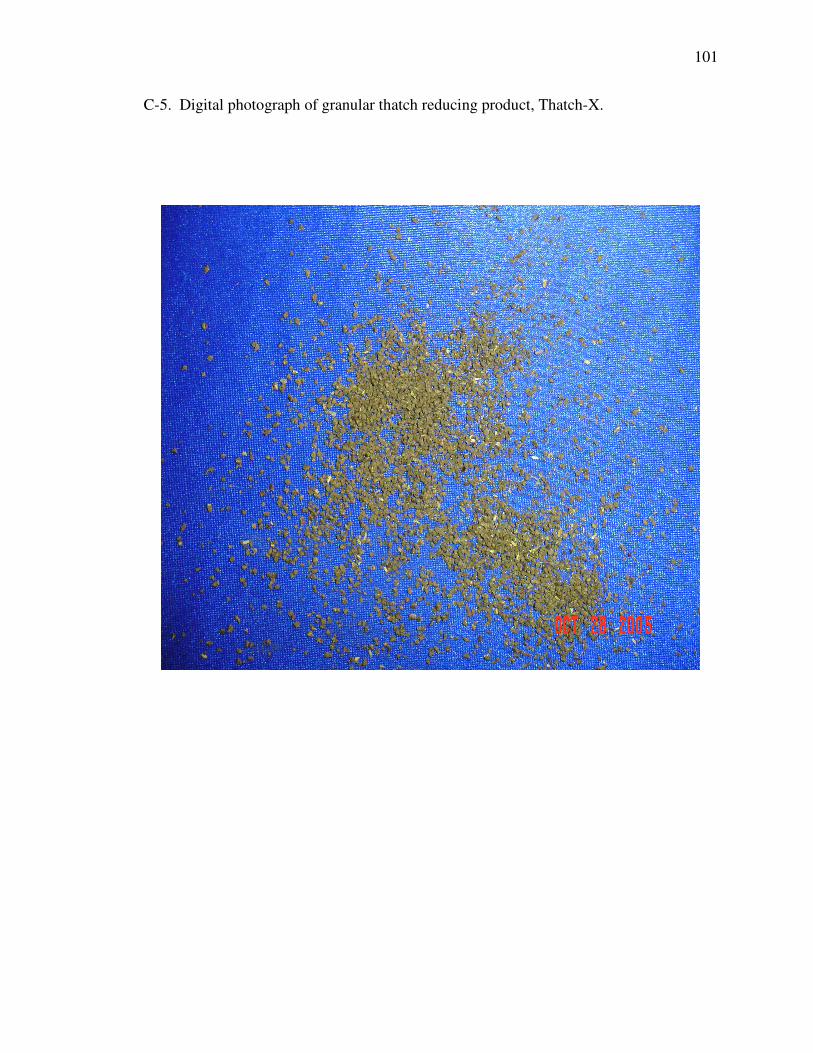
101
C-5. Digital photograph of granular thatch reducing product, Thatch-X.
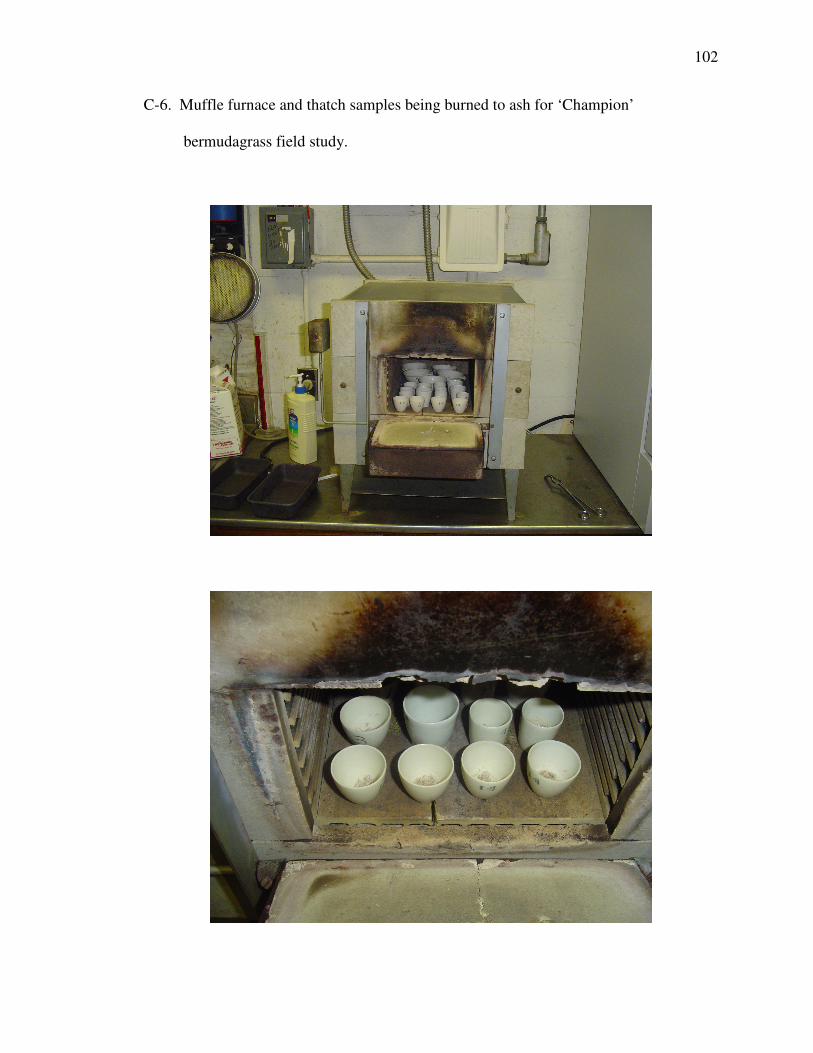
102
C-6. Muffle furnace and thatch samples being burned to ash for ‘Champion’
bermudagrass field study.
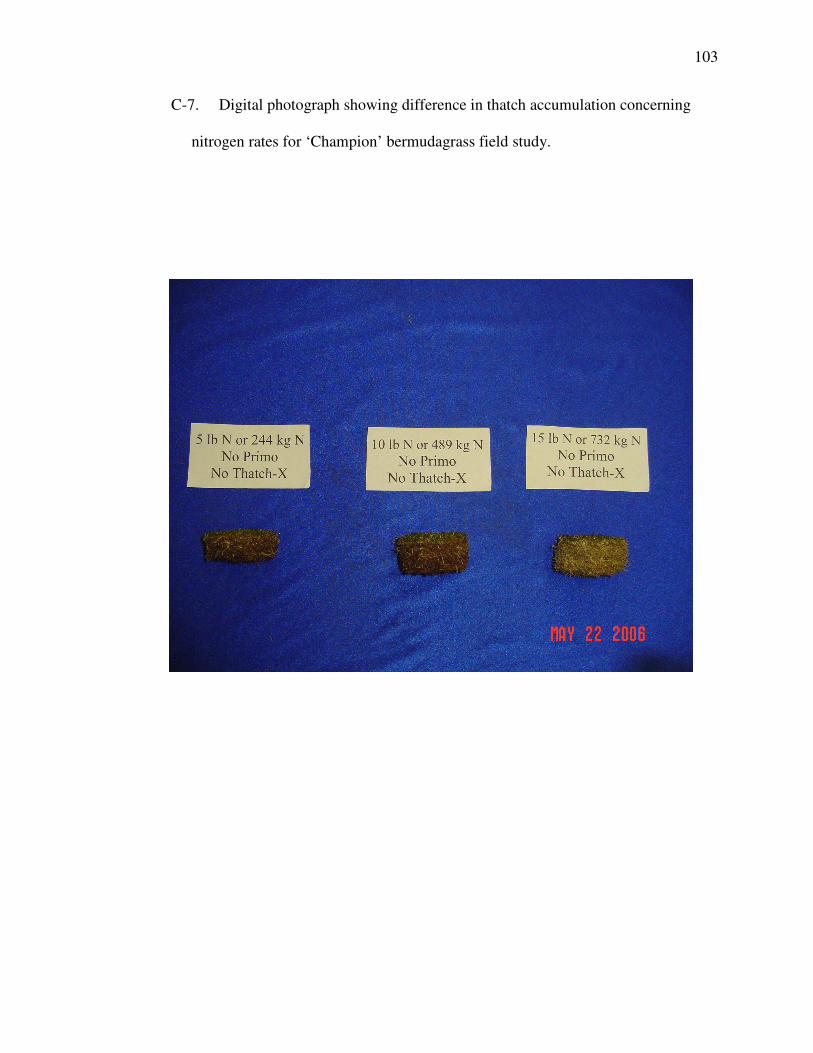
103
C-7. Digital photograph showing difference in thatch accumulation concerning
nitrogen rates for ‘Champion’ bermudagrass field study.
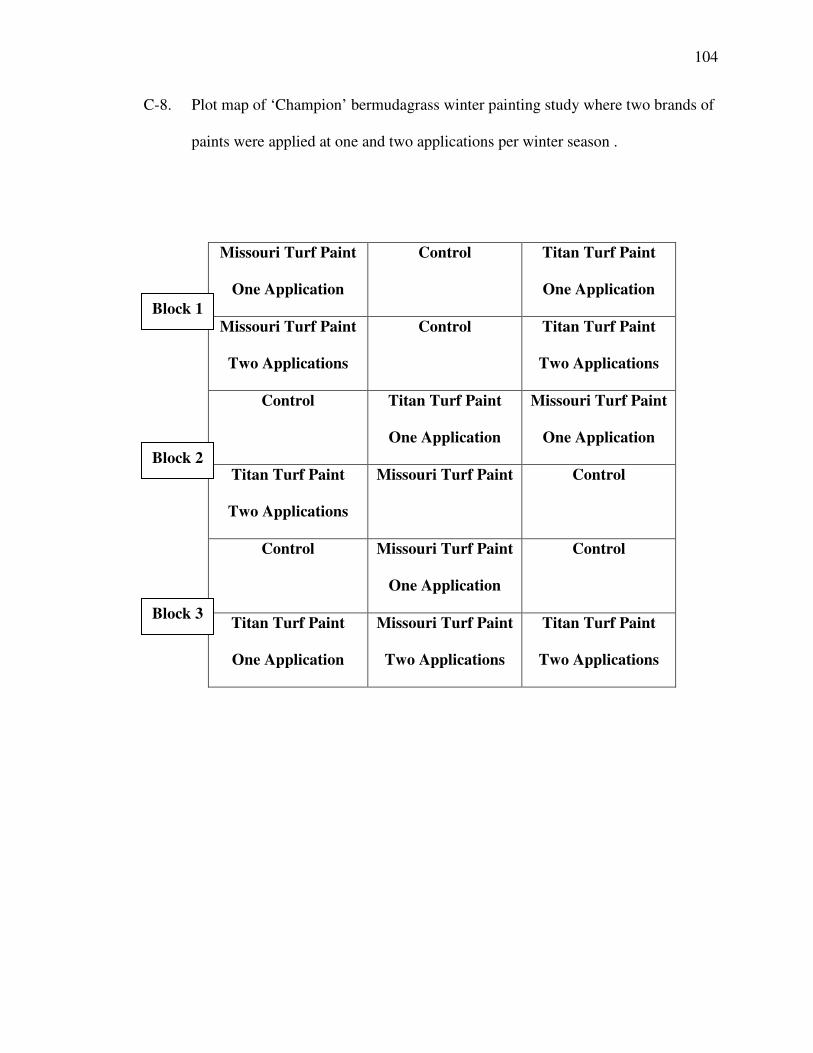
104
C-8. Plot map of ‘Champion’ bermudagrass winter painting study where two brands of
paints were applied at one and two applications per winter season .
Missouri Turf Paint
One Application
Control Titan Turf Paint
One Application
Missouri Turf Paint
Two Applications
Control Titan Turf Paint
Two Applications
Control Titan Turf Paint
One Application
Missouri Turf Paint
One Application
Titan Turf Paint
Two Applications
Missouri Turf Paint Control
Control Missouri Turf Paint
One Application
Control
Titan Turf Paint
One Application
Missouri Turf Paint
Two Applications
Titan Turf Paint
Two Applications
Block 1
Block 2
Block 3
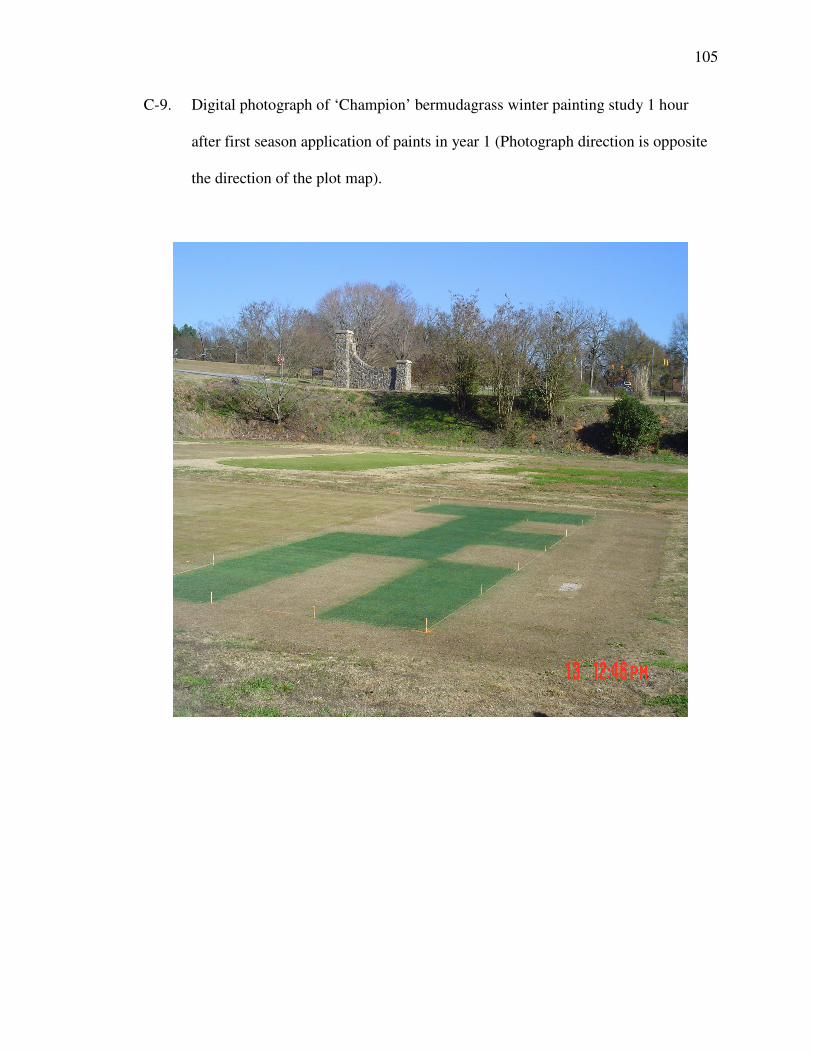
105
C-9. Digital photograph of ‘Champion’ bermudagrass winter painting study 1 hour
after first season application of paints in year 1 (Photograph direction is opposite
the direction of the plot map).
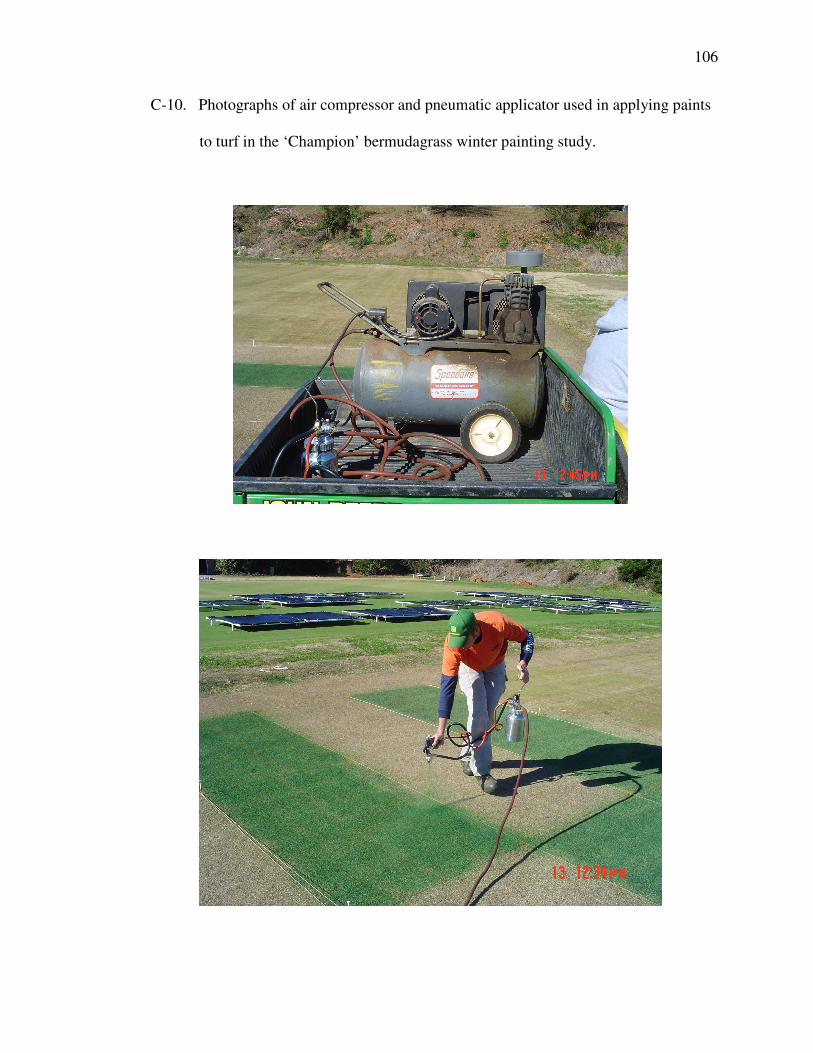
106
C-10. Photographs of air compressor and pneumatic applicator used in applying paints
to turf in the ‘Champion’ bermudagrass winter painting study.
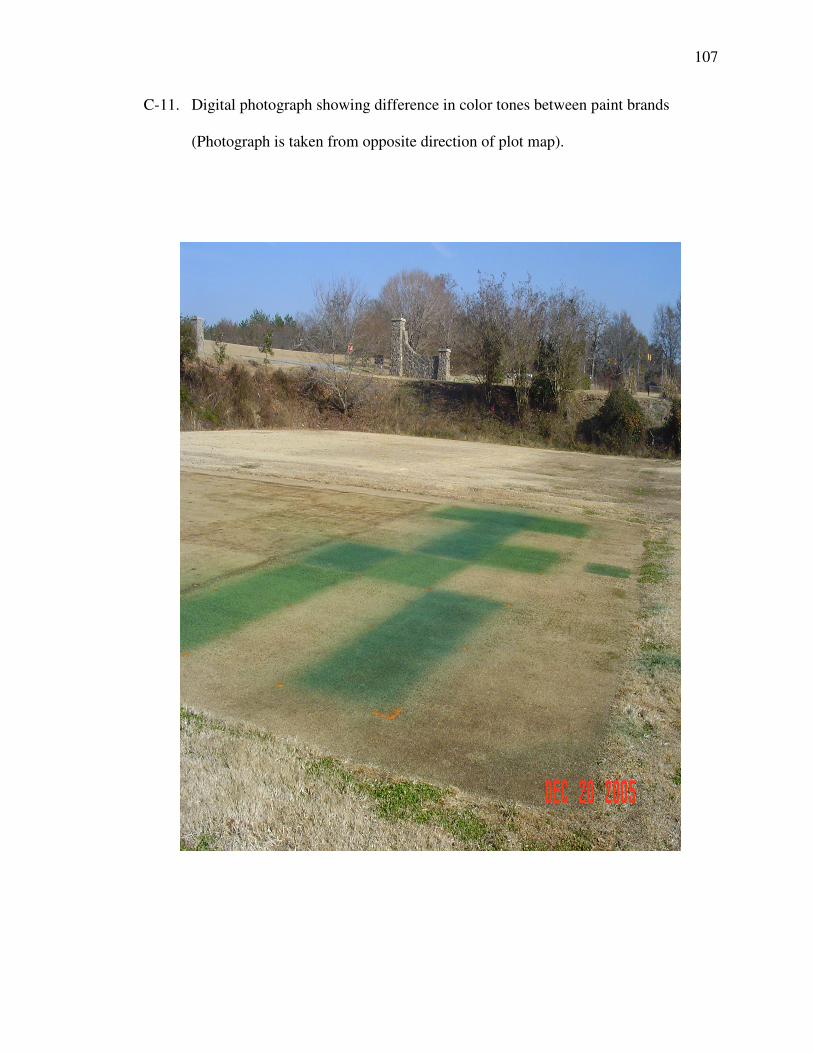
107
C-11. Digital photograph showing difference in color tones between paint brands
(Photograph is taken from opposite direction of plot map).
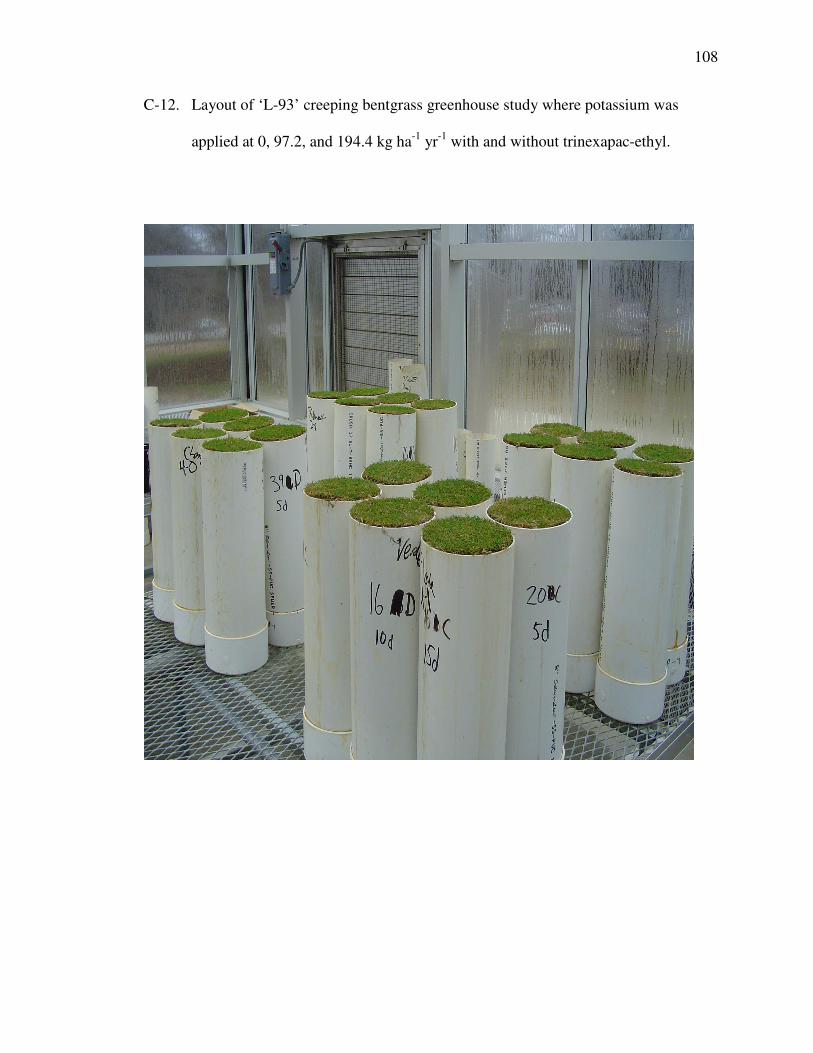
108
C-12. Layout of ‘L-93’ creeping bentgrass greenhouse study where potassium was
applied at 0, 97.2, and 194.4 kg ha-1 yr-1 with and without trinexapac-ethyl.
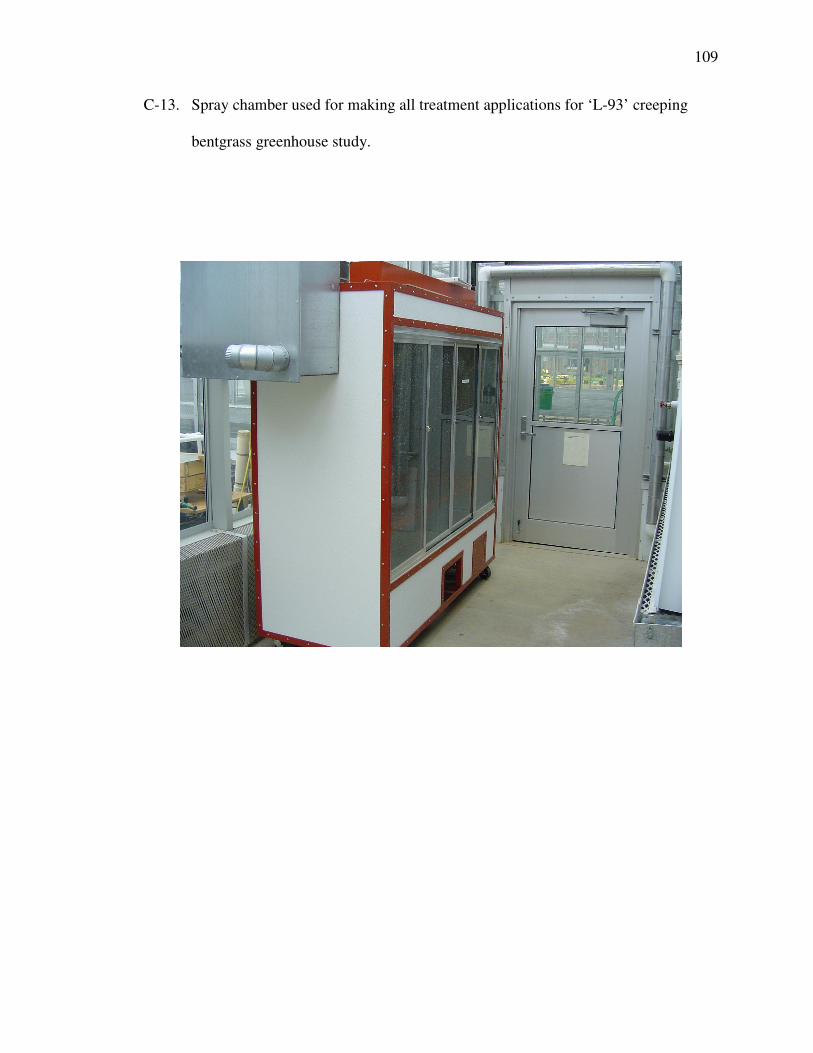
109
C-13. Spray chamber used for making all treatment applications for ‘L-93’ creeping
bentgrass greenhouse study.
REFERENCES
Anonymous. 2004a. Champion Turf Farms, Inc. Retrieved: May 15, 2004.
(http://www.cturf.com).
Anonymous. 2004b. Milliken Chemical. Retrieved: May 27, 2004.
(http://www.milliken2.com).
Anonymous. 2005a. Plant Growth Regulators in the Turfgrass Industry. Retrieved:
April 15, 2005. (http://www.msu.edu/~babbageb/pgr.htm).
Anonymous. 2005b. Primo Conditional Registration. Retrieved: April 15, 2005.
(http://pmep. cce.cornell. edu/profiles/herb-growthreg/cacodyliccymoxanil/
cimectacarb/cimectacarb-reg.html).
Anonymous. 2006. Syngenta Crop Sciences, Inc. Retrieved: June 31, 2006.
(http://www.syngenta.com).
Baldwin, C.M. 2004. Responses of Warm-Season Turfgrasses to Various Physiological
Stresses. M.S. Thesis. Clemson University. Clemson, SC.
Beard, J.B. 1982. Turf Management for Golf Courses. Macmillian Publishing Co., NY.
Beard, J. B. 1973. Turfgrass: Science and Culture. Prentice-Hall, Inc. Englewood.
Cliffs. N.J.
Bloom, A.J., A. Meyerhoff, A.R. Taylor, and T.L. Rost. 2003. Root development and
absorption of ammonium and nitrate from the rhizosphere. J. Plant Growth
Regul. 21:416-431
111
Bowman, D.C., C.T. Cherney, and T.W. Rufty, Jr. 2002. Fate and transport of nitrogen
applied to six warm-season turfgrasses. Crop Sci. 42:833-841.
Bowman, D.C., G.R. Cramer, and D.A. Devitt. 2005. Effect of salinity and nitrogen
status on nitrogen uptake by tall fescue turf. J. Plant Nutrition. 29:1481-1490.
Bunnell, T.B., L.B. McCarty, and W.C. Bridges, Jr. 2005. ‘TifEagle’ bermudagrass
response to growth factors and mowing height when grown at various hours
of sunlight. Crop Sci. 45:575-581.
Campbell, W.H. 1999. Nitrate reductase structure, function and regulation. Annu. Rev.
Plant Phys. 50:277-303.
Carrow, R.N., B.J. Johnson, and R.E. Burns. 1987. Thatch and quality of Tifway
bermudagrass turf in relation to fertility and cultivation. Agron. J. 79:524-530.
Carrow, R.N., D.V. Waddington, and P.E. Rieke. 2001. Turfgrass Soil fertility and
Chemical Problems – Assessment and Management. Ann Arbor Press, Chelsea,
MI.
Carson, Teressa. 2004. Overseed or paint? Golf Course Mgt. 72(12):22.
Chalmers, D.R. and R.E. Schmidt. 1979. Bermudagrass survival as influenced by
deacclimation, low temperatures, and dormancy. Agron. J. 71:947-949.
Christians, N.E., D.P. Martin, and K.J. Karnok. 1981. The interactions among nitrogen,
phosphorus, and potassium on the establishment, quality, and growth of Kentucky
bluegrass (Poa pratensis L. ‘Merion’) p. 341-348. In R.W. Sheard (ed.) Proc. 4th
Intl. Turfgrass Res. Conf., Guelph, Canada. 19-23 July 1981. Int. Turgrass Soc.,
Ontario Agric. Coll., Univ. of Guelph, Guelph, ON.
112
Cisar, J., G. Snyder, and D. Park. 2005. The effect of nitrogen rates on ultradwarf
bermudagrass quality. USGA 4(17):1-6.
Dernoedon, P.H. 2000. Creeping Bentgrass Management Summer Stresses, Weeds and
Selected Maladies. Ann Arbor Press, Chelsea, Michigan.
Duble, R.L. 1996. Turfgrasses Their Management and Use in the Southern Zone. Texas
A&M University Press, College Station. Texas.
Ebdon, J.S., A.M. Petrovic, and R.A. White. 1999. Interaction of nitrogen, phosphorus
and potassium on evapotransporation rate and growth of Kentucky bluegrass.
Crop Sci. 39:209-218.
Ervin, E.H. and A.J. Koski. 2001. Kentucky Bluegrass growth responses to
trinexapac-ethyl, traffic, and nitrogen. Crop Sci. 41:1871-1877.
Fagerness, M.J. and F.H. Yelverton. 2000. Tissue production and quality of ‘Tifway’
bermudagrass as affected by seasonal application patterns of trinexapac-ethyl.
Crop Sci. 40:493-497.
Fagerness, M.J., D.C. Bowman, F.H. Yelverton, and T.W. Rufty, Jr. 2004. Nitrogen use
in Tifway bermudagrass, as affected by trinexapac-ethyl. Crop Sci. 44:595-599.
Fitzpatrick, R.J.M. and K. Guillard. 2004. Kentucky bluegrass response to potassium
and nitrogen fertilization. Crop Sci. 44:1721-1728.
Forde, B.G. and D.T. Clarkson. 1999. Nitrate and ammonium nutrition of plants:
Physiological and molecular perspectives. Adv. Bot. Res. 30:1-90.
Goatley, J.M. Jr., V. L. Maddox, and K. L. Hensler. 1998. Late-season application of
various nitrogen sources affect color and carbohydrate content of ‘Tiflawn’ and
Arizona common bermudagrass. Hort. Sci. 33: 692-695.

113
Goatley, J. M. Jr, V. Maddox, D.J. Lang and K.K.Crouse. 1994. Tifgreen bermudagrass
response to late-season application of N and K. Agron. J. 86: 7-10
Goatley, Jr., J.M., H.W. Philley, J.V. Krans, E.A. van Santen, L. Capo-chichi, and D.
Davis. 2003. The genetic stability of six bermudagrasses as affected by chronic
exposure to dinitroaniline herbicides. USGA Green Section Record. 2(10):1-7.
Golembiewski, R.C. and T. K. Danneberger. 1998. Dollar spot severity as
influenced by Trinexapac-ethyl, creeping bentgrass cultivar, and nitrogen fertility.
Agron. J. 90:466–470.
Goss, R.M., J.H. Baird, S.L. Kelm, and R.N. Calhoun. 2002. Trinexapac-ethyl and
nitrogen effects on creeping bentgrass grown under reduced light conditions.
Crop Sci. 42:472-479.
Guertal, E. A. and D. L. Evans. 2006. Nitrogen rate and mowing height effects on
TifEagle bermudagrass establishment. Crop Sci 46: 1772-1778.
Hanna, W. 2005. Controlling thatch in 'TifEagle' bermudagrass with the Graden
Verticutter. USGA Turfgrass and Environmental Research Online 4(5):1-6.
Havlin, J.L., J.D. Beaton, S.L. Tisdale, and W.L. Nelson. 2005. Soil Fertility and
Fertilizers, 7th ed. Upper Saddle River, NJ. Prentice-Hall Inc.
Hill, W.J., J. R. Heckman, B.B. Clarke, and J. A. Murphy. 2002. Soil pH management
for control of summer patch of Kentucky bluegrass. J. Int. Turf. Soc. 9: 388-393.
Hollingsworth, B.S., E.A. Guertal, and R.H. Walker. 2005. Cultural management and
nitrogen source effects on ultradwarf bermudagrass cultivars. Crop Sci.
45:486-493.
Hull, R.J. 1996. N usage by turfgrass. Turfgrass Trends 5(11): 6-15.
114
Hull, R. J. and H. Liu. 2005. Turfgrass nitrogen: physiology and environmental impacts.
Inter. Turfgrass Soc. Res. J. 10:962-975.
Johnson, B.J. 1997. Growth of Tifway bermudagrass following application of nitrogen
and iron with trinexapac-ethyl. HortScience 32:241-242.
Kopp, K.L. and K. Guillard. 2002. Clipping management and nitrogen fertilization of
turfgrass: growth, nitrogen utilization, and quality. Crop Sci. 42:1225-1231.
Lemaux, Peggy G. Plant Growth Regulators and Biotechnology. Retrieved: Jan.
13, 1999. (http://ucbiotech.org/resources/biotech/talks/misc/regulat.html).
Lickfeldt, D.W., D.S. Gardner, B.E. Branham, and T.B. Voigt. 2001.
Implications of repeated trinexapac-ethyl applications on kentucky bluegrass.
Agron. J. 93:1164–1168.
Lillo, C., C. Meyer, U.S. Lea, F. Provan, and S. Oltedal. 2004. Mechanism and
importance of post-translational regulation of nitrate reductase. J. Exp. Bot.
55:1275-1282.
Marschner, H. 1995. Mineral Nutrition of Higher Plants. 2nd Edition. Academic Press,
London.
McCarty, L.B. 2005. Best Golf Course Management Practices, 2nd ed. Prentice-Hall Inc.
Upper Saddle River, NJ.
McCarty L.B., and G. Miller. 2002. Managing Bermudagrass Turf. Selection,
Construction, Cultural Practices, and Pest Management Strategies. Ann Arbor
Press, Chelsea, MI.
McCarty, L.B., J.S. Weinbrecht, J.E. Toler, and G.L. Miller. 2004. St. Augustinegrass
response to plant growth retardants. Crop Sci. 44:1323-1329.

115
McCarty, L.B., M.F. Gregg, J.E. Toler, J.J. Camberato, and H.S. Hill. 2005. Minimizing
thatch and mat development in a newly seeded creeping bentgrass golf green.
Crop Sci. 45:1529-1535.
McCullough, P.E. 2004. Physiological response of ‘TifEagle’ bermudagrass (Cynodon
dactylon Pers. x C. transvaalensis Burtt-Davy) to nitrogen and trinexapac-ethyl.
M.S. Thesis. Clemson University. Clemson, SC.
McCullough, P. E., H. Liu, L. B. McCarty, T. Whitwell, and J. E. Toler. 2006.
Bermudagrass putting green growth, quality, and nutrient partitioning influenced
by nitrogen and trinexapac-ethyl. Crop Sci. 46: 1515-1525.
Monroe, C.A., C.D. Coorts, and C.R. Skogley. 1969. Effect of nitrogen-potassium levels
on the growth and composition of Kentucky bluegrass. Agron J. 61:294-296.
Munshaw, G.C., E.H. Ervin, C. Shang, S.D. Askew, X. Zhang, and R.W. Lemus. 2006.
Influence of late-season iron, nitrogen, and seaweed extract on fall color retention
and cold tolerance of four bermudagrass cultivars. Crop Sci. 46:273-283.
O’Brien, P. and C. Hartwiger. 2005. Personal communication.
O’Brien, P. and C. Hartwiger. 2001. Tips on designing an ultradwarf bermudagrass
putting green management program for the SE region. USGA regional news
update, June 4, 2001.
Pellet, H.M. and M.C. Roberts. 1963. Effects of mineral nutrition on high temperature
induced growth retardation of Kentucky bluegrass. Agron J. 55:473-476.
Petrovic, A.M. 1990. The fate of nitrogenous fertilizers applied to turfgrass. J. Eviron.
Qual. 19:1-14.
116
Qian, Y.L., and M.C. Engelke. 1999. Influence of trinexapac-ethyl on ‘Diamond’
zoysiagrass in a shade environment. Crop Sci. 39:202-208.
Sartain, J.B. 2002. Tifway bermudagrass response to potassium fertilization. Crop Sci.
42:507-512.
Sartain, J.B. 1993. Interrelationships among turfgrasses, clipping recycling, thatch, and
applied calcium, magnesium, and potassium. Agron. J. 85:40-43.
SAS Institute Inc. 2003. SAS Version 9.1. SAS Inst., Cary, NC.
Shearman, R.C., L.A. Wit, S. Severmutlu, H. Budak, and R.E. Gaussoin. 2005. Colorant
effects on dormant buffalograss turf performance. HortTech. 15(2):244-246.
Snyder, G.H. and J.L. Cisar. 2000. Nitrogen/potassium fertilization ratios for
bermudagrass turf. Crop Sci. 40:1719-1723.
Steinke, K. and J.C. Stier. 2003. Nitrogen selection and growth regulator applications
for improving shaded turf performance. Crop Sci. 43:1399-1406.
Stier, J.C., and J.N. Rogers III. 2001. Trinexapac-ethyl and iron effects on supina and
Kentucky bluegrass under reduced irradiance. Crop Sci. 39:1423-1430.
Taiz, L. and E. Zeiger. 2006. Plant Physiology 4th ed. Sinauer Associates, Inc.
Sunderland, MA.
Trenholm, L.E., R.N. Carrow, and R.R. Duncan. 2000. Mechanisms of wear tolerance in
seashore paspalum and bermudagrass. Crop Sci. 40:1350-1357.
Tucker, B.J., L.B. McCarty, H. Liu, C.E. Wells, and J.R. Rieck. 2006. Mowing height,
nitrogen rate, and biostimulant influence root development of field-grown
‘TifEagle’ bermudagrass. HortScience 41(3):805-807
117
Turgeon, A. J. 2005. Turfgrass Management, 7th Ed. Prentice-Hall, Inc. Englewood
Cliffs. N.J.
Turner, T.R. and N.W. Hummel, Jr. 1992. Nutritional requirements and fertilization. In
D.V. Waddington, R.N. Carrow, and R.C. Shearman, Eds. Turfgrass. Agronomy
Monograph 32, Madison, WI. Amer. Soc. of Agron.
Willis, G., L.B. McCarty, A. Estes, and H. Liu. 2006. Chemical thatch control in a
creeping bentgrass putting green. Golf Course Mgt. 74(10): 96-98.