Embed Size (px)
Citation preview
Version 1. June 13, 2014
1
Thawing Permafrost Lessons & Lab Manual
Bruce Taterka West Morris Mendham High School
65 East Main Street Mendham, NJ 07945
Rose M. Cory, PhD Department Of Earth & Environmental Sciences
2534 C. C. Little Building, 1100 North University Ave Ann Arbor, Michigan, 48109-1005
The manual presents lessons and lab activities for high school earth science, environmental science and biology. The focus is on permafrost and related topics including the earth’s carbon cycle, the greenhouse effect, climate change, and aqueous geochemistry. The diagrams and photographs included in this manual, along with additional visual materials, are included in the companion Thawing Permafrost Presentation, available on Google Drive. For the activities described below, access to permafrost is not necessary. The activities will work fine with compost, humus, soil with a high organic content, or even leaf litter. Contents:
Introduction ............................................................................................... 1
Lesson 1: What is Permafrost? ............................................................... 3
Lesson 2: Climate Feedback Loops ........................................................ 6
Lesson 3: Dissolved Organic Matter in Natural Waters ........................ 7
Lesson 4: Effect of Sunlight on DOM ...................................................... 11
Lesson 5: Respiration from Natural Waters ........................................... 15
Resources .................................................................................................. 17
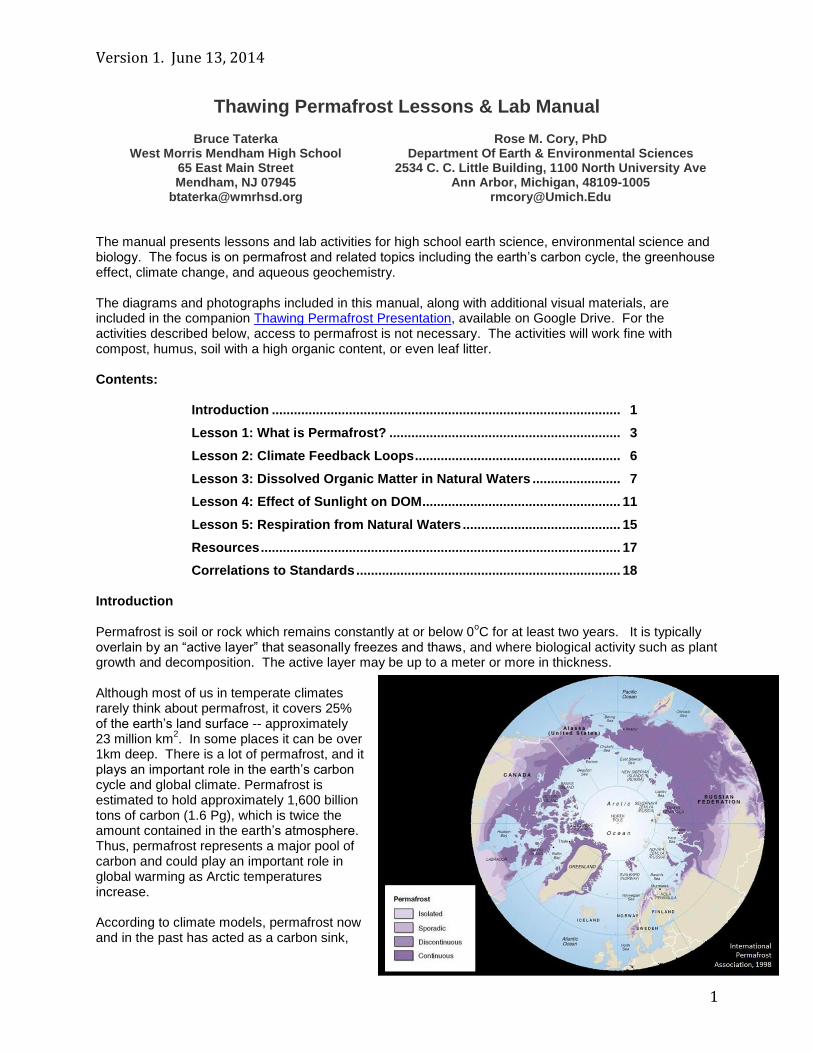
Correlations to Standards ........................................................................ 18 Introduction Permafrost is soil or rock which remains constantly at or below 0
oC for at least two years. It is typically
overlain by an “active layer” that seasonally freezes and thaws, and where biological activity such as plant growth and decomposition. The active layer may be up to a meter or more in thickness. Although most of us in temperate climates rarely think about permafrost, it covers 25% of the earth’s land surface -- approximately 23 million km
2. In some places it can be over
1km deep. There is a lot of permafrost, and it plays an important role in the earth’s carbon cycle and global climate. Permafrost is estimated to hold approximately 1,600 billion tons of carbon (1.6 Pg), which is twice the amount contained in the earth’s atmosphere. Thus, permafrost represents a major pool of carbon and could play an important role in global warming as Arctic temperatures increase. According to climate models, permafrost now and in the past has acted as a carbon sink,

Version 1. June 13, 2014
2
with more carbon taken in from the atmosphere through photosynthesis during the short Arctic growing season that is emitted through decomposition and respiration throughout the year. This can be observed in permafrost deposits, which commonly contain deeply buried plant remains that are tens of thousands of years old, but appear to be relatively fresh and undecayed. As climate warms, permafrost will thaw and become dryer, which will expose previously-frozen organic material to sunlight and bacterial action, enhancing respiration and decomposition. This will have the effect of converting permafrost carbon to the greenhouse gases carbon dioxide and methane, promoting global warming. This is a positive feedback process in which warmer climate will lead to thawing permafrost, which in turn will lead to increasing greenhouse gases and an even warmer global climate. However, it also must be considered that a warming climate will produce a longer growing season, increasing photosynthesis. The overall carbon balance in a warming tundra is not well understood at this time, but current research warns that Arctic ecosystems could shift from being a carbon sink to being carbon-neutral, or even becoming a carbon source depending on the amount of warming that occurs. Concern over the thawing of permafrost is especially acute because temperature increases in the Arctic over the past 100 years have been greater than any other area of the planet, with some parts of the Arctic experiencing more than twice as much warming as the global average. Borehole studies have observed that permafrost temperatures at 20 m depth have increased 2–3 ◦C increase in the last two decades. Because of the large quantity of carbon locked up in permafrost and the prospect of even more extreme warming in the future, “carbon dioxide and methane emissions from thawing permafrost and warming wetlands of the Arctic have been referred to as a carbon bomb, and there is compelling evidence that the fuse is burning now.” (Woods Hole). As Arctic air temperatures have been increasing over past decades, ground temperatures have also shown a warming trend. As a result, permafrost has been warming and even melting in some locations. While it will take centuries for permafrost to melt even under high-end warming scenarios, the impact of thawing permafrost is already being felt in Arctic regions. Melting permafrost can cause the ground to become unstable, leading to soil collapse. Melting can produce “thermokarst” features, which are sinkholes or puddles at the surface of ground underlain by permafrost. This can have serious consequences for drainage and wildlife habitat as well as roads, pipelines and structures.
This work has been made possible by the National Science Foundation and
PolarTREC, which supported the Arctic Sunlight & Microbial
Interactions research program at the Toolik Field
Station in the summer of 2013.
Version 1. June 13, 2014
3
Lesson 1: What is Permafrost?
Approximate Time: 2 to 3 class periods Materials
Thawing Permafrost Presentation Lesson #1 - What is Permafrost?
Computers and web connection for online research
Video: Thawing Permafrost (NSF Changing Planet Series)
National Snow & Ice Data Center, All About Frozen Ground
National Geographic: Permafrost
Active Layer Thaw Depth spreadsheet
Permafrost or permafrost substitute (compost, humus, soil with a high organic content, ordinary soil, or even leaf litter)
CO2 sensors
Plastic containers with cutout for CO2 sensor
Safety and Disposal
Students should wear safety goggles
Soil can be returned to original location or composted. Activities
1. Introduction & Background
Lesson #1 -- What is Permafrost? (included in the Thawing Permafrost Presentation)
Video: Thawing Permafrost (NSF Changing Planet Series)
Online research
National Snow & Ice Data Center, All About Frozen Ground.
National Geographic - Permafrost
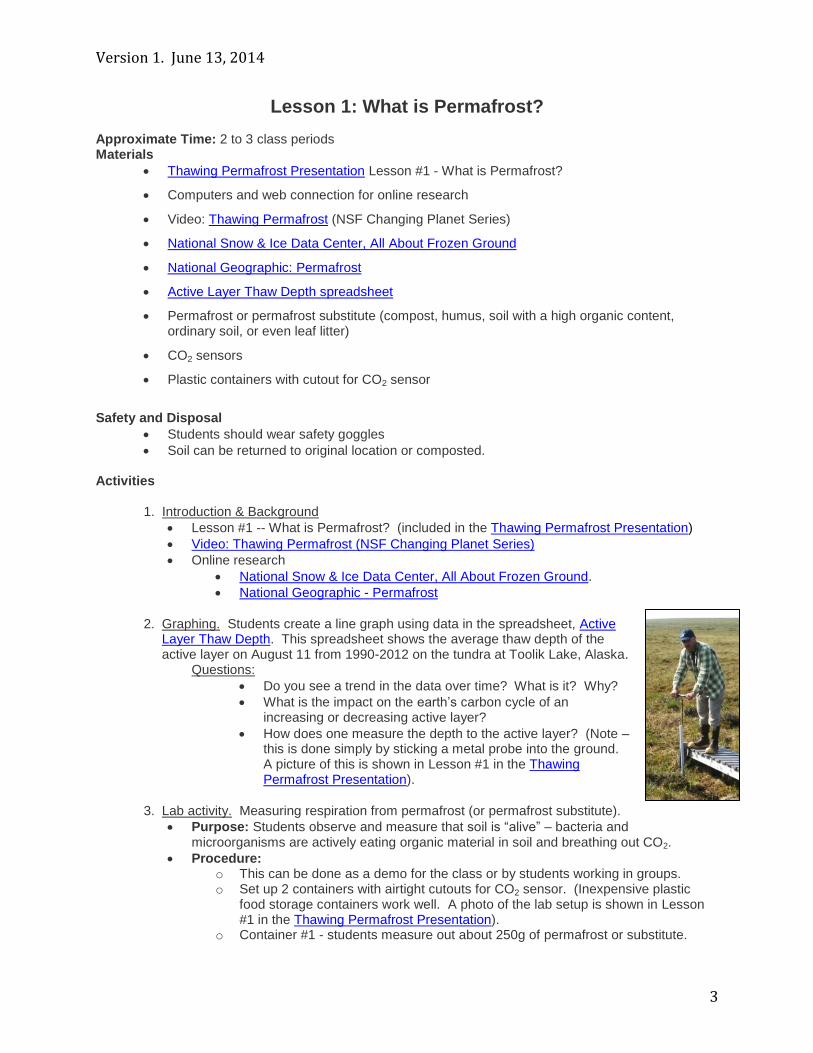
2. Graphing. Students create a line graph using data in the spreadsheet, Active Layer Thaw Depth. This spreadsheet shows the average thaw depth of the active layer on August 11 from 1990-2012 on the tundra at Toolik Lake, Alaska.
Questions: Do you see a trend in the data over time? What is it? Why?
What is the impact on the earth’s carbon cycle of an increasing or decreasing active layer?
How does one measure the depth to the active layer? (Note – this is done simply by sticking a metal probe into the ground. A picture of this is shown in Lesson #1 in the Thawing Permafrost Presentation).
3. Lab activity. Measuring respiration from permafrost (or permafrost substitute).
Purpose: Students observe and measure that soil is “alive” – bacteria and microorganisms are actively eating organic material in soil and breathing out CO2.
Procedure: o This can be done as a demo for the class or by students working in groups. o Set up 2 containers with airtight cutouts for CO2 sensor. (Inexpensive plastic
food storage containers work well. A photo of the lab setup is shown in Lesson #1 in the Thawing Permafrost Presentation).
o Container #1 - students measure out about 250g of permafrost or substitute.

Version 1. June 13, 2014
4
o Container #2 – no permafrost. This is a control. o Place sensors in containers and record CO2 concentration in atmosphere inside
container. (Should be about 400ppm to start). Check time. o Record CO2 concentration every 5 or 10 minutes over class period.
Data Analysis: o Create a line graph showing change in ppm CO2 in Container #1 and Container
#2 o Calculate change in ppm CO2 per minute o Calculate percent change CO2. o Optional calculations for advanced students:
Linear regression, calculate slope of trend line in Container #1. Calculate volume of air in container, total volume of CO2 produced, and
volume of CO2 produced per mass soil per minute.
Version 1. June 13, 2014
5
Questions: o What is the difference between the trends in CO2 concentration in Container #1
and Container #2. Why? o What was the process that produced CO2? o How does this relate to organic material that is frozen on the tundra? o If the Arctic continues to warm, what will be the effect on climate from thawing
permafrost?
Variations: o Conduct the experiment at different temperatures, using warm or room
temperature soil compared to frozen soil. Students will observe greater respiration in warmer soil, demonstrating the impact of climate change on the release of carbon from permafrost.
Connections:
This lab illustrates the concept that soil contains carbon that actively participates in the earth’s carbon cycle. This carbon is available to be metabolized to CO2 and CH4 by soil organisms, or to dissolve into groundwater and eventually flow into surface waters which is explored in Labs 3, 4 and 5.
Version 1. June 13, 2014
6
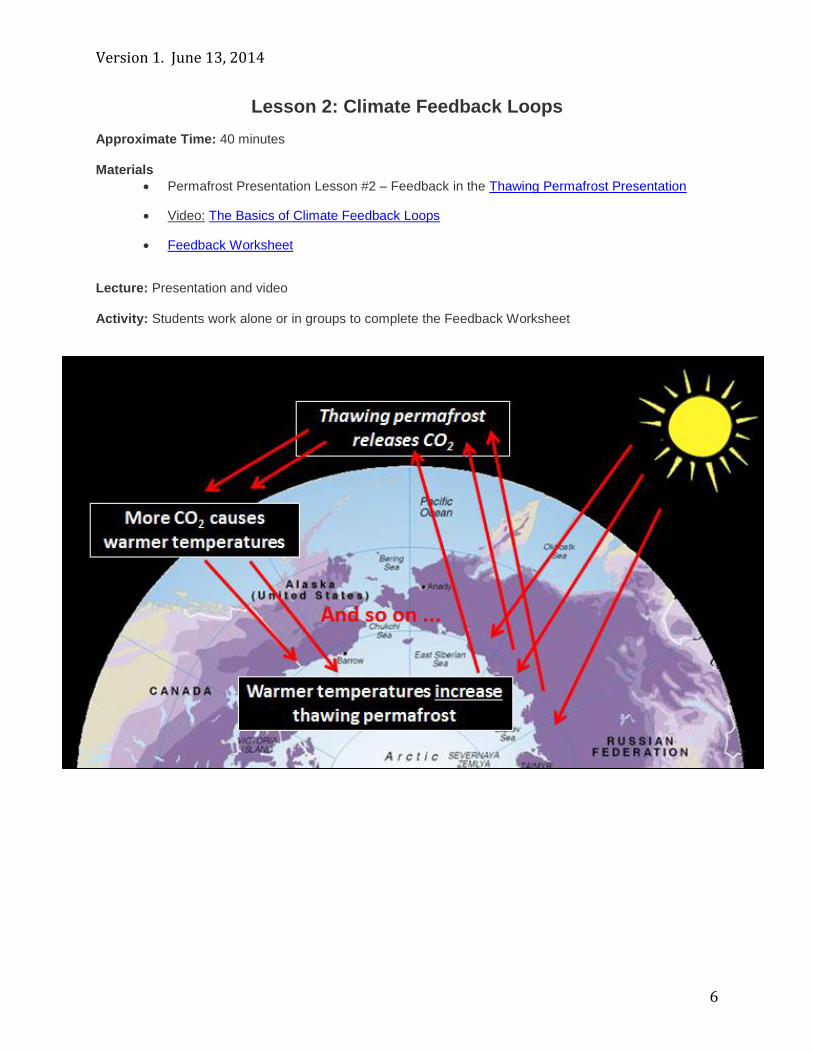
Lesson 2: Climate Feedback Loops
Approximate Time: 40 minutes Materials
Permafrost Presentation Lesson #2 – Feedback in the Thawing Permafrost Presentation
Video: The Basics of Climate Feedback Loops
Feedback Worksheet
Lecture: Presentation and video Activity: Students work alone or in groups to complete the Feedback Worksheet
Version 1. June 13, 2014
7
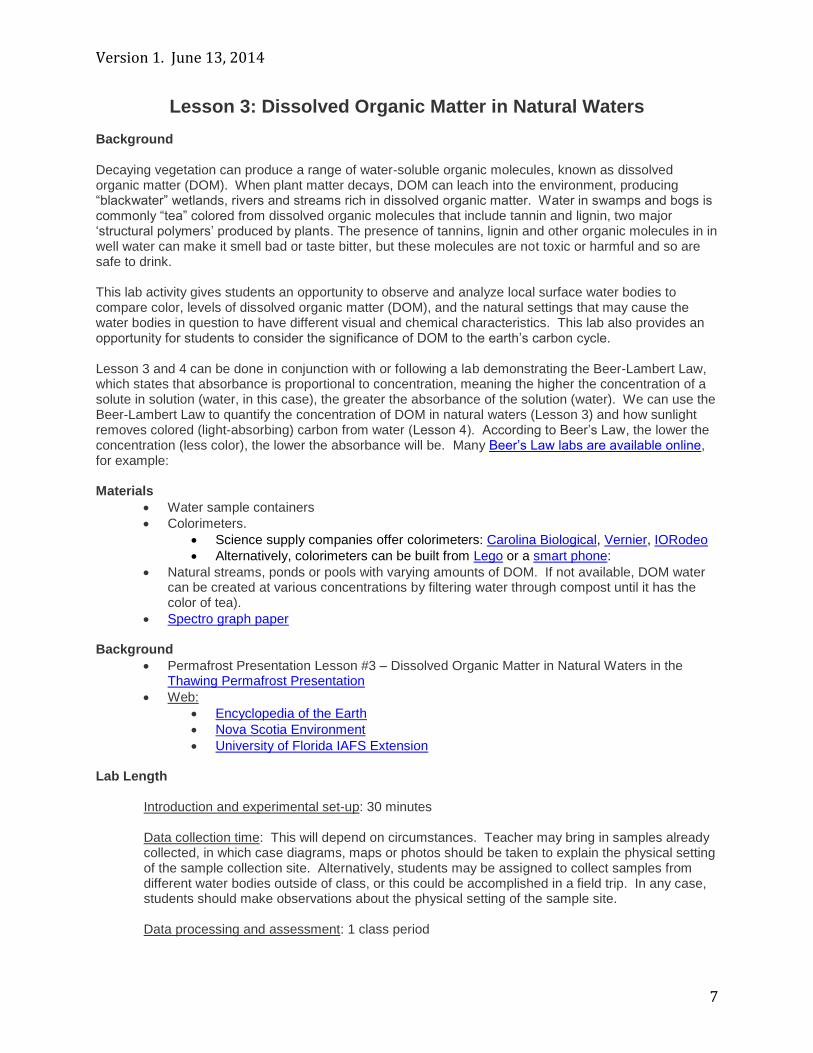
Lesson 3: Dissolved Organic Matter in Natural Waters
Background Decaying vegetation can produce a range of water-soluble organic molecules, known as dissolved organic matter (DOM). When plant matter decays, DOM can leach into the environment, producing “blackwater” wetlands, rivers and streams rich in dissolved organic matter. Water in swamps and bogs is commonly “tea” colored from dissolved organic molecules that include tannin and lignin, two major ‘structural polymers’ produced by plants. The presence of tannins, lignin and other organic molecules in in well water can make it smell bad or taste bitter, but these molecules are not toxic or harmful and so are safe to drink. This lab activity gives students an opportunity to observe and analyze local surface water bodies to compare color, levels of dissolved organic matter (DOM), and the natural settings that may cause the water bodies in question to have different visual and chemical characteristics. This lab also provides an opportunity for students to consider the significance of DOM to the earth’s carbon cycle. Lesson 3 and 4 can be done in conjunction with or following a lab demonstrating the Beer-Lambert Law, which states that absorbance is proportional to concentration, meaning the higher the concentration of a solute in solution (water, in this case), the greater the absorbance of the solution (water). We can use the Beer-Lambert Law to quantify the concentration of DOM in natural waters (Lesson 3) and how sunlight removes colored (light-absorbing) carbon from water (Lesson 4). According to Beer’s Law, the lower the concentration (less color), the lower the absorbance will be. Many Beer’s Law labs are available online, for example: Materials
Water sample containers
Colorimeters.
Science supply companies offer colorimeters: Carolina Biological, Vernier, IORodeo
Alternatively, colorimeters can be built from Lego or a smart phone:
Natural streams, ponds or pools with varying amounts of DOM. If not available, DOM water can be created at various concentrations by filtering water through compost until it has the color of tea).
Spectro graph paper Background
Permafrost Presentation Lesson #3 – Dissolved Organic Matter in Natural Waters in the Thawing Permafrost Presentation
Web:
Encyclopedia of the Earth
Nova Scotia Environment
University of Florida IAFS Extension Lab Length
Introduction and experimental set-up: 30 minutes Data collection time: This will depend on circumstances. Teacher may bring in samples already collected, in which case diagrams, maps or photos should be taken to explain the physical setting of the sample collection site. Alternatively, students may be assigned to collect samples from different water bodies outside of class, or this could be accomplished in a field trip. In any case, students should make observations about the physical setting of the sample site. Data processing and assessment: 1 class period
Version 1. June 13, 2014
8
Procedure Field Work:
1. Plastic containers for collecting water samples should be rinsed with DI water prior to field work.
2. Select sampling locations with a variety of “color.” Ideally, samples should be collected from a variety of locations including clear flowing streams, stagnant wetlands, slow-moving waters, surface waters in flat areas, hilly areas, sunny locations and shaded locations.
3. Use DI water for a control. 4. At each sample location, have students fill out the Sample Data Sheet, shown below.
Photographs should be encouraged. 5. Triple-rinse plastic sample bottles in the water body, then collect sample. Exercise care to
avoid collecting debris and solid material in the sample. 6. Ideally, samples should be filtered but this step can be skipped if sample water is not turbid.
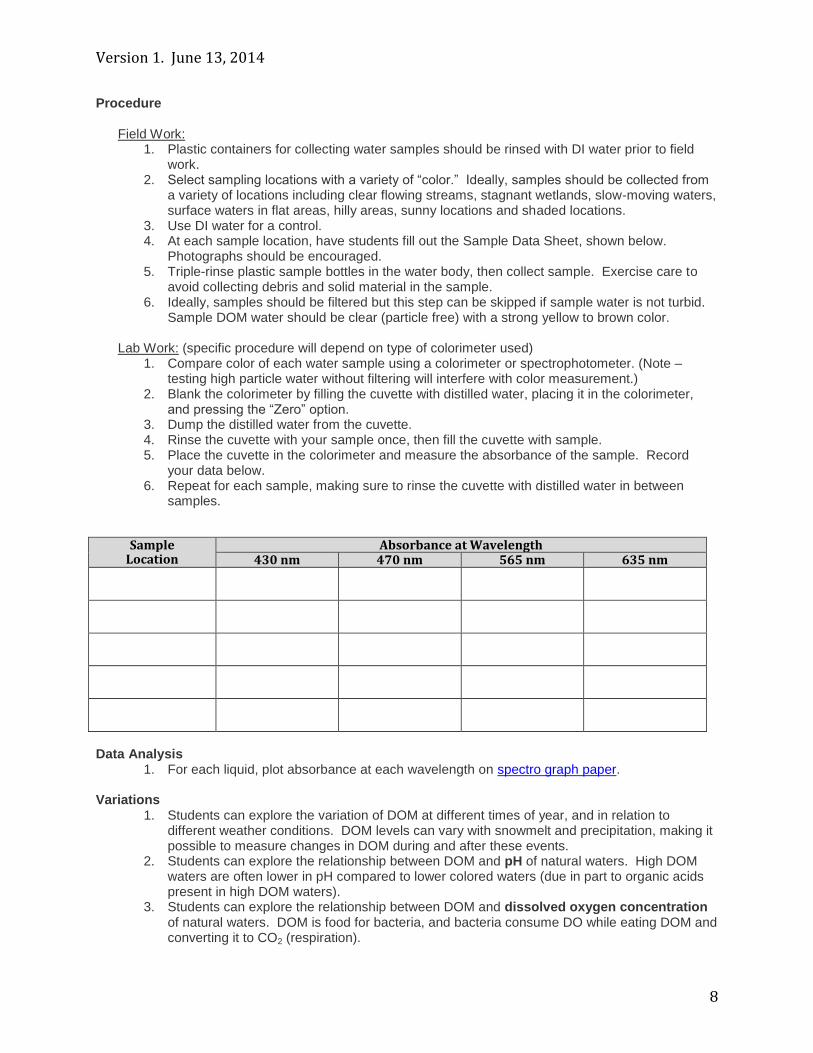
Sample DOM water should be clear (particle free) with a strong yellow to brown color. Lab Work: (specific procedure will depend on type of colorimeter used)
1. Compare color of each water sample using a colorimeter or spectrophotometer. (Note – testing high particle water without filtering will interfere with color measurement.)
2. Blank the colorimeter by filling the cuvette with distilled water, placing it in the colorimeter, and pressing the “Zero” option.
3. Dump the distilled water from the cuvette. 4. Rinse the cuvette with your sample once, then fill the cuvette with sample. 5. Place the cuvette in the colorimeter and measure the absorbance of the sample. Record
your data below. 6. Repeat for each sample, making sure to rinse the cuvette with distilled water in between
samples.
Sample Location
Absorbance at Wavelength 430 nm 470 nm 565 nm 635 nm
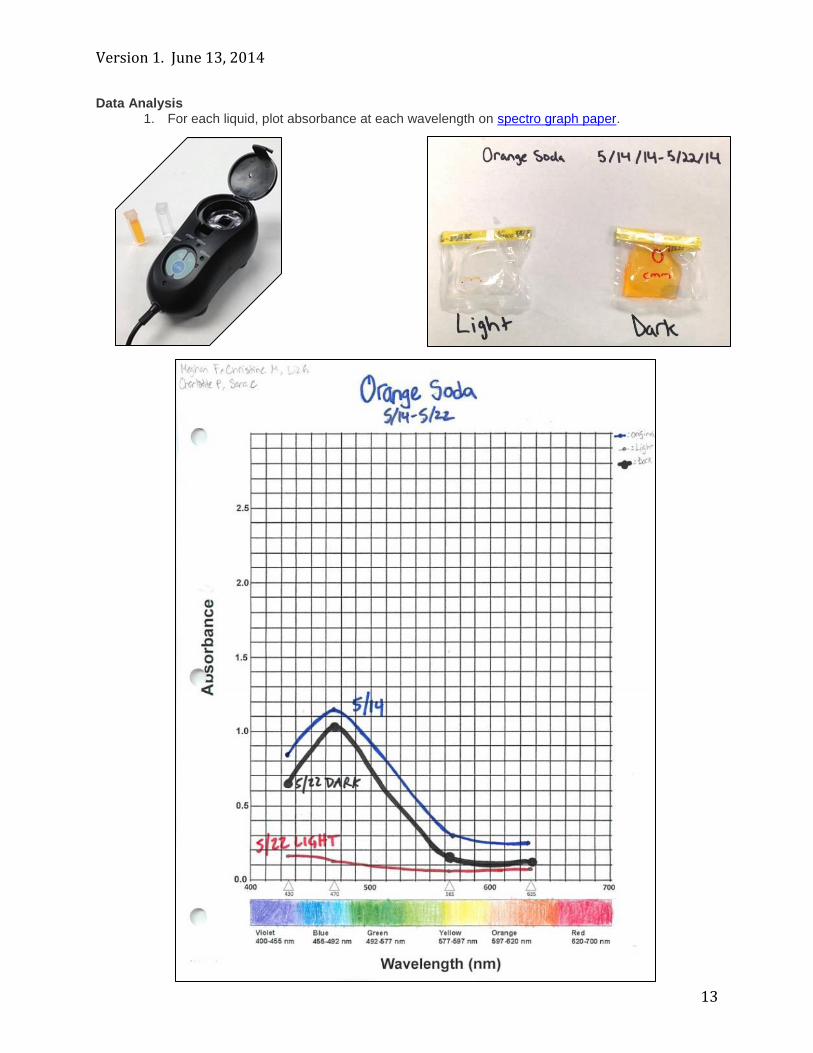
Data Analysis
1. For each liquid, plot absorbance at each wavelength on spectro graph paper. Variations
1. Students can explore the variation of DOM at different times of year, and in relation to different weather conditions. DOM levels can vary with snowmelt and precipitation, making it possible to measure changes in DOM during and after these events.
2. Students can explore the relationship between DOM and pH of natural waters. High DOM waters are often lower in pH compared to lower colored waters (due in part to organic acids present in high DOM waters).
3. Students can explore the relationship between DOM and dissolved oxygen concentration of natural waters. DOM is food for bacteria, and bacteria consume DO while eating DOM and converting it to CO2 (respiration).
Version 1. June 13, 2014
9
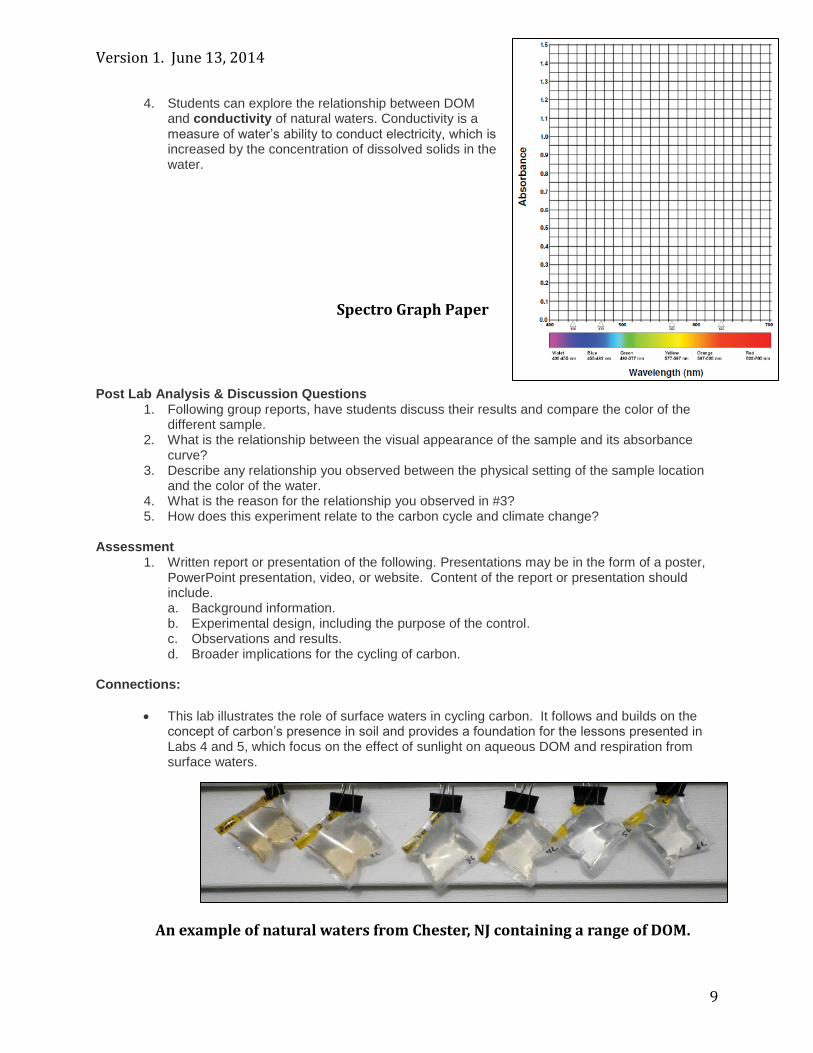
4. Students can explore the relationship between DOM and conductivity of natural waters. Conductivity is a measure of water’s ability to conduct electricity, which is increased by the concentration of dissolved solids in the water.
Post Lab Analysis & Discussion Questions
1. Following group reports, have students discuss their results and compare the color of the different sample.
2. What is the relationship between the visual appearance of the sample and its absorbance curve?
3. Describe any relationship you observed between the physical setting of the sample location and the color of the water.
4. What is the reason for the relationship you observed in #3? 5. How does this experiment relate to the carbon cycle and climate change?
Assessment
1. Written report or presentation of the following. Presentations may be in the form of a poster, PowerPoint presentation, video, or website. Content of the report or presentation should include. a. Background information. b. Experimental design, including the purpose of the control. c. Observations and results. d. Broader implications for the cycling of carbon.
Connections:
This lab illustrates the role of surface waters in cycling carbon. It follows and builds on the concept of carbon’s presence in soil and provides a foundation for the lessons presented in Labs 4 and 5, which focus on the effect of sunlight on aqueous DOM and respiration from surface waters.
Spectro Graph Paper
An example of natural waters from Chester, NJ containing a range of DOM.
Version 1. June 13, 2014
10
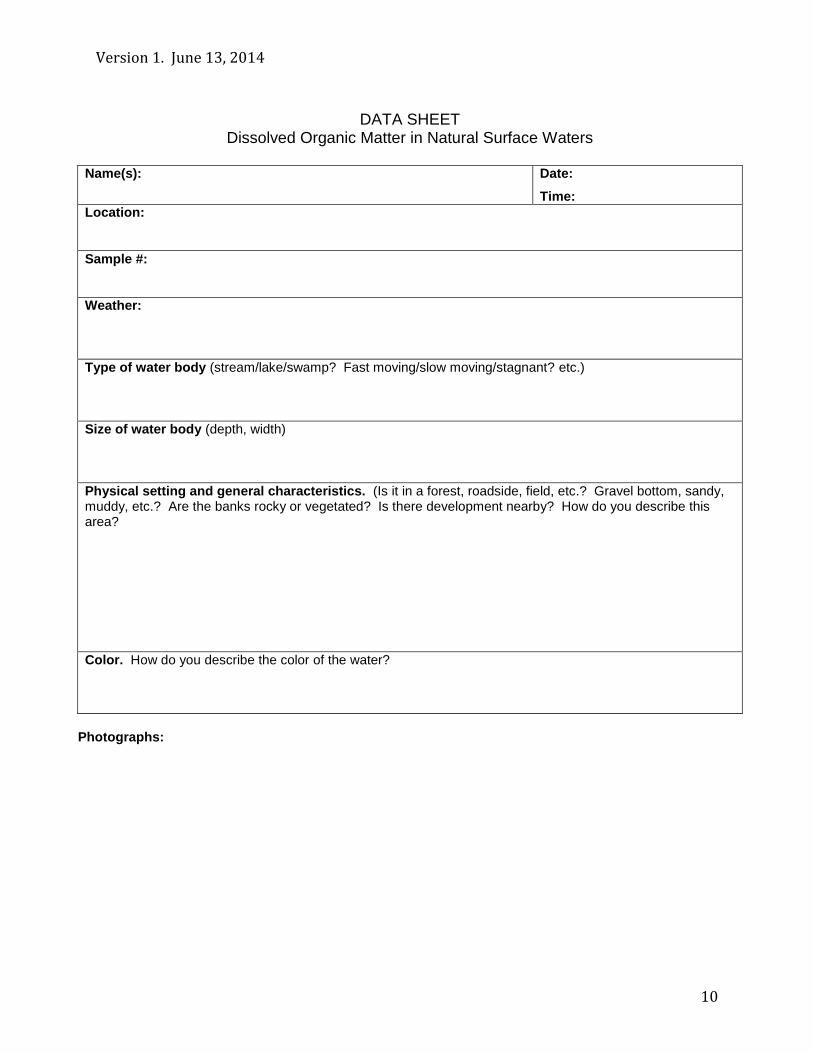
DATA SHEET Dissolved Organic Matter in Natural Surface Waters
Name(s):
Date:
Time:
Location:
Sample #:
Weather:
Type of water body (stream/lake/swamp? Fast moving/slow moving/stagnant? etc.)
Size of water body (depth, width)
Physical setting and general characteristics. (Is it in a forest, roadside, field, etc.? Gravel bottom, sandy, muddy, etc.? Are the banks rocky or vegetated? Is there development nearby? How do you describe this area?
Color. How do you describe the color of the water?
Photographs:

Version 1. June 13, 2014
11
Lab 4: Effect of Sunlight on Organic Molecules
Introduction
The fate of carbon from thawing permafrost depends on a variety of factors. One factor is the nature of the landscape, and whether carbon from thawing permafrost is transported from the land into groundwater and surface waters. Chemical conditions, including the availability of oxygen and nutrients are also important factors, as is the nature of the microbial community in land and surface waters. In addition, recent research shows that the ability of microbes to convert dissolved organic carbon to CO2 is significantly impacted by the exposure previously frozen organic matter to sunlight. Exposure to sunlight can cause CO2 production to increase by up to 40% compared to “dark” samples, demonstrating that sunlight may play an important role in determining the fate of organic matter from thawing permafrost. This lab activity models and explores the effect of sunlight on organic matter
Materials
58ml Whirl-pak bags Selection of artificially colored beverages such as cola, orange soda, root beer, grape soda
Selection of naturally colored beverages such as tea, coffee, fruit or vegetable juices
Aluminum foil
Apparatus to expose liquid-filled Whirl-paks to outdoor sunlight for a period of days.
Colorimeter or spectrophotometer. Safety and Disposal
Students should wear safety goggles
Beverage containers and foil should be recycled appropriately.
Non-recyclable material may be disposed of as ordinary trash. Group Size Groups of 4 Lab Length
Introduction and experimental set-up: 1 period Data collection, processing and assessment: 1 period
Preparation and Prep Time Background:
Students will need preparation time in or out of class to become familiar with the concepts of permafrost and observed Arctic warming trends. Suggested teacher resources:
o International Permafrost Association o NASA Global Climate Change website o Arctic Climate Research at the University of Illinois o Defusing the Arctic Carbon Bomb. Woods Hole Research Center.
Suggested sources for background reading by students prior to lab activity: o Slumping Arctic Soils Produce Significant Amounts of CO2. o PolarTREC Journal – The Effect of Sunlight on Thawing Permafrost.
Procedure. (See photos in Lab 4 in the Thawing Permafrost Presentation).
1. Lay out Whirl-paks and beverages for easy access. 2. Beverages should be grouped into two categories: (a) natural beverages (fruit juices without
artificial coloring, coffee, tea) and (b) artificial beverages (soda or artificially colored fruit

Version 1. June 13, 2014
12
drinks) 3. Each student group should gather 16 Whirl-paks and and 4 natural beverages and 4 artificial
beverages. (Groups may do more or less depending on space and time, etc.). 4. For each beverage, students should fill 1 Whirl-pak for an experimental light-exposed sample
and 1 Whirl-pak for a dark control. Each Whirl-pak should be labeled with the name of the beverage and either “LIGHT” or “DARK”.
5. The dark control samples should be wrapped in foil sufficiently to block light and placed in a light-tight container.
6. The light samples should be exposed to bright sunlight or artificial UV light for at least 48 hours but preferably longer. (The experiment should not be conducted indoors behind windows which may block UV rays).
7. The container with the dark controls should be placed next to the light-exposed samples, to maintain consistent temperature between light exposed and dark controls.
8. Plan the lab for a day with a forecast of sunshine and temperatures above freezing. Whirl-paks may be left out for several weeks if convenient, with students making periodic observations.
Data Collection (specific procedure will depend on type of colorimeter used).
1. After exposing samples to light, or at periodic intervals, students will unwrap the dark control samples and qualitatively compare light and dark samples. Students may observe strong color change in artificially colored liquids compared to naturally colored liquids. (See photos in Lab 4 in the Thawing Permafrost Presentation).
2. After recording visual observations, use colorimeter to quantify color change. 3. Blank the colorimeter by filling the cuvette with distilled water, placing it in the colorimeter, and
pressing the “Zero” option. 4. Dump the distilled water from the cuvette. 5. Rinse the cuvette with your sample once, then fill the cuvette with sample. 6. Place the cuvette in the colorimeter and measure the absorbance of the sample. Record your
data below. 7. Repeat for each sample, making sure to rinse the cuvette with distilled water in between samples.
Sample
Location Absorbance at Wavelength
430 nm 470 nm 565 nm 635 nm
Experimental setup. Light and dark samples of natural beet juice on left; light and dark samples of black cherry soda on right. Samples were exposed to sunlight from May 15-23.
Version 1. June 13, 2014
13
Data Analysis 1. For each liquid, plot absorbance at each wavelength on spectro graph paper.
Version 1. June 13, 2014
14
Variations 1. Create additional light-exposed samples exposed only to specific wavelengths of light. For
example, place the additional light-exposed samples behind filters for specific colors, ultraviolet, or infrared light.
Post Lab Analysis & Discussion Questions 1. Following group reports, have students discuss their results and compare the response of
natural and artificially colored beverages. 2. What was the effect of sunlight on the color of the beverages? 3. How did exposure to sunlight change the color of the liquids? 4. Why did artificially colored liquids go clear while naturally colored liquids experienced less
color change? 5. How does this experiment relate to the impact of sunlight on liquids containing dissolved
organic matter from thawing permafrost? 6. How does this experiment relate to the carbon cycle and climate change?
Assessments
1. Written report or presentation of the following. Presentations may be in the form of a poster, PowerPoint presentation, video, or website. Content of the report or presentation should include. a. Background information. b. Experimental design, including the purpose of the control. c. Observations and results. d. Broader implications for conversion of carbon from melting permafrost to CO2 and its
relevance to climate change. Connections:
This lab illustrates the concept that DOM in surface waters may be decomposed or otherwise affected by exposure to sunlight. This builds on the carbon cycle lessons presented in labs 1, 2 and 3 and provides further foundation for the concept of respiration from surface waters presented in Lab 5.

Version 1. June 13, 2014
15
Lesson 5: Respiration from Natural Waters
Background When permafrost thaws it releases previously frozen organic matter to participate in the earth’s carbon cycle. While some organics may be consumed in place by microorganisms and converted to CO2 or CH4, other organics may dissolve into water and become dissolved organic matter (“DOM”). Given that permafrost contains approximately 1.6 billion tons of carbon that could potentially mobilize as DOM as the earth warms, it is important to understand the fate of DOM. After thawing, DOM likely flows in groundwater or surface water, from where it may be consumed by microorganisms, deposited in lake sediments, or carried out to the ocean. This lab provides an opportunity for students to measure production of CO2 from surface waters and consider the role of surface waters in the global carbon cycle and. Students will compare rates of production in different types of surface water and identify the physical characteristics that affect production rates. This lab is closely related to Lab 3, in which students studied the color water and its relation to DOM concentration.
Materials
Presentation Lesson #5 – Respiration from Natural Waters in the Thawing Permafrost Presentation).
CO2 sensors
Floating plastic containers with cutout for CO2 sensor. This can be made from a pretzel barrel cut in half, or other plastic container. (See photos).
Natural streams, ponds or pools with varying amounts of DOM.
Procedure Field Work:
1. Select sampling locations with a variety of “color.” Ideally, samples should be collected from a variety of locations including clear flowing streams, stagnant wetlands, slow-moving waters, surface waters in flat areas, hilly areas, sunny locations and shaded locations.
2. Use DI water in a sink or a tub for a control. 3. At each sample location, have students fill out the Sample Data Sheet. Students should
record observations on the physical setting of the location. Photographs should be encouraged.
4. At each location, connect the CO2 sensor to the floating CO2 chamber and place it on the surface of the water. Record ppm CO2 every minute for at least 10 minutes.
Version 1. June 13, 2014
16
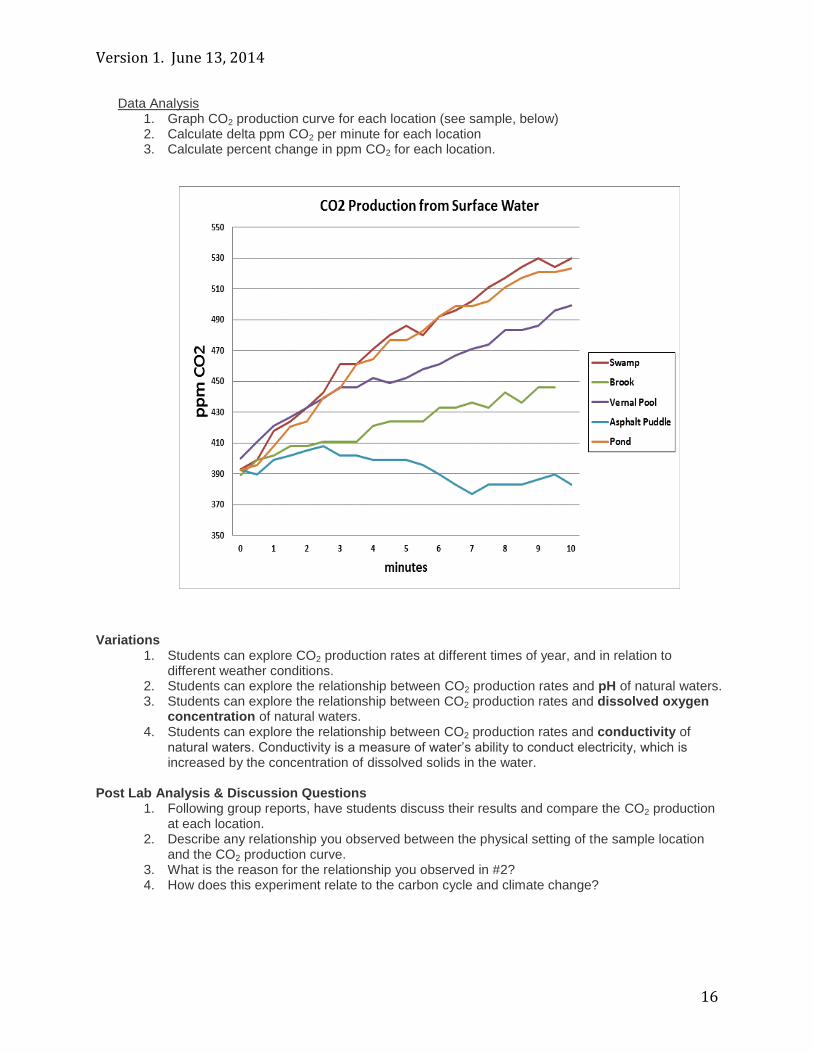
Data Analysis 1. Graph CO2 production curve for each location (see sample, below) 2. Calculate delta ppm CO2 per minute for each location 3. Calculate percent change in ppm CO2 for each location.
Variations 1. Students can explore CO2 production rates at different times of year, and in relation to
different weather conditions. 2. Students can explore the relationship between CO2 production rates and pH of natural waters. 3. Students can explore the relationship between CO2 production rates and dissolved oxygen
concentration of natural waters. 4. Students can explore the relationship between CO2 production rates and conductivity of
natural waters. Conductivity is a measure of water’s ability to conduct electricity, which is increased by the concentration of dissolved solids in the water.
Post Lab Analysis & Discussion Questions
1. Following group reports, have students discuss their results and compare the CO2 production at each location.
2. Describe any relationship you observed between the physical setting of the sample location and the CO2 production curve.
3. What is the reason for the relationship you observed in #2? 4. How does this experiment relate to the carbon cycle and climate change?
Version 1. June 13, 2014
17
Resources
Arctic Climate Research at the University of Illinois. http://arctic.atmos.uiuc.edu/
Arctic Monitoring and Assessment Programme, 2011, http://amap.no/swipa/SWIPA2011ExecutiveSummaryV2.pdf
Bruce Taterka, Permafrost & Climate Change, in Antarctica and the Arctic Circle: A Geographic Encyclopedia of the Earth's Polar Regions, ABC-CLIO, October 2014 (in press). http://www.abc-clio.com/product.aspx?isbn=9781610693929
Defusing the Arctic Carbon Bomb. Woods Hole Research Center. http://www.whrc.org/support/carbon_bomb.html
Encyclopedia of the Earth: http://www.eoearth.org/view/article/154471/
Geological Survey of Canada. http://geogratis.gc.ca/api/en/nrcan-rncan/ess-sst/092b663d-198b-5c8d-9665-fa3f5970a14f.html
International Permafrost Association. http://ipa.arcticportal.org/
NASA Global Climate Change website: http://climate.nasa.gov/
National Geographic: http://education.nationalgeographic.com/education/encyclopedia/permafrost/?ar_a=1
National Oceanic & Atmospheric Administration. http://www.arctic.noaa.gov/essay_romanovsky.html
National Snow & Ice Data Center, All About Frozen Ground. http://nsidc.org/cryosphere/frozenground/index.html/
Nova Scotia Environment: http://www.gov.ns.ca/nse/water/docs/droponwaterFAQ_HumicSubstances.pdf
PolarTREC: http://www.polartrec.org
PolarTREC Journal – The Effect of Sunlight on Thawing Permafrost. http://www.polartrec.com/expeditions/arctic-sunlight-and-microbial-interactions
Policy Implications of Warming Permafrost, UN Environment Programme, 2012. http://www.unep.org/pdf/permafrost.pdf
Rose M. Cory, Byron C. Crump, Jason A. Dobkowski, and George W. Kling. Surface exposure to sunlight stimulates CO2 release from permafrost soil carbon in the Arctic. PNAS 2013 110 (9) 3429-3434; published ahead of print February 11, 2013,doi:10.1073/pnas.1214104110. http://www.pnas.org/content/110/9/3429.full.pdf+html
Slumping Arctic Soils Produce Significant Amounts of CO2. http://news.sciencemag.org/sciencenow/2013/02/slumping-arctic-soils-produce-si.html?ref=hp
University of Florida IAFS Extension: http://edis.ifas.ufl.edu/ss507
Video: Thawing Permafrost (NSF Changing Planet Series) https://www.youtube.com/watch?v=yN4OdKPy9rM
Video: The Basics of Climate Feedback Loops https://www.youtube.com/watch?v=_tVxloCKJN0
Version 1. June 13, 2014
18
Correlation to National Standards for grades 9-12 Next Generation Science Standards, Disciplinary Core Ideas
HS-LS2B: Cycles of Matter and Energy Transfer in Ecosystems
HS-PS4B: Electromagnetic Radiation
HS-LS2-3. Construct and revise an explanation based on evidence for the cycling of matter and flow of energy in aerobic and anaerobic conditions.
HS-ESS2-5: Plan and conduct an investigation of the properties of water and its effects on Earth materials and surface processes.
HS-ESS2-6: Develop a quantitative model to describe the cycling of carbon among the hydrosphere, atmosphere, geosphere, and biosphere.
HS-ESS3D: Global Climate Change Common Core State Standards Connections: Grades 6-12 Literacy in History/Social Studies, Science, and Technical Subjects
RST.11-12.1 Cite specific textual evidence to support analysis of science and technical texts, attending to important distinctions the author makes and to any gaps or inconsistencies in the account.
WHST.9-12.2 Write informative/explanatory texts, including the narration of historical events, scientific procedures/ experiments, or technical processes.
WHST.9-12.5 Develop and strengthen writing as needed by planning, revising, editing, rewriting, or trying a new approach, focusing on addressing what is most significant for a specific purpose and audience.
WHST.9-12.7 Conduct short as well as more sustained research projects to answer a question (including a self-generated question) or solve a problem; narrow or broaden the inquiry when appropriate; synthesize multiple sources on the subject, demonstrating understanding of the subject under investigation.
SL.11-12.5 Make strategic use of digital media (e.g., textual, graphical, audio, visual, and interactive elements) in presentations to enhance understanding of findings, reasoning, and evidence and to add interest.
AP Environmental Science
I.D – Soil and Soil Dynamics
II.E – Biogeochemical Cycles
VII.B – Global Warming AP Chemistry
III – Reactions AP Biology
I.A – Chemistry of Life
III.C – Ecology North American Association for Environmental Education (NAAEE): Excellence In Environmental Education: Guidelines For Learning (K–12).
Strand 1 (al) – Questioning, Analysis & Interpretation Skills
2.1(A) – Processes that shape the earth
2.1(B) – Changes in matter
2.2(C) – Systems & connections
2.2(D) – Flow of matter & energy
2.3(D) – Global connections
2.4(A) – Human/environment interactions
2.4(B) – Places
2.4(E) – Environmental issues
3.1(A) – Identifying & investigating issues
3.1(B) – Sorting out the consequence of issues