Embed Size (px)
Citation preview
ED 257 633
AUTHORTITLE
INSTITUTIONSPONS AGENCY
REPORT NOPUB DATECONTRACTNOTEPUB TYPE
DOCUMENT RESUME
SE 045 569
West, Jerry; And OthersAn Analysis of Course-Taking Patterns in SecondarySchools as Related to Student Characteristics. HighSchool and Beyond: A National Longitudinal Study forthe 1980's.Evaluation Technologies, Inc., Arlington, Va.National Center for Education Statistics (ED),Washington, DC.NCES-85-206Mar 85NCES-300-83-0114135p.Reports - Research/Technical (143) -- StatisticalData (110)
EDRS PRICE MF01/PC06 Plus Postage.DESCRIPTORS *Computer Science Education; *Data Analysis;
Educational Research; Enrollment Trends; *MathematicsEducation; *Science Education; Secondary Education;*Student Characteristics; Surveys; *VocationalEducation
IDENTIFIERS *Course Taking Patterns; High School and Beyond(NCES)
ABSTRACTResponses to the problems of secondary school
education must be predicated on reliable information on studentparticipation in mathematics, science, computer science, vocationaleducation, and general education. This analysis summarized 1981-1982High School and Beyond student transcript data to identifycourse-taking patterns relative to each of the above subject areas.Moreover, responses to the First Follow-up Survey were used toidentify characteristics of students exhibiting various course-takingpatterns. Four distinct course-taking patterns were identified forscience and mathematics students, and four others were identified forvocational education students. Student characteristics consideredwere socio-demographic attributes, school nerformance andexperiences, and postsecondary plans and aspirations. Findingsreported include the foiiowing: (1) less than 10 percent of thestudents had concentrated in mathematics or science in high school;(2) course-taking patterns in all subject areas were strongly relatedto socioeconomic status and to type of school attended; (3) gradeaverages and cognitive test scores differed significantly across thecourse-taking patterns of each subject area; and (4) in general, theimmediate post-graduation plans of students were not related tocourse-taking patterns. (MNS)
w*******************************************************x**************Reproductions supplied by EDRS are the best that can be made
from the original document.***********************************************************************
High School and Beyonda national longitudinal study for the 1980's
An Analysis of Course-Taking
Patterns in Secondary Schools as
Related to Student CharacteristicsU S DEPARTMENT OF EDUCATION
NATIONAL INS TI1DTE OF EDUCATIONz
2

An Analysis of Course-Taking Patterns in SecondarySchools as Related to Student Characteristics
Evaluation Technologies Incorporated
Jerry WestWendy MillerLouis Diodato
George H. BrownProject OfficerNational Center for Education Statistics
Prepared for the National Center for EducationStatistics under contract 300-83.0114 (Study D)with the U.S. Department of Education. Contractorsundertaking rich projects re encouraged to expr-ssfreely their professional judgment. This report, there-fore, does not necess2rily represent positions orpolici( , of the Government, and no official endorse-ment should be inferred. This rep,gt is released asreceived from the contractor.
March 1985
NCES 85-206
ACKNOWLEDGMENTS
The authors wish to thank all those persons who contributed to this report.
Special appreciation is extended to the members of the advisory panels who
worked with us to develop conceptual and operational definitions of athe-
matics, science, vocational education, computer science, and general educa-
tion and to identify the research questions addressed by the analysis. The
amthlacienc panel members were Dr. James Gates, Mr. Gerard J. Barry, and
Dr. Henry J. Bindsl, Jr. The vocational education panelists were Dr. Floyd
L. McKinney, Mr. John W. Brandt, Dr. Willies Warren, Dr. Frank Carricato,
and Wr. Kent Bennion. Members of the general education panel were Dr. John
Porter and Dr. Warren Strandberg. We would also like to thank Dr. Nancy
Sandberg and Dr. Meredith Ludwig, project consultants. Finally, us would
like to thank those members of the LACES staff who assisted us on this
project: Dr. George H. Brown, Project Ofiicer; Dr. C. Dennis Carroll, Chief
of the Longitudinal Studies Branch; and Dr. Jeffrey Owings, Statistician.
4

TABLE OF CONTENTS
Elms
EXECUTIVE SUMMARY
1. INTRODUCTION
1.1 The Decline in Mathematics and Science Education
1.2 Solutions to the Decline in Mathematics and Scienceand Their Impacts on Vocational Education
2.3 CompUter Science Education
1.4 An Analysis of Student Participation in Mathematics,Science, Vocational Education, Computer Science, andGeneral Education
1.5 Data Sources
1.6 Report Organization
2. KEY STUDY DEFINITIONS
2.1 Mathematics
2.2 Computer Science
2.3 Science
xii
1
1
4
6
7
9
9
10
11
12
13
ii

TABLE OF CONTENTS (Continued)
Page
2.4 Vocational Education13
2.5 General Education14
2.6 Student Course-Taking Patterns 15
3. COURSE-TAKING PATTERNS: OVERVIEW 20
3.1 Mathemeti s, Science, Vocational Education, and
CospJte Science Course-Taking Pattmrna 20
3.2 Relationships &:cong Sub3ect Area Course-Taking
Patterns22
3.3 Course-Taking History of General Education Students 26
4. CHARACTERISTICS flF STUDENTS EXHIBITING VARIOUS
COURSE-TAKING PATTERNS IN MATHEMATICS 30
4.1 Socio-demographic Attributes 30
4.2 School Performance and Experiences 34
4.3 Postsecondary Plans and Aspirations 39
5. CHARACTERISTICS OF STUDENTS EXHIBITING VARIOUS
COURSE-TAKING PATTERNS IN SCIENCE 45
5.1 Socio-demographic Attributes45
iii
6

TABLE OF CONTENTS (Continued)
cbmintrPage
5.2 School Performance and Experiences
5.3 Postsecondary Plans and Aspirations
47
50
6. CHARACTERISTICS OF STUDENTS EXHIBITING VARIOUSCOURSE-TAKING PATTERNS IN VOCATIONAL EDUCATION 58
6.1 5(21:A0-demographic Attributes 58
6.2 School Performance and Experiences 60
6.3 Postsecondary Plans and Aspiration,' 64
7. CHARACTERISTICS OF STUDENTS EXHIBITING VARIOUSCOURSE-TAXING PATTERNS IN COMPUTER SCIENCE 73
7.1 Socio-demographic Attributes 73
7.2 School Performance and Experiences 73
7.3 Postsecondary Plans and Aspriations 76
8. CHARACTERISTICS OF GENERAL EDUCATION STUDENTS 85
8.1 Socio-demographic Attributes 85
8.2 School Performance and Experiences 88
8.3 Postsecondary Plans and Aspirations 88
iv

TABLE OF CONTENTS (Continued)
VARtn EMI
TECHNICAL APPENDICES A-1
A. Sources of the Data A-1
A.1 High School and Beyond Sample Designs A-1
B. Estimation Procedures A-3
B.1 Estimates of Student Course-Taking Patterns A-4
C. Standard Errors A-5
D. Sub'ect Area Course Categories and Classification of
Secohdary School Course Codes Used to Define Course-
Taking Patterns
V
A-9

LIST OF TABLES
TablePage
1 Percentages and Number (Thousands) of Stucleits Who ExhibitedSpecified Course-Taking Pattern, in Mathematics, Science,Vocational Education, and Computer Science: 1981-82
2 Percentages of Students Who Exhibited Specified Course-TakingPatterns in Mathematics, Science, Vocational Education, andCc.aputer Science and Their Course-Taking Patterns in OtherAreas: 1981-82
3 Average Number of Credits Earned by General Education Stu-dents in Arts, Humanities, Mathematics, Science, VocationalEducation, and Computer Science InstructionalPrograms: 1981-82
4 Percentages of Students Who Exhibited Specified Mathematics
Course-Taking Patterns, by Sex, Socio-economic Status, andRace/Ethnicity: 1981-82
21
23
27
31
S Percentages of Students Who Exhibited Specified MathematicsCourse-Taking Patterns, by School Type: 1981-82 33
6 Percentages of Students with Overall Grade Averages atSpecified Levels, by Mathematics Course-Taking Pattern:1981-82
7 Percentages of Students Whoise Composite Vocabulary,
Verbal, and Mathematics Test Scores Fell Into the
Lowest, Second, Third, and Highest Quartiles, by
Mathematics Course-Taking Pattern: 1981-82
vi
36
37

Table
8
9
LIST OF TABLES (Continued)
Percentages of Students Who Had Participated in
Specified Extra-Curricular Activities, by Mathematics
Course-Taking Pattern: 1981-82
Percentages of Students Who Expected to Engage in
Specified Activities for the First Year After
Graduation, by Mathematics Course- Taking Pattern:
1981-82
10 Percentage. of Students Who Expected to Obtain
Specified Kinds and Levels of Education, by
Mathematics Course-Taking Pattern: 1981-82
11 Percentages of Students Who Expected to Hold
Spec:4fied Jobs or Occupations When 30 Years Old, by
Mathematics Course-Taking Pattern: 1981-82
12 Percentages of Collage -Bound Students Who Planned to
Enroll in Specified Fields of Study, by Mathematics
Course- `faking Pattern: 1981-82
13 Percentages of Students Who Exhibited Specified
Science Course-Taking Patterns, byllSex, Socio-economic
Status, and Race/ Ethnicity: 1981 -82
14 Percentages of Students Who Exhibited Specified
Science Course-Taking Patterns, by School Type:
1981-82
15 Percentages of Students with Ova.:all Grade Averages
at Specified LelPels, by Science Course-Taking
Pattern: 1381-82
vii
0
38
40
41
4-,
44
46
48
49

LIST OF TABLES (Continued)
16 Percentages of Students Whose Composite Vocabulary,Verbal, and Mathematics Teat Scores Fell Into theLowest, Second, Third, and Highest Quartiles, byScience Course-Taking Pattern: 1981-82
17 Percentages-of Students Who Had Participated inSpecified Extra-Curricular Activities, by ScienceCourse-Taking Pattern: 1981-82
18 Percentages of Students Who Expected to Engage inSpecified Activities for the First Year AfterGraduation, by Science Course-Taking Pattern: 1981-82
19 Percentages of Students Who Expected to ObtainSpecified Kinds and Levels of Education, by ScienceCourse - Taking Pattern: 1981-82
20 Percentages of Students Who Expected to HoldSpecified Jobs or Occupations When 'PO Years Old, byScience Course-Taking Pattern: 1981-82
21 Percentages of College-Bound Students Who Planned toEnroll in Specified Fields of Study, by ScienceCourse-Taking Pattern: 1981-82
22 Percentages of Students Who Exhibited SpecifiedVocational Education Course-Taking Patterns, by Sox,Socio-economic Status, and Race /Ethnicity: 1981-82
23 Percentages of Student* Who Exhibited SpecifiedVocational Education Course-Taking Patterns, bySchool Type: 1981-82
viii
51
52
53
55
56
57
59
61

LIST OF TABLES (Continued)
Table
24 Percentages of Students with Overall Grade Averages
at Specified Levels, by VocetiJnal Education
Course-Taking Pattern: 1981-82
25 Percentages of Students Whose Composite Vocabulary,
Verbal, and Mathematics Test Scores Fell Into the
Loweat, Second, Third, and Highest Quartiles, by
Vocational Education Course-Taking Pattern: 1981-82
26 Percentages of Students Who Had Participated in
Specified Extra-Curricular Activities, by Vocational
Education Course-Taking Pattern: 1981-82
27 Percentages of Students Who Expected to Engage in
Specified Activities for the First Year After
Graduation, by Vocational Education Course-Taking
Pattern: 1981-82
28 Percentages of Studenta.Who Expected to Obtain
Specified Kinds and Levels of Education, by
Vocational Education Course-Taking Pattern: 1981-82
29 Percentages of Students Who Expected to Hold
Specified Jobs or Occupations When 30 Years Old, by
Vocational Education Course-Taking Pattern: 1981-8:
30 Percentages of College-Bound Students Who Planned to
Enroll in Specified Fields of Study, by Vocational
Education Course-Taking Pattern: 1981-82
12
ell92
62
63
65
66
67
69
70
LIST OF TABLES (Continued)
Iskl,e28iff
31 Percentager of Students Who Expected to Train inSpecified Fields at a Trade or Vocational School, byVocational Education Course-Taking Pattern: 1981-82
,32 Percentages of Students Who Exhibited SpecifiedComputer Science Course-Taking Patterns, by Sex,Socio-economic Status, and Race/Ethnicity: 1981-82
33 Percentages of Students Who Exhibited SpecifiedComputer Science Course-Taking Patterns, by SchoolType: 1981-82
34 Percentages of Students with Overall Grade Averagesat Specified Levels, by Computer Science
Course-Taking Pattern: 1981-82
35 Percentages of Students Whose Composite Vocabulary,Verbal, and Mathematics Test Scores Fell Into the
Lowest, Second, Third, and Highest Quartiles, byComputer Science Course-Taking Pattern: 1981-82
36 Percentages of Students Who Had Participated inSpecified Extra-Curricular Activities, by ComputerScience Coursa-Taking Pattern: 1981-82
37 Percentages of Students Who Expected to Engage in
Specified Activities for the First Year After
Graduation, by Computer ,cience Course-TakingPattern: 1981-82
x
3
71
74
75
77
78
79
80

LIST AF TABLES (Continued)
I.A.
38 Percentages of Students Wha Expected to Obtain
Specified Kinds and Levels of Education, by Computer
Science Course-Taking Pattern: 1981-82
39 Percentages of Students Who Expected to Hold Specified
Jobs or Occupations When 30 Years Old, by Computer
Science Course-Taking Pattern: 1981-82
40 Perceni.eges of College-Bound Students Who Planned to
Enroll in Specified/Fields of Study, by Computer
Science Course-Taking Pattern: 1981-82
41 Percentages of Students Who Took General Education
Program, by Sex, Socio-economic Status, and Race/
Ethnicity: 1981-82
42 Percentages of Students Who Took a General
E495
82
83
84
86
Education Program, by School Type: 1981-82 87
43 Percentages of Students in a General Education
Program with Overall Grade Averages at Specified
Levels: 1981-82
44 'Percentages of Students in a General Education Program
Whose Composite Vocabulary, Verbal, and Mathematics
Test Scores Fell Into the Lowest, Second, Third, and
Highest Quartiles: 1981-82
45 Percentages of Students in a General Education Program
Who Had Participated in Specified Extra-Curricular
Activities: 1981-82
4
xi
89
90
91

LIST OF TABLES (Continued)
MN,
46 Percentages of Students in a General Education ProgramWho Expected to Engage in Specified Activities forthe First Year After Graduation: 1981-82.
47 Percentages of Students in a General Education ProgramWho Expected to Obtain Specified Kinds and Laval& ofEducation: 1981-82
48 Percentages of Students in General Education ProgramWho Expected to Mold Specified Jobs or OccupationsWhen 30 Years Old: 1981-82
49 Percentages of College-Bound Students in a GeneralEducation Program Who Planned to Enroll in SpecifiedFields of Study: 1981-82
xii 1.5
Page
92
94
95
96

EXECUTIVE SUMMARY
Over the last 20 years, the United States has witnessed a widespread de-
cline in the quality of education. This decline has been especially pro-,
nounced with respect to mathematics and science, as evidenced by lowered
enrollments and achievement scores, a diminishing teacher pool, and in-
creased numbers of students on a general education track. This situation
was brought to the forefront of public attention by the National Commission
on Excellence in Education' report, A Nation at Risk: The Imeerative for
gducati2g BtfgEe. A central focus of the report was on the need to redress
the decline in mathematics and science education and to prepare students to
use emerging new technologies, such as the computer, so they say compete
effectively in today's society.
Much of the public discussion and debate as to how to resolve the problems
facing education in the United States has centered on how to impart basic
skills to students and what should constitute a secondary school curricu-
lum. Commissions and panels have set forth recommendations which would
require shift in emphasis to more traditional academic pursuits (i.e.,
mathwmatica, science, English, etc.). The role of non -academic programs,
such as vocational education and general education, in responding to the
problems in secondary education has yet to Ca determined.
Responses to the problems of oecondary acrool education must be predicated
on carrent and reliable information on student participation in mathema-
tics, science, computer acicaco, vocational education, and general educa-
tion. Specifically, information is needed on the various course-taking
pdtterna exhibited by students in each of these areas and the characteris-
tics of these students. Taken together, this information may provide a
base for policy decisions concerning the future direction of secondary
school curricula.
The analysis summarized in this report used 1981-82 High School and Beyond
(1151.120 student transcript data to identify course-taking patterns relativft

to each of the above-mentioned subject areas. Moreovcr, the responses ofschools and students to the HS&B First Follow-up Survey were used to iden-tify the characteristics of students exhibiting the various mathematics,science, computer science, vocational education, and general educationcourse-taking patterns. Some representative findings of toe analysis follow.
Course-Taking Patterns
Student course-taking pattwrna were defined by the number of credits stu-dents earned in various typos and levels of courses within each of thesubject /Areas of interest. The patterns within each subject area are on acontinuum, ranging from no or limited participation to intense participa-tion. For mathematics arsd science, four distinct patterns ware identified:(1) concentrators; (2) 4-year college bound students; (3) general methane-tics (science) students; and (4) non-participants or limited participants.For vocational education, students were classified as either (1) concentra-tors; (2) limited concentrators; (3) samplers; or (4) non-participants.Because so few students had earned computer science credit, only two pat-terns were distinguishable, participants and non-participants. Participa-tion in a general education program 1/ was measured by students' self-reported descriptions of their high school program.
o A minority of students had concentrated in uathematics (8.6 per-cent) or science (9.3 percent) in high school, while about one-halfof all students exhibited a general level of participation (i.e.,were classified as general mathematics or general science stu-dents). Nearly one in every 20 students had earned less than onemathematics credit, and one in every six had earned lass than onescience credit during their high school careers.
o Overall, participation in mathematics and science were stronglyrelated. For example, a majority of mathematics concentrators were
1/ For a definition of "general education program" as used in thisreport see page 13 and 26.
xiv 17

either science concentrators (46 percent) or 4-year college bound
science students (43 percent). Nearly all science concentrators
were either mathemitica concentrators or 4 -year college bound math-
ematics students (96 percent).
o About one-half of the students had exhibited either a strong voca-
tional focus (concentrators) or vocational interest (limited
concentrators). Leas than five percent of the students had earned
no vocational education credit.
o Participation in vocational education was negatively related to
participation in mathematics and science. However, advanced level
participation in mathematics and science did not preclude students
from seeking vocational training, nor did intense participation in
vocational education preclude students from earning credit in
advanced level mathematics and science courses.
o Given that as late as 1981-82 only 55 percent of all schools in the
nation made computer science instruction available to students, it
is not surprising that only 13 percent of all students had earnird
some computer science credit.
o Participation in computer science was commonly related to sore
intense participation in mathematics. A similar pattern was found
with respect to science.
o Over one-third of the students defined their high school program as
general. These students earned fewer credits in the humanities,
mathematics, and science than did those in academic and vocational
programs.
cbgEggteriptige 2f §tudonts Exhibiting Various Course-Taking Pptterns
Course-taking patterns were examined with respect to number of student
characteristics. These characteristics fall into three categories:
(1) socio-demographic attributes; (2) school performance and experiences;
and (3) postsecondary plans and aspirations.
xv

Socio-demographic Attributes
o Course-taking patterns in all subject areas were strongly relatedto socioeconomic status (SES). In particular, high SES studentswere more likely to participate at a sore intense level inmathematics. science, and computer science. More intense partici-pation in vocational education and general education was morefrequently associated with low SES.
0 A student's race/ethnicity was unrelated to participation in voca-tional education. White students exhibited more intense participa-tion in sathesatica, science, and computer science. A largerpercentage of Hispanic/other students had participated in a generaleducation program than had students from other racial/ethnic groups.
o A student's sex was related to participation in science, with malesparticipating at more intense levels. In addition, moremales had participated in a general education program. No majordifferences were noted with respect to male and female partici-pmtion in mathematics and computer science. For vocational educa-tion, few differences were found; however, higher percentage offemales were concentrators.
o The type of school that students attended was strongly related tocourse-taking patterns in all of the subject areas. Specifically,concentration in mathematics and science was more typically asso-ciated with private school attendance whereas a general level ofparticipation in these subjects was more commonly found amongpublic school students. Because few private schools had offeredmany of the courses encompassed in a vocational education curricu-lum, public school students were more likely to have a strongvocational focus or interest. Public school students were alsomore likely to have taken part i., a general education program.Students who had attended other Ci.e., non-Catholic) privateschools were less limmly to have participated in computer science.
xvi
1
School performance and Experiences
o Grade averages and cognitive teat scores differed significantly
across the course-taking patterns of each subject area. Students
who had participated at a more intense level in mathematics,
science, computer science earned higher overall grade averages end
scored higher on tests designed to measure their vocabulary,
verbal, and mathematics abilities. The reverse pattern held with
respect to vocational education and general education participation.
o Students who had participated more intensely in mathematics and science
and, to lesser degree, those who had participated in computer science
were mcr likely than other students to have taken part in certain
extra-curricular activities. For example, these students were more
likely to have been involved in the production of the school newspaper/
yearbook, been members of honorary and service clubs, and participated
in varsity and other athletics. On the other hand, students who had
concentrated in vocational education partici- looted to lesser extent
in many of these activities, as did general education students.
E4ette92a4ory Eltne ins Aselretigne
o In general, the immediate post-graduation plans of students were not
related to course-taking patterns. The largest differences that were
found occurred with respect to attendance at 4-year college or uni-
versity and full-time employment. Students who had participated more
intensely in mathematics, science, or computer science were more likely
to indicate that the majority of their time would be spent pursuing
study at 4-year college or univeraity the first year after high
school graduation. A smaller percentage of these same student* indi-
cated that they planned to work full-time the year after graduation.
Not surprisingly, the short-term plans of vocational education concen-
trators and limited concentrators ard of general education students
were more likely to include full-time employment.

o For the most part, the educational expectations of students were con-siatent with their high school course-taking patterns. That is, ahigher percentage of students who had participated sore intensely inmathematics, science, or computer science expected to attain at least a4- or 5-year college degree. On the other hand, the percentage ofstudents who expected their formal education to end with high school orto include vocational, trade, or business school attendance was higheramong those students who had shown a strong vocational interest orfocus than among other students. A similar pattern of educationalexpectations was found with respect to participation in generaleducation program.
b With few exceptions, students shared similar Job aspirations regard-less of their course-taking patterns in each of the subject areas ofinterest. Many students aspired to Job in professional capacity byage 30; however, the percentage of students with this aspiration washigher among mathematics and science concentrators/ 4-year collegebound students and computer 6cience participants than among those whohad participated less intensely in these sub)ects. Vocations] educa-tion concentrators were more likely than others to indicate that theyaspired to a clerical or craftsman occupation. Overall, the Job aspi-rations of general education students resembled those of students inother programs; however, a smaller percentage of general educationstudents expected to be in a professional occupation at age 30.
o The intended fields of study of college bound students did not differmarkedly by course-taking pattern. Some differences were detected,however. Mathematics and science concentrators were sore likely tostudy architecture and engineering and biological and phyeical sciencesand were less likely to study business, art, or music. Science concen-trators were also more likely than other students to plan to enter pre-professional programs. As expected, computer science participants werethree times as likely as other students to plan to study computer endinformation sciences. General education students were less likely thanothers to plan to study architecture and engineering or enter a pre-profeliunal program and were more likely to study art and music. As
xviii21

expected, a higher percentage of vocational education concentrators
expressed plans to study business or pursue vocational/technical
studies in college.
o The vast majiority of students did not plan on attending a trade or
vocational school. Nevertheless, vocational education concentrators
were more likely to do so than were atudenta in the other vocational
education patterns. The field of study moat often cited by these
students was secretarial, stenographic, typing, or other office work.
This was followed by computer.programming or computer operations and
Auto mechanic*. Computer programming or computer operations was idan-
tifisd by the largest percentage of students in each of the other
course-taking patterns as the field they would most likely study at a
trade or vocational school.
x ix
22

CHAPTER 1
INTRODUCTION
A well-documented problem facirg education in the United States today is the
critical need to impart basic skills in mathematics and science to its stu-
dents. Moreover, with the increasing role computers are playing in all
facets of American life, another problem facing education is that of deciding
how best to prepare students for using this technology. Panels, commissions,
and policy-makers at the highest levels have studied these problems and have
put forth specific proposals for redressing them. The as3ority of these
proposals shift curriculum emphasis and class hours away from such programs
as general education and vocational education to required courses in mathe-
matics, science, and computer science. Advocates of vocational education
have argued that such proposals have traditionally overlooked the role of
their field in responding to these problems.
The analysis summarized in this report is intended to provide educators.
policymakors, and the general public with information on the current status
of mathematics, science, vocational education, computer science, and general
education in the secondary schools of the United States. In particular, this
analysis provides information en students' course-taking patterns in these
atubject areas as they relate to student characteristics. Data collected by
the National Canter for Education Statiatica were analyzed to address ques-
tions concerning these secondary school programs. The answers provided to
these questions may be used as input into policy decisions concerning the
future directions of mathematics, science, vocational education, compu gr
science, and general education in our nation's schools.
1.1 M. Ptgline in ff2tb,e2Wict 2a4 Egience g4mcci442o
Over the last two decades, mathematics, and science education have experi-
enced three essential problems: declining enrollments, declining achievement
23

scores, and a diminishing teacher pool. Enrollment in traditional mathemat-
ics courses dropped sharply between 1964 and 1981. The percentage of highschool students enrolled in algebra 1 declined from 76 to 64 percent, wh;leenrollment in geometry dropped from 51 to 44 percent, and algebra 2 from35 to 31 percent. Enrollments in science courser such as biology (80 to77 percent), chemistry (34 to 32 percent`. and general science (61 to 37 per -cant) experienced similar declines over this period. 1/
Interrelated with declining enrollments in mathematics and science is thedecline in student achievement scores in these areas. The National ScienceBoard reported that between 1973 and 1982 the mean achievement scores of17 year-olda declined 3.2 percent in mathematics. Similarly, between 1970and 1983 mean science achievement scores declined 6.7 percent. Regardingthe decline in the sciences, Stephen Graubard, editor of Daedalus, diammllyconcluded, "scientific knowledge and understanding, by any reasonable stan-dard, is so uncommon among Americans of ell agree and races today that it isno exaggeration to speak of mass illiteracy in the sciences." 2/
Compounding the problem of declining enrollments and achievement scores isthe diminishing mathematius teacher pool. Max Sobel, past president of theNational Council of Teachers of Mathematics, noted:
Since 1972 there has been a 77 percent decline in the number ofsecondary level mathematics teachers prepared by schools ofeducation nationwide. As a result, over 50 percent of the newlyemployed mathematics teachers in some states are considered to
1/ Clifford Adelman, "Devaluation, Diffusion and the College Connection: AStudy of High School Transcripts, 1964-81," Washington, D.C. NationalInstitute of Education, March 1983 in Educating Americans for the 21stCentury by the National Science Board Cosmission on Precollege Educationin Mathematics, Science and Technology, September, 1983, p. 1.
2/ Stephen Graubard, ed. "Nothing to Fear, Much to Do," Daedalus, Spring,1983, p. 237.
r) 4-2-
be unqualified to teach mathematics, but continue to be employed
on an emergency basis because fully certified teachers are not
available. 3/
The reduced science teacher pool is also critical. Between 1970 and 1980 the
production of science teachers by schools of education dropped by 64 per-
cent. 4/
Another factor that is viewed as a major contributor to the decline in
mathematics, science, and other academic courses in U.S. secondary schools is
the increased number of students on a general education track. 5/ Between
the let. 1960s and the late 19703, the percentage of students in a general
track increased from 12 percent to roughly 43 percent.
The increased freedom to select courses tailored to the needs and interests
of the individual student resulted in both a reduction in high school
graduation requirements and students receiving much narrower range of high
school class experiences. 6/ Thus, as a philosophy of secondary education,
general education has not lived up to its intentions, and its overall goals
are ambiguous. 7/
3/ Max A. Sobel, "The Crisis in Mathematics Education," gduggtignol
Horizons, Winter.
4/ Susan Walton, "A Generation Lags Behind as Science Advanced," gducation
Week July 27, 1983, p. 2.
5/ Clifford Adelman, "Devaluation. Diffusion and the College Connection: A
Study of High Srhool Transcripts, 1964-81."
,6/ D. Offermann, "Designing a General Education Curriculum for Today's High
School Student," Educational Leadership, March, 1984.
7/ R. Brandt (ed.), "The Fate of Craft Boutique," g4yggtigngl gadership,
March, 1984.
-3-
25

According to Adelman, the education experience of the general track studentis quite different from that of the academic or vocational track student.The general track student spends more time in personal service anddevelop-ment courses, home economic courses, and arts and crafts courses. Theacademic experience of the general track student is characterized by partici-pation in remedial and generalized courses (e.g., general sciences, generalsocial studies, and general mathematics). Study within subject area (e.g.,vocational education), while it may be intense, is at the same time diverse.
1.2 Solutions to the Decline in Netbeaatice end §cienst end TheirImpacts on Vocational Education
Many of the proposed solutions to the problems confronting mathematics andscience education require a restructuring of curriculum emphasis. Studentswould be required to take mom courses in and devote more of their classhours to mathematics and science. The Peidele Pr2poegl (Adler, et el.)would eliminate "all specialized training for particular jobs" from thesecondary school curriculum in order to make time £m the essentials of"basic schooling." 8/ A plat., of action, prepared by the National ScienceBoard, for improving mathematics, science and technology education for allAmerican elementary and secondary students recommends significant increasesin the number of required mathematics and science courses. In the languageof the report,
All secondary school students should be required to take at least Caresyears of high school mathematics including one year of algebra .
(and) at least three years of science and technology, including onesemester of computer science prior to high school graduation. 9/
8/ Mortimer J. Adler et al., The eal4gie PEopoggl -- 6n gducatipnalManifesto (New York: Macmillan Publishing Co., 1982), p. 35.
9/ National Science Board Commission on Precollege Education in Mathema-tics, Science and Technology, Educating Americans for the pat Century(Washington, D.C., 2983), p. 40.
-4- 2

The recommendations of the National Commission on Excellence in Education
strongly emphasize return to basics, or as the Commission phrases it, the
"new basics." In the areas of mathematics and science., all students would
be required to take, "at a minimum," throe years of mathematics, three years
of science, and one-half year of computer science. 10/ While the Commission
urges that high school curricula "also provide students with program requir-
ing rigorous effort in subjects that advance students' personal, educational,
and occupational goals." 11/ it does not acknowledge the central problem of
the limited number of hours in the school day or the opportunities to
acquire basic technological skills already available to students in non-
mcademic curricula.
Gene Bottoms, ..;.xcutiv Director of the American Vocational Association,
takes exception to the proposal contained in the Commission on Excellence
,wort and other similar reports. No notes:
[They3 focus narrowly on the academic curriculum in the high school.
Both reports refer repeatedly to the goal of excellence for all programs
and all students, but the recommendations fail to live up to this in-
tention. In fact, four of the six specific charges to the Commission
on Excellence dealt with preparation for college, college admissions,
and success in college. No mention was made of preparation for work. 12/
Bottoms goes on to say, "The two prestigious panels did not even consider the
potential of non-academic curriculums to contribute to the 'new basics' or to
alleviate scientific and technological backwardness." 13/
10/ The National Commission on Excellence in Education, Nati2U et Rik
The Imperative for Educational Reform (Washington, D.C., 1983), p. 24.
11/ A Nation at Risk, p. 26.
12/ Gene Bottoms, AVA Executive Director, "Vac Ed Belongs on the National
Agenda for Excellence," VocEd, October 1983, p.8.
13/ Bottoms, p. S.
-5-
2 7

The problems facing mathematics and science education must be resolved if ouryoung people are going to compete effectively in an ever-changing techno-logical world. However, there is much debate concerning; the beat way toaccomplish this goal. Some argue that solving the problema of mathematicsand science by undermining the success of vocational education in preparingstudents for entry into the labor force is not in the beat interest of thenatimn or its young.
Before we adopt solutions to the problems confronting education in mathemat-ic and science, we need to understand better the status of mathematics andscience in the nation's secondary schools. Moreover, we need more informa-tion on those areas -- such as vocational education, general education, andthe arts, and the humanities -- that would be affected by attempts to remedythe mathematics and science deficiencies of high school students. In partic-ular, information is needed on: (1) the types of courses currently beingtaught in mathematics, science, and vocational education, and computerscience; c the current enrollments in these courses, (3) the characteris-tics of schools that offer different numbers and types of courses in theseareas and have differential student participation rates in theses courses;(4) student course-taking patterns in mathematics, science, end vocationaleducation, computer science, and general education; and (5) the characteris-tics of students who participate to varying degrees in these programs.
1.3 Computer Science Education
It is generally recognized that there is a shortage of computer scienceinstruction in our nation's schools. It is equally recognized that, at aminimum, today's students need to become r7quainted with the computerand its ussi if they are to compete effectively in the job market and succeedin poataecandary education. Furthermore, schools Lre experiencing the valueof the computer as a learning tool which permits students to explore subjectareas and investigate concepts through simulations and games.
Traditionally, computer studies in education have been classified into twomain groupings -- computer science and bualness data processing. Computer
-6-

science was traditionally tied to mathematics while business data process-
ing, as its name impliea, was linked to the study of business. Recently, a
third classification of computer studies has emerged which focuses on learn-
ing about computers. Computer literacy courses provide students with the
opportunity to learn what a computer is, how it works, and what it can and
cannot do.
As indicated earlier, many of the panels and commissions that have studied
the status of contemporary education have recommended that computer science
instruction be part of all students' educational experience. There is,
however, such discussion concerning the best way to achieve this goal.
Often missing from this discussion i current information on the level of
computer science instruction in echo ls, enrollments in these courses, and
the characteristics of school, with differential offerings and students par-
ticipation in this type of program. 14/
1.4 fin 6n2lyti§ 21 ztHdent earicipatipn in Mathrigticaz Science4
Vocational EducationL Computer Sciences and General Education
Recognizing the need for detailed information on the status of mathematics,
science, vocational education, computer science cnd general education in
secondary education, and the ability of certain data collected by the
Motional Center for Education Statistics ()ICES) to help meet this need, the
"ICES contracted with Evaluation Technologies Incorporated (ETI) to design
14/ Throughout this report, the term computer science is used to refer to
the overall study of computers, including courses traditionally classi-
fied as computer science, business data processing, and computer
literacy. An alternative term, which some might prefer, would be
computer studies.
-7--
29

and conduct two analyses as they relate to these subject areas. The twoanalyses constitu two separate studies:
(1) A study of offerings and enrollments as they relate to schoolcharacteristics; 15/ and
(2) A study of student course - taking behavior es it relates tostudent characteristics.
The general objectives of the first study were to:
o Identify current mathematics, science, vocationaleducation, and computer science courae offeringsand enrollments in the secondary schools in theUnited States; and
o Identify those school characteristics that areassociated with course offerings and enrollmentsin mathematics, science, vocational education,education, and computer science.
The goals of the second study are to:
o Define the course-taking patterns of mathematics,science, vocational education, computer science,and general education students in secondary schools;
o Determine students' school experiences and extra-curricular experiences that are related to theircourse-taking behavior in these areas; and
15/ Evaluation Technologies Incorporated, An ArlelYtit 21 gem! glitrinstand Enrollments as Related to School Characteristic*, Washington, D.C.:National Center for Education Statistics, October 2, 1984.
-8- 30

o Assess the impact of having taken mathematics,
science, vocational education, computer science,
and general education courses on student aspira-
tions and achievements.
1.5 Data Sources
As part of its longitudinal studies program, NCES sponsors the High Schaal
and Beyond (HSCB) study. The NS&B Base Year Survey and First Follow-Up
Survey provide detailed information on the school experiences, attitudes,
activities, future plans, personal motivations, and &elected background
characteristics of nationally representative sample of 1982 graduating
seniors (sophomore class of 1980). In addition, transcript data collected
during the First Follow-Up Survey make it possible to identify the course-
taking behavior of students in different curriculum areas.
1.6 purport Organization
The remainder of this report is organized into seven chapters and a technical
appendix. Chapter 2, entitled Key Study Definitions, presents both at the
conceptual and operational level, definitions of mathematics, science, voca-
tional education, computer science, and general education as developed by
advisory panels of subject-matter experts. This chapter also describes the
cfurse-taking patterns of secondary school students which are the focus of
the analysis. Chapter 3 presents an overview of study findings pertaining to
course - taking patterns in these subjects. The mathematics, science, voca-
tional education and computer science course-taking patterns as related to
student characteristics are summarized in Chapter 4 through 7, respectively.
Research findings pertaining to the characteristics of general education
students are presented in Chapter 8. The technical appendix presents brief
descriptions of the sample designs, data sources, data adjustments, and
procedures far calculating standard errors. It also contain a complete list
of the courses which were encompassed under various mathematics, science,
vocational education, and computer science instructional programs.
-9-
31

CHAPTER 2
KEY STUDY DEFINITIONS
When designing the analysis of student course-taking patterns in mathemat-ics, science, vocational education, computer science, and general educa-tion. it was necessary to establish conceptual and operational definitionsof each area These definitions were required for two reasons: (1) forthe analysis to produce meaningful and policy-relevant findings, course-taking patterns in all curriculum areas had to be uniquely described withinthe context of secondary education, and (2) the quantitative nature of theanalysis required that key concepts be operationally defined in terms ofthe available survey data.
The LACES determined that subject-area specialists were needed to identifythe common and unique elements of mathematics, science, vocational educa-tion, computer science, and general education at the secondary level and toadvise in the operationalization of course-taking patterns in these areas.Specialists were selected from among national, state, and local leaders' insecondary and postsecondary education and in educational policy development.
The subject -area specialists and ETI pro3sct staff convened to: (1) deve-lop both abstract and operational definitions of mathematics, science,vocational education, and computer science; (2) identify high school cour-ses which should be flagged as offerings of these types; (3) identifycourse-taking patterns for study; and (4) develop a set of research ques-tions framed in the HUM survey data. Two sessions were held, one toconsider mathematics, science, and computer science and one to considervocational educatiOn.
The general education specialists did not convene. Rather, ETI projectstaff held conversations with each of these persons individually. Duringthese conversations, they discussed: (1) the definition of general educa-tion; (2) the appropriateness of identifying course codes to define
-10- 32
general education curriculum; and (3) the development of research quer Ions
pertaining to general education.
These subject-matter specialists provided either a conceptual definition of
the relevant subject area accompanied by a list of course codas from the
Classification of Secondary School Courses tCSSC) organized to represent
this definition, or the codes which implied a clear definition. 16/ These
definitions are presPnted in the following sections. The CSSC codes which
were used to define secondary school study in each area are included as
part of the technical appendix to this report.
2.1 Mathematic&
Mathematics is the group of subjects that deals with quantities, magni-
tudes, forms, and their relationships by the use and manipulation of num-
bers and symbols. For purposes of the analysis, mathematics courses were
organized into categories on the basis of their intended outcome and the
type of students that they served. The study of mathematics at the second-
ary school level includes the following types of coursework:
o College Preparatory Courses for Gifted-Talented Students (e.g.,
linear algebra, calculus, and advanced placement calculus)
o College Preparatory Courses for Mathematics Concentrators (e.g.,
analytic geometry, algebra and trigonometry, and probability and
statistics)
o College Preparatory Courses for 4 -Year College Bound Students
(e.g., algebra 1, 2, and 3, geometry, and trigonometry)
16/ Evaluation Technologies Incorporated, A Cigssifigptien ef 2econdary
School Courses, Washington, D.C.: National Center for Education
Statistics, 1982.

o General Mathematics (e.g., general mathematics 1 and 2)
o Vocational Mathematics (e.g., agricultural mathematics, businessmathematics 1 end 2)
o Basic Mathematics (e.g., consumer mathematics)
o Optional Mathematics (e.g., computer mathemstics 1 and 2.mathematics in the arts).
2.2 colimutn &Anse
Out of en appreciation that computer science is becoming increasingly asps-rated into its own curriculum area, it was decided to it separately frommathematics, science,,vocational education, and general education in theanalysis. ETI relied on a computer program development specialist to sug-gest guidolinos for the analysis of student participation patterns incomputer science.
The study of computers has bean tied to two different disciplines. Computerscience has become associated with the discipline of mathematics, whereasdata processing has allied itself with business. A third curriculum area iscomputer literacy. Current literature tends to include computer literacyunder computer scienc.s.
The study of computer science in U.S. secondary schools includes coursoworkin the following areas:
o Computer Science Languages and Programmingo Business Data Processing Application..
2.3 ;sting,
Science is the organized knowledge that is gained through systematic
mpiricel methods. The science programs listed in the CSSC were divided
into two general categories: (1) life sciences and (2) physical sciences.
Within these two categories, courses were grouped according to whether they
wore advanced or general level courses. 17/
2.4 Vocational Education
Although the group of vocational education specialists did not initially
state a conceptual definition of vocational education, they later agreed on
the following definition:
Vocational education is any education that provides experiences,
visual stimuli, affective awareness, cognitive information, or
psychomotor skills; and that enhances the vocational development
processes of exploring, establishing, and maintaining oneself in
the world of work. 18/
At the secondary school level, vocational education includes coursework in
the following nine areas:
o Agriculture
o Business
17/ The panel decided to exclude general science offerings from the analy-
sis. This decision was based on the interdisciplinary nature of
courses of this typo, the differences in content and format of such
courses across schools, and the fact that general science is offered as
an eighth grade course in many schools.
18/ John F. Thompson, Eemnittign, 2i Yeggtienal g4msgti4o Englewood
Cliffs, New Jersey: Prentice -Hall, Inc., 1973.
-13-
35

o Marketing
o Health
o Industrial Arta
o Technologies
o Trade and Industry
o Consumer Home Economics
o Occupational Home Economies
2.5 General Education
General education is that common universe of discourse, understanding, andcompetence necessary for effective membership in a free society. 19/ Asstated in the introduction to this report, it developed in the school systemout of a concern for the education of the unique needs of the individualstudent. The general education curriculum is characterized by greaterstudent freedom to choose courses from a wide variety of offerings.
According to the general education project advisors, it is not possible toidentify a set of high school courses that are broadly agreed upon as con-stituting general education courses. 20/ Courses are defined as general edu-cation offerings by their content and by the extent to which they adhere tothe philosophy of general education. Moreover, general education courses ascompared with academic courses are distinguished by the lower difficultylevel and the lower expectations of student performance. while the materialcovered in general education course is similar in content to that of othercourses, the difficulty level of the concepts studied and the amount ofmaterial covered is reduced.
19/ D. Tanner and L. Tanniv.f, gurr/cvlgm pevel92ment Them Into PracticL2nd ed., New York: MacMillian, 1980, p. 445.
20/ The exceptions say be general mathematics, gereral science, and generalEnglish.
-14-

In light of the nature of general education and the recommendations of the
general education advisors, no attempt was ade to identify a set of general
education courses prior to the analysis. Rather, the analysis focused on
identifying the coursas taken by self-defined general education students and
on the characteristics of these student*. Thus, the approach to the analy-
sis of course-taking behavior among general education students deviated from
that which guided the analysis of students in other subject areas.
2.6 Student Course-taking Patterns
The conceptual and operational definitions of mathematics, ccmputer science,
science, vocational education, and general education provided the foundation
for the analysis of student participation in these areas. For purposes of
the study, student participation was defined in terms of the course-taking
histories of secondary school students as represented in the HSWEI student
transcript date.
Mathematics Course-Taking Patterns
Each student aampled for the HS&B Transcripts Survey was classified into
one of four mathematics participation patterns on the basis of his or her
secondary school course-taking history. The operationalization of each
pattern is function of the intensity of participation in high school
mathematics and the type(*) of mathematics courses a student took over his
or her high school career. Intensity was measured by the number of Carnegie
credits a student earned.
Before being assigned to a specific mathematics course-taking pattern, each
student was first identified as being a college preparatory mathematics
student or a non-college preparatory mathematica student. Once a student
was assigned to one of these classifications, he or she was than assigned to
one of the two patterns within that classification. This process is illus-
trated below:
-15-
3 7

A. Collage Preparatory Mathematics Studentdefined as any student who
has earned two or more credits from the college preparatory mathematics
categories in addition to any credits earned in the general, vocational,basic, or optional mathematics categories (see CSSC codes in theTechnical Appendix).
1. The Mathematics Concentrator -- a student who has mimed four or
more credits in mathematics, at least one of which was earned from
the "college preparatory for gifted and talented students"
category or the "college preparatory for mathematics concentrators"category (See CSSC codes in the Technical Appendix).
2, The 4-Year College Bound Mathematics Student -- student who meetsthe conditiors specified under the definition of the "College Prepar-atory Mathematics Student" in A, above, but not those specifiedunder the Concentrator definition.
B. Non-collegs Preparatory Mathematics Student -- defined as any studentwho has earned less than two credits from college preparatorymathematics categories.
1. The General Mathematics Student -- a student who has earned one or
more credits in mathematics but less than two credits in collegepreparatory mathematics courses.
2. Non-participant or Limited Participant -- student who has earnedless than one credit in mathematics.
Science Course-Tsking eatterns
Secondary school participation in science courses is linked to the abilitylevel of the student and to his or her postsecondary aspirations. Studentswith low to average ability and without any postsecondary education aspira-tions are most typically found in general science courses (e.g., generalbiology and general physical sciences). On the other hand, students with
-16- 3S

above average abilities and those with college aspirations more often enroll
in college preparatory and advanced science courses such as advanced
biology, chemistry and physics. These patterns of student participation in
secondary school science studies, plus pattern reflecting no or limited
secondary school study in the sciences, are oporationalized below.
As with the mathematics course-taking patterns, each student was first
categorized as being college preparatory science student cr non-college
preparatory science student. Next, the student was assigned to one of the
two patterns within that category, as follows:
A. College Preparatory Science Student -- defined ss any student who has
earned one or sore credits in advanced life science courses or in
advanced physical science courses in addition to any credits earned in
the general life and general phyaical science courses (see CSSC codes
in the Technical Appendix).
1. The Science Concentrator -- a student who has earned one or sore
credits in each of the following: biology, chemistry, and physics
in addition to any credits earned in general science courses.
2. The 4-Year College Bound Student -- a student who meets the condi-
tions specified under the definition of the "College Preparatory
Science Student" in A, above, but not those specified under the
Concentrator definition.
B. Non-college Preparatory Science Student -- defined as any student who
has earned less than one credit in advanced life science or advanced
physical science courses.
1. The General Science Student -- a student who has earned one or more
credits in general life science or general physical science courses
and less than one credit in advanced level science offerings.
2. Non-participant or Limited Participant -- a student who has earned
less than one credit in science.
-17-
39

Comput9r 2GAnce cop-se-Taking Patterns
Student involvement in computer science was measured in terms of participa-
tion in the two areas of study (i.e., computer science languages and pro-
gramming and business data processing applications). This was done in
recognition of the fact that computer science education in U.S.secondery
schools is a relatively new phenomenon and that a relatively smell percent-
age of all high school students have earned credits in these courses. The
computer science course-taking patterns are operationalized as follows:
o Participant -- a student who has earned any credit in computerscience.
o Non-participant -- a student who has earned no credit in computerscience.
Y2g2t12041 g4Wctti2B g2gEff=ing Pattern!
Intensity of a student's participation, as measured by the number of Car-negie credits earned, served as the foundation for the vocational educationcourse-taking patterns. In addition, the distribution of student's ere-:sits across the instructional programa was taken into account.
Four patterns of participation in vocational education were identified:
o Concentrator -- a student who has earned four or more credits in a
aingle vocational education program. A student who has earned
four or more credits each in multiple instructional programs(e.g., four credits in business and four credits in marketing) isincluded in this definition.
o Limited Concentrator -- student who earned four or more credits
in vocational education but less than four in singleinstructional program.
o Sampler -- student who has earned more than zero but less thenfour credits in vocational education.
-18-

o Non-participant -- a student who has learned no credits in voca-
tional education.
Gemmel Education Course-Taking Patterns
General education was treated differently from mathematics, computer science,
science, and vocational education in the analysis. Since it was not possible
to identify a standard set of general education courses to define this curri-
culum alternative, no course-taking patterns were developed prior to the
analysis. Inatead, the identification of student participation patterns
across sutject areas was an outcome of the analysis. That is, course-taking
profiles were developed for self-dofined gambrel education students.
Them" course-taking profiles were based on the types of courses general
education students had taken during their high school careara and the inten-
sity of their participation in these courses. The course categories deve-
loped for mathematics, computer science, science, vocational education, the
arts, and the humanities were used for this purpose. 21/
21/ The instructional programs for each of these subject areas that were deve-
loped as part of prior analyses of the HUB data were used for this
purpose. Several of the mathematics and vocational education instruc-
tional programs differ slightly from the course groupings used to define
mathematics and vocational education course-taking patterns. Listings of
the courses comprising these instructional programs may be found in two
Evaluation Technologies Incorporated reports:
Genet gfftringe en4 Enz.:sal:tint, in tb2 art* en4 Hms2nitiet 2t tb2
Segondary School Level, Washington, D.C.: National Canter for
Education Statistics, June 29, 1984.
ha 6D21YfiN ef Gam: Myriam' KW garallrgatt fit 6110t2d t2
§ch2o1 Chgractoristics, Washington, D.C.: National Center for
Education Statistics, October 2, 1984.
-19- 41

CHAPTER 3
COURSE-TAKING PATTERNS: OVERVIEW
This chapter presents an overview of our research findings concerningcourae-taking patterns in mathematica, science, vocational education, andcomputer science. It presents nationwide estimates of the number and per-centage of students who exhibited various course-taking pattern, in thesesubject arena as defined in Chapter 2. The chapter also includes researchfindings pertaining to the participation of general education students inthe aub)ect areas of interest.
3.1 n9tb9E2tigNA &ISOM. 1/2G9ti902i gOM9.9ti2DA 900 g2ERgttli *2i9092Course-Taking Patterns
HS &8 transcript data were examined to determine the number and percentage ofsecondary school students who participated to varying degrees in athemat-ics, science, vocational education, and computer science during their highschool careers. The results of this analysis are shown in Table 1.
Only small percentages of students had concentrated in mathematics (8.6 per-cent) or science (9.3 percent). In each of these fields, the most prevalentpattern was what we have termed the "general" pattern in which the studenthad earned one or more mathematics credits but less then two in collegepreparatory mathematics courses. About half of all students conformed tothis pattern. With respect to the sciences, about 47 percent of the stu-dents had earned at least ono science credit but had not earned one creditin any advanced level life or physical science course. Nearly one in everytwenty students had earned fewer than one mathematics credit, and about onein every six students had earned fewer than one science credit (limitedparticipants or non-participants). 22/
22/ Caution should be exercised in interpreting this finding as anygeneral/unified science (CSSC number 30.0111) credits earned werenot included in determining a student's science course-takingbehavior.
-20-
1 2

TABLE I: PERCENTAGES AND AMER ITIOUSANDS) OF STUDENTS 400 EXHIBITED
SPECIFIED COWIE-TAKING PATTERNS IN MATHEMATICS, SCIENCE, VOCATIONAL
EDUCATION, ANA, COMPUTER SCIENCE: 1941-42
Course-Tahl no Pa +tarn Percent Number
Matwos,l cs
Comentratcr 4.6 280
4 -Year Col 1.941 etwod 36.6 1,194
t2anral Nafteartics Student 50.1 1,632
/On -particIpant cr Limited 4.7 152
Participant
Sc lance
Corcetrtrat:r 9.3 304
4-Vear College Bound 27.7 904
Genre! Science Student 47.2 1,539
Nan - participant or Lhaltad 15.7 513
Participant
Vocational Education
Corcontrirtor 24.8 807
Limited Concentrator 25.5 629
Seep! or 45.3 1,477
Nan -part 1c1 4.5 146
Computer Science
Participant 12.5 404
Non-participant 87.5 2,444
BEST COPY AVAILAH3

Overall, about 50 percent of the students exhibited either a strong voca-tional focus (concentrators) or a vocational interest (limited concentra-tors). One-fourth of the students had earned four or more credits in asingle vocational education instructional program 23/ (e.g., agriculture,business, etc.) and a like number had earned four or more vocational creditsacross instructional programs. The largest single group of participantswas comprised of those atudenta who had earned some vocational credit butless than four credits across the instructional programs (samplers). Only4.5 percent of the students nationwide had earned no vocational credit (non-participants).
As stated in Chapter 2, relatively few students were expected to have earnedcomputer science credits. This expectation was supported by the distribu-tion of computer science credits. Consequently, only two patterns of parti-cipation were examinedparticipant and non-participant. Approximately 13percent, or 408,000 students, earned some computer science credit. Thisfinding is not surprising given that only about 55 percent of all schoolsprovided 'students with the opportunity to study this new technology as lateas 1981-82. 24/
3.2 Beletionshi2e 6eong Subject brim Course-Taking Patterns
The findings reported above indicate that participation in mathematics andscience follow such the sass pattern. A supplementary analysis of thecourse-taking patterns of these two subject areas underscores these similar-ities. The findings of this analysis ars presented in Table 2.
Students' patterns of participation in mathematics and :ience were stronglyrelated. The majority of mathematics concentrators were either science
23/ Students who earned four or more credits each in multiple instruc-tional programs (e.g., four credits in business and four credits inmarketing) are included in the definition of concentractors.
24/ Evaluation Technologies Incorporated, An Analysis of Course Offeringsand Enrollments ga Related to School Characteristics, Washington, D.C.:National Center for Education Statistics, October 2, 1984.
-22- 44

TALI 2: NIKINIANCS OF MUMS 1110 MIMI MID "WW1= CONNE-TAKING PATTON iM 11619111OTIOS, 9ORICE, VOCATION INCATION, AND0:99,101ot lc it ICE AND NE IA Gill It -TARNS FATTENS IN 011101 NIASI NO 42
Corse-TionIng Pottir a
In Mir Areas
Onerso-TanIng PoIlirn
11.16enstIcs Science
Codeontrenar
1 -bar
WispIbeild
Onorra1
IloWanostIcas
INuisnt
lent-nertIcIpeat or
t*.i PartIcliont
4-Va1r
0.11eile
Conrinerstar Ihnond
Omar el
Schwan
Stinkpot
Ilon-IpertIcIpoot er
I.104 fed Participantk
11,111mort Ice
Canr.onft a tar 42.9
04, 0101nee Oised 53.0
Onears1 11511finstIcs
Wolin* 1.1
1141-partIcloat a-
LImInme/NortIcIponn
lefeac
0.0
Onceadra tor 41.4 13.5 .0 0.0
4-loor on1Inen Noel 12.0 13.1 13.9 10.1
&Heir e 1 ScIalco
IT enact
lbntert1c1 oaf sr
10.3 MA 67.0 40.11
United FertIcIpent .0 1.6 231 19.1
IlmartIses1 ITencafien
OPanasInstar 5.3 14.1 339 25.1 3.4
Owl Tod Cirensortretcr 0.5 70.0 32.1 73.0 9.9
10119 Er 14.4 59.2 31.0 36.9 71.1
On-fortIcIpeet 11.6 3.2 IA 13.1 10.7
Cognetw Sc lame
Pert kips*. 29.6 111.0 7.7 9.5 30.9
Ian-pert 1c l pI nt 70.1 111.9 92.3 94.5 69.2
13.2 1.9 .3
00.0 29.4 1410.7
75.1 69.7 71.1
1.7 4.0 14.5
11.7 32.0 33.1
19,0 3i.4 79.3
60.1 35.1 31.3
9.9 2,0 .0

TAILt 3: PENCENTA413 07 STWEIITS 114) 4011111102 f4CIFIt0 COO* -T NC ING PAITE1444 111 84A114344TPOS. ILIT141, VOCATIONAL COLLATION,COOPV1ER !CNN" ANO MIA 0:411K-14411112 014121311141 I 011471 MAIL 190142 (04.11.41
Cower-TakIng Parke. P
Coars4-74110 Pettur Voute144441 14.04,144Is *Mr Ames 1.14ite4
04Nmetrs CoNtortrotor 5040 er Itoev $1ctpoet
1011644stlas
Computer ScIaNce
Part lc Ira/ Obelpert !closet
Coacomerettir 1. 2. 14.1 22.1 20.4 4.04.4p4r 011110.4 Ofted 24.0 111.111 47.0 42.0 44.8 11.1114.srs1 Nithram/101
1114111NN 84.7 42.12 23.1 21.0 WV 52.10184-portIc1,444 or
LI IN fed Port kiwi* 4.V 4.0 3.4 13.1 S.0 4,0
Wows
Comsomirstar 1.3 3.4 19.4 27.3 23.0 7.141.14or 0.11404 114444 14.3 20.1 31.0 34.3 33..3 24.04114m4441 Wow*
1114414e4 111.0 57.9 14.11 20.1 33.2 49.34144-part 1c 1 peat er
L1414144 Port !tips*
lboot14441 8/mast1444
21.3 44.2 /C 21.0 ICA 14.5
Commairstar0.1 19.4
1I411444 Oriceetrotor28.3 21.fi
6844141.92.1 44.4lbstyartIcIpief2.5 4.8
Cows* SeismsPo* t !closest 0,7 13.4 14.4 7,014.4-4ortIcIont 41.1 04.1 03.1 03.0
AMIIIIII01.111.111111.=
.10 BEST COPY AVAILABLF

concentrators (46 percent) or 4-year college bound science students (43 per-
cent). Conversely, bow!: 96 percent of all science concentrators were
either mathematics concentrators or 4-year college bound mathematics stu-
dents. The 4-year college bound pattern in both mathematics and science wags
strongly linked to either a 4-year college bound or a general level of
participation in the other area (for example, a 4-year college bound mathe-
matic student was likely to be either a 4-year college bound science stu-
dent or a general science student). Nearly one-half of the students who
earned fewer than one mathematics credit earned a similar number of credits
in science. Limited participation or non-participation in the sciences was
moat commonly associated with general mathematics participation (74 percent).
Vocational education course-taking patterns were also examined in relation
to those of mathematics and science. As might be expected, concentration in
vocational education was most strongly associated with general level of
participation in both of these subject areas. Nevertheless, about one-
fourth of all the vocational education concentrators and limited concentra-
tors met the requirements of the 4-year college bound mathematics pattern.
A majority of the vocational education samplers had met the definition of a
4-year college bound mathematics or science student (47 percent and 37
percent, respectively) or the definition of general student in these
subject areas (35 percent and 37 percent, respectively). About 75 percent
of the mathematics concentrators and 76 percent of the science concentrators
were vocational education samplers, having earned some vocational education
credit. These findings indicate that intense participation in mathematics
snd science did not preclude students from seeking vocational training, nor
did intense participation in vocational education preclude students from
earning credit in college preparatory mathematics and science courses.
Not surprisingly, participation in computer science was most commonly re-
lated to more advanced level participation in mathematics. About 20 percent
of the students who earned computer science credit concentrated in mathema-
tics, and 47 percent were 4-year college bound mathematics students. Only
two percent of the students who had earned computer science credit had
earned less than one credit in mathematics.
-25-
4 7

The relationship between computer science participation and science course-taking patterns was similar to that for mathematics; however, smallerpercentage of computer science participants were college preparatory sciencestuderts. Furthermore, a higher percentage of the computer science partici-pants (10.6 percent) had earned less than one science credit than had earnedless than one mathematics credit.
The involvement of computer science participants in vocational education wasmost often as a sampler (52 percent) and least often as a non-participant(2.5 percent). This finding was not unexpected given that college prepara-tory mathematics students were typically vocational education samplers.
3.3 Cgurse-Taklng History of General Educetign Stuggentp
As previously stated, there is no set of secondary school courses than canbe used to define a general education curriculum. Therefore, it was notpossible to define the course-taking patterns of general education in thesame way as the course-taking patterns in mathematics, science, vocationaleducation, and computer science. Instead, the average number of credits indifferent subject areas that were earned by students who considered them-selves to be in a general education program was examined. The findings ofthis analysis are presented in Table 3.
When asked to describe their high school program as part of the HS&B FirstFollow-Up Survey, over one-third (35.1 percent) of the students defined itas general. 25/ The average number of credits earned by these self-defined
25/ Students' self-reported description of their high school program wasexamined with respect to their course-taking patterns in mathematics,science, vocational education, and computer science. A majority ofthese students were general mathematics students (63 percent). About66 percent of the self-defined general education students were generalscience or limited/non-participating science students, while 91 percentwere computer science non-participants. With respect to vocationaleducation, 57 percent of the general education students were concentra-tors or limited concentrators, and 41 percent were samplers.
-26-
48

TNILE 31 AVERAK NINE* OF CREDITS EASED BY SWIM EDUCATION STUDENTS IN
ARTS, *INANITIES, MATHEMATICS, SCIENCE, VOCATIONAL EDUCATION, AND
COOPUTOt SCIENCE INSTRiCTICMN. PROSRANSi 1141-42
instructional Program
General ,
Education\
Pulite&
Ail
Other
Students
Arts I.s I.3
DameDramatic Arts and Design .1 .1
graphic and Coward lel Arts
Grafts .1 .1
F I no Arts .5 .4
06isic .7 .7
CrestIvo Writing
Human! +les 5.9 6.9
Nviti-Clacipi may and inter-
01 lc 1 pi !nary Studies
Philosophy and Religion.1
Fcr gn Languages .e 1.2
History 1.4 1.4
Anthropology and Cultural
Geography .4 41
English and the Study of Literature 3.1 3.2
Rhetoric and Composition .4 .4
Cultural Appreciation
Notheeetios 2.0 2.6
Ornerel Whematios 1 .5 4general Nethematios 2 .3 .2
general Nefihemelos, Other
Algebra 1.5 .6
Algebra 2 .2 .3
Algebra 3 .1 .2
Geometry.3 .5
Advanced and Pure Whematics .1 .3
Calculus, Advanced Placement
Statistics, Applied Whematics and
Actuarial Science
Sc linos1.5 2.0
Biology. General .7 .5
Biology, College Preparatory .1 .2
Life Sciences, ether
Physical Sciences, General .3 .3
.07.011101mommd1011.7==mm
Students earned an average of lass than .1 credit.
BEST COPY AVAILABLE
Alownimea,
-27-9

TOLE 31 AMAIN NOW OF CREDITS MINED By GENERAL EDUCATIONNITS, NUMMI T I ES, NATMFJOTI CS, SCIENCE, VOCATIONALCOM TER SCIENCE INSTRUCTIONAL PR MANS: 1911-12
STUDENTS INEDUCAT KIN, MD
t Cont I mod/
In struct 1 ore 1 Program
Physics I Sc linos s, OtherMemel stry
Geological SciencesPhys I cs
Vocational Educet Ion
Agr I cu I twoBuil mossMirka+ I ng*a 1 ttIndustrial Arts'ref:imp' og IsmTrade and IndustryConsumer Have Econom I csOccwat Iona 1 Hose Eton= 1 cs
Computer Sc lance
Covu tar Sc lance Langwas and ProgrammingBusiness Data Processing Applications
asnare 1Educat IonStudents
.2.1
.1
4.4
. 21.4.1
. 4
1.1
.6.2
.1
AI IOther
Students
.4
.2
4.1
.2I. 6.2.1
. 3
1.0.62
. 1
1.
Students owned an swage of ions than .1 credit.
BEST COPY AVAILABLE
-28-
general education students suggests that they experienced less exposure to
the humanities, mathematics, and the sciences than did other students (i.e.,
college preparatory and vocational education students). Overall, general
education students earned about one lees credit in the humanities and about
one-half less credit in mathematics and science than did other students.
The credit differential in the humanities was attributed primarily to gene-
ral education students' earning fewer foreign language credits. In mathe-
matics, general education students earned slightly fewer credits in most of
the upper level offerings. A similar pattern held with respect to advanced
level science courses. General education students earned about the same
number of credits in the arts and vocational education as did students in
other programs.
CHAPTER 4
CHARACTERISTICS OF STUDENTS EXHIBITING VARIOUSCOURSE- TAKING PATTERNS IN MATHEMATICS
This chapter presents the findings of our analysis relating mathematicscourse-taking pattern. to selected student characteristics. The character-istics that are examined fell into three categories; (1) aocio-demographicattributes; (2) school performance and experiences; and (3) postsecondaryplans and aspirations. Findings relating these characteristics to science,vocational education, computer science, and general education are presentedin Chapters 5 through 8.
The findings reported in Chapter 3 suggest that students differed withrespect to their participation in high school mathematics, with this parti-cipation ranging from intense (concentrator.) to limited or no involvement.The findings presented in Tables 4 through 12 identify the charactaristicsof students in each of the mathematic. course-taking patterns. All of thedifferences described in this and the remaining chapters are at least +tootimes the standard error of the difference and therefore are statisticallysignificant.
4.1 22P1.2:42112gre2hic 6ttributea
Course-taking patterns were examined relative to students' sex, socio-economic statue, race/ethnicity, and the type of school they attended. Thisinformation is summarized in Tables 4 and 5.
The distribution of students across the various course-taking patterns wassuch the sass for males and females. Moreover, the percentage of males andfemales within each pattern appeared to be roughly equivalent to theirrepresentation in the student population. For example, while males com-prised about 49 percent of the student population and females about 51 per-cent, each represented approximately 51/4 percent of the general mathematicsstudents. The relationship between mathematics course-taking behavior and
-30-
52
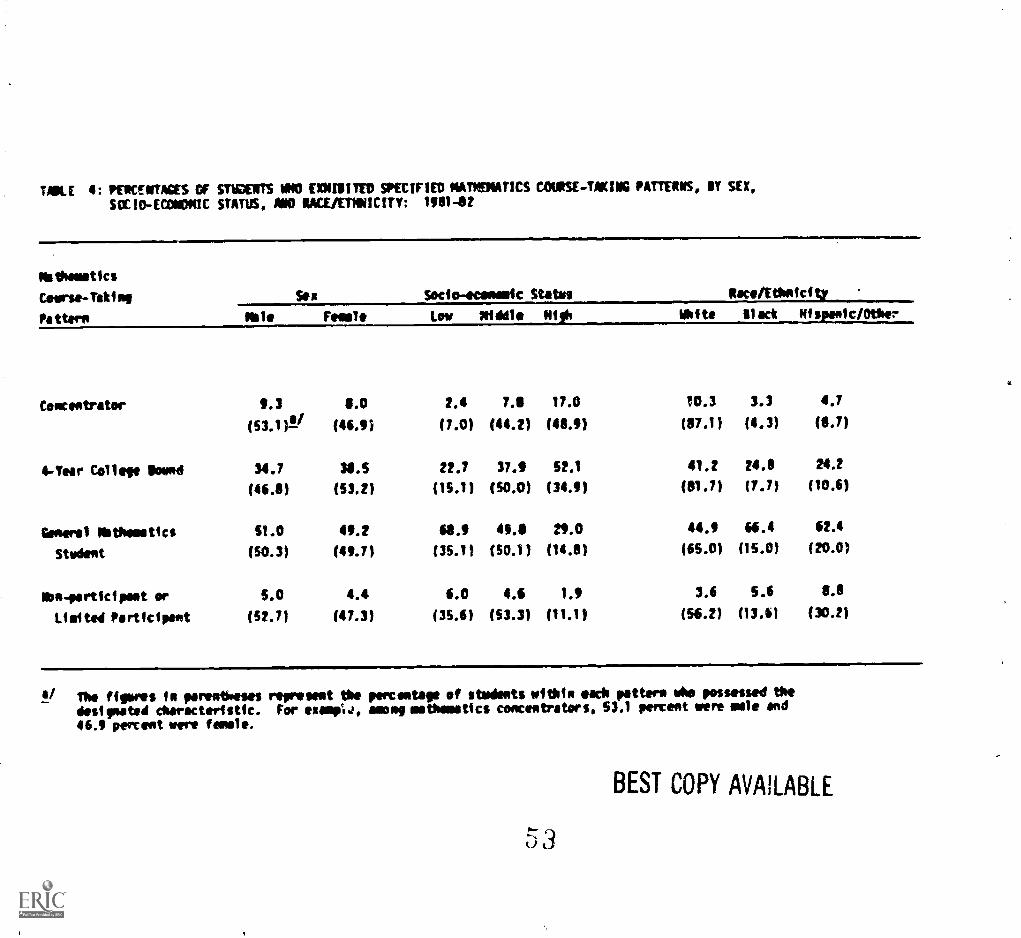
TAOLE 4: PENCENTAGES OF STVDENTS 1010 EXIIMITIO SPECIFIED HATNEHATICS COURSE-TAKING PATTERNS, 81' SEX,
SOCIO-ECONDHIC STATUS, ANO RACE/ETHNICITY: 1181-82
listhematics
Ceerse-laking
Pattern
Sex
Nile remelt
Socio-economic Status Racenthnfcity
Low Iliddle White Mack hispenic/OtheT
Concentrator 6.3 8.0 2.4 7. 17.0 10.3 3.3 4.7
(53.1)x/ (46.9) (7.0) (44.2) (48.3) (PM (4.3) (8.7)
4-Tear College 'owed 34.7 38.5 22.7 37.6 SPA 41.2 24.8 24.2
(46.8) (53.21 (15.1) (50.0) (34.31 (81.7) (7.7) (10.6)
Gemini Siiithoestics 51.0 411.2 68.9 4E6 23.0 44.6 66.4 62.4
Stedent (50.3) (43.7) (35.1) (50.1) (14.8) (65.0) (15.0) (20.0)
Nbnaperticipent or 5.0 4.4 6.0 4.6 1.4 3.6 5.6 8.8
Limited Participant (52.7) (47.31 (35.61 (53.3) (11.11 (56.2) (13.61 (30.2)
The Tiger's fn pareotWeses represent the percentage of students within each pattern whop possessed the
designated characteristfc. For exaupJ, among asthmatics concentrators, 53.1 percent were mile and
46.6 percent were Towle.
BEST COPY AVAILABLE
03ul

socio-economic status was such stronger. Participation in college prepare-tory mathematics courses, both as a concentrator and as a 4-year collegebound student, was positively associated with SES. Seventeen percent of thehigh SES atudents concentrated in mathematics, and 52 percent of thesestudents ware defined es 4-year collage bound as compared with nearly twopercent and 23 percent, respectively, of the low SES students. Conversely,the percentage of students defined as general mathematics students or non-participants/limited participants was larger among the low SES students.
Low 5E: students wore especially underrepresented among the mathematicsconcentrators and 4-year college bound relative to their numbers in thestudent population. While these students comprised approximately 25 per-cent of ttNe student population, they represented only seven percent of theconcentrators and 15 percent of the 4-year college bound. Middle SES stu-dents were ulightly underrepresented among the concentrators, and high SESstudents ware substantially overrepresented.
Race/ethnicity, like SES, was related to mathematics course-taking patterns.White student, were much more likely then other students to be mathematicsconcentrators or 4-year college bound mathematics students. Black student*,in particular, were underrepresented among the mathematics concentratorsrelati:e to their representation in the population. Furthermore, Hispanicother students repreaented only about nine percent of the mathematicsconcentrators although they accounted for about 16 percent of the studentpopulation. Conversely, Hispanic/other students were overrepresented amongthe non-participant/limited participant category.
The type of school that students attended was related to their participationin mathematics (sea Table 5). As one might expect, private schools had ahigher percentage of their students participating at college preparatorylevel than did public school*. The percentage of Catholic school and otherprivate school students who had concentrated in mathematics was roughlythree times that of public school students. On the other hand, publi,T

TABLE 5: PERCENTAGES OF STUDENTS WHO EXHIBITED SPECIFIED MATHEMATICS COURSE-TAKING
PATTERNS, SY 11:1MOCL TYPES 199142
MenomatIcs Course- School Type
TakIng Pattern NOlic Catholic Orthir Private
Concentrator 6.9 23.4 23.9
S-Year Colley Bound 35.0 52., 45.4
General Mathematics
St Wont 53.1 22.3 26.7
1bn -participant or
Limited Participant 5.0 1.7
BEST COPY AVAILABLE

',
school "students were about twice ea likely to have been general mathematicsstutients. 26/ Public school students were also sore likely to have beenn,,n-participants/limitod participants.
4.2 School Performance and Experiences
The various components of the HS&B First Follow-Up Survey collected datathat may be u.sod to measure different aspects of students' performance andexperiences. For example, the HSCB Transcript Survey collected data on thegrades that students earned while in high school. These data, along withcourse credit data, were used to calculate an average grade for each stuAAnt.
Moreover, as part of the 1982 First Follow-Up Survey, students were adminis-tered cognitive testa in reading, vocabulary, and mathematics. For thepurpose of this analysis, the average of the three standardized scores onthese teats were grouped by quartiles, reflecting whether a student's aver-age score fell in the lowest, second, third, or highest quartile of thedistribution of the all student scores. 27/
26/ An earlier study conducted by Evaluation Technologies Incorporated forthe LACES found that private schools offered sore advanced level mathe-matics courses and that enrollments in these courses were higher ascompared with public schools. Public schools had higher generalmathematics enrollments. See Evaluation Technologies Incorporated, AnAnalysis of Course Offerings agd Enrollments as Related to SchoolCharacteristics, Washington, D.C.: National Center for EducationStatistics, October 2, 1984.
27/ Test scores were standardized so that the weighted, distribution ofscores would have a mean of 50 and a standard deviation of 10. For moreinformation on the tests and the composite scales used here, see HighSchool and Beyond 1980 Sophomore Cohort First Follow-ft (1982): DataFile User's Manual.

Finally, the questionnaire administrated to the First Follow-Up sophosore
sample contained a series of questions relating to the student's participa-
tion in a variety of extra-curricular activities. The responses to these
questions were used to determine the types of activities engaged in by
students who had participated in mathematics at varying levels.
Each of these measures of students' school performance and experience& is
examined in Tables 6 through 8 of this section.
The overall grade averages of students differed according to their level of
participation in :dathematica (see Table 6). A significantly higher percent-
age of concentrators (69.9 percent) had an overall grade average of B or
higher than did 4-year college bound (42.7 percent), general mathematics
students (12.5 percent), or non-participants/limited participants (10 per-
cent). Conversely, the majority of general mathematics students (63.7 per-
cent) and non-participants/limited participant& (68.1 percent) had overall
grade averages of C or lower.
Students who were mathematics concentrators performed significantly better
on the reading, vocabulary, and mathematics testa than did students exhibit-
ing the other mathematics course-taking patterns (see Table 7). General
mathematics students and non-participants/limited participants generally had
scores falling into the lowest two quartiles. These findings are consistent
with the view that lower achievement scores are, in part, attributable to
students' limited mathematics participation. It in equally plausible to
suppose that weaker students tend to avoid mathematics.
Table 8 presents findings relating to extra-curricular activities. In
general, students who had participated in mathematics more intensely were
also more likely to have engaged in many of the school-sponsored activities.
Concentrators were more likely to have participated in honorary clubs and
the production of a school newspaper/yearbook than were the other classifi-
cationa of students. These students, along with the 4-year college bound,
were more likely to have participated in service clubs/community service
activities and athletics and ware less likely to have participated in voca-
tional education clubs.
-35-r`wsie)1

TABLE 6: PERCENTAGES OF STLCENTS WITH OVERALL GRADE AVERAGES AT SPECIFIED LEVELS, BYMATHEMATICS 00&t $E- TAKING PATTERN: 1981-02
Overall Grade
Average
Mathematics Course-Taking Pattern
Concentrator
4-Year
College
Bound
General
Mathematics
Student
Non-participant or
Welted Partici ant
A 1.1 .3 .1 .4A- 36.0 15.0 2.5 .8
32.8 27.4 9.9 8.83- 22.8 31.9 23.9 22.0C 6.1 19.5 56.6 35.4C- 1.2 5.3 23.2 25.8
0.0 .6 5.9 6.90- 0.0 0.0 0.0 0.0F 0.0 0.0 0.0 0.0
36
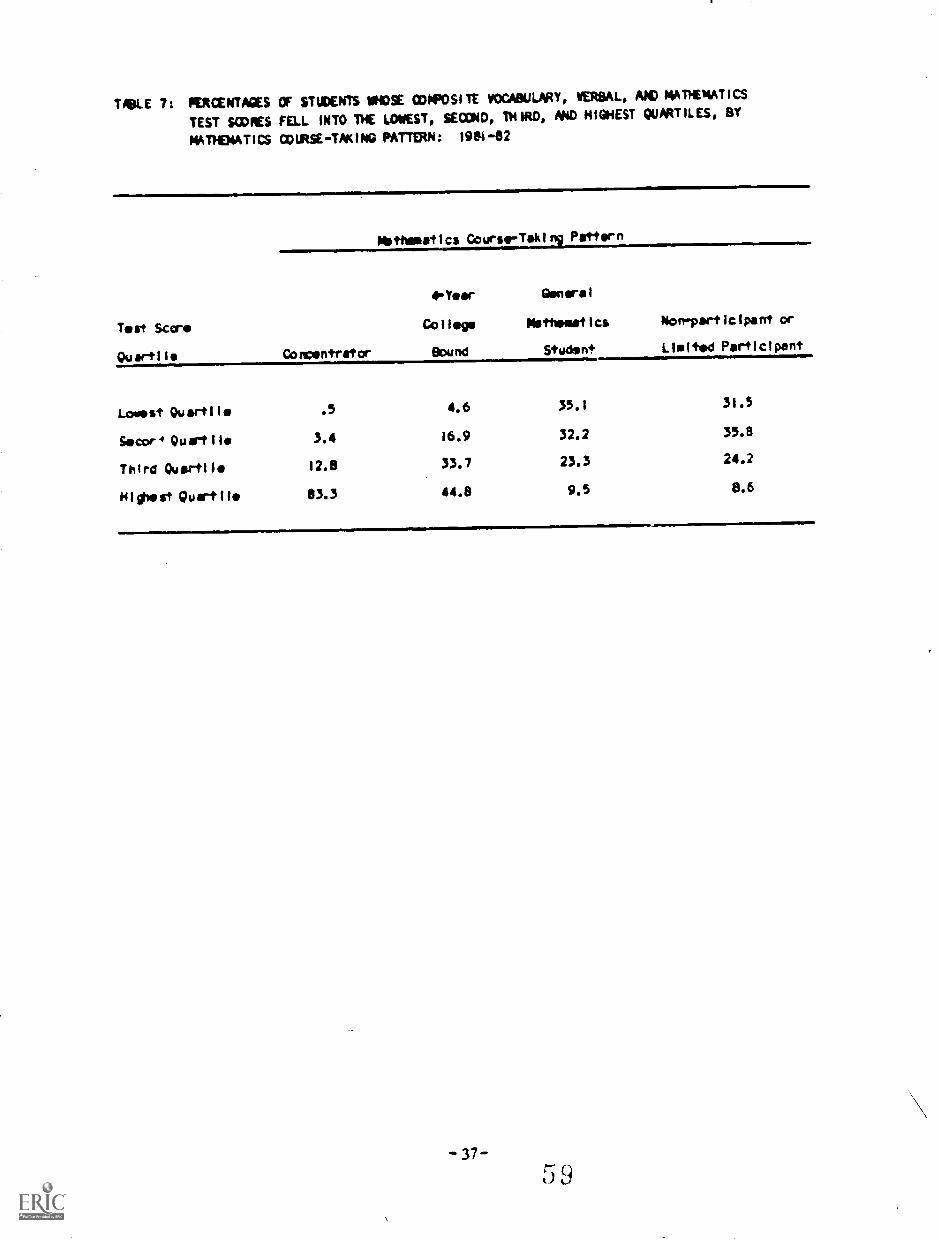
TABLE 7: PERCENTAGES OF STUDENTS VHDSE ODMPOSITE VOCABULARY, VERBAL, AAD MATHEMATICS
TEST SODRES FELL INTO THE LOWEST, SECOND, THIRD, AND HIGHEST QUARTILES, BY
MATHEMATICS COURSE-TAKING PATTERN: 1961-62
Mathematics Gout-so-T*41N Pattern
4-Year General
Test Sc.cr Collor Mathematics Pion-part iclpar0 or
Quartile Concentrator Bound Student Limited Participant
Loop s+ Quartile .5 4.6 35.1 31.5
Secor4 Quartile 3.4 16.9 32,2 35.8
Thin! Quartile 12.8 33.7 23,3 24.2
Highest Quartile 83.3 44.8 9.5 8.6

TAKE 8: PEICENTAGES Cir SMUTS 1881 MD PARTICIPATES II SPECIFIES EIT1111-CORRICIAUIR ACTIVITIES, RTNATIMPATICS COINISE-IMING PAT11110: 1981 -i2
itatitmotics Coorse-Tabiog Patter*
Eatro-CerricularActivitzi Coacaotrator
4-YearCollegelisood
Geoarral
141theasticsStudien
laa-portfcipaat orOwl tad Participant
Varsity AthleticsOther
48.5 40.3 28.6 24.7Athletic TeamCheerleatiag,
47.3 43.3 37.11 16_0Pop Club
Dailatfai15.0 15.4 12.6 10.4or llovaa 17.6 15.1 10.6 10.6Iasi or Ortilestrs
OWNS17.0 16.9 11.5 15.4or WIC Ilt 17.2 20.5 19.4 17.9
NOW/ Clubslioftwury
20.1 17.1 19.8 22.5Clubs 47.0 22.8 6.5 .8School bowspoperfrearbookSchool
30.0 21.6 13.2 14.;Sobject-Mattar MAPS 28.4 73.3 18.0 15.8Staboot Casucilffaverturret
Vocatiosol26.8 20.7 11.0 12.6
dimities' ClubsTout*
7.4 17.4 31.0 20.1Cassosity OrganizationChart*
20.3 16.3 14.8 13.1Activ1t1es/1'81'W Cm.' 37.7 40.5 33.4 33.2Jolter Achlesomest 4.5 41.9 6.3 7.1Service Clubs/Cournonity Service
ActivitiesSomettissaratemities
?SA MA 12.1 12.32.5 2.4 2.8 2.5
tit
BEST COPY AVAILABLE
4.3 eettO2HDOHY Elio, 200 W1E21/202
Students were asked about the level ox education which they expected to
attain,their short-term plans for the year after graduation from high
school, and their long-range occupational goals. Furthermore, those stu-
dents who planned to attend college were asked to identify the field of
study that they would cost likely pursue. Student responses to these
inquiries are presented by mathematics course- taking pattern in Tables 9
through 12.
The immediate post-graduation plans of students varied rather markedly by
mathematics course-taking pattern (see Table 9). A such larger percentage
of general mathematics students and non-participants/limited participants
planned to work full-time or attend trade or business school as compared
with mathematics concentrators and 4-year college bound students. Converse-
ly, a significantly higher percentage of these latter two groups planned to
attend 4-year college or university. Surprisingly, about 11 percent of
the non-participants/limitald participants indicated that they planned to
attend a 4-year college or university.
There is a strong relationship between mathematics course-taking patterns
and students' educational expectations (see Table 10). As expected, a
aignificently higher percentage of general mathematics students and non-
participants/ limited participants expected to attain no education beyond
high school or expected to attend a vocational, trade, or business school
than did mathematics concentrators and 4-year college bound students. On the
other hand, concentrators and 4-year college bound students were more likely
to aspire to a 4- or 5-year college degree, master' degree, and another
advanced degree.
For the most part, students shared similar Sob aspirations regardless of
mathematics course-taking pattern (see Table 11). Nevertheless, some dif-
ferences were apparent. General mathematics students and non-participants/
limited participants were more likely to expect to have a lob in clerical
or craftsman occupation at age 30. A much larger percentage of concentrat-
ors and 4-year college bound students expected to have professional jobs as
compared with other students.
-39-
TA64. g: $>ERCtsTACES OF STUDENTS *0 EXPECTED TO ENGAGE IN SPECIFIED ACTIVITIES FCR THE FIRST YEAR AFTERGRAN*TION, BY MATHEMATICS COURSE-TAKING PATTERN: 1981-82
Activity That Will Takes Ths
Largest Share of Time the
Year Atter Higt School
Metheastics Cowes-Taking Potters
Ozaceetrstor
4-Tear
College
Bowed
General
Mathamelcs Mon-participant car
Stwdnt Llnifed Participant
Working twit-time 3.5 18.5 43.6 48.6
Appose/tic cr os-the-lob
training .6 1.3 3.1 .8Aimplar military service
for servIcs academy) 1.2 3.0 5.5 6.3
rw11-tfiss %oaemaker C.0 .9 2,0 2.7
Takla. courses full-tims
or part-the et:
A trade or Sinless, school 1.4 4.7 8.2 9.0A junky or ccommity
col tow
Acadwalc courses 6.9 12.3 5.2 9.4Technical courses 1,3 4.5 5.0 4.9
A 4-year college or
university 80.7 50.9 16.4 10.5
Working pert-ties, but mot
attending school 1.7 1.8 2.5 2.9
Othsr (travel, take a brook,
no plans) .8 2.1 3.6 4.6
TAM 10: FEACENTAGIS OF STUMENTS 1110 INFECTED TO OBTAIN SPECIFIED KINDS AND LEVELS OF EDUCATION, IY MAINENATICS
COURSE -TAKIN6 PATTERN; 19411-82
Mathematics Coarie-Taking Fattier*
Idocatlesel
Fopectatioe Ceoceetrotor
4 -Year
College
lowed
General
Mathematics
SWIMNon-particlvot or
Lleited_particIvA
Less that, Nigh School Gredeatlee .2 .1 .8 2.3
Nigh School Grodoetloo 1.0 7.1 79.0 30.5
Yocatleoel, Triode or
Dueness School
After Mob School -
Loss Thee Two Years .5 4.7 12.2 12.3
Two or lire Years 1.6 8.0 17.1 17.4
College - Less thee 2 Years .1 2.5 3.6 6.3
College - 2 or Pere Years 4.7 16.4 16.2 14.1
College Cospletfoo - 4 or S Year
Deem 40.3 34.3 12.5 11.7
Nester's Deirre or fogivoloot 25.6 16.0 5.0 3.1
Ph.D., N.D., or Other 01* .Aced
Frofesslooal Degree 21.5 11.0 3.6 2.5

TULE 11: PERCENTAGES OF STUDENTS MHO EXPECTED TO HOLD SPECIFIED JOSS OR OCCUPATIONS WHEN 30 YEARS 010, 8Y MATHEWICSCOURSE-TAKING PATTERN: 1981-82
Mathematics Course-Taking Patten,
4-Year General
College Mathematics Noe-participant orOccupationConceotrator pound Student Limited Particip,nt
Clerical1.2 6.4 11.7 10.3Craftsman.5 3.6 11.1 10.1Farmer, Farm Memeger .7 1.2 2,7 2.3Homeesker 1,3 2.2 3.0 3.6laborer 0.0 .6 2.4 3.3
*nigger, Administrator E.8 9.4 7,2 6.5Military1.1 1.4 3.0 3.0Operative.4 1.3 5.0 4.5
Professiooal - No Admixed Degree 44.6 32.9 20.1 18.2Professfesal - Aktramced Degree 24.0 13.5 5.1 3.6Proprietor or Dimmer 1.5 4.1 5.3 7.1Protective Service
.5 1.4 2.6 2.0Sales .7 1.9 2.0 3.1Scheel Teacher
2.5 4.6 2.7 3.1Service ,4 2.1 6.0 7.1Teclimicei
13.8 13.3 9.1 10.6Not Working.2 .2 1.0 1.1
BEST COPY AvAlLisikt

Interestingly, professional occupations requiring no advanced degree were
the expected occupations of a plurality of students in each of the mathema-
tics course-taking patterns. Entrance into each of these professions re-
quires a college degree. Yet, many students have not earned sufficient
credits in advanced level mathematics courses to improve their chances of
entering college in order to obtain a Job in a professional =opacity.
When students were compared with respect to their intended field of study in
college, only a few differences emerged (see Table 12). Mathematics concen-
trators were more likely than other students to plan to study architecture
and engineering or the biological and physical sciences. On the other hand,
concentrators were less likely to study business and eomewhat les likely
to study art and music. General athematica studeri.a and non-participk.ilts/
limited participants were more likely than other students to plan to take up
vocational/technical studies.
f; l)
-43-

_
TALE 12t PERCENTAGES 0F DCLLEGE-41CUNO STLID(NTEk I0 PLANNEC TC ENROLL IN SPECIFIED FIELDS OF STUDY, BY MATHEMATICSDX 1,1E-TAKING PATTERN: 1911412
Mathematics Course-Ilk! Pattern
Fleld of Study Concantratcr
1.0
College
found
1.9
Mettematles
Student
3.1
Non-par/1point or
Limited Participant
4.4
Agriculture
Architecture and Engineering
Art
23.1 11.3 6.6 6.Iand *sic
2101ogidal and Physical
1.5 5.5 2.5 9.4
Sciences
brainees
1.0 4.11.1 1.0
Communicatidos
13.8 22.9 21.1 20.4
Computer and InforimatIon
2.5 3.5 3.4 1.7
Sciences
EdudaYlon
12.0 1.4 6.9 9.7
English
3.2 4.2 4.0 3.9and Foreign Levu/pas
Et) '1c and Into.-
2.0 2.9 1.91.1
diadlellury Studle.3
.1 .2 0.0Neafth Occupations
Nasitt
2.9 4.6 6.0 3.9Sciences
Nome :condoles
5.5 5.4 4.0 4.1
Mathematics
As 1.5 2.8 3.0
PnlIcsdpny and Aell;lon
2.9 .6.1 0.0
Pro-Professional
.7
10.5
.4 .2.3
;
14)4pdology
7.3 3.1 3.3and Social Sciences
VocatIonal/TecrnIcsI
4.7 5.5 5.4 4.9$tudirs
C*ner
1.8 45 10.9 12.32.9 5.1 8.6 10.7
-44-
BEST COPY AVAILABLE

CHAPTER 5
CHARACTERISTICS OF STUDENTS EXHIBITING
VARIOUS COURSE-TAKING PATTERNS IN SCIENCE
The findings of the analysis reported in Chapter 3 indicate that science
course-taking patterns were strongly related to those of mathematics.
Therefore, we would expect the characteristics of students exhibiting the
different science course-taking patterns to resemble those associated with
the different mathematics patterns. For the moat part, the findings
summarized in the following sections of this chapter support this expecta-
tion.
5.1 §2clo-09m2grephic Attiqbutes
Student participation in the sciences was examined relative to several
distinguishing student and school characteristics. Table 13 presents the
findings of this analysis.
A higher percentage of males than of females were science concentrators
(11.6 percent versus 7.1 percent). Males were substantially overrepre-
sented among the science concentrators (61.4 percent) and females underre-
presented (38.6 percent) relative to their representation in the student
population. A higher percentage of female.' were general science students,
whereas in mathematics general level of participation was unrelated to
sex.
Science course-taking behay.:..J: was strongly related to students' SES.
Participation at the college preparatory level increased with SES. That
is, a higher percentage of students in the middle and high SES categories
were defined as concentrators and 4-year college bound students as com-
pared with low SES students. General science participation and non-
participation/limited participation were inversely associated with SFS.
As with mathematics, low SES students were underrepresented among aclence
concentrators and the 4 -year collec.. bound. Moreover, while low SEE
students comprised about one-fourth of the student population, they revte
scented 38 percent of the non-participation/limited participation sclen7E,
category.
-45-
C)
TABLE 13: PERCENTAGES CF STUDENTS MNO [maim SPECIFIED SCIENCE COUSE-TAKING PATTERNS, BY SEX,SOCIO-ECONOMMC STATUS, AMD RACE/ETHNICITY: 19111-82
Selene
Morse- Tattoo
Patters;
Concentr star
Sin Socto-lecomeic Status Onicentheici4Melo Fele Low Middle HtiN White 111wet NixpeRic/Oteer
4-Year College Nomad
Geeeral Science
Stvdeet
113 -forticipset or
Limited Participant
11.6 7.1
(61 .4)-4-/ (3L4)
3.2 4.3 14.4 11.0 4.0 5.4(4.5) (43.2) (44.4) (85.9) (4.4) (9.r)
26.6 16.4 MO 39.9(47.4) (52.6) (14.51 (50.3) (35.:)
44.4 49,6 57.4 44.3 34.1
(46.8) (53.2) (30.43 (50.9) (18.3)
17.0
(53.4)
14.5 ZZ.0 14.6 7.6
(46.6) (38.3) (411.41 (13.0)
30.7 22,1 11.4
(80.4) (9.0) D0.0
45.0 54.4 52.5
(49.1) (13.0) (17.4)
13.4 19.6 23.8
(61.7) (14.1) (24.3)
a/ row ffgwres in parentheses represent the percentage of stadeets witefe gam patteve who possessed thedesignated characteristic. For example, sewn science concentrators, 61.4 percent were 11410 and 38.6percent were
BEST COPY AVAILABLE

White students earned more advanced level science crtdite then did black
or Hispanic/other students. Nearly 42 per!7ent of the white students were
science concentrators or 4-year college bound as compared with 26 percent
and 24 percent, respectively, of students from the other racial /ethnic
groups. Students from the latter groups were significantly underrepre-
sented among the college preparatory patterns relative to their numbers in
tne, total student population.Hiepanic /other students represented about 24
percent of all science non-participants/limited participants though they
accounted for about 16 percent of the students attending U.S. secondary
schools.
The differences in the percentage of public and private school students
exhibiting the various patterns of science participation were not as
pronounced as they were with respect to mathematics (ace Table 14).
Nevertnelless, there was a pattern of sore intense participation in tl:e
advanced sciences in private schools as compared with public schools. In
contrast, public school students were more likely to have participated at
more general or limited levels than were private school students. 28/
5.2 Student Performance and Experiences
Two meaeures are typically used to azsess student performance: (1) grade
average and (2) scores on standardized tests. These measurers are examined
with respect to science course-taking patterns in Tables l5 and 16. Stu-
dent experiences, as meaaured by participation in extra-curricular acti-
vities, are presented in Te-)lo 17.
'he findings in Table 15 suggest that students who had parti,:ipated at a
core advanced le.el in the sciences had higher overall grads averejes than
did c_)thLr students. For example, a significantly higher percentage of
Acience concentrators had an overall grade average of B or higher
(67.1) percent) than did 4-year college bound (42 percent), general
science st.;ients (18.7 percent) or non-participants/limited participanta
Estamate for other pl-lvote school. students may be less accurate than
others because of the small sample size and lower response rate.
-47-

TABLE 14: PERCENTAGES OF STUDENTS WHO EXHIBITED SPECIFIED SCIENCE COURSE-TAKINGPATTERNS, BY 9:1.001 TYPE: 1981-82
Science Course- School Type
TokIng Pttern PulpIld Catholic Other Private
Concentrator 6.5 17.3 14.9
4-Year COlisig. Bound 26.6 38.4 35.9
General Scienc
Student 48.0 39.6 42.6
POn -participant or
Limited Participant 17.0 4.5 6.7
*Estimates for other private schools may be less accurate than othersbecause of the small sample size and lower response rate.
BEST COPY AVAILABLE
T Ai3L. L t L : Nf Aik S C STUDENTS el TN OVERALL GRACIE AVERAGES AT SPECIFIED LEVELS,
13Y SCIENCE. (IAA SL -TAKING PATTERN: 1981-432
Overal l Grate,
Avera;,e
Science Cour se-Tekin Pattern
Concentrator
4-Yaer
C.c.1 iege
Sound
Genera
Sc halve
Student
San-portIc I pant or
Limited Partici ant
A 1.0 .4 0.0 .1
A- 32.4 16.3 4.1 2.8
13 53,7 2..1 14.6 7.7
U- 23.0 L1.4 26.2 23.8
C 8.6 19.5 34.1 33.9
C- 1.4 7.4 18.2 25.9
0 0.0 .8 2.8 5.8
0- 0.0 0.0 0.0 0.0
F 0.0 0.0 0.0 0.0
BEST COPY AVAILABLE

I
(10.6 percent). Conversely, a majority of general scie..ce students andnon-participants/limited participants earned overall averages of C orlower (55.1 percent and 65.6 percent, respectively) in contrast to concen-trators (10 percent) and 4-year college bound students (27.7 percent).
As with mathematic*, there was strong relationship between sciencecoursetaking patterns and students' cognitive teat scores (sae Table 16).A large majority of science concentrators scored in the highest quartile(nearly 80 percent) as compared with the other classifications of stu-dents. Moreover, when the third and highest quartiles are taken together,the scores of nearly 95 percent of all science concentrators are repre-sented as compared with 42.1 percent of general science students and39.2 percent of non-participants/ limited participants.
Table 17 aummarizes information on students' participation in variousextracurricular activities by science course - taking pattern. Concentrators were far more likely to participate in varsity aporta, otherathletics, and honorary clubs than were other classifications of students.Concentrators and 4-year college bound students were more likely thanother at1:7ents to be involved in school newspaper/yearbook activities,serve on the student council/government, and participate in service clubs/community service activities. As was found with respect to mathematics,general science students and non-participants/limited participants weremore likely to be members of vocational education clubs.
5.3 Postsecondary Plans and Aspirations
Only a few differences emerged with respect to the activities that stu-dents expected to engage in for the first year after graduation (see Table16). General science students and non-participants/limited participant&were significantly more likely than others to anticipate working full-time. Furthermore, non-participants/limited participants were somewhatmore likely to anticipate attending a trade or business school than wereconcentrators, while concentrators and 4-year college bound students ex-prflased d fa. greater likelihood of attending a 4-year college or-nivigraty.
$nrf

TABLE 16: PERCENTAGES OF STUDENTS WHOSE CO*POSITE VOCABULARY, VERBAL, AND
loNTHEOKTICS TES1 SCORES FELL INTO 114E LOWEST, SECOND, THIRD, AND HIGHEST
QUARTILES, BY SCIENCE COURSE-TAKING PATTERN: 1981-82
Science Course-Taking Pattern
4-Year General
Tort Sccro College Sc lens Non-participant or
Quartile Concentrertor Bound Student Limited Participant
LOWS St Quarts I .5 7.2 26.5 40.0
Second Quart 1 lo 4.7 15.1 31.4 30.7
Third Quar-ti le 15.1 31.3 27.1 21.6
Highest Quart i le 79.7 46.4 15.0 7.6
BEST COPY AVAILABLE

TALE 11: PENCENTWAS OF srumxis WHO HAD PARTICIPATED IN siotoriro Eno-cuomicuuto ACTIVITIES, BySCIENCE COURSE-TAK1NG PATTERN: 1901-82
Science Course-Taking Pattern
Extra-Curricular
Activit, Cencentretor
4 -'leer
College
Ociend
General
Science
Student
Nom -perticipant or
Limited Participent
Varsity Athletics 51.4 39.3 30.1 26.9Other Athletic Teems 50.8 43.0 38.7 35,6Cheerleeding, Pep Club 13.5 14.1 14.4 11.2Debiting or Drums 18.9 14.9 11.5 9.5Band er Orchestra 17.5 11,0 12.6 11.6Chorus or Dance 16.5 19.0 20.4 20.0Nobily Clubs 1V.0 19.2 18.7 21.1Newer, Clubs 42.6 25.1 8.5 5.6Scheel Newspaper/Yearbeek 26.9 21.9 15.1 12,5School Sik.lect-Wettirr Clubs 74.1 25.2 18.6 16.7Student Cemicil/Goveramemt 24.8 21.8 12.6 10.6Vocational Edecition Clmbs 7.3 17.6 33.2 25.3Youth Cameaity Organizations 21.6 20.4 13.5 15.5Church Activities/Youth Groups 41,2 40.4 35.1 30,2Junior Achievement 4.6 4.9 6.0 6.8Service Clibs/Cammenity Service
Activities 25.2 19.7 12.5 11.6SiroritiestFreternities 2.2 2.8 2.4 3,2
BEST COPY AVAILABLE4

TAKE 16: PENCENTAGES OF STUDENTS WHO EXPECTED TO ENGAGE IN SPECIFIED ACTIVITIES FY THE FIRST' YEAR AF1TNGRADUATION, SY SCIENCE COURSE-TAKING PATTERN: 1961-82
Activity That Will Take The
Largest Share of Time The
Year After High School
Scfeece Course-Taking PetVerm
Concentrator
4-Year
College
bound
General
Sciatica
Student
Non-participant or
Limited Participant
Working full-time 5,4 17,6 40.6 46.4
Apprentice or on-Vie-jolttraining 1.1 1.5 2.5 2.5
Regular military servicefor service ocode4y) 1.9 2.9 4.6 6.9
full-time homemaker 0.0 .9 1.7 2.5
Taking courses full-timeor part-timm at:
A trod* or business school 1.3 4.7 7.3 9.5
A Junior or communitycollege:
Academic courses 6.3 11,9 9.3 7.2
Technical courses 2.0 4,0 5.3 4,5
A 4-year college oruniversity 77.6 52.3 22.5 12.2
Molting part-time, but notettendirtg ackuoi 1.2 2.0 2.5 2.5
Other (travel, take a break,no plans) 1.3 1.9 3.5 3.7
BEST COPY AVAILABLE

When asked about their educational expectations, a significantly higherpercentage of general science students and non-participants/limited parti-cipants stated that they expected their formal education to end withgraduation from high school (see Table 19). A larger percentage of thesesame student. stated that they expected their education to include voca-tional, trade, or business school than was indicated by concentrators and4-year college bound students. As expected, concentrator. and 4-yearcollege bound students were sore likely to state that they expected tocomplete college or earn en advanced degree.
As the findings in Table 20 indicate, there were few marked differences inthe occupational aspirations of science participants across the differentcourae-taking patterns. Regardless of their course-taking pattern, thelargest percentage of students saw themselves as being a professionalwithout an advanced degree at age 30. However, a larger percentage ofconcentrators expressed these aspirations than did other classificationsof students. Science concentrators were also more likely to aspire toprofessions requiring an advanced degree. On the other hand, non-partici-pants/limited participants were acre likely to see themselves in a cleri-cal or craftsman occupetion at age 30 than were science concentrators andthe 4-year college bound.
Science concentrators differed from other students with respect to thefield of study they planned to pursue in college (see Table 21). Concen-trators were more likely to identify architecture, engineering, the bio-logical and physical sciences, and pre-professional fields as their plao-need area of college study. At the same time, concentrators ..ere lasslikely to study business, art, and music. Won-participants/ imitedparticipants c.ire more likely to identify vocational/technical studies antheir planned college curriculum.

14MLE its POICEMIAGIES OF 47110111T1 W040 EMPECTO TO 00TAIN SPECIFIED KINN AND LEVELS i1F EINCATION, ST Sc1ENLX
asks St -TM 1442 PATT 42111: MI 42
Ethsgs414w41
Expoctotleo
Seem* Cowes-Td 1ov Pot*ors
Coorootrortor
4 -Veer
College
044mod
Chloorof
Schwab
Shodobt
Umo-por/IcIpowf or
LholbodPerocIpoort
Boas tkos 1410 $ es 4,4141.41 .2 .2 .5 1.7
$10 Wolof Orbimotho
volootIosol, trade or
1.2 7.9 23.1 12.0
Swifts* *deaf
Altar N1ob ScObsol-
loos Men 2 *oars .2 S. S 1;.1 11.7
Two or Nino Wars 1.1 0.5 15.4 11.1
Collage - tom 'boo 2 *oars .2 2.0 4.0 3.9
Colknow - 2 or sieve Veers 10.0 19.4 Mb.* 19.0
Co11ego CooplotIolo - 4 or S Voir
DI;IF 37.0 9'5.0 17.2 10.1
obstor's Oporto* or folOviefoot 18.5 0.0 3.11
Ph.D., M.O., or Otbor A/wowed
Prolossional Degree 25.1 11.0 4.2 2.$
7 7 BEST COPY

TABLE 20: PERCENTAGES nr STUDENTS mwo rmilcirn TO HOLD SPECIFIED JOSS OR OCCUPATIONS MEN 30 runs OLD, BY SCIENCECOURSL-TAKIN0 PATTERN: 1091-92
Science Comrse-Taking Pattern
9-Year General
College ScienveConcentrator Sound Stedeet
Clerical
Craftsman
Farmer, Farm Manager
MOmenaker
Laborer
Manager, Administrator
II
Military
Operative
Prof/Moan - No Advanced Degree
Professions! - Advanced Degree
Proprietor or Owner
Protective Service
Sales
School Teacher
Service
TechnIca;
Net Working
Non-partfcipaal or
Limited Participant
ircmpatlen
.9 4.5 11.9 11.S
.8 3.6 9.1 12.91,7 1.5 2.0 2.9.3 2.3 2.9 3.6.2 .6 1.7 3.5
5.3 9.3 8,0 7.11.2 1.6 2.6 2.9.6 1.4 4.4 4.6
41.2 33.9 22.1 19.729.0 13.1 5.7 3.11.1 3.B 5.3 6.1.7 1.6 t.4 2.1.7 1.9 2.2 1.6
2.6 4.1 3.5 Z.3.6 2.1 S.4 6.2
12.7 13.8 9.9 9.3.1 .3 .9 1.0
BEST COPY AVAILABLE
I

TABLE 21: MORON/A/ZS or OOLLEGEOBOLM STUDENTS 14NO PLANNED TO ENROLL IN SPECIFIED FIELDS OF STUDY, BY SCIENCE
COURSE-TAKING PATTERN: 198142
Field of Study CoPc n rator
Schiele, Guar.. -Takl
4-Yea-
College
Sound
Patter
rofterai
Scionco
Student
Ilion-participant or
Limited Participant
Agriculture 2.6 2.1 2.6 1.9
Architocture and Engineering 26.2 10.8 6.3 6.7
Art end Music .8 6.1 7.3 10.0
Biological and Physlcal
Sciences U.S 4.4 1.7 1.0
Susie's, 9.4 20.0 26.3 20.1
Communications 1.8 3.6 3.2 4.0
Computer and Information
&cloacae 10.6 8.5 7.2 9.2
Education 2.8 4.4 4.3 3.2
Enillsh and Foreign Languagos 2.2 2.7 2.4 1.2
Ethnic and Into--
disciplinary Studies .1 .2 .1 .2
Health Occupations 3.7 5.4 5.5 2.9
Health Sciences 7.6 6.6 5.8 2.9
Home Economics 0.0 1.4 2.7 3.5
Notheinstics 1.4 .7 .7 .3
Philosophy and Religion .4 .4 .4 .1
Pre-Ptofessional 12.1 7.6 3.6 2.0
Psychology and Social Solemn' 3.6 5.8 5.6 5.0
vocationai/TedlnIcal Studies 1.6 5.1 8.5 13.5
Other 3.4 4.5 7.9 10.4
BEST COPY AVAILABLE
-57-
i .7
CHAPTER 6
CHARACTERISTICS OF STUDENTS EXHIBITINGVARIOUS COURSE-TAKING PATTERNS IN VOCATIONAL EDUCATION
The anaLysit that was performed relating mathematics and 'science course-taking patterns to selected student characteristics was replicated for thevocations =t.oucation patterns. The findings of this analysis are sum-marized in this chapter.
Because intense participation in vocational education was typically asso-ciated with less intense advanced study in mathematics and science, it wasexpected that the characteristics of vocational education concentretorsand limited concentrators would resemble those of general level mathema-tics and science participants and limited/non-participants in the othersubject areas. Conversely, the characteristics of vocational educationsamplers and non-participants were expected to resemble those of mathema-tics and science college preparatory students (concentrators and .4.-yearcollege bound). For the most part, the findings summarized in the follow-ing sections support this expectation.
6.1 Socic.-demographic Attributes
There were few differences between males anc.., females with respect tovocational education course-taking patterns (see Table 22). There was,however, a difference with respect to vocational education concentration;a slightly higher percentage of females than of males had earned four ormore credits in a single vocational education instructional program.Males were overrepresented among the non-participants.
The relationship between the vocational education patterns and 5E5 foundin Table 22 was opposite that of mathematics and science. A higher per-.7entage of low SES students as compared with high SFS stu,,ents wereconcentrators and limited concentrators, while he reverse was found withrespect to vocational samplers. Although high SES students representedtpproximately 25 percent of the total student population, they accountedfor nearly 48 percent of the non-participant- in vocational education.

TABLE 22; FIRCENTAGES OF STUDENTS NNO EXHIBITED SPECIFIED VOCATIONAL EDUCATION COURSE-TAKING PATTERNS, BY
SEX. SCC10.-EOONONIC STATUS, AND RACE/ETHNIC1TY: 1981-82
Vocational Education
Course-TseIng
Pattern Miele Fecel
Sex Socio-economic Status Race/EthnIcIlry
Loge NIddi High White biocit Hispanic/Other
Concentrator 22.8 26.7 34.2 26.8 11.9 25.1 22.2 c).(+
(45.4)-a/
(54.6) 134.5) (53.4) (12.1) (73.6) (10.2; (16.2)
United Cons sontrator 25.6 25.3 29.3 27.8 17.5 24.3 29.8 27.b
(49.6) (73.4) (28.8) (54.0) (17.3) (69.4) (13.3) (17.4)
Sesplwr 46.4 44.3 58.8 42.3 62.6 46.2 44.1 42.2
(50.5) (44.5) 118.7) (46.4) (34,8) (74.1) 111.03 (14.9)
Ndn-portIcIpant 5.3 3.) 2.6 3.1 8.0 4.4 1,9 5.2
(58.6) (41.4) (16.3) (36.25 (47.5) (71.6) (9.8) (18.6)
The figures in parentheses represent the perceniege of students within each Fortier', who possessed the
designated characteristic, For example, among vocational education concentrators, 45.4 percent were
male and 54.15 percent were female. BEST COPY AVAILABLESi

Regardle,- of receiothnicity, students exhibited about the same vocationaleducation course-taking patterns. This finding differed markedly fromthat of matIlesatics and science, where race/ethnicity was strongly likedto course-taking behavior in those subject areas.
Because few private schools had offered vocational training relative topublic schools, it is not surprising that public achool students were morelikely than private school students to have a strong vocational focus orinterest (see Table 23). About 54 percent of the public school studentswere vocational education concentrators or limited concentrators as com-pared with about 20 percent of the Catholic school students and about 18percent of the other private school students. On the other hand, studentsattending Catholic schools were more likely to be vocational samplers thaneither public school or other private school students. Approximatelyeight percent of the Catholic school students and four percent of thepublic school students had earned no vocational credits, as compared withalmost one-fourth of the other private school students.
6.2 School Performance and Experiences
The overall grade averages of students differed significantly across thevocational education course-taking patterns (see Table 24). A smallerpercentage of concentrators and limited concentrators earned an averagegrade of B or higher as compared with samplers and non - participants.About 45.6 percent of the non-participants earned an overall grade averag.,!of B or higher as compered with about 22 percent of the vocationaleducation concentrators. When the percentages of students who had earneda C average or lower are compared, the reverse pattern was found.
The relationship between the second indicator of student performance,cognitive test scores, and vocational education course-taking patterns issimilar to that of grade average (see Table 25). Only 10.4 percent of theconcentrators' scores on these teats placed them in the highest quartilecompared with nearly 65 percent of the non-participants. The percentageof theme students whose teat scores fell in the lowest quartile" were28.3 percent and 11.7 percent, respectively.
-60-
r.

TARLE 23: PERCENTAGES OF STUDENTS 1040 EXHIBITED SPECIFIED VOCATIONAL EDUCATION
ODURSE-TAKING PATTERNS, SY SCHOOL TYPE: 1981-82
Vocsticolel Educstlor
Courlup.Taki Pettern
School T
Public Catholic Other Privet.
corcentreter 16.6 10,6 '.0
L1e!ted Concentrytor 27.2 9.5 12.8
Sawier 42.6 71.7 59.8
Ian -part iCip,nt 3.5 6.3 22.4
6I
BEST COPY AVAILABLE

BEST COPY AVAILABLE
TABLE 24: PERCENTAGESOf STUDENTS WITH OVERALL GRADE AVERAGES AT SPECIFIED LEVELS.
BY VOCATIONAL EDUCATION COURSE -TAKING PATTERN: 1981-82
Vocational Education Course-Talkini Pettern
Overall Grade
Average Concentrator
Limited
Concentrator Sampler Non-participant
A .2 .2 .3 .5A- 6.5 5.0 13.6 21.08 15.6 13.3 22.0 24.1B- 28.0 27.8 25.3 26.8C 31.7 33.5 23.1 16.5C- 16.2 18.2 42.9 6.40 1.9 2.1 2.8 4.80- 0.0 0.0 0.0 0.0F 0.0 0.0 0.0 0.0

T ABL. E 25: PERM NT AGES OF ST LIDENTS WHOSE ODP,P0 Si TE VOCABULARY, VERBAL, AND MAT TICS
TEST SCORES FELL INTO THE LOWEST, SECOND, THIRD, AND HIGHEST QUARTILES, BY
VOCATIONAL EDUCATION COURSE -TAXING PATTERN: 1981-82
Vocationa 1 Education Courser-781d ng Pattern
Test Sc ore Limited
meiratcr af-rici ant
Lowest Quart i 1 28.3 26.5 13.7 II.?
Second Qu art i I e 34.7 27.8 17.7 9.1
Third Quirt I le 26.7 26.2 $4.4
Hi ghost Quarts i 10.4 17.7 42.4 64.8
BEST COPY AVAILAS1E

The findings in Table 26 suggest that students who had concentrated invocational education in high school participated to a lesser extent thenother students in many extra-curricular activities. Concentrators and/orlimited concentrators were leas likely to have participated in varsityathletics and other thlottic teams, arta activities (e.g., drama, band,orchestra, chorus, end dance), honorary, autject-matter, and serviceclubs. student government, and the production of the school newspaper/yearbook. Not surprisingly, concentrators and limited concentrators weremore likely to have participated in vocational education clubs.
G.2 Postsecondary Plans and Aspiration&
Table 27 presents the short-term plans of students in each of the fourvocational education course-taking patterns. As was expected, the largestsingle activity that concentrators and liaited concentrators indicatedwould take moat of their time the year after graduating from high schoolwas full-time employment. Thus, in all likelihood, their concentration invocational courses was in preparation for entry into the world of work.The second most commonly cited activity by these students was attending a4-year college or university; 16 percent of the concentrators and 22 per-cent of the limited concentrators stated that this activity would occupythe largest share of their time. In contrast, 4-year college attendancewas cited by about 49 percent of the vocational education samplers and64 percent of the non-participants as the activity that would take thelarg4..5t share of their time the year after graduation. Slightly sore thannine percent of the concentrators and eight percent of the limited concen-trators indicated that they would take full-time or part-time courseworkat a trade or business school.
Given the high percentage of concentrators and limited concentrators whoindicated that a full-time job would occupy most of their time the yearafter high school graduation, it is not surprising that a larger percent-age of t'lese students expected to terminate their fox-eel education withhigh school (see Table 26). Similarly, it is not surprising that a largerpercentage of students in the two concentrator categories expected toatten1 a w_)cational, trade, or business school for some period of time ascompared with samplers and non-participante. Samplers, and non-partici-pants were about equally likely to expect to complete college, but a

TAKE 26: PfNCENTAFALS OF STUDENTS WO 1440 PARTICIPATED IN SPECIFIED EXTRA-CUNNICULAN ACTIVITIES. 11Y
VtXATIONAL EDUCATION COUSSE-TAIL ING FATTERN: 1961-52
'Vocational Education Course-Tab, Pattern
Extra-CurricularActivi oncentrstor
LimitedConcentrator Per Non rtici
Varsity Athletics 25.2 33.1 39.7 43.9
Other Athletic Team 32.0 42.1 44.2 45.1
Clwer leading, Pap Club 13.6 13.6 14.2 11.2
Debating or Drava 6.5 10.6 16.6 27.9
Rood or OrchaFtra 10.5 10.2 17.7 22.3
Nom or Dame 14.4 17.0 22.8 21.9
liobby Clubs 17.6 19.6 19.7 19.7
Nomerary Clubs 10.0 4.9 22.3 30.2
School liestspeperflearliook 12.1 13.5 22.0 32.5
School SubJect-Platter Clubs 16.3 19.1 22.4 29.3
S bitilllt COW 1101 /UV* nuotat 10.4 12.4 20.4 24.3
Vocational Education Clubs 41.5 31.2 11.3 4.4
Youth Community Organizations 13.3 14.S 19.2 20.2
Church Activities/Youth GrOVID S 32.2 36.2 36.5
Junior Achievement 5.0 5.3 5.9 8.2
Service Clubs/Cormunity Service
Activities 10.6 12.4 19.4 25.3
Sorori ties/Freterni tles 2.6 2.2 2.5 2.7
BEST COPY AVAILABLE
I
is

TABLE 27: PERCENTAGESOF STUUENTS W000 EXPECTED TO ENGAGE IN SPECIFIED ACTIVITIES FOR THE FIRST YEARAFTER GRAMATION, OY VOCATIONAL EDUCATION COURSE-TAKING PATTERN: 1901-82
Vocational [(location Coors,- Taking PatternActivity That Will Take The
lamest Shore of lime the
Year After NtgI SchoolConcentrotor
Limited
Concentrator Sampler Non-DarticipantWorking full-time
47.5 39.4 21.0 14.8Apprentice or on-the-job
training
aeiolar military service(or service scademy
1
2.8
4.8
2.8
4,3
1.5
3.9
.4
2,8Full-Ose homemaker
1.1 1.?!2.0
Toting cosines /ell -timeor part-ti.v at:
A trace or Nosiness school9.1 A.4 3.9 2.7
A junior or commmnitycollege:
AC 11441141 C C awrubs 8.2 9.5 10.8 7.3Technical courses 4.9 6.0 3.8 1.1A 4-year collet, or
university16.0 22.3 49.3 64.4Working part-ti... Not not
sttendino voile!4.1 2.0 2.4 1.5
Other gravel. take a breonk.no plansi
2.9 3.5 2.5 1.2
BEST COPY AVAILABLL
r

Pal
4
318111WAV ActO3 IS32
'AZ L 6
6' L'1
I ' 9 A's
I'61 I'll
110 OL, Vtit. , S
1,0 040 .PW alwW JO O'ss Vat
0.10 ! MO 1 OSA MO 1 . 0400
.1"A 6 4,9 i - / es 1 93190 0661 I 90
9 -9 CPI L I 1'91 Amu -10 t - 6601 1:13
Z 01" I C'C II s.aA T smswi stisl - d 00
9'9 6 L L' / tr 91 s.sfoi Jim Jo O
6. 111' L 9' I I
G, s
a'
064111,134641-sscys J1616106
I i SOA 1 611164 VS01
-.0343S OM
0044.3c Blau 1s Mg
03 aye ' 1 IsW i so ./oA
I ISZ 00 I 4 API elf I 004-6 49 1 H
obi VINPIIM VS IN New 11***1
.16#11 iteC61110 "ILO 44.603041e)
094 1+11
va43s4 lIss1vel-ss.ewo3 Notee3sy3 jessoleaalm
slowsomi
*al 11+311ba
1,2.0)1413.)
111-1061 AlL111116: 1111111/1- KIM 1101 1rY1a:3
ISS011iralt AS 40)11r3IL1I SIMI1 GOV MIS 413141311 IIISMIO d GIL3i410 SIIIVAIIXS1111 ;St I VIVI

1oreer percentage of non-participants expected to attain an advanced
''able 29 relates the expected fobs or occupations of students whenyears old to their vocational education course-taking patterns. Overall,tne occupational aspirations of students exhibiting the different patterns,e participation were fairly similar. There were, however, some excep-teene. Concentratore were more likely than others to indicate that theireecupation at age 30 would be clerical or that they would be craftsmen.f' ::r there is a steady increase in the percentage of students whoeee.cated that they would be a professional by age 30 as one moves fromIntense concentration to non-participation in vocational education courses.fs exemple, non-participants were three times as likely as concentrators toetmte that they expected to in a professionalposition at age 30.
AP the findings in Table 30 indicate, there were few substantial differences7eperted by students in the different vocational education participationentegories with respect to their planned field of study at a college ornne.,ersity. Exceptions to this finding included business, pre-professional,,Ind vocational/technical studies. Approximately 32 percent of the vocation-education coJcentratora indicated that they planned to study business ascompared with about 13 percent of the samplers and 12 percent of the non-p..-ticipanta. A smaller percentage of the concentrators and limited concen-ttatore stated that they planeee to enter a pre-professional curriculum ascompared with the other class.. cations of the students. Needless to say,roncetration in vocational education during high school was related toelana t) pursue vocational/technical stediea in college.
i-,-ause a possible extension of high school vocational training is attend-,nee at a trade or vocational school, students were asked what spec ficof study they would pursue at suet- a school. The findings relating,el- responees to this inquiry to course-taking patterns are presented in31.
4,1) except Lon of vocational education concentrators, the largest perc of students in each of the course-taing categories stated that thehied nc, plans to attend a trade or vocational school. However, this wasstated more frequently by samplers and non-participants (44.1 percent and
e.

TABU 29: PMENTACES OF sTuorms WIG EXPECTED 10 NOLO SPECIFIED JOSS ON OCCUPATIONS %HEN 30 YEARS OLD, 8T VOCATIONAL
EDUCATION COURSE-TAKING PATTC811: 1981-82
*melon Ea duet Conrse-Tekee Pottara
Sircvpotlan_ Coacentretor
LIN'itad
Conoenireter
Cie/1:e,19.6 7.7 3.9 1.5
Craftsmen 13.3 8.3 3.9 2.8
Foraer. Fere Kloaver 3.6 2.4 .6 .9
NoseesKar 3.6 2.7 2.1 1.5
labor*,1.8 1.1 1.4 .9
Ninegar, AdelnIstrocor 7.2 1.2 6.9 6.8
Nelltery 2.0 2.6 ;.2 2.1
Operative 5.0 3.7 1.9 3.1
Professional - No Advanced Degree 16.4 24.7 33.2 37.4
Professional - Advanced Degree 3.0 6.2 14.6 22.5
Proprietor or Oviver 4.5 5.7 4.1 4.2
Protective Service, 1.5 2.5 1.9 1.1
Sehts :.2 2.5 1.9 1.0
School Toschor 4.2 4.2 3.6
Service5.1 6.0 2.7 1.4
Technics, 9.1 17.3 11.8 9.4
Wicrhing.8 .6 .5 0.0
11=....11I.1
H BEST COPY AVAILABLE

-
TA&E 30; PERCENTAGES OF COLLEGE-BOUND STUOiNIS WHO PLANNED TO ENROLL IN SPECIFIED FIELDS OF STUDY, BY VOCATIONALEDUCATION COURSE-TAKING PATTERN: 1981-82
Vocational Education Course-Taking Pat-tern
Field of Studnor ntrart or
Limited
Concentrator Sam ler rticloant
AgrIcu':ure
Architecture and Engfneering
Art and 04.1s1c
Biological end Physical
Sciences
3.6
10.2
4.7
1.1
3.2
8.4
5.9
2.3
1.6
11.5
7.2
4.7
1.5
14.9
7.0
7.7Business32.3 21.9 17,5 11.8
Communicationsi.5 2.2 4.3 5.8
Computer and Information
Sc fences7.6 9.5 8.1 7.1
Education3.4 3.9 4.5 2.6
English and Foreign Languages .8 1.2 3.2 5.2Ethnic and inter-
0 lac Ipl inary Studies0.0 .2
.1 .3Hmmitti Occupations 4.1 6.1 5.0 2.5Nfiltt Sclem:os
2.9 5.6 6.1 3.0Home Economics2.9 3.8 1.0 0.0Netbenotics .2 .4 1.1 .6
Philosophy and Plat lOon 0.0 .2 .5 1.2Pre-Professionat
1.5 3.0 8.4 12.1Psychology end Social Sciences 2.8 4.4 6.5 8.3Vocational/Technics; Studios 13.2 9.5 3.8 2.8Qt Nee
7.2 8.6 5.2 5.6
-70-s ;
TABLE 31: PERCENTAGES OF STUDENTS WHO EXPECTED TO TRAIN IN SPECIFIED FIELDS AT A TPADE ON VOCATIONAL. SCOW., NY
VOCATIONAL EDUCATION COURSE-TAXING PATTERW: 1981-82
Vocational Feucation Course Taking Pattern
Field of Study Concentrator
LimitedConcentrator Sampler
lion -
participant
Agriculture 3.8 3.2 1.6 1.7
Auto Mechanics 7.6 5.6 3.0 3.5
Commercial Arts 2.5 3.7 4,4 6.4
Computer Progremning Or
Computer Operations 9,0 11.6 11.3 8.4
Construction Trades 5.0 4.4 3.1 2.2
Plumbing .4 .4 .5 .2
Cosmetology, Hairdressing,
or 8a ering 5.2 S.3 2.4 2.2
Drafting 2.3 2.7 1.8 1.0
Electronic, 2.9 3.5 3.0 3.9
Home Ecor4 -, 2.0 3.1 1,3 0.0
Machine Shop 2.4 .9 .6 .3
Medical or Dental
Assisting/Practical
Nursing 4.9 8.4 7.4 4.5
Ouantity Food Occupations .7 .9 .5 .4
Sales or Merchandising 2.7 3.7 3.2 1.6
Secretarial, Stenograpnic,
Typing, or Other Office
Mort 18.4 6.4 3.3 1.5
Welding 3.2 3.1 .9 .3
Aviation 1.0 1.9 2,6 3,4
Refrigeration .4 .4 .3 0,0
Other
hon't Plan To qo To
7.? 5.8 4.9 5.1
Trade or Vocational
School 18.4 25.1 44,1 53.6
BEST COPY Av AUBE9 3
&
=-.
r

53.6 percent, reapectively) than by concenta-ators or limited concentrators(16.4 percent and 25.1 percent, respectively).
Among the concentrators, the moat frequcrntly cited field of study ct a tradeor vocational school was secretarial, stenographic, typing, or other officework, This was followed by computer programming or computer operation& endauto mechanics. Computer programming or computer operations was identifiedby the largest percentage of limited concentrators, &explore, non-partici-pants as the field they would moat likely study at a trsde or vocationalschool. Among the limited concentrators, medical or dental assisting/practical nursing were the second most cited fields of study. About sixpercent of the non-participant& identified commtrcial arts sa the field that
.
they would study t this type of school.

CHAPTER 7
CHARACTERISTICS OF STUDENTS EXHIBITING VARIOUS
COURSE-TAMING PATTERNS IN COMPUTER SCIENCE
Students were grouped according to whether they had or had not earnLi.d ely
credit in computer mtudies over their high school careers. These two groups
were then compared on a number of characteristics. The results are pre-
sented below.
7.1 Sc,c.( -Opmogranhic 1%ttributes
Table 32 relates computer science participation to several atudoet chmrac
teristics. A minority of both wale's and femaleft had warned computer science
credit (14 percent and 11 percent, respectively) . Females were slightly
underrepresented and males elightly overrepre&ented smoeg those students
earning such credit.
Participation in computer science was related to students' SES and race/
ethnicity. High SES students were twice as likely as low SES students to
have earned computer science credit (17.4 percent versus 8.4 percent,
respectively). White students were more likely to have earned computer
science credit than either black or Hispanic/other students. White students
represented about 73 percent of the total population of high school stu-
dents, yet they accounted for about 80 percent of those students who had
earned computer science credit. In contrast, students classified as
Hispanic /other rrpresented about 16 percent, of the etudent population and
accounted for 10 percent of the computer science participants.
Students who attended other (non-Catholic) private schools were less likely
to have earned credit in computer science Csee Table 33). There was no
significant difference .n the participation of public and Catholic ac:10 1
students.
7.2 School Performance and Experiences
As was the case with respect to more intense participation in mathematics
and science, student participation in computer science was related to
_73-

TAM/ 12: PIR(JhunCtS OF SYWENTS *10 EXHIBITED SPECIFIED COMPUTER SCIENCE COURSE-TAXING PATTERNS, BY SEX,SCCIO-CCUNDMIC STATUS, AND RACE/ETHNICITY: 1981-62
Compu ter en(
Cow- so- Ta,Ing Sew Soclo-sconomfc Status Rowe/EthnicityPe4ten Miele Female Low Middle PIO White Black Hispanic/Other
PortIcIpant 13.b 11.4 8.4 12.4 17.4 13.8 10.5 8.0
(46.3) (16.7) (48.7) (54.6) (80.2) (9.5) (10.3)
Man-prlIcIpart 86.4 88.8 91.6 87.6 82.7 86.2 89.5 92.0
(48.7) (51.3) (26.3) (499) (23.9) (71.6) (11.6) 116.9)
the flgurss In parentheses represent the percentage of students within each pattern who possessed thedos1gnsts4 cheractorlstic. For example, among computer science participants, 53.8 percent were maleend 46,3 ;ercent were female.
1
BEST COPY AVAILABLE
a
TABLE 33: PERCENTAGES OF STUDENTS WHO EXHIBITED SPECIFIED COMPUTER SCIENCE
COURSE-TAXING PATTERNS, BY SCHOOL TYPE: 1981-82
Computer Science School Type
Course-Taking Pattern Public Catholic Other Privet*
Participant 12.5 14.3 8.7
Nbn-par ticipant 87.5 85.7 91.3
BEST COPY AVAILABLE

various indicators of school performance. :hese findings are not surprisinggiven the strong association between computer science participation andcollege preparatory levels of participation in these other subject areas.Computer science participants had higher overall grade averages (see Table34) and scored higher on tests of cognitive ability than did non-partici-pants (see Table 35). For example, about 42 percent of the participants hadearned an average grade of S or higher as compared with about 26 percent ofthe non-participants. Computer science participants' test scores were high-ly skewed towards the two upper quartiles, while non - participants' scoreswere about evenly diatrituted across all test score quartiles.
For the most part, the extra-curricular activities of students participatingin computer science did not differ significantly from those of non-partici-pants (see Table 36). Exceptions included varsity athletics and otherathletic teams, chorus or dance, honorary clubs, and vocational educationclubs. Participants were more likely to have taken part in athletics andhonorary clubs, and were less :ikely to have taken part in chorus or danceand vocational education clubs.
7.3 Postsecondary Plana and Aspirations
With some exceptions, students who had participated in computer science didnot differ significantly from those who had not participated in this area ofstudy with respect to their immediate post-graduation plans (see Table 37).Student* who had earned some computer science credit were more likely thannon - participants to plan on attending a 4-year college or university (52percent versus 32.2 percent, respectively). A slightly higher percentage ofparticipants expected to take technical courses at a community or juniorcollege than did non-participants (6.6 percent versus 4.2 percent). More-over, participants were less likely to plan on attending a trade or businessschool. In addition, the percentage of participants who planned to workfull-time the year after graduation wee significantly smaller than that ofnon-participants (19.5 percent versus 33.8 percent).
When asked about the kind and level of education that they expected toattain, differeicea were found between pertic4ants end non - participants(see Table 38). Specifically, participants were more likely to indicatethat tiley expected to complete college or attain en advanced degree, while
-76-
,
9 L.,

TABLE 34: PERCENTAGES O STUDENTS WON OVERALL GRADE AVERAGES AT SPECIFIED LEVELS, BY
CONFUTER SCIENCE COURSE-TAXING PATTERN: 1981-82
°vocal! Grad
wxmgMampm,
Computor Science) Courelaktu Pelorn
A .7 .2
A- 18.7 8.6
a 22.7 17.6
B- 0.6 26.6
C 21.6 28.5
C- 8.0 15.8
0 .8 2.7
0- 0.0 0.0
F 0.0 0.0
BEST COPY AVAILABLE

TRIILE 35: PERCENTAGESOF STLVENTS WHOSE t7DMDOS I TE VOCABULARY, VERBAL, APC MATHEMAT I CS
TEST SCORES FELL INTO THE LOWEST. SECOND, TH IRO, MD HIGHEST QUARTILES* BTCOOPUTER SCIENCE COIRSE -TAXI NG PATTERN: 1981-82
Test Score
Quart 1 1e
Lowest Quertile
Second Quart!'
Third Quart Ile
Highest Quart) l
Com ut *r Science Course-Tek I Pattern
Particle:: Non-pert ic fps rrt
9.5
I% I
25.2
50.2
22.0
25.4
26.5
26. I
le

TABLE 36: PERCENTAGES OF STUDENTS WHO HAA PARTICIPATED IN SPECIFIED EXTRA -CURRICULAR
ACTIVITIES, BY COMPUTER SCIENCE COURSE-TAXING PATTERN: 1981-82
Gomputer Sciatic* Coursa-Taking Pattern
Extra-Curricular
Acflvity Participant Mon
Varsity Athletics 38.9 34.0
Other Athletic Ti i 44.2 60.1
CheerloadIng, Pep Club 12.2 14.0
Debating or Drama 11.7 13.1
Band or Orchestra 14.9 14.1
Chorus or Dance 15.3 20.2
hobby Clubs 19.5 19.2
HOnorery Clubs 23.9 15.0
School Newspaper/Yearbook 18.8 17.8
School Subject4ieter Clubs 21.5 20,8
Student Council/Gcmornment 16.3 16.1
Vocotional Education Clubs 16.9 24.7
Youth Community Organlzati.)ns 16.9 16.5
Church Activities/Youth Groups 34.4 36.8
Junior Achievement 5.0 5.7
Service Clubs/Communlil, vice
Activities 17.8 15.4
Sororities/Fraternities 2.3 2.7
BEST COPY AVAILABLE
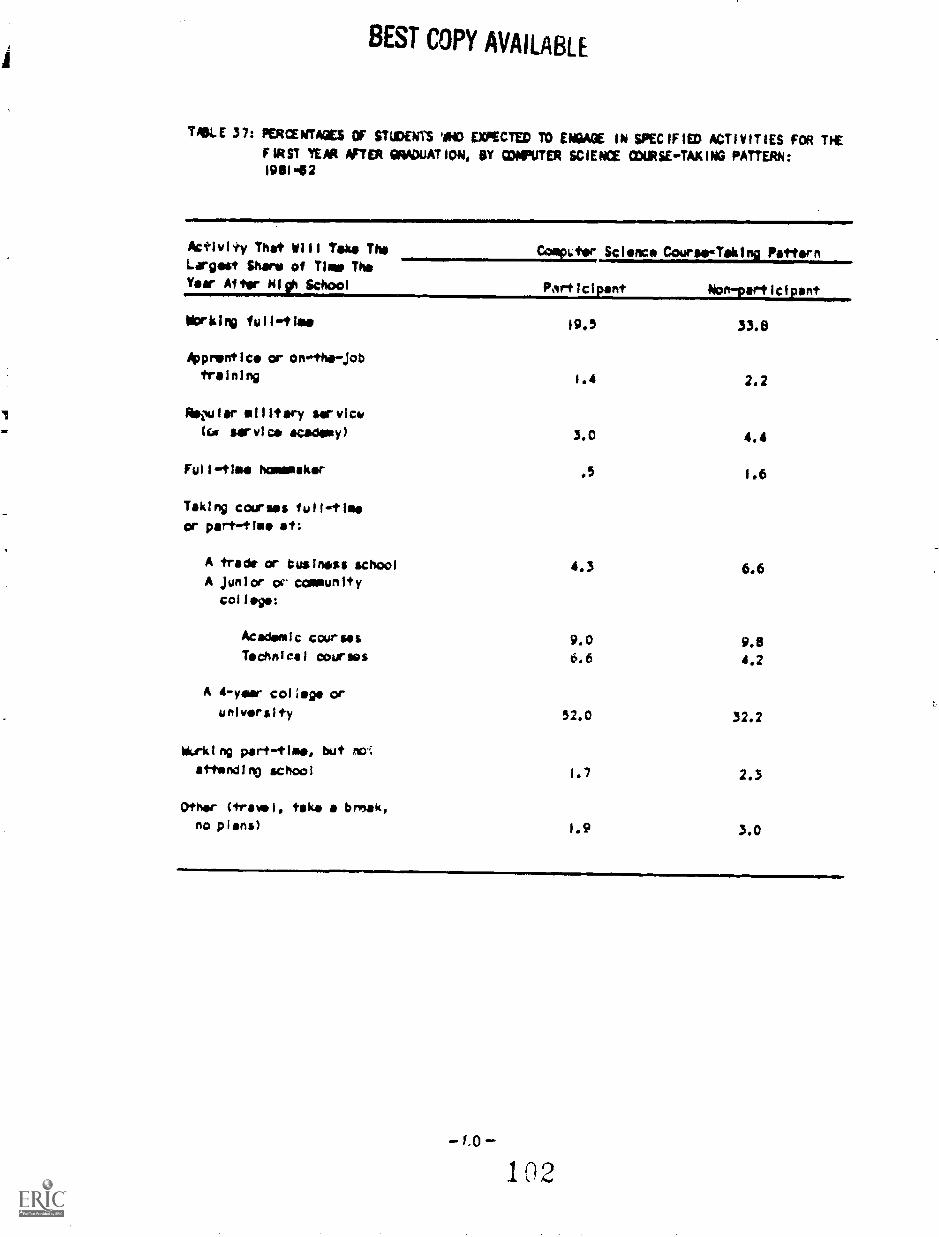
BEST COPY AVAILABLE
VOLE 37: PERCENTAGES OF STUDENTS W145 MEC= TO MAW IN SPECIFIED ACTIVITIES FOR TEEFIRST YEAR *TER GRADUAT ION, BY COOPUTER SCIENCE CURSE-TAXING PATTERN:191114 2
111111IM
Activi,ry That Will Yoke The CompL ter Sclence Course-Taking Pat forLargest Share of Time TheYear After NI School Part lc I nt No art icl ant
Working fulltIme 19.5 33.8
/apprentice or on..the-jobtraining 1.4 2.2
ReiNlar military smrvicyka service academy) 3.0 4.4
Full -time homemaker .5 1.6
Taking courses full-tieeor part-tle at:
A trade or business school 4.3 6.6A Junior cc coenunity
college:
Academic courses 9.0 9.8Technical courses 6.6 4.2
A 4 -year- col ;op oruniversity
ng part-tlae, but For;et-fending school
52.0
1.7
32.2
2.3
Other (trowel, take a break,no plans) 1.9 3.0
1,0102

non-participants were more likely to indicate that they expected to study
for some period of time at a vocational, trade or business school. Students
who had earned no computer science credit were three times es likely as
participants to identify high school graduation as the highest level of
education that they expected to complete.
Table 39 summarizes the occupational aspirations of computer science parti-
cipants and non - participants. In general, the aspirations of these two
groups were similar; however, a few differences were found. A larger per-
centage of participants planned to be professional or aspired to technical
occupations such as a computer programmer. In comparison with participants,
non-participants envisioned themselves more as a craftsman or operator
(e.g., meat cutter, assembler, machine operator, welder, taxicab, bus, or
truck by age 30.
The findings presented in Table 40 relate parti :ipation in computer science
to students' planned field of study at a college or univers3Ly. With few
exceptions, participation in computer science was unrelated to these plans.
Participants were more likely then non-participants, however, to indicate
that they planned to study architecture and engineering. Moreover, as would
be expected, par"-icipants were three times as likely as non-participants to
plan to study computer and information science.

BEST COPY AVAILABLETABLE 38: PERCENTAGES OF STUDENTS WHO EXPECTED TO OBTAIN SPECIFIED KINDS AND LEVELS
OF EDUCATION, SY CORNIER SCIENCE COURSE-TAXING PATTERN: 1981-82
Coe Course- Taking Pattern
Educational
ExpectationParl/ele.---tewt/E2:EELLELUIL__--
Lass than High School Graduation .2 .6
High School Graduation 6.5 19.9
Voce Iona!, Trade or
Business School
Al ter High School -
Lass Than 2 Yaws
Tiro or Nora Years
4.2 8.9
8.1 12.8
Co loge - Less than 2 Years 2.9 3.0
College - 2 or Kora Years 16.0 15.4
Collage Coo" 1 et Ion - 4 or S Year
Degree 35.5 21.5
Master's Degree or Equ Iva lent 15.9 10.3
Ph.D., M.D., or 0/1110r Advanced
Professional Degree 10.7 7.6
-S2-
104

TABLE 39: PERCENTAGES OF STUDENTS WHO EXPECTED TO HOLD SPECIFIED JOBS OR
OCCUPATIONS MIEN 30 YEARS OLD, SY COMPUTER SCIENCE COURSE-TAKING
PATTERN: 1981-1982
Coecuter Science Course-TakIni ^ Attars
Occupation Participant Non-participant
Clerical 7.0 8.9
Craftsman 2.9 7.9
Fanner, Fans Arnow 1.0 2.1
Homeeeker 1.9 2.7
Labarar .3 1.7
)111.10r, AdMittistratiror 9.1 7.8
Military 1.9 2.3
%Vera+ Ivo .6 3.6
Professional - No Advanced Decree 31.0 26.4
Protesslohal - Advanced Degree 12.8 9.5
Propriety ce Oa nor 3.1 4.5
Protective Service 1.0 2:
Sales 1.5 1.9
School Teacher 2.9 3.5
Service 1.7 4.4
Technical 21.0 9.7
Not Working .3 .7
BEST COPY AVAILABLE
105

TABLE 40: PERCENTAGES OF COLLEGE-801M STLINNTS WO PLANNED TO ENROLL IN SPEC IF 1EDFIELDS OF STUDY, BY ODNPUTER SCIENCE COURSE-TAKING PATTERN: 1981-82
HJt.r SCiO4C Course - Taking Pattern
Field of Study
Participant NofIlert lc I pant
Agriculture i.5 2.5
Architecture and Engineering 13.3 10.1
Art and Music2.2 7.1
Biological and Physical
Sciences 4.5 3.3
Business 24.0 20.8
Communications 1.5 3.6
Computer and information
Sciences 19.2 6.3
Education 3.3 4.1
English and Foreign Lalgueges 2.0 2.4
Ethnic and Inter -
disc ipl !nary Studies .2 .1
Health Occupations 2.5 5.4
Health S,:lerces 4.7 5.2
Hoe* Economics .9 2.2
Mathemat I cs I.0 .7
Philosophy and Rol I g Ion .1 .4
Pr.-Professional 6.0 5.8
Psychology and Social Sciences 4.5 5.5
Vocational/Technical Studies 7.3
Other 3.3 7.0
-84-106
BEST COPY AVAILABLE

CHAPTER 8
CHARACTERISTICS OF GENERAL EDUCATION STUDENTS
The finding& of the analyses performed to determine the characteristics of
general education students are reported in this chapter. As discussed in
Chapter 2, the analyses of general education students relied upon the de-
finitions of student program participation established by the students
themselves. Nationwide, about 35 percent of secondery'school students de-
fined their high school program in this way. For comparison purposes. the
characteristics of students participating in all other types of programs
were aggregated and analyzed. Tables 41 through 49 present the results of
these analyses.
8.1 Socio-demographic Attributes
A larger percentage of males (36.4 percent) then of females (32 percent) had
participated in a general education program (see Table 41). General educa-
tion students were also more likely to come from a lower socio- economic
background than were students in other programs. High SES students were the
least likely to have participated in a general education program and ware
underrepresented in this program relative to their representation in the
total student population.
There was no difference in the percentage of white and black students who
had participated in a general education program. Moreover, each was repre-
sented within this type of program about equal to their representation in,
the student population. While the percentage of Hispanic/other students
among the population of general education students equalled their represent-
ation in the total student population, a larger percentage of these students
had participated in this type of program than had either white or black
students.
As the findings in Table 42 suggest, general education participation was
related to the type of school attended. Public school students (36.7 per-
cent) were more likely than Catholic school students (22.2 percent) or other
private school students (11.2 percent) to have participated in general
education program.-85-
1 0 7
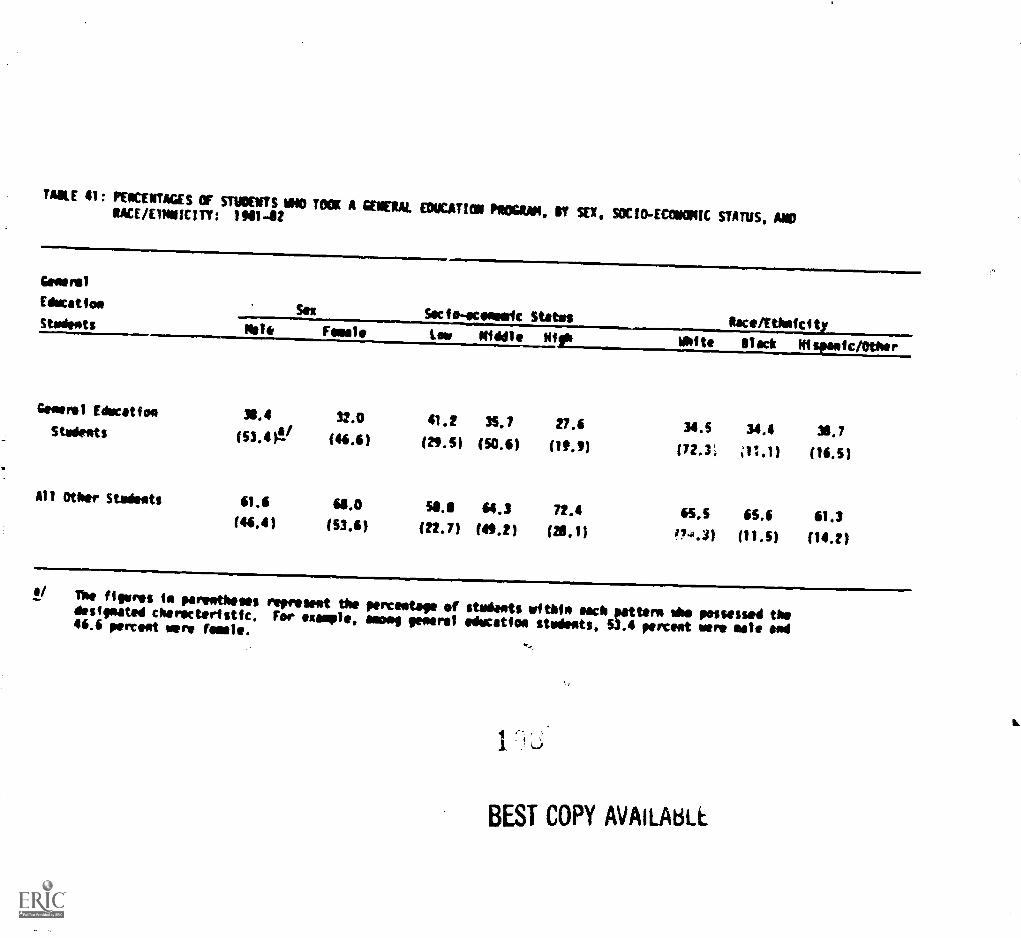
TAKE 41: PKACIXTAGES OF SNOUTS 1410 TOOK A MEAI. EDUCATION INMAN, ST SEX,SOCIO-ECONONIC STATUS, AlRACE/E1NNICITY: 14111-112
General
Education SolSocio-economic Status
Itace/EthefcitStudents No 1ir Female Lew Middle Nila White litact NispaeictOther
Goners, Educatfoo 31.4 32.0 41.2 35.1 27,6 34.5 34.4 36.1Studetts (53,411/ (46.6) (29.51 (50.6) (19.5) (72.31 i11.1) (14.5)
All Other Studeets 61.6 64.0 56. 64.3 72.4 65.5 65.6 61.3(46.4) (53.6) (22.7) (4E21 (26.1) 174.3) (11.5) (14.2)
a/ The figures in parentheses represent the perceetage of students vials each pattern uhe possessed thedesignated cherecteristic. For simple, wool genre; edocatfon students, 53.4 percent sore sole sod46.6 percent mere female.rY
BEST COPY AVAILAtled
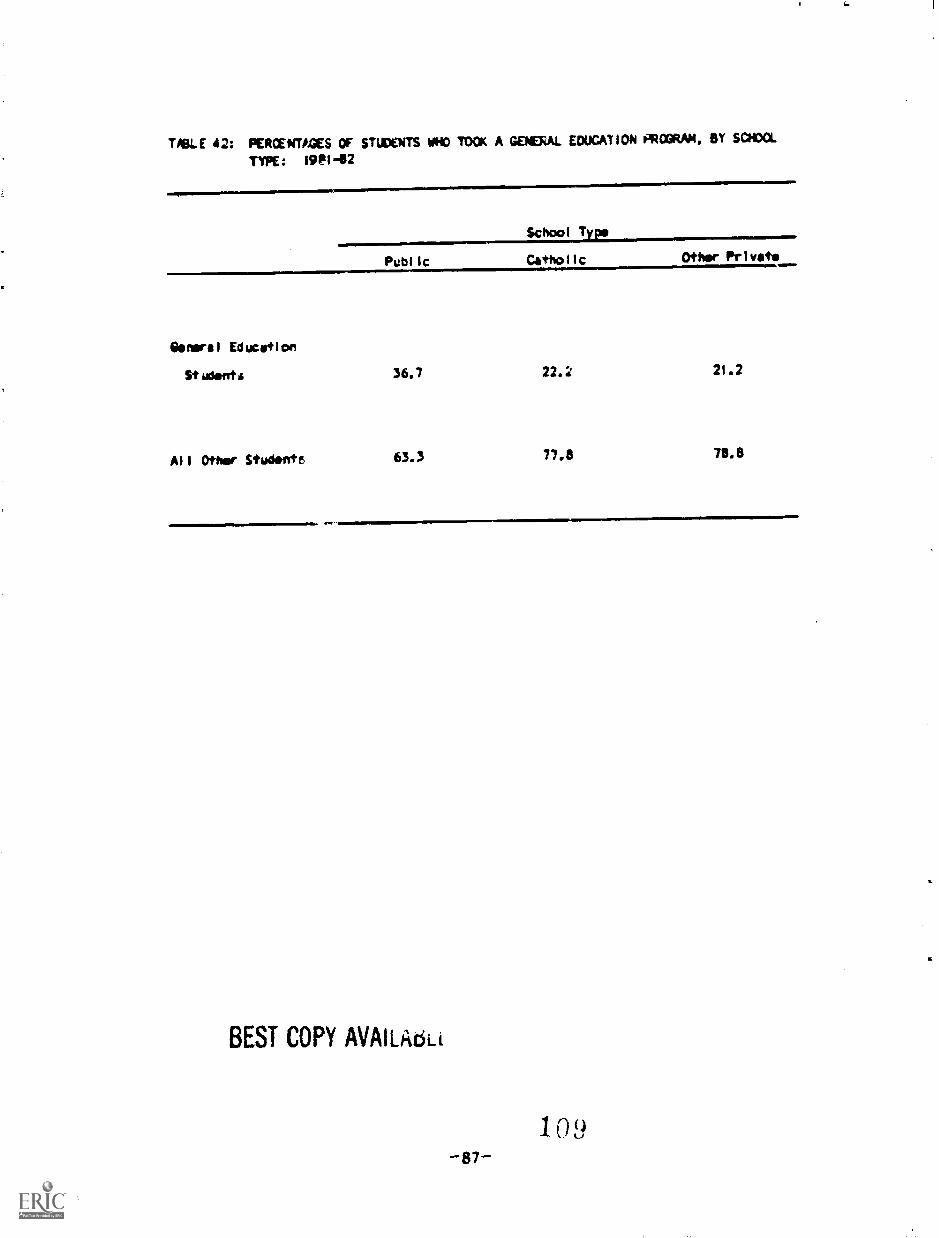
TABLE 42: PERCENTAGES OF STUDENTS WHO TOOK A GENERAL EDUCATION PROGRAM, BY SCHOOL
TYPE: MilP1-112
aPublic
School Type
Catholic Other Privets
General EducetIon
St udents 36.7 22.2 21.2
All Other Studeote, 63.3 77.8 78.8
BEST COPY AVAiliaki
87109
8.2 School Perftrmance JAd Ex2eriences
General education students did more poorly on the standard measures ofstudent performancegrade average and cognitive teat scores--than did stu-dents in cthLr high school progress (see Tables 43 and 44). Only 19 percentof the general education students earned a B average or higher as comparedwith about 34 percent of the other students. Conversely, 55 percent of thegeneral education students had a C average or lower, as compared with 38percent of the other students.
Students in a general education program were less than half as likely asother students to hove received scores that placed in the highest cognitivetest quartile (15.8 percent versus 36.5 percent, respectively). In con-trast, about one-fourth of the general education students had scored in thelowest quartile while less than one- fifth of the students in other programshad similar scores on tests designed to measure verbal, mathematics, ardvocabulary abilities.
General education students differed from other students with respect totheir participation in many extra-curricular activities (see Table 45). Forexample, they were less likely to have participated in varsity athletics,honorary clubs, production of the school newspaper/yearbook, school subject-matter clubs, and student government. They ware also less likely to havebeen involved in youth community organizations, service clubs, and communityservice Activities. Thus, their lower participation rates in these acti-vities reaemble those associated with general or limited/non-participants inmathematics and science.
8.3 Postsecondary Plans and Appr2tions
When students were asked about the activity that would take the largestshare of their time the year after high fAchool graduation, general educationstudents indicated more often than other students that they would workfull-time (39.9 percent versus 27.7 percent) (see Table 46). These twocategories, of students also differed with respect to expected attendance at4-year college or university; general education students were less likely
to indicate that their short-term plans included attending a 4-year collegeor university.
-88-1 1 1
TABLE 43: PERCENTADES OF STUDENTS IN A GENERAL EDUCATION PRODRAN WITH OVERALL
GRADE AVERAGES AT SPECIFIED LEVELS: 1981-82
Overall Grad*
Averale
General
Education
Students
Ali
Other
Students
A .2 .3
A- 4.9 13.0
e 14.1 21.0
B. 25.8 27.3
C 32.8 24.8
C- 14.5 11.7
D 2.8 1.9
0- 0.0 0.0
F 0.0 0.0
BEST COPY AVAILABLE
TABLE 44: PERCENTAGES OF STUDENTS IN A GENERAL EDUCATION PROGRAMMroSE ODMPOSITE VOCABULARY, VERBAL, AND MATHEMATICS TESTSCORES FELL INTO THE LOWEST, SECOND, THIRD, AND HIGHESTQUARTILES: 190142
Test Score
Quartile
Genera I All
Education Other
Students Student:.
Lousst QUICT110 24.7 10.0
Second Quartile 30.6 20.5
Third Quartile 29.0 25.0
HI Ghost Quartile 15.8 36.5
BEST COPY AVAILABLE
-90 -
112

LISLE 45: PERCENTAMS OF STUDENTS IN A GEWRAL EDUCATION PROGRAM WHO HAD PARTICIPATED IN
SPECIFIED EXTRA-CURRICULAR ACTIVITIES; 1981-82
Extra-Curricular
Activity
Genre,
Education
Students
All
Other
Students
Vers1,y Athletics 31.1 36.6
Other Athletic Teams 39.8 41.2
Cholrleeding, Pep Club 12.7 14.4
Debating or Drees 11.4 13.8
Sand or Orchestra 13.2 14.9
Chorus or Dance 19.5 19.5
Hobby Clubs :0.4 18.6
Honorary Stubs 1.4 20.4
School Nevapaper/filarbcc* 13.9 20.1
School Ubject-Mettor Clubs 17.1 22.0
Student Council/Government 11.9 19.1
Vocational Education Clubs 2;!.3 24.4
Youth ComunIty Organizations 13.4 18.4
Church ActivItlos/Youth Groups 33.I 38.5
Junior AcSlovement 5,4 5.0
Service Clubs/Community Service
Activities 12.,? 17.6
Sororities/Fraternities2.1, 2.9
11111111
-91-
BEST COPYCOPY AVAILABLE

PA
BEST COPY AVAILABLE
TABLE 46: PERCENTAGES OF STUDENTS IN A GENERAL EDUCATION PROGRAM WHO EXPECTEDTO ENGAGE IN SPECIFIED ACTIVITIES FOR NE FIRST YENt AFTERGRADUATION: 1981-82
Activity The, Will Take The GeneralLargest Share of Ties The EducationYear Afier N I gh School Students
Working full -time
Ppprentica or on-Vmm-jobtraining
39.8
2.5
Regular military servicefor mrvIce ac. gamy) 5.4
Fut 11140 hommaker 2.0
Taking courses lull-fleaor part-tie. at:
A trade or business schoolA Junior or community
college:
Ac adagio coursesTechnic. I courses
A 4-yam college oruniversity
Mgr*, mg part..time, but notattending school
Other (tram!, talcs a brock,no plans/
AllOther
Students
27.7
1.9
3.5
7.1 5.7
9.4 9.84.6 4.4
21.9 41.9
3.2
4.1
1.7
2.2

,M1
A large percentage of students in all types of high school programs expected
that college would play some role in their future education plans (see Table
47). However, a lower percentage of the general education students expected
to complete college or to attain an advanced degree. On the other hand,
general education students were more likely than other students to expect to
attend a vocational, trade, or business school for some period of time.
General education students were also more likely than other students to
expect high school to be the culmination of their formal education (25.6
percent versus 14.1 percent).
The findings in Table 48 indicate that the )013/occupational expectations of
general education students were, for the most part, very similar to those of
other students. The largest differences were with respect to professional
occupations. A smaller percentage of general education students (29.6 per-
cent) than other students (40.8 percent) expected to hold a professional
occupation by age 30.
In general, the planned fields of study of college bound general education
students were similar to those of other students (see Table 49). Buainess
was the most popular field for each of these groups. Nevertheless, several
interesting differences were found. General education students were Jess
likely tan other students to plan to atudy architecture and engineering or
to engage in pre-professional studies. A larger percentage of the general
education students expressed plans to pursue art and music.

TABLE 47: PERCENTAGES or 'TUDENTS IN A GENERAL EDUCATION PRCGRAM WHO EXPECTED TOOBTAIN SPECIFIED KINDS AND LEVELS OF EDUCATION: 1981-82
momme.....
Educational
Expectation
General
EducatIon
Students
Less than Hlgh School Graduation.7
All
Other
Students
.5
High School Graduation14.1
Vocstional, Trade or
Business School
After High School-
Lass Than 2 Yews 9.8 7.A
Two or More Years 15.6 10.5
College - Less than 2 Years 3.9 2.6
College - 2 or More Years 15.5 15.5
College Completion - 4 or 5 Year
Degree 18.3 26.0
Mestoria Degree or Eoulvalont 6.3 13.5
Ph.D., M.D., or Other Advanced
Professional Decree 4.4 10.0
BEST COPY AVAILABLE 94 1'"
TABLE 44: PERCENTAGES OF SNOUTS IN A GENE /AL EDUCATION PROGRAM MNO EXPECTED TO NOLO warm
JOSS OR OCCUPATIONS WHEN 30 YEARS OLD: 1941-1962
Occepation
General
Umatilla
Students
All
Other
Students
Clerical 6.9 9.6
Craftsmen9,5 4.1
Former, Fern Peeper 2.3
Nomomoler3.7 t.0
Laborer2.4 .9
Reneger, Administrator1.9
Military2.9 1.6
Operative4.1 2.7
Prohissionel - Me Adveaced Owe* 24.0 24.6
Professional - Mowed Degree 5.4 12.2
Proprietor or Owner5.4 4.2
Protective Service2.1 1.5
Sales2.4 1.4
School Teacher3.4 3.3
Unit* 5.1 3,5
Technical10.4 11.4
Net Wareing.9 .5
BEST COPY AVAILABLE117

743LE 49: PERCENTAGES OF COLLEGE-BOUM STUDENTS iN A GENERAL EDUCATION PROGRAM WHOPLANNED TO ENROLL IN SPECIFIED FIELDS OF STUDY: 1981-82
Field of Study
General
Education
Students
All
OPth6
Student's
Agriculture3.1
2.1
Architecture 6nd Engineering 8.511.7
Art and Music8.8
5.1
Biological and Physical
Sciences2.2
4.2
Business20,6 21.6
Communications 2.73.6
Computer and information
Sciences..9
5.3
Education 5.13.5
English and Foreign Languages 2.3 2.4
Ethnic an inter-
disciplinary Stud:es.1
.2
Health Ctcupatlons 5.9 4.5
Health Sciences4.0
5.7
Haas Economics2.5 1.7
Methemafics.7
.8
Ph!losaphy and Religion.1
.5
Pre - Professional2.9 7.3
Psychology and Social Sciences 5.5 5.3
Vocstional/Technical Studies 8.66.3
Other8.7
5,5
-96--
-BEST-COPYAVAILABLL
1 I S

TECHNICAL APPENDIX
A. SOURCES OF THE DATA
Data for the analysis of course-taking patterns in mathematics, science,
vocational education, computer science, ant general education came from the
sophomore cohort of the High School and Beyond (HUB) Study sponsored by
NCES. Several components of the HUB First Follow-up Survey provided the
data used In the analysis. The 1982 HUB transcripts collection provided
data which were used to define course-taking patterns. The data on the
characteristics of secondary school students came fran the responses to the
school and student questionnaires administered during the HS&B Base Year and
First Foliar -up surveys.
All of the HUB samples were designed to provide national estimates. The
sample designs of these surveys are described In the following sections.t
A.1 1110 _Schcol and Beyond Soula_allgns
A.1.1 Base Year Survey Sample Design
Base year data for the HUB study were collected in 1980. A highly
stratified, two-stage probability sample was used to select over 58,000 high
IL More detailed information on the sample designs of the HUB surveys as
well as information on their data collection procedures and other survey
features Is provided In:
C. Jones, S. Knight, M. Butz I. Crawford, and B. Staphenson, bigh
Ake . -*A
Chicago, Illinois: National Opinion Research Center, 1983.
-
C. Jones, M. Clarke, H. McWilliams, I. Crawford, B. Stephenson, and R.
Tourengeau,.09B2)! Data File User's Manual. National Center for Education Statis-
tics (NCES 83-214), 1983.
1 0.41. *1 .0 k .01
C. Jones, M. Frankel, R. Tourangeau, H. McWilliams,
k . ,1 1 AI. O'Brien, high
Chicago,1%.
Illinois: National Opinion Research Center, 1983.
A-1
1 ! 9

school students (over 28,000 seniors and over 30,000 sophomores) from over1,000 public and private secondary schools. Over 1,000 schools were selfv-tad daring the first stag. of the design with a probability proportional tothe estimated enrollment in their 10th and 12th grades.2 During the secondstage of sampling, 36 seniors and 36 sophomores were selected in eachschool, except in those schools with fewer /tin 36 seniors or 36 sophomores.In the latter schools, ail eligible students yr-. drawn In the sample. Thisreport utilizes only data from the sophomore cohort members.
A.1.2 First Follow-up Survey Sample Design
The HSU First Follow-up Survey smnpie design retained the essentialfeatures of the 1980 Base Year design. That Is, it was a multi-stage,stratified, probability sample with schools selected during the first stageof sampling, and students selected during stage two. Listed below are theimportant features of the 1982 First Follow-up sample design:
All schools selected as part of the Basil Year Survey ware con-tacted for participation In this First Follow-Up Survey unless theyhad no 1980 sophomores, had closed, or had merged with otherschools in the base year sample.
1980 sophomores still enrolled In their 1980 schools were retainedw:th certainty, resulting in approxislately 30,000 1980 sophomoresbeing included In the sample.
1980 sophomore cohort students who were no longer attending theirbase year schools (1.0., dropouts, early graduates, and those whohad transferred as individuals to a new school) wore subsampled.
2L This selection criterion was not used uniformly across all strata In thesample design. In certain sample strata (e.g., schools with largeminority enrol iments), study requirements resulted In an oversampling ofschools. For more Information on the Base Year Survey sample design,see M. Frankel, L. Limns, D. Buonanno, and R. Tourangeau, Somme Deswniteportt. Chicago, Illinois: National Opinion Research Center, 1981.

A.1.3 TrenscrIpts Survey Sample Design
The ample for the NSW Transcripts Survey was selected from among the 1980
sophomores who were eligible for the First Follow-up Survey. Prior to
selecting the sample, 1980 sophomores were stratified according to a number
of student and school-level characteristics. The *Irate were partitioned
Into one of two major groups with different student selection probabilities:
one contained polcy-relevant subgroups (e.g., students from private
schools, base year nonrespondents, high achlevemen% blacks, and high
achievement Hispanics), and the olher contained all of the remaining
sophomore subgroupings (e.g., other blacks, other Hispanics, and all other
students).
All students in the pol icy -relevant subgroups were selected with c.wtaInty,
resulting in 12,987 students being included In the survey sample. An
additional 5,440 sophomores were se:acted from the remaining subgroups, with
a selection pNobabil;ty equal to approximately .32. A total of 18,427
members of the 1980 sophomore cottort sere selected for participation in the
HUB Transcripts Survey.
Ninety-one percent of the schools responded to the request for student
tremscripts. Schools provided 15,941 (83 percent) of the 18.152 transcripts
requested (excluding the non-sampled co-twins).
The case weights for the transcripts data were adjusted to take into account
differential rates of response for a :umber of school types and student
statuses. The average nonresponse adjustment factor war 1.1:.3
B. ESTIMATION PROCEDURES
The goals of the analysis were to identify: (1) mathematics, science,
vocational education, computer science, end general education courso-takIng
patterns in U.S. secondary schools, and (2) the characteristics of students
that are related to patterns of participation in these subject areas.
IL For sore information on this adjustment no alshjalliaaLinfilayszatUr=-0 pp. 12-17.I.
A-3
1 1
Since these goals were directed toward understanding course-taking patternsof U. S. secondary school students, estimates were expanded to represent allor some portion of the national population of students. The procedures usedto produce the estimstes found in the study tables are described below.
B.1atlisalikEstLIStglaaSaamtlaiting_EAttfirns
The 1982 NSW Tranh,cript Survey was the source of data used to estimate thenumber and percentage of students exhibiting various course-taking patterns,As described in Chapter 2, course-taking patterns in mathematics, science,vocational education, and computer science, were operationally defined,totally or in pert, by the number of credits a student earned In certaincourses.4 Only credits earned In courses whore a student received a passinggrade were tabulated to establish these patterns.
In addition to the credits earned in a ("purse, vocational education course-teIng patterns were based on v'se number of vocational education instruc-tional programs In which credits were earned. When calculating each ofthese, courses that were failed and/or that did not result in credits beingearned (e.g., courses audited) were deleted.
Estimates of the number and percentage of students exhibiting variouscourse-taking patterns in the subject areas were expanded to represent thepopulation of secondary school students. However, the estimates apply onlyto the estimated 3,260,382 1980 sophomores who were enrolled in school Inthe Spring of 1982, or had gradLated early. The estimates do not apply tothose 1980 sophomores who dropped out of sctool prior to the Spring of 1982.
4L Since the credit systems of schools vary considerably, course credits inthe HS&B Transcript Survey data file were standardized using the proce-dures of the National Longitudinal Survey of Labor Force Behavior. Thestandardized credits (ICC) in the data file are defined by:SSC = CCiSCOWhere CC = Oaurse credit earned by the student
SCC Number of credits offered for completion of a one-yearcourse In a particular school.
L if it was not possible to determine the number of credits associatedwith a particularcourse, that course was not Included In the analysis.
A-4

Dropouts were excluded from the analysis because of the problems they create
for the Interpretation of the course-taklng patterns. With dropouts removed
from consideration, all patterns are representative of the course-taking
behavior of those students rho had completed high school or who had been
enrolled In high school for four years. That is, a stpdentls placement
within a pattern Is not contingent upon the number of years he or she has
attended school, but on the course-taking t,ehiNior exhibited while a
student.
C. STANDARD ERRORS
Each of the 1982 NSa8 samples represent only one of many that could have
been selected Jsing th4 same sample design specifications. Estimates der
rived from these different samples would vary. Standard errors for the
estimated totals and percentages measure the precision of these estimates,
i.e., the variation of all the estimate: around the theoretical, complete-
coverage values. The standard errors, together with the sample estimates,
may be used to define confidenco'intervals i.e., ranges that would include
the comparable complete-coverage value for specified percentage of all
possible samples. For example, the complete-coverage value would be in-
cluded In the range from two standard errors above to two standard errors
below the estimate Ur about 95 percent of all possible samples.
No standard *vacs were reported for the estimates presented In the tables
In Chapters 3 through 8. Methods for approximating the standard errors of
the ustimated totals and percentages presented in the tables are described
below.
All of the estimates of the number and percentage of student course-taking
patterns and other student characteristics were based on sample data. The
standard error (SE) of a percentage (p) estimated from a simp:e random
sample (SRS) of n students from the total population of secondary school
students (N) Is approximately:
SE(p)
DEFTF--n/
A-5
14,r13

DEFT Is' a correction factor used to compensate for the effect of the sampledesign. Since the students In the 1952 HS&B study were selected using adisproportionate stratified sample design, simple random sampling formu-las will underestimate the variance and standard errors of simple statis-tics such as percentages. For the student-based estimates reported In thetables, the DEFT correction factor is 2.0.
6
The standard error of the estimated number of students with varying charac-teristics Is computed by multiplying the standard error of the estimatedproportion (SE /100) by the number of students in the population of U.S.secondary school students or by the number of students In a specific sub-class of students (e.g., high SES students).
Since different tables in the report are based on different subsamples ofstudents, it Is important that the appropriate sample Cr) and population (N)sizes be used In calculating these approximations of the standard- errors.
Estimate* reported in Tables 1 through 49 were based on the responses ofthose students participating in the transcript survey who were still atten-ding their original basal year school for who had graduated early). Thetotal and subclass sample sizes (n) on which these estimates were based arereported in Table A.1. This table also contains the weighted N for eachsubclass.
fa. Exact standard errors calculated by the method of Balanced RepottedReplication are available through N(S.
A-6
124

Table A.1: Unweighted and Weighted Numbers of Students, for the Major Subclasses
Used In the Student Course-Taking Patterns Tables
Total Students13,946 3,260,382
Mathematics Course-taking Patterns
Concentrators1,573 280,383
4-Year College Bound 5,400 1,194,149
General Mathematics Students 6,371 1,632,021
Limited Participants or Non-participants 602 151,924
Science Course-taking Patterns
Concentrators1,481 303,543
4-Year College Bound 4,148 903,596
General Science Students 6,312 1,538,554
Limited Participants or Nom-participants 2,005 513,255
Vocational Education Course-taking Patterns
Concentrators2,996 806,605
limited Concentrators 3,234 829,477
Samplers6,893 1,476,712
Non - participants823 146,188
Computer Science Course-taking Patterns
Participants1,825 408,012
Non-participants12,121 2,848,296
General Education
General Education Students 4,412 1,092,308
All Otter Students9,063 2,016,786
AL In sane cases, these numbers do not match those on which the table estimates
were based because of missing data. Consequently, approximations of the
standard errors associated with the recorded estimates calculated using these
numbers may be slightly biased. Exact standard errors of alt estimates are
available from NOES.
A-7
125

Table A.1: Unweighted and Weighted Numbers of Students, for he Major SubclassesUsed in the Student Course-Taking Patterns Tables (Continued)
Sex
Male6,914 1,607,686
Female 7,032 1,649,728
Socio-econcmic Status
Low3,803 778,428
Middle6,135 1,538,307
High 3,484 781,641
Race/Ethnicity
White8r365 2,365,595Black1,945 369,017Hispanic/Other 3,636 523,073
School Type
Public10,762 2,920,301Catholic2,360 222,341Other Private
842 113,989
..aL. In some cases, these numbers do not match those on which the table estimateswere based because of missing data. Consequently, approximations of thestandard errors associated with the recorded estimates calculated using thesenumbers may be slightly biased. Exact standard errors of all estimates areavailable from NCES.
A-8 126
D. lifitUAKIJIMLtMurse Cater Les and CI Ific flop_ of-Secondary School
The subject areas -- mathematics, science, vocational education, and
computer science -- care subdivided for purposes of identifying student
course-taking pettern5. The secondary school courses which constituted
these subdivisions were grouped according to the codes for the Classifica-
tion of Secondary School Courses (CSSC). The CSSC was originial ly developed
for use In coding transcripts of students participating In the National
Center for Education Stat!sticsi longitudinal High School an' Beyond study.
This nationwide inventory of high school courses Identifies each course with
a six-digit numerical code. Each subject area and its subdivisions are
I isted. The appropriate CSSC codas and their titles follow.*
MATHEMATICS
College Preparatory (For Gifted-Talented Students)
27.041727.041927.0421
Linear AlgebraCalculusCalculus, Advanced Placement
College Fteparatory (For Mathematics Oznoentratcrs)
27.040027.041227.041327.041427.041527.041627.041827.042327.042427.050027.051127.052127.0531
Pure Mathematics, OtherAnalytic GeometryTrigonometry and Solid GeometryAlgebra and TrigonometryAlgebra and Analytic UsometryAnalysis, IntroductoryCalculus and Analytic GeometryMathematics 3, UnifiedMathematics, independent StudyStatistics, OtherStatisticsProbabilityProbability and Statistics
College Preparatory (For -Year College Bound)
27.040427.040527.040627.040727.040827.041027.0411
27.042127.0422
Algebra 1Algebra 2Geometry, PlaneGeometry, SolidGeometryAlgebrr. 3
TrigonometryMathematics 1, UnifiedMathematics 2, Unified
Each course iscourses encompafoLT -digit code
identified with a six-digit numerical code. When all the
ssed under a CSSC instructional program are used, only the
associated with that program Is listed.
A-9
127

General
27.010627.010727.040227.040327.0409
Vocational
Basic
01.015107.017107.017207.022117.065127.011027.011132.0108
27.010027.010527.010827.0114
Optional
11.012111.012227.010921.011227.011327.020027.030027.9900
SCIENCE
Mattlimatics 1, Generalterthematics 2, GeneralAlgebra 1, Part 1Algebra 1, Part 2Gocseetry, informal
Agricultural Methemati csBusiness *thematic' 1Business Maitematics 2Financial MathematicsNurse's MathematicsMathematics, VocationalTechnical *thematic*Mathematics for Employment
Mathematics, Other GeneralMathematics, BasicScience MathematicsConsumer Mathematics
Dcmputer Mathematics 1
Computer Mathematics 2Mathematics in the Arts*athematic' ReviewMathematics TutoringActuarial Sciences, OtherAppi led Mathematics, Ot'herMathematics, Other
General Life Sciences
26.012126.013126.015126.0751
Biology, BasicBiology, GeneralField BiologyPhysiology, Human
Advanced Life Sciences
26.014126.014226.016126.017135.018126.0100
Biology, College PreparatoryBiology, AdvancedGeneticsBtopsychologyBiology SeminarBiology, Other General
A-10
128

26.071126.072125.073126.074126.075226.076126.070026.0226.0326.0426.0526.0626.99
General Physical
40.01
40.055140.0611
Advanced Physical
40.0240.0340.0440.051140.0521
40.052240.053140.054140.056140.050040.062140.0631
40.064140.060040.0740.0840.0940.99
VOCATIONAL EDUCATION
Agriculture
ZoologyZoology, VertebrateZoology, InvertebrateAnimal BehaviorPhysiology, AdvancedPathologyZoology, OtherBiochemistry and BiophysicsBotanyCeil and Molecular BiologyMicr.;tiologyMiscellaneous Specialized Areas, Life Sciences
Life Sciences, Other
Sciences
Physical Sciences, GeneralConsumer ChemistryEarth Science
Sciences
AstronomyAstrophysicsAtmospheric Science and MeteorologyChsmistry, IntroductoryChemistry 1Chemistry 2Organic ChemistryPhysical ChemistryChemistry, Independent StudyChemistry, OtherEartt Science, College PreparatoryGeologyMineralogyGeological Sciences, OtherMiscellaneous Physical SciencesPhysicsPlanetary SciencePhysical Pciencos, Other
01.01 Agricultural
01.02 Agricultural01.03 Agricultural
01.04 Agricultural01.05 Agricultural01.06 Horticulture
02.0423)
01.07 international Agriculture
01.99 Agribusiness and Agriculture Production, Other
02.01 Agricultural Sciences, General
02.02 Animal Sciences
02.03 Food Sciences
Business and ManagementMechanicsProduction (plus 01.0681)Products and ProcessingServices and Supplies(All except 01.0681) (plus 02.0421
A-11
Agriculture (Contid)
02.04 Pi ant Sciences (All except 02.0421 - 02.0423102.05 Soil Sciences03.01 Renevabie Natural Resources, General03.02 Conservation and Regulation03.03 Fishing and Fisheries03.04 Forestry Production and Processing03.05 Forestry and Related Sciences03.06 Wildlife Management03.99 Renovate Natural Resources, Other
Business
06.0106.0206.0406.0506.0606.0906.1106.1206.1306.1506.1606.1806.1906.9907.01
07.02
07.0307.04
07.0507.06
07.07
07.99
Marketing
Business and Management, GeneralAccountingBusiness Administration and ManagementBusiness EconomicsHuman Resources Development
International Business ManagementLabor Industrial RelationsManagement Information SystemsManagement ScienceOrganizational BehaviorPersonnel ManagementSeall Business Management and OwnershipTaxatinnBusiness and Management, OtherAccounting, Bookkeeping, and Related Programs(All except 07.0161 and 07.0162)
Banking and Related Financial Programs(plus 06.03)
Business Data Processing and Related ProgramsOffice Supervision and Management(All except 07.0411 and 07.0412)
Personnel and Training ProgramsSecretarial and Related Programs (plus 07.0411and 07.0412)
Typing, General Office, and Related Programs(plus 07.0161 and 07.0162)
Business and Office, Other
06.07 institutional Management06.08 'nsurance and Risk Management06.14 Marketing Management and Research06.17 Real Estate08.01 Apparel and Accessories Marketing08.02 Business and Personal Services Marketing08.03 Entrepreneurship08.04 Financial Services Marketing08.05 Floristry, Fare and Garden Supplies Marketing08.06 Food Marketing08.07 General Marketing
A-12130

Marketing (Contld)
06.08 His and Office Products Marketing
08.09 Hospitality and Recreation Marketing
08.10 Insurance Marketing08.11 Transportation and Travel Marketing
08.12 Vehicles and Petroleum Marketing
08.99 Marketing and Distribution, Other
09.02 Advemollsing
Heal th
17.01 Dental Services17.02 Diagnostic and Treatment Services (All except
17.0211)17.03 Medical Laboratory Technologies
17.04 Mental Health/Hunan Services
17.05 Miscellaneous Allied Health Services (All except
17.0561)
17.06 Nurse-Related Services (All except 17.0611)
17.07 Ophthalmic Services
17.08 Rehabilitation Services17.99 Allied Health, Other
Industrial Arts
21.01 Industrial Arts (All except 21.0110, 21.0111, 21.0112,
21.0114, 21.0116 - 21.0118, 21.0120 - 21.0124)
47.0651 Consumer Auto
48.0511 Metal 1
48.0711 Woodworking 1
Technologies
10.01 Caamunication Technologies (Ali except 1 0.0111 - 10.0132)
11.01 Computer and Information Sciences, General
11.03 Data Processing11.04 information Sciences and Systems
11.05 Systems Analysis
11.99 COmputer and information Sciences, Other
15.0400 Electromechanical Instrumentation and Maintenance
Technologies, Other
15.0500 Environmental Control Technologies, Other
15.06 Industrial Production Technologies (All except
15.0611 and 16.0631)
15.0700 Quality Control and Safety Technologies, Other
15.0800 Mechanical and Related Technologies, Other
15.0900 Mining and Petroleum Technologies, Other
Trade and Industry
06.20 Trade and Industrial Supervision end Management
12.01 Drycloaning and Laundering Services
12.04 Personal FArvices
12.99 Consumer, Personal, and Miscellaneous Services, Other
43.01 Criminal Justice
43.02 Fire Protection
131

Trade and industry (Contld)
43.99 Protective Services, Other46.01 Brickmasonry, Stonemasonry, and Tile Setting46.02 Carpentry46.03 Electrical and Poser Transmissicm Installation
(plus 47.0521)46.04 Miscellaneous Construction Trades (All except 46.0441)46.05 Plumbing, Pipofitting, and Steamfitting46.99 Construction Trades, Other47.01 Electrical and Efectronici Equipment Repair (plus
15.0:', 21.0114, 21.0116 - 21.0118, 21.0120)47,02 Heating, Air Conditioning, and Refrigeration Mechanics
(plus 15.0511)47.03 Industrial Equipment Maintenance and Repair (All except
47.0321) (Plus 15.0911 and 15.0921)47.04 Miscellaneous Mechanics and Repair (Plus 15.0411 and
15.0441)47.06 Vehicle and Mobile Equipment Mechanics and Repair (All
except 47.0651) ;Plus 47.0321, 47.0511 - 47.0514)47.99 Mechanics and Repairers, Other48.01 Drafting (Plus 15.0211)48.02 Graphic and Printing Communications (plus 10.0131 and
10.0132)48.03 Leatherworking and Upholstering (All except 48.0311 and
48.0312)48.04 Precision Food Production48.05 Precision Metal Work (All accept 48.0511) (plus 15.0611,
15.0711, 21.0121 - 21.0124)48.06 Precision Work, Assorted Materials (plus 15.0631)48.07 Woodworking (All except 48.0711)48.99 Precision Production, Other49.01 Air Transportation49.02 Vehicle and Equipment Operation49.03 Water Transportation49.99 Transportation and Material Moving, Other21.0110 Trade and industry Cooperative21.0111 Industrial Cooperative Work Experience21.0112 industrial Cooperative Work Experience, Advanced32.0104 Work Experience32.0105 Work Experience, Advanced32.0106 Cooperative Education 132.0107 Cooperative Education 2
Consurf 4cmo Economics
20.0113 Hone Ecw1(..-Ics 1
20.0114 Home Economlcs 220.0115 Home Economics 320.0116 Home Economics 420.0118 Comprehensive Opnsuser and Homemaking Home Economics,
Independent Study20.0122 Cbtid Development 120.0123 Child Development 220.0124 Child Development 320.0125 Child Development 420.0133 Clothing 1
A-1413'2

Consumer and Home Economics (Cont'd)
20.0134 Clothing 220.0135 Clothing 320.0136 Clothing 420.0137 Tailoring20.0141 Consumer Education 120.0142 Consumer Education 212.9900 Consumer, Personal, and Miscellaneous Services, Other20.0151 Home Economics Occupations 1, Exploratory20.0152 Home Economics Occupations 2, Exploratory20.0161 Family Health 120.0162 Family Health 220.0117 Adults Roles and Functions17.0211 First Aid20.0171 Family Relations20.0172 Marriage Society and Change20.0173 Parenthood20.0154 Home Economics Leadership35.0111 interpersonal Relationships35.0121 Building Human Relationships35.0100 Interpersonal Skills, Other37.0111 Porsonel Development Techniques37.0121 Coping wIth Personal Problems37.0131 Self Perception37.0100 Personal Awareness, Other20.0183 Foods 120.0184 Foods 220.01e5 Foods 320.0186 Foods 420.0187 International Foods20.0188 Nutrition19.0500 Food Sciences and Human Nutrition, Other20.0191 Home Management 120.0192 Home Management 219.0400 Family/Consmar Resource Management, Other46.0441 Homo Maintenance and Repair19.06 Human Environment and Housing04.0511 interior Design04.0500 interior Design, Other
20.0100 Consumer and Home Economics
Occupational Home Economics
20.0211 Child Care Services20.0221 Child Care Aide42.0711 Child Psychology20.0231 Child Card Management20.0241 Fcster Care and Family Caro20.0251 Teacher Aide20.0153 Home Economics Laboratory Assistant
33.0111 Student Assistant20.0321 Clothing Maintenance Aide12.0100 Dry Cleaning and Laundering Cervices, 'Other
12.0111 Dry Cleaning20.0311 Clothing Occupations 120.0312 Clothing Occupations 2
133

Occupational Nome Economics CCont'd!
20.0313 Clothing Occupations 320.0331 Commercial Garment and Apparel Construction20.0391 Cfo*Ing Production Menaqement20.0341 Customer Apparel Construction20.0351 Customer Tailoring and Alteration20.0361 Wedding snd Specialty Consulting20.0371 Fashion and Fabric Coordination20.0381 Textiles Testing20.0300 Clothing, Apparel, and Textiles, Management, Production,
and Services, Other20.0411 Food Service Training 120.0412 Food Service Training 220.0421 Food Service CboperatIve Training20.0431 Baking20.0441 Chef20.0461 Dietetic Aide20.0451 Catering20.0471 Food Testing20.0481 School Food ServIse20.0511 Housing and interior Design 120.0512 Housing and interior Design 220.0513 interior Design Occupations20.0521 Floral Design20.0541 Home Furnishings Aide20.0551 Custom Drapery and Window Treatment Design20.0561 Custom Slipcovering and Upholstering20.0571 Home-Service Assisting20.0611 Custodial Services20.0621 Executive Housekeeping20.0631 Homemaker's Aide20.0661 Therapeutic Recreation Aldo20.0651 Consumer Aide20.0641 Companion to the Aged
C404PUTER SCIENCE
Computer Science Languages and Programming
11.0111 Computer Appreciation11.9900 Computer and Information Sciences, Other11.0121 Computer Mathematics 111.0211 Computer Provamming 111.0100 Computer and Information Sciences, Other General11.0241 BASIC Introduction11.0122 Computer Mathematics 211.0212 Computer Programming 211.0131 Computer Applications11.0132 Computer Applications, Independent Study11.0141 Computer Science, A.P.11.0221 FORTRAN11.0231 PASCAL11.0200 Ccoputer Programming, Other11.0251 OWL
A-16
134

Business Data Processing Applications
11.0311 Data Processing 107.0311 Computers in Business07.0321 Bust:gess Data Processing 107.0331 Business Compeer Progremm1r.g 111.0312 Data Processing 211.0313 Data Processing Advanced07.0322 Business Data Processing 207.0332 Business Computer Programming 2
*VS GOVERNMENT PRINTING OFFICE: 19 8 5 4 6 1 2 8 3 2 0 2 0
A-17
135