Embed Size (px)
Citation preview

The 2001 Brown Center Report on American Education:
HOW WELL ARE AMERICAN STUDENTS LEARNING?With special sections on high school culture and urban school achievementSeptember 2001
Volume I, Number 2
by:
TOM LOVELESS
Director, Brown Center on
Education Policy

Copyright ©2001 byTHE BROOKINGS INSTITUTION1775 Massachusetts Avenue, NW Washington, D.C. 20036www.brookings.edu
All rights reserved
TABLE OF CONTENTS
3 Introduction
PART I
5 The Nation’s Achievement
PART II
17 High School Culture
PART III
29 Urban School Achievement
38 Endnotes
Research assistance by:
PAUL DIPERNA
Brown Center on Education Policy

THE 2001 BROWN CENTER REPORT ON AMERICAN EDUCATION
Education commanded a prominent position in the 2000 campaign for
president. Both candidates featured proposals for improving schools.
Both talked about education on the stump, in campaign advertisements,
and in televised debates. Within a few days of taking the oath of office,
George W. Bush made education legislation the incoming administration’s
top priority. Secretary of Education designate Rod Paige stood at Bush’s
side as the president declared a vigorous new role for the federal govern-
ment in school reform, an effort, Bush pledged, that would provide a
better education for every American student and leave no child behind.
This pledge highlights a problem discussed in this report, the second
edition of the Brown Center Report on American Education. The concern
is with achievement gaps, the yawning disparities in achievement between
the academically successful—be they students, schools, or nations—
and the unsuccessful. Focusing on gaps demands that we think about
achievement as not simply a phenomenon measured by test score averages.
Statisticians would say that the distribution of achievement is now being
taken into account. In the case of student achievement, for example,
it means paying attention to the range of scores from top to bottom, the
number of students performing at various levels of proficiency, and the
learning differences that different scores represent. Focusing on gaps
forces people to see education as a valued resource that is distributed
differently to different students, inviting questions about the educational
system’s fundamental fairness and a sober consideration of what it will
The Brown Center Report on American Education 3

take to ensure that students who struggle academically learn what they need
to learn, of what—truly—is required so that no child is left behind.
Although varying in content from year to year, the Brown Center Report
is organized by three consistent sections. The first section uses evidence
released in the previous twelve months to evaluate student achievement
in America’s schools. This year, we investigate the enormous gap between
the U.S. and other nations in mathematics achievement and analyze, in
reading achievement, the gap between the nation’s best and worst readers
in fourth grade.
The second section explores a theme in depth. This year’s theme is the
culture of the American high school. A survey of foreign exchange students
was conducted to get their impressions of American high schools. Responses
indicate that the culture of high schools and the low status of academic
accomplishments within teen culture may present formidable obstacles to
the attainment of academic excellence.
The third section analyzes achievement in urban schools. Test score
data from dozens of states were collected to determine how urban school
districts are doing in comparison to rural and suburban districts in the
same state. We present scores for thirty-nine of the fifty most populous
cities in the U.S. and analyze the performance of urban districts serving a
substantial number of children in poverty. The data do not allow for any
firm policy conclusions or recommendations, although the most popular
urban school reforms of the 1990s are briefly discussed. This section’s
primary objective is to estimate the achievement gaps that urban schools
must overcome to reach parity with their rural and suburban counterparts.
4 The Brown Center Report on American Education

THE NATION’S ACHIEVEMENT
The Brown Center Report on American Education
Part
ITHE NATION’S ACHIEVEMENT
The Brown Center Report on American Education
Part
I

6 The Brown Center Report on American Education
Part I The Nation’s Achievement
AMERICAN STUDENTS MADE SOLID GAINS IN
mathematics achievement in the 1990s. Reading achievement
remained flat. This conclusion is based on an analysis of the National
Assessment of Educational Progress (NAEP), considered by many education
experts as the best measure of academic achievement in the United States.
Last year’s Brown Center Report analyzed
data from the NAEP trend assessment, a test
oriented toward traditional curriculum content.
This year’s report begins by examining data
from another NAEP test, the main assessment,
which was first given in 1990. The main NAEP
is designed to reflect contemporary ideas
about reading and mathematics. It is strongly
influenced by professional educator groups.
Many of these organizations seek to change
how reading and mathematics are taught
and assessed. To keep the main assessment
current with professional opinion, NAEP
officials may periodically alter the test’s content
and procedures.1
How did American students do in the 1990s?Confirming findings from the trend NAEP,
reading scores remained basically unchanged
on the main NAEP from 1992 to 2000 (see
Table 1). Small declines in the early 1990s were
offset by later gains, producing a zero net change
for the decade. As a rule of thumb, changes
of three scale score points or more in NAEP
national averages are statistically significant.
Despite the lack of progress in reading, the
scores offer a ray of hope. A modest upward
slope has been in place since 1994, and if it
continues, reading achievement will experi-
ence solid gains in the next decade.
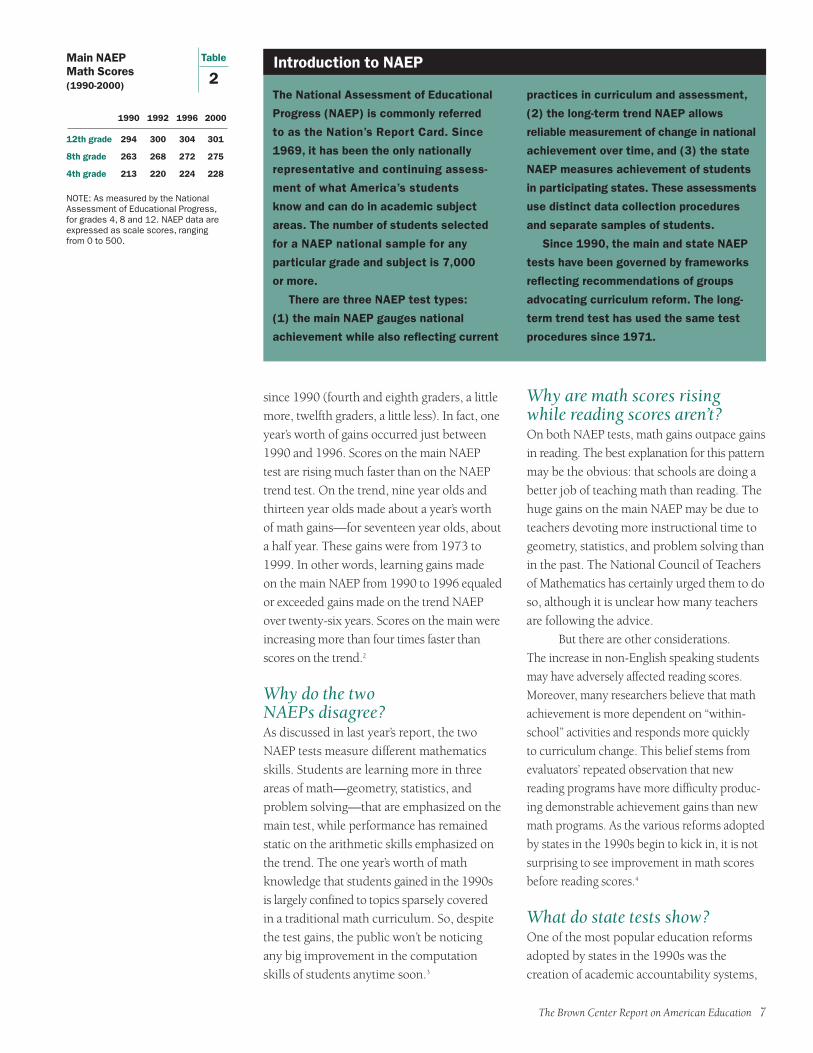
Math scores shot up on the main NAEP,
despite the fact that the performance of twelfth
graders experienced a three point decline in
2000 (see Table 2). Not only were the decade’s
gains statistically significant, but they also are
almost certainly of real-world importance. An
estimate of one year’s worth of growth between
fourth and eighth grades can be made by divid-
ing the two grades’ scale score differences by
four (in 1996, for example, 48 ÷ 4 = 12). The
same calculation for annual growth between
eighth and twelfth grades produces an estimate
of about eight points. Since eighth grade is
the starting and ending point of the two time
frames, ten points is a reasonable estimate of
growth for eighth graders, midway between
that of fourth grade (12 points) and twelfth
grade (8 points).
Using these estimates, it appears that
students at all three grade levels have gained
about one year’s worth of math knowledge
Main NAEPReading Scores (1992-2000)
12th grade
8th grade
4th grade
1992 1994 1998 2000
292 287 291 —
260 260 264 —
217 214 217 217
Table
1
NOTE: As measured by the NationalAssessment of Educational Progress,for grades 4, 8, and 12. NAEP data areexpressed as scale scores, rangingfrom 0 to 500. Eighth and twelfth gradesnot tested in 2000.
The Brown Center Report on American Education 7
since 1990 (fourth and eighth graders, a little
more, twelfth graders, a little less). In fact, one
year’s worth of gains occurred just between
1990 and 1996. Scores on the main NAEP
test are rising much faster than on the NAEP
trend test. On the trend, nine year olds and
thirteen year olds made about a year’s worth
of math gains—for seventeen year olds, about
a half year. These gains were from 1973 to
1999. In other words, learning gains made
on the main NAEP from 1990 to 1996 equaled
or exceeded gains made on the trend NAEP
over twenty-six years. Scores on the main were
increasing more than four times faster than
scores on the trend.2
Why do the two NAEPs disagree?As discussed in last year’s report, the two
NAEP tests measure different mathematics
skills. Students are learning more in three
areas of math—geometry, statistics, and
problem solving—that are emphasized on the
main test, while performance has remained
static on the arithmetic skills emphasized on
the trend. The one year’s worth of math
knowledge that students gained in the 1990s
is largely confined to topics sparsely covered
in a traditional math curriculum. So, despite
the test gains, the public won’t be noticing
any big improvement in the computation
skills of students anytime soon.3
Why are math scores rising while reading scores aren’t?On both NAEP tests, math gains outpace gains
in reading. The best explanation for this pattern
may be the obvious: that schools are doing a
better job of teaching math than reading. The
huge gains on the main NAEP may be due to
teachers devoting more instructional time to
geometry, statistics, and problem solving than
in the past. The National Council of Teachers
of Mathematics has certainly urged them to do
so, although it is unclear how many teachers
are following the advice.
But there are other considerations.
The increase in non-English speaking students
may have adversely affected reading scores.
Moreover, many researchers believe that math
achievement is more dependent on “within-
school” activities and responds more quickly
to curriculum change. This belief stems from
evaluators’ repeated observation that new
reading programs have more difficulty produc-
ing demonstrable achievement gains than new
math programs. As the various reforms adopted
by states in the 1990s begin to kick in, it is not
surprising to see improvement in math scores
before reading scores.4
What do state tests show?One of the most popular education reforms
adopted by states in the 1990s was the
creation of academic accountability systems,
The National Assessment of Educational
Progress (NAEP) is commonly referred
to as the Nation’s Report Card. Since
1969, it has been the only nationally
representative and continuing assess-
ment of what America’s students
know and can do in academic subject
areas. The number of students selected
for a NAEP national sample for any
particular grade and subject is 7,000
or more.
There are three NAEP test types:
(1) the main NAEP gauges national
achievement while also reflecting current
practices in curriculum and assessment,
(2) the long-term trend NAEP allows
reliable measurement of change in national
achievement over time, and (3) the state
NAEP measures achievement of students
in participating states. These assessments
use distinct data collection procedures
and separate samples of students.
Since 1990, the main and state NAEP
tests have been governed by frameworks
reflecting recommendations of groups
advocating curriculum reform. The long-
term trend test has used the same test
procedures since 1971.
Introduction to NAEPMain NAEPMath Scores (1990-2000)
12th grade
8th grade
4th grade
1990 1992 1996 2000
294 300 304 301
263 268 272 275
213 220 224 228
Table
2
NOTE: As measured by the NationalAssessment of Educational Progress,for grades 4, 8 and 12. NAEP data areexpressed as scale scores, rangingfrom 0 to 500.

8 The Brown Center Report on American Education
Part I The Nation’s Achievement
establishing incentives for both schools and
students by linking rewards and sanctions
to performance on state achievement tests.
What do these tests show about the direction
of academic achievement? We analyzed scores
from several grade levels in states that gave
the same test in 1999 and 2000. We found
that scores in both math and reading are rising,
but less than reported last year. In reading,
more states exhibited gains than losses at
grades four, five, eight, and ten. However, the
percentage of improving states decreased
from 1999 to 2000, indicating that progress
may be slowing (see Figure 1).5
In math, achievement gains in the
elementary grades also appeared to slow. The
percentage of improving states decreased in
fourth and fifth grades (see Figure 2). As Robert
L. Linn has pointed out, it is not unusual for
“plateauing” to occur after testing programs
have been in place for awhile. When states
and districts introduce new tests, they fre-
quently produce large initial gains. Over time,
however, as teachers and students adjust to
the objectives of the test—in some cases,
teachers may actually teach to the test—the
gains become smaller and begin to level off.6
The plateauing effect is not evident
in the upper grades, where more states are
reporting math gains. In tenth grade, 84%
of the states reported higher math scores in
2000 than in 1999, compared to 54% that
reported higher scores in 1999 compared to
1998. The upward trend for tenth graders on
state tests is contrary to the decline reported
on the 2000 main NAEP for twelfth graders.
Students enrolled in the two grades attend
the same high schools. With many people
proposing that NAEP serve as a check on state
tests—and that federal education aid to states
depend on states holding schools accountable
for academic progress—it is important for
68%
44%
grade 40%
10%
20%
30%
40%
50%
60%
70%
80%
90%
100%
59%
72%
grade 5
46%
59%
grade 10
42%
52%
grade 8
1999-2000
1998-1999
Fig
1Reading gainsare slowing.
At all four grade levels, fewer states reported gainsin 2000 than in 1999.
States reporting gains
It is important for
discrepancies between
the main NAEP and
state tests to be
thoroughly investigated
and explained.

The Brown Center Report on American Education 9
discrepancies between the main NAEP and
state tests to be thoroughly investigated and
explained. At this point, state tests are too
new to have established reliable trends. For
now, they should be viewed as establishing
baselines of achievement.
How is the United States doingcompared to other countries?TIMSS-R stands for the Third International
Mathematics and Science Study-Repeat. It
replicated the 1995 TIMSS, an international
study of achievement in math and science
involving fourth, eighth, and twelfth graders
in forty-one countries. The TIMSS-R test was
given in 1999 to eighth graders from thirty-
eight countries. Results were released in
December 2000. Several U.S. school districts
and consortia of districts also participated in
the study as part of the TIMSS Benchmarking
project. The Benchmark data are discussed
later in this report.
The results from TIMSS-R are similar
to the 1995 results. The U.S. placed near the
middle of world achievement (see Table 3).
Singapore had the highest scores, and Korea,
Chinese Taipei, Hong Kong, Japan, and
Belgium (Flemish) scored near the top.
The horserace aspect of TIMSS—deter-
mining which countries score the highest—is
indeed fascinating. Drawing less attention are
the valuable data the test gathers on the teachers,
students, and curricula of participating nations.
Educators in each country are given an opportu-
nity to describe what they do so that their
practices may be compared to those of other
teachers around the world. Four findings are
striking, primarily because of their implica-
tions for math reform in the United States.
What do teachers think abouttheir preparation to teach?American teachers possess tremendous confi-
dence in their teaching. Teachers were asked
1999-2000
1998-1999
Fig
2Math gains are mixed.
Gains are slowing in the lower grades but accelerating in the upper grades.
0%
10%
20%
30%
40%
50%
60%
70%
80%
90%
100%
States reporting gains
86%
62%
grade 4
67%
79%
grade 5
84%
54%
grade 10
78%
63%
grade 8
Math Achievement on1999 TIMSS-R (Grade 8)
Country
Singapore
Korea
Chinese Taipei
Hong Kong
Japan
Belgium (Flemish)
Netherlands
Hungary
Canada
Russia
Australia
Czech Republic
Malaysia
United States
England
New Zealand
Italy
Cyprus
Thailand
Israel
Turkey
Jordan
Iran
Chile
Philippines
South Africa
Score SE
604 6.3
587 2.0
585 4.0
582 4.3
579 1.7
558 3.3
540 7.1
532 3.7
531 2.5
526 5.9
525 4.8
520 4.2
519 4.4
502 4.0
496 4.1
491 5.2
479 3.8
476 1.8
467 5.1
466 3.9
429 4.3
428 3.6
422 3.4
392 4.4
345 6.0
275 6.8
Table
3

10 The Brown Center Report on American Education
Part I The Nation’s Achievement
Teachers’ Major Area of Study(TIMSS-R, 1999, Grade 8)
Country
Belgium(Flemish)
Chinese Taipei
Japan
Singapore
Hong Kong
Korea
United States
InternationalAverage
Percentage of students with teachers
majoring in:Math Education
89 (2.6) 42 (2.9)
82 (3.7) 32 (3.6)
79 (3.6) 15 (3.2)
78 (3.6) 48 (4.8)
57 (4.2) 36 (3.8)
55 (4.2) 19 (3.2)
41 (3.4) 54 (3.4)
71 (0.6) 32 (0.6)
Table
5
NOTE: Standard errors appear in parentheses.
how prepared they are to teach math, and
responses were sorted into high, medium, and
low categories. The TIMSS-R unit of analysis
is students, so the study reports the percentage
of students having teachers with a particular
characteristic.
Eighty-seven percent of American eighth
graders are taught by teachers with high con-
fidence (see Table 4). The average for students
in all countries is 63%. The highest scoring
nations have fewer teachers at this level than
the U.S.: Chinese Taipei, 71%; Singapore, 66%;
Belgium (Flemish) 65%; Hong Kong, 61%;
Korea, 48%. Japan comes in dead last at 8%.
Japanese students may perennially score near
the top on math tests, but Japanese teachers
feel the least prepared of any teachers in the
world to teach math. These puzzling statistics
mirror what international studies have already
discovered about American and Japanese stu-
dents, suggesting that measures of confidence
are strongly influenced by national culture.
Although U.S. performance is mediocre to bad
on international assessments, American teachers
and students are at the top of the world when
it comes to confidence in their own abilities.
And teachers and students in high scoring
nations, especially Japan, are unsure of their
own proficiency.7
What have math teachers studied?The confidence that American teachers
express about teaching math is not related
to their own extensive study of mathematics
as a discipline. Among the world’s math
teachers, American teachers are among the
least likely to have majored in mathematics
in B.A., M.A., or teacher training programs
(see Table 5). Most American eighth grade
math teachers majored in education. Only
41% of U.S. eighth graders are taught by
math majors. The international average is
71%. In the highest scoring nations, students
are likely to have teachers holding math
degrees: Belgium (Flemish), 89%; Chinese
Taipei, 82%, Japan, 79%; Singapore, 78%.
American teachers believe they are well-
prepared to teach math despite the fact that
they have less formal education in the disci-
pline than teachers in other countries.
Does math instruction reflect the real world? Many math reform groups urge teachers to
anchor their instruction in real-world activities.
Following this advice, recently published
American textbooks emphasize solving practical
math problems and de-emphasize working with
notation, symbols, and abstract equations. The
belief is that stressing math’s practical uses will
lead students to appreciate the subject’s value.
Much of the world seems to have a hard
time believing that math’s practical utility is
paramount in learning the subject. Students
were asked how often they use items from
everyday life to solve math problems (see Table
6). Most students answered in the middle
two response categories, but examining the
extremes brings international differences into
focus. The U.S. eighth graders led the world
on this question, with 23% saying they “almost
always” solved math problems using items
from everyday life and only 12% saying “never.”
About a two to one ratio in favor of practical
applications. The pattern of responses in higher
scoring nations was the reverse: Singapore, 16%
almost always and 14% never; Chinese Taipei,
11% almost always and 15% never; Belgium
(Flemish), 7% almost always and 27% never;
Hong Kong, 6% almost always and 15% never;
Korea, 3% almost always and 37% never;
Japan, 2% almost always and 27% never. 8
American math lessons stress the practi-
cal side of mathematics, more so than the rest
of the world, much more so than high achiev-
ing nations. Students in high scoring nations
learn a more formal and symbolic mathematics.
Teachers ExpressingHigh Confidencein Preparation to Teach Math(TIMSS-R, 1999, Grade 8)
Country
United States
Chinese Taipei
Singapore
Belgium(Flemish)
Hong Kong
Korea
Japan
InternationalAverage
% Students Score
87 (2.4) 505 (4.2)
71 (3.6) 586 (4.5)
66 (4.2) 603 (7.1)
65 (3.2) 559 (5.8)
61 (4.3) 579 (5.5)
48 (3.9) 585 (3.2)
8 (2.1) 584 (6.1)
63 (0.6) 489 (1.1)
NOTE: Standard errors appear in parentheses.
Table
4

The Brown Center Report on American Education 11
One can’t tell from these data if the formal
study of math in other countries leads to
higher achievement or if teachers in other
countries are able to teach a more abstract
mathematics because their students are
higher achieving. But the notion that math
instruction should be based on real-world
tasks is certainly called into question.
Are reasoning and problem solving emphasized?American math reformers argue that the
U.S. math curriculum should focus more
on reasoning and problem solving. TIMSS
researchers constructed an index to measure
how much teachers stress these topics. Three
categories —high, medium, and low—reflect
curricular emphasis. Overall, the U.S. ranks
high on this measure, and two high achiev-
ing nations, Japan and Korea, rank even
higher (see Table 7). Emphasizing reasoning
and problem solving seems to be related
to high math achievement, particularly in the
U.S. American students studying a curriculum
rated “high” on this dimension (scale score
of 519) significantly outscore American
students in the “medium” (502) and “low”
(489) categories.
But Table 7 also indicates that the
benefits are limited. Only 14 scale score points
separate the international averages for the
“high” and “low” categories of this variable.
Moreover, students in high achieving nations
learn much more mathematics whether
reasoning and problem solving are empha-
sized or not. Compare the 519 scale score
of U.S. students in the “high” category with
students from other countries in the “low”
category—Japan, 562; Korea, 594; Chinese
Taipei, 573; Singapore, 599; Hong Kong,
570; Belgium (Flemish), 540. American
students studying a curriculum steeped in
reasoning and problem solving score well
below foreign students exposed to very little
reasoning and problem solving.
These gaps are enormous. If the
TIMSS-R data are to be believed, the U.S.
is not going to catch up with high scoring
nations by using items from everyday life in
math instruction or emphasizing reasoning
and problem solving in the math curriculum.
U.S. students who experience these reforms
learn only a fraction of what students in high
achieving nations learn when they do not
experience them. The problem of under-
achievement may be rooted too deeply in
American schooling to be solved by minor
changes in curriculum and instruction.
Students’ Use of Items from Everyday Life in Math Work(TIMSS-R, 1999, Grade 8)
Table
6
NOTE: Standard errors appear in parentheses.
Pretty Often
%Students Score
31 (0.8) 509 (3.8)
34 (0.9) 606 (6.9)
31 (0.8) 600 (4.0)
20 (0.8) 560 (4.4)
24 (0.8) 583 (6.5)
12 (0.6) 602 (3.2)
17 (0.7) 590 (3.5)
26 (0.2) 493 (0.9)
Once in a While
%Students Score
34 (0.7) 515 (4.1)
36 (1.1) 617 (6.3)
43 (0.8) 590 (4.4)
47 (1.1) 567 (4.0)
56 (0.9) 587 (4.0)
47 (0.8) 595 (2.3)
55 (0.8) 583 (2.1)
39 (0.2) 497 (0.9)
Never
Country
United States
Singapore
Chinese Taipei
Belgium (Flemish)
Hong Kong
Korea
Japan
InternationalAverage
Almost Always
%Students Score
23 (0.9) 489 (5.1)
16 (0.8) 578 (7.8)
11 (0.5) 596 (6.2)
7 (0.7) 531 (13.8)
6 (0.3) 573 (8.0)
3 (0.3) 580 (7.5)
2 (0.2) —
15 (0.1) 474 (1.4)
%Students Score
12 (0.7) 493 (6.8)
14 (0.8) 599 (6.1)
15 (0.7) 540 (6.5)
27 (1.1) 552 (4.8)
15 (0.7) 570 (6.1)
37 (0.8) 573 (2.7)
27 (1.0) 564 (3.3)
19 (0.2) 478 (1.0)
NOTE: Standard errors appear in parentheses.
Curricular Emphasis on Reasoning and Problem Solving(TIMSS-R, 1999, Grade 8)
High
Country
Japan
Korea
United States
Chinese Taipei
Singapore
Hong Kong
Belgium(Flemish)
International Average
% Students Score
49 (4.1) 584 (2.6)
21 (3.0) 588 (4.0)
18 (2.5) 519 (12.4)
13 (2.4) 571 (7.5)
7 (2.1) 617 (25.9)
6 (2.2) 597 (13.7)
1 (0.4) —
15 (0.5) 493 (3.5)
Table
7
Medium
% Students Score
45 (4.1) 574 (2.5)
66 (3.3) 586 (2.6)
57 (2.9) 502 (4.1)
58 (4.2) 594 (6.0)
47 (4.0) 607 (8.8)
56 (3.6) 591 (5.7)
39 (3.1) 592 (4.9)
61 (0.7) 490 (1.0)
Low
% Students Score
7 (2.1) 562 (6.2)
13 (2.4) 594 (4.6)
24 (2.7) 489 (6.4)
29 (3.8) 573 (6.9)
47 (4.4) 599 (8.2)
38 (3.7) 570 (8.1)
61 (3.1) 540 (5.4)
24 (0.6) 479 (1.5)

12 The Brown Center Report on American Education
Part I The Nation’s Achievement
NAEP and the reading gapWhen the NAEP scores for fourth grade reading
were released in April, 2001, officials high-
lighted a widening gap between the nation’s
best and worst readers. In the NCES press
release, Gary Phillips, Acting Commissioner at
the National Center for Education Statistics
(NCES), reported, “Over the past eight years,
we have seen a gradual widening of the gap
between the reading skills of the highest and
lowest performing students. In other words,
the best students are reading better, while the
worst students are falling further behind.”
Phillips used this to explain why
the national average remained unchanged
from 1992 to 2000. “Although the gap
between high and low performing students
has widened,” Dr. Phillips went on to say,
“the average reading scores for America’s
fourth-graders have remained unchanged
over the past eight years. Improvements in
scores for high-performing students—those
at the 75th and 90th percentiles— were
offset by declining scores for low-performing
students—those at the 10th percentile—
so that the overall net effect was no change
in the statistical average.” U.S. Secretary of
Education Rod Paige seconded this interpre-
tation, noting that the results showed “the
better students getting better, and the worse
students getting worse.” 9
The following week, a report commis-
sioned by the National Education Goals
Panel (NEGP) and authored by Paul E.
Barton made the same argument. Analyzing
state by state NAEP results from 1992 to
1998, the report concluded, “Good readers
are getting better at the same time weak readers
are losing ground.” Popular press accounts
echoed this line. A New York Times article was
headlined, “Test Results From States Reveal
Gaps in Learning,” and similar stories in the
263 263 264261
243 244 245242
189193
193194
159167
163
170
1992150
170
190
210
230
250
270
1994 1998 2000
25th percentile (-1 point)
75th percentile (+3 points)
10th percentile (-7 points)
90th percentile (+3 points)
Fig
3Main NAEP shows a widening reading gap.
Since 1992, the best readershave improved while the worstreaders have slipped.
Fourth grade reading scores as measured by the National Assessment of Educational Progress (NAEP), 1992-2000.

The Brown Center Report on American Education 13
Washington Post and Education Week empha-
sized the widening gap between high and
low performing students.10
Commentators expressed understand-
able concern. Hugh B. Price of the National
Urban League, stated, “These are totally unac-
ceptable levels of movement.” Amy Wilkins of
the Education Trust drew a troubling conclu-
sion: “It’s frightening in that it would appear
that in some ill-considered attempt to respond
to the demands of higher achievement, what
schools did was focus on the kids that were
most likely to succeed.”11
Is the reading gap really widening?Let’s examine the data that triggered these
warnings, the 2000 main NAEP scores, and
pay close attention to how scores have
changed since 1992. The scores in Figure 3
are for the nation’s fourth graders. The fol-
lowing discussion will be confined to fourth
grade reading for the sake of simplicity. The
main NAEP scores of better readers, those at
the 75th and 90th percentiles, did indeed go
up and the scores of poor readers, those at the
25th and 10th percentiles, did indeed go down
from 1992 to 2000. The gap widened.
But look closer. That is only part of the
story. Also clear in Figure 3 is that the bulk of
the widening happened between 1992 and
1994. For the 10th-90th percentile gap, thir-
teen points of widening—actually, more than
the decade’s total amount—occurred in this
single two year period. What happened? In
1994, scores fell for readers at the bottom of the
distribution, especially at the 10th percentile.
The gap between the 10th and 90th percentiles
expanded to 104 scale score points. Since
1994, the gap has not hit 104 points again,
shrinking to 101 points in 2000.
The NCES press release is misleading.
Rather than showing “a gradual widening” of
the achievement gap, a more accurate summary
would be that the gap has fluctuated wildly
since 1992, rising or falling at least five scale
score points each time the test has been given.
Interpreting long-term changes in a fluctuating
statistic depends on the starting and end points
of the time period examined. So although
everything the NCES and NGEP said about
trends since 1992 is true, reporting the more
recent trend since 1994 would have created
a starkly different impression. Consider the
following true statements and imagine the
newspaper coverage if they had headlined the
release of either report: The achievement gap
between the nation’s best and worst readers
reached its widest point in 1994 but has shrunk
since then. From 1994 to 2000, at the same
time that scores of the best readers stayed
unchanged, scores of the nation’s worst readers
improved a statistically significant amount. 12
In May 2000, an NCES publication con-
cluded that NAEP scores of poor readers were
improving. Note that this NCES release came
only eleven months before NCES declared
the performance of poor readers in decline.
The 2000 report was describing progress from
1994 to 1998. It is important for the public,
press, and policymakers to pay close attention
to the time frames in this type of analysis.
Otherwise, the wrong policies will receive
blame or praise. Analysts should focus on
figuring out what schools were doing that
depressed poor readers’ performance from
1992 to 1994. That’s when the gap dramati-
cally expanded. Contrary to the outcry when
these scores were released in April, 2001,
there is scant evidence on which to criticize
current practice—at least when it comes to
the gap between the best and worst readers.13
What do state NAEP results tell us about the reading gap?The National Education Goals Panel report
analyzed different data. The NCES analyzed
national NAEP scores from the main NAEP

14 The Brown Center Report on American Education
Part I The Nation’s Achievement
test. The NEGP study relied on data from the
state NAEP tests. The two surveys administer
the same test, but the two samples of students
are drawn independently. So the state results
offer a way to check the achievement gap
using another data source.
State NAEP scores exhibit patterns simi-
lar to the national data. An analysis comparable
to NEGP's, but not identical, tests the statisti-
cal significance of scale score changes at the
25th and 75th percentiles in each state.
The gap appears to have widened.
But, as with the national NAEP, the entire
effect is explained by changes between 1992
and 1994 (see Table 8). And, again, changes
in the gap are driven by fluctuations in the
scores for poor readers, those at the 25th
percentile. From 1992 to 1994, not a single
state showed improvement at the 25th
percentile. Sixteen states experienced statis-
tically significant declines. At the 75th
percentile, three states improved, one
declined, and twenty-nine were unchanged.
The situation reversed itself in the
period from 1994 to 1998. The poorest
readers made solid gains. Scores at the 25th
percentile rose in twelve states and declined
in none. The performance of good readers
barely budged, with scores at the 75th
percentile staying flat. Two states improved,
thirty-two states showed no change,
and one declined.
The state NAEP scores reaffirm the
findings discussed above. The difference
in performance of good and poor readers
went through two phases from 1992 to 1998.
The gap widened significantly during the
first phase, between 1992 and 1994, largely
because of a drop in scores for the bottom
quartile of readers. However, the gap narrowed
in the second phase, from 1994 to 1998, as
the performance of poor readers improved.
Scores of good readers stayed relatively
stable through both phases.
What does the trend NAEP tell us about the reading gap?A third set of data, from the long-term trend
NAEP test, tells a completely different story.
It contradicts the idea that the reading gap
widened at all in the 1990s and furnishes
compelling evidence that it actually closed.
This dissenting view should be taken seriously
for two reasons. First, the trend NAEP uses a
different test than the other NAEPs. It places
greater emphasis on basic reading skills, the
most important objective of programs serving
nine year olds who don’t know how to read.
Second, as its name implies, the trend NAEP
is more appropriate than the main to draw
conclusions about long-term trends. As we
have seen, the gap between the 10th and
90th percentiles jumps around a lot. The trend
NAEP has been given ten times in reading
and the main only four, which means the
trend offers more than twice as many data
points to estimate “true” trends in long-term
achievement. In the 1990s, the trend was
given five times, the main, three (four if 2000
is included to close out the 1990s).
Figure 4 displays the trend’s reading
scores for nine year olds at the 10th and 90th
percentiles. A clear picture emerges. The
nation’s top readers gained in proficiency in
the 1980s while the scores of poor readers fell.
The gap between the two groups reached its
widest point, 116 scale score points, in 1990.
Then it reversed. Throughout the 1990s, the
gap steadily narrowed, falling a total of 15
points from 1990 to 1999. In almost equal
measures, the narrowing was a result of
poor readers’ rising scores and good readers’
falling scores. In 1996, the gap between
the best and poorest readers hit its narrowest
point since 1980.
The two NAEP tests are in conflict as
to what happened to the reading gap in the
1990s. The main NAEP shows a widening
gap from 1992 to 1994 and shrinkage since
State NAEP Reading Scores(Grade 4)
25th Percentile
1992–1994
1994–1998
States States States Improving Unchanged Declining
0 17 16
12 23 0
Table
8
75th Percentile
1992–1994
1994–1998
States States States Improving Unchanged Declining
3 29 1
2 32 1

The Brown Center Report on American Education 15
then. The trend NAEP indicates that the
gap narrowed significantly, with most of the
shrinkage occurring from 1990 to 1992.
The discrepancy arises from the two tests’
conflicting data on the performance of good
and poor readers during the decade. According
to the trend NAEP, fourth graders who
struggle with reading have improved signifi-
cantly since 1990. The main NAEP says their
performance has declined. According to
the trend NAEP, the performance of the best
fourth grade readers has declined since 1990.
According to the main NAEP, their perfor-
mance has improved.14
Summary and policy implicationsThis section has reviewed the current state of
student achievement in reading and mathemat-
ics, analyzed how the U.S. compares to other
countries on several indicators pertaining to
the teaching of math, and examined whether
the achievement gap between high and low
performing readers in the fourth grade has
expanded, contracted, or remained the same.
Findings and policy implications are:
• Federal and state test data indicate that
achievement in mathematics continues to
improve. Reading performance is holding
steady. Data conflict on two questions. The
main NAEP is reporting a much faster rate
of improvement in math than the NAEP
trend test. And the 2000 main NAEP shows
a decline in twelfth grade math skills at the
same time state tests are reporting improve-
ment in tenth grade. Federal officials should
clearly explain the differences in the content
of the NAEP math tests. And, as more state
tests come online, discrepancies between
state tests and the NAEP assessments should
be pinpointed and thoroughly researched.
1971 1975 1980 1984 1988 1990 1992 1994 1996 1999
259261
+109 +99 +97 +106 +106 +116 +104 +104 +100 +101
258 262 263 263 266260 260 260
152159
165157 157
150156 156
160158
90th percentile (-2 points)
10th percentile (+6 points)
Fig
4The trend NAEP tells a different story.
As opposed to the main NAEP, the trend test shows that the gap between the best and the worst readers shrank in the 1990s.
Age 9 reading scores as measured by the National Assessment of Educational Progress (NAEP), 1971-1999.
The two NAEP tests
are in conflict as
to what happened
to the reading gap
in the 1990s.

16 The Brown Center Report on American Education
Part I The Nation’s Achievement
• The U.S.’s international ranking in eighth
grade mathematics stayed about the same
on TIMSS tests conducted in 1995 and 1999,
near the middle of the pack. Eighth grade
American math teachers express confidence
in their teaching despite having studied less
mathematics than other teachers around the
world—and considerably less than teachers
in high achieving countries. In their math
lessons, American students are more likely to
use items from everyday life and to focus on
reasoning and problem solving than students
in most other countries. These practices are
of limited benefit. Although the data demon-
strate correlation, not causation, they suggest
that making sure teachers are well educated
in mathematics may yield greater payoffs
than altering a few classroom practices.
• The gap between high and low performing
readers is not as clear-cut as concluded by
two influential reports released in 2001.
Again, there is a conflict between the two
NAEP tests. The main NAEP shows the read-
ing gap expanding. The trend NAEP shows it
contracting. In reading, as in math, officials
should explain the differences in the two
NAEPs and how those differences affect the
interpretation of achievement trends.
• In both reading and math, the trend tests
favor traditional content. The main favors
contemporary notions of how the two
subjects should be changed. In reading, for
example, the main reading test asks more
situational and contextual questions than
the trend. It also asks questions requiring
extended, written responses rather than
the trend’s multiple choice questions. The
main NAEP might ask students to compare
the character of a story to another character
they’ve encountered in movies, in books, or
on television. Questions of this type rely
on knowledge external to the test’s reading
passages and tap writing skills as much as
reading. The trend, on the other hand,
more often asks students to identify the
correct meaning of words. It is more likely
to pose comprehension questions directly
related to the passages that the student
has read on the test. The trend test is more
self-contained.
Federal officials considered halting
the NAEP trend tests in the late 1990s.
Fortunately, they didn’t. As this report shows,
giving two different tests requires that
conflicting data from the two instruments
be reconciled. In one respect, that inconve-
nience is a strength, not a weakness. Only
by having two tests can it be determined
how students are doing on both traditional
content and the content reformers want
schools to teach.

Part
IIHIGH SCHOOLCULTURE
The Brown Center Report on American Education

18 The Brown Center Report on American Education
ARULE OF INTERNATIONAL MATH ASSESSMENTS
is that the older the students tested, the worse the United States
performs. American fourth graders do the best, scoring in the upper
third of nations, eighth graders score near the middle of the pack, and high
school seniors fall significantly behind the rest of the world. Why is this? An
observer in a unique position to shed light on this question is the foreign
exchange student. By having personally experienced American high schools
up close, foreign exchange students can offer insights about American
teenagers and American high schools that might otherwise be overlooked.
With the cooperation of the American Field
Service (AFS), the Brown Center conducted a
survey of foreign exchange students in U.S.
high schools during the 2000-2001 academic
year. After AFS provided us with a list of 2,200
students, we randomly drew a sample of 500
and administered a short survey by mail.
Questions focused on comparing high school
culture in the U.S. and abroad, especially the
beliefs and activities of teens known to affect
academic performance. Completed surveys
were received from 368 students, about 73%.
This is a terrific return rate. We also over-
sampled students from five high achieving
nations on TIMSS: France, Sweden, Russia,
Hong Kong, and Japan. The return rate for the
sample of high achieving nations was also
high, about 76%.
The response rates make us confident
that the survey findings are an accurate reflec-
tion of opinions in both samples. However,
exchange students are almost certainly not
representative of their countries’ students as
a whole. Although we collected very little
personal information from the students, it is
safe to assume that they are excellent students,
probably from families with above average
wealth, attended U.S. schools that are above
average in performance, and, while in the U.S.,
enrolled in classes designed for high achievers.
The survey’s findings should be considered
only applicable to the sampled population,
foreign exchange students in the American
Field Service’s program. We are currently sur-
veying American students in the AFS program
who have attended high schools in other

The Brown Center Report on American Education 19
countries—the most logical comparison
group—but that study won’t be completed
until the winter of 2001.
Before discussing the results, some
historical background is in order.
The study of teensJust about everyone who writes about high
schools eventually writes about high school
students. In part, this is because a school’s
accomplishments are registered in the changes
it causes in students. It’s also because of adult
society’s endless curiosity about teens. The
interest ranges from the trivial—what they
eat, the music they listen to, the clothes they
wear—to the serious—their values, the people
they admire, what they hope to accomplish
in life. Today, interest in teen culture is high,
mirroring demographic trends. High schools
enrolled approximately 15 million students
in 2001, with about 13.6 million students
in public schools and 1.4 million in private
schools. By 2005, high schools will add at
least a million more students, surpassing the
previous peak of 1976, as the children of
baby boomers and recent immigrants reach
high school age.15
Historically speaking, scholarship on
high school students is relatively new. Imagine
visiting a medium-sized American town in
1880. You probably wouldn’t have found
a high school there. The few hundred that
existed nationwide were primarily located
in large cities. Less than one in ten young-
sters of high school age attended school,
and those who did went an average of only
eighty-six days annually.16
You wouldn’t have asked about teen-
agers. The term wasn’t invented until the
middle of the twentieth century. In fact, in
1880 most questions about adolescence would
have elicited blank stares. Adolescents
weren’t considered a distinct group because
adolescence wasn’t considered a distinct
developmental period. More than 70% of the
U.S. population lived in rural areas. Children
worked on farms or in small shops, learned
how to make a living in the family, and
shortly after the onset of puberty, became
adults. The time between childhood and
adulthood was too fleeting to be thought
remarkable. A significant number of young
men and women were parents themselves
before they reached twenty years of age.17
Forty years later, everything had
changed. We know how teenagers lived in
the 1920s from the intricately detailed descrip-
tions of life in Middletown, the landmark
study of a Midwestern town by Chicago soci-
ologists Robert and Helen Lynd. Four decades
of surging high school enrollments meant
that huge groups of adolescents now spent
most of the day together, segregated from
families and the adult world, an arrangement
unheard of in agrarian society. In the chapter,
“School ‘Life,’” the Lynds describe Middletown’s
high school of 2,000 students as “a fairly
complete social cosmos in itself.” The formal
instruction provided by teachers and other
adults was contrasted with the informal
instruction of the school’s social life. “This
informal training is not a preparation for a
vague future that must be taken on trust, as
is the case with so much academic work; to
many of the boys and girls in high school
this is ‘the life,’ the thing they personally like
best about going to school.”18
Yearbooks trace the trajectory of the
school’s social and academic missions. The
first edition, published in 1894, featured
the senior class and the school’s faculty
members, along with descriptions of course
offerings. By 1924, “athletics shares the
position of honor with the class data, and
a faculty twelve times as large occupies
relatively only half as much space.”
In the 1950s, another sociologist,
James S. Coleman, studied high schools and

20 The Brown Center Report on American Education
Part II High School Culture
warned about the formation of these mini-
societies. In retrospect, Coleman’s 1961 book,
The Adolescent Society, appeared on the scene
like a skunk at a picnic. The post-WWII baby
boom was in full swing, Hollywood churned
out motion pictures celebrating youth, Doctor
Spock’s baby books climbed to the top of
best-seller lists, and consumer products in
the U.S. were increasingly pitched to a youth-
oriented market.19
Coleman found that youngsters’
admiration for academic accomplishments
begins to wane immediately after entering
high school. For males, social rewards in the
typical American high school are allocated
on the basis of athletic prowess, not academic
excellence. In interviews with students,
Coleman discovered that the typical high
school social system judges hard work and
effort differently in different pursuits, that
“the boy who goes all-out scholastically is
scorned and rebuked for working too hard;
the athlete who fails to go all-out is scorned
and rebuked for not giving his all.” Acceptance
of peers assumes special urgency in adoles-
cence. Adults, not teens, are responsible for
the anti-intellectualism of teen culture. As
Coleman stated, “The norms of the system
are created in large part by the activities to
which it is subject. And it is the adult commu-
nity that fixes the activities of the adolescent
community.”20
A cautionary note was struck again when
Laurence Steinberg led a team of researchers
that studied 20,000 American high school
students in the 1980s and 1990s. Steinberg
argued that school reformers, despite more
than a decade of strenuous effort, had failed
to significantly improve American education
by doing exactly what Coleman had urged
them not to do—ignore teen culture. The1993
book, Beyond the Classroom, carefully docu-
mented how teens spend their time. The
average teen devotes about five hours each week,
less than 10% of waking, out-of-school time,
to homework or studying. Three activities
absorb the most time—extra-curricular activ-
ities (including sports), hanging out with
friends, and part-time jobs.21
These activities seep into school life and
weaken the press for academic excellence. For
individuals, an excessive commitment to any
of them drives down academic achievement.
Parents and employers, Steinberg pointed out,
undermine school achievement by tolerating,
sometimes even actively supporting, excessive
time spent on sports, friends, and jobs at the
expense of fulfilling academic responsibilities.
Tinkering with the structure of high schools
by adding time to the school day or making
coursework more difficult will have no effect,
Steinberg concluded, until adults more aggres-
sively guide teen culture towards intellectually
productive ends.
The 1990s research of Barbara
Schneider and David Stevenson closed out
the twentieth century by producing a book-
end to the Lynds’ findings from Middletown.
The century had begun with teens flocking
to high schools. The century ended with
near universal high school attendance and
high school graduates flocking to colleges. In
The Ambitious Generation: America’s Teenagers,
Motivated But Directionless, Schneider and
Stevenson focused on the mismatch between
teens’ post-secondary ambitions and their
plans for accomplishing them. Almost all
teens want to attend college and enter a
profession, but they have no idea of the
skills and knowledge required to do so. In
some cases, students overestimate what they
need to learn to realize their ambitions; in
other cases, they underestimate and fail
to take courses that would even minimally
prepare them for college. Like researchers
before them, Schneider and Stevenson
found schools, parents, and peers all impor-
tant influences on students. But, sadly,
Coleman found that
youngsters’ admiration
for academic accom-
plishments begins to
wane immediately after
entering high school.

The Brown Center Report on American Education 21
these influences often reinforce the “present-
mindedness” of high school students rather
than pointing them toward the future.22
These studies span several decades
and involve tens of thousands of students.
A common thread runs through the literature.
Schools influence students. But causality also
points in the other direction. The survey
that the Brown Center conducted of foreign
exchange students proceeds from this latter
assumption, that students play a significant
role in creating the cultures that give schools
unique identities. Foreign students who have
attended American high schools may help
to explain why the U.S. perennially under-
achieves on international assessments. Or,
to phrase the comparison more positively,
the findings may help to explain why high
school students in many Asian and European
nations always do well on tests of academic
knowledge.
In a nutshell: they work harder and
care more. The answers to four questions
support this conclusion.
How do American classes compare?Overwhelmingly, the foreign exchange
students found U.S. classes easier than classes
in their home countries (see Figure 5). More
than half, 56%, described the U.S. classes they
attended as much easier and 29% as a little
easier. In contrast, only 5% found U.S. classes
much harder and 6% a little harder. Even con-
sidering that exchange students are excellent
students, as noted above, while in the U.S.
they usually attend above average schools and
take the toughest classes that American high
schools have to offer. Compared to the classes
they are familiar with back home, which
probably serve high achieving students, the
American classes do not seem very rigorous.23
Fig
5American classesare easier.
The survey asked foreign exchange students to compare their U.S. classes to classes in their home country.
56%much easier
29%a little easier
4%about the same
6%a little harder
5%much harder
Margin of error: +/- 5%

22 The Brown Center Report on American Education
Part II High School Culture
This perception is widespread among
students coming from our subsample of high
scoring countries on TIMSS. The percentage
of students describing American classes as
much easier: Sweden 55%; Hong Kong, 60%;
Japan, 61%; Russia, 67%; France, 73%. It’s
clear that students from the highest achieving
countries in Europe and Asia regard American
high schools as less demanding. How American
students use their time may be one reason
they think so.
Do American students spend as much time on schoolwork? We asked exchange students to compare the
amount of time U.S. students and students in
their home countries devote to schoolwork.
More than a third, 34%, said U.S. students
spend much less time on schoolwork, and 22%
said a little less time (see Figure 6). This com-
pares with 11% who felt that Americans spend
much more time on schoolwork, and 14% who
believed the U.S. students’ time commitment
was a little more. No shock here. The figures
reaffirm other surveys of international study
habits. American students don’t spend as much
time on studying—either in school or at home—
as kids in other countries. The exchange
students provide an interesting, counter-intu-
itive caveat to this finding, however. It isn’t
simply more homework that makes a differ-
ence. The survey inquired about the frequency
of math homework. Estimates of how often
math homework is assigned in the U.S. and
abroad are almost identical (see Figure 7).
Almost half of the exchange students, 47%,
said homework is assigned everyday in their
U.S. schools; 42% said it’s assigned everyday
at their home schools. About 34% said math
homework is assigned three or four times a
week in U.S. schools, and 37% gave the same
estimate for schools in their home countries.24
It’s clear that students
from the highest
achieving countries in
Europe and Asia regard
American high schools
as less demanding.
Fig
6American students don’t spend as much time on schoolwork.
Exchange students were asked: “Compared to students in your home country, do you think U.S. students spend more, less, or about the same amount of time on schoolwork?” 34%
much less
22%a little less
18%about
the same
14%a little more
11%much more
Margin of error: +/- 5%

The Brown Center Report on American Education 23
How can American kids spend less
time on schoolwork but have homework
assigned just as often? Speculation is war-
ranted here. Consistent with courses being
easier, U.S. homework may be as frequent
but take less time to complete. It could also
be that students abroad spend more time
preparing for class, studying for tests, and
reviewing material previously covered,
activities of good students that go beyond
completing assigned homework.
It’s important to note that such activities
are self-initiated. And in good schools, they
aren’t considered extraordinary. Students are
assumed to do them—by teachers and by
other students. It’s what good students do. That
is what is meant by a strong academic culture.
Students at high achieving schools share values
and beliefs that support academic striving.
High achieving countries do too. It is evident
in the way kids from different countries treat
non-academic activities that may interfere
with their responsibilities as students.25
Do American students value academic success?We asked the exchange students to compare
their friends in the U.S. and students back
home on the importance of doing well in math.
Then we asked them to make the same
comparison for doing well in sports. As shown
in Figure 8, the exchange students don’t believe
American students value success in mathemat-
ics as much as kids in their home countries.
Almost half (17.5% + 27.1%=45%) said U.S.
students place less importance in the subject,
as opposed to only 14% saying math is more
important in the U.S. Doing well at math is a
core value of high school students elsewhere
in the world. This is especially true for high
achieving nations, with Russia, Japan, and
Hong Kong standing out. The percentage of
1.8% 2.8%
never
2.5%4.7%
<1
14.0% 14.3%
1-2
34.4%36.5%
3-4
47.3%
41.8%
every day0%
5%
10%
15%
20%
25%
30%
35%
40%
45%
50%
Fig
7
Math homework is assigned with equal frequency in the U.S. and abroad.
Exchange students reported how many days per week math homework was assigned at their U.S. school and at their home school.
Home school
U.S. school
Margin of error: +/- 6%
American students don’t
spend as much time on
studying—either in
school or at home—as
kids in other countries.

24 The Brown Center Report on American Education
Part II High School Culture
students saying that math is less important
to U.S. students: France, 46%; Sweden, 51%;
Russia, 63%; Japan, 69%; Hong Kong, 84%.26
The pattern is starkly different for athletic
accomplishments. Exchange students view
success in sports as a top priority of American
high school students. How important? The
numbers are lopsided (see Figure 9). More
than two-thirds of exchange students report
that success in sports is much more important
to their American friends than to students
in home countries. Another 18% say a little
more important. As mentioned above, in
Coleman’s study in the 1950s, athletes com-
manded the top status positions among peer
groups in typical American high schools.
In the eyes of students from other countries,
the paramount importance of sports persists
to this day.
Teen employment in the U.S. also differs
from other countries. Most American teens
hold down part-time jobs. A recent federal
government study of high school seniors
concluded that the final year of high school
is essentially wasted time, devoted more to
non-academic activities than to learning.
Employment is one of the culprits diverting
seniors’ attention from academics, even
among students headed for college. In a fall
2000 survey of college freshmen, only 26%
said they had not worked during a typical
week of their senior year in high school. This
distraction does not exist in other countries.
More than 70% of exchange students said they
don’t work during a normal school week at
home (see Figure 10). The percentage of non-
working students was greatest in high
achieving countries: Japan, 74%; Sweden,
76%; France, 88%; Hong Kong, 91%; and
Russia, 93%.27
Compared to the rest of the world, why
do American teens spend so much time on
A recent federal
government study of
high school seniors
concluded that the
final year of high school
is essentially wasted
time, devoted more to
non-academic activities
than to learning.
0%
5%
10%
15%
20%
25%
30%
35%
40%
45%
50%
Fig
8
Success in mathmeans less in the U.S.
Exchange students were asked, “Comparedto students in your homecountry, how importantdo your U.S. friends thinkit is to do well in math?”
17.5%
27.1%
41.0%
10.1%4.1%
much less a little less about the same a little more much more
Margin of error: +/- 5%
The Brown Center Report on American Education 25
Fig
10Exchange students aren’tdistracted by part-time jobs.
Students were asked,“During a normal school week in your homecountry, how much timebefore and after schooldo you usually spendworking at a paid job?”
2%<1 hour per week
6%1-2 hours per week
10%3-5 hoursper week
9%>5 hoursper week
73%no time
Margin of error: +/- 5%
0%
10%
20%
30%
40%
50%
60%
70%
80%
Fig
9
Success in sports is dramatically more important in the U.S.
The survey asked, “Compared to students in your home country, how important do your U.S. friends think it is to do well in sports?”
1.1% 2.5%11.5%
17.8%
67.2%
much less a little less about the same a little more much more
Margin of error: +/- 5%

26 The Brown Center Report on American Education
Part II High School Culture
part-time work? And why do they value success
in sports more than success in mathematics?
Clues may be found in the fundamental reasons
why students go to school.
Why do students go to school?We presented a list of reasons why young
people go to school and asked the exchange
students to rate each one on their importance
to young people in the U.S. and abroad. As
shown in Figure 11, learning core subjects—
math, science, literature, and history—is far
more important internationally than in the
U.S. This is an American problem, not a
teen problem. Americans tend to dismiss
the traditional justification for a liberal arts
education, that learning for the sake of
learning is a virtue, celebrating education’s
practical value instead.28
But Figure 11 also reveals an irony.
American high school students perceive
only ambiguous connections between
high school and the world of work. As
Schneider and Stevenson found in their
study, American students probably cannot
identify the specific skills and knowledge
needed for most occupations nor the high
school courses in which these skills and
knowledge are taught. American students
may also believe that the so-called “soft
skills,” non-academic skills that are important
to employers (for example, teamwork, fol-
lowing directions, punctuality) are learned
through part-time employment. Students
elsewhere in the world believe that high
school prepares them for an occupation and
see intellectual development as central to
the task. Perhaps the notion that a solid
grounding in intellectual disciplines opens
the door to most professions is more explic-
itly visible in the larger, national culture
of other nations.
51.9%
21.8%
learn math, science, literature and history
44.7%
68.7%
prepare for an occupationIn U.S.
In home country
Fig
11American and exchange studentsdiffer on why they go to school.
Much higher percentages of the sample said that intellectual developmentand career preparation were “very important” to foreign students than to their American counterparts.
0%
10%
20%
30%
40%
50%
60%
70%
80%
90%
100%
Students were asked to rate each reason as “very important,” “somewhat important,” or “not important.”
Margin of error: +/- 5%
Students elsewhere in
the world believe that
high school prepares
them for an occupation
and see intellectual
development as central
to the task.

The Brown Center Report on American Education 27
Figure 12 displays two areas in which
the exchange students think American and
students abroad are alike. Worldwide, teens
are social animals. Seeing friends is a universal
reason for going to high school and it need
not interfere with academic excellence. The
position of high school as a stepping stone
to college is also widely acknowledged. These
areas of similarity are encouraging. According
to exchange students, the “hallway” life of
other nations’ schools really isn’t very differ-
ent. Reshaping the American high school’s
culture will not require teenagers to stop
acting like teenagers.
Summary and conclusionsStudents from abroad see American high
schools as less focused on academic accom-
plishments than schools in their home
countries. They don’t believe that American
students work as hard as students elsewhere
in the world. American students don’t seem
to care as much about learning academic
subjects such as mathematics. They seem to
care more about success at sports. Most
American high school students hold down
part-time jobs. Internationally, the vast majority
of high school students do not. American
students are also less aware of how experiences
in high school are related to their occupational
aspirations. But, like students in other coun-
tries, American students are very aware of high
school’s importance in getting into college.
And, like teens everywhere, they enjoy being
with their friends.
This portrait may be unduly harsh,
exaggerating the non-intellectual side of U.S.
education. A survey that asks teenagers to
compare their home country to another is
bound to stir some national pride, perhaps even
chauvinism. Because of the passage of time,
exchange students may remember their home
schools as more challenging than they really
are, something akin to absence making the
Margin of error: +/- 5%
61.3%
70.0%
see friends
64.2%
73.6%
prepare for college
In U.S.
In home country
Fig
12But there are twoareas of agreement.
Both U.S. and exchange students see social lifeand college preparation as “very important” reasons for going to school.
0%
10%
20%
30%
40%
50%
60%
70%
80%
90%
100%
Students were asked to rate each reason as “very important,” “somewhat important,” or “not important.”
Reshaping the
American high school’s
culture will not require
teenagers to stop acting
like teenagers.

28 The Brown Center Report on American Education
Part II High School Culture
heart grow fonder. Homesickness may even
play a part. These influences will become
clearer when survey data from the U.S. students
abroad are analyzed. If they are real, the same
effects should show up there and work in favor
of how U.S. schools appear.
That said, it would be a mistake to dis-
miss these findings. In the hundreds of surveys
returned to the Brown Center, there was no
indication that the exchange students had an
axe to grind or that they had anything but
fondness for the United States, their American
schools and teachers, their host families, and
the friends that they have met here. The survey
asked them to make certain comparisons and
estimates. They did that without rancor. These
are the impressions of friends. They should
be taken at face value.
Another plausible response to these
findings is to accept their validity but dismiss
them as irrelevant. Teaching academic subjects
has always been a central goal of American
schooling, but not the only one. American
parents want their children to be “well-
rounded.” Knowledge is important, but so are
social skills and the ability to get along with
others, high ethical standards, creativity, a
commitment to democracy and the welfare of
communities, and sound practical judgment.
Harvard psychologist Howard Gardner, writ-
ing in reaction to the U.S.’s disappointing
scores on yet another international assessment,
argued that there is too much national hand-
wringing over how American students rank
on such tests. Whether one considers the low
status of academic pursuits a defect of
American schools depends on the importance
attributed to academic accomplishments
in the first place.29
The portrait painted by this survey is
consistent with the findings of decades of
research on American adolescents and high
schools. Experts have also described the
changes individuals can make to alter the
situation. Policies may help, but only if they
encourage changes in individual behavior
that produce shifts in culture. Teens can work
harder and spend more time on schoolwork.
Schools can expect more and structure the
school environment around intellectual
accomplishments. Parents can closely monitor
their children’s academic progress and discour-
age activities that interfere with learning.
Employers can stop hiring teenagers to work
part time during the school year, especially
on school nights. All American adults who
interact with teens, including producers of pop
culture, can stress the fundamental importance
of improving one’s mind, not only because
it’s the key to living a productive and fulfilling
life, but for its intrinsic worth.
Dramatically changing American teen
culture requires that academic learning
become a greater priority—for teenagers, of
course, but also for parents, for educators, for
employers, and for American society as a whole.
Dramatically changing
American teen culture
requires that academic
learning become a
greater priority—for
teenagers, of course,
but also for parents, for
educators, for employers,
and for American
society as a whole.

The Brown Center Report on American Education
Part
IURBAN SCHOOLACHIEVEMENT
The Brown Center Report on American Education
Part
III

30 The Brown Center Report on American Education
THIS SECTION INVESTIGATES ANOTHER ASPECT OF
education that worries Americans, the low achievement of urban
school systems. It first explores how differences in reading achieve-
ment between urban and suburban students are related to achievement
gaps among racial/ethnic groups and families of different economic status.
It also reviews the performance of several urban and suburban districts that
participated in the TIMSS Benchmark study, which compared American
math achievement to the achievement of other nations. The section then
presents achievement data from big city school districts and other urban
districts across the country to find out how they score relative to state averages.
That analysis is based on both reading and math scores.
A warning up front: the report does not
identify policies and practices for improving
urban school systems. It takes the first step
toward that objective by presenting the best
available evidence on how individual urban
systems are currently performing. Until we
can identify which systems are succeeding
and failing—and then link those outcomes to
specific programs and policies—solutions to
the problems of urban education will remain
theoretical. Note too that school systems are
the unit of the analysis. From time to time,
success stories circulate about failing schools
that have been turned around by dynamic
educators or new programs. Credible evidence
of entire systems being turned around is
sparse to nonexistent. The report concludes
by discussing current policies targeted at
improving urban education, but this is only
to give readers an idea of prevalent approaches,
not to endorse one policy over another. Much
more evidence of effectiveness is needed
for that.
What has happened to achievement gaps related to race and ethnicity?A dramatic success story of the past three
decades has been the rising achievement of
African-American and Hispanic students.

The Brown Center Report on American Education 31
Black-White and Hispanic-White Gaps in Achievement,Main NAEPReading Scores(Grade 4, 2000)
National
Suburbs
Non-FreeLunch
Black- Hispanic- White White
33 29
28 26
22 19
Table
9
Reading achievement for black and Hispanic
students improved markedly in the 1970s
and 1980s (see Figure 13). The score differ-
ences between white nine year olds and both
black and Hispanic nine year olds narrowed
steadily until 1988. Since then, however, these
gaps have bounced around. They generally
widened, with the notable exception of
significantly narrowing in 1996. From 1988
to 1999, at the same time reading scores for
white students rose by three scale score points,
Hispanic scores dipped one point, and African-
American scores fell by three. Hispanic and
black scores suffered a decline from 1988 to
1990 that is more than the entire loss of the
eleven year period.30
What can we do to close these gaps?
Approximately 60% of African-American and
40% of Hispanic fourth graders attend schools
located in central cities. Black and Hispanic
reading achievement will start rising again if
urban schools are improved, but not by as
much as many people think. It is true that
urban schools under-perform their counter-
parts in suburban and rural areas. And, yes,
the black-white and Hispanic-white test score
gaps are smaller in suburban schools. But wide
achievement differences still exist there.
What would happen to racial/ethnic
achievement gaps if all schools were suddenly
made to look like schools in the suburbs? The
2000 NAEP fourth grade reading scores allow
for ballpark estimates. Scores are reported for
three locations: central city, urban fringe/large
town, and rural/small town. The “urban
fringe/large town” category is considered
analogous to suburbs.
The national black-white gap is 33 scale
score points. It is 28 points in urban fringe/
large towns (see Table 9). This suggests that
if every school in the country were suddenly
transformed into a suburban school, the
1971 1975 1980 1984 1988 1990 1992 1994 1996 1999
221214
217221
218 218 218 218217220
170
181
183189
190
186
187
189
194
182
189
185
192
185
186
191
195
186
193
160
180
200
240
220
Black (+16 points)
White (+7 points)
Hispanic (+10 points)
Fig
13The race/ethnicity gapsnarrowed from 1971-1988…
Age 9 reading scores as measured by the National Assessment of Educational Progress (NAEP) trend test, 1971-1999.
But they have widenedslightly since then.
NOTE: Reported in scale score points.

32 The Brown Center Report on American Education
Part III Urban School Achievement InternationalPerspective on U.S. School Districts’Math Achievement
Percentage of 8th graders reaching TIMSS-R median international benchmark
School District
Singapore
Hong Kong
Korea
Naperville School District #203, IL
Japan
First in the World Consortia, IL
Belgium (Flemish)
Michigan Invitational Group, MI
Montgomery County, MD
United States Average
International Average
Jersey City Public Schools, NJ
Israel
Thailand
Chicago Public Schools, IL
Rochester City School District, NY
Tunisia
Miami-Dade County Public Schools, FL
Iran
Indonesia
% of Students
93
92
91
91
89
87
85
77
77
61
50
48
47
44
41
32
32
29
25
22
Table
10
Students can:
• apply basic mathematical knowledge in straightforward situations;
• add or subtract to solve one-step word problems involvingwhole numbers and decimals;
• identify representations of common fractions and relativesizes of fractions;
• solve for missing terms in proportions;
• recognize basic notions of percents and probability;
• use basic properties of geometric figures;
• read and interpret graphs,tables, and scales, and understand simple algebraic relationships.
black-white gap would shrink by only 5 points,
a reduction of 15%. The Hispanic-white gap
would decrease from 29 points, the current
national gap, to 26 points, the gap in the sub-
urbs. This is a decline of about 10%. Admittedly,
the “urban fringe/large town” classification is
a crude proxy for suburban location, but it’s
doubtful that classifying schools with more
precision would overthrow the principal
insight here. In terms of immediate impact,
equalizing urban and suburban schools would
probably make only a small dent in achievement
gaps related to race and ethnicity.
Reducing poverty would make a bigger
difference. The free and reduced lunch
program serves children from poor families.
Among children who do not qualify for the
free and reduced lunch program—in other
words, children from families above the
poverty line—the black-white test score gap
is 22 points, one-third less than the 33 point
gap between all black and white fourth
graders. The Hispanic- white gap for non-
qualifiers of the free lunch program is 19
points, also about 33% less than the 29 point
gap for all Hispanics and whites nationwide.
Non-free lunch students in the suburbs
outscore non-free lunch students in the cen-
tral city by 5 points, a gap that is 62% less
than the urban-suburban gap of 13 points
across the nation (not shown in table).
Please note that these “back of the
envelope” calculations are not the same as
controlling for inequalities in income. Families
that do not qualify for free lunch range from
those barely above the poverty line to those
living in mansions. The category is so broad
as to dramatically understate the correlation
of family income to achievement. Caroline
Hoxby reports that family variables—parent
income, education, race, ethnicity, and
involvement with school, etc.—account for
about 93% of the explained variation in
twelfth grade math achievement in the
National Educational Longitudinal Survey
(NELS). Hoxby cautions that this does not
mean that schools are helpless. The family
variables include characteristics that good
schools are able to exploit to boost learning.
Also bear in mind that equalizing the quality
of urban and suburban schools could unleash
several long-term benefits: high achieving
urban youngsters in private schools returning
to the public system, parents staying put who
now move out of cities in search of better
schools, urban taxpayers adopting more
generous attitudes toward school funding,
and excellent teachers with several job offers
choosing to teach in urban classrooms.31
How do urban districts compare internationally? The TIMSS Benchmark study, released in
April, 2001, provides an international yardstick
for measuring achievement. Several states,
school districts, and consortia of districts
volunteered to take the TIMSS-R assessment, a
math and science test given to eighth graders
in dozens of countries around the world
in 1999. The U.S. as a whole scored slightly
above the international average. Districts
in the U.S. were a mixed bag. Students in
Naperville, IL and the First in the World
Consortia, a group of well-to-do districts in
suburban Chicago, scored at very high levels,
with about 90% of students meeting the
median world benchmark for math profi-
ciency (see Table 10). This is comparable
to the performance of students in Singapore,
Japan, Korea, Hong Kong, and other high
achieving countries.
At the other end of the spectrum, three
urban districts, the Miami-Dade, Rochester,
and Chicago school districts, scored at about
the same level as Thailand, Tunisia, and Iran.
The data spotlight the vast differences
in achievement within the U.S. The gap
between the lowest and highest performing
Median Benchmark

The Brown Center Report on American Education 33
districts, Miami and Naperville, is much larger
than the gap between the United States and
Singapore, the highest scorer on the test.
How are big city districts doing on state tests?The TIMSS Benchmark study only included a
small number of school districts in the United
States. How are students performing in other
big city districts? We used state tests from the
1999-2000 academic year to estimate how
urban schools compete with rural and suburban
schools in the same state. We collected data
from twenty-one states, created a composite
score combining performance in fourth grade
reading and eighth grade math, and computed
a z-score for each state’s districts. Z-scores are
expressed in standard deviation units and report
a district’s performance relative to the state
average. Districts scoring one standard devia-
tion above their state’s mean have z-scores of
+1.00, one standard deviation below the mean,
-1.00. The endnotes provide additional infor-
mation on how these calculations were made.32
Table 11 displays the year 2000 perfor-
mance of districts in the nation’s fifty largest
cities, rank-ordered by population. A few
caveats. Conjuring these scores into a competi-
tion that pits city against city is inappropriate.
Even in the same subjects, state tests vary in
what they assess and how they assess it. Districts
differ on factors that influence achievement,
such as the proportion of students in poverty
or of students lacking English proficiency.
They differ on how many students are excluded
from testing and the reasons for doing so. And,
since the scores presented here reflect relative
performance—each district in comparison to
other districts in the same state—it is important
to note that the comparison groups are vastly
different from state to state. A low scoring
district in a high achieving state may be
performing at a level similar to the average
district in a low achieving state. This is the
Achievement in the Nation’s Top Fifty Cities, 2000Rank-ordered by City Population(Scores on State Tests)
City
New York City
Los Angeles
Chicago
Houston
Philadelphia
San Diego
Phoenix
San Antonio
Dallas
Detroit
San Jose
San Francisco
Indianapolis
Jacksonville
Baltimore
El Paso
Memphis
Austin
Milwaukee
Boston
Seattle
Charlotte
Nashville
Fort Worth
Denver
Tucson
New Orleans
Long Beach
VirginiaBeach
Las Vegas
Sacramento
Fresno
Atlanta
Miami
Mesa
Oakland
Minneapolis
Colorado Springs
Pittsburgh
State
NY
CA
IL
TX
PA
CA
AZ
TX
TX
MI
CA
CA
IN
FL
MD
TX
TN
TX
WI
MA
WA
NC
TN
TX
CO
AZ
LA
CA
VA
NV
CA
CA
GA
FL
AZ
CA
MN
CO
PA
School District
New York City Public Schools
Los Angeles Unified School District
Chicago Public Schools
Houston Independent School District 1
School District of Philadelphia
San Diego Unified School District
Paradise Valley Unified District 1
San Antonio Independent SchoolDistrict 1
Dallas Independent School District
Detroit Public Schools
San Jose Unified School District
San Francisco Unified School District
Indianapolis Public Schools
Duval County Public Schools
Baltimore City Public School System
El Paso Independent School District 1
Memphis City Schools
Austin Independent School District
Milwaukee Public Schools
Boston Public Schools
Seattle Public Schools
Charlotte-Mecklenburg Schools
Nashville-Davidson CityPublic Schools
Fort Worth Independent School District
Denver Public Schools
Tucson Unified School District 1
New Orleans Public Schools
Long Beach Unified Public School District
Virginia Beach City Public Schools
Clark County School District
Sacramento City Unified School District
Fresno Unified School District
Atlanta Public Schools1
Miami-Dade County Public Schools
Mesa Unified School District 1
Oakland Unified School District
Minneapolis Public Schools
Colorado Springs Public Schools
Pittsburgh Public Schools
City % Free % Black Population
Z-Score Lunch + Hispanic Rank
-2.40 0.58 0.74 1
-1.31 0.73 0.82 2
-2.29 0.56 0.86 3
-1.02 0.60 0.86 4
-3.38 0.42 0.75 5
-0.25 0.64 0.50 6
1.44 0.16 0.10 7
-2.23 0.80 0.94 8
-3.18 0.65 0.86 9
-1.42 0.64 0.93 10
0.00 0.43 0.51 11
0.25 0.65 0.38 12
-2.64 0.64 0.59 13
-0.41 0.38 0.42 14
-2.73 0.65 0.85 16
-1.03 0.59 0.80 17
-2.66 0.38 0.82 18
-1.52 0.42 0.59 19
-4.40 0.66 0.72 20
-1.95 0.46 0.73 21
0.24 0.19 0.31 22
-0.69 0.29 0.43 23
-1.22 0.32 0.43 25
-1.53 0.53 0.70 27
-1.70 0.51 0.68 29
0.08 0.34 0.47 31
-1.98 0.70 0.92 32
-0.88 0.64 0.58 34
0.26 0.17 0.26 35
-0.39 0.27 0.33 37
-0.47 0.59 0.43 38
-1.16 0.62 0.53 39
-0.87 0.74 0.92 40
-1.77 0.53 0.84 44
1.00 0.19 0.19 45
-1.31 0.60 0.73 46
-3.40 0.54 0.45 47
0.12 0.23 0.23 48
-1.80 0.42 0.56 49
Table
11
NOTE: Data unavailable for 11 cities.
1Common Core (1995) indicates this is the largest public school district in a city that is served by multipleschool districts.

34 The Brown Center Report on American Education
Part III Urban School Achievement
problem of comparing big and little fishes
swimming in lots of big and little ponds.
Despite these limitations, the data are
useful. They accurately depict how districts
in each state are judged by the public when
test scores are released. They also show the
magnitude of the task of turning around
many urban districts. Table 11 is dominated
by minus signs. Thirty-one of these cities,
about 80%, score below their state average
(z-score of 0.00); twenty-four (62%) have
z-scores below -1.00, and ten (26%) have
z-scores below -2.00. Only eight cities, 21%,
score at or above their state average, and six
of these have fewer than 40% of students
qualifying for free and reduced lunch, approx-
imately the national figure for elementary
school students.
Are urban districts serving poor children doing better in some states?Table 12 casts a wider net. We first identified
all districts coded as “large central city” or
“midsize central city” in the U.S. Department
of Education’s Common Core of Data, a
compilation of data on every school district
in the country. It includes districts from thou-
sands of smaller cities not shown in Table 11.
After computing z-scores for achievement
in the manner described above, we narrowed
the list to districts with at least 40% of students
qualifying for free lunch. This eliminated
a few affluent “island” districts located in
metropolitan areas. We then calculated state
means and rank-ordered the states by average
z-score. Table 12 shows, on a state-by-state
basis, the relative achievement of urban
districts serving substantial numbers of
poor children.33
A single characteristic leaps out.
Sun Belt states dominate the top of the list.
But note that poor urban districts in Florida,
the highest ranked state with more than one
district meeting our criteria, still score .43
standard deviations below the state average.
Why do urban districts in theSun Belt seem to do better?To determine why the states fall as they do in
Table 12 would require several steps beyond
the scope of the current study. Let’s start with
achievement data. Ideally, tests scores from
several years would be available, both to esti-
mate how much academic growth districts are
able to produce—as opposed to scores from a
single point in time, as presented here—and to
minimize the possibility of an anomalous year
distorting test scores. The tests that states
employ should be scrutinized to see if the type
of test influences urban districts’ relative rank-
ings. A survey of district and state systems of
finance and governance would be needed,
along with an inventory of state and local edu-
cation policies to pinpoint educational activities
that promote and depress achievement.
That said, reasonable hypotheses for
why the top seven states in this analysis are in
the Sun Belt include:
Achievement of Poor Urban SchoolDistricts in Selected States, 2000
State
North Carolina
Florida
Louisiana
Arizona
Georgia
Texas
California
Washington
Colorado
Virginia
New York
Illinois
Massachusetts
Pennsylvania
Michigan
Indiana
Maryland
Minnesota
Wisconsin
Districts
1
6
6
10
7
44
64
2
2
9
12
4
4
8
16
6
1
2
1
Average Z-Score Standard Error % Free Lunch % Black + Hispanic
+0.26 — 0.40 0.57
-0.43 0.30 0.45 0.43
-0.53 0.37 0.55 0.62
-0.65 0.20 0.52 0.73
-0.72 0.11 0.56 0.69
-0.72 0.17 0.59 0.75
-0.75 0.07 0.63 0.51
-0.98 0.40 0.44 0.41
-1.10 0.60 0.46 0.60
-1.24 0.25 0.50 0.64
-1.88 0.20 0.53 0.49
-1.89 0.17 0.51 0.76
-2.05 0.37 0.50 0.72
-2.05 0.44 0.48 0.50
-2.09 0.22 0.56 0.67
-2.27 0.38 0.53 0.56
-2.73 — 0.65 0.85
-3.31 0.08 0.52 0.36
-4.41 — 0.66 0.72
Table
12
CRITERIA: At least 50 students in grades tested.Percentage of students in the federal free lunch program ≥ 40%.

The Brown Center Report on American Education 35
Policies
Southern states were first out of the blocks
with standards and testing when the
accountability movement started in the
1980s. Florida, Texas, and Louisiana make
students pass an exit exam before graduating
from high school. California and Arizona
will start doing so in the next few years. Six
of the top seven states, Arizona being the
exception, have a legacy of strong state influ-
ence over the curriculum, most notably
through curriculum frameworks and text-
book adoptions. Arizona leads the nation
in charter schools. Compared to the rest
of the nation, Sun Belt states spend less per
pupil but distribute funds more equitably
among districts. These policies may narrow
achievement gaps between urban and
suburban districts.34
Governance
As a general rule of educational governance,
the Sun Belt has more centralization at the
state level and more dispersed governance
locally. Several urban areas in the South and
West feature a batch of small school districts
surrounded by a few large suburban dis-
tricts. Phoenix has twenty-four districts
within its city limits. The state’s largest dis-
trict is located in nearby Mesa. Big cities in
the Rust Belt, on the other hand, are often
served by a single large city district ringed
by dozens of smaller suburban districts.
This pattern arose from a tradition of strong
municipal governments in the East and
Midwest and weak municipal governments
in the West and South. Hoxby (1995) found
that areas with more school districts gain an
achievement advantage because districts
must compete for homebuyers. When
people shop for new homes, the quality of
local schools is crucial. Parents are also
shopping for school districts. That choice is
limited in the Rust Belt’s big cities.35
Demographics
The nature of urban areas varies by region.
Redding, CA, a city of 164,000 near Mt. Shasta
in Northern California, will not strike many
Easterners as a typical urban area. Even in
more populated Western areas, visitors are
often surprised to discover urban communities
without skyscrapers. In the Los Angeles area,
Watts, South Central, and East Los Angeles
are neighborhoods consisting of single-family
houses. Racial and ethnic populations also vary
by region, with Hispanic and Asian immigrants
more prevalent in the Sun Belt. And whereas
many urban districts in the East and Midwest
have declined in population over the past few
decades, the Sun Belt’s urban districts have
experienced sharp growth.
Test artifacts
The findings may be spurious. Urban Sun Belt
districts serve large numbers of students lack-
ing English proficiency. If these students are
excluded from testing, a district’s standing
relative to the state average may be artificially
boosted. Non-English speaking students in
Texas take a Spanish version of the TAAS from
second to sixth grade. Their scores are published
separately and were not used in the analysis.
From 1998 to 2000, California and
San Francisco education officials fought in
court over whom would be tested in the state’s
testing program. San Francisco refused to
administer the SAT-9 to bilingual program
students who had been in the district for
thirty months or less. San Francisco lost the
legal battle and was ordered to include all
students in SAT-9 testing. The court order was
issued after 2000 testing had been completed,
however. In producing the scores analyzed
here, San Francisco played by its own rules,
followed by no other California district taking
the SAT-9. If significantly more English lan-
guage learners are included in San Francisco’s
testing in 2001, scores may drop.36
Compared to the rest
of the nation, Sun Belt
states spend less per
pupil but distribute
funds more equitably
among districts.

36 The Brown Center Report on American Education
Part III Urban School Achievement
What are the most prevalentstrategies for improving urban schools?In the 1990s, all levels of government—
federal, state, and local—adopted policies
focused on improving urban schools.
Traditionally, helping urban schools involved
directing more resources their way, either
through federal programs, especially Title I,
or by reducing funding disparities among
school districts within the same state. In the
1990s, new strategies emerged. These strate-
gies fall into three broad categories: choice,
standards, and class size reduction.
Choice
Charter school legislation has been
adopted in thirty-seven states, with nearly
2,000 charters in operation during the
2000-2001 academic year. Publicly-funded
vouchers are provided to several thousand
poor children in Milwaukee, Cleveland,
and the state of Florida. The privately-
funded Children’s Scholarship Fund
annually supplies 40,000 poor urban stu-
dents with scholarships to attend private
schools in dozens of cities.
Achievement in charter schools has
thus far proven difficult to evaluate. Most
charters are too new to have generated
definitive data. Others serve special popula-
tions, such as students at risk or dropouts,
skewing results.37
Although controversial, research gener-
ally shows positive effects for students using
vouchers to attend private schools. Effects are
limited, however. Vouchers tend to benefit
elementary students rather than students in
middle and high schools and African-American
children rather than Hispanic or white children.
Vouchers also tend to improve math perfor-
mance instead of achievement in reading or
other subjects.38
Standards
Virtually every state in the union has adopted
academic standards and an assessment system
for measuring student learning. Standards
vary in quality, especially in terms of clearly
spelling out what students should know and
when they should know it. Assessments also
differ, with some states purchasing off-the-shelf
commercial tests and other states developing
their own, criterion-referenced tests keyed to
state standards. Several big city school districts
(Boston, Chicago, Houston, Philadelphia) have
adopted their own sets of standards and criteria
for student promotion from grade to grade.39
Evidence on the effect of standards is
sparse, and in the short term it will probably
remain so. David Grissmer of RAND found
that Texas and North Carolina made signifi-
cant progress on NAEP tests in the 1990s and
attributed the states’ success to having estab-
lished accountability systems backed by
rigorous standards. Gains were particularly
impressive for poor and minority students.
It is almost impossible to isolate the effects of
standards from the effects of other reforms
implemented concurrently. If while putting
standards into effect states also impose new
requirements for teacher training, limit or
reduce class sizes, adopt new textbooks, and
raise teachers salaries, it could be any, all, or
none of these policies that produce changes
in test scores. Add the local policies of urban
districts to the mix, and determining causal-
ity becomes even more difficult.40
Reducing Class Size
In the 1990s, the STAR experiment in
Tennessee triggered strong public interest in
reducing class size. The experiment randomly
assigned students to small classes and tracked
student learning for several years. Researchers
found that small classes significantly boost
achievement, especially of African-American

The Brown Center Report on American Education 37
students and primarily in the early grades.
California poured billions of dollars into a
class size initiative for the early elementary
grades, and a federal program was adopted
during the Clinton administration, targeted
primarily at urban districts.41
Alan Krueger’s recent re-analysis of the
Tennessee data confirms the benefit of small
classes for African-Americans. The California
effort has raised cautions, however, especially
in terms of unintended consequences for
urban schools. Reducing the size of classes in
suburban districts opened up job openings
for teachers. As urban districts lost experi-
enced teachers who left for the suburbs, they
hired inexperienced, and frequently, non-
credentialed teachers to replace them. Statewide
class size reductions should be implemented
while keeping an eye on the teacher labor
market, perhaps phased-in slowly to lessen
any unforeseen ill effects.42
ConclusionThese reforms are promising, but we don’t
yet know if they will succeed or fail. The
challenge is great. An important lesson from
the last century of schooling is that at almost
every level of education, from classrooms
to nations, failure begets failure. The history
of urban schools in the past few decades is
grim evidence of that fact. But the flip side is
also true, higher achievement feeds on itself.
Turning around our urban school systems
ultimately would mean more than improving
education. It would have a profound impact
on the social welfare of the nation.
An important lesson
from the last century
of schooling is that at
almost every level of
education, from
classrooms to nations,
failure begets failure.

38 The Brown Center Report on American Education
ENDNOTES
1 Main NAEP reading tests have remained substantiallythe same from 1992 to 2000. See P.L. Donahue, R.J.Finnegan, A.D. Lutkus, N.L. Allen, and J.R. Campbell,U.S. Department of Education, The Nation’s Report Card:Fourth-Grade Reading 2000, (NCES 2001-499, U.S.Government Printing Office, 2001), p. 2.
2 Tom Loveless, The Brown Center Report on AmericanEducation, (The Brookings Institution, 2000), p. 8.
3 For effect of score volatility on school accountabilityprograms, see Thomas J. Kane and Douglas O. Staiger,“Volatility in School Test Scores: Implications for Test-Based Accountability Systems,” Paper presented at TheBrookings Papers on Education Policy Conference, TheBrookings Institution, Washington, DC, May 15, 2001;Also note that scores on the Iowa Test of Basic Skills inthe 1990s showed gains in math concepts but declinesin computation; Robert L. Linn, “Assessments andAccountability,” Educational Researcher, vol. 29, no. 2(March, 2000), pp. 4-16; Loveless, 2000.
4 Richard J. Murnane, The Impact of School Resources onthe Learning of Inner City Children, (Balinger PublishingCompany, 1975); Adam Gamoran, “The Stratification ofHigh School Learning Opportunities,” Sociology ofEducation, vol. 60, no. 3 (July, 1987), pp. 135-155.
5 Data obtained from 37 states (and the District ofColumbia) for 1998-1999, and 45 states (and theDistrict of Columbia) for 1999-2000. States were categorized as showing improvement, no change, or adecline. Figures 1 and 2 only report improving states.The other states are fairly equally divided between “nochange” and “decline.” Complete data posted on theBrown Center website at www.brookings.edu/browncenter.
6 Linn, 2000.
7 Ina V.S. Mulis, Michael O. Martin, Eugenio J.Gonzales, Kelvin D. Gregory, Robert A. Garden,Kathleen M. O’ Connor, Stephen J. Chrostowski, TeresaA. Smith, TIMSS 1999 International Mathematics Report:Findings from IEA’s Repeat of the Third InternationalMathematics and Science Study at the Eighth Grade,(Center for the Study of Testing, Evaluation, andEducational Policy, Boston College, 2000), p. 206.
8 Note that U.S. responses for “never” are statisticallynot significantly different from those of Singapore (basedon two-sample test of differences).
9 Gary Phillips press release (April 6, 2001) obtainedfrom the following page on the NCES website:nces.ed.gov/whatsnew/ncesnews.asp; “Paige ReleasesNAEP Results Showing Need To Improve Reading Skill,”The White House Bulletin, April 6, 2001.
10 Paul E. Barton, “Raising Achievement and ReducingGaps: Reporting Progress Toward Goals for AcademicAchievement,” A Report to the National Education GoalsPanel (NEGP), March, 2001, p. 48; Kate Zernike, “TestResults from States Reveal Gaps in Learning,” The NewYork Times, April 9, 2001, The New York Times onlinearchives: www.nytimes.com ; Kathleen Kennedy Manzo,“4th Graders Still Lag on Reading Test,” Education Week,April 11, 2001, Education Week online archives:www.edweek.com/edsearch.cfm ; Michael A. Fletcher,“Test Shows Wider Gap in Reading Skills,” WashingtonPost, April 7, 2001, p. A2.
11 Manzo, 2001.
12 Of the three year-to-year changes in the gap, only the five point change from 1998 to 2000 falls short ofstatistical significance. And it’s close. The standard errorof the 1998-00 gap change is 2.73, meaning any changegreater than 5.46 would have been significant.
13 U.S Department of Education, National Center for Education Statistics, “1998 Reading Results for Low-Performing Students,” NAEP Facts, vol. 4, no. 4(May, 2000).
14 Population changes in the top and bottom groups oftest scorers were not controlled in this analysis, nor in
the studies conducted by NCES and NEGP. The scoresare unadjusted for poverty, native language, and otherbackground characteristics of students. If the proportionof children who are poor or non-English speaking grewin the bottom decile of readers, that could widen the gap.
15 “Millions of Kids Flock to High Schools,” AssociatedPress, (May 23, 2001); U.S. Department of Education,National Center for Education Statistics, Digest ofEducational Statistics, 2000, (NCES 2001-034, U.S.Government Printing Office, 2001), p. 12.
16 U.S. Department of Education, National Center forEducation Statistics, Digest of Educational Statistics, 2000,(NCES 2001-034, U.S. Government Printing Office,2001), pp. 12, 48-49.
17 On the word “teenager,” see Webster’s EncyclopedicUnabridged Dictionary of the English Language, (RandomHouse, 1996); On the perception of childhood and adolescence, see Philippe Aries, Centuries of Childhood,(Random House, 1965); On U.S. rural population in1880, see U.S. Census Bureau, “Population and HousingUnit Counts, Table 4. Population 1790 to 1990,” U.S.Census Bureau online data: www.census.gov/population/censusdata/table-4.pdf.
18 Robert S. Lynd and Helen Merrell Lynd, Middletown,(Harcourt, Brace & World, Inc., 1929).
19 James S. Coleman, The Adolescent Society, (The FreePress, 1961).
20 Coleman, 1961, pp. 305-309.
21 Laurence Steinberg, Beyond the Classroom, (Simonand Schuster, 1996).
22 Barbara Schneider and David Stevenson, TheAmbitious Generation, America’s Teenagers, Motivated butDirectionless, (Yale University Press, 1999). Also see TheAdolescent Years: Social Influences and EducationalChallenges, edited by Kathryn Borman and BarbaraSchneider, (University of Chicago Press, 1998).
23 Margins of error reported at the 95% confidence level.
24 For FIGURE 7: Regarding the estimate of homeworkin the United States, we dropped about one-fourth of theexchange students because they were not taking a mathclass in the U.S. (n=279).
25 In addition to the authors cited in the text, theimportance of academic press in school culture isstressed by Anthony S. Bryk, Valerie E. Lee, and Peter B.Holland, Catholic Schools and the Common Good,(Harvard University Press, 1993).
26 For FIGURE 8: We conducted a separate analysiswith students not taking a math class in the U.S. Theresults were similar: much less, 18.8%; a little less,28.5%; about the same, 37.9%; a little more, 11.6%;much more, 3.3%.
27 National Commission on The High School SeniorYear, The Lost Opportunity of Senior Year: Finding a BetterWay (Preliminary Report), (National Commission on The High School Senior Year, 2001).
28 Richard Hofstadter, Anti-Intellectualism in AmericanLife, (Random House, 1962).
29 Howard Gardner, “Low Scores Are No Disgrace,” The New York Times, March 2, 1998, p. A17.
30 Gaps in other subjects and grade levels generallyfollow the pattern of 4th grade reading, but there are differences. See U.S. Department of Education, Office of Educational Research and Improvement, NationalCenter for Education Statistics, NAEP 1999: Trends inAcademic Progress, by J. R. Campbell, C. M. Hombo, and Jane Mazzeo, (NCES 2000-469, U.S. GovernmentPrinting Office, 2001).
31 Caroline M. Hoxby, “If Families Matter Most, WhereDo Schools Come In?” Paper presented at the Koret TaskForce Meeting, The Hoover Institution, Palo Alto, CA,February 10, 2000.
32 For TABLE 11: Some states tested different grades (9 of 21 states). When necessary, we substituted 3rd or5th grade to get a reading score, 6th or 7th grade to get a math score. Some districts serve only the lower grades(3,4, or 5) or only the higher grades (6,7, or 8). Wedropped these districts from the analysis, as well as thosedistricts with less than 50 students. The score for NewYork City Public Schools is a composite score for all districts that fall under the control of the New York CityBoard of Education. Also note that the Council of theGreat City Schools recently analyzed achievement oftheir member urban school districts. See Council of theGreat City Schools, Beating The Odds: A City-By-CityAnalysis of Student Performance and Achievement Gaps onState Assessments, by Michael Casserly, (Council of theGreat City Schools, 2001).
33 For TABLE 12: State averages are only for urban districts that met our criteria for poverty. Demographicvariables were obtained from U.S. Department ofEducation, National Center for Education Statistics,Local Education Agency (School District) Universe SurveyLongitudinal Data File: 1986-1997, Common Core of Data(CCD), CCD Information on public Schools and SchoolDistricts in the United States: nces.ed.gov/ccd/ccd12yragency.html.
34 Education Week, Quality Counts ’98: The UrbanChallenge, (January, 1998), pp. 100-101.
35 For effects of competition among public schools, seeCaroline M. Hoxby, “Does Competition Among PublicSchools Benefit Students and Taxpayers?” AmericanEconomic Review, Vol. 90, No. 5 (December 2000), pp. 1209-1238.
36 Mary Ann Zehr, “California Settles Battle Over LEPTesting,” Education Week, November 22, 2000, EducationWeek online archives.
37 See Center on Reinventing Public Education, A Studyof Charter School Accountability, (U.S. Department ofEducation, 2001).
38 Paul E. Peterson and David E. Campbell, “AnEvaluation of the Children’s Scholarship Fund,”(Program on Education Policy and Governance, HarvardUniversity, 2001); William G. Howell, Patrick J. Wolf,Paul E. Peterson, and David E. Campbell, “Test-ScoreEffects of School Vouchers in Dayton, Ohio, New YorkCity, and Washington, DC: Evidence from RandomizedField Trials,” Paper presented at the annual meeting ofthe American Political Science Association, Washington,DC, September 2000.
39 Education Week, Quality Counts 2001: A BetterBalance; Standards, Tests, and The Tools to Succeed,(January, 2001).
40 David W. Grissmer, Ann Flanagan, Jennifer Kawata,and Stephanie Williamson, Improving Student Achievement:What State NAEP Test Scores Tell Us, (The RANDCorporation, 2000).
41 Frederick Mosteller, Richard J. Light, and Jason A.Sachs, “Sustained Inquiry in Education: Lessons fromSkill Grouping and Class Size,” Harvard EducationalReview, vol. 66, no.4 (Winter, 1996), pp. 797-842.
42 Alan B. Krueger and Diane M. Whitmore, “WouldSmaller Classes Help Close the Black-White AchievementGap?” Paper presented at the Closing The Gap: PromisingApproaches to Reducing the Achievement Gap Conference,The Brookings Institution, Washington, DC, February 2,2001. For more information on the effects of class sizereduction in California, see Class Size Reduction in California:The 1998-99 Evaluation Findings, (Class Size ReductionResearch Consortium, 1999), www.classize.org/techreport/index-00.htm; Randy Ross, “How Class Size ReductionHarms Kids in Poor Neighborhoods,” Education Week,May 26, 1999, Education Week online archives:www.edweek.com/edsearch.cfm.