Embed Size (px)
Citation preview
The 2007 Noto Peninsula, Japan Earthquake (Mw6.7): Damage to Wooden Structures
Masumi Yamada1, Sun-Cheon Park1, and Jim Mori2
1 Pioneering Research Unit for Next Generation, Kyoto University, Japan
2 Disaster Prevention Research Institute, Kyoto University, Japan
Introduction
The 2007 Noto Peninsula earthquake (Mw 6.7, Mjma 6.9) produced strong shaking
throughout central Japan with severe damage to over 600 buildings. The shallow event
occurred close to the Japan Sea coast (37.22oN, 136.69oE, depth 11 km) on March 25,
2007 at 00:41:58 GMT. Analyses of seismic data showed that it was a thrust fault
(striking northeast and dipping downward to the southeast) with dimensions of about
15 x 30 km2 (Figure 1) (Aoi and Sekiguchi, 2007). There was no significant surface
faulting from the earthquake but Global Positioning System (GPS) measurements
showed surface displacements of 20 to 25 cm (Geographical Survey Institute, 2007). The
recent seismicity of the Noto Peninsula region has been relatively low, and has
included moderate events in 1933 (Mjma 6.0) and 1993 (Mjma 6.6). For the latest
earthquake, there were significant strong ground motions throughout the Noto
Peninsula (Figure 1), with maximum recorded ground velocities of 80 to 100 cm/sec.
Although the region is a relatively sparsely populated area of Japan, there was
considerable damage to wooden structures, which is the predominant type of
construction. There were 630 totally and 13920 partially collapsed buildings, with
concentrations of damage in Monzen and Anamizu, with lesser damage in downtown
Wajima city (Cabinet Office, Government of Japan, 2007a). The cost of the total
damage is estimated to be 65 billion yen (about $US 535 million) (Cabinet Office,
Government of Japan, 2007b). Despite the large number of severely damaged houses,
there was only 1 fatality (not related to a building collapse) and 336 injured persons.
As has been done for several recent earthquakes in Japan, detailed surveys of
building damage were quickly carried out by several groups. This paper presents some
statistical results of damage to wooden structures for the Noto Peninsula earthquake,
which characterizes the fragility of this region of rural Japan to strong shaking. The
damage statistics are somewhat different to the results for other earthquakes, and
probably reflects the difference in regional construction practices.
Strong ground motions for the 2007 Noto Peninsula earthquake
The 2007 Noto Peninsula earthquake was recorded by many strong motion
stations. Figure 1 shows the distribution of horizontal peak ground velocity, PGV (the
larger amplitude of the two horizontal components). The PGV values exceeding 90 cm/s at
Anamizu and Wajima are due to soft soil amplification.
The closest station to the fault plane at Monzen had severe shaking with a
peak ground acceleration (PGA) of 1304 cm/s2 (vector sum of three components) and a
Japan Meteorological Agency (JMA) Seismic Intensity (Ijma) 6 upper (6.4). Since the
waveforms at the JMA station in Monzen are not available, we estimated the peak
ground velocity from the empirical relationship of ground motion (Fujimoto and
Midorikawa, 2005):
Ijma = 1.291 + 1.017 log10(PGA*PGV) 0.2 (1)
From this relationship, the PGV at the station is estimated to be about 81 cm/s. Note
that this function has a large variance, and this value could be an underestimate of the
real PGV. Estimates from the attenuation relationship and observations of overturned
tombstones give higher values.
Historical background in Monzen
Monzen is a small town on the west coast of the Noto peninsula, built around a
historical Buddhist temple, Souji-ji. Due to its geolographical location, the town
flourished as a trading port between northern and western Japan during the Edo era
(17th to 19th century).
The typical houses in Monzen are constructed in a traditional style, consisting
of column and beam structures with mud plaster walls (Figure 2). The roof is covered
by Japanese tiles. Along with the long history of the town, most houses have an
average age of 40~50 years, and some are more than 100 years old. People continually
use these old buildings with occasional expansions and repairs. A special structural
feature in this area is wooden boards nailed on the wall (Figure 2). The boards protect
the mud plaster wall from the strong sea breeze, and improve the seismic performance
of the houses.
Damage survey of wooden structures in Monzen
On April 6th and 7th, two weeks after the event, we carried out a damage
survey for over 660 wooden structures in the severely damaged Hashiride and Touge
districts in Monzen.
The damage survey included photos and damage classification for all wooden
structures, as could be recognized from outside inspection. The target structures were
all kinds of wooden structures, including a houses, stores, and storage buildings. We
classified buildings into three categories; no damage (Rank A), minor damage (Rank B),
and severe damage (Rank C). Rank B is damage which does not affect the main
structural members, but includes cracks in walls, crumbling of walls, and missing roof
tiles. Rank C has damage to the structural components. For Rank C buildings repair
is difficult and the structure will likely be demolished. This category includes the
following types of damage; a) visible tilts of the columns (Figure 3), b) total collapse of a
story (Figure 4), and c) buildings which were already cleared at the time of the survey
(Okada and Takai, 1999). The results of the damage survey are shown in Table 1.
In Hashiride, the damage ratio is almost same across the different locations,
and the occurrence of Rank C damage is about 20~30% of all wooden structures (Figure
5(a)). Hashiride includes a business district in sections Hb and Hc, and many stores
were severely damaged due to the large open spaces on the first floor. In Touge, the
occurrence of Rank C damage is 10 to 52%, depending on the location. The hill side
area (section Ta in Figure 5(b)) has less damage whereas the area close to a river has
larger damage (section Tb in Figure 5(b)).
Typical damage we observed were cracks in the wall, exfoliation of the wall
material, fallen roof tiles, shifting of roof tiles, and displacements of columns. We have
also observed many instances of termite infestations and wood decay on the structural
components, especially in houses with severe damage (Figure 6). These environmental
degradations critically decreased the seismic performance of the wooden structures.
Comparison with damage for other earthquakes
Figure 7 shows the relationship between damage ratio of Rank C wooden structures
and PGV for several recent earthquakes in Japan. PGV values are taken from the
larger horizontal component of the strong motion record. Since the strong motion
network at the time of the Kobe earthquake was not as dense as these days, PGV
values were estimated from damage ratio functions of 1st or 2nd story buildings (Murao
and Yamazaki, 2000). The PGV values for the 2000 Western Tottori earthquake were
estimated from overturned tombstones (Hayashi, 2004). And PGV values for the
Mid-Niigata earthquake were computed from observed strong motion records.
The relationship for each earthquake follows the Gaussian cumulative
function ():
Damage ratio = ((ln PGV – )/) (2)
where and are the mean and standard deviation, respectively. The parameters
which best fit each dataset are; ( for Kobe, (5.57, 0.81) for Tottori, and
(5.62, 0.73) for Niigata (Murao and Yamazaki, 1999).
The damage ratio for the Kobe earthquake is more than twice that of the 2000
Western Tottori and 2004 Mid-Niigata earthquakes. Our value for the Noto Peninsula
earthquake is intermediate between these extremes. One reason for the large
differences is that the structure style is very different depending on the region. The
Niigata, Tottori, and Noto areas have heavy snowfalls in winter, so the structural
performance is higher than in the Kobe area. For example, the diameter of columns in
the Tottori area is 10~20 % larger compared to houses in the Kobe area (Kitahara et al.,
2002). The construction style of structures critically affects the seismic performance of
wooden buildings. Another reason for the difference is the maintenance conditions. For
the 1995 Kobe earthquake, older buildings had significantly more damage, whereas
structural damage in Tottori did not depend on the building age (Hayashi, 2004). This
is because the houses in Tottori are well maintained and there were fewer cases of
termite infestations and wood decay (Hayashi, 2004).
In Figure 7, the PGV of the 2007 Noto Peninsula earthquake is obtained not
from a strong motion record, but the empirical relationship in equation (1). The
damage ratio is the percentage of Rank C damage in section Hb, where the JMA
station is located (see Figure 5(a)). The damage ratio for the 2007 Noto Peninsula
earthquake is higher than that of the 2000 Western Tottori and 2004 Mid-Niigata
earthquakes, and lower than the 1995 Kobe earthquake.
Our data is not sufficient to provide a concrete conclusion, but one possible
interpretation is that the damage ratio for wooden structure is lower than the 1995
Kobe earthquake because the wooden structures in Noto have relatively good seismic
performance typical of buildings in these regions. The existence of the wooden board
covers on the exterior walls is one example, which improves the strength of the
structures. However, the higher damage compared to the 2000 West Tottori and 2004
Mid-Niigata earthquakes may be due to do poorer maintenance practices. More
detailed analysis is needed to evaluate the strong motions in the near-source area and
seismic performance of wooden structures of the Noto region.
Acknowledgements
The authors thank Drs. Yasuhiro Hayashi and Takeshi Morii of Kyoto University, Drs.
Hiroshi Arai and Hidemaru Shimizu in the National Research Institute for Earth
Science and Disaster Prevention (NIED) for supporting the damage survey. We
acknowledge NIED and JMA for the use of strong motion data. This research was
supported by the Program for Improvement of Research Environment for Young
Researchers from Special Coordination Funds for Promoting Science and Technology
(SCF) commissioned by the Ministry of Education, Culture, Sports, Science and
Technology (MEXT) of Japan.
References
Aoi, M. and H. Sekiguchi (2007). Source inversion from the near-source ground motions
for the 2007 Noto Peninsula earthquake.
http://www.kyoshin.bosai.go.jp/k-net/topics/noto070325/ (in Japanese).
Cabinet Office, Government of Japan, Press release on April, 25th, 2007 (2007).
http://www.bousai.go.jp/oshirase/h19/070425noto.pdf (in Japanese) .
Cabinet Office, Government of Japan, Disaster information on May, 28th, 2007 (2007).
http://www.bousai.go.jp/kinkyu/070528jishin_noto/070528jishin_noto_30.pdf
(in Japanese) .
Fujimoto, K. and S. Midorikawa (2005). Empirical Method for Estimating J.M.A.
Instrumental Seismic Intensity from Ground Motion Parameters Using Strong Motion
Records during Recent Major Earthquakes. Regional Safe Academic Society Dissertation
Collection, No. 7. (in Japanese) .
Geographical Survey Institute, Crustal deformation associated with the 2007 Noto Peninsula
earthquake (2007).
http://www.gsi.go.jp/WNEW/PRESS-RELEASE/2007/0328.htm (in Japanese) .
Hayashi, Y. (2004). Analysis of Relationship between Damage Ratio of Wooden Houses
and Construction Years --- Based on Damage during Hyogo-ken nanbu Earthquake and
Western Tottori Prefecture Earthquake ---. Journal of Architecture and Building
Science, 119, 71-75 (in Japanese).
Kitahara, A., Y. Hayashi, T. Okuda, Y. Suzuki, and M. Goto (2002). Structural
characteristics and earthquake damage of wooden houses in the 2000 western Tottori
earthquake.
Journal of Structural and Construction Engineering , no. 561, pp. 161-167.
Okada, S. and N. Takai (1999). Classifications of Structural Types and Damage
Patterns of Buildings for Earthquake Field Investigation. Journal of Structural and
Construction Engineering, AIJ, 524, 65-72 (in Japanese).
Murao, O. and F. Yamazaki (1999). Development of Fragility Curves for Buildings
Based on Damage Survey Data of a Local government after the 1995 Hyogoken-Nanbu
Earthquake. Journal of Structural and Construction Engineering, AIJ, 527, 189-196 (in
Japanese).
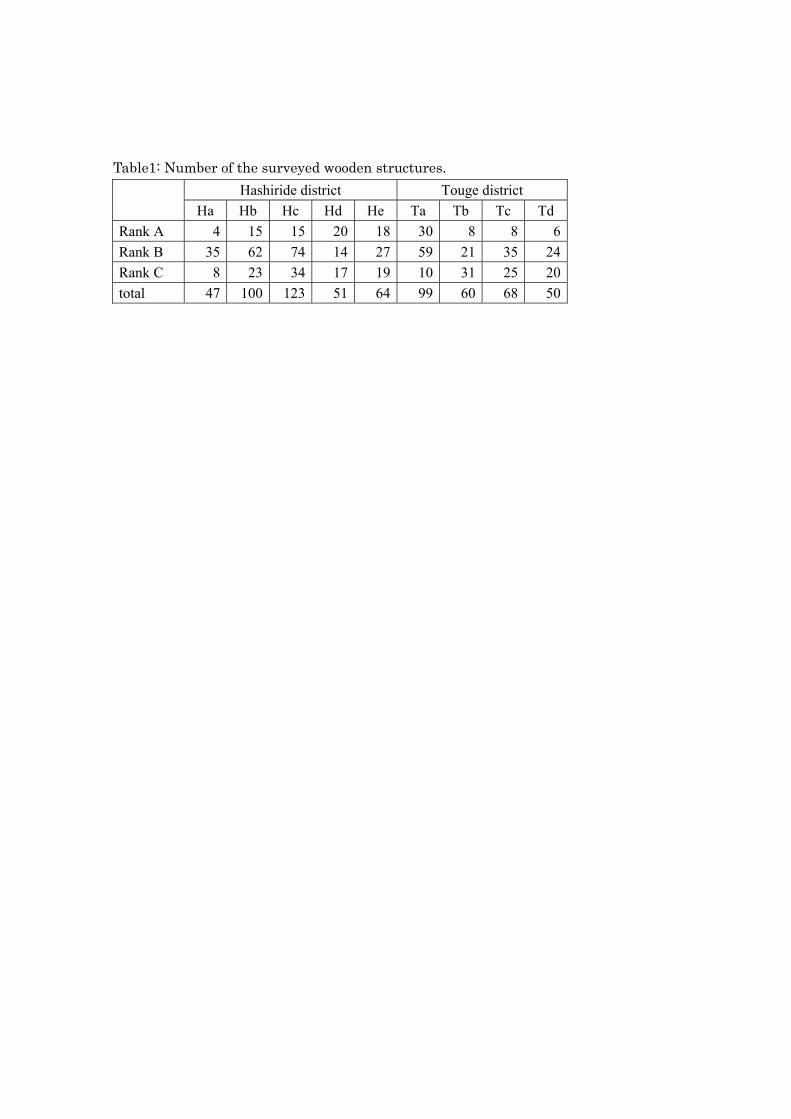
Table1: Number of the surveyed wooden structures.
Hashiride district Touge district
Ha Hb Hc Hd He Ta Tb Tc Td
Rank A 4 15 15 20 18 30 8 8 6
Rank B 35 62 74 14 27 59 21 35 24
Rank C 8 23 34 17 19 10 31 25 20
total 47 100 123 51 64 99 60 68 50
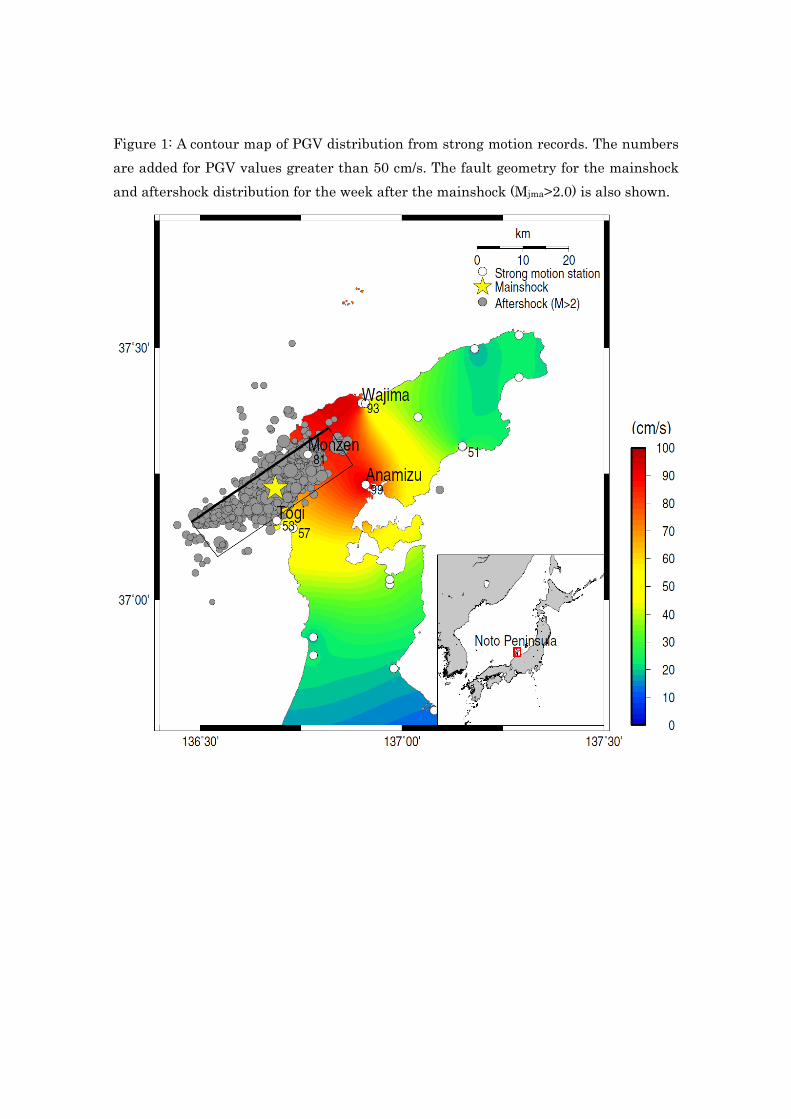
Figure 1: A contour map of PGV distribution from strong motion records. The numbers
are added for PGV values greater than 50 cm/s. The fault geometry for the mainshock
and aftershock distribution for the week after the mainshock (Mjma>2.0) is also shown.
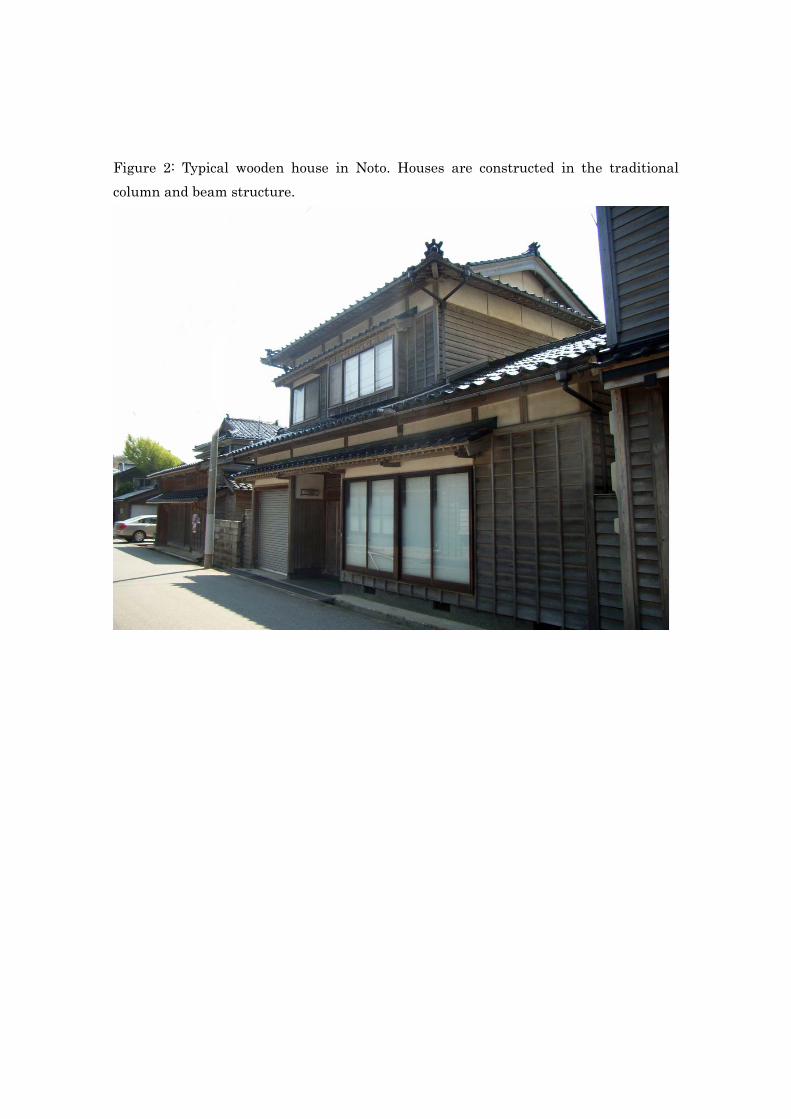
Figure 2: Typical wooden house in Noto. Houses are constructed in the traditional
column and beam structure.
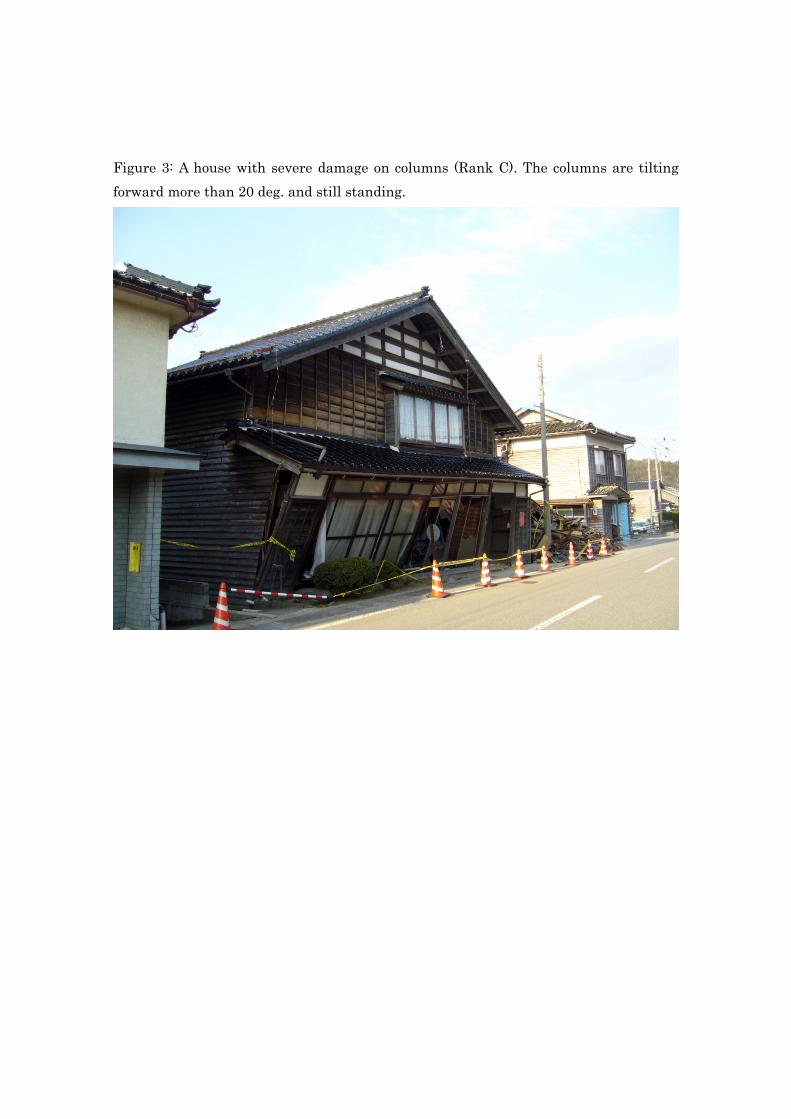
Figure 3: A house with severe damage on columns (Rank C). The columns are tilting
forward more than 20 deg. and still standing.
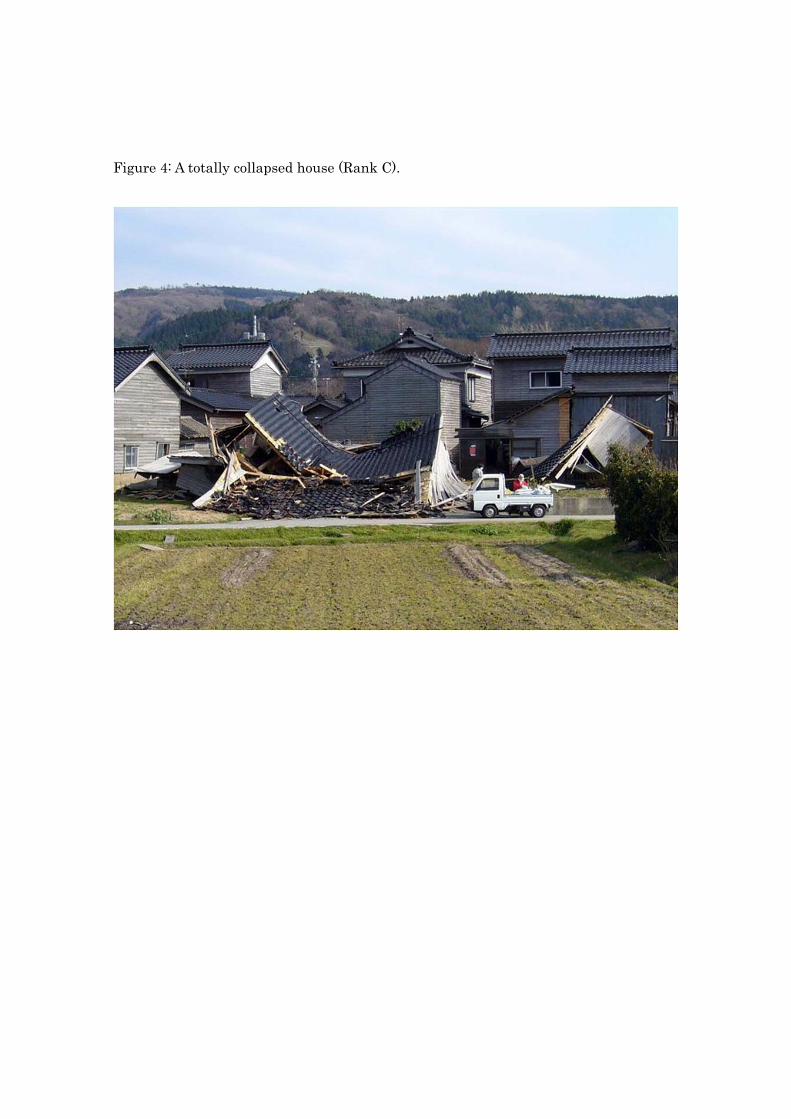
Figure 4: A totally collapsed house (Rank C).
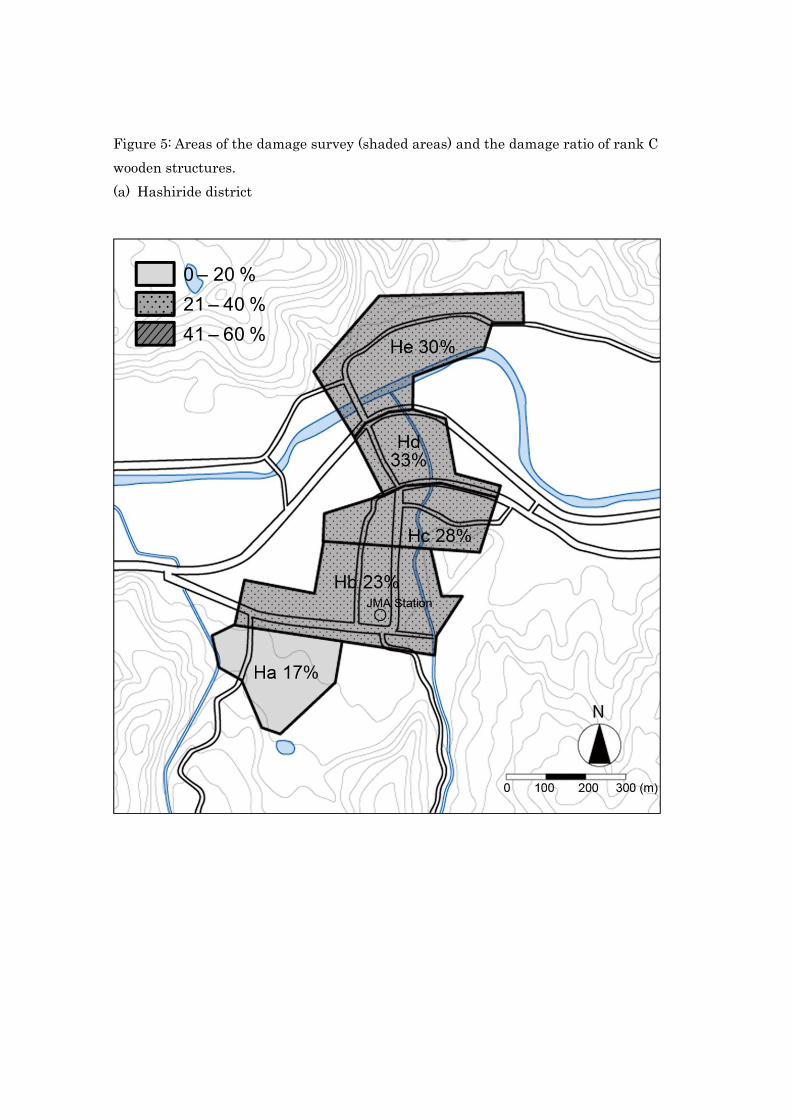
Figure 5: Areas of the damage survey (shaded areas) and the damage ratio of rank C
wooden structures.
(a) Hashiride district
0 – 20 %
21 – 40 %
41 – 60 %
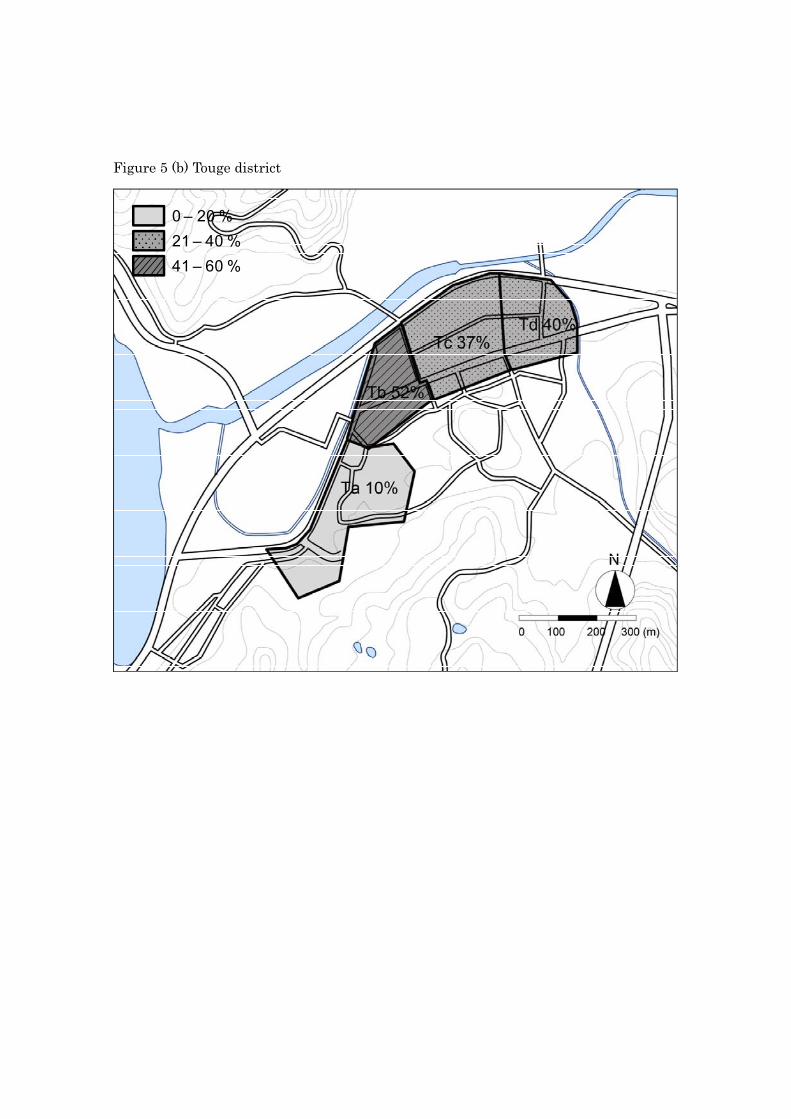
Figure 5 (b) Touge district
0 – 20 %
21 – 40 %
41 – 60 %
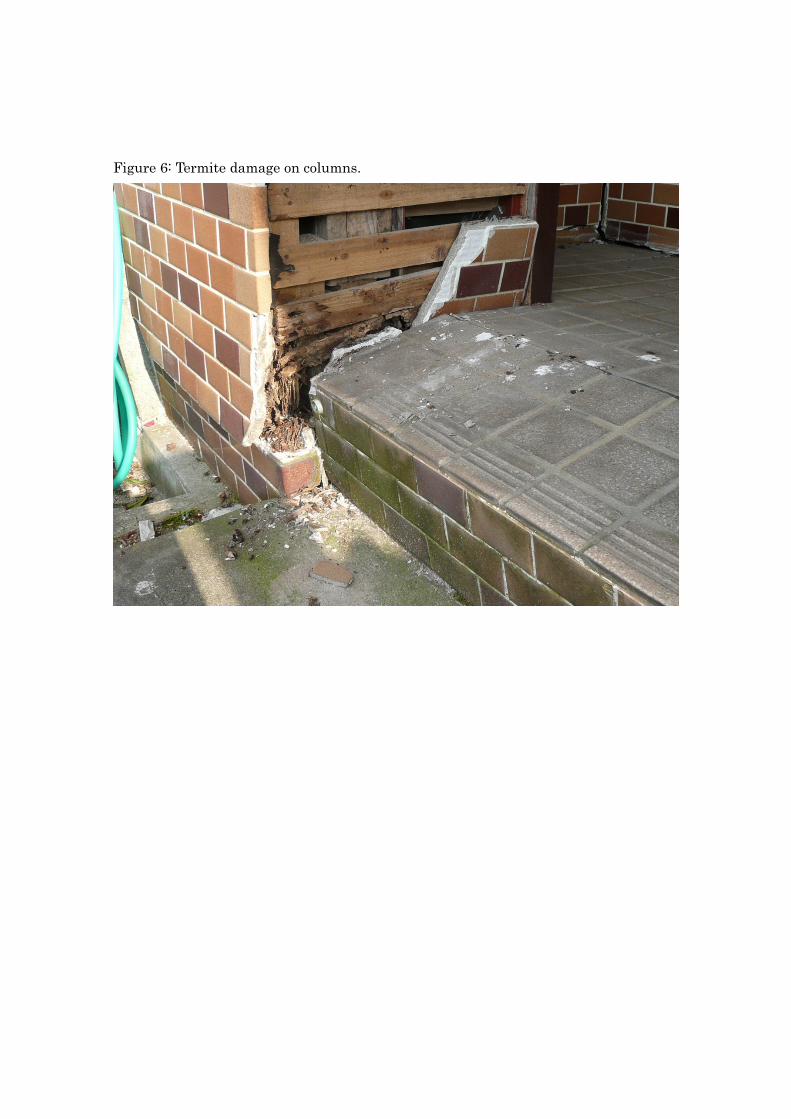
Figure 6: Termite damage on columns.
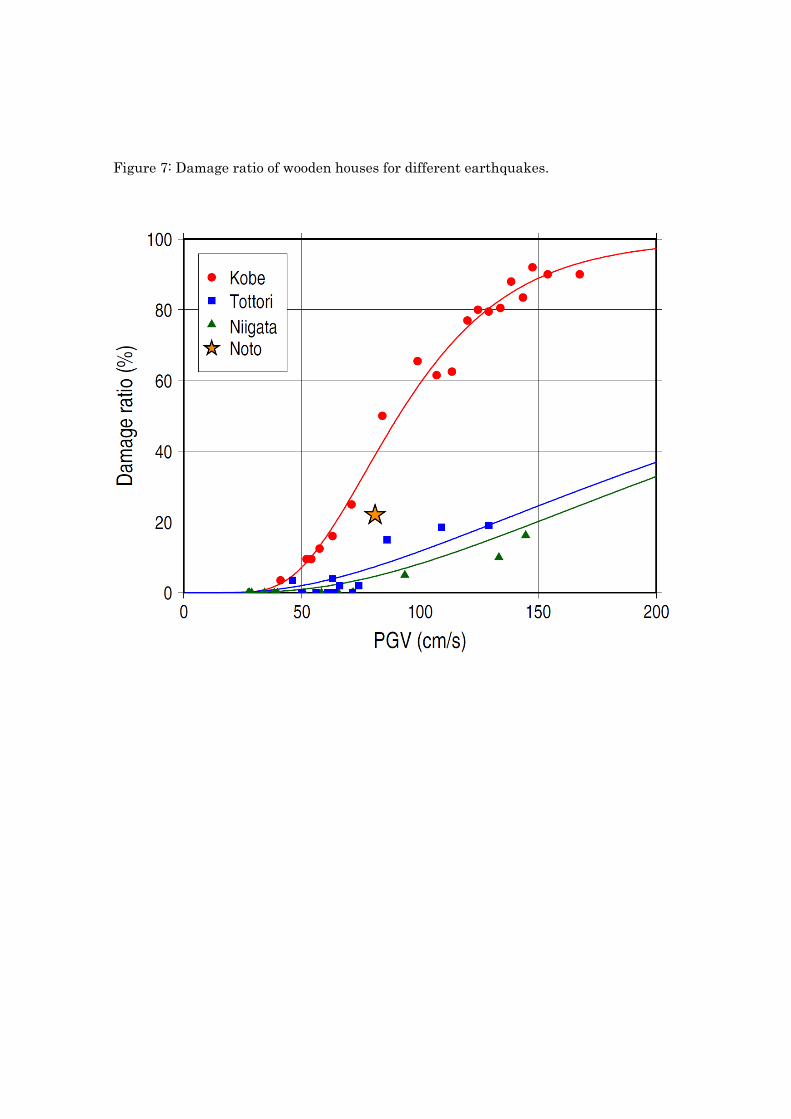
Figure 7: Damage ratio of wooden houses for different earthquakes.