Embed Size (px)
Citation preview
1
The 2010 EU industrial R&D investment
SCOREBOARD
Joint Research Centre European Commission
Héctor Hernández
2
Contents
1. Background2. Overall R&D trends3. Top R&D companies4. R&D by region5. R&D by industrial sector6. Age and R&D intensity of companies
3
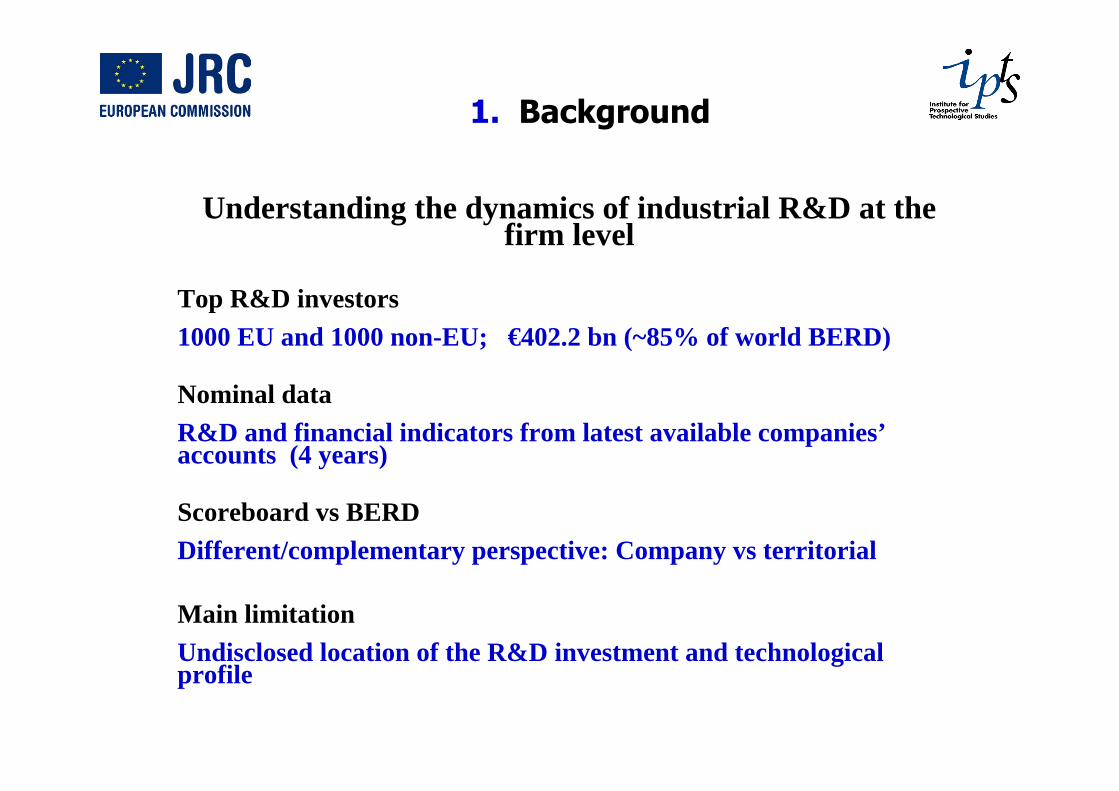
1. Background
Understanding the dynamics of industrial R&D at the firm level
Top R&D investors1000 EU and 1000 non-EU; €402.2 bn (~85% of world BERD)
Nominal dataR&D and financial indicators from latest available companies’accounts (4 years)
Scoreboard vs BERDDifferent/complementary perspective: Company vs territorial
Main limitation Undisclosed location of the R&D investment and technological profile
4
2. Overall R&D trends
5
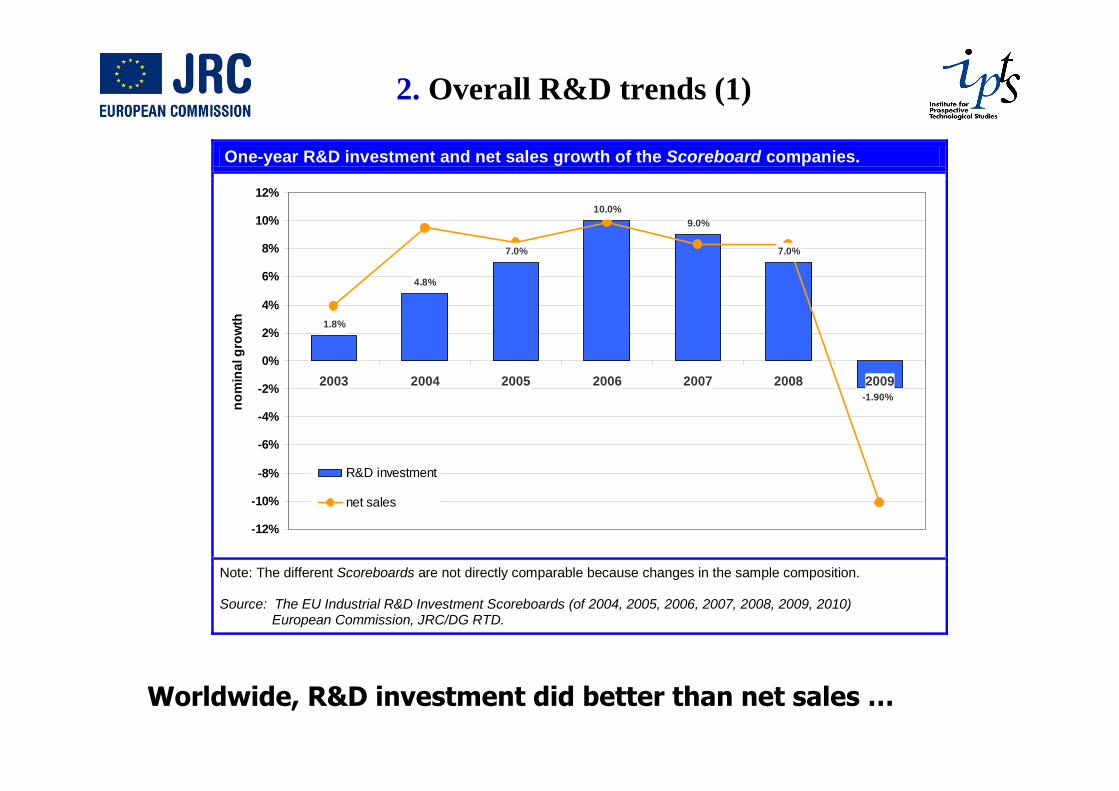
One-year R&D investment and net sales growth of the Scoreboard companies.
Note: The different Scoreboards are not directly comparable because changes in the sample composition. Source: The EU Industrial R&D Investment Scoreboards (of 2004, 2005, 2006, 2007, 2008, 2009, 2010)
European Commission, JRC/DG RTD.
7.0%
10.0%9.0%
7.0%
1.8%
4.8%
-1.90%
-12%
-10%
-8%
-6%
-4%
-2%
0%
2%
4%
6%
8%
10%
12%
2003 2004 2005 2006 2007 2008 2009
nom
inal
gro
wth
R&D investment
net sales
2. Overall R&D trends (1)
Worldwide, R&D investment did better than net sales …
6
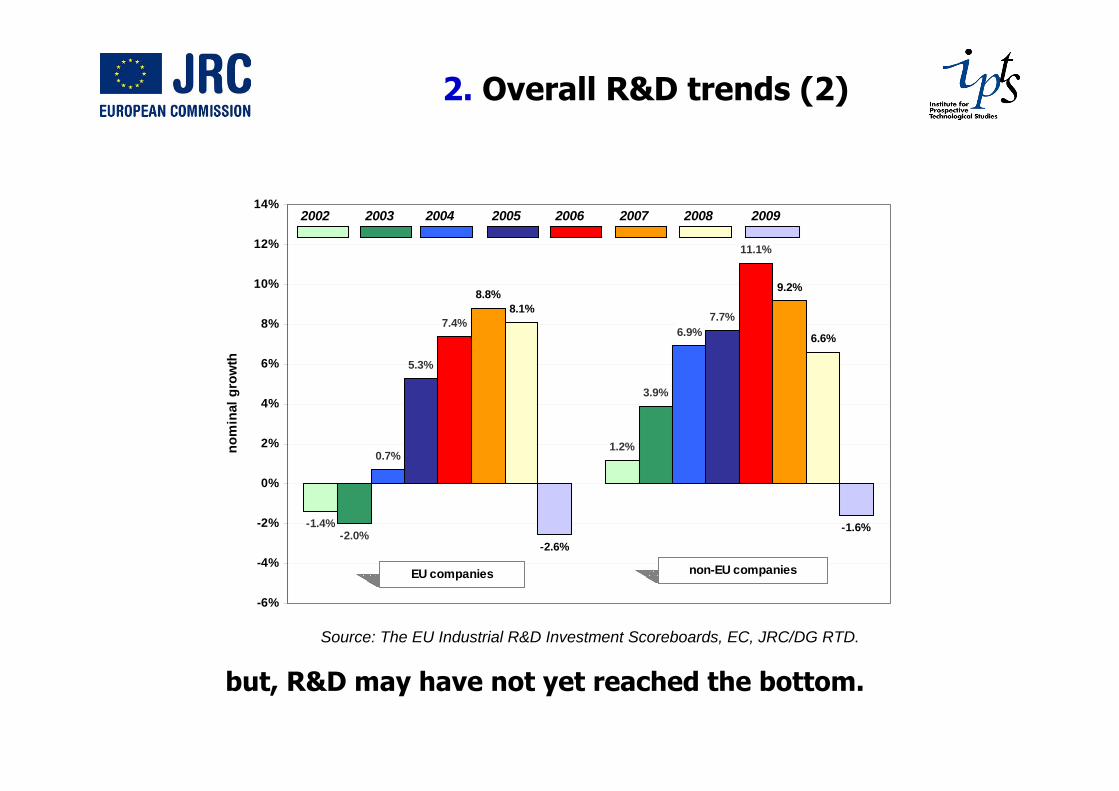
2. Overall R&D trends (2)
but, R&D may have not yet reached the bottom.
Source: The EU Industrial R&D Investment Scoreboards, EC, JRC/DG RTD.
-1.4%
1.2%
-2.0%
3.9%
0.7%
6.9%
5.3%
7.7%
11.1%
7.4%
9.2%8.8%8.1%
6.6%
-2.6%-1.6%
-6%
-4%
-2%
0%
2%
4%
6%
8%
10%
12%
14%
nom
inal
gro
wth
non-EU companiesEU companies
2002 2003 2004 2005 2006 2007 2008 2009
7
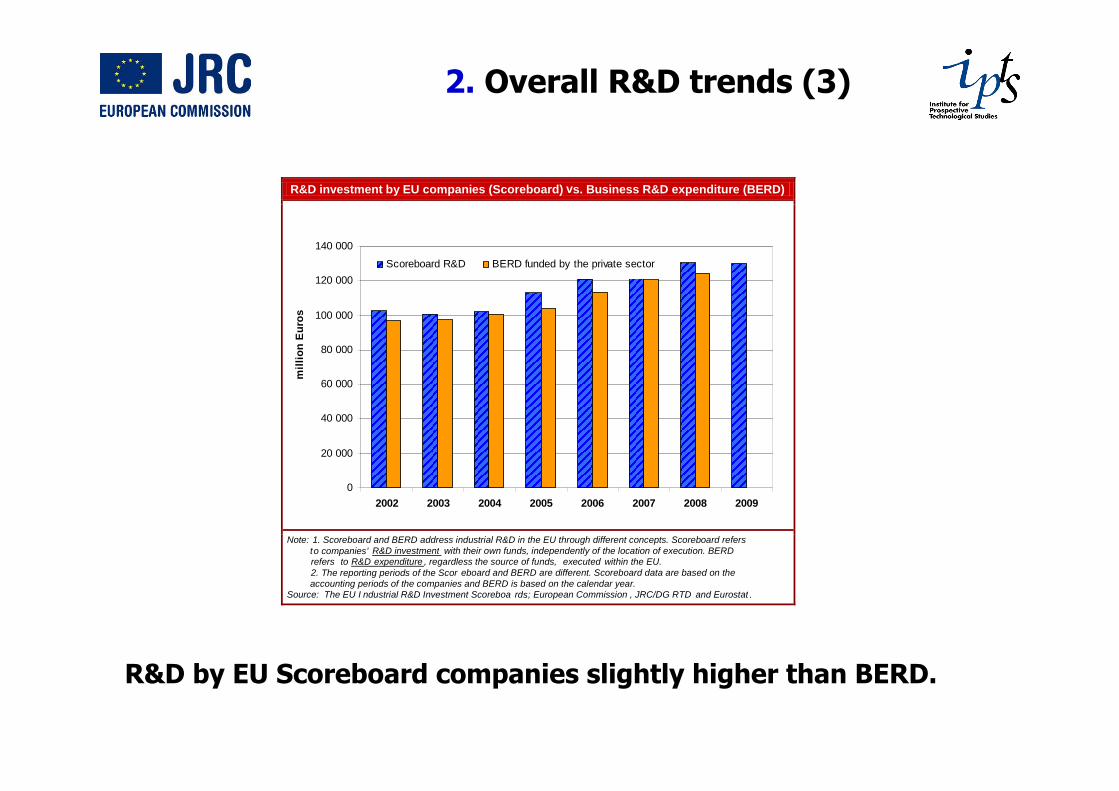
2. Overall R&D trends (3)
R&D by EU Scoreboard companies slightly higher than BERD.
R&D investment by EU companies (Scoreboard) vs. Business R&D expenditure (BERD)
Note: 1. Scoreboard and BERD address industrial R&D in the EU through different concepts. Scoreboard refers t o companies’ R&D investment with their own funds, independently of the location of execution. BERD refers to R&D expenditure , regardless the source of funds, executed within the EU. 2. The reporting periods of the Scor eboard and BERD are different. Scoreboard data are based on the accounting periods of the companies and BERD is based on the calendar year. Source: The EU I ndustrial R&D Investment Scoreboa rds; European Commission , JRC/DG RTD and Eurostat .
0
20 000
40 000
60 000
80 000
100 000
120 000
140 000
2002 2003 2004 2005 2006 2007 2008 2009
mill
ion
Euro
s
Scoreboard R&D BERD funded by the private sector
8
3. Top R&D companies
9
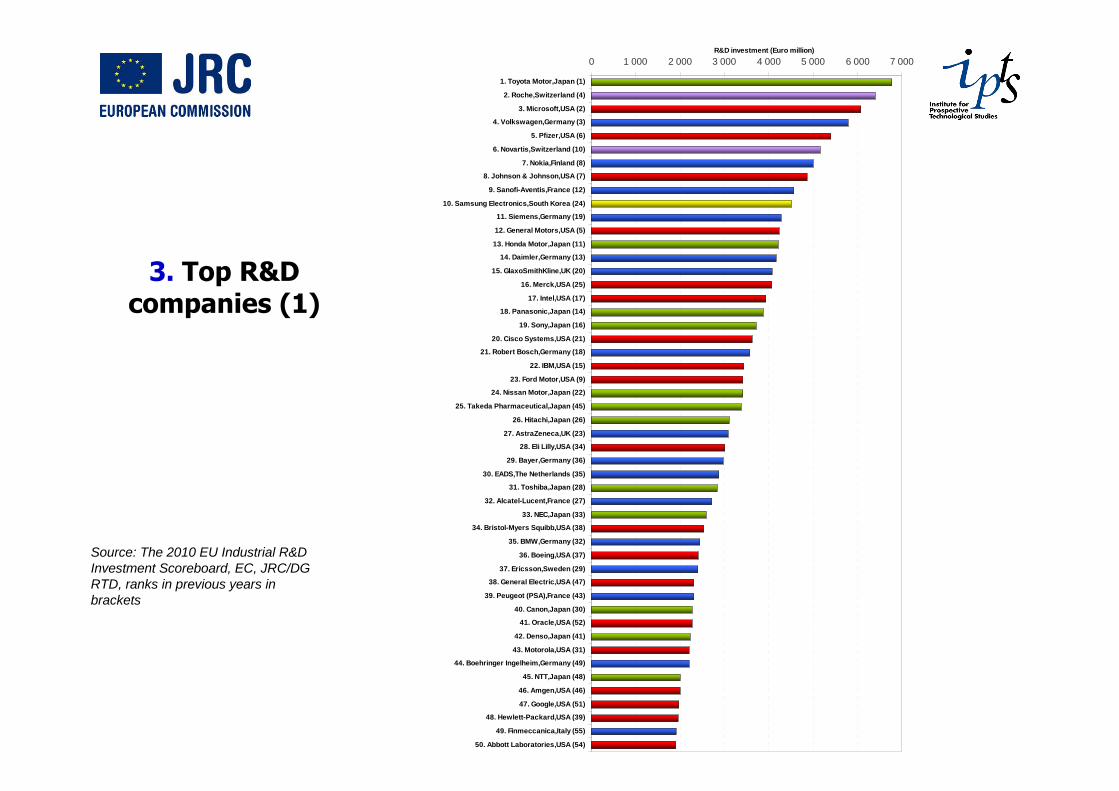
3. Top R&D companies (1)
Source: The 2010 EU Industrial R&D Investment Scoreboard, EC, JRC/DG RTD, ranks in previous years in brackets
0 1 000 2 000 3 000 4 000 5 000 6 000 7 000
50. Abbott Laboratories,USA (54)
49. Finmeccanica,Italy (55)
48. Hewlett-Packard,USA (39)
47. Google,USA (51)
46. Amgen,USA (46)
45. NTT,Japan (48)
44. Boehringer Ingelheim,Germany (49)
43. Motorola,USA (31)
42. Denso,Japan (41)
41. Oracle,USA (52)
40. Canon,Japan (30)
39. Peugeot (PSA),France (43)
38. General Electric,USA (47)
37. Ericsson,Sweden (29)
36. Boeing,USA (37)
35. BMW,Germany (32)
34. Bristol-Myers Squibb,USA (38)
33. NEC,Japan (33)
32. Alcatel-Lucent,France (27)
31. Toshiba,Japan (28)
30. EADS,The Netherlands (35)
29. Bayer,Germany (36)
28. Eli Lilly,USA (34)
27. AstraZeneca,UK (23)
26. Hitachi,Japan (26)
25. Takeda Pharmaceutical,Japan (45)
24. Nissan Motor,Japan (22)
23. Ford Motor,USA (9)
22. IBM,USA (15)
21. Robert Bosch,Germany (18)
20. Cisco Systems,USA (21)
19. Sony,Japan (16)
18. Panasonic,Japan (14)
17. Intel,USA (17)
16. Merck,USA (25)
15. GlaxoSmithKline,UK (20)
14. Daimler,Germany (13)
13. Honda Motor,Japan (11)
12. General Motors,USA (5)
11. Siemens,Germany (19)
10. Samsung Electronics,South Korea (24)
9. Sanofi-Aventis,France (12)
8. Johnson & Johnson,USA (7)
7. Nokia,Finland (8)
6. Novartis,Switzerland (10)
5. Pfizer,USA (6)
4. Volkswagen,Germany (3)
3. Microsoft,USA (2)
2. Roche,Switzerland (4)
1. Toyota Motor,Japan (1)
R&D investment (Euro million)
10
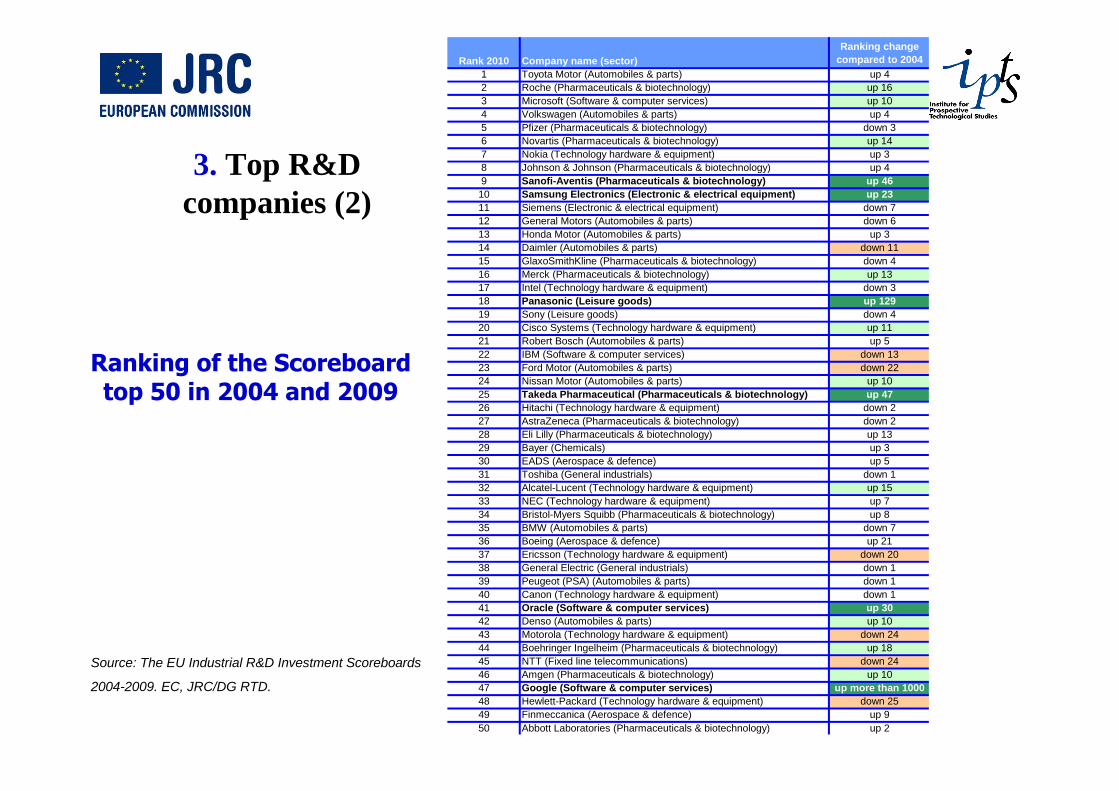
3. Top R&D companies (2)
Source: The EU Industrial R&D Investment Scoreboards
2004-2009. EC, JRC/DG RTD.
Ranking of the Scoreboard top 50 in 2004 and 2009
Rank 2010 Company name (sector)
Ranking change compared to 2004
1 Toyota Motor (Automobiles & parts) up 42 Roche (Pharmaceuticals & biotechnology) up 163 Microsoft (Software & computer services) up 104 Volkswagen (Automobiles & parts) up 45 Pfizer (Pharmaceuticals & biotechnology) down 36 Novartis (Pharmaceuticals & biotechnology) up 147 Nokia (Technology hardware & equipment) up 38 Johnson & Johnson (Pharmaceuticals & biotechnology) up 49 Sanofi-Aventis (Pharmaceuticals & biotechnology) up 4610 Samsung Electronics (Electronic & electrical equipment) up 2311 Siemens (Electronic & electrical equipment) down 712 General Motors (Automobiles & parts) down 613 Honda Motor (Automobiles & parts) up 314 Daimler (Automobiles & parts) down 1115 GlaxoSmithKline (Pharmaceuticals & biotechnology) down 416 Merck (Pharmaceuticals & biotechnology) up 1317 Intel (Technology hardware & equipment) down 318 Panasonic (Leisure goods) up 12919 Sony (Leisure goods) down 420 Cisco Systems (Technology hardware & equipment) up 1121 Robert Bosch (Automobiles & parts) up 522 IBM (Software & computer services) down 1323 Ford Motor (Automobiles & parts) down 2224 Nissan Motor (Automobiles & parts) up 1025 Takeda Pharmaceutical (Pharmaceuticals & biotechnology) up 4726 Hitachi (Technology hardware & equipment) down 227 AstraZeneca (Pharmaceuticals & biotechnology) down 228 Eli Lilly (Pharmaceuticals & biotechnology) up 1329 Bayer (Chemicals) up 330 EADS (Aerospace & defence) up 531 Toshiba (General industrials) down 132 Alcatel-Lucent (Technology hardware & equipment) up 1533 NEC (Technology hardware & equipment) up 734 Bristol-Myers Squibb (Pharmaceuticals & biotechnology) up 835 BMW (Automobiles & parts) down 736 Boeing (Aerospace & defence) up 2137 Ericsson (Technology hardware & equipment) down 2038 General Electric (General industrials) down 139 Peugeot (PSA) (Automobiles & parts) down 140 Canon (Technology hardware & equipment) down 141 Oracle (Software & computer services) up 3042 Denso (Automobiles & parts) up 1043 Motorola (Technology hardware & equipment) down 2444 Boehringer Ingelheim (Pharmaceuticals & biotechnology) up 1845 NTT (Fixed line telecommunications) down 2446 Amgen (Pharmaceuticals & biotechnology) up 1047 Google (Software & computer services) up more than 100048 Hewlett-Packard (Technology hardware & equipment) down 2549 Finmeccanica (Aerospace & defence) up 950 Abbott Laboratories (Pharmaceuticals & biotechnology) up 2
11
4. R&D investment by region
12
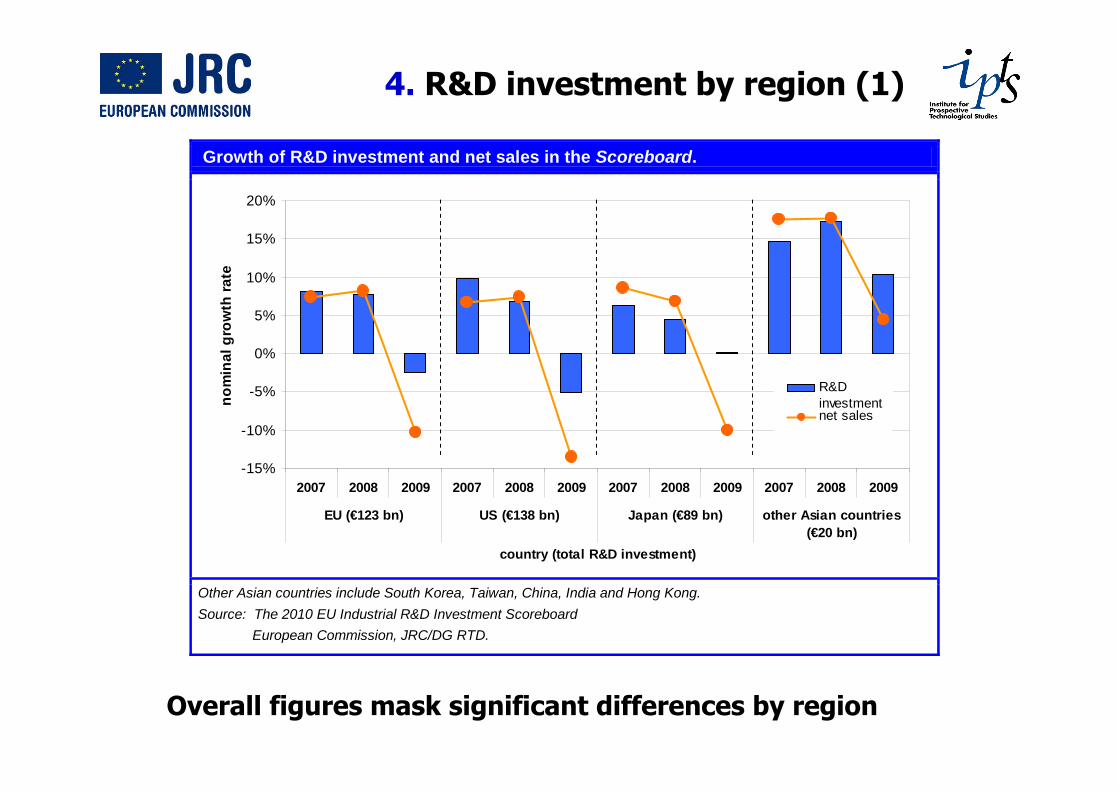
4. R&D investment by region (1)
Overall figures mask significant differences by region
Growth of R&D investment and net sales in the Scoreboard.
-15%
-10%
-5%
0%
5%
10%
15%
20%
2007 2008 2009 2007 2008 2009 2007 2008 2009 2007 2008 2009
EU (€123 bn) US (€138 bn) Japan (€89 bn) other Asian countries(€20 bn)
country (total R&D investment)
nom
inal
gro
wth
rate
R&Dinvestmentnet sales
Other Asian countries include South Korea, Taiwan, China, India and Hong Kong. Source: The 2010 EU Industrial R&D Investment Scoreboard European Commission, JRC/DG RTD.
13
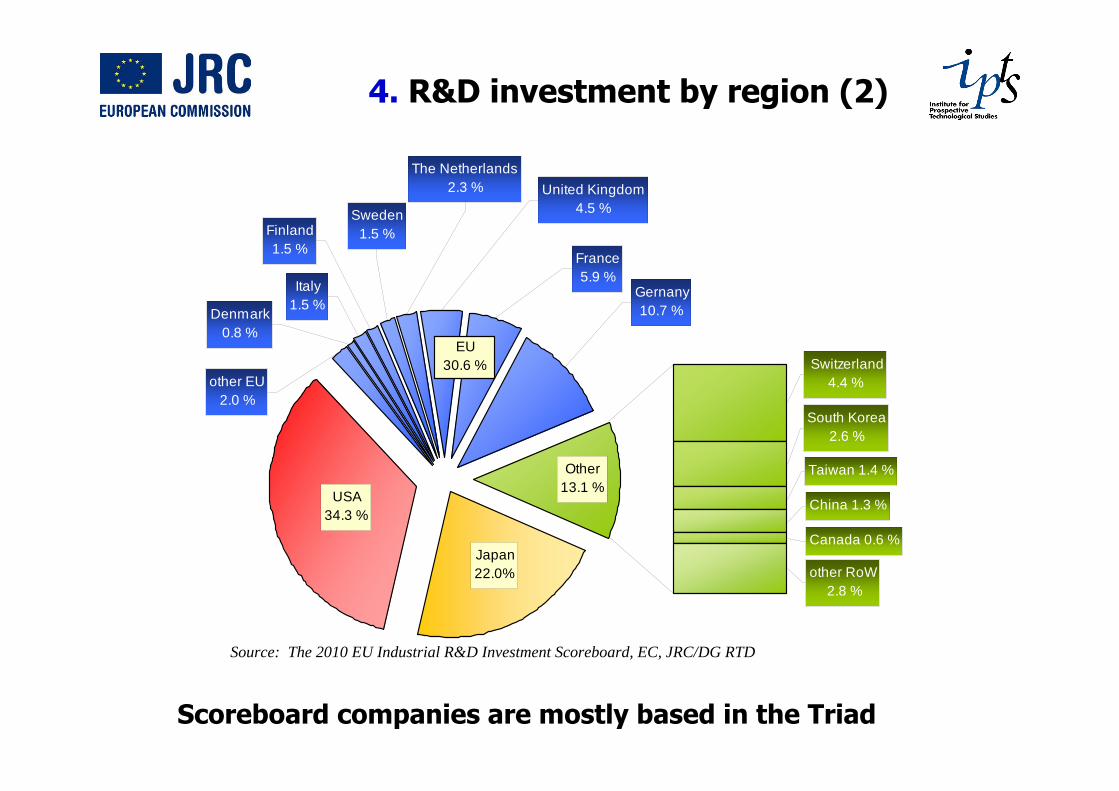
4. R&D investment by region (2)
Scoreboard companies are mostly based in the Triad
Source: The 2010 EU Industrial R&D Investment Scoreboard, EC, JRC/DG RTD
other EU2.0 %
USA34.3 %
Japan22.0%
France 5.9 %
United Kingdom4.5 %
The Netherlands2.3 %
Finland1.5 %
Sweden1.5 %
Italy 1.5 %Denmark
0.8 %
Other13.1 %
other RoW 2.8 %
Canada 0.6 %
China 1.3 %
Taiwan 1.4 %
South Korea2.6 %
Switzerland 4.4 %
Gernany 10.7 %
EU30.6 %
14
5. R&D investment by sector
15
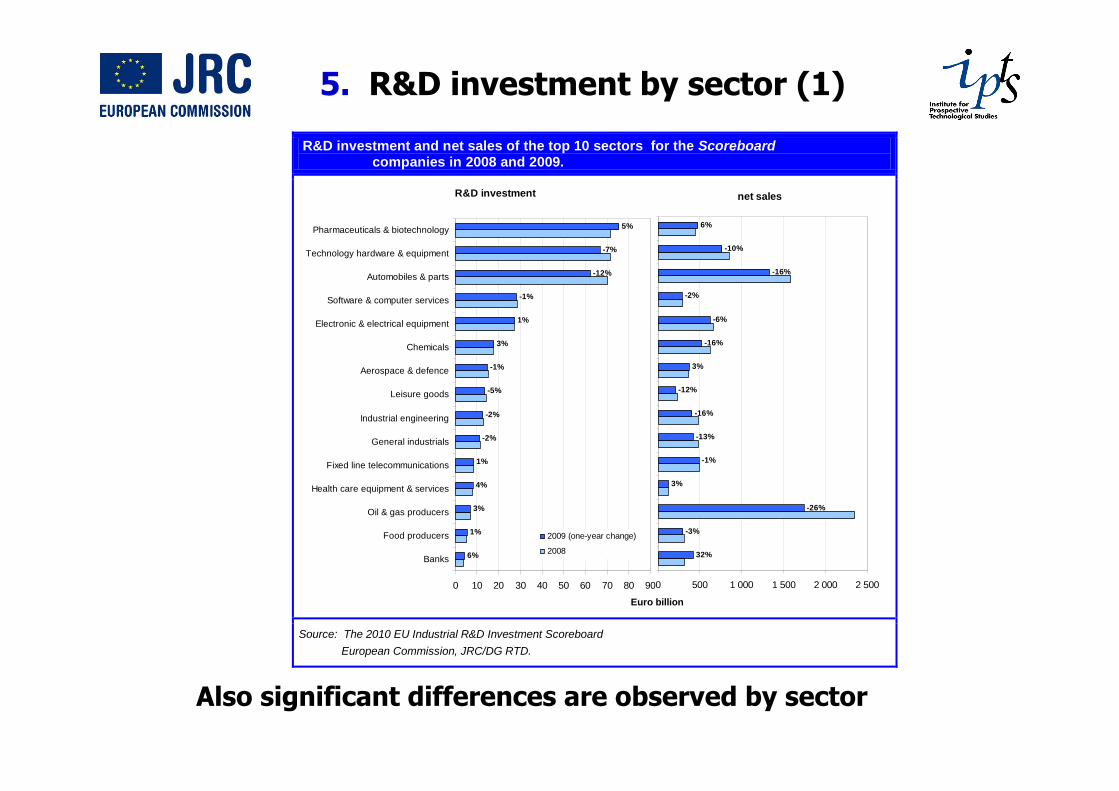
5. R&D investment by sector (1)
R&D investment and net sales of the top 10 sectors for the Scoreboard companies in 2008 and 2009.
Source: The 2010 EU Industrial R&D Investment Scoreboard European Commission, JRC/DG RTD.
R&D investment
5%
-7%
-12%
-1%
1%
3%
-1%
-5%
-2%
-2%
1%
6%
1%
3%
4%
0 10 20 30 40 50 60 70 80 90
Banks
Food producers
Oil & gas producers
Health care equipment & services
Fixed line telecommunications
General industrials
Industrial engineering
Leisure goods
Aerospace & defence
Chemicals
Electronic & electrical equipment
Software & computer services
Automobiles & parts
Technology hardware & equipment
Pharmaceuticals & biotechnology
Euro billion
2009 (one-year change)
2008
net sales
6%
-10%
-16%
-2%
-6%
-16%
3%
-12%
-16%
-13%
-1%
3%
-26%
-3%
32%
0 500 1 000 1 500 2 000 2 500
Also significant differences are observed by sector
16
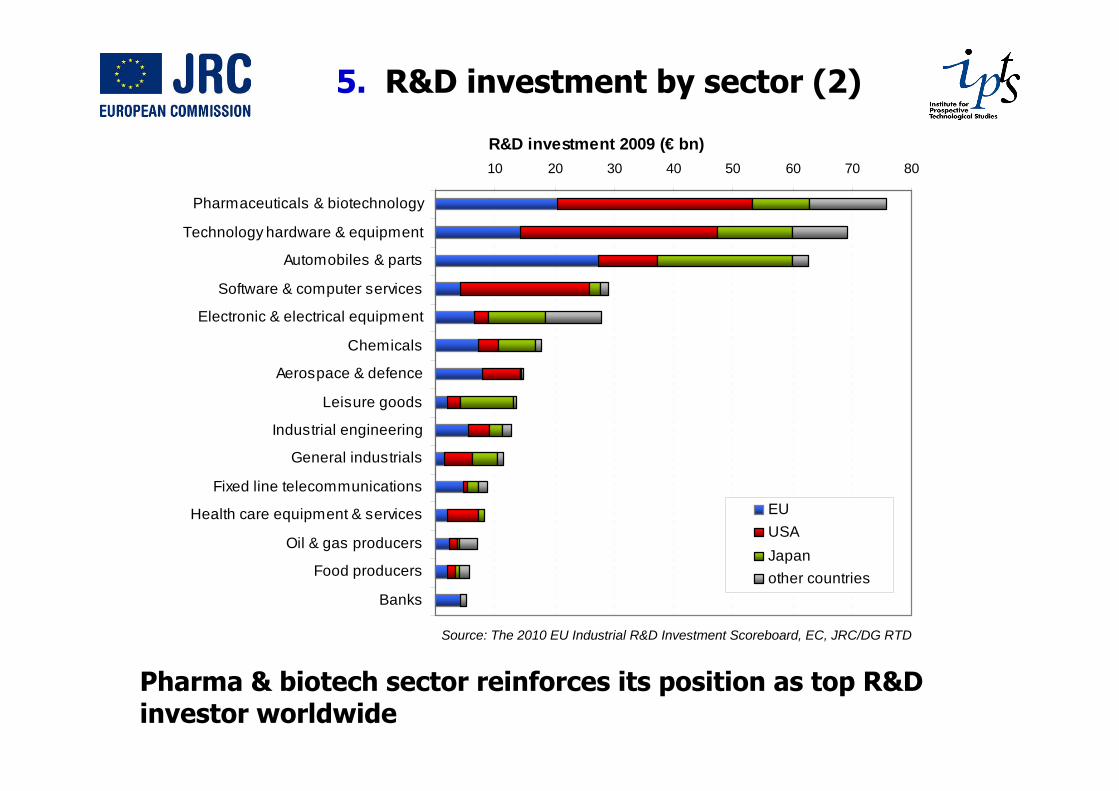
5. R&D investment by sector (2)
Pharma & biotech sector reinforces its position as top R&D investor worldwide
Source: The 2010 EU Industrial R&D Investment Scoreboard, EC, JRC/DG RTD
10 20 30 40 50 60 70 80
Pharmaceuticals & biotechnology
Technology hardware & equipment
Automobiles & parts
Software & computer services
Electronic & electrical equipment
Chemicals
Aerospace & defence
Leisure goods
Industrial engineering
General industrials
Fixed line telecommunications
Health care equipment & services
Oil & gas producers
Food producers
Banks
R&D investment 2009 (€ bn)
EUUSAJapanother countries
17
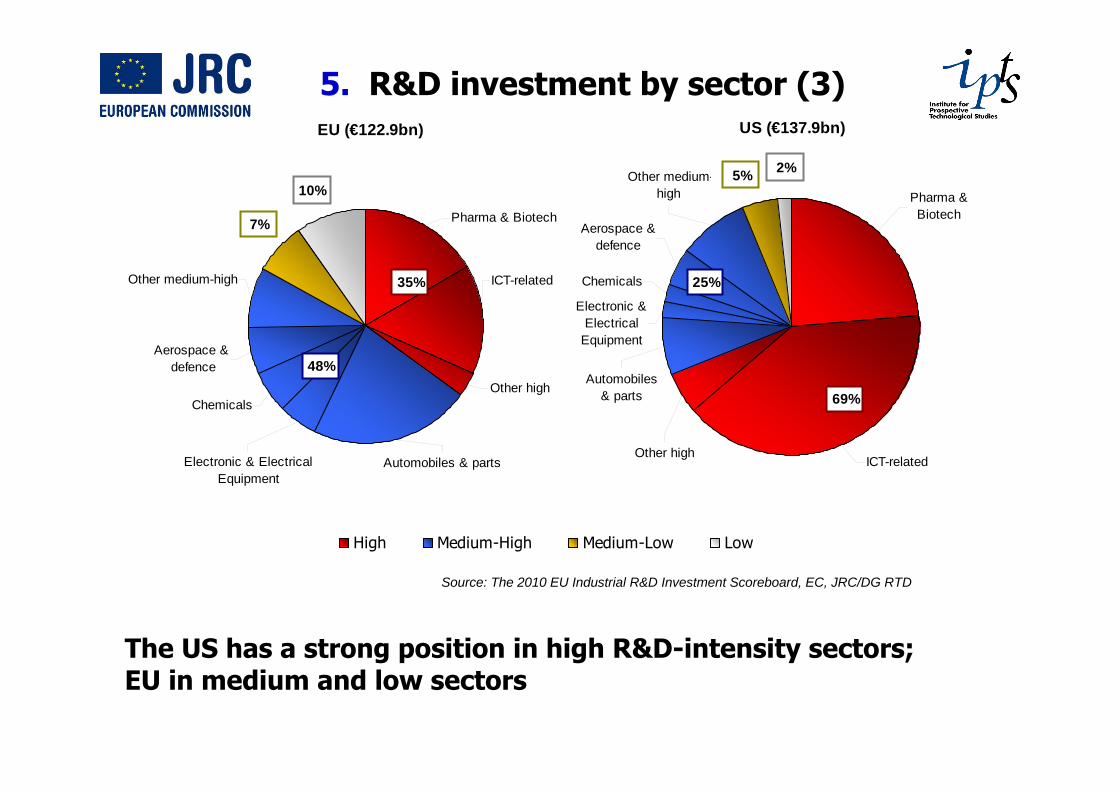
5. R&D investment by sector (3)
The US has a strong position in high R&D-intensity sectors; EU in medium and low sectors
Source: The 2010 EU Industrial R&D Investment Scoreboard, EC, JRC/DG RTD
EU (€122.9bn)
Pharma & Biotech
ICT-related
Other high
Automobiles & partsElectronic & Electrical Equipment
Chemicals
Aerospace & defence
Other medium-high
High Medium-High Medium-Low Low
35%
10%
7%
48%
US (€137.9bn)
Other medium-high
Aerospace & defence
Chemicals
Electronic & Electrical
Equipment
Automobiles & parts
Other highICT-related
Pharma & Biotech
5% 2%
69%
25%
18
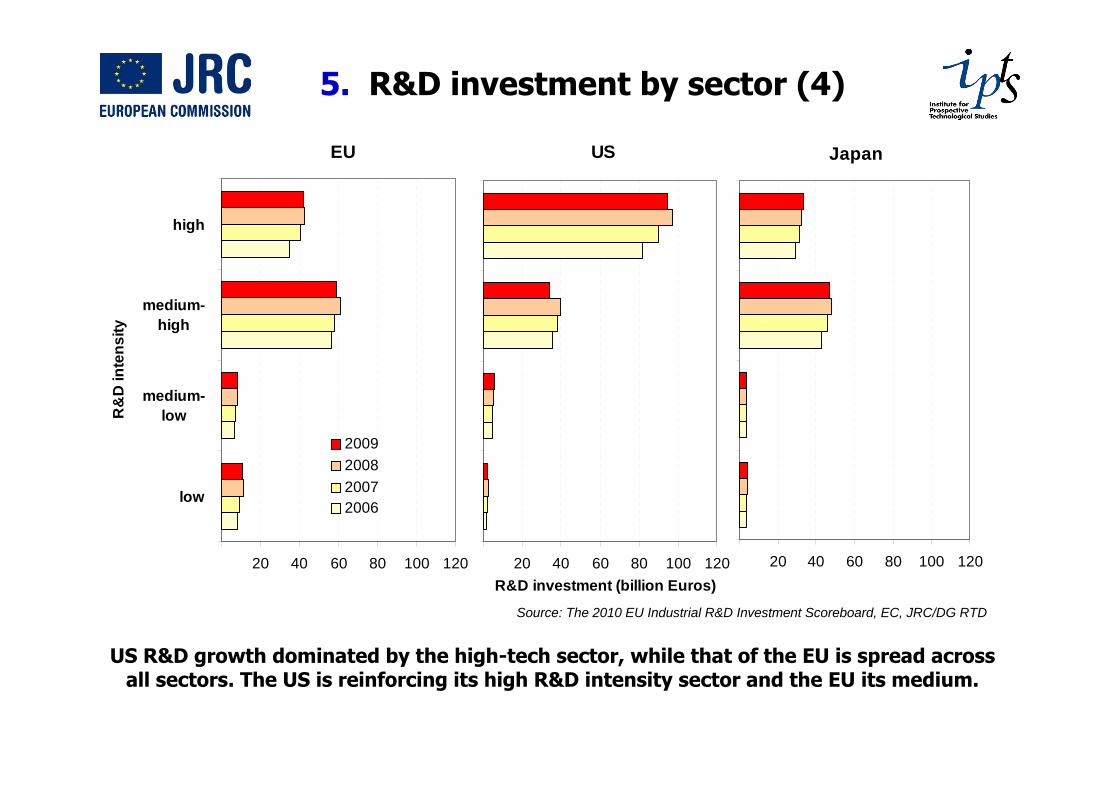
US R&D growth dominated by the high-tech sector, while that of the EU is spread across all sectors. The US is reinforcing its high R&D intensity sector and the EU its medium.
5. R&D investment by sector (4)
Source: The 2010 EU Industrial R&D Investment Scoreboard, EC, JRC/DG RTD
EU
20 40 60 80 100 120
low
medium-low
medium-high
high
R&
D in
tens
ity
R&D investment (billion Euros)
2009200820072006
US
20 40 60 80 100 120
Japan
20 40 60 80 100 120
19
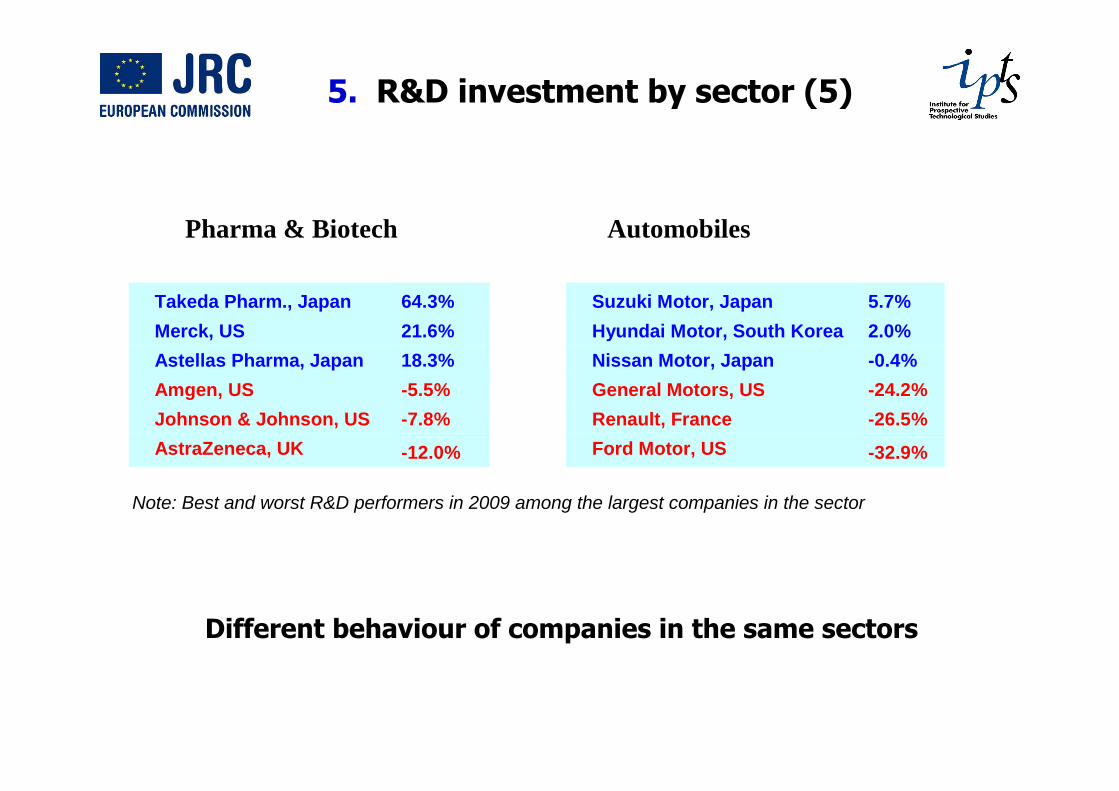
Different behaviour of companies in the same sectors
5. R&D investment by sector (5)
Takeda Pharm., Japan 64.3% Merck, US 21.6% Astellas Pharma, Japan 18.3% Amgen, US -5.5% Johnson & Johnson, US -7.8% AstraZeneca, UK -12.0%
Suzuki Motor, Japan 5.7% Hyundai Motor, South Korea 2.0% Nissan Motor, Japan -0.4% General Motors, US -24.2% Renault, France -26.5% Ford Motor, US -32.9%
Pharma & Biotech Automobiles
Note: Best and worst R&D performers in 2009 among the largest companies in the sector
20
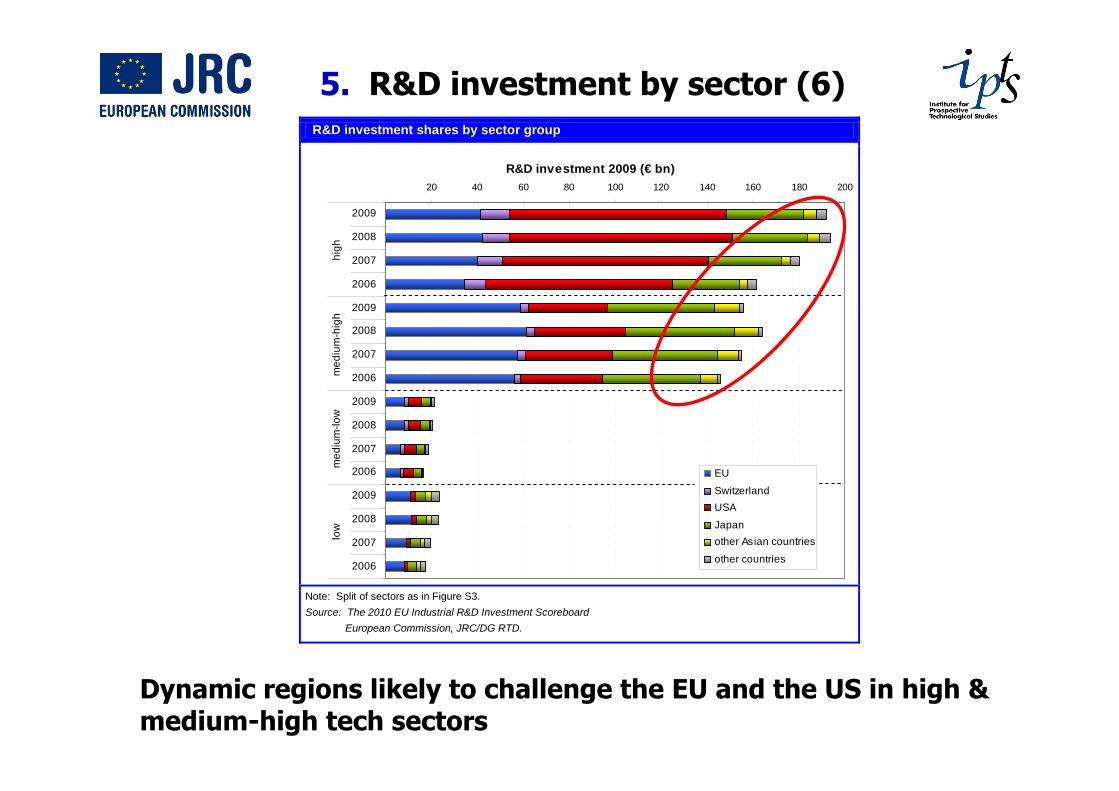
5. R&D investment by sector (6)
R&D investment shares by sector group
Note: Split of sectors as in Figure S3. Source: The 2010 EU Industrial R&D Investment Scoreboard
European Commission, JRC/DG RTD.
20 40 60 80 100 120 140 160 180 200
2009
2008
2007
2006
2009
2008
2007
2006
2009
2008
2007
2006
2009
2008
2007
2006
high
med
ium
-hig
hm
ediu
m-lo
wlo
w
R&D investment 2009 (€ bn)
EU
SwitzerlandUSA
Japanother Asian countries
other countries
Dynamic regions likely to challenge the EU and the US in high & medium-high tech sectors
21
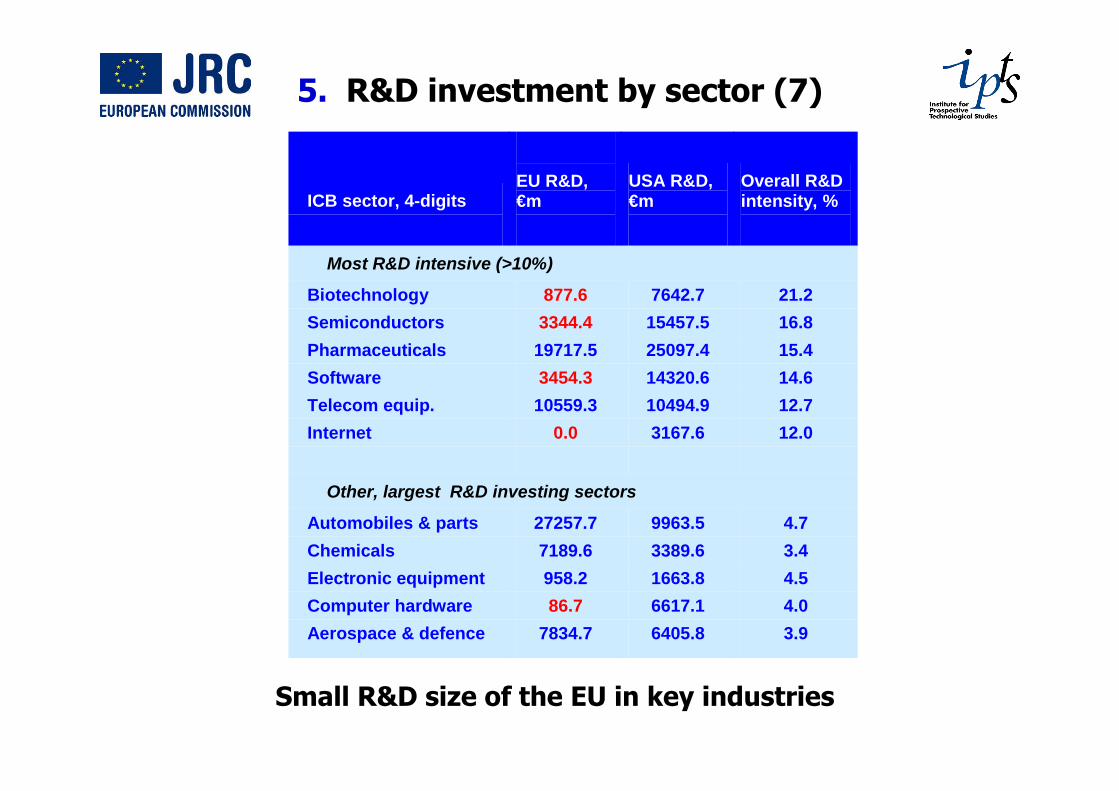
5. R&D investment by sector (7)
ICB sector, 4-digits
EU R&D, €m
USA R&D, €m
Overall R&D intensity, %
Most R&D intensive (>10%)
Biotechnology 877.6 7642.7 21.2 Semiconductors 3344.4 15457.5 16.8 Pharmaceuticals 19717.5 25097.4 15.4 Software 3454.3 14320.6 14.6 Telecom equip. 10559.3 10494.9 12.7 Internet 0.0 3167.6 12.0
Other, largest R&D investing sectors
Automobiles & parts 27257.7 9963.5 4.7 Chemicals 7189.6 3389.6 3.4 Electronic equipment 958.2 1663.8 4.5 Computer hardware 86.7 6617.1 4.0 Aerospace & defence 7834.7 6405.8 3.9
Small R&D size of the EU in key industries
22
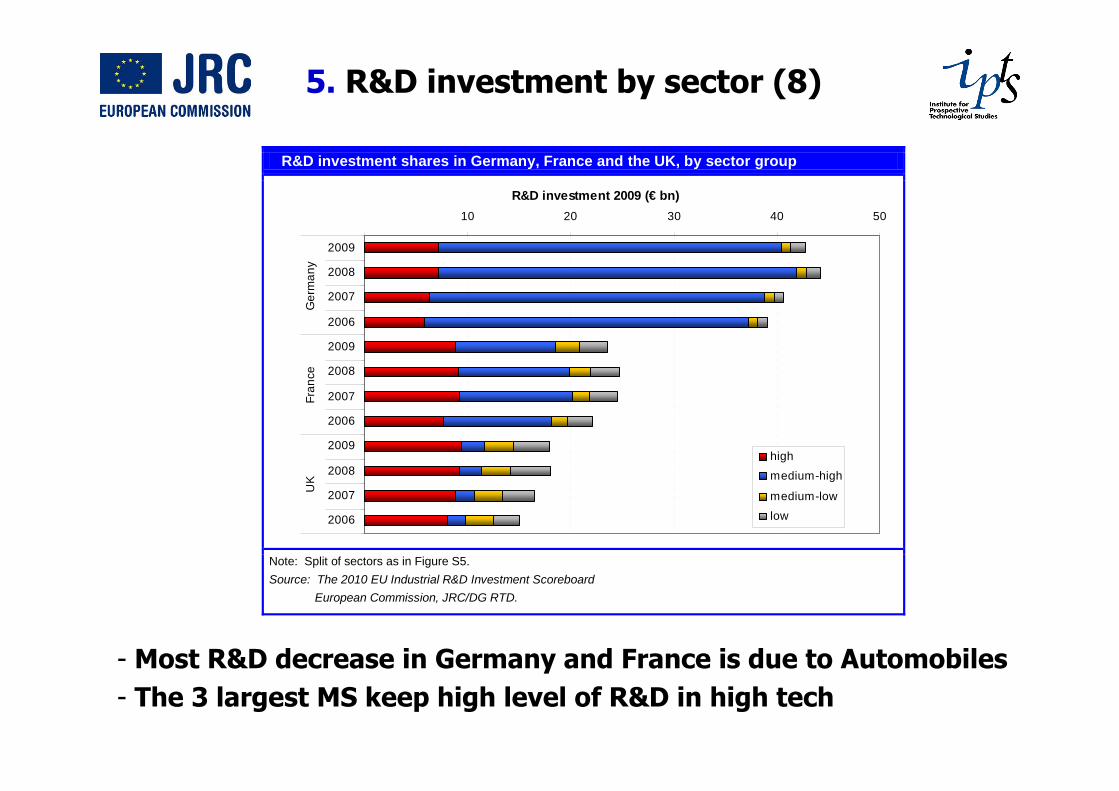
5. R&D investment by sector (8)
R&D investment shares in Germany, France and the UK, by sector group
10 20 30 40 50
2009
2008
2007
2006
2009
2008
2007
2006
2009
2008
2007
2006
Ger
man
yFr
ance
UK
R&D investment 2009 (€ bn)
high
medium-high
medium-low
low
Note: Split of sectors as in Figure S5. Source: The 2010 EU Industrial R&D Investment Scoreboard
European Commission, JRC/DG RTD.
- Most R&D decrease in Germany and France is due to Automobiles- The 3 largest MS keep high level of R&D in high tech
23
6. Age and R&D intensity of companies
24
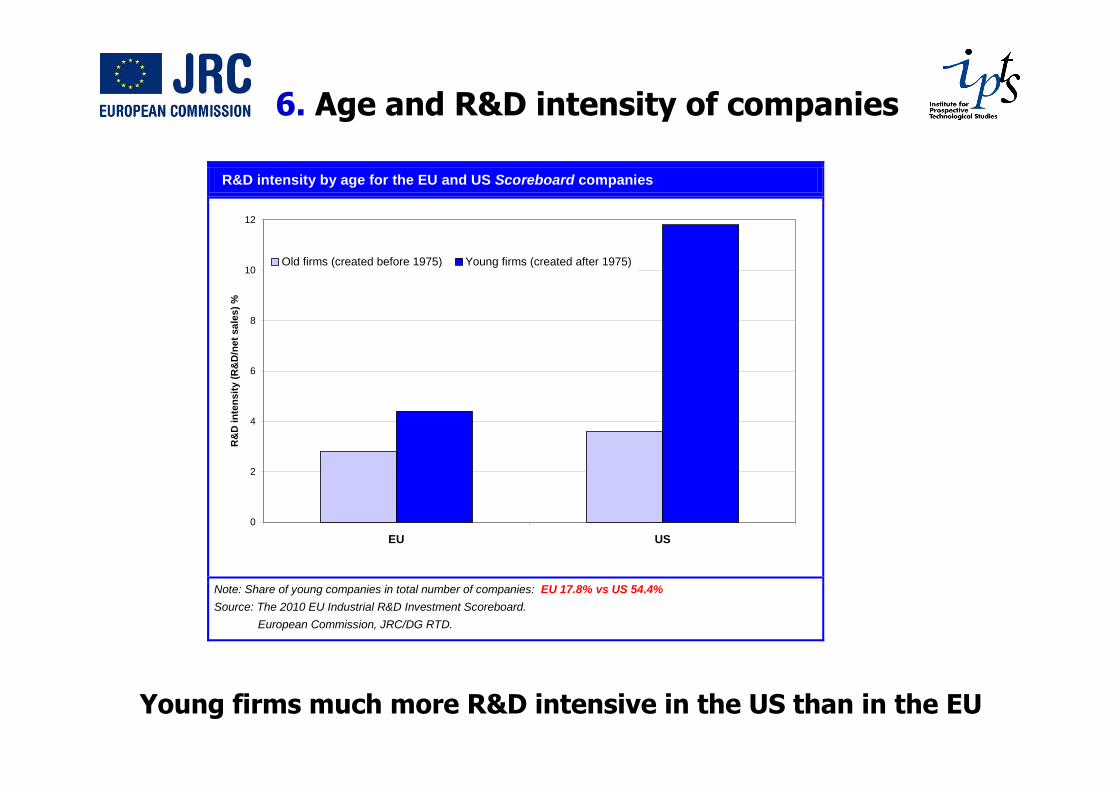
6. Age and R&D intensity of companies
Young firms much more R&D intensive in the US than in the EU
R&D intensity by age for the EU and US Scoreboard companies
0
2
4
6
8
10
12
EU US
R&
D in
tens
ity (R
&D
/net
sal
es) %
Old firms (created before 1975) Young firms (created after 1975)
Note: Share of young companies in total number of companies: EU 17.8% vs US 54.4% Source: The 2010 EU Industrial R&D Investment Scoreboard.
European Commission, JRC/DG RTD.
25
Summary
• Worldwide corporate R&D proved resilient to the global recession (R&D drop by 1.9% & sales by 10.1%)
• Toyota is first R&D investor followed by Roche; Volkswagen in 4th position is biggest R&D investor in the EU
• Overall R&D figures mask significant differences by
- Sector: pharma continued to rise (5.3%) whereas automotive & IT hardware were severely hit (-11.6% vs -6.4%)
- Region: EU (-2.6%) better than US (-5.1%) whereas some Asian countries strongly increase R&D, China (40%), India (27.3%), etc.
• Beyond the crisis:
- US dominates in high-tech and EU in medium-high tech but new players likely to challenge them over the medium term
- EU’s main weakness: Small R&D size of its high-tech sector
• EU’s R&D pattern mainly shaped by countries with large share of automotive R&D (Germany and France) and IT hardware R&D (Finland and Sweden)