Embed Size (px)
Citation preview

ISSN
252
1-18
38
z
The 2012 crisis in Mali and its implications on resilience and food security
FAO AGRICULTURAL DEVELOPMENT ECONOMICS WORKING PAPER 17-04
July 2017


The 2012 crisis in Mali and its implications
on resilience and food security
Marco d’Errico, Francesca Grazioli, Aurélien Mellin
Food and Agriculture Organization of the United Nations
Rome, 2017
Recommended citation
D’Errico, M., Grazioli, F. & Mellin, A. 2017. The 2012 crisis in Mali and its implications on
resilience and food security. FAO Agricultural Development Economics Working Paper 17-04.
Rome, FAO.
The designations employed and the presentation of material in this information product do
not imply the expression of any opinion whatsoever on the part of the Food and Agriculture
Organization of the United Nations (FAO) concerning the legal or development status of any
country, territory, city or area or of its authorities, or concerning the delimitation of its frontiers
or boundaries. The mention of specific companies or products of manufacturers, whether or
not these have been patented, does not imply that these have been endorsed or
recommended by FAO in preference to others of a similar nature that are not mentioned.
The views expressed in this information product are those of the authors and do not
necessarily reflect the views or policies of FAO.
ISBN 978-92-5-109835-6
© FAO, 2017
FAO encourages the use, reproduction and dissemination of material in this information
product. Except where otherwise indicated, material may be copied, downloaded and printed
for private study, research and teaching purposes, or for use in non-commercial products or
services, provided that appropriate acknowledgement of FAO as the source and copyright
holder is given and that FAO’s endorsement of users’ views, products or services is not
implied in any way.
All requests for translation and adaptation rights, and for resale and other commercial use
rights should be made via www.fao.org/contact-us/licence-request or addressed to
FAO information products are available on the FAO website (www.fao.org/publications) and
can be purchased through [email protected]
iii
Contents
List of tables ........................................................................................................................ iv
List of figures ....................................................................................................................... iv
Abstract ................................................................................................................................ v
Acknowledgments ............................................................................................................... vi
1 Background .................................................................................................................. 1
1.1 Identification strategy ............................................................................................. 1
2 Exploring the nexus between conflict and resilience ..................................................... 6
2.1 Theoretical framework ........................................................................................... 6
2.2 Destruction and theft of assets............................................................................... 8
2.3 Limited basic services further deteriorated by conflict ............................................ 9
2.4 Localized disruption of social service provision .................................................... 10
2.5 Restricted use of social safety nets ...................................................................... 11
2.6 Deterioration of food security ............................................................................... 11
3 Data ........................................................................................................................... 15
4 Resilience measurement ............................................................................................ 16
5 Estimation strategy ..................................................................................................... 18
5.1 Pseudo-panel approach ....................................................................................... 18
5.2 Impact evaluation strategy ................................................................................... 18
6 Findings ...................................................................................................................... 21
7 Conclusions ................................................................................................................ 26
References ........................................................................................................................ 28
Annex ................................................................................................................................ 34
iv
List of tables
Table 1 Resilience pillars and variables ................................................................... 16 Table 2 T-test for baseline ........................................................................................ 21 Table 3 Impact of conflicts in 2012 on RCI, Mali ....................................................... 22 Table 4 Difference in conflict impact over RCI .......................................................... 23 Table 5 Effect of conflicts on resilience pillars and their variables ............................ 23
List of figures
Figure 1 The road network and population density in Mali ........................................... 3 Figure 2 Political conflict by event type in West Africa between 2009 and 2014 .......... 5 Figure 3 Estimate of weekly value of smuggling from Algeria to Mali ......................... 10 Figure 4 Food price fluctuations, Mali ........................................................................ 12 Figure 5 Mali Dietary Energy Supply (DES) ............................................................... 13 Figure 6 Conflict intensity in Mali from 1990 to 2015 ................................................. 14
v
The 2012 crisis in Mali and its implications on resilience and food security
Marco d’Errico1, Francesca Grazioli1, Aurélien Mellin1
1 Food and Agriculture Organization of the United Nations, Agricultural Development Economics Division (ESA), Viale delle Terme di Caracalla, 00153 Rome, Italy
Abstract
Food security can be considered an outcome of resilience. From this perspective, a
household can be considered resilient if it manages to recover from a shock and return to the
previous level of food security that it held prior to the shock occurring.
As such, exploring the nexus between resilience and conflict means looking at both a
theoretical and an analytical framework that can help to establish the channels through which
conflict affects resilience and, ultimately, food security. This approach also draws policy-
makers’ attention to the key aspects to be considered (in the case of conflict) in order to
restore and/or maintain resilience and, thus, food security.
This analysis highlights that household resilience deteriorates as a result of: reduced adaptive
capacity; a decrease in productive and non-productive assets; and an increase in exposure
to shocks.
This paper looks at datasets from Mali in order to econometrically measure the impact of
conflict – namely, the 2012 Tuareg rebellion and insurrection of Al Qaeda in the Islamic
Maghreb (AQIM) – on resilience to food insecurity for the population in northern Mali. The
findings of this paper show that these conflicts have had a strong impact, which must be
adequately addressed with supportive interventions.
Keywords: Resilience, Food Security, Conflict, Mali, Structural equation Model
JEL codes: D74, O55, Q18

vi
Acknowledgments
The Authors would like to acknowledge the contribution of many colleagues. We especially
would like to thank Professor Tilman Brück for the important inputs and suggestions as well
as for the constant incentives and supports. Similarly we would like to thank the presenters
and participants to the 12th Households in Conflict Network (HiCN) - FAO/ISDC Workshop
(Rome, 24-25 October 2016) for their suggestions. We would also like to thank our colleagues
from World Bank and Unicef that provided both data and specific variables, and contributed
with comments; in particular we want to mention Mr Sundashu Handa, Mr Yele Maweki
Batana, Mr Patrick Hoang-Vu Eozenou, and Ms Dorsati Madani.
1
1 Background
The nexus between food security and conflict has been and is currently being analysed by
many researchers, practitioners and scholars; examples exist of various approaches to
studying the effect of conflict on food security based on its connection to economic health
(Collier and Hoeffler, 2004), how conflict interferes with socio-political characteristics of
individuals and so their food security level (Esteban and Ray, 2009), shocks and stability
(Miguel, Satyanath and Sergenti, 2004; Dube and Vargas, 2013), and income composition
(Murshed and Tadjoeddin, 2009), including dependence on aid (Grossman, 1992) and on
extractive resources (Collier and Hoeffler, 2005) as key determinants of the relationship
between conflict and food security. Further examples exist that attempt to explore the reverse
relationship; that is, how food security can affect conflict, which generally looks into the
opportunity costs of participating in conflicts (Gurr, 1993; Stewart, 2008; Justino, 2009).
Although far from reaching a consensus, the discourse is alive and interesting.
However, the debate does not feature resilience, which is closely related to food security
(d’Errico et al. 2016). Although many studies exist that show the link between conflict and
various aspects of resilience, no attempt has been made – to the best of the knowledge of the
authors of this paper – to approach this relationship in a systematic way. That is, looking at the
relationship between conflict and a construct that can be defined as ‘household resilience
capacity’.
In a scenario of instability, the capacity of households to absorb and adapt to shocks is
paramount. Livelihoods, which are already affected by extreme climate conditions and conflict
over natural resources, are further jeopardised by the use of force by political actors. Therefore,
exploring the link between food security, resilience and conflict can help develop a better
understanding of the policy considerations needed for restoring livelihoods and meeting food
security needs.
This paper seeks to contribute to the current literature by providing evidence of the negative
effect of conflict on household resilience capacity, and by explaining the channels through
which these effects deteriorate the capacity to ‘bounce back’ to a desired level of food security.
It achieves its objectives by assessing the negative effects of the conflicts in the Northern
regions of Mali against a household resilience measure called RIMA (presented further below
in this paper); the analysis further disaggregates the resilience construct in order to assess the
channels of transmission between conflict and resilience capacity.
The reminder of the paper presents the identification strategy (chapter 2); the theoretical
framework of the nexus between conflict and resilience (chapter 3); the data employed (chapter
4); RIMA (chapter 5); and the estimation strategy (Chapter 6). Chapter 7 discusses the findings
and chapter 8 concludes.
1.1 Identification strategy
For a number of reasons, Mali is a valid case study for exploring the relationship between
conflict and resilience. Firstly, due to the fact that there is data available; second, because a
conflict occurred there that can be identified and contextualized with precision. Finally, given
the unique history of the country.

2
Even though, for a long period of time, Mali has been considered a model nation for stability
and democracy in the Sahel region (Holder, 2013),1 in 2012 the country experienced a series
of disruptive events – an insurgence of various armed rebel and Islamist groups, a political
coup and major military interventions by foreign powers all within a year, referred to hereafter
as ‘the 2012 crisis’.
From January 2012 to January 2013, a chain reaction of events occurred that challenged the
stability of the Malian nation, featuring secessionist movements, religious extremism dynamics,
questioning of state legitimacy. During early 2012, the security situation in northern Mali had
deteriorated due to the simultaneous occurrence of the Tuareg rebellion2 and the Al Qaeda in
the Islamic Maghreb (AQIM) insurgence.3 As a result of the unstable situation at that time, a
political coup led by members of the local military took place in March 2012, which effectively
weakened already fragile state structures.
This coup rendered the Government of Mali incapable of responding to the ongoing offensive
of armed rebel groups,4 which were taking over three northern regions, Kidal, Gao and
Timbuktu. This rebel activity triggered the deployment of the African-led International Support
Mission in Mali (AFISMA)5 and the French-led Opération Serval, both of which were initiated
in January 2013.6 Although the onset of the 2012 crisis was swift, it is important to stress that
there were other long-term factors that contributed to this destabilizing of governance in Mali.
After a coup that took place in 1991, the establishment of Mali’s Third Republic was aimed at
tackling corruption within politics and government administration. However, in 2003 corruption
in these areas was still a major feature of the Government of Mali, and had spread to every
level of state administration. Patronage had become a normalized practice, given that “the
posts in public administration can be viewed as assets”, through which individuals could pursue
their own interests (World Bank, 2015). Furthermore, the performance of public services was
critically poor as a result of a lack of resources. Following on from this, the 2012 military coup
established a non-democratic regime, which further distanced governance in Mali from the
population and their concerns (Marchal, 2012; Siméant and Traoré, 2012).
1 However, an analysis of recorded conflict reveals recurring waves of violence in Mali over the past 15 years preceding the more recent 2012 crisis. 2 The Tuareg community is a Berber ethnic minority group that for decades had been fighting the Malian state in a claim for more autonomy in the three northern regions of Gao, Kidal and Timbuktu, designated as the ‘Azawad’ territory (Holder, 2013). The Tuareg rebellion was made in 2012 of a coalition of rebel groups in which the MNLA played a central role. 3 The Al Qaeda insurgence in Mali has been implanted in Mali since the end of the 1990’s and the early 2000’s. During this period, the Salafist Group for Preaching and Combat (Groupe Salafiste pour la Prédication et le Combat -GSPC) which fought the Algerian government during the civil war were eventually chased away and settled in Mali where they developed ties with Al Qaeda. In 2007, AQIM was born from the roots of the GSPC and the support from the international Islamist nebula. In early 2012, AQIM and its splinter groups actually coalesced with Tuareg rebel groups to challenge the Malian government authority in the three northern regions and to enforce secession over the Azawad territory (Sköns and Nyirabikali, 2016). 4 The National Movement for the Liberation of Azawad (MNLA), a Tuareg-led rebel group, initiated the
insurrection against the Malian state in January 2012 and was later joined by Mouvement pour l'unicité et le
jihad en Afrique de l'Ouest (MUJAO), AQIM, Ansar Dine and former Malian militaries. By November 2012,
the MUJAO, AQIM and Ansar Dine controlled, respectively, the regions of Gao, Timbuktu and Kidal (Sköns
and Nyirabikali, 2016). 5 The AFISMA was a military intervention led by the Economic Community of West African States, which was authorised during December 2012. 6 Ansar Dine’s subsequent armed offensive over the region of Mopti triggered the Opération Serval
intervention by French forces in January 2013 (Sköns and Nyirabikali, 2016).
3
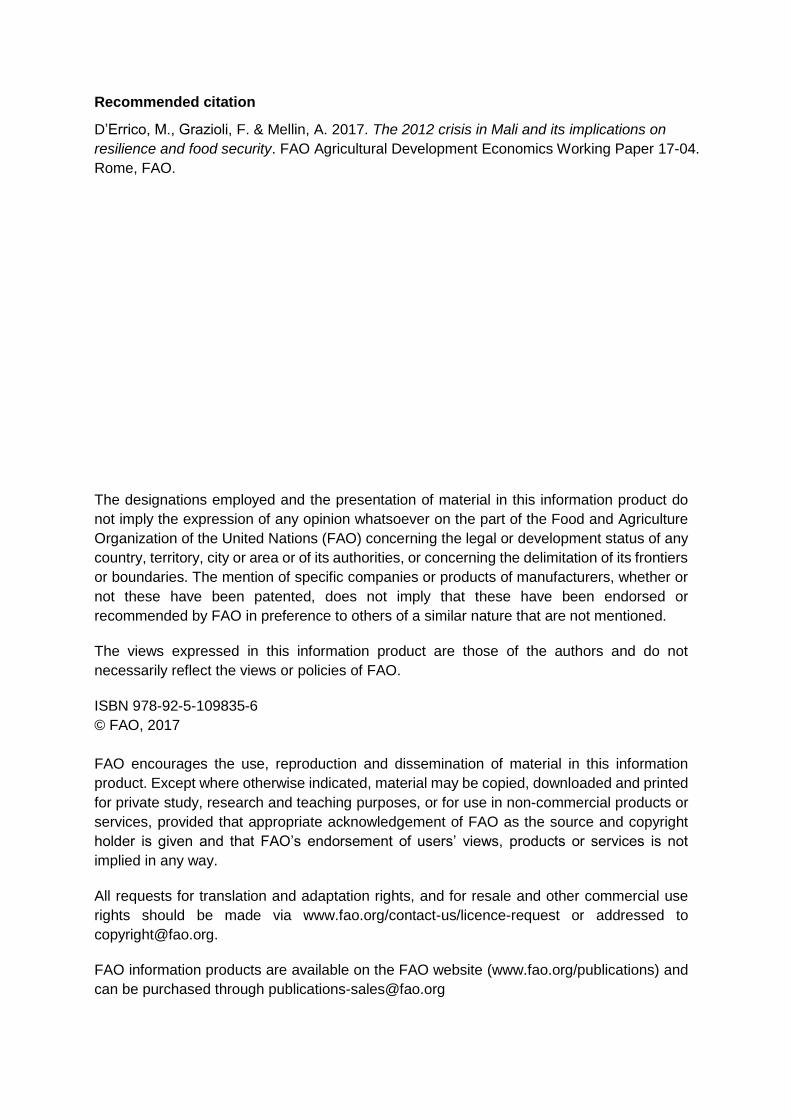
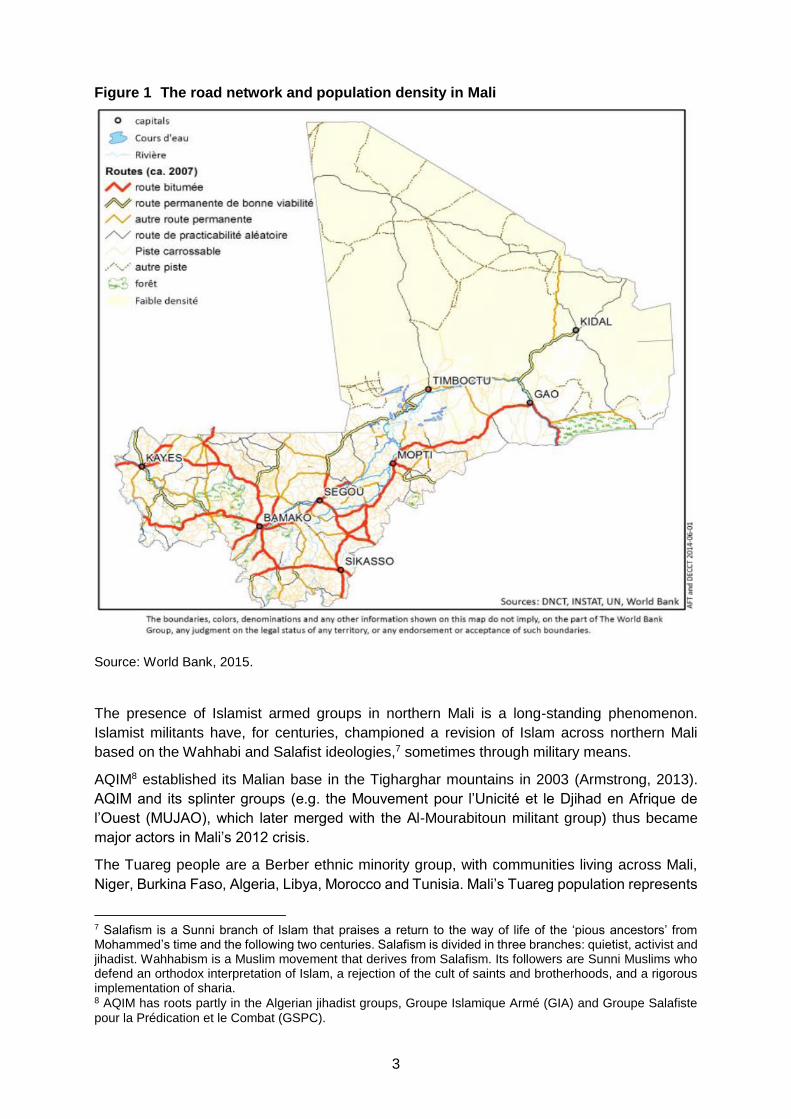
Figure 1 The road network and population density in Mali
Source: World Bank, 2015.
The presence of Islamist armed groups in northern Mali is a long-standing phenomenon.
Islamist militants have, for centuries, championed a revision of Islam across northern Mali
based on the Wahhabi and Salafist ideologies,7 sometimes through military means.
AQIM8 established its Malian base in the Tigharghar mountains in 2003 (Armstrong, 2013).
AQIM and its splinter groups (e.g. the Mouvement pour l’Unicité et le Djihad en Afrique de
l’Ouest (MUJAO), which later merged with the Al-Mourabitoun militant group) thus became
major actors in Mali’s 2012 crisis.
The Tuareg people are a Berber ethnic minority group, with communities living across Mali,
Niger, Burkina Faso, Algeria, Libya, Morocco and Tunisia. Mali’s Tuareg population represents
7 Salafism is a Sunni branch of Islam that praises a return to the way of life of the ‘pious ancestors’ from Mohammed’s time and the following two centuries. Salafism is divided in three branches: quietist, activist and jihadist. Wahhabism is a Muslim movement that derives from Salafism. Its followers are Sunni Muslims who defend an orthodox interpretation of Islam, a rejection of the cult of saints and brotherhoods, and a rigorous implementation of sharia. 8 AQIM has roots partly in the Algerian jihadist groups, Groupe Islamique Armé (GIA) and Groupe Salafiste
pour la Prédication et le Combat (GSPC).
4
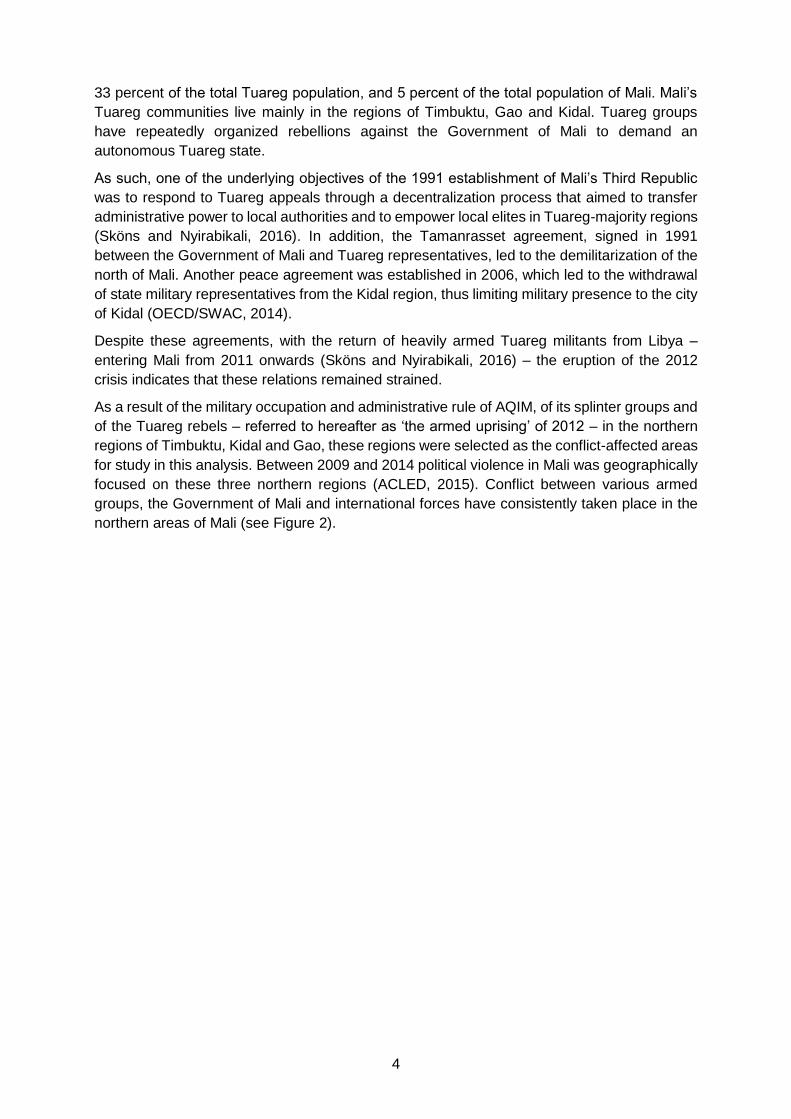
33 percent of the total Tuareg population, and 5 percent of the total population of Mali. Mali’s
Tuareg communities live mainly in the regions of Timbuktu, Gao and Kidal. Tuareg groups
have repeatedly organized rebellions against the Government of Mali to demand an
autonomous Tuareg state.
As such, one of the underlying objectives of the 1991 establishment of Mali’s Third Republic
was to respond to Tuareg appeals through a decentralization process that aimed to transfer
administrative power to local authorities and to empower local elites in Tuareg-majority regions
(Sköns and Nyirabikali, 2016). In addition, the Tamanrasset agreement, signed in 1991
between the Government of Mali and Tuareg representatives, led to the demilitarization of the
north of Mali. Another peace agreement was established in 2006, which led to the withdrawal
of state military representatives from the Kidal region, thus limiting military presence to the city
of Kidal (OECD/SWAC, 2014).
Despite these agreements, with the return of heavily armed Tuareg militants from Libya –
entering Mali from 2011 onwards (Sköns and Nyirabikali, 2016) – the eruption of the 2012
crisis indicates that these relations remained strained.
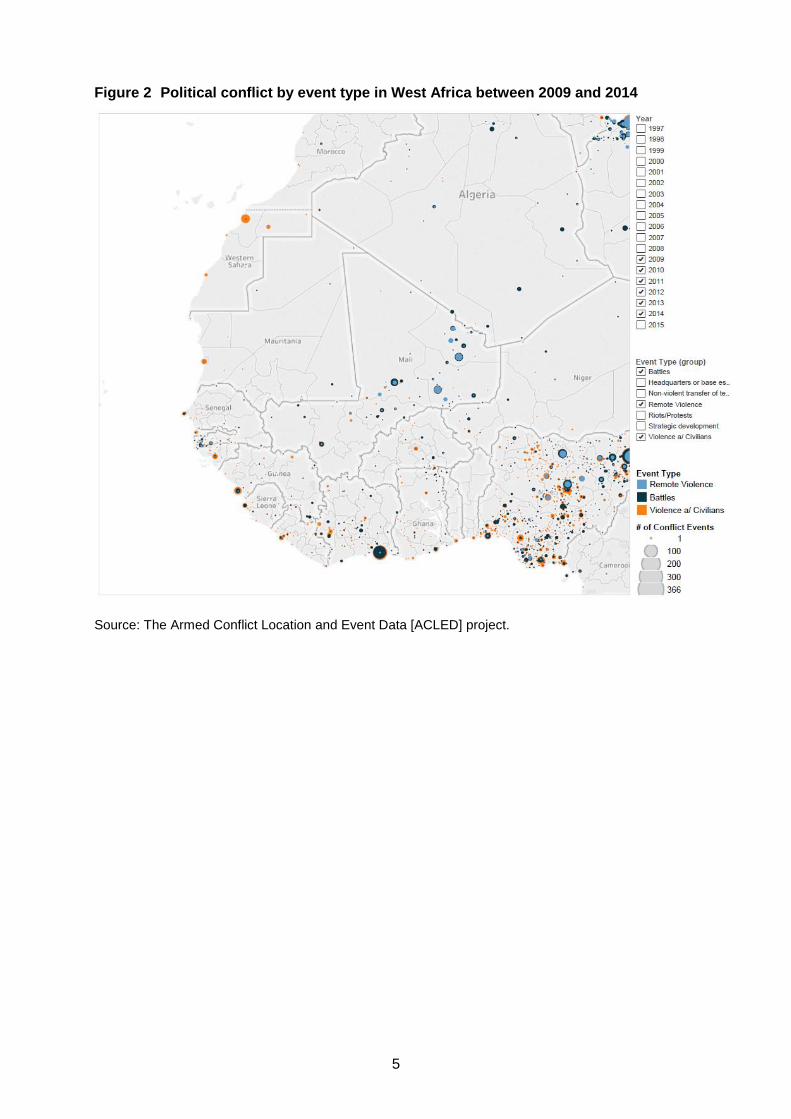
As a result of the military occupation and administrative rule of AQIM, of its splinter groups and
of the Tuareg rebels – referred to hereafter as ‘the armed uprising’ of 2012 – in the northern
regions of Timbuktu, Kidal and Gao, these regions were selected as the conflict-affected areas
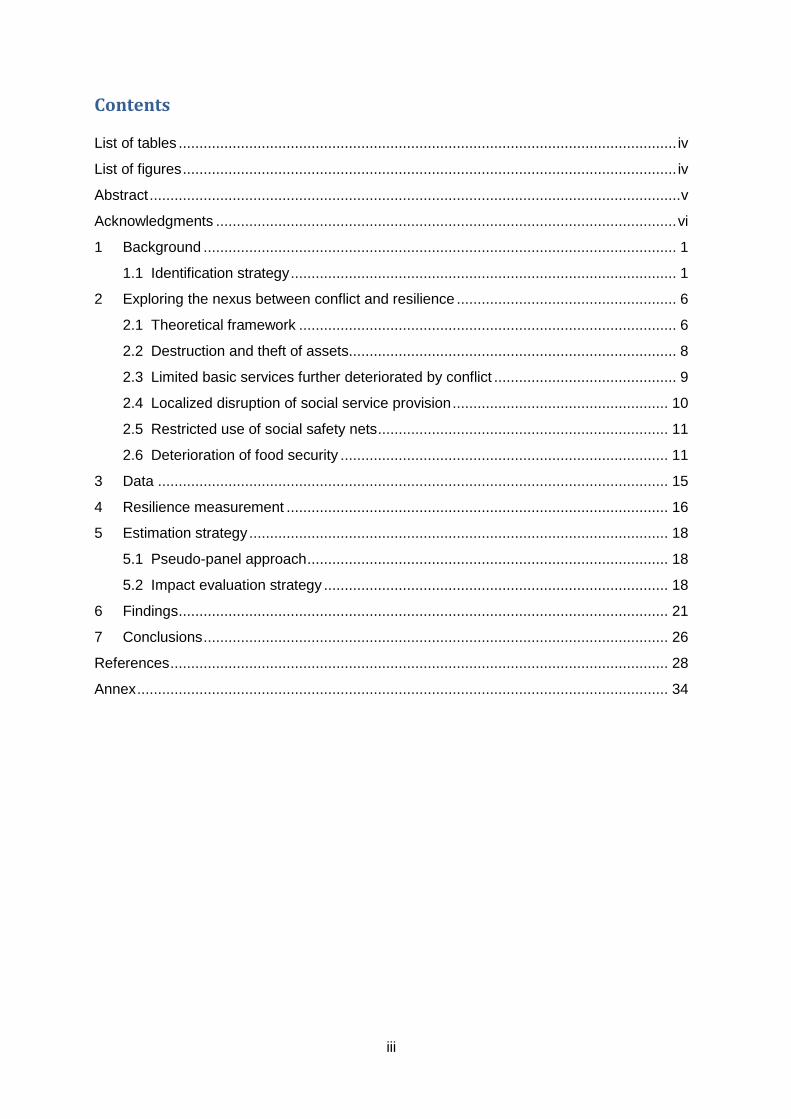
for study in this analysis. Between 2009 and 2014 political violence in Mali was geographically
focused on these three northern regions (ACLED, 2015). Conflict between various armed
groups, the Government of Mali and international forces have consistently taken place in the
northern areas of Mali (see Figure 2).
5
Figure 2 Political conflict by event type in West Africa between 2009 and 2014
Source: The Armed Conflict Location and Event Data [ACLED] project.
6
2 Exploring the nexus between conflict and resilience
2.1 Theoretical framework
Resilience is a multi-faceted concept that can be broadly defined as “the capacity that ensures
adverse stressors and shocks do not have long-lasting adverse development consequences”
(Constas, Frankenberger and Hoddinott, 2013). From a theoretical point of view, and based
on the above-mentioned definition, addressing resilience calls for a long-term perspective
(Pingali, Alinovi and Sutton, 2005). That is, resilience-enhancing interventions should be
focused on a medium- to long-term time frame. Furthermore, some components of resilience
have an immediate effect on household well-being and food security (for example, on
productive assets) while the effect of other components may be more delayed and/or long-
term (for instance, on education). Resilience also correlates to agency, that is, the agent’s
capacity to absorb and adapt to shocks and consequently transform livelihoods in order to deal
with the effects of the shock (d’Errico et al., 2016).
Finally, resilience is an outcome-based concept. In the case of household resilience capacity,
the outcome variable that measures how resilient the household is in relation to a shock must
be a measure of the agent’s status in terms of a given, standardized output level (e.g. poverty
line, minimum food caloric intake, etc.). The dependent variable may differ depending on the
scale and unit of analysis. In this case, the analysis focuses on estimating household resilience
to food insecurity (i.e. the capacity of a household to return to its previous level of food security
after the occurrence of a shock).
Therefore, this relationship can be expressed as:
𝐹𝑆ℎ,𝑡 = 𝑓(𝑅𝐶𝐼ℎ,𝑡 , 𝑍ℎ,𝑡)
where the food security level of the household h at time t depends on the Resilience Capacity
Index (RCI) and a set of time-variant and time-invariant socio-economic characteristics of the
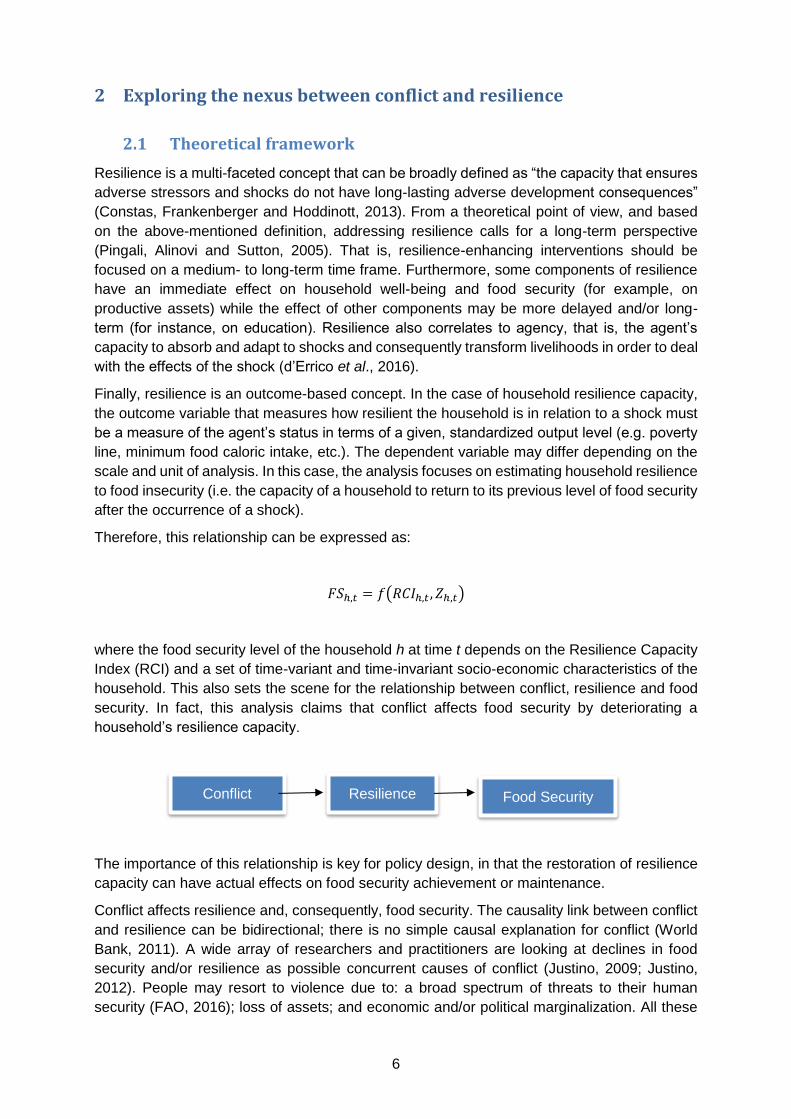
household. This also sets the scene for the relationship between conflict, resilience and food
security. In fact, this analysis claims that conflict affects food security by deteriorating a
household’s resilience capacity.
The importance of this relationship is key for policy design, in that the restoration of resilience
capacity can have actual effects on food security achievement or maintenance.
Conflict affects resilience and, consequently, food security. The causality link between conflict
and resilience can be bidirectional; there is no simple causal explanation for conflict (World
Bank, 2011). A wide array of researchers and practitioners are looking at declines in food
security and/or resilience as possible concurrent causes of conflict (Justino, 2009; Justino,
2012). People may resort to violence due to: a broad spectrum of threats to their human
security (FAO, 2016); loss of assets; and economic and/or political marginalization. All these
Conflict Resilience Food Security
7
factors, individually or together, can trigger conflicts. For instance, unstable, higher food prices
can cause social unrest (Bellemare, 2015), as can competition for control of natural resources
such as land and water (FAO, 2016).
Typically, economic explanations of the reasons behind people’s involvement in violent
behaviour are dominated by opportunity cost theories (Maystadt and Ecker, 2014). In other
words, individuals might weigh the relative costs and benefits of engaging in criminal activities,
either by joining or supporting them (Draca and Machin, 2015). People may engage with
militant activity or rebellions because they may stand to gain from that engagement in the form
of economic and social opportunities (Grossman, 2004) or because non-participation is riskier
than participation (Kalyvas and Kocher, 2007).
A number of trends and factors can lead to social tension, such as unequal distribution of
income and other material goods; growing competition for land and water, due to land
degradation or high population growth (Bora et al., 2010); higher global food prices (Brinkman
and Hendrix, 2011); high infant mortality rates and slow growth in food production (Messer and
Cohen, 2007); perception of inequality (Messer, Cohen and Marchione, 2002); competition for
food production resources (Simmons, 2013); and worsened climatic conditions (Maystadt and
Ecker, 2014). These many factors offer fertile ground for the conditions that precipitate conflict.
It is also true that countries with lower per capita caloric intake are more prone to experiencing
civil conflict, and this relationship is stronger in states where primary commodities make up a
large proportion of the export profile (Brinkman and Hendrix, 2011). It has been suggested that
food insecurity can fuel and drive conflict, especially in the presence of unstable political
regimes, a high youth population, stunted economic development, slow or declining economic
growth, and high inequality (Breisinger et al., 2014; Ecker, 2014). Finally, those countries with
the lowest levels of food security are all either engaged in or have recently emerged from war
(von Grebmer et al., 2015).
These arguments are important for Mali, where one of the root causes of participation in the
Tuareg rebellion was unemployment and food insecurity. Mali's average rainfall has dropped
by 30 percent since 1998 (Stewart, 2013), with droughts becoming longer and more frequent;
this translates to chronic food insecurity. Another reason for participation in the rebellion was
desertification. Due to this, herders from neighbouring regions and countries (such as Algeria
and Niger) have been moving into areas that the Tuareg community uses for grazing.9 The
emergence of a ‘food for jihad’10 practice was another successful programme in which new
recruits were attracted to Islamist armed groups. This is also confirmed by Brinkman and
Hendrix (2011), which reports that those most likely to participate in armed conflicts are young
men from rural areas with limited education and economic prospects – fighting becomes
attractive once work is unavailable.
Socio-economic conditions in the north of Mali, particularly endemic poverty, have created a
pervasive sense of marginalization and a lack of livelihood opportunities for young men. This
factor has fed into the region’s recurrent conflicts (Haysom, 2014). The above-mentioned
Tuareg uprising in Mali in the early 1990s was also fuelled by resentment over the
embezzlement of international relief funds by ethnically Bambara (i.e. non-Tuareg) government
9 Ethnic tensions that have evolved into local or regional conflicts [insert area here – where is this happening?]
increasingly seem to be linked to environmental factors and natural resources, especially oil and gas reserves, Nile waters, hardwood timbers, rangelands, and rain-fed agricultural land; research confirms that droughts fuel conflict in Somalia (Breisinger et al., 2014) 10 The emergence of this trend was reported on in 2015. For further information, see: http://www.reuters.com/article/us-climatechange-mali-conflict-idUSKBN0NI16M20150427
8
officials and military officers (Hendrix and Brinkman, 2013; Benjaminsen, 2008).
Misappropriated food aid also become a source of political tension; violent actors diverted food
aid in order to satisfy their own basic resource requirements (Hendrix and Brinkman, 2013).
Meanwhile, a shortage of natural resources played a major role in engaging the Tuareg
community in such a bloody rebellion (Abdalla, 2009). Finally, the Tuareg’s community’s
unfulfilled request to the Government of Mali to create new livelihoods after some members of
that community returned from Libya enhanced tension between the government and the
Tuareg community.11
While the long-lasting consequences of all these factors on resilience are difficult to estimate,
evidence exists of losses in human capital that are often irreversible and may persist across
generations (Justino, 2012a). Furthermore, conflict can affect households via economic, social
and institutional changes that take place in the communities and location where people live
(Justino Brück, T. & Verwimp 2013. Thus, exploring the nexus between resilience and conflict
requires utilizing both a theoretical and an analytical framework that can help to establish the
channels through which this causal relationship may ultimately affect food security.
Furthermore, this draws policy-makers’ attention to the particular aspects that need
consideration (in the case of conflict) when designing policies targeting the restoration or
maintenance of food security.
From a theoretical point of view, Justino (2012a) argues that resilience in situations of conflict
depends on three main factors: “(i) the magnitude and duration of the effects of violence; (ii)
the type of coping strategies that people are able (or allowed) to access; and (iii) the
effectiveness of the strategies adopted to cope with the effects of conflict and violence”.
From an analytical point of view, this paper suggests that a sound approach to exploring
channels of transmission between conflict and resilience should disaggregate the analysis by
pillar of resilience and the components, or variables, of each of these pillars. This allows for
the identification of the main determinants of a decline in resilience.
This strategy is explored further below in the section covering the findings of the analysis.
2.2 Destruction and theft of assets
Asset destruction or loss is a common feature of violent conflict; conflict deteriorates both
productive and non-productive assets (e.g. houses, land, livestock, utensils, labour) (González
and Lopez, 2007; Shemyakina, 2011; Verpoorten, 2009).
Such asset loss directly endangers the capacity of households to maintain survival strategies
in the context of violent events, as it reduces a household’s productive capacity in the short
term. Further, asset loss also decreases a household’s ability to effectively recover from a
shock in a post-conflict situation (Justino, 2012b). In fact, certain assets can become liabilities
in the context of conflict, as their value can attract predatory behaviour, such as looting by
conflict actors (Lautze, 2010). In addition, in the case of northern Mali during the 2012 crisis,
rebel groups have required mobility to carry out their insurgency operations – controlling the
main routes and lines of communication (OECD/SWAC, 2014). Rebel groups can thus hinder
pastoralist activity and the nomadic movement of populations and livestock, in some cases
also resorting to asset theft for their own consumption or material advantage. Consequently,
11 The Tuareg community is nomadic, moving across Algeria, Burkina Faso, Libya, Niger and Mali. For further information on how their migration practices have compounded the 2012 crisis, see: http://www.migrationpolicy.org/article/tuareg-migration-critical-component-crisis-sahel
9
during the 2012 crisis livestock units were repeatedly stolen or the animals died as a result of
their migration being inhibited, which thwarted access to pasture and to animal health services.
Similarly, agricultural land was left abandoned due to conflict (Foley and Duechting, 2015). It
is therefore likely that the resilience of households that depend on agriculture for their livelihood
in the Timbuktu, Gao and Kidal regions was severely affected due to the impact of conflict on
their productive assets.
Of note for this paper is the fact that the long-term consequences of conflict on resilience
(through, for instance, asset destruction, reduced access to education, and significant
limitation of basic services provision) could not be included in this analysis without long-running
data sets, which are currently unavailable.
2.3 Limited basic services further deteriorated by conflict
As explained above, the provision of basic services in northern Mali was already scarce and
inefficient prior to the conflict involved in the 2012 crisis. This was due to the absence of the
state, poorly equipped local authorities, and corruption and patronage influencing relations
between state officials and citizens. As stressed by Justino, Brück and Verwimp (2013), conflict
generally leads to the destruction of civil infrastructure, such as roads, which would otherwise
provide local populations with access to basic services, such as water facilities. With the
breakout of the armed uprising involving AQIM, its splinter groups and Tuareg rebels in 2012,
the provision of services by public authorities in Mali thus deteriorated, most likely as public
servants left conflict areas and infrastructure was abandoned, looted or destroyed (Foley and
Duechting, 2015; OCHA, 2013). The provision of basic services, such as water facilities, was
also reduced due to recurrent droughts and the dehydration of water points (OCHA, 2013),
which is likely to have further deteriorated households’ resilience capacity. In addition, large
quantities of fuel, which can serve to produce electricity, were supplied through unregulated
means even before the conflicts of 2012 erupted (OECD/SWAC, 2014). The drastic reduction
in unregulated transnational flows of goods between 2011 and 2014 therefore probably
impacted household access to electricity, given that there was then a lack of combustible
materials available (see Figure 4).

10
Figure 3 Estimate of weekly value of smuggling from Algeria to Mali
Source: Bensassi, S et al., 2014.
2.4 Localized disruption of social service provision
Regarding household sensitivity to shocks, the situation for households in northern Mali –
which was already worse in terms of sensitivity than for households in the south of Mali prior
to the 2012 crisis – is also expected to have significantly deteriorated as a consequence of
conflict events. During conflict periods, children are often the first victims of a deteriorating
nutritional status and of reduced access to health services. This is likely to provoke long-term,
negative effects on household productivity and resilience. As a result, this exposes households
to greater risk of relying on negative coping strategies or to falling into poverty traps (Justino,
2012). In this sense, according to the United Nations Office for the Coordination of
Humanitarian Affairs (OCHA), 96 out of 199 health facilities in the regions of Timbuktu, Gao
and Kidal were partially or totally destroyed by the warring parties by October 2013. In addition,
only 19 percent of medical personnel were reportedly still working in those three northern
regions at the end of 2013.12 It is worth mentioning that the risk of contracting malaria in Mali
is at its highest between May and October each year. As a result, about 500 000 people did
not have access to health services at the end of 2013 due to the lack of human resources,
medicine and operational facilities, and because of the suspension of aid provision following
the coup in early 2012. Moreover, community bodies, such as school parents’ associations,
had traditionally played a central role in the provision of health assistance in Mali, despite these
associations’ dependence on external support. These structures were further weakened in
northern Mali due to conflict and lack of resources resulting from the 2012 crisis (OCHA, 2013).
12 It is also noteworthy that most displaced populations from northern Mali moved into Mali’s southern regions, where health facilities and schools rapidly became overcrowded. Medical services were thus put under stress by the massive population influx (OCHA, 2013).

11
2.5 Restricted use of social safety nets
A household’s adaptive capacity for dealing with shocks relates to the ways it can respond to
a sudden deterioration of its economic status. In this sense, cash transfers and social safety
nets can reduce the dependence of household members on their livelihood as a source of
income; livelihoods may be affected by the emergence of conflict. The availability of credit and
insurance mechanisms, state allowances, cooperation among households and communities,
and remittances sent from abroad can all improve the resilience capacity of conflict-affected
populations (Justino, 2012). However, in the context of conflict, these forms of financial support
can be jeopardized by a number of factors. For instance, distrust among and between
communities, the loss of social capital, and the destruction of social networks (Justino et al.,
2013). This particularly affects displaced populations, which lose their ties with their original
local networks. As reported by OCHA, about 450 000 Malians had fled conflict-affected areas
as of December 2013 (i.e. they were internally displaced persons (IDPs) and refugees), and
were therefore in need of external and state assistance (OCHA, 2013). Simultaneously,
populations affected by the 2012 crisis faced deteriorating economic conditions, which led to
halted cash flows, the closure of shops and banks, and thwarted development projects (Foley
and Duechting, 2015). Meanwhile, households’ capacity to respond to crises can be advanced
by improving the education level of household members. However, conflict-affected
populations are usually confronted with reduced educational opportunities due to the
occupation, looting or destruction of schools and the flight of teachers. This was the case Mali,
where, according to OCHA (2013), more than 200 schools were destroyed, occupied or looted
by the end of 2013 in conflict-affected areas. Thus, with the improvement of the security
situation in Mali, those returning there from 2014 onwards – in particular, to the regions of
Timbuktu and Gao – will be met with a lack of school infrastructure and teachers for school-
age children.
2.6 Deterioration of food security
In addition to necessitating the use of significant financial resources – which could otherwise
be used for development initiatives – conflicts require human capital and large quantities of
food and provisions to feed and supply unproductive social activities. They also destroy the
means for already inadequate livelihood systems. At the same time, food insecurity can fuel
conflict dynamics, in the sense that limited access to natural resources (e.g. land and water)
increases competition between actors, and can provoke inter- and intra-community conflicts
over limited food production (FAO, 2016). Prior to the 2012 crisis and its associated conflicts,
Mali was already facing nationwide food insecurity. During the occupation of the north of the
country by armed groups,13 production and trade of food with the south were disrupted and
stocks declined. This aggravated the unsustainability of food systems in northern Mali, which
could only be addressed to a limited extent through humanitarian aid. Moreover, prior to the
2012 crisis, illegal trafficking had offered a source of food for households in remote areas along
the border with Algeria. According to estimates from the Organisation for Economic Co-
operation and Development (OECD), in 2011 around €2 000 000 worth of basic foodstuffs was
smuggled from Algeria to Mali. These flows of food products then decreased by 50 percent,
13 It is worth mentioning that while the Government of Mali recovered control of most of the northern regions
in the country, following a nine-month occupation of those areas by AQIM, Ansar Dine, MUJAO and the
National Movement for the Liberation of Azawad (MNLA), the security situation there is still critical due to
attacks and the use of improvised explosive devices (IEDs).
12
mainly due to the fight against smuggling and drug trafficking14 (taking place between 2011
and 2014) in response to the rise of Islamist armed groups in northern Mali (see Figure 4)
(OECD/SWAC, 2014; Scheele, 2013). As such, the Comité Permanent Inter-Etats contre la
sécheresse dans le Sahel (CILSS) deemed most of the areas in Timbuktu, Gao and Kidal and
several areas in the region of Mopti to be in food security crisis in December 2013. The rest of
the Sahel areas were considered ‘in stress’. This food security crisis was the result of multiple
factors, such as the lack of productive agricultural means and pasture for herders, and high
prices for basic foodstuffs. These factors were all directly compounded by the conflicts
associated with the 2012 crisis onward and its effects on food security (OCHA, 2013).
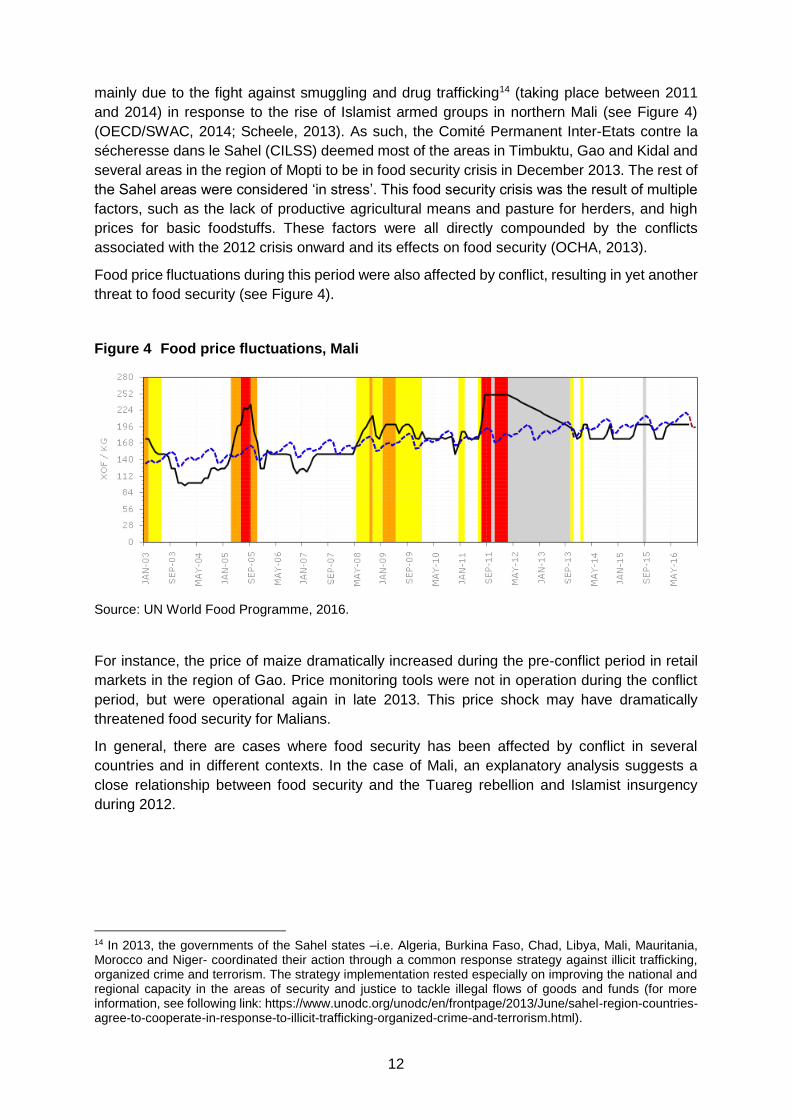
Food price fluctuations during this period were also affected by conflict, resulting in yet another
threat to food security (see Figure 4).
Figure 4 Food price fluctuations, Mali
Source: UN World Food Programme, 2016.
For instance, the price of maize dramatically increased during the pre-conflict period in retail
markets in the region of Gao. Price monitoring tools were not in operation during the conflict
period, but were operational again in late 2013. This price shock may have dramatically
threatened food security for Malians.
In general, there are cases where food security has been affected by conflict in several
countries and in different contexts. In the case of Mali, an explanatory analysis suggests a
close relationship between food security and the Tuareg rebellion and Islamist insurgency
during 2012.
14 In 2013, the governments of the Sahel states –i.e. Algeria, Burkina Faso, Chad, Libya, Mali, Mauritania, Morocco and Niger- coordinated their action through a common response strategy against illicit trafficking, organized crime and terrorism. The strategy implementation rested especially on improving the national and regional capacity in the areas of security and justice to tackle illegal flows of goods and funds (for more information, see following link: https://www.unodc.org/unodc/en/frontpage/2013/June/sahel-region-countries-agree-to-cooperate-in-response-to-illicit-trafficking-organized-crime-and-terrorism.html).
13
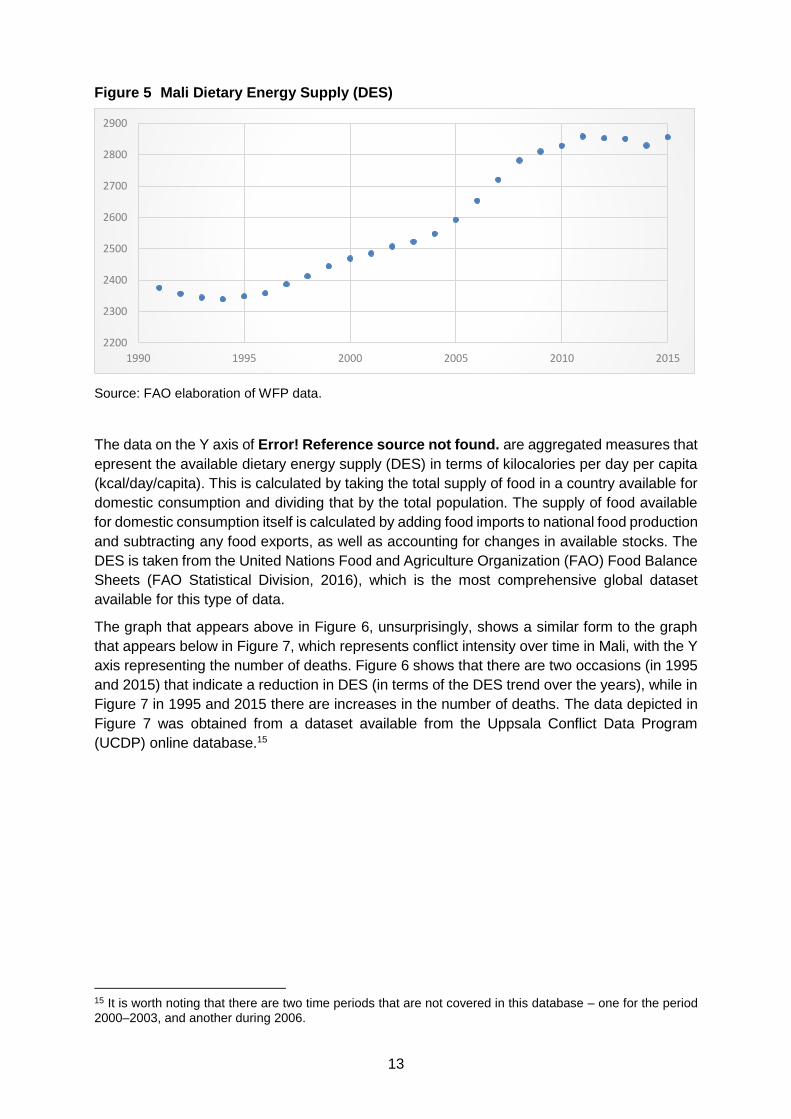
Figure 5 Mali Dietary Energy Supply (DES)
Source: FAO elaboration of WFP data.
The data on the Y axis of Error! Reference source not found. are aggregated measures that
epresent the available dietary energy supply (DES) in terms of kilocalories per day per capita
(kcal/day/capita). This is calculated by taking the total supply of food in a country available for
domestic consumption and dividing that by the total population. The supply of food available
for domestic consumption itself is calculated by adding food imports to national food production
and subtracting any food exports, as well as accounting for changes in available stocks. The
DES is taken from the United Nations Food and Agriculture Organization (FAO) Food Balance
Sheets (FAO Statistical Division, 2016), which is the most comprehensive global dataset
available for this type of data.
The graph that appears above in Figure 6, unsurprisingly, shows a similar form to the graph
that appears below in Figure 7, which represents conflict intensity over time in Mali, with the Y
axis representing the number of deaths. Figure 6 shows that there are two occasions (in 1995
and 2015) that indicate a reduction in DES (in terms of the DES trend over the years), while in
Figure 7 in 1995 and 2015 there are increases in the number of deaths. The data depicted in
Figure 7 was obtained from a dataset available from the Uppsala Conflict Data Program
(UCDP) online database.15
15 It is worth noting that there are two time periods that are not covered in this database – one for the period
2000–2003, and another during 2006.
2200
2300
2400
2500
2600
2700
2800
2900
1990 1995 2000 2005 2010 2015

14
Figure 6 Conflict intensity in Mali from 1990 to 2015
Source: Own elaboration on UPSALA dataset (available at http://ucdp.uu.se/#country/432).
At these points in time during 1995 and 2015, food security decreased and violence increased;
in the later instance, this occurred at approximately the same time as the occurrence of the
Tuareg rebellion and of the Islamist insurgency.16
16 The negative effects of conflicts on food security indicators, such as DES, are not immediate. This is for
two main reasons: because these indicators are typically collected once a year, and because the figures in the DES datasets from FAO Statistics report the average value for a three-year period.
0
200
400
600
800
Num
of d
eath
s
1990 1995 2000 2005 2010 2015years
Own elaboration on UPSALA dataset (http://ucdp.uu.se/#country/432)
Mali - Conflict Intensity

15
3 Data
This study employs two different datasets. The first dataset is the Multiple Indicator Cluster
Survey (MICS). This includes (for a sub-sample only) the Enquête Légère Intégrée auprès des
Ménages (ELIM) which includes a set of questions on livelihood strategies and means of living.
The survey has been implemented by the United Nations International Children's Emergency
Fund (UNICEF)17 together with the National Institute for Statistics and the Ministry for Health,
Social Development and Promotion of Family in Mali18 2009. The second survey comes from
the Enquête Agricole de Conjoncture Intégrée aux conditions de vie des ménages 2014 (EAC-
I 2014), supported by the Living Standards Measurement Study-Integrated Surveys on
Agriculture (LSMS-ISA).
The MICS and ELIM datasets used for this analysis consist of 8 061 observations at the
household level and are representative at the national, regional and urban/rural levels. The EAC-
I 2014 covers 3 711 households, but for security reasons it was not possible to collect data on
the Kidal region, as it was significantly affected by conflict. As a consequence, that region has
been removed from the present impact evaluation analysis. The two sets of data (MICS/ELIM
on one side, LSMS on the other) have quite overlapping questionnaires which includes
information on livelihoods; health; education; safety nets; shocks; assets; food access and
security; and basic services. The ELIM/MICS has a stronger components on children and women
health and empowerment. Both, however, lack of proper data for calculating income; therefore it
has been removed from the estimation of RIMA. These limitations turned into a RIMA
specification that mirrors the data availability and Malian context.
The datasets for both 2009–2010 and 2014 were taken at the household level. The main
limitation for this analysis is that the datasets are not panel datasets. Since it was not possible
to see the effect of conflict on resilience capacity for the same households for the period of 2009–
2010 and 2014, a pseudo-panel strategy was implemented, as explained below.
17 The MICS survey is freely downloadable in the mics website (available at http://mics.unicef.org/surveys). Otherwise a full report is available, issued by the National bureau of Statistics (CSP/SSDSPF 2010) or in the UNICEF-MICS website http://mics.unicef.org/surveys 18 Available in the website of the archive of the National Bureau of statistics: http://www.afristat.org/nadamali/index.php/catalog/ELIM
16
4 Resilience measurement
Resilience is defined according to the definition of the Resilience Measurement Technical Working Group (RMTWG)19.
Household resilience is estimated through The Resilience Index Measurement and Analysis
(RIMA) methodology; this estimates the RCI as a latent variable, which depends on pre-
determined dimensions, called pillars of resilience. While further details on this methodology
can be found in FAO (2016a), it is important to remind here that have been quite a number of
attempts at measuring household resilience to food insecurity. Some of them employs latent
variable models; other approaches this topic with a momentum-based strategy; other simply
employs vulnerability or adaptive capacity indicators as proxy for resilience. There is a sort of
consensus on the fact that latent variable models are the best approach for measuring
household resilience with a unique construct that can then be employed for targeting and
impact evaluation (see d’Errico et al 2017). In the case of RIMA, a two-step approach is
developed which employs observed variables in order to obtain an estimation for the key pillars
of resilience through factor analysis. The second steps employs the estimated pillars into a
structural equation model in order to obtain a resilience construct called Resilience Capacity
Index.
While RIMA-II tends to be consistently designed in every case study, it also very much relies
on context specificity.20 In the case of Mali, and due to the limitations abovementioned, the
model employs four pillars:21 Access to Basic Services (ABS), Assets (AST), Sensitivity (S)
and Adaptive Capacity (AC).
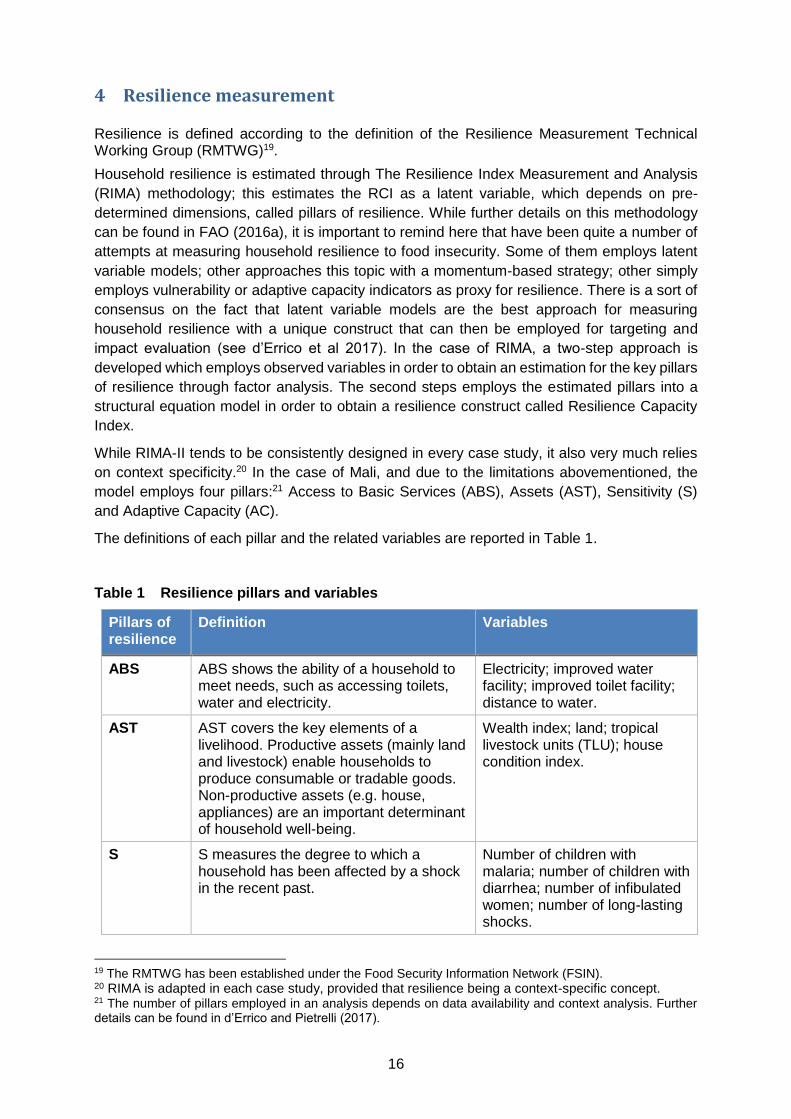
The definitions of each pillar and the related variables are reported in Table 1.
Table 1 Resilience pillars and variables
Pillars of resilience
Definition Variables
ABS ABS shows the ability of a household to meet needs, such as accessing toilets, water and electricity.
Electricity; improved water facility; improved toilet facility; distance to water.
AST AST covers the key elements of a livelihood. Productive assets (mainly land and livestock) enable households to produce consumable or tradable goods. Non-productive assets (e.g. house, appliances) are an important determinant of household well-being.
Wealth index; land; tropical livestock units (TLU); house condition index.
S S measures the degree to which a household has been affected by a shock in the recent past.
Number of children with malaria; number of children with diarrhea; number of infibulated women; number of long-lasting shocks.
19 The RMTWG has been established under the Food Security Information Network (FSIN). 20 RIMA is adapted in each case study, provided that resilience being a context-specific concept. 21 The number of pillars employed in an analysis depends on data availability and context analysis. Further details can be found in d’Errico and Pietrelli (2017).
17
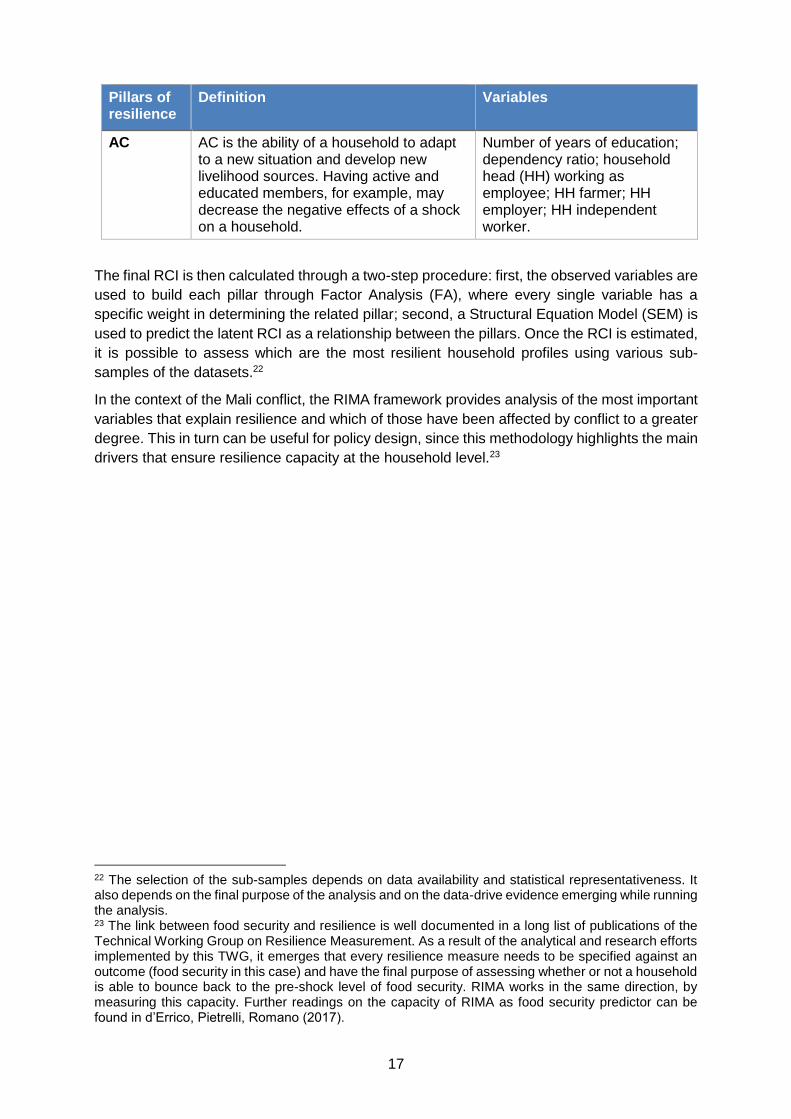
Pillars of resilience
Definition Variables
AC AC is the ability of a household to adapt to a new situation and develop new livelihood sources. Having active and educated members, for example, may decrease the negative effects of a shock on a household.
Number of years of education; dependency ratio; household head (HH) working as employee; HH farmer; HH employer; HH independent worker.
The final RCI is then calculated through a two-step procedure: first, the observed variables are
used to build each pillar through Factor Analysis (FA), where every single variable has a
specific weight in determining the related pillar; second, a Structural Equation Model (SEM) is
used to predict the latent RCI as a relationship between the pillars. Once the RCI is estimated,
it is possible to assess which are the most resilient household profiles using various sub-
samples of the datasets.22
In the context of the Mali conflict, the RIMA framework provides analysis of the most important
variables that explain resilience and which of those have been affected by conflict to a greater
degree. This in turn can be useful for policy design, since this methodology highlights the main
drivers that ensure resilience capacity at the household level.23
22 The selection of the sub-samples depends on data availability and statistical representativeness. It also depends on the final purpose of the analysis and on the data-drive evidence emerging while running the analysis. 23 The link between food security and resilience is well documented in a long list of publications of the Technical Working Group on Resilience Measurement. As a result of the analytical and research efforts implemented by this TWG, it emerges that every resilience measure needs to be specified against an outcome (food security in this case) and have the final purpose of assessing whether or not a household is able to bounce back to the pre-shock level of food security. RIMA works in the same direction, by measuring this capacity. Further readings on the capacity of RIMA as food security predictor can be found in d’Errico, Pietrelli, Romano (2017).

18
5 Estimation strategy
5.1 Pseudo-panel approach
Ideally, panel data would have been available for this analysis, but unfortunately this does not
exist for the regions and period studied. In order to address this shortcoming, given the
availability of repeated cross-sectional data and following the approach found in Deaton
(1985), it is possible to conduct a pseudo-panel multivariate regression analysis. There has
been a number of studies that develop pseudo-panels (or synthetic panels) out of multiple
rounds of cross-sectional data based on age cohorts to investigate income and consumption
over time (Deaton and Paxson, 1994) (Banks, Blundell and Brugiavini, 2001; Pencavel, 2006)
and poverty over time (Bourguignon, Goh and Kim, 2004; Güell and Hu, 2006). Since cross-
section samples are typically refreshed each time surveys (like MICS, ELIM and EAC-I 2014)
are carried out, synthetic panels are possibly also less exposed to attrition and measurement
error than real panel data (Lanjouw and Dang, 2013). A related yet different approach was
recently proposed by Dang et al. (2011), featuring both parametric and non-parametric
approaches to construct synthetic panels at the household level from two rounds of cross-
sections, using conservative assumptions.
As noted by Deaton (1985) and Moffitt (1993), cohorts should be defined based on time-
invariant characteristics to prevent (artificial) temporal inter-cohort variation. As such, cohorts
have been defined using two dimensions: the age of the HH, and the region where the
household is located. Given the trade-off24 between the number of cohorts and the number of
observations per cohort, Moffitt (1993) notes that cohort averages should be calculated based
on a reasonably “large" number of observations, while Verbeek and Nijman (1992) consider
100 to 200 observations per cohort to be sufficiently large. The final choice of resilience pillars
used in a given analysis will therefore be guided by the relevant literature reviews and the
amount of relevant data available. In this paper, it was possible to group together 44 unique
cohorts (see TableA1 in the Annex).
5.2 Impact evaluation strategy
In this chapter the econometric strategy for identifying those who have suffered the negative
effect of conflict on resilience capacity is presented. A general discussion on how to approach
impact assessment is presented; it is then followed from the specific estimator adopted for this
case study with its relative set of equations.
In a typical randomized control trial, the Average Treatment Effect (ATE) can be identified
simply by the mean difference in outcomes between the treatment and the control group, where
the treatment group is that which has received government interventions or some form of aid:
𝐸𝜏 = 𝐴𝑇𝐸 = 𝐸[𝑌1] − 𝐸[𝑌0] (1)
where Y1 is the treatment group and Y0 the control.
24 The higher the number of cohorts created within the same sample, the smaller the number of observations in each cohort, and thus their statistical relevance is lowered.
19
While (1) estimates the average effect on the entire population, it is also possible to estimate
the average effect of treatment (ATT), i.e. the (negative) effect of shock on those subjects who
ultimately where reached by the conflict.
𝐸𝜏|𝐷=1 = 𝐴𝑇𝑇 = 𝐸[𝑌1|𝐷 = 1] − 𝐸[𝑌0|𝐷 = 1] (2)
For this analysis, the Difference in Difference (DID) estimator was employed for pillars and
observed variables:
𝑅𝐶𝐼𝑡,𝑖 = 𝛽0 + 𝛽1𝐶𝑡,𝑗 + 𝛽2𝑇𝑡,𝑖 + 𝛽3 𝐶𝑡,𝑖 ∗ 𝑇𝑡,𝑖 + 𝛽4 𝑋𝑡,𝑖 + 𝜀𝑖 (3)
where the RCI of a single household i is given by being or not being in one of the regions
affected by the conflict (C) as a dummy equal to one if the household is located in Gao or
Timbuktu. T represents the structural break, the time before and after the conflict, C*T the
interaction between these two variables and a set of socio-economic characteristics (X), an
intercept term (𝛽0) and the error term (ε). The same DID estimator was applied to each pillar
and each variable within the pillars.
The DID approach allows for the mitigation of the effects of unobserved factors that could place
downward bias on the accuracy of the results. This is done by looking at the differential effect
on resilience capacity in the regions involved in the conflict (i.e. with the highest number of
fatalities) before and after the conflicts’ occurrence.
In non-experimental analysis, other identification assumptions must be taken into
consideration to control for other factors that may determine if a household has participated in
an aid programme. In this case, assignment to the treatment group is frequently non-random;
therefore, households assigned to the treatment group may differ not only in their treatment
status but also in other characteristics that affect both participation in aid programmes and the
outcome of interest (Winters, Salazar and Maffioli, 2010)(Caliendo and Kopeinig, 2008). The
use of a propensity score allows for solving the counterfactual problem by estimating the
conditional probability of receiving the project (Pi=1) given a vector of observed characteristics
(X) (dimensionality problem).
Another limitation of the DID estimator is that it relies on the fact that both the treatment and
control groups’ composition has not drastically changed over time. The crucial aspect here is
if the groups differ with respect to the variables’ (of the resilience pillars) trends over time
(Abadie, 2005; Imbens and Wooldridge, 2009). Changes in group composition are common
when data come from repeated cross-section or pseudo-panels, rather than pure panel data
(Smith et al 2014). Out of the long list of methods adopted in order to control the selection bias,
the propensity score matching seems to have a prominent role in the current literature (Smith
et al., 2014).
The propensity score (in this case, the probability of participating in a programme, given
observed characteristics 𝑋𝑖 (Caliendo and Kopeinig, 2008) will be adopted for the RCI only.
The RCI is a multidimensional index which, therefore, can be influenced by selection biases
present in the different variables that the pillars are comprised of. In fact, each variable can be
affected by selection bias and this would ultimately distort the RCI; it is not possible to
20
completely disaggregate the combined effect of biases caused by the simultaneous action of
all the variables employed in the estimation. As a consequence, a more comprehensive
approach is to control this bias, albeit with the disadvantage of reduced precision in the
estimation.
In terms of the functional form to use, for a binary case like this (i.e. either being or not being
involved in conflicts), logit and probit models usually yield similar results (Caliendo and
Kopeinig, 2008).
In terms of the variables to be included as covariates in the propensity score model, the
matching strategy requires that the outcome variable should be independent of treatment,
conditional on the propensity score. Therefore, variable(s) should be chosen that satisfy this
condition; that is, including only variables that are unaffected by participation in government
aid programmes, or in this case, by conflict. A recommendation is to use variables that are
fixed over time, or were measured before the conflict took place (Caliendo and Kopeinig, 2008).
Finally, while there is a number of possible matching algorithms that could be adopted, in this
case the nearest neighbour (NN) has been chosen.
The econometric analysis of the impact of conflict on resilience can start with a reduced form
equation estimated at the baseline and the follow-up (i.e. for 2009 and 2014).
𝑅𝐶𝐼𝑖 = 𝑓(𝑏0 + 𝑏1𝐶𝑖 + 𝑏3𝑋𝑖 + 𝑢𝑖) (4)
where household resilience (the RCI) is a function of: an intercept term; the conflicts (C); a
vector of control variables and a normally distributed random error term. The RCI is estimated
through the RIMA methodology.
Formally, in time 0 (or, the baseline), the causal effect of the treatment is estimated through a
model:
Yi0 = β0 + β1Di + β2T0 + β3(T0Di) + β4Xi + εi0 (5)
where Yitis the outcome variable; Dit is a treatment indicator taking the value of 1 if a household
has received the treatment, or 0 if otherwise; and Tt is a time indicator, equal to 0 for the
baseline and 1 for the follow-up round. TtDi is an interaction between time and treatment
variables. εit denotes an error term and X is the vector of socio-economic characteristic control
variables. The mean outcome for the treatment group in the follow-up round is captured by
β0 ̂ + β1̂ + β2̂ + β3̂.+ β4̂.
In this specific case, the outcome of interest, Y, can be considered the change in RCI. This
specification indicates the marginal effect of voluntary or involuntary participation in conflict on
household resilience. β2 estimates the impact of the conflict on resilience capacity.

21
6 Findings
Balance tests were implemented to check the validity of the pseudo-panel approach; the
differences between the different cohorts were tested at the baseline. The rationale for
employing hypothesis testing is to assess whether there are pre-existing differences between
the treatment and control groups. However, as balance in the baseline is a characteristic of
observed variables, there is no level below which a hypothetical imbalance can be ignored (Ho
et al., 2007).
In this case, the balance tests were applied to the typology of cohorts that were created, which
consider the age of the HH and the region in which the household is located.
Table 2 T-test for baseline
Pillars and variables T-test with cohort
ABS
Access to electricity 0.0943***
(0.00370)
Distance to water in minutes 0.364***
(0.00347)
Access to toilet 0.453***
(0.00677)
Access to water -0.0451***
(0.00467)
AST
Cultivated land per capita 0.142***
(0.00309)
House value 1.785***
(0.0514)
Wealth Index 0.0319***
(0.00121)
TLU per capita 0.0473***
(0.00196)
AC
Education in years 0.941***
(0.0289)
Dependency ratio 0.0471***
(0.00687)
Wage income 0.0533***
(0.00233)
Farmer income -0.0918***
(0.00388)
Employer income 0.0119***
(0.000236)
22
Pillars and variables T-test with cohort
Other income 0.0219***
(0.00253)
SSN
Number of children with Malaria 0.176***
(0.00285)
Number of children with diarrhoea 0.134***
(0.00254)
Number of observations 8061
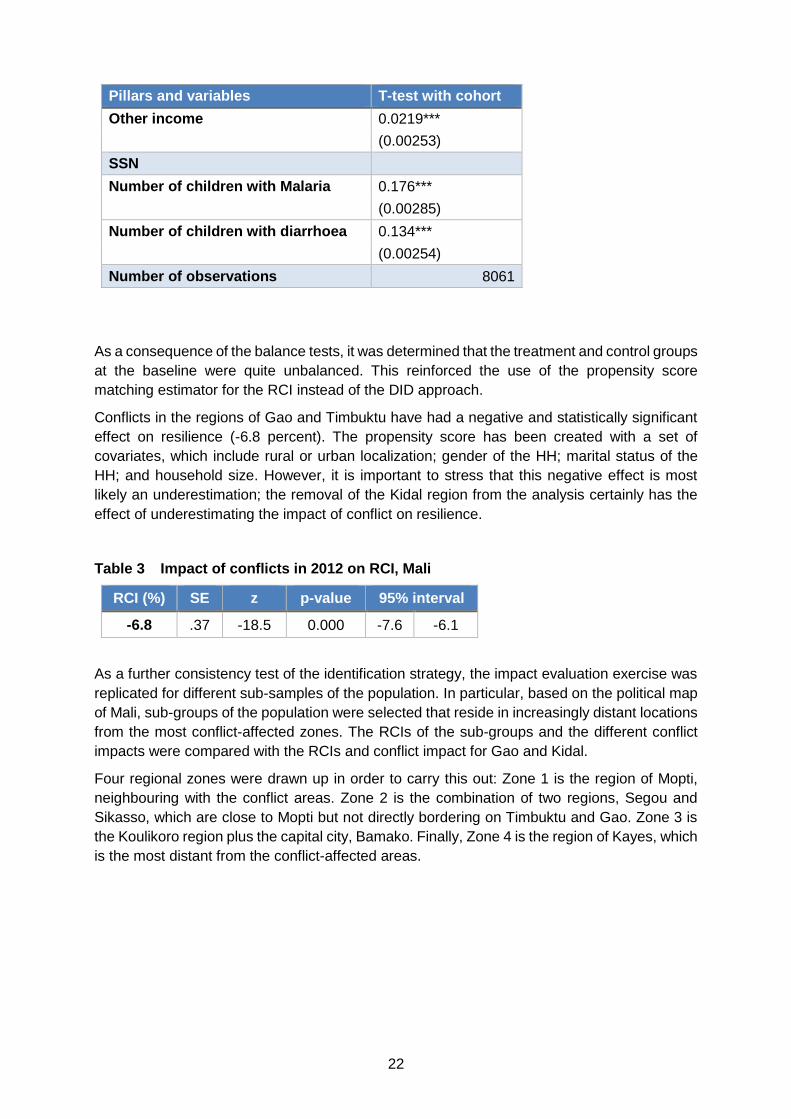
As a consequence of the balance tests, it was determined that the treatment and control groups
at the baseline were quite unbalanced. This reinforced the use of the propensity score
matching estimator for the RCI instead of the DID approach.
Conflicts in the regions of Gao and Timbuktu have had a negative and statistically significant
effect on resilience (-6.8 percent). The propensity score has been created with a set of
covariates, which include rural or urban localization; gender of the HH; marital status of the
HH; and household size. However, it is important to stress that this negative effect is most
likely an underestimation; the removal of the Kidal region from the analysis certainly has the
effect of underestimating the impact of conflict on resilience.
Table 3 Impact of conflicts in 2012 on RCI, Mali
RCI (%) SE z p-value 95% interval
-6.8 .37 -18.5 0.000 -7.6 -6.1
As a further consistency test of the identification strategy, the impact evaluation exercise was
replicated for different sub-samples of the population. In particular, based on the political map
of Mali, sub-groups of the population were selected that reside in increasingly distant locations
from the most conflict-affected zones. The RCIs of the sub-groups and the different conflict
impacts were compared with the RCIs and conflict impact for Gao and Kidal.
Four regional zones were drawn up in order to carry this out: Zone 1 is the region of Mopti,
neighbouring with the conflict areas. Zone 2 is the combination of two regions, Segou and
Sikasso, which are close to Mopti but not directly bordering on Timbuktu and Gao. Zone 3 is
the Koulikoro region plus the capital city, Bamako. Finally, Zone 4 is the region of Kayes, which
is the most distant from the conflict-affected areas.
23
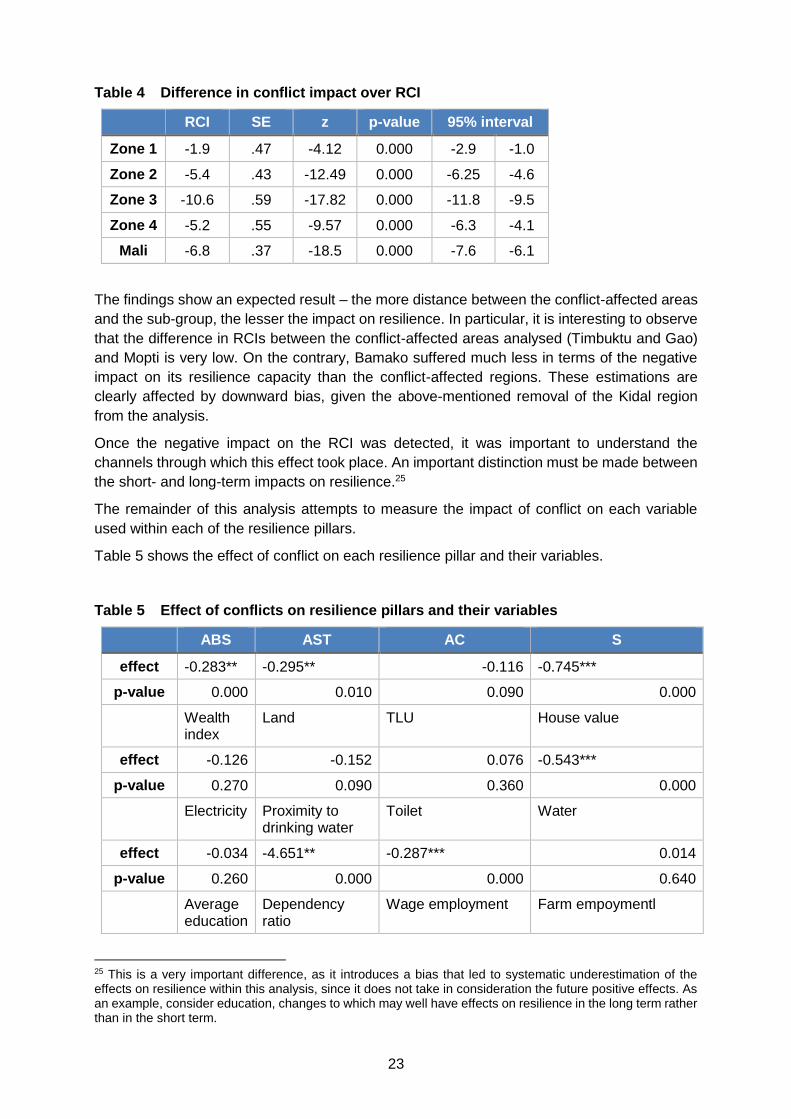
Table 4 Difference in conflict impact over RCI
RCI SE z p-value 95% interval
Zone 1 -1.9 .47 -4.12 0.000 -2.9 -1.0
Zone 2 -5.4 .43 -12.49 0.000 -6.25 -4.6
Zone 3 -10.6 .59 -17.82 0.000 -11.8 -9.5
Zone 4 -5.2 .55 -9.57 0.000 -6.3 -4.1
Mali -6.8 .37 -18.5 0.000 -7.6 -6.1
The findings show an expected result – the more distance between the conflict-affected areas
and the sub-group, the lesser the impact on resilience. In particular, it is interesting to observe
that the difference in RCIs between the conflict-affected areas analysed (Timbuktu and Gao)
and Mopti is very low. On the contrary, Bamako suffered much less in terms of the negative
impact on its resilience capacity than the conflict-affected regions. These estimations are
clearly affected by downward bias, given the above-mentioned removal of the Kidal region
from the analysis.
Once the negative impact on the RCI was detected, it was important to understand the
channels through which this effect took place. An important distinction must be made between
the short- and long-term impacts on resilience.25
The remainder of this analysis attempts to measure the impact of conflict on each variable
used within each of the resilience pillars.
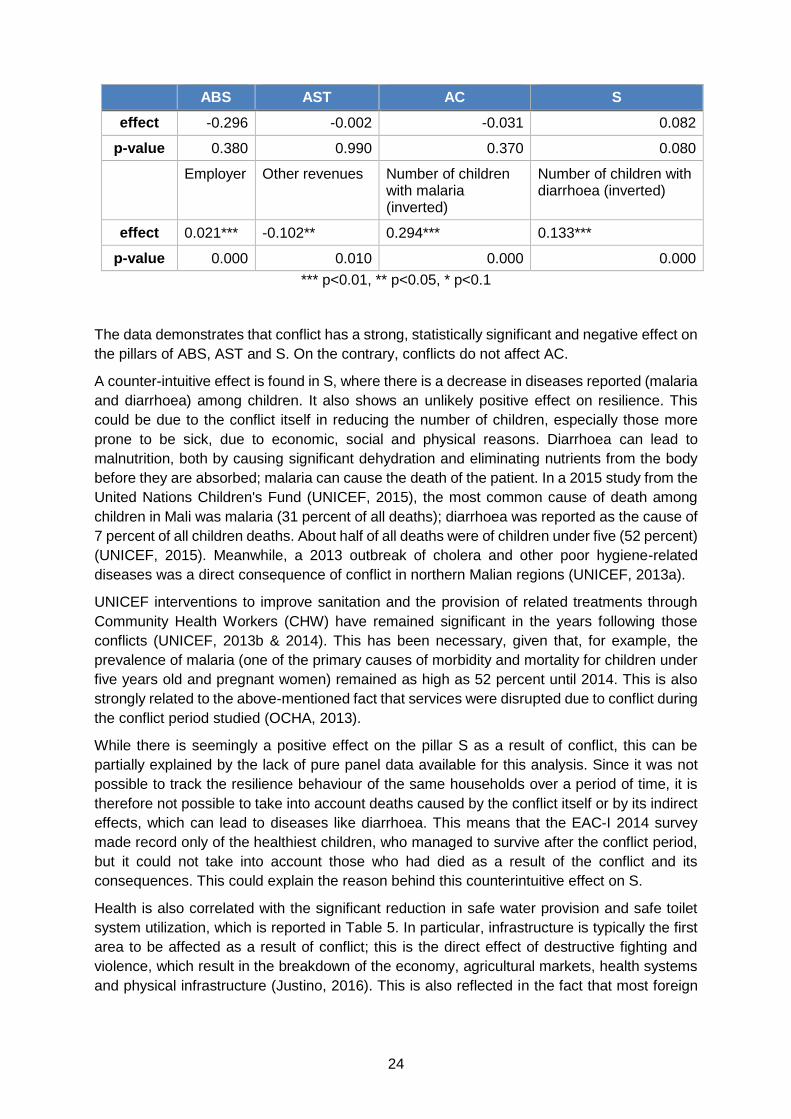
Table 5 shows the effect of conflict on each resilience pillar and their variables.
Table 5 Effect of conflicts on resilience pillars and their variables
ABS AST AC S
effect -0.283** -0.295** -0.116 -0.745***
p-value 0.000 0.010 0.090 0.000
Wealth index
Land TLU House value
effect -0.126 -0.152 0.076 -0.543***
p-value 0.270 0.090 0.360 0.000
Electricity Proximity to drinking water
Toilet Water
effect -0.034 -4.651** -0.287*** 0.014
p-value 0.260 0.000 0.000 0.640
Average education
Dependency ratio
Wage employment Farm empoymentl
25 This is a very important difference, as it introduces a bias that led to systematic underestimation of the effects on resilience within this analysis, since it does not take in consideration the future positive effects. As an example, consider education, changes to which may well have effects on resilience in the long term rather than in the short term.
24
ABS AST AC S
effect -0.296 -0.002 -0.031 0.082
p-value 0.380 0.990 0.370 0.080
Employer Other revenues Number of children with malaria (inverted)
Number of children with diarrhoea (inverted)
effect 0.021*** -0.102** 0.294*** 0.133***
p-value 0.000 0.010 0.000 0.000
*** p<0.01, ** p<0.05, * p<0.1
The data demonstrates that conflict has a strong, statistically significant and negative effect on
the pillars of ABS, AST and S. On the contrary, conflicts do not affect AC.
A counter-intuitive effect is found in S, where there is a decrease in diseases reported (malaria
and diarrhoea) among children. It also shows an unlikely positive effect on resilience. This
could be due to the conflict itself in reducing the number of children, especially those more
prone to be sick, due to economic, social and physical reasons. Diarrhoea can lead to
malnutrition, both by causing significant dehydration and eliminating nutrients from the body
before they are absorbed; malaria can cause the death of the patient. In a 2015 study from the
United Nations Children's Fund (UNICEF, 2015), the most common cause of death among
children in Mali was malaria (31 percent of all deaths); diarrhoea was reported as the cause of
7 percent of all children deaths. About half of all deaths were of children under five (52 percent)
(UNICEF, 2015). Meanwhile, a 2013 outbreak of cholera and other poor hygiene-related
diseases was a direct consequence of conflict in northern Malian regions (UNICEF, 2013a).
UNICEF interventions to improve sanitation and the provision of related treatments through
Community Health Workers (CHW) have remained significant in the years following those
conflicts (UNICEF, 2013b & 2014). This has been necessary, given that, for example, the
prevalence of malaria (one of the primary causes of morbidity and mortality for children under
five years old and pregnant women) remained as high as 52 percent until 2014. This is also
strongly related to the above-mentioned fact that services were disrupted due to conflict during
the conflict period studied (OCHA, 2013).
While there is seemingly a positive effect on the pillar S as a result of conflict, this can be
partially explained by the lack of pure panel data available for this analysis. Since it was not
possible to track the resilience behaviour of the same households over a period of time, it is
therefore not possible to take into account deaths caused by the conflict itself or by its indirect
effects, which can lead to diseases like diarrhoea. This means that the EAC-I 2014 survey
made record only of the healthiest children, who managed to survive after the conflict period,
but it could not take into account those who had died as a result of the conflict and its
consequences. This could explain the reason behind this counterintuitive effect on S.
Health is also correlated with the significant reduction in safe water provision and safe toilet
system utilization, which is reported in Table 5. In particular, infrastructure is typically the first
area to be affected as a result of conflict; this is the direct effect of destructive fighting and
violence, which result in the breakdown of the economy, agricultural markets, health systems
and physical infrastructure (Justino, 2016). This is also reflected in the fact that most foreign

25
aid arriving to Mali currently focuses on long-term investments in education, health and
infrastructure (Miguel, 2007).
There is a negative and significant effect on asset; in particular there is a strong reduction of
house value.
There is a negative impact (although not significant) on the AC pillar, which is in line with other
findings such as D’Souza and Jolliffe (2013) on the effect of conflict on households’ adaptive
capacity. However, the effect is negative and significant on revenues coming from other
sources and an increase of self-enterprises. This may be interpreted as the result of a
reduction/interruption of more traditional income generating activities and the consequent
startup of micro enterprises self-managed.
Finally, a negative and statistically significant effect on the value of houses was detected. This
variable, which has a limited value per se, can still be important if the house is considered as
a proxy for durable assets. Significant migration and displacement took place in Mali between
2012 and 2013 (UNICEF, 2013b); nearly 450 000 Malians left their homes because of conflicts
(OCHA, 2013). This may be connected with the lowered house value observed. In fact, people
may be moving because of destruction of their property, taking place due to conflict. Otherwise,
people may be just moving away from dangerous areas; this implies that these people remain
without a dwelling, which ultimately translates to a reduction in the average house value
reported.
There are of course other side effects of conflicts that have not been captured by this impact
evaluation analysis. For instance, a disruption of schooling for thousands of children was
reported by UNICEF (2013a), which has not been explored here. In this analysis, the sole
indicator for education included in the estimation was the average number of years of
education for the HH; this limits the scope of the analysis and strengthens the need for cross-
tabulation and validation with secondary data sources.
26
7 Conclusions
This paper looked at the effects of conflict on resilience and, as a consequence, on food
security in Mali. The empirical analysis adopted a pseudo-panel approach with two sets of
cross-sectional data from UNICEF (MICS, conducted from 2009 to 2010) and ELIM,
implemented by the National Institute for Statistics and the Ministry for Health, Social
Development and Promotion of Family, and from the EAC-I 2014, supported by the LSMS-ISA.
The pseudo-panel approach was achieved through the creation of 44 cohorts populated with
at least 50 observations each.
The identification strategy selected three regions for the purpose of this analysis: Gao, Timbuktu,
and Kidal. However, unfortunately there was no data available for Kidal for the period studied due
to security concerns, therefore this analysis covered only Gao and Timbuktu.
The econometric analysis employed DID and propensity score matching estimators to assess
the impact of the Tuareg rebellion and the Islamist insurgency in northern Mali.
The findings demonstrate a negative impact on overall resilience, which ultimately translates
to a possible threat for food security.
In this case, conflict affected household resilience capacity by reducing access to basic services
(in particular, reducing access to safe water and toilets); reducing their assets (durable assets).
This poses serious threats to people’s capacity to handle subsequent shocks.
The analysis also shows a seemingly counterintuitive reduction of exposure to malaria and
diarrhea; this can be however due to the limitation of the pseudo panel approach.
As a general conclusion, the first areas in Mali to be affected by conflict were sanitation and
public health. This is strongly linked to the interruption of service provision and destruction of
durable assets. Consequently, short-term and immediate responses should aim to restore
these systems. People’s resilience may be significantly deteriorated by the prolonged nature
of conflict in Mali.
Two major interventions have already been put in place to address issues of security and
development in the Sahel, with a special emphasis on targeting pastoralists.26 Adopted in May
2013 by a number of central African countries – including Mali – the Ndajamena Declaration
took clear actions to support four main objectives in order to “put the pastoral livestock sector
at the heart of stabilization and development strategies for the Saharo-Sahelian areas in the
short-, medium- and long-term”.27
26 Pastoralist and agropastoralist communities have been increasingly under pressure as a result of dynamic population growth and more frequent and intense droughts (Breisinger et al., 2014) 27 Specifically, the declaration has established the following goals: 1) Improving governance, by advocating
the inclusion of pastoralist communities in the governance of land and public life, as well as facilitating access
to education and healthcare services; 2) Strengthening the resilience of pastoral communities, envisaging
high-level discussion on the financing and management of pastoral water infrastructures. Most importantly,
the declaration proposes the negotiation of legally binding social agreements to secure mobility and pastoral
areas, and to improve access to natural resources (e.g. water and pastures); 3) Enhancing the economic
sustainability of the pastoral livestock sector, developing the pastoral economic activities, for example, by
improving market infrastructures and establishing transhumance and cattle trading routes, by strengthening
the skills of professional livestock bodies, and by improving access to banking services; 4) Enhancing the
social sustainability of communities in the Sahelo-Saharan areas, praising the integration of human and
animal public health services through innovative policies. They also vow to improve the access of local
populations to basic education and vocational training, among other recommendations.
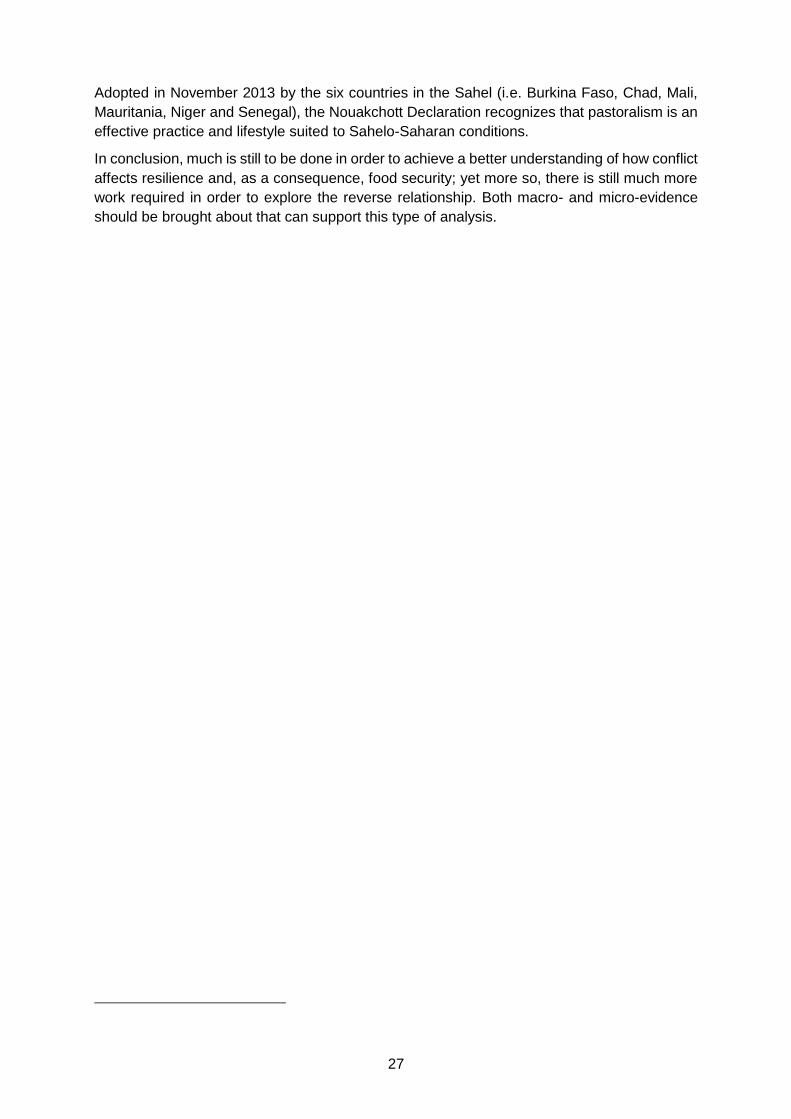
27
Adopted in November 2013 by the six countries in the Sahel (i.e. Burkina Faso, Chad, Mali,
Mauritania, Niger and Senegal), the Nouakchott Declaration recognizes that pastoralism is an
effective practice and lifestyle suited to Sahelo-Saharan conditions.
In conclusion, much is still to be done in order to achieve a better understanding of how conflict
affects resilience and, as a consequence, food security; yet more so, there is still much more
work required in order to explore the reverse relationship. Both macro- and micro-evidence
should be brought about that can support this type of analysis.

28
References
Abadie, A. 2005. Semiparametric difference-in-differences estimators. Review of Economic
Studies. 72, 1-19.
Abdalla, M. 2009. Understanding of the natural resource conflict dynamics: The case of Tuareg
in North Africa and the Sahel. ISS Paper 194. Institute for Security Studies (available at
https://issafrica.s3.amazonaws.com/site/uploads/Paper194.pdf).
Armed Conflict Location and Event Data Project (ACLED). 2015. Armed Conflict Location and
Event Data Project Country Report: Mali (available at http://www.acleddata.com/wp-
content/uploads/2015/01/ACLED-Country-Report_Mali.pdf).
Aker, J. 2013. Cash or Coupons? Testing the Impacts of Cash versus Vouchers in the
Democratic Republic of Congo. Center for Global Development Working Paper No. 320
(available at https://www.cgdev.org/publication/cash-or-coupons-testing-impacts-cash-
versus-vouchers-democratic-republic-congo-working).
Akresh, R., De Walque, D. & Kazianga, H. 2013. Cash Transfers and Child Schooling:
Evidence from a Randomized Evaluation of the Role of Conditionality. World Bank Policy
Research Working Paper No. 6340. Impact Evaluation Series No. 82. World Bank (available
at http://documents.worldbank.org/curated/en/587731468005971189/pdf/wps6340.pdf).
Asfaw, S., Pickmans, R., Alfani, F. & Davis, B. 2016a. Productive Impact of Ethiopia’s Social
Cash Transfer Pilot Programme: A From Protection to Production (PtoP) report. Rome, FAO
(available at fao.org/3/a-i5166e.pdf).
Baird, S., Ferreira, F. & Woolcock, M. 2013. Relative Effectiveness of Conditional and
Unconditional Cash Transfers for Schooling Outcomes in Developing Countries: A Systematic
Review. Campbell Systematic Reviews.
Baird, S. 2011. Cash or Condition? Evidence from a Cash Transfer Experiment. The Quarterly
Journal of Economics. 126(4): 1709–1753.
Baird, S. 2014. Conditional, unconditional and everything in between: a systematic review of
the effects of cash transfer programmes on schooling outcomes. Journal of Development
Effectiveness. 6(1):1-43.
Banks, J., Blundell, R. & Brugiavini, A. 2001. Risk pooling, precautionary saving and
consumption growth. Review of Economic Studies. 68(4): 757–779.
Bellemare, M. F. 2015. Rising Food Prices, Food Price Volatility, and Social Unrest. American
Journal of Agricultural Economics. 97(1): 1–21.
Benjaminsen, T. A. 2008. Does Supply-Induced Scarcity Drive Violent Conflicts in the African
Sahel? The Case of the Tuareg Rebellion in Northern Mali. Journal of Peace Research. 45(6):
819–836.
Benjaminsen, T. A., Alinon, K., Buhaug, H. & Buseth, J. T. 2012. Does climate change drive
land-use conflicts in the Sahel? Journal of Peace Research. 49 (1), 97-111.
Bora, S., Ceccacci, I., Delgado, C. & Townsend, R. 2010. Food Security and Conflict. World
Development Report 2011 Background Paper. Washington, D.C., World Bank (available at
http://documents.worldbank.org/curated/en/622491468331234468/pdf/620340WP0Food00B
OX0361475B00PUBLIC0.pdf).
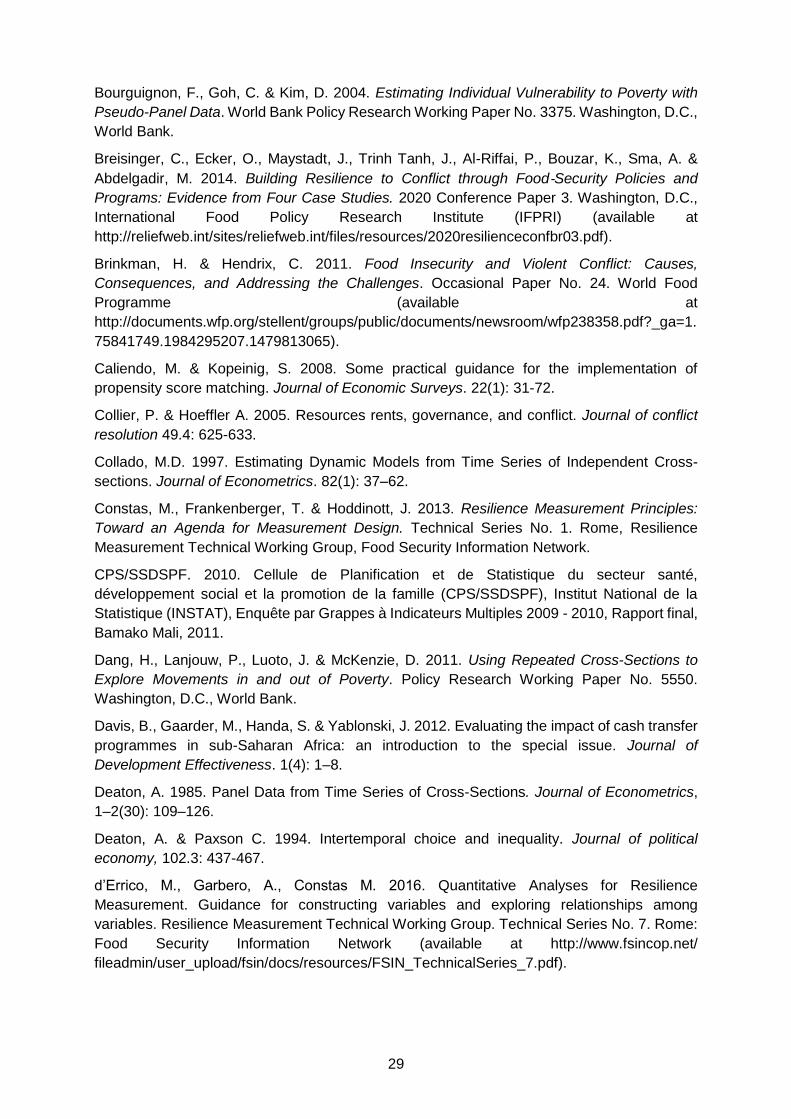
29
Bourguignon, F., Goh, C. & Kim, D. 2004. Estimating Individual Vulnerability to Poverty with
Pseudo-Panel Data. World Bank Policy Research Working Paper No. 3375. Washington, D.C.,
World Bank.
Breisinger, C., Ecker, O., Maystadt, J., Trinh Tanh, J., Al-Riffai, P., Bouzar, K., Sma, A. &
Abdelgadir, M. 2014. Building Resilience to Conflict through Food‐Security Policies and
Programs: Evidence from Four Case Studies. 2020 Conference Paper 3. Washington, D.C.,
International Food Policy Research Institute (IFPRI) (available at
http://reliefweb.int/sites/reliefweb.int/files/resources/2020resilienceconfbr03.pdf).
Brinkman, H. & Hendrix, C. 2011. Food Insecurity and Violent Conflict: Causes,
Consequences, and Addressing the Challenges. Occasional Paper No. 24. World Food
Programme (available at
http://documents.wfp.org/stellent/groups/public/documents/newsroom/wfp238358.pdf?_ga=1.
75841749.1984295207.1479813065).
Caliendo, M. & Kopeinig, S. 2008. Some practical guidance for the implementation of
propensity score matching. Journal of Economic Surveys. 22(1): 31-72.
Collier, P. & Hoeffler A. 2005. Resources rents, governance, and conflict. Journal of conflict
resolution 49.4: 625-633.
Collado, M.D. 1997. Estimating Dynamic Models from Time Series of Independent Cross-
sections. Journal of Econometrics. 82(1): 37–62.
Constas, M., Frankenberger, T. & Hoddinott, J. 2013. Resilience Measurement Principles:
Toward an Agenda for Measurement Design. Technical Series No. 1. Rome, Resilience
Measurement Technical Working Group, Food Security Information Network.
CPS/SSDSPF. 2010. Cellule de Planification et de Statistique du secteur santé,
développement social et la promotion de la famille (CPS/SSDSPF), Institut National de la
Statistique (INSTAT), Enquête par Grappes à Indicateurs Multiples 2009 - 2010, Rapport final,
Bamako Mali, 2011.
Dang, H., Lanjouw, P., Luoto, J. & McKenzie, D. 2011. Using Repeated Cross-Sections to
Explore Movements in and out of Poverty. Policy Research Working Paper No. 5550.
Washington, D.C., World Bank.
Davis, B., Gaarder, M., Handa, S. & Yablonski, J. 2012. Evaluating the impact of cash transfer
programmes in sub-Saharan Africa: an introduction to the special issue. Journal of
Development Effectiveness. 1(4): 1–8.
Deaton, A. 1985. Panel Data from Time Series of Cross-Sections. Journal of Econometrics,
1–2(30): 109–126.
Deaton, A. & Paxson C. 1994. Intertemporal choice and inequality. Journal of political
economy, 102.3: 437-467.
d’Errico, M., Garbero, A., Constas M. 2016. Quantitative Analyses for Resilience
Measurement. Guidance for constructing variables and exploring relationships among
variables. Resilience Measurement Technical Working Group. Technical Series No. 7. Rome:
Food Security Information Network (available at http://www.fsincop.net/
fileadmin/user_upload/fsin/docs/resources/FSIN_TechnicalSeries_7.pdf).
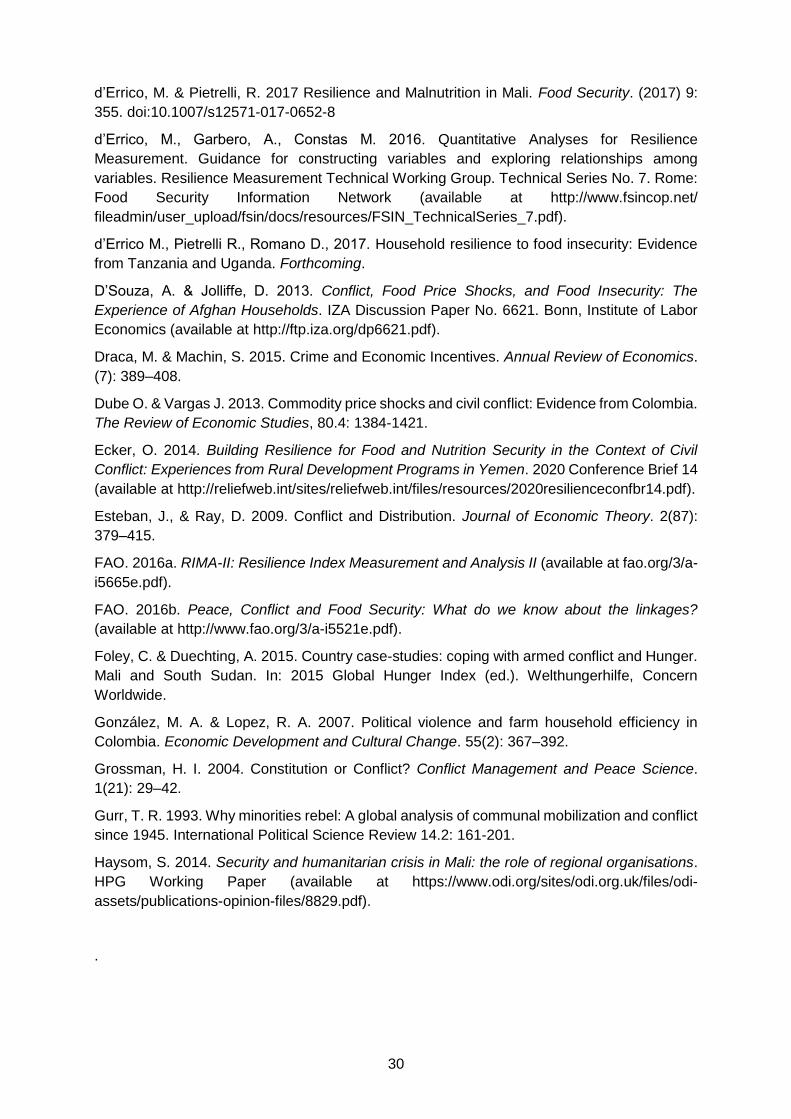
30
d’Errico, M. & Pietrelli, R. 2017 Resilience and Malnutrition in Mali. Food Security. (2017) 9:
355. doi:10.1007/s12571-017-0652-8
d’Errico, M., Garbero, A., Constas M. 2016. Quantitative Analyses for Resilience
Measurement. Guidance for constructing variables and exploring relationships among
variables. Resilience Measurement Technical Working Group. Technical Series No. 7. Rome:
Food Security Information Network (available at http://www.fsincop.net/
fileadmin/user_upload/fsin/docs/resources/FSIN_TechnicalSeries_7.pdf).
d’Errico M., Pietrelli R., Romano D., 2017. Household resilience to food insecurity: Evidence
from Tanzania and Uganda. Forthcoming.
D’Souza, A. & Jolliffe, D. 2013. Conflict, Food Price Shocks, and Food Insecurity: The
Experience of Afghan Households. IZA Discussion Paper No. 6621. Bonn, Institute of Labor
Economics (available at http://ftp.iza.org/dp6621.pdf).
Draca, M. & Machin, S. 2015. Crime and Economic Incentives. Annual Review of Economics.
(7): 389–408.
Dube O. & Vargas J. 2013. Commodity price shocks and civil conflict: Evidence from Colombia.
The Review of Economic Studies, 80.4: 1384-1421.
Ecker, O. 2014. Building Resilience for Food and Nutrition Security in the Context of Civil
Conflict: Experiences from Rural Development Programs in Yemen. 2020 Conference Brief 14
(available at http://reliefweb.int/sites/reliefweb.int/files/resources/2020resilienceconfbr14.pdf).
Esteban, J., & Ray, D. 2009. Conflict and Distribution. Journal of Economic Theory. 2(87):
379–415.
FAO. 2016a. RIMA-II: Resilience Index Measurement and Analysis II (available at fao.org/3/a-
i5665e.pdf).
FAO. 2016b. Peace, Conflict and Food Security: What do we know about the linkages?
(available at http://www.fao.org/3/a-i5521e.pdf).
Foley, C. & Duechting, A. 2015. Country case-studies: coping with armed conflict and Hunger.
Mali and South Sudan. In: 2015 Global Hunger Index (ed.). Welthungerhilfe, Concern
Worldwide.
González, M. A. & Lopez, R. A. 2007. Political violence and farm household efficiency in
Colombia. Economic Development and Cultural Change. 55(2): 367–392.
Grossman, H. I. 2004. Constitution or Conflict? Conflict Management and Peace Science.
1(21): 29–42.
Gurr, T. R. 1993. Why minorities rebel: A global analysis of communal mobilization and conflict
since 1945. International Political Science Review 14.2: 161-201.
Haysom, S. 2014. Security and humanitarian crisis in Mali: the role of regional organisations.
HPG Working Paper (available at https://www.odi.org/sites/odi.org.uk/files/odi-
assets/publications-opinion-files/8829.pdf).
.

31
Hendrix, C. & Brinkman, H. 2013. Food Insecurity and Conflict Dynamics: Causal Linkages
and Complex Feedbacks. Stability: International Journal of Security and Development. 2(2),
p.Art. 26.
Ho, D. E., Imai, K., King, G. & Stuart, E. A. 2007. Matching as nonparametric preprocessing
for reducing model dependence in parametric causal inference. Political Analysis. 15:199-236.
Holder, G. 2013. "Mon pays S.A.": un certain retour sur la démocratie exemplaire du Mali et
sa déraison islamique. SciencesPo Centre de Recherches Internationales (available at
sciencespo.fr/ceri/fr/content/dossiersduceri/mon-pays-sa-un-certain-retour-sur-la-democratie-
exemplaire-du-mali-et-sa-deraison-islamique).
Imbens, G. W. & Wooldridge, J. M. 2009. Recent Developments in the Econometrics of
Program Evaluation. Journal of Economic Literature. 47(1): 5–86.
Justino, P. 2009. Poverty and Violent Conflict: A Micro-Level Perspective on the Causes and
Duration of Warfare. Journal of Peace Research. 3(46): 315–333.
Justino, P. 2012a. War and Poverty. In Garfinkel, M. & Skaperdas, S., eds. Handbook of the
Economics of Peace and Conflict. Oxford, Oxford University Press.
Justino, P. 2012b. Resilience in protracted crises: exploring coping mechanisms and resilience
of households, communities and local institutions. Paper presented at High level expert forum
on food insecurity in protracted crises. Rome, 13-14 September, 2012.
Justino, P., Brück, T. & Verwimp, P. 2013. Micro-level dynamics of conflict, violence and
development: a new analytical framework. HiCN Working Paper 138. Households in Conflict
Network (available at http://www.ids.ac.uk/publication/micro-level-dynamics-of-conflict-
violence-and-development-a-new-analytical-framework
Kalyvas, S. N. & Kocher, M. A. 2007. How "free" is free riding in civil wars? Violence,
insurgency, and the collective action problem. World Politics. 2(59) (available at
http://stathis.research.yale.edu/documents/WP.KalyvasKocher.pdf).
Lanjouw P., Dang H.W. (2013) Measuring Poverty Dynamics with Synthetic Panels Based on
Cross-Sections, Policy Research Working Paper (6504). Washington, D.C., World Bank.
Lautze, S. 2010. Militarised livelihoods in Uganda. Degree of Doctor of Phylosophy,
Department of International Development, Hertford College, Queen Elizabeth House, Oxford
University.
Marchal, R. 2012. Intervenir au Mali? SciencesPo Centre de Recherches Internationales.
Available: http://www.sciencespo.fr/ceri/fr/monde/intervenir-au-mali).
Maystadt, M. Y. & Ecker, O. 2014. Extreme Weather and Civil War: Does Drought Fuel Conflict
in Somalia through Livestock Price Shocks? American Journal of Agricultural Economics.
Published electronically March 25. doi:10.1093/ajae/aau010 (available at
http://feb.kuleuven.be/drc/licos/publications/dp/dp326.pdf).
Messer, E., Cohen, M.J. & Marchione, T. 2002. Conflict: A Cause and Effect of Hunger. In
Environmental Change and Security Program Report 7, pp. 1–20. Washington D.C., Woodrow
Wilson Center (available at https://www.wilsoncenter.org/sites/default/files/ECSP7-
featurearticles-1.pdf).
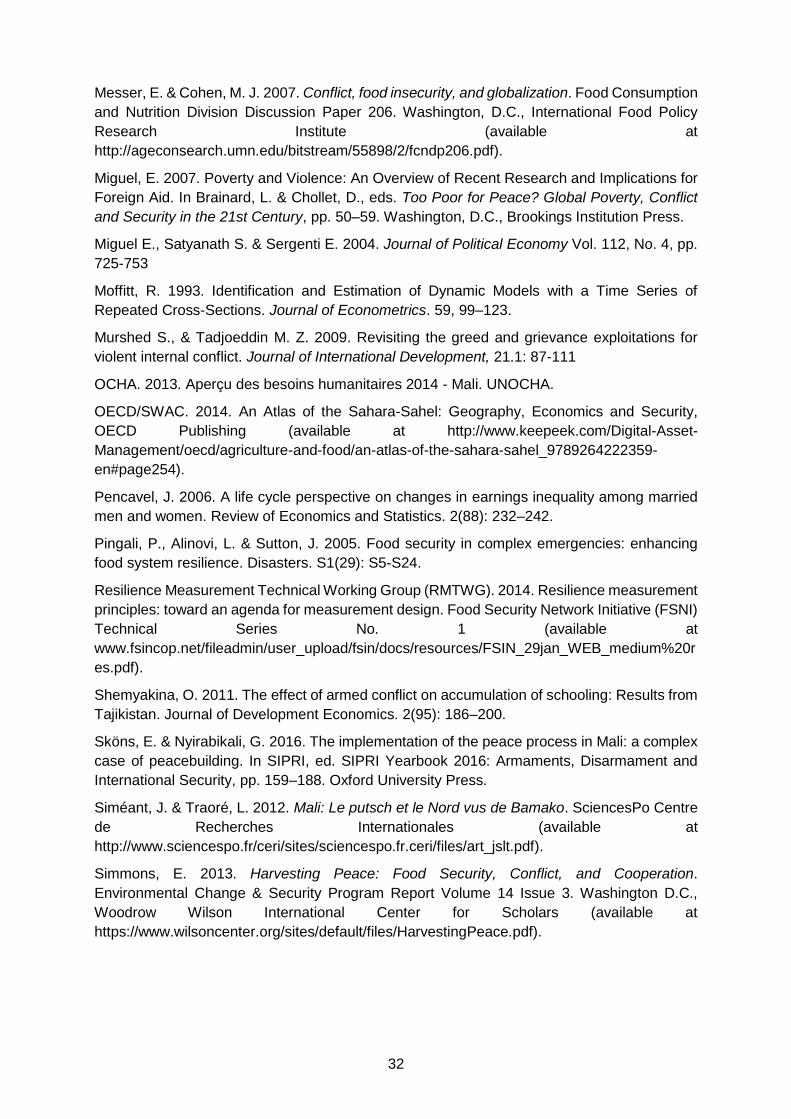
32
Messer, E. & Cohen, M. J. 2007. Conflict, food insecurity, and globalization. Food Consumption
and Nutrition Division Discussion Paper 206. Washington, D.C., International Food Policy
Research Institute (available at
http://ageconsearch.umn.edu/bitstream/55898/2/fcndp206.pdf).
Miguel, E. 2007. Poverty and Violence: An Overview of Recent Research and Implications for
Foreign Aid. In Brainard, L. & Chollet, D., eds. Too Poor for Peace? Global Poverty, Conflict
and Security in the 21st Century, pp. 50–59. Washington, D.C., Brookings Institution Press.
Miguel E., Satyanath S. & Sergenti E. 2004. Journal of Political Economy Vol. 112, No. 4, pp.
725-753
Moffitt, R. 1993. Identification and Estimation of Dynamic Models with a Time Series of
Repeated Cross-Sections. Journal of Econometrics. 59, 99–123.
Murshed S., & Tadjoeddin M. Z. 2009. Revisiting the greed and grievance exploitations for
violent internal conflict. Journal of International Development, 21.1: 87-111
OCHA. 2013. Aperçu des besoins humanitaires 2014 - Mali. UNOCHA.
OECD/SWAC. 2014. An Atlas of the Sahara-Sahel: Geography, Economics and Security,
OECD Publishing (available at http://www.keepeek.com/Digital-Asset-
Management/oecd/agriculture-and-food/an-atlas-of-the-sahara-sahel_9789264222359-
en#page254).
Pencavel, J. 2006. A life cycle perspective on changes in earnings inequality among married
men and women. Review of Economics and Statistics. 2(88): 232–242.
Pingali, P., Alinovi, L. & Sutton, J. 2005. Food security in complex emergencies: enhancing
food system resilience. Disasters. S1(29): S5-S24.
Resilience Measurement Technical Working Group (RMTWG). 2014. Resilience measurement
principles: toward an agenda for measurement design. Food Security Network Initiative (FSNI)
Technical Series No. 1 (available at
www.fsincop.net/fileadmin/user_upload/fsin/docs/resources/FSIN_29jan_WEB_medium%20r
es.pdf).
Shemyakina, O. 2011. The effect of armed conflict on accumulation of schooling: Results from
Tajikistan. Journal of Development Economics. 2(95): 186–200.
Sköns, E. & Nyirabikali, G. 2016. The implementation of the peace process in Mali: a complex
case of peacebuilding. In SIPRI, ed. SIPRI Yearbook 2016: Armaments, Disarmament and
International Security, pp. 159–188. Oxford University Press.
Siméant, J. & Traoré, L. 2012. Mali: Le putsch et le Nord vus de Bamako. SciencesPo Centre
de Recherches Internationales (available at
http://www.sciencespo.fr/ceri/sites/sciencespo.fr.ceri/files/art_jslt.pdf).
Simmons, E. 2013. Harvesting Peace: Food Security, Conflict, and Cooperation.
Environmental Change & Security Program Report Volume 14 Issue 3. Washington D.C.,
Woodrow Wilson International Center for Scholars (available at
https://www.wilsoncenter.org/sites/default/files/HarvestingPeace.pdf).

33
Smith P., Veiga A., Brown J. 2014. The use of sample weights in multivariate multilevel models
with an application to income data collected by using a rotating panel survey. Journal of the
Royal Statistical Society: Series C (Applied Statistics); 65-84.
Stewart, F. 2008. Horizontal inequalities and conflict: An introduction and some hypotheses.
Horizontal Inequalities and Conflict. Palgrave Macmillian UK. 3-24.
Stewart, D.J. 2013. What Is Next for Mali? The Roots of Conflict and Challenges to Stability
(available at http://ssi.armywarcollege.edu/pubs/display.cfm?pubID=1185).
Stuart, E.A., Huskamp, H.A., Duckworth, K., Simmons, J., Song, Z., Chernew, M., Colleen
L.B., 2014 Using propensity scores in difference-in-differences models to estimate the effects
of a policy change. Health Serv Outcomes Res Methodol. 14: 166–182. doi: 10.1007/s10742-
014-0123-z
UNICEF. 2013a. UNICEF Steps up Prevention Efforts as Cholera Outbreak in Mali Threatens
Thousands in Conflict Affected North (available at
https://www.unicef.org/media/media_69393.html).
UNICEF. 2013b. UNICEF Annual Report 2013 – Mali (available at
https://www.unicef.org/about/annualreport/files/Mali_COAR_2013.pdf).
UNICEF. 2015. Final report: Impact evaluation of community-led total sanitation (CLTS) in rural
Mali (available at
https://www.unicef.org/evaldatabase/files/CLTS_impact_eval_Mali_final_report.pdf).
Verpoorten, M. 2009. Household coping in war- and peacetime: Cattle sales in Rwanda, 1991-
2001. Journal of Development Economics. 1(88): 67–86.
von Grebmer, K, Bernstein, J., Prasai, N., Yin, S., Yohannes, Y., Towey, O., Sonntag, A.,
Neubauer, L. & de Waal, A. 2015. 2015 Global Hunger Index: Armed Conflict and the
Challenge of Hunger. Bonn/Washington, D.C./ Dublin, Welthungerhilfe, International Food
Policy Research Institute & Concern Worldwide (available at
welthungerhilfe.de/fileadmin/user_upload/Mediathek/Welthunger-Index/WHI_2015/global-
hunger-index_2015_english.pdf).
Winters, P., Salazar, L. & Maffioli A. 2010. Designing impact evaluations for agricultural
projects: Impact-Evaluation Guidelines. Technical Notes No. IDB-TN-198. Washington D.C.,
Inter-American Development Bank.
World Bank. 2011. World Development Report 2011: Conflicts, Security, and Development.
Washington, D.C., World Bank.
World Bank. 2015. Mali - Systematic country diagnostic: priorities for ending poverty and
boosting shared prosperity. Washington, D.C., World Bank Group (available at
http://documents.worldbank.org/curated/en/101991468188651405/Mali-Systematic-country-
diagnostic-priorities-for-ending-poverty-and-boosting-shared-prosperity).
Verbeek, M. & Nijman, T. 1992. Can Cohort Data Be Treated as Genuine Panel Data?
Empirical Economics. 1(17): 9–23.
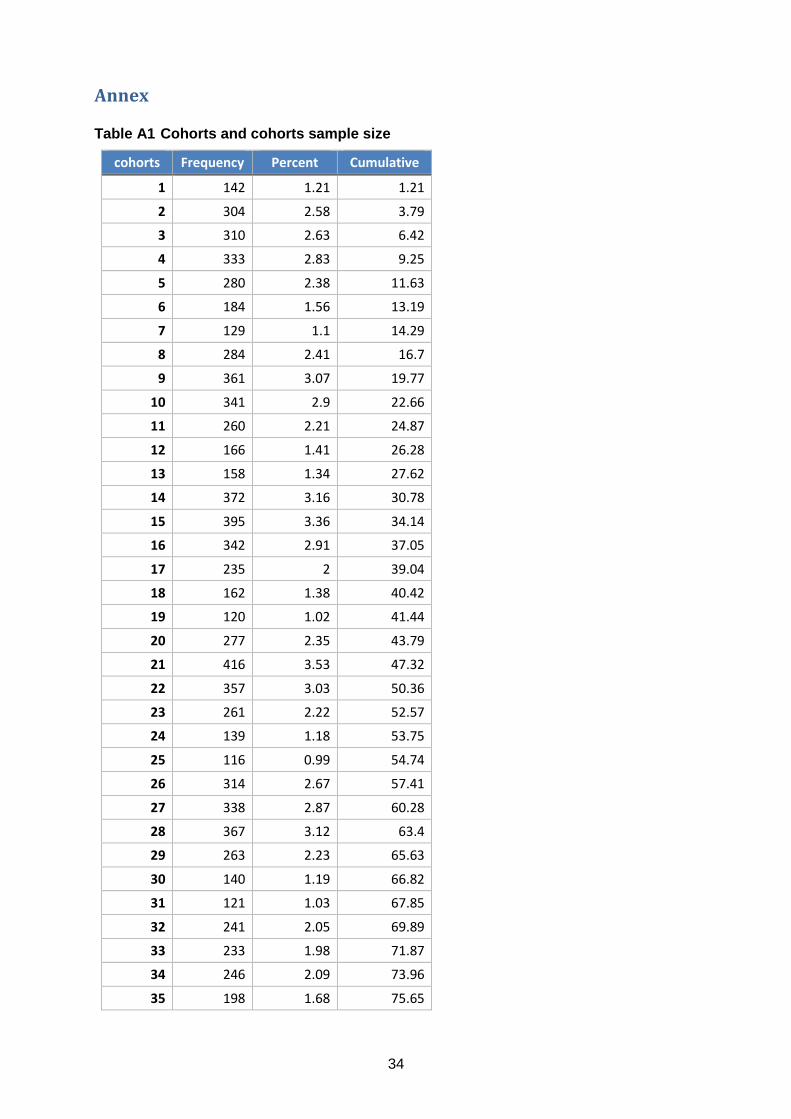
34
Annex
Table A1 Cohorts and cohorts sample size
cohorts Frequency Percent Cumulative
1 142 1.21 1.21
2 304 2.58 3.79
3 310 2.63 6.42
4 333 2.83 9.25
5 280 2.38 11.63
6 184 1.56 13.19
7 129 1.1 14.29
8 284 2.41 16.7
9 361 3.07 19.77
10 341 2.9 22.66
11 260 2.21 24.87
12 166 1.41 26.28
13 158 1.34 27.62
14 372 3.16 30.78
15 395 3.36 34.14
16 342 2.91 37.05
17 235 2 39.04
18 162 1.38 40.42
19 120 1.02 41.44
20 277 2.35 43.79
21 416 3.53 47.32
22 357 3.03 50.36
23 261 2.22 52.57
24 139 1.18 53.75
25 116 0.99 54.74
26 314 2.67 57.41
27 338 2.87 60.28
28 367 3.12 63.4
29 263 2.23 65.63
30 140 1.19 66.82
31 121 1.03 67.85
32 241 2.05 69.89
33 233 1.98 71.87
34 246 2.09 73.96
35 198 1.68 75.65

35
36 247 2.1 77.74
37 197 1.67 79.42
38 326 2.77 82.19
39 329 2.79 84.98
40 582 4.94 89.93
41 527 4.48 94.4
42 369 3.13 97.54
43 205 1.74 99.28
44 85 0.72 100
Total 11,772 100


FAO AGRICULTURAL DEVELOPMENT ECONOMICS WORKING PAPERSThis series is produced by the Agricultural Development Economics Division (ESA) of the Food and Agriculture Organization of the United Nations (FAO) since 2001 to share findings from research produced by the Division and elicit feedback for the authors.
It covers different thematic areas, such as food security and nutrition global trends and governance; food security and resilience; sustainable markets, agribusinesses and rural transformations; and climate-smart agriculture.
The analysis and conclusions are those of the authors and do not indicate concurrence by FAO.
The complete series is available at: www.fao.org/economic/esa/working-papers
The Agricultural Development Economics Division (ESA) is the focal point for FAO’s research and policy analysis on agricultural and economic development. The Division produces evidence-based policy analysis and strengthens the capacity of member countries to improve decision-making on food security and nutrition, resilience, climate-smart agriculture, sustainable markets, agribusinesses and rural transformations.
CONTACTS
Agricultural Development Economics Division (ESA) Food and Agriculture Organization of the United Nations (FAO)
www.fao.org/economic/agricultural-development-economicswww.fao.org/economic/[email protected]
I7560EN/1/07.17
ISBN 978-92-5-109835-6
9 7 8 9 2 5 1 0 9 8 3 5 6