Embed Size (px)
Citation preview
4/17/2013
1
THE 2013 GENENTECH ONCOLOGY TREND REPORT
Perspectives From Managed Care, Specialty Pharmacy Providers, Oncologists, Practice Managers, and Employers
©2013 Genentech, South San Francisco, CA December 2013
2
Mission Statement
The mission of The 2013 Genentech Oncology Trend Report: Perspectives From Managed Care, Specialty Pharmacy
Providers, Oncologists, Practice Managers, and Employers is to provide timely and useful information on the latest cancer care trends and developments. Updated annually, the publication is designed to serve as a unique resource for those seeking an understanding of the issues surrounding cancer management
and practice. The content of this report was prepared by Emron with the guidance of an editorial board and is based on primary
research of key stakeholders, as well as published literature. Statements and opinions contained in this report do not
necessarily reflect the opinions of Genentech.
4/17/2013
2
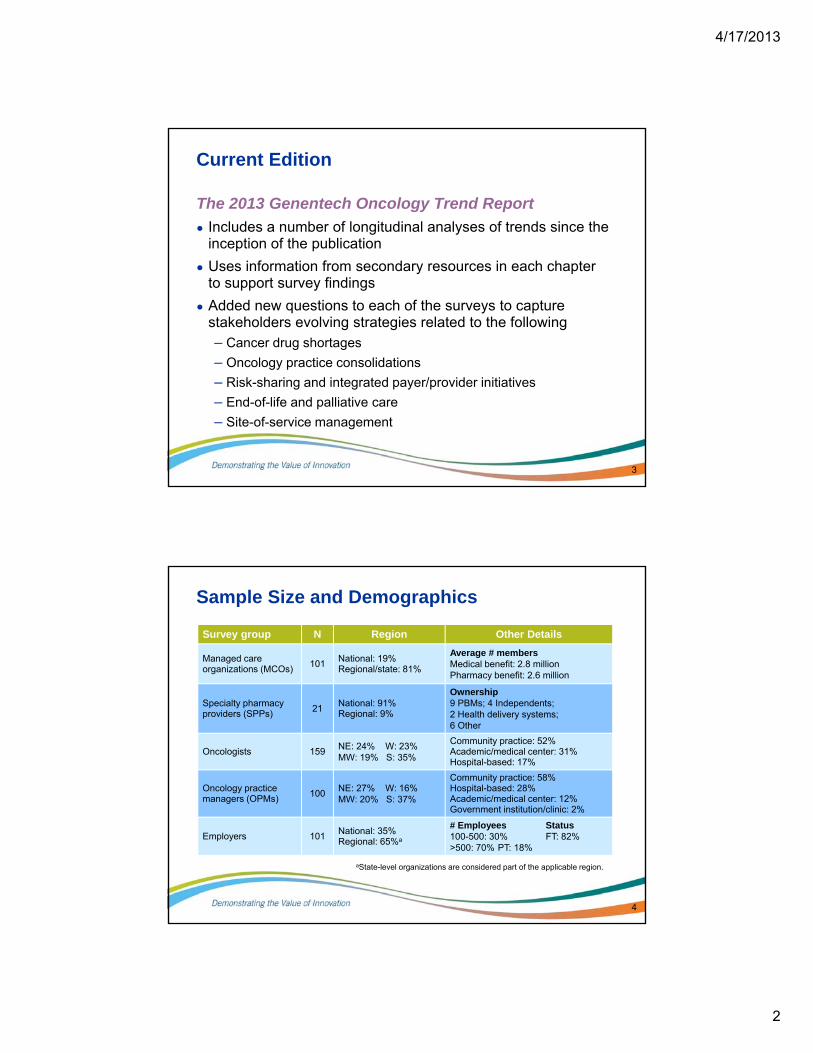
Current Edition
The 2013 Genentech Oncology Trend Report
● Includes a number of longitudinal analyses of trends since the inception of the publication
● Uses information from secondary resources in each chapter to support survey findings
● Added new questions to each of the surveys to capture stakeholders evolving strategies related to the following– Cancer drug shortages
– Oncology practice consolidations
– Risk-sharing and integrated payer/provider initiatives
– End-of-life and palliative care
– Site-of-service management
3
4
Sample Size and Demographics
Survey group N Region Other Details
Managed care organizations (MCOs)
101National: 19%Regional/state: 81%
Average # membersMedical benefit: 2.8 millionPharmacy benefit: 2.6 million
Specialty pharmacy providers (SPPs)
21National: 91%Regional: 9%
Ownership9 PBMs; 4 Independents; 2 Health delivery systems; 6 Other
Oncologists 159NE: 24% W: 23%MW: 19% S: 35%
Community practice: 52% Academic/medical center: 31% Hospital-based: 17%
Oncology practice managers (OPMs)
100NE: 27% W: 16%MW: 20% S: 37%
Community practice: 58% Hospital-based: 28% Academic/medical center: 12% Government institution/clinic: 2%
Employers 101National: 35%Regional: 65%a
# Employees Status100-500: 30% FT: 82% >500: 70% PT: 18%
aState-level organizations are considered part of the applicable region.
4/17/2013
3
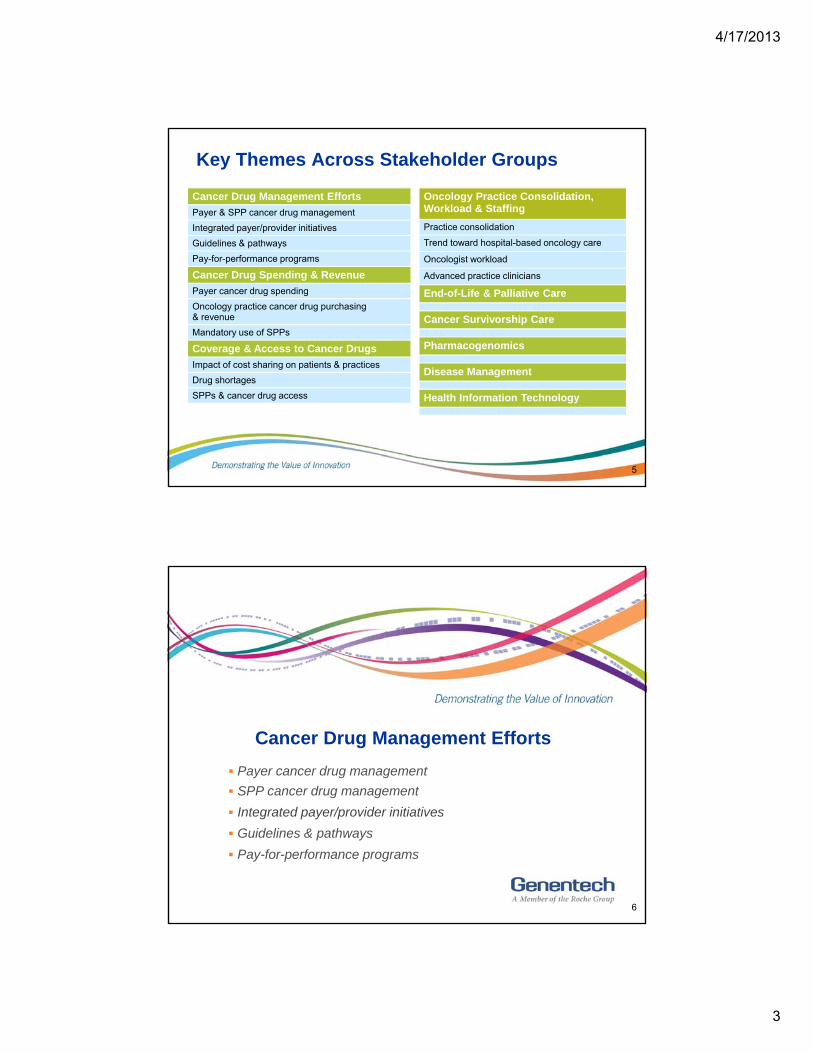
Key Themes Across Stakeholder Groups
5
Cancer Drug Management Efforts
Payer & SPP cancer drug management
Integrated payer/provider initiatives
Guidelines & pathways
Pay-for-performance programs
Cancer Drug Spending & Revenue
Payer cancer drug spending
Oncology practice cancer drug purchasing & revenue
Mandatory use of SPPs
Coverage & Access to Cancer Drugs
Impact of cost sharing on patients & practices
Drug shortages
SPPs & cancer drug access
Oncology Practice Consolidation, Workload & Staffing
Practice consolidation
Trend toward hospital-based oncology care
Oncologist workload
Advanced practice clinicians
End-of-Life & Palliative Care
Cancer Survivorship Care
Pharmacogenomics
Disease Management
Health Information Technology
Cancer Drug Management Efforts
6
Payer cancer drug management
SPP cancer drug management
Integrated payer/provider initiatives
Guidelines & pathways
Pay-for-performance programs
4/17/2013
4
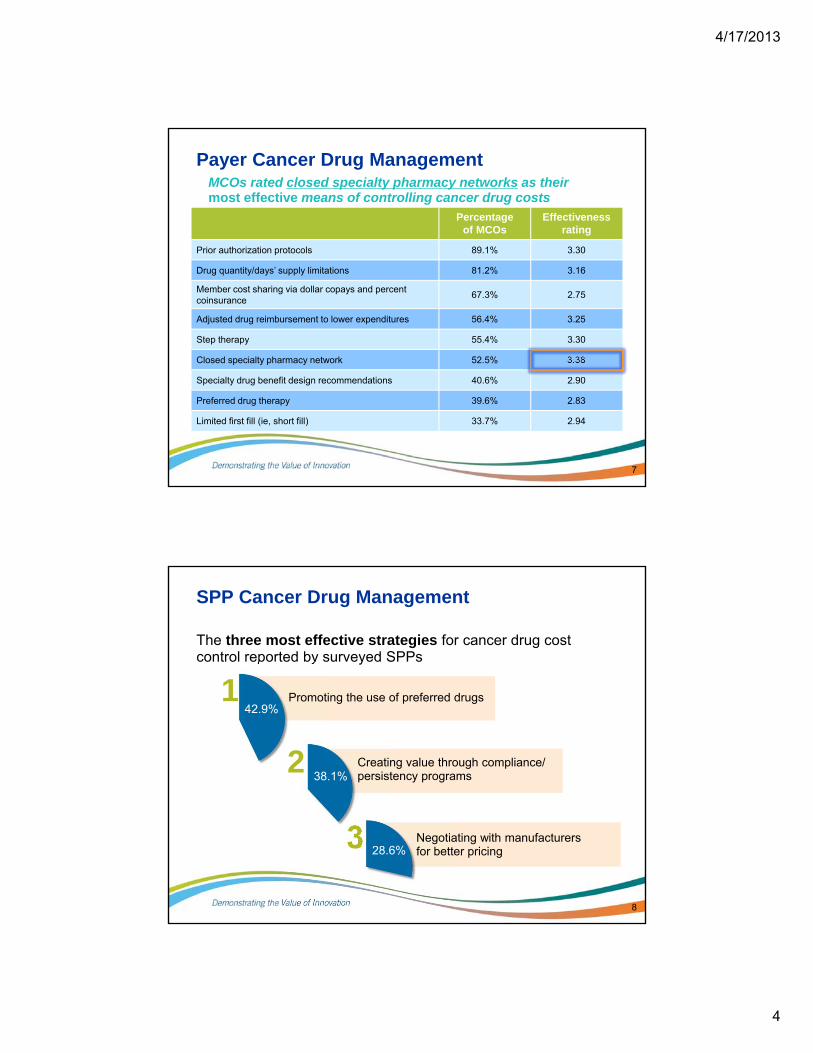
Payer Cancer Drug Management
Percentage of MCOs
Effectiveness rating
Prior authorization protocols 89.1% 3.30
Drug quantity/days’ supply limitations 81.2% 3.16
Member cost sharing via dollar copays and percent coinsurance
67.3% 2.75
Adjusted drug reimbursement to lower expenditures 56.4% 3.25
Step therapy 55.4% 3.30
Closed specialty pharmacy network 52.5% 3.38
Specialty drug benefit design recommendations 40.6% 2.90
Preferred drug therapy 39.6% 2.83
Limited first fill (ie, short fill) 33.7% 2.94
7
MCOs rated closed specialty pharmacy networks as their most effective means of controlling cancer drug costs
SPP Cancer Drug Management
The three most effective strategies for cancer drug cost control reported by surveyed SPPs
8
1 Promoting the use of preferred drugs
Negotiating with manufacturers for better pricing
3
42.9%
28.6%
Creating value through compliance/persistency programs
238.1%
4/17/2013
5
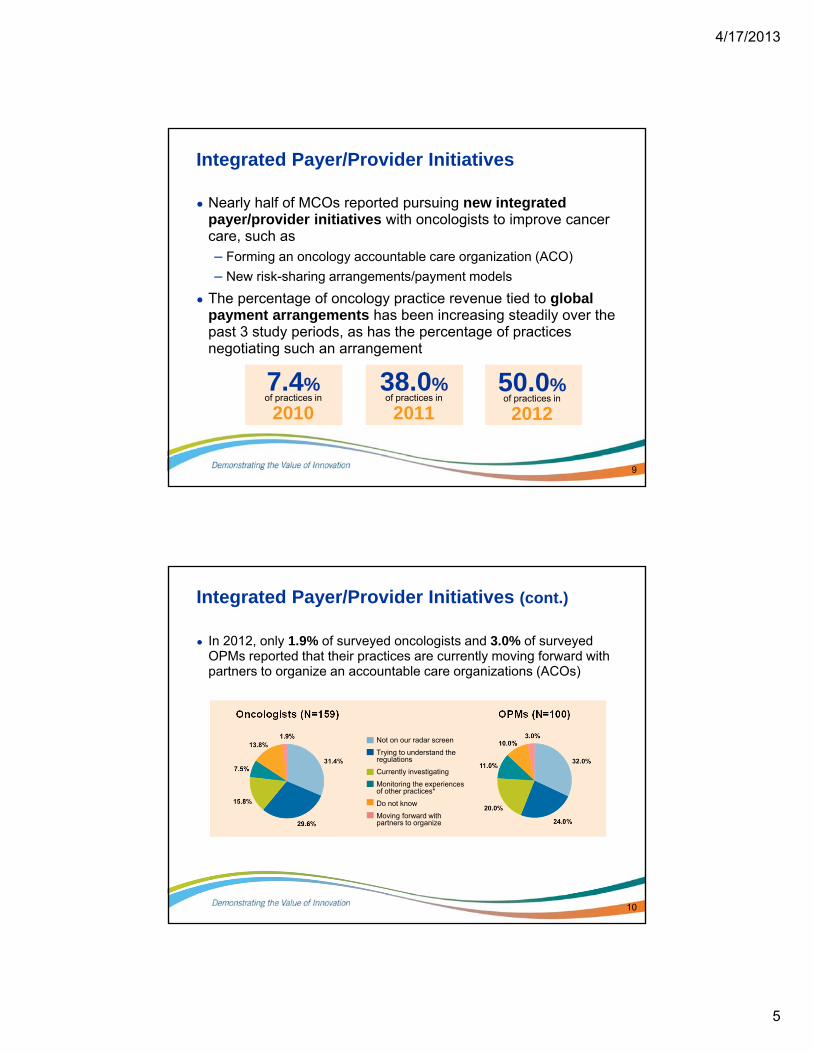
Integrated Payer/Provider Initiatives
● Nearly half of MCOs reported pursuing new integrated payer/provider initiatives with oncologists to improve cancer care, such as– Forming an oncology accountable care organization (ACO)
– New risk-sharing arrangements/payment models
● The percentage of oncology practice revenue tied to global payment arrangements has been increasing steadily over the past 3 study periods, as has the percentage of practices negotiating such an arrangement
9
7.4%of practices in
2010
38.0%of practices in
2011
50.0%of practices in
2012
Integrated Payer/Provider Initiatives (cont.)
● In 2012, only 1.9% of surveyed oncologists and 3.0% of surveyed OPMs reported that their practices are currently moving forward with partners to organize an accountable care organizations (ACOs)
10
Oncologists (N=159) OPMs (N=100)
Not on our radar screen
Trying to understand the regulations
Currently investigating
Monitoring the experiences of other practices*
Do not know
Moving forward with partners to organize
4/17/2013
6
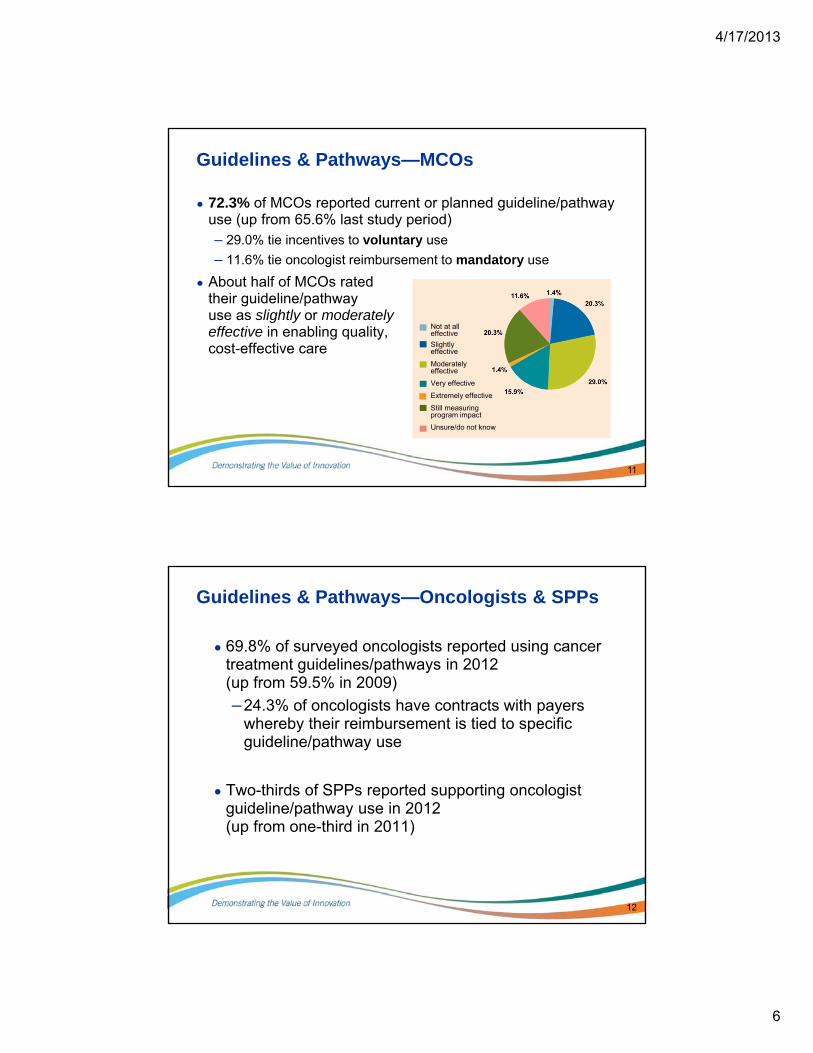
● 72.3% of MCOs reported current or planned guideline/pathway use (up from 65.6% last study period)– 29.0% tie incentives to voluntary use
– 11.6% tie oncologist reimbursement to mandatory use
● About half of MCOs rated their guideline/pathway use as slightly or moderately effective in enabling quality, cost-effective care
Guidelines & Pathways—MCOs
11
Not at all effective
Slightly effective
Moderately effective
Very effective
Extremely effective
Still measuring program impact
Unsure/do not know
Guidelines & Pathways—Oncologists & SPPs
● 69.8% of surveyed oncologists reported using cancer treatment guidelines/pathways in 2012 (up from 59.5% in 2009)
–24.3% of oncologists have contracts with payers whereby their reimbursement is tied to specific guideline/pathway use
● Two-thirds of SPPs reported supporting oncologist guideline/pathway use in 2012 (up from one-third in 2011)
12
4/17/2013
7
Coverage & Access to Oncology Drugs
13
Impact of cost sharing on patients & practices
Drug shortages
Impact of Cost Sharing on Patients & Practices
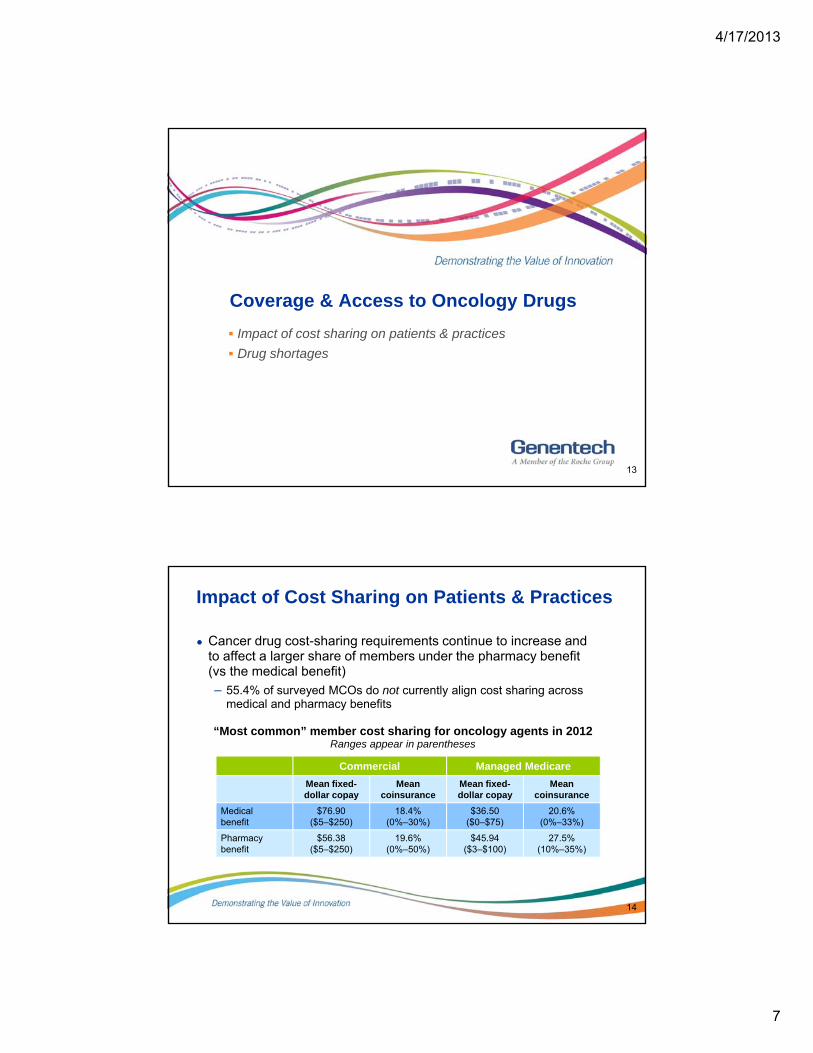
Commercial Managed Medicare
Mean fixed-dollar copay
Mean coinsurance
Mean fixed-dollar copay
Mean coinsurance
Medical benefit
$76.90 ($5–$250)
18.4%(0%–30%)
$36.50($0–$75)
20.6%(0%–33%)
Pharmacy benefit
$56.38 ($5–$250)
19.6%(0%–50%)
$45.94($3–$100)
27.5%(10%–35%)
14
● Cancer drug cost-sharing requirements continue to increase and to affect a larger share of members under the pharmacy benefit (vs the medical benefit)
– 55.4% of surveyed MCOs do not currently align cost sharing across medical and pharmacy benefits
“Most common” member cost sharing for oncology agents in 2012Ranges appear in parentheses
4/17/2013
8
Impact of Cost Sharing on Patients & Practices (cont.)
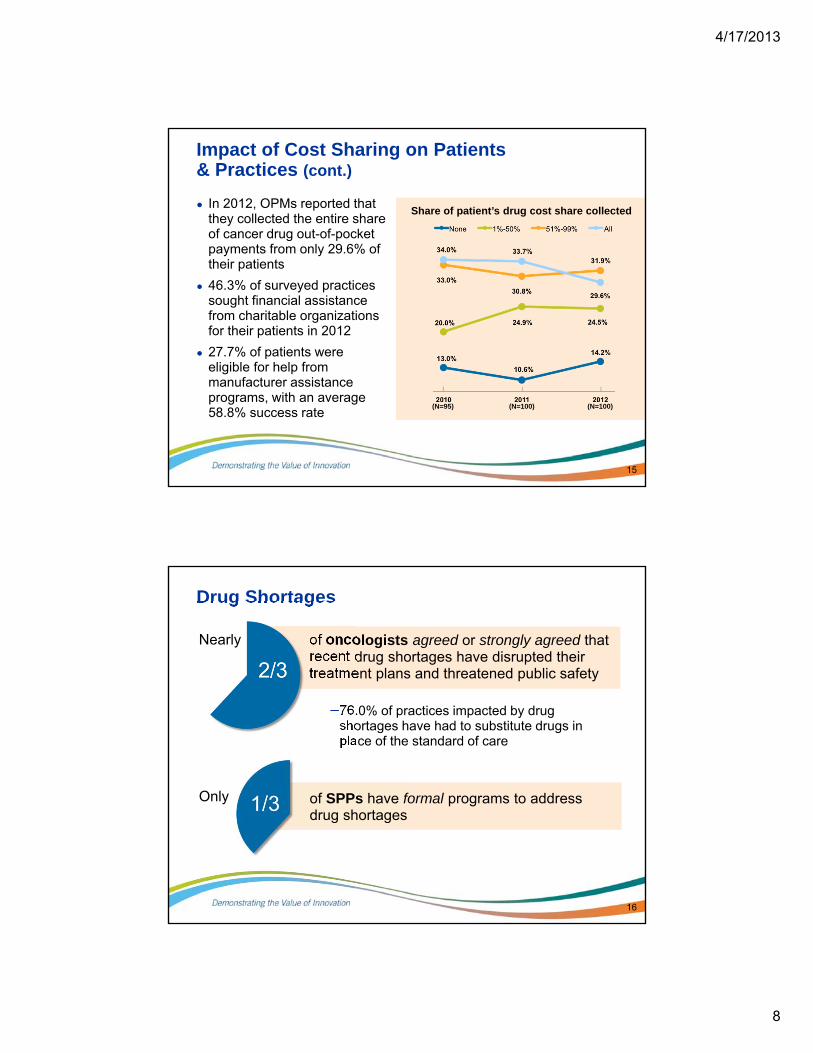
● In 2012, OPMs reported that they collected the entire share of cancer drug out-of-pocket payments from only 29.6% of their patients
● 46.3% of surveyed practices sought financial assistance from charitable organizations for their patients in 2012
● 27.7% of patients were eligible for help from manufacturer assistance programs, with an average 58.8% success rate
15
(N=95) (N=100) (N=100)
Share of patient’s drug cost share collected
Drug Shortages
of oncologists agreed or strongly agreed that recent drug shortages have disrupted their treatment plans and threatened public safety
–76.0% of practices impacted by drug shortages have had to substitute drugs in place of the standard of care
16
Nearly
Only of SPPs have formal programs to address drug shortages
4/17/2013
9
Cancer Drug Spending & Revenue
17
Payer cancer drug spending
Oncology practice drug purchasing & revenue
Mandatory use of SPPs
18
Payer Cancer Drug Spending
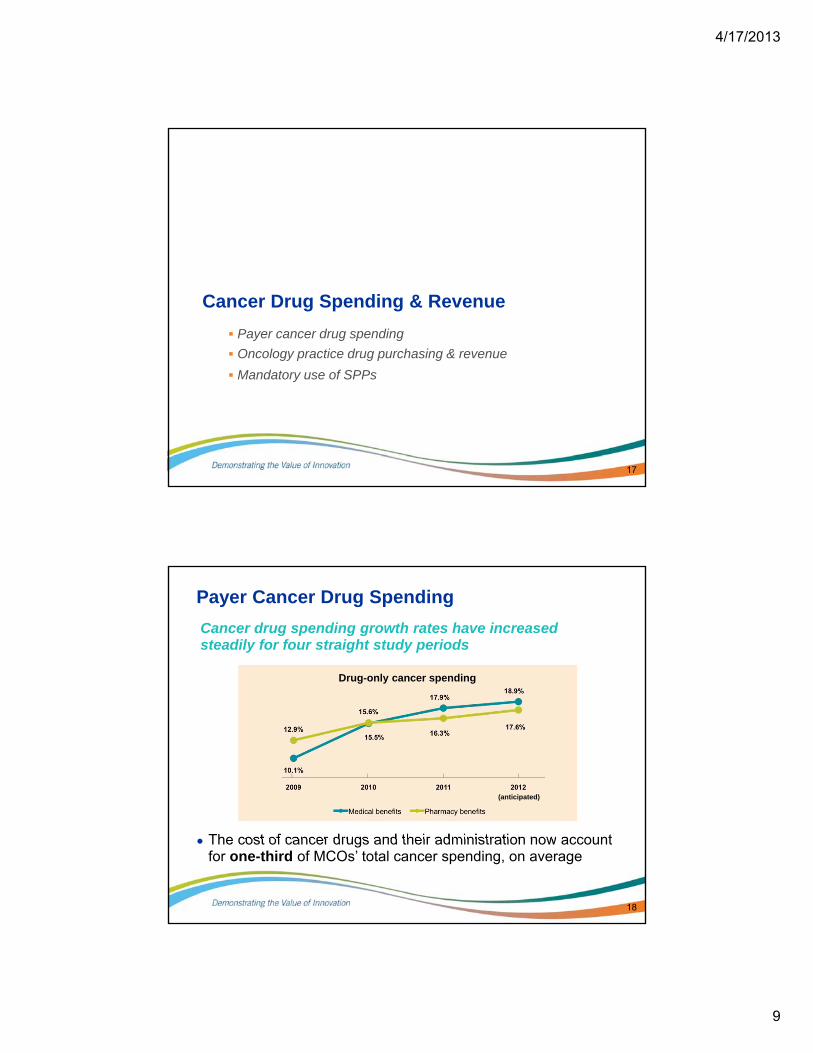
Cancer drug spending growth rates have increased steadily for four straight study periods
● The cost of cancer drugs and their administration now account for one-third of MCOs’ total cancer spending, on average
Drug-only cancer spending
(anticipated)
4/17/2013
10
19
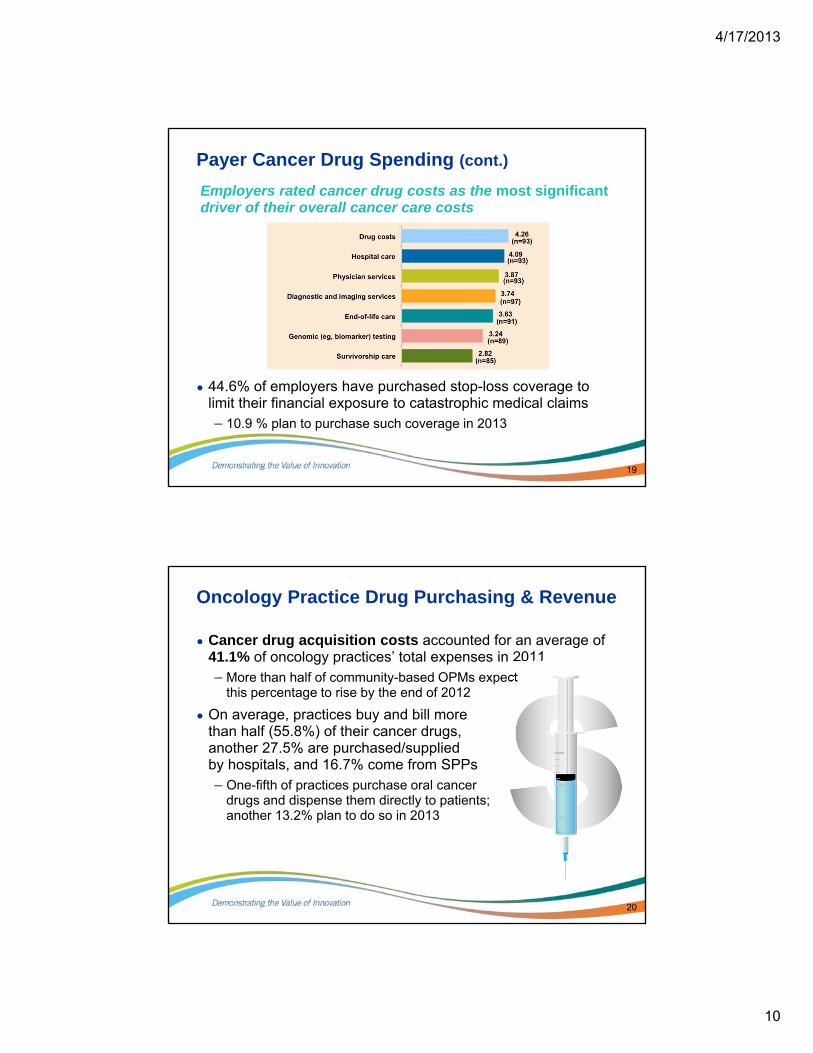
Payer Cancer Drug Spending (cont.)
Employers rated cancer drug costs as the most significant driver of their overall cancer care costs
● 44.6% of employers have purchased stop-loss coverage to limit their financial exposure to catastrophic medical claims– 10.9 % plan to purchase such coverage in 2013
Oncology Practice Drug Purchasing & Revenue
● Cancer drug acquisition costs accounted for an average of 41.1% of oncology practices’ total expenses in 2011– More than half of community-based OPMs expect
this percentage to rise by the end of 2012
● On average, practices buy and bill more than half (55.8%) of their cancer drugs, another 27.5% are purchased/supplied by hospitals, and 16.7% come from SPPs– One-fifth of practices purchase oral cancer
drugs and dispense them directly to patients; another 13.2% plan to do so in 2013
20
4/17/2013
11
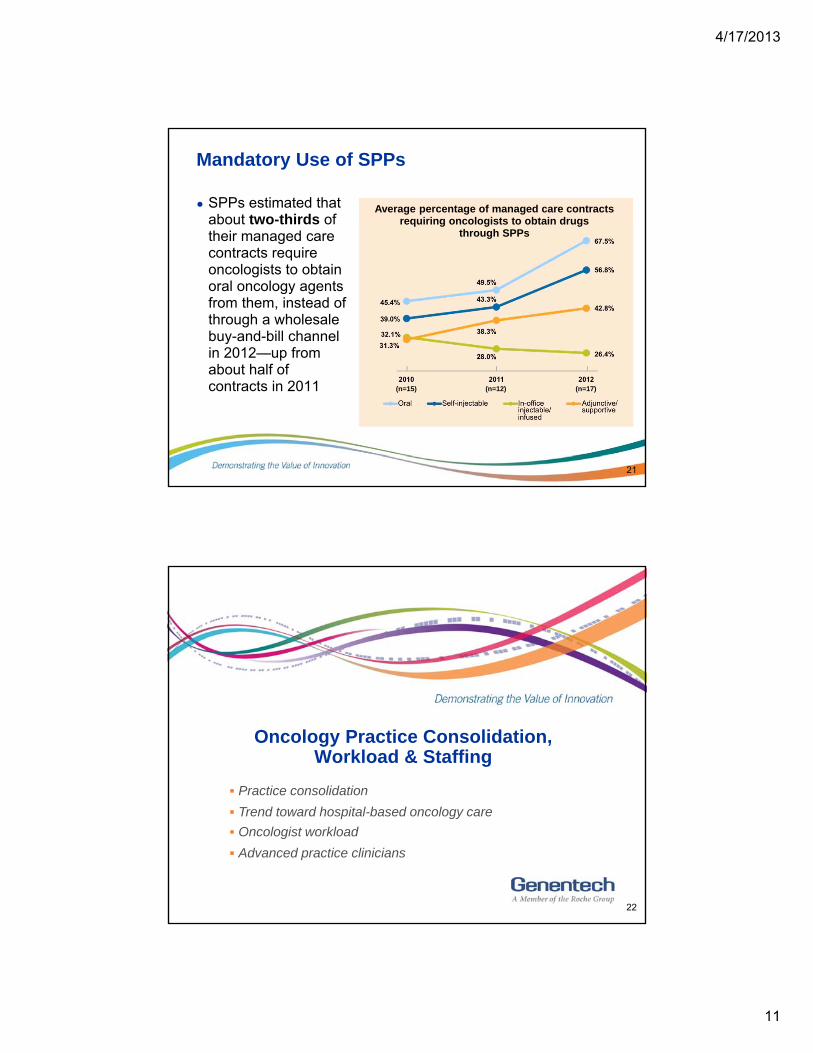
Mandatory Use of SPPs
● SPPs estimated that about two-thirds of their managed care contracts require oncologists to obtain oral oncology agents from them, instead of through a wholesale buy-and-bill channel in 2012—up from about half of contracts in 2011
21
(n=15) (n=12) (n=17)
Average percentage of managed care contracts requiring oncologists to obtain drugs
through SPPs
Oncology Practice Consolidation, Workload & Staffing
22
Practice consolidation
Trend toward hospital-based oncology care
Oncologist workload
Advanced practice clinicians
4/17/2013
12
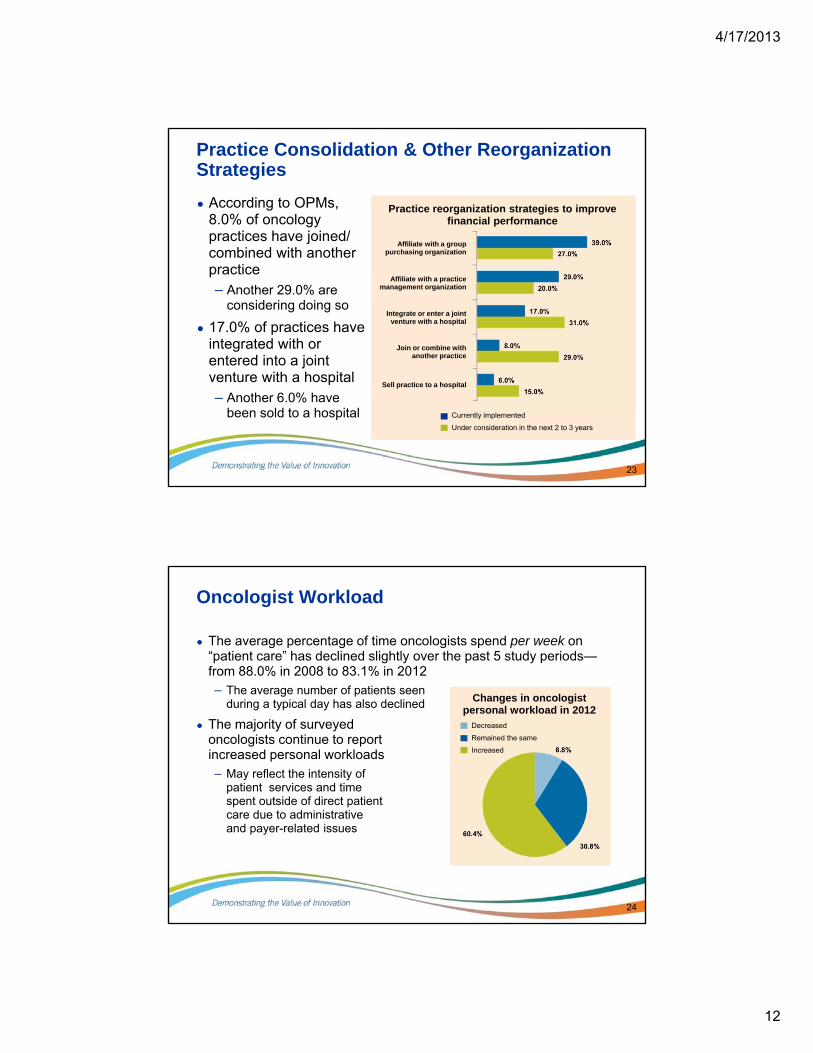
Practice Consolidation & Other Reorganization Strategies
● According to OPMs, 8.0% of oncology practices have joined/combined with another practice– Another 29.0% are
considering doing so
● 17.0% of practices have integrated with or entered into a joint venture with a hospital– Another 6.0% have
been sold to a hospital
23
Practice reorganization strategies to improve financial performance
Affiliate with a grouppurchasing organization
Affiliate with a practice management organization
Integrate or enter a joint venture with a hospital
Join or combine with another practice
Sell practice to a hospital
Currently implemented
Under consideration in the next 2 to 3 years
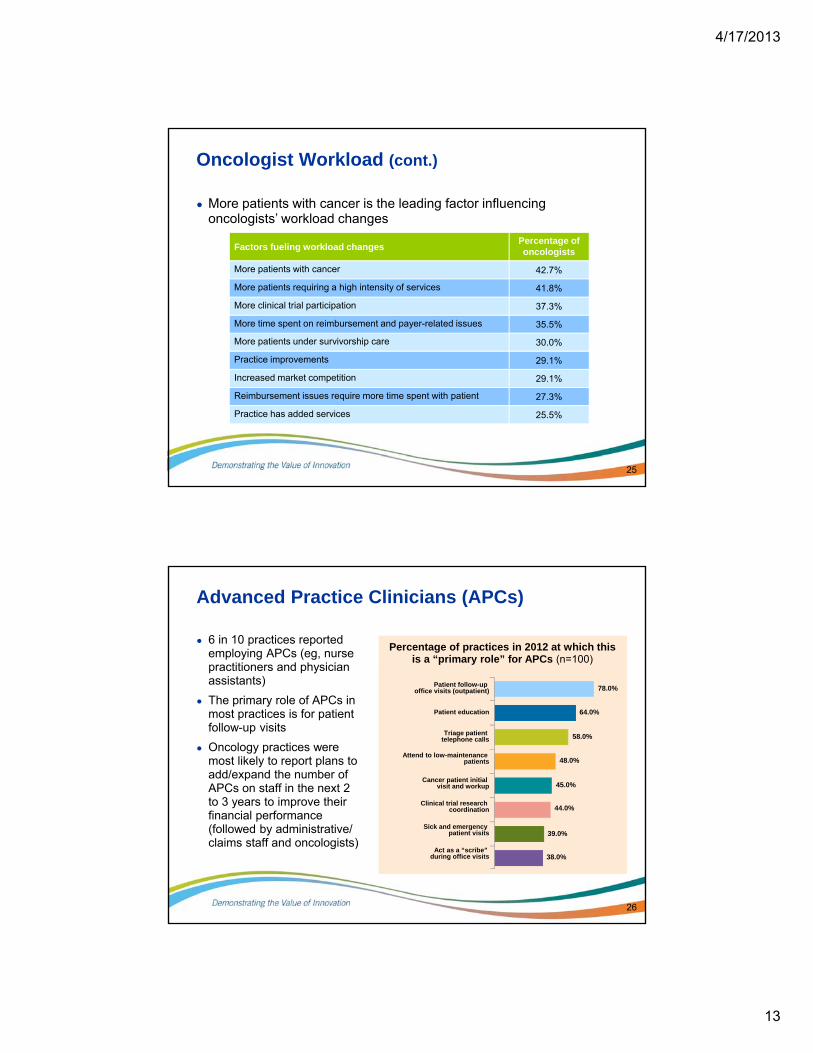
Oncologist Workload
● The average percentage of time oncologists spend per week on “patient care” has declined slightly over the past 5 study periods—from 88.0% in 2008 to 83.1% in 2012
– The average number of patients seen during a typical day has also declined
● The majority of surveyed oncologists continue to report increased personal workloads
– May reflect the intensity of patient services and time spent outside of direct patient care due to administrative and payer-related issues
24
Changes in oncologist personal workload in 2012
Decreased
Remained the same
Increased
4/17/2013
13
Oncologist Workload (cont.)
Factors fueling workload changesPercentage of oncologists
More patients with cancer 42.7%
More patients requiring a high intensity of services 41.8%
More clinical trial participation 37.3%
More time spent on reimbursement and payer-related issues 35.5%
More patients under survivorship care 30.0%
Practice improvements 29.1%
Increased market competition 29.1%
Reimbursement issues require more time spent with patient 27.3%
Practice has added services 25.5%
25
● More patients with cancer is the leading factor influencing oncologists’ workload changes
Advanced Practice Clinicians (APCs)
● 6 in 10 practices reported employing APCs (eg, nurse practitioners and physician assistants)
● The primary role of APCs in most practices is for patient follow-up visits
● Oncology practices were most likely to report plans to add/expand the number of APCs on staff in the next 2 to 3 years to improve their financial performance (followed by administrative/ claims staff and oncologists)
26
Patient follow-up office visits (outpatient)
Patient education
Triage patient telephone calls
Attend to low-maintenance patients
Cancer patient initial visit and workup
Clinical trial research coordination
Sick and emergency patient visits
Act as a “scribe”during office visits
Percentage of practices in 2012 at which this is a “primary role” for APCs (n=100)
78.0%
64.0%
58.0%
48.0%
45.0%
44.0%
39.0%
38.0%
4/17/2013
14
End-of-Life & Palliative Care
27
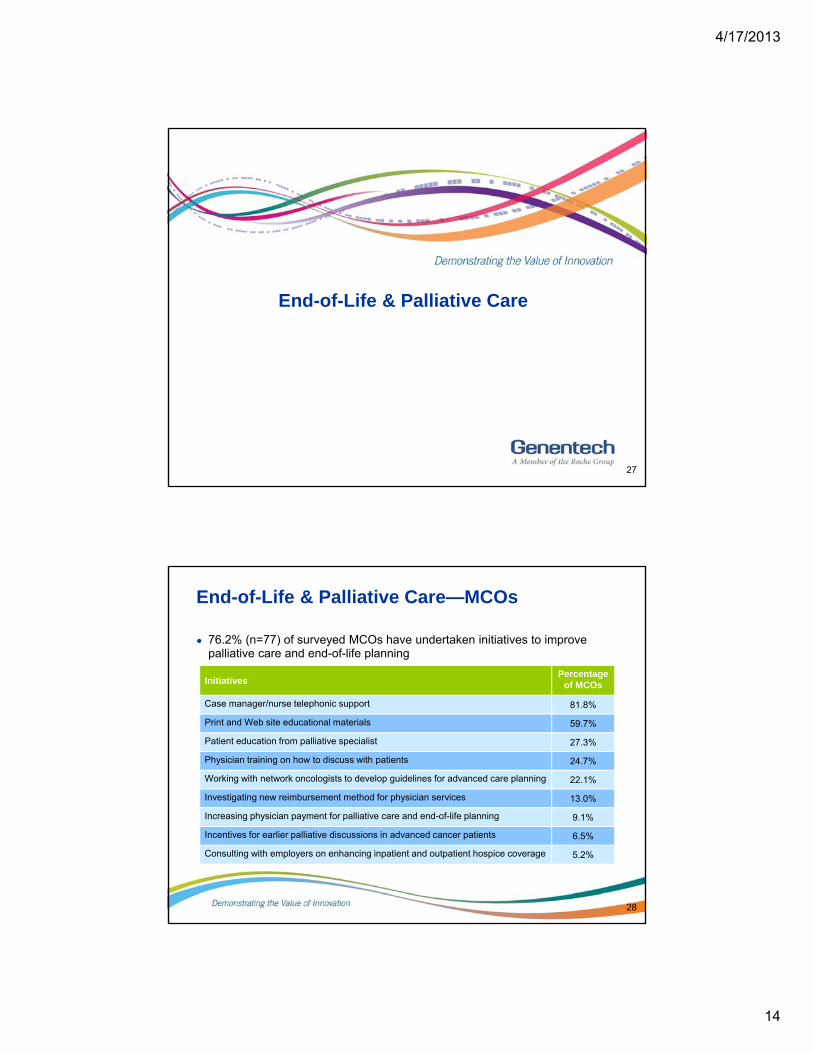
End-of-Life & Palliative Care—MCOs
● 76.2% (n=77) of surveyed MCOs have undertaken initiatives to improve palliative care and end-of-life planning
28
InitiativesPercentage
of MCOs
Case manager/nurse telephonic support 81.8%
Print and Web site educational materials 59.7%
Patient education from palliative specialist 27.3%
Physician training on how to discuss with patients 24.7%
Working with network oncologists to develop guidelines for advanced care planning 22.1%
Investigating new reimbursement method for physician services 13.0%
Increasing physician payment for palliative care and end-of-life planning 9.1%
Incentives for earlier palliative discussions in advanced cancer patients 6.5%
Consulting with employers on enhancing inpatient and outpatient hospice coverage 5.2%
4/17/2013
15
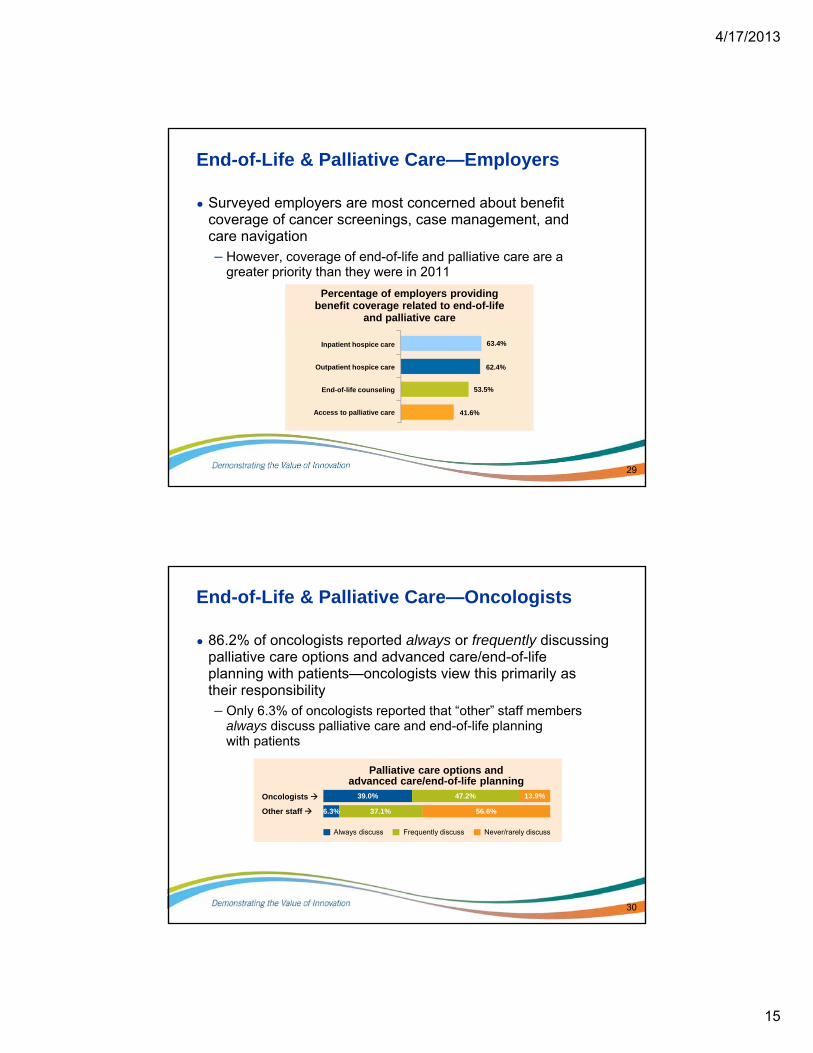
End-of-Life & Palliative Care—Employers
● Surveyed employers are most concerned about benefit coverage of cancer screenings, case management, and care navigation– However, coverage of end-of-life and palliative care are a
greater priority than they were in 2011
29
Percentage of employers providing benefit coverage related to end-of-life
and palliative care
41.6%
63.4%
62.4%
53.5%
Inpatient hospice care
Outpatient hospice care
End-of-life counseling
Access to palliative care
End-of-Life & Palliative Care—Oncologists
● 86.2% of oncologists reported always or frequently discussing palliative care options and advanced care/end-of-life planning with patients—oncologists view this primarily as their responsibility– Only 6.3% of oncologists reported that “other” staff members
always discuss palliative care and end-of-life planning with patients
30
Always discuss Frequently discuss Never/rarely discuss
Oncologists
Other staff
39.0% 47.2% 13.9%
6.3% 37.1% 56.6%
Palliative care options and advanced care/end-of-life planning
4/17/2013
16
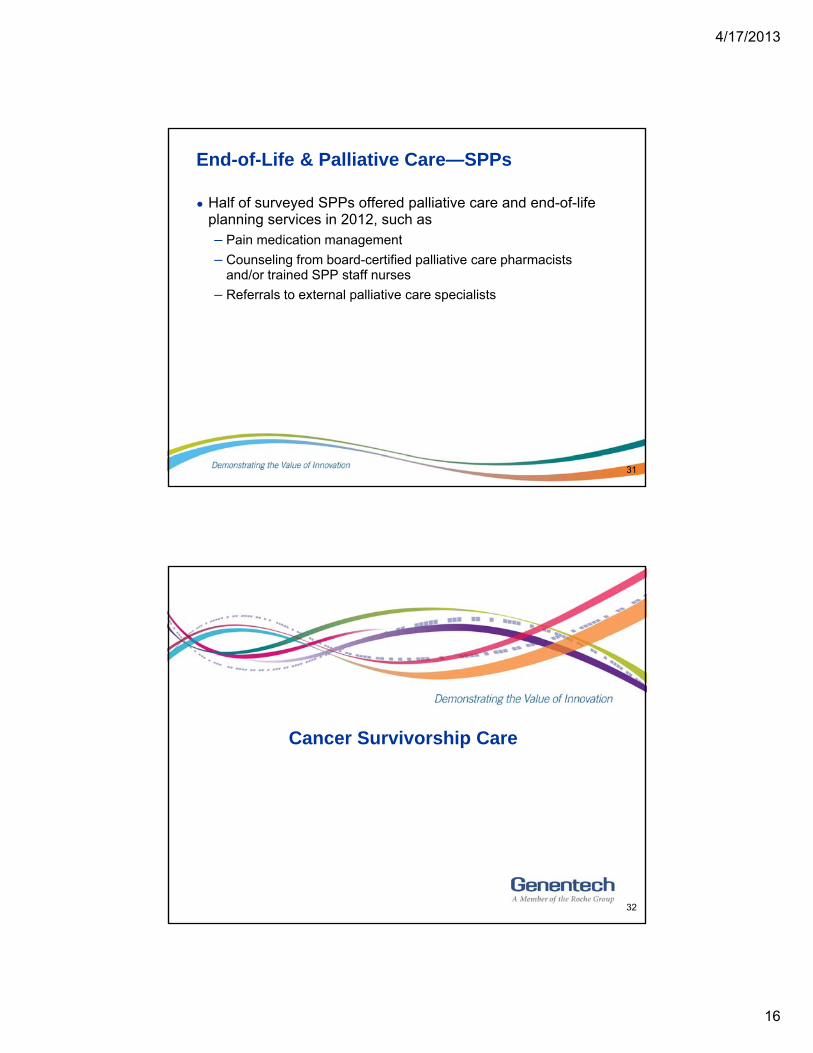
End-of-Life & Palliative Care—SPPs
● Half of surveyed SPPs offered palliative care and end-of-life planning services in 2012, such as– Pain medication management
– Counseling from board-certified palliative care pharmacists and/or trained SPP staff nurses
– Referrals to external palliative care specialists
31
Cancer Survivorship Care
32
4/17/2013
17
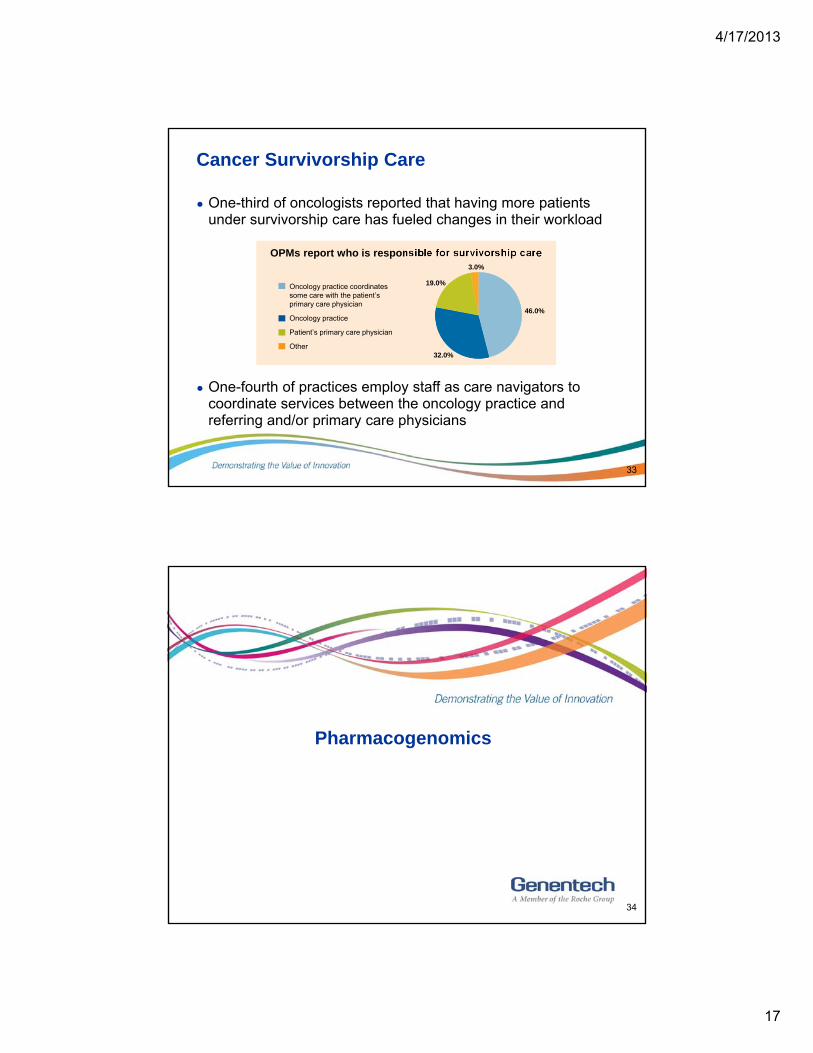
Cancer Survivorship Care
● One-third of oncologists reported that having more patients under survivorship care has fueled changes in their workload
33
● One-fourth of practices employ staff as care navigators to coordinate services between the oncology practice and referring and/or primary care physicians
OPMs report who is responsible for survivorship care
Oncology practice coordinates some care with the patient’s primary care physician
Oncology practice
Patient’s primary care physician
Other
46.0%
32.0%
19.0%
3.0%
Pharmacogenomics
34
4/17/2013
18
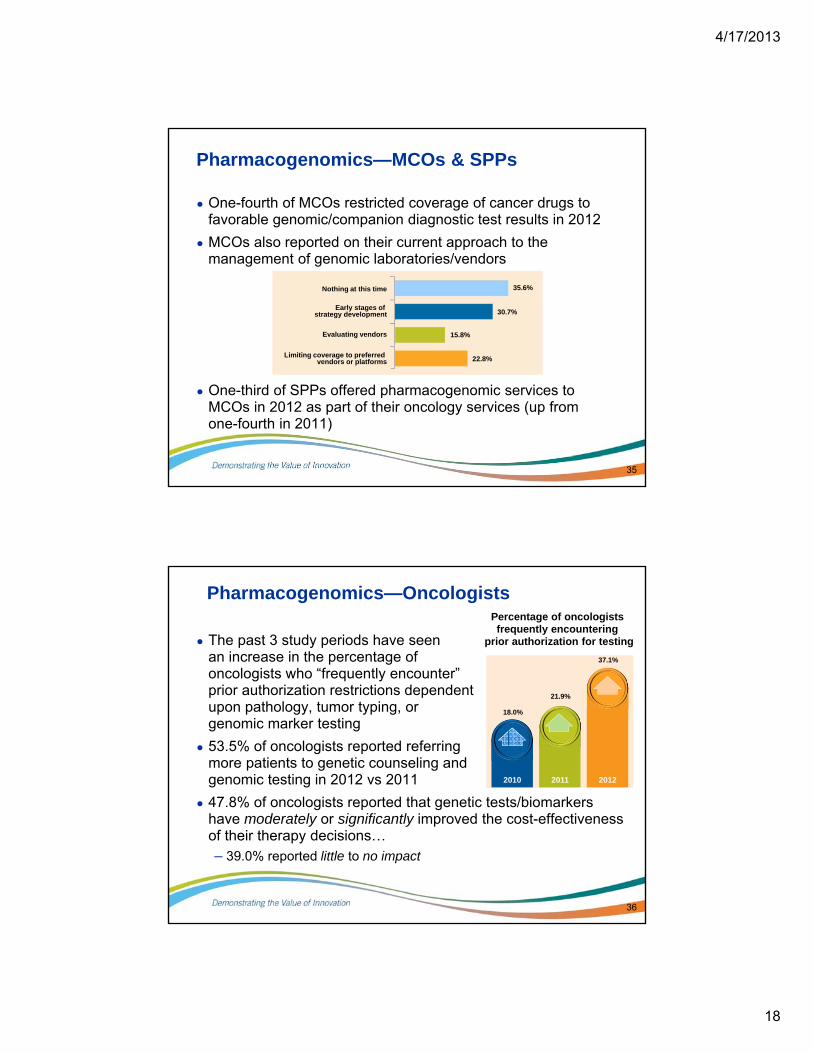
Pharmacogenomics—MCOs & SPPs
● One-fourth of MCOs restricted coverage of cancer drugs to favorable genomic/companion diagnostic test results in 2012
● MCOs also reported on their current approach to the management of genomic laboratories/vendors
35
● One-third of SPPs offered pharmacogenomic services to MCOs in 2012 as part of their oncology services (up from one-fourth in 2011)
Nothing at this time
Early stages of strategy development
Evaluating vendors
Limiting coverage to preferred vendors or platforms
35.6%
30.7%
22.8%
15.8%
Pharmacogenomics—Oncologists
● The past 3 study periods have seen an increase in the percentage of oncologists who “frequently encounter”prior authorization restrictions dependent upon pathology, tumor typing, or genomic marker testing
● 53.5% of oncologists reported referring more patients to genetic counseling and genomic testing in 2012 vs 2011
● 47.8% of oncologists reported that genetic tests/biomarkers have moderately or significantly improved the cost-effectiveness of their therapy decisions…– 39.0% reported little to no impact
36
Percentage of oncologists frequently encountering
prior authorization for testing
37.1%
20122011
21.9%
2010
18.0%
4/17/2013
19
Disease Management
37
Disease Management
● Only 25.7% of MCOs offered a disease management (DM) program for cancer in 2012– DM programs are primarily developed internally by MCOs
– DM programs are most commonly created for patients with breast, colorectal, prostate, and lung cancer
● 47 employers offered DM programs as part of their health benefit plans in 2012 – 35.6% of those offer a cancer DM program
– Such programs most often include
• Case management
• Education about cancer screening/prevention
• Web-based resources
38
4/17/2013
20
Health Information Technology
39
Health Information Technology
● The use of health information technology by oncology practices has increased significantly over the last 4 study periods
40
EHR = electronic health record; eRx = electronic prescribing.
(N=159)(N=183)(N=150)(N=158)
Use of health system information technology(Percentage of respondents)
4/17/2013
21
Health Information Technology (cont.)
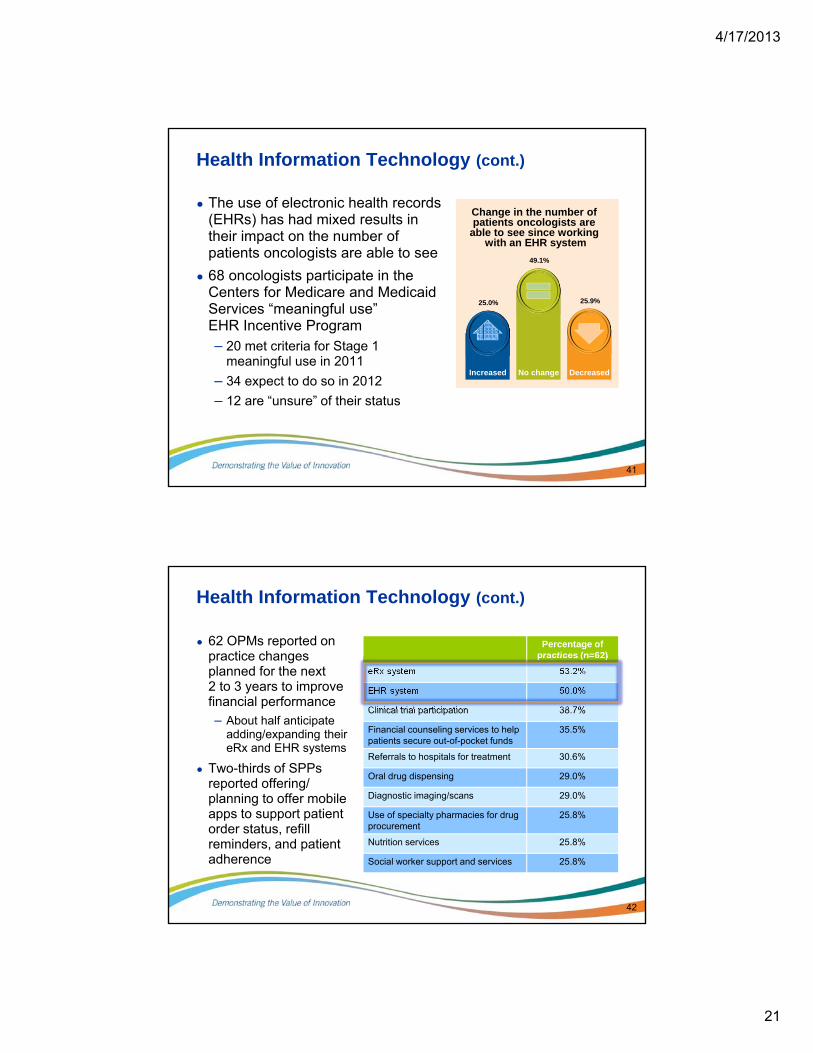
● The use of electronic health records (EHRs) has had mixed results in their impact on the number of patients oncologists are able to see
● 68 oncologists participate in the Centers for Medicare and Medicaid Services “meaningful use”EHR Incentive Program– 20 met criteria for Stage 1
meaningful use in 2011
– 34 expect to do so in 2012
– 12 are “unsure” of their status
41
Change in the number of patients oncologists are
able to see since working with an EHR system
25.9%
DecreasedNo change
49.1%
Increased
25.0%
Health Information Technology (cont.)
Percentage of practices (n=62)
eRx system 53.2%
EHR system 50.0%
Clinical trial participation 38.7%
Financial counseling services to help patients secure out-of-pocket funds
35.5%
Referrals to hospitals for treatment 30.6%
Oral drug dispensing 29.0%
Diagnostic imaging/scans 29.0%
Use of specialty pharmacies for drug procurement
25.8%
Nutrition services 25.8%
Social worker support and services 25.8%
42
● 62 OPMs reported on practice changes planned for the next 2 to 3 years to improve financial performance
– About half anticipate adding/expanding their eRx and EHR systems
● Two-thirds of SPPs reported offering/planning to offer mobile apps to support patient order status, refill reminders, and patient adherence
4/17/2013
22
THE 2013 GENENTECH ONCOLOGY TREND REPORT
Perspectives From Managed Care, Specialty Pharmacy Providers, Oncologists, Practice Managers, and Employers
©2013 Genentech, South San Francisco, CA December 2013