Embed Size (px)
Citation preview

The 2016 Lesser Prairie-Chicken Range-wide
Conservation Plan Annual Progress Report
Edited by:
Roger L. Wolfe
Western Association of Fish and Wildlife Agencies Lesser Prairie-Chicken Program Manager
Drafted by:
Sean C. Kyle, Lesser Prairie-Chicken Range-wide Plan Industry Service Director
Jim C. Pitman, Lesser Prairie-Chicken Range-wide Plan Conservation Delivery Director
Deb M. VonDeBur, Chief Financial Officer
Michael E. Houts, Lesser Prairie-Chicken Range-wide Plan Information System Director
March 2017

Western Association of Fish and Wildlife Agencies March 2017
The 2016 Lesser Prairie-Chicken Range-wide Conservation Plan Annual Progress Report Page 2
RECOMMENDED CITATION
Wolfe, R. L., S. C. Kyle, J. C. Pitman, D.M. VonDeBur, M.E. Houts, 2016. The 2016 Lesser
Prairie-Chicken Range-wide Conservation Plan Annual Progress Report. Western Association of
Fish and Wildlife Agencies. Boise, Idaho, pp.135
ACKNOWLEDGMENTS
We thank all past and present state fish and wildlife agency employees who dedicated their time
and effort to the development and successful implementation of the range-wide plan (RWP). We
also thank all past and present members of the Lesser Prairie-Chicken Initiative Council (LPCIC)
for their active engagement in our program and continued advocacy for our new conservation
model. We especially thank the six state wildlife agency Directors who currently serve on the
LPCIC including Keith Sexson, Kansas; J.D Strong, Oklahoma; Ross Melinchuk, Texas;
Alexandra Sandoval, New Mexico; Bob Broscheid, Colorado; and Tim McCoy, Nebraska. Jon
Ungerer and Christian Hagen provided input on the Lesser Prairie-Chicken Initiative and Natural
Resources Conservation Service (NRCS) programs. David Hoge provided input on Farm Services
Agency (FSA) programs. We also thank the many people in the USDA state offices and their field
staff who assisted with development of the RWP and continue to provide conservation planning
support. Dan Ashe, Gary Frazer, Benjamin Tuggle, Noreen Walsh, Matt Hogan, Kevin Burgess,
Chris O’Meilia, Jenny Davis, Clay Nichols, Patricia Echo-Hawk and Leslie Ellwood of the U.S.
Fish and Wildlife Service (USFWS) all provided input regarding RWP implementation. The
Lesser Prairie-Chicken Advisory Committee (LPCAC), Lesser Prairie-Chicken Science Sub-
committee, and Fee Structure Sub-committee all played key roles in RWP implementation. A
great deal of appreciation is also due to all the WAFWA Staff, Regional Biologists, GIS staff and
business office personnel who coordinate the daily activities associated with RWP
implementation. This program would not be a success without their collective knowledge and
dedication. Finally, we would also like to specifically thank Larry Kruckenberg and Bill Van Pelt
for their leadership and commitment to the continued success of this comprehensive conservation
effort.
Photo Credit: Grant Beauprez

Western Association of Fish and Wildlife Agencies March 2017
The 2016 Lesser Prairie-Chicken Range-wide Conservation Plan Annual Progress Report Page 3
Table of Contents
EXECUTIVE SUMMARY 5
INTRODUCTION 10
BACKGROUND 10
CONSERVATION STRATEGY 13
WAFWA MITIGATION AND METRICS SYSTEM 13
ADAPTIVE MANAGEMENT 14
INDUSTRY PARTICIPATION 16 LEK SURVEYS FOR PROJECT CLEARANCE 16
INDUSTRY ENROLLMENT AUDIT 17
WAFWA CONSERVATION AGREEMENT PARTICIPATION BY INDUSTRY 24
WCA COMPLIANCE 33
WCA SUSPENSIONS FOR NON-PAYMENT OF ENROLLMENT FEES 33
SUMMARY OF WCA COMPLIANCE MONITORING 33
WCA EMERGENCY & NON-EMERGENCY OPERATIONS AND LPC MORTALITY REPORTING 34
CCAA INDUSTRY PARTICIPATION 34
CCAA COMPLIANCE 45
CCAA SUSPENSIONS FOR NON-PAYMENT OF ENROLLMENT FEES 45
SUMMARY OF CCAA COMPLIANCE MONITORING 45
CCAA EMERGENCY & NON-EMERGENCY OPERATIONS AND LPC MORTALITY REPORTING 46
RWP CONSERVATION PROGRAM 48 WAFWA NON-OFFSET AGREEMENTS 49
WAFWA CONSERVATION FUNDING STRATEGY 49
WAFWA TERM CONTRACTS 50
WAFWA PERMANENT CONSERVATION ACQUISITIONS 53
WAFWA HABITAT RESTORATION EFFORTS 54
QUALITY OF WAFWA CONTRACTED PROPERTIES 56
WAFWA CONSERVATION AGREEMENT SUMMARY 57
NON-WAFWA CONSERVATION PROGRAMS ADMINISTERED WITHIN LPC RANGE 58
LESSER PRAIRIE-CHICKEN CONSERVATION INITIATIVE AND OTHER NRCS PROGRAMS 58
CONSERVATION RESERVE PROGRAM (CRP) 59
PARTNERS FOR FISH AND WILDLIFE PROGRAM 60
CANDIDATE CONSERVATION AGREEMENT 61
NON-CCAA PRIVATE LAND CONS. PROGRAMS DELIVERED BY STATE WILDLIFE AGENCIES 62
NON-WAFWA PROPERTIES IDENTIFIED AS POTENTIAL STRONGHOLDS 62
OTHER PUBLIC LANDS AND NON-GOVERNMENT ORGANIZATION LAND OWNERSHIP 62
SUMMARY OF ALL CONSERVATION EFFORTS BEING DELIVERED IN LPC RANGE 63
WAFWA MITIGATION TRACKING 65 INDUSTRY IMPACT UNIT GENERATION 66
RECLAMATION OF IMPACTS TO GENERATE OFFSET UNITS 75
OFFSET UNIT GENERATION 78
HABITAT QUALITY OF IMPACT SITES VERSUS CONSERVATION SITES 80
PROJECT LOGS AND LEDGERS 86
REPORTING UNITS AND DEVELOPMENT LEVEL THRESHOLDS 93
TRACKING PROGRESS TOWARDS RWP CONSERVATION GOALS 98 POPULATION GOALS 98
HABITAT RESTORATION GOALS 101

Western Association of Fish and Wildlife Agencies March 2017
The 2016 Lesser Prairie-Chicken Range-wide Conservation Plan Annual Progress Report Page 4
HABITAT AVAILABILITY GOALS 102
PROGRESS TOWARDS PERMANENT CONSERVATION GOALS 102
FINANCIAL SUMMARY. 105
RESPONSIBLE PARTIES FOR RWP ADMINISTRATION 108
COMMITTEE COMPOSITION 109
COMMITTEE RESPONSIBILITIES 110
COMMITTEE MEETINGS 111
REPORTING PERIOD 111
STAFFING 112
RESEARCH PRIORITIES 113
LITERATURE CITED 115 APPENDICES 118 APPENDIX A. PUBLIC LAND AND CONSERVATION PROGRAM ACREAGE WITHIN EACH LPC CHAT 1
(FOCAL AREA) REPORTING UNIT, 2016.
APPENDIX B. PUBLIC LAND AND CONSERVATION PROGRAM ACREAGE WITHIN EACH LPC CHAT 2
(CONNECTIVITY ZONE) REPORTING UNIT, 2016.
APPENDIX C. ANNUAL CROPLAND RESTORATION AND REMEDIATION ACREAGE
ACCOMPLISHMENTS AND LONG-TERM GOALS WITHIN EACH LPC CHAT 1 (FOCAL AREA)
REPORTING UNIT, 2016.
APPENDIX D. ANNUAL CROPLAND RESTORATION AND REMEDIATION ACREAGE
ACCOMPLISHMENTS AND LONG-TERM GOALS WITHIN EACH LPC CHAT 2 (CONNECTIVITY ZONE)
REPORTING UNIT, 2016.
APPENDIX E. FOCAL AREA REPORTING UNITS SORTED BY PERCENT IMPACT AS OF JANUARY 1,
2016.
APPENDIX F. CONNECTIVITY ZONE REPORTING UNITS SORTED BY PERCENT IMPACT AS OF
JANUARY 1, 2016.
APPENDIX G. LESSER PRAIRIE-CHICKEN ADVISORY COMMITTEE ANNUAL REPORT AND RWP
COMMITTEE INFORMATION

Western Association of Fish and Wildlife Agencies March 2017
The 2016 Lesser Prairie-Chicken Range-wide Conservation Plan Annual Progress Report Page 5
EXECUTIVE SUMMARY
In 2014, a new era in wildlife conservation was ushered in with the implementation of the Lesser
Prairie-Chicken (LPC) Range-wide Conservation Plan (Van Pelt et al. 2013; RWP). The RWP
describes a locally controlled and innovative approach for maintaining state authority to conserve
the LPC.
The purpose of the RWP is to articulate a conservation strategy for the LPC that that ensures the
improvement and long-term persistence of the species into the foreseeable future (50 years)
throughout its current or expanded range. More specifically, the RWP:
1. Identifies range-wide and ecoregion breeding population goals for LPC, the range-wide
benchmark being a 10-year average of 67,000 birds
2. Identifies desired habitat amounts and conditions to achieve the population goal within the
first 10-year timeframe
3. Uses the Southern Great Plains Crucial Habitat Assessment Tool (CHAT) to identify
priority areas where LPC conservation actions will be emphasized and development will
be minimized
4. Enhances programs and cooperative efforts to encourage and expand voluntary landowner
conservation programs
5. Promotes agreements that incentivize industry avoidance and minimization and require
mitigation when that is not possible
6. Establishes a mitigation framework administered by WAFWA that includes contractual
agreements with participating companies and private landowners. The framework requires
unavoidable impacts to be offset with off-site conservation actions and utilizes a 2:1
mitigation ratio to ensure that a net conservation benefit occurs.
7. Identifies research needs and implements monitoring of the LPC population and enrolled
properties
8. Outlines an adaptive management framework that will maximize conservation benefits to
LPC by incorporating monitoring data and emerging science
9. Incorporates input received from agencies, organizations, landowners, industries, other
stakeholders, and the public
During the reporting period, January 1, 2016 - December 31, 2016, significant progress was
achieved across all nine elements identified in the RWP. More specifically:

Western Association of Fish and Wildlife Agencies March 2017
The 2016 Lesser Prairie-Chicken Range-wide Conservation Plan Annual Progress Report Page 6
1. The annual LPC aerial survey used to monitor progress toward the population goals was
conducted between March and May 2016. In 2016, the estimated breeding population size
was 25,651 (90% CI: 18,692–34,991). While there was an estimated range-wide population
decline of 14.5% from 2015 to 2016, the point estimates did not statistically differ (P >0.1).
Increases in abundance of LPC were estimated in two of the four ecoregions.
The largest was a statistically significant 263.3% increase in the Shinnery Oak
ecoregion, (P < 0.1). The survey indicated that the population in the Sand Sagebrush
ecoregion increased by 64.9% from 2015 but the change was not statistically significant (P
>0.1). The populations in the Mixed Grass and Shortgrass ecoregions were estimated to
have decreased by 31.3% and 22.8% from 2015, respectively. However, neither of those
estimated declines were statistically significant (P > 0.1). Data from the 2016 aerial survey
generally indicate that the population remained stable from the previous year except in the
Shinnery Oak where a significant increase was observed.
2. During this reporting period, WAFWA secured two permanent conservation sites. The first
site consists of 1,781 acres of privately owned native rangeland in the Mixed Grass
ecoregion of which 1,670 acres are in CHAT 1. WAFWA purchased a perpetual easement
(held by Pheasants Forever) on the property that preserves the conservation values of the
site. Those conservation values include both the LPC habitat and the ranching heritage.
WAFWA also developed a dynamic management agreement that will be implemented in
perpetuity by the landowner. There have been two different LPC lek sites documented on
this property or within 3 miles of its perimeter within the last 5 years
WAFWA also acquired the title to a 29,718-acre ranch in the Sand Sagebrush ecoregion.
This ranch was acquired by WAFWA from a willing seller in June 2016. The entirety of
the property consists of native sand sagebrush prairie and all but 124 acres occur in CHAT
1. Despite minimal survey efforts, there have been 5 different LPC lek sites documented
on the acquired property or within 3 miles of its perimeter within the last 5 years. The
property will meet all the criteria to be considered a stronghold upon completion of all the
required documentation. WAFWA will continue to manage the property as a working
cattle ranch using livestock as the primary tool to create optimum LPC habitat. The grazing
rights on the ranch are currently leased to a private producer.
In addition to these two new acquisitions, WAFWA had previously secured an additional
1,554-acre permanently conserved site in the Shinnery Oak Ecoregion. WAFWA is also
conserving 100,650 additional acres across thirteen active 10-year term contracts. Three
of those term contracts covering 5,602 acres were executed during the last year. At the end
of 2016, WAFWA was conserving 16 sites totaling 133,703 acres of which 33,053 acres
are permanently protected by perpetual easements or fee title ownership.
3. During 2016, significant progress was made in database development and
accessibility. The highlights include an integration of impact and conservation sites into a
relational ArcSDE SQL database that processes nightly scripts to ensure all impacts are
offset by an appropriate conservation site. Also, a custom website was developed that
Western Association of Fish and Wildlife Agencies March 2017
The 2016 Lesser Prairie-Chicken Range-wide Conservation Plan Annual Progress Report Page 7
provides participant companies a way to submit and approve new projects as well as view
all past submissions. WAFWA and the U.S. Fish and Wildlife Service (USFWS) can also
use the web interface to query the database for site-specific summary statistics, habitat
credit balances, and raw data.
In the 2015 annual report, WAFWA identified irregularities between the GIS data of
enrolled acres and the acreage declared by companies when enrolling. WAFWA
announced at that time that it was going to conduct an audit of enrolled acres during
2016. This audit was necessary to rectify conflicting figures between the number of
contractual acres enrolled and the spatial data that were submitted by participating
companies. Several issues were identified and upon further examination, there was a net
decrease of reportable enrolled acres. Factors that contributed to this reduction included
the duplicate submittal of acreage by companies, submittal of incorrect spatial data by
companies, an erroneous submission of an entire service area by a participating co-op, and
an early data processing error by WAFWA that created enlarged transmission line buffers
to represent right of way widths.
The audit resulted in a net decrease of reported enrollment acres from approximately 10.4
million acres in 2015 to approximately 8.1 million acres in 2016, a difference of 2.3 million
acres. Approximately 1.6 million acres of this difference came from correcting electrical
enrollment data, and approximately 540,000 acres were eliminated because of corrections
to oil/gas parcel boundaries. These changes had little effect on enrollment fees paid/due to
WAFWA because a majority of the corrections were associated with linear enrollments for
which participants pay a flat fee to participate in the RWP. Only ~165,000 (1.6%) acres
were lost due to terminations and sale of acres to companies that were not enrolled in the
RWP and hence were transferred out of the program (after paying all enrollment fees).
4. A 2-year renewable agreement with Pheasants Forever (PF) was signed to partially fund
five positions located throughout the LPC range. This is a cooperative effort between
NRCS, Pheasants Forever (PF) and WAFWA and he supported positions will assist all
the partnering entities with program promotion, monitoring activities, and conservation
planning.
5. There were 114 active CCAA contracts (Certificates of Inclusion) and 57 active WCA
contracts (Certificates of Participation) as of December 31, 2016. WAFWA recognized
that many of the participant companies were undergoing severe financial hardship in the
face of an economic downturn that resulted in near stoppage of oil and gas development in
the region. That drop in oil and gas prices and associated development activities rippled
throughout most of the other industries enrolled in the RWP.
WAFWA’s goal has been to retain as many companies in the program as possible,
despite financial hardship. To further that goal, WAFWA developed a procedure in July
of 2016 to address non-payment of enrollment fees. That procedure offered options to
those companies, including payment plans and partial or full terminations. Payment plans

Western Association of Fish and Wildlife Agencies March 2017
The 2016 Lesser Prairie-Chicken Range-wide Conservation Plan Annual Progress Report Page 8
require payment of interest sufficient to cover the assumed 4% rate of return of the
conservation endowment and any additional costs for WAFWA. The term of those plans
can be up to three years for each remaining year of unpaid enrollment fees. If a company
agrees to a payment plan and remains current, the compliance issue is considered
resolved and WAFWA notifies USFWS of that resolution. WAFWA’s procedure allows
for some settlement of enrollment fees for partial or full terminations if the company can
document severe financial hardship and can demonstrate that threats to the species from
their activities are addressed on the parcels to be terminated.
6. In 2016, there were 114 industry projects processed and mitigated. These projects
generated 3,179 annual impact units equating to $4,172,852.64 in mitigation fees. By
ecoregion, the Shinnery Oak region had the most projects (73 of 114 projects; 64%),
however, the Mixed Grass ecoregion was the most impacted (3,069 of 3,179 impact units;
96.5%). This difference was due to the fact that most of the impacts in the Shinnery Oak
ecoregion were infield drilling sites with little new impact compared to two wind power
facilities that were mitigated in the Mixed Grass ecoregion. There continues to be a
surplus of credits available with a range-wide positive value of 71,639 units. The
distribution of available credits at the end of this reporting period was as follows: Sand
Sagebrush (14,620), Shinnery Oak (15,366), Mixed Grass (37,279), and Short-grass
(4,374).
7. There was continued effort to work with state wildlife agencies to identify and pursue
research and management needs. Those activities included LPC translocation efforts that
move birds from the shortgrass to sand sagebrush ecoregion. The partnership is also
supporting research projects that are evaluating various land cover data, impacts of
energy development on LPC space use, LPC movements, and climate-related effects to
LPC populations.
8. WAFWA continued to monitor the need for adaptive management and identified or
implemented two changes (Electric Distribution Proposal and Landowner Fee Increases
for Certain Practices) to the program in 2016. In July, the Lesser Prairie-Chicken Initiative
Council (LPCIC) approved changes to the requirements to bury electric distribution lines.
Those changes were the culmination of a cooperative effort that included most of the
electric distribution cooperatives across the LPC range. It also created a system that allows
cooperatives to acquire credit for removing above ground electric lines providing a net
conservation benefit for the species. The effort used WAFWA lek database and extensive
proprietary electric data from the cooperatives to identify areas where above ground lines
might be built with minimal impact to the species. Prior to approval by the LPCIC, these
adaptive management changes were reviewed by the Science Sub-committee. The Science
Sub-committee provided comments on the proposal to the LPCAC without providing a
consensus recommendation. The LPCAC approved the proposal after reviewing the
Science Sub-Committee comments and submitted it to the LPCIC which gave final
approval.

Western Association of Fish and Wildlife Agencies March 2017
The 2016 Lesser Prairie-Chicken Range-wide Conservation Plan Annual Progress Report Page 9
The second adaptive management action in 2016 was a modification of the mitigation unit
values that the RWP utilizes to calculate mitigation costs and conservation payments in
each ecoregion. This process was initiated with a proposal that was developed by WAFWA
staff and provided to the Lesser Prairie-Chicken Fee Structure Sub-committee (LPCFSS)
for review and discussion. The proposal consisted of the current costs to implement all the
necessary conservation practices as determined by WAFWA staff. It also included the new
unit values that would take effect if the proposed payment rates were implemented. The
LPCFSS discussed the proposal and recommended that it be forwarded with minor
revisions to the Lesser Prairie-Chicken Advisory Committee (LPCAC). WAFWA staff
prepared a revision and presented it to the LPCAC on a conference call in February 2016.
The LPCAC made a recommendation to the LPCIC to approve the proposal as written.
The LPCIC approved the proposal at their March 2016 meeting with an effective date of
January 1, 2017. On that date, the mitigation unit values increased as follows: Mixed Grass
(2.1%), Shortgrass (2.7%), Shinnery Oak (1.3%), and Sand Sagebrush (3.0%).
9. Through the LPCAC, representatives from industry, non-governmental agencies, as well
as state and federal agencies addressed input and suggestions from agencies,
organizations, landowners, industries, other stakeholders and the general public on the
RWP. The LPCAC made recommendations to the LPCIC on multiple topics including
the adaptive management topics previously outlined.

Western Association of Fish and Wildlife Agencies March 2017
The 2016 Lesser Prairie-Chicken Range-wide Conservation Plan Annual Progress Report Page 10
The 2016 Lesser Prairie-Chicken Range-wide Conservation Plan Annual
Progress Report
Edited by:
Roger L. Wolfe, Lesser Prairie-Chicken Program Manager
Western Association of Fish and Wildlife Agencies
INTRODUCTION
This report summarizes the 2016 activities associated with the lesser prairie-chicken (LPC,
Typmanuchus pallidicinctus) range-wide conservation plan (RWP) administered by the Western
Association of Fish and Wildlife Agencies (WAFWA, Van Pelt et al. 2013). The goal of the
RWP is to conserve the LPC for future generations while facilitating continued and uninterrupted
economic activity throughout the entire five-state LPC range (Figure 1). The RWP identifies a
two-pronged strategy for LPC conservation: (1) the coordinated implementation of incentive-
based landowner programs and (2) the implementation of a mitigation framework, which reduces
threats and provides resources for off-site conservation activities.
If conservation of the LPC is to show long-term success, a strong and mutually respective
partnership will be necessary between state, federal, non-governmental agencies; private
landowners; and industry. The foundation of that partnership is embedded in Section 6 of the
Endangered Species Act (ESA). This section clearly directs the U.S. Fish and Wildlife Service
(USFWS) to cooperate to the maximum extent practicable with state fish and wildlife agencies,
and provides them with the authority to carry that partnership forward. That partnership guided
the development of the RWP which now provides a clear road map for conserving the LPC.
BACKGROUND
The USFWS was petitioned to list the LPC by the Biodiversity Legal Foundation in 1995 due to
a declining population, range reduction, and increasing habitat impacts (USFWS 1997). In 1998,
the USFWS determined that the species was warranted listing but precluded because of actions
needed for higher priority species (USFWS 2012). The USFWS assigned the LPC a listing
priority number of 8 (1 indicating the highest need for action and 12 the lowest). A candidate
review conducted by USFWS in 2008 increased that priority number to 2 due to an increased
threat of wind power and transmission line development within the LPC occupied range
(USFWS 2012).

Western Association of Fish and Wildlife Agencies March 2017
The 2016 Lesser Prairie-Chicken Range-wide Conservation Plan Annual Progress Report Page 11
Figure 1. Current estimated occupied range plus 10 miles (EOR+10) of the lesser prairie-chicken
and the four ecoregions delineated by the Western Association of Fish and Wildlife Agencies.

Western Association of Fish and Wildlife Agencies March 2017
The 2016 Lesser Prairie-Chicken Range-wide Conservation Plan Annual Progress Report Page 12
On December 11, 2012, the USFWS issued a proposed rule that would list the LPC as threatened.
Their primary justification included historical, ongoing, and probable future impacts of cumulative
habitat loss and fragmentation. These impacts are the result of: conversion of grasslands to
agricultural uses; encroachment by invasive woody plants; wind energy development; petroleum
production; and presence of roads and man-made vertical structures including towers, utility lines,
fences, turbines, wells, and buildings. The USFWS proposed listing the LPC as threatened with a
final listing decision scheduled for no later than September 30, 2013 (USFWS 2012).
On May 6, 2013, the USFWS issued a proposed special rule under the authority of section 4(d) of
the ESA. A comment period on the proposed listing rule was opened to provide an opportunity for
the public to simultaneously provide comments on the proposed listing rule with a proposed special
rule, and a draft range-wide conservation plan for the LPC prepared by the five state wildlife
agencies in collaboration with WAFWA.
On July 9, 2013, the USFWS announced a 6-month extension of the final listing determination
based on their finding that there was substantial disagreement regarding the sufficiency or accuracy
of the available data relevant to their determination regarding the proposed listing rule. The Service
reopened the comment period to solicit additional information.
On October 23, 2013, the USFWS endorsed the RWP as “a comprehensive conservation plan
that reflects sound conservation design and strategy that, when implemented will provide a net
conservation benefit to the lesser prairie-chicken.” Following that endorsement, the USFWS
reopened the comment period on a revised proposed special 4(d) rule and the proposed listing
rule.
On March 27, 2014, the USFWS published a final rule listing the LPC as a threatened species
under the ESA of 1973, as amended (USFWS 2014). In addition, the USFWS published a final
special rule under section 4(d) of the ESA for the LPC. The final 4(d) special rule provided that
take incidental to activities conducted by a participant enrolled in, and operating in compliance
with, the LPC Interstate Working Group’s RWP would not be prohibited (Van Pelt et al. 2013).
This rule became effective May 12, 2014.
On September 1, 2015, the U.S. District Court in the Western District of Texas vacated the
USFWS rule in response to a suit filed by the Permian Basin Petroleum Association and four
New Mexico counties. The suit claimed, in part, that the USFWS did not fully evaluate voluntary
conservation efforts for LPC under the USFWS Policy for Evaluation of Conservation Efforts
(PECE) prior to making the decision to list the species as threatened under the ESA. On July 19,
2016, the USFWS officially removed the LPC from the list of threatened and endangered species
in fulfillment of the September 1, 2015 U.S. District Court order.
On September 8, 2016, a petition was filed by WildEarth Guardians, Defenders of Wildlife and
the Center for Biological Diversity asking the USFWS to re-list the LPC under the ESA. This
petition also requested that sub-populations of LPC located in the shinnery oak and sand
sagebrush ecoregions be considered for emergency listing.

Western Association of Fish and Wildlife Agencies March 2017
The 2016 Lesser Prairie-Chicken Range-wide Conservation Plan Annual Progress Report Page 13
On November 30, 2016, the USFWS published a notice in the Federal Register in response to
the September 8, 2016 listing petition. The USFWS found that the petition presented substantial
positive information and therefore they would undergo the 12-month review process. During
this 12-month review, a Species Status Assessment of the LPC will also be conducted.
CONSERVATION STRATEGY
The RWP describes a conservation strategy, which when implemented, will support sustainable
populations of LPC. The strategy identifies 10-year habitat and population goals that are
sufficient in size and juxtaposition to provide adequate population resiliency and redundancy...
The RWP also improves coordination and conservation targeting across all the agencies and
organizations who are delivering programs on private land. Additionally, the RWP promotes
avoidance and minimization of impacts to LPC habitat and establishes a process for RWP
industry participants to mitigate their actions when necessary.
A key component of the RWP conservation strategy is applying the concept of focal areas and
connectivity zones. This concept identifies the areas of greatest importance to the LPC, and focuses
conservation efforts into those areas.
The strategy emphasizes delivery of habitat improvement in focal areas and connectivity zones
by maximizing incentives to encourage those landowners to engage in LPC habitat maintenance
and improvement.
Another important component of the strategy is identification of tools that help industry with siting
decisions and development of a compensatory mitigation program that RWP participants can
utilize when they are unable to avoid impacts to LPC habitat.
WAFWA MITIGATION AND METRICS SYSTEM
The WAFWA Mitigation Framework incentivizes avoidance and minimization of impacts to
LPC habitat from development. The metrics system within this framework provides a pathway to
mitigate for impacts to habitat through a biologically-based system that incorporates space, time
and habitat quality to define both habitat impact units and habitat offset units. A habitat impact is
defined as: potential LPC habitat that has been rendered unusable by LPCs based on direct or
indirect habitat loss related to development. A habitat offset is defined as: an area of potential LPC
habitat that is conserved and managed or restored to compensate for impacted habitat. Impacts are
considered permanent, unless remediation back to baseline occurs. The mitigation system also
utilizes a 2:1 mitigation ratio to ensure that offsets are greater than impacts, resulting in a net
conservation benefit for the LPC.
The WAFWA Mitigation Framework functions as a platform to balance impact and habitat offset
units in that a portion of the offset units are allocated at the sign-up based on current acreage and
habitat quality. Additional offset units are generated annually and the quantity is reflective of
potentially usable acreage and habitat quality. The landowner is incentivized to manage for quality
habitat because their annual payment is based on the acreage and Habitat Evaluation Guide (HEG)
score of the enrolled property. If the participant does not follow the recommended management
plan for the property, the offset units will be reduced, as will the annual payment to the participant.

Western Association of Fish and Wildlife Agencies March 2017
The 2016 Lesser Prairie-Chicken Range-wide Conservation Plan Annual Progress Report Page 14
This performance-based system ensures participants are not paid in advance for un-generated
offset units.
Offset units will be generated by enrolling a property into an agreement with WAFWA or one of
its technical service providers. Participants may enroll in short-term (5-10 year) agreements or in
long-term agreements requiring an easement. The value of 25% of the habitat offset units will be
targeted towards permanent conservation to support long-term conservation and population
strongholds. The remaining 75% of the conservation efforts will be targeted towards short-term
contracts (5-10 years), which represent permanent conservation that may shift around on the
landscape within the targeting goals of the RWP and the SGP CHAT. Finally, the WAFWA
mitigation system incentivizes the remediation of impacts that are not permanent on the
landscape by providing the opportunity to generate offset units that can count toward new
developments elsewhere. The 25/75 ratio of long and short-term offset units will be evaluated
through the adaptive management process and may need to be adjusted in the future.
ADAPTIVE MANAGEMENT
Adaptive management is defined as a formal, structured approach to dealing with uncertainty in
natural resource management, using the experience of management and the results of research as
an ongoing feedback loop for continuous improvement. Adaptive approaches to management
recognize that the answers to all management questions are not known and that the information
necessary to formulate answers is often unavailable. Adaptive management also includes, by
definition, a commitment to change management practices when deemed appropriate within the
guidelines of the RWP.
Adaptive management is a dynamic process that helps reduce uncertainty in natural resource
management by incorporating into flexible conservation plans new information as it becomes
available. Adaptive management strategies allow for mutually agreed-upon changes to the
conservation measures to occur in response to changing conditions or new information, including
those identified during monitoring. The primary reason for using adaptive management in the
RWP is to allow for changes in the conservation measures that may be necessary to reach the stated
long-term goals. Under adaptive management, the mitigation and conservation activities
implemented under the RWP will be monitored to identify whether they are producing the required
results. Additionally, adaptive management activities affecting the implementation of the RWP
will be influenced by emerging science and RWP implementation that fills existing knowledge
gaps. Those two types of information will be used to guide adjustments in implementation of the
RWP. To date, the adaptive management process in the RWP can generally be broken into two
categories. The first category is directed at ensuring the program maintains its progress toward
LPC habitat and populations goals. The second is directed at enhancing participation by industry
by avoidance and minimization of impacts on LPC populations and habitat by industry
development, operations and maintenance
The RWP identifies a series of activities or situations that will trigger the adaptive management
process or specific conservation actions for LPC, as well as the timelines that those activities or
situations will be evaluated (see Table 10 on page 110-121 in the RWP). There are eight individual

Western Association of Fish and Wildlife Agencies March 2017
The 2016 Lesser Prairie-Chicken Range-wide Conservation Plan Annual Progress Report Page 15
variables in that list which are to be evaluated on an annual scale:
1) Administrative fee—WAFWA reports on the sustainability of the administrative
endowment in the annual reports (see the financial summary). In 2016, WAFWA did not adjust
the administrative fee.
2) Individual technical service provider (TSP) compliance—Starting in May 2014, WAFWA
has held five technical service provider training courses and has trained 267 individual TSPs on
the use of spatial data available on the SGP CHAT website and the process for conducting field
habitat evaluations. Certified TSPs submit habitat evaluations to the WAFWA GIS lab for
review. These evaluations include photo points allowing for visual confirmation of collected
data. No TSP compliance issues were identified in 2016.
3) Population size—WAFWA conducts annual population monitoring and a detailed
description is included in this report. Populations are evaluated on a three-year moving average,
and 2016 was the first window for evaluating the average for adaptive management triggers.
4) Conservation Practice Costs—As identified in the RWP, WAFWA established the LPC
Fee Structure Sub-committee (LPCFSC) and held the inaugural meeting on November 18,
2014. It was determined that more information was needed on how payments tied to practices
were perceived by landowners based on their acceptance of contracts. After another year of RWP
implementation, another meeting of the LPCFSC was held on October 19, 2015. Upon
presenting the information, WAFWA began development of a proposal recommending changes
in conservation practice costs and the proposal was shared with the working group on December
7, 2015. The LPCFSC accepted the proposed changes and forwarded it to the LPCAC for action
in 2016.
5) Emerging science—The RWP identified a Science Sub-committee, (LPCSSC), reviews
and informs the LPC Advisory Committee on LPC science-related issues. Their reviews were
incorporated into adaptive changes forwarded to the LPCAC and are summarized below.
6) Tangible mitigation unit offset ratio— The mitigation unit offset ratio in the RWP
considers both acres and potential habitat quality of acres impacted and conserved. This
combination of acres and habitat quality are represented as annual habitat units. This report
contains an annual analysis of the acres impacted by industry development, habitat quality of those
impacted acres and compares that to the acres conserved and the habitat quality of those acres. The
comparisons are conducted on the scale of ecoregions, SGP CHAT categories, and reporting units.
7) Quality of the offset acreage—The habitat metric system defined in the RWP evaluates
habitat quality for offset acreage on an annual basis. A summary of habitat quality is included in
this report.
8) Habitat restoration goals—The RWP uses a system of focal areas and connectivity zones
with goals of 70% suitable habitat in the focal areas and 40% in the connectivity zones. To achieve
those goals, LPC habitat must be restored and maintained. Many LPC conservation programs
across the region now use the SGP CHAT to target conservation efforts. This report will include
an annual evaluation of those goals considering the restoration efforts of all conservation programs
that provide data for that analysis. The strength of this approach is that common targeting helps
leverage conservation efforts and funding with efforts from partner organizations.
Rigorous evaluations of habitat quantity, sustainability of the conservation endowment,
conservation practices, avoidance of high priority CHAT categories, and strongholds are scheduled

Western Association of Fish and Wildlife Agencies March 2017
The 2016 Lesser Prairie-Chicken Range-wide Conservation Plan Annual Progress Report Page 16
for 2018. WAFWA also committed to expedited timelines for permanent conservation which will
be evaluated after the 2016 reporting period. However, this report contains information on the
progress towards each of the stated goals.
In addition to the evaluation periods defined in the RWP, WAFWA also brought other adaptive
management issues before the committees in 2016. Those issues pertained to distribution line
burial requirements and mitigation unit values. The adaptive management changes associated with
those issues will be discussed in further detail in this report.
INDUSTRY PARTICIPATION
The RWP is designed to include conservation measures that eliminate and/or reduce threats by
land uses including mineral, oil/gas, and, wind-energy developments, agricultural practices, and
civil infrastructure (including transmission and distribution lines, radio/cell towers, water lines,
and roads) on state and private property.
LEK SURVEYS FOR PROJECT CLEARANCE
Under the RWP, participant companies may conduct lek surveys to address restrictions under the
conservation measures in the WCA and the WAFWA Oil and Gas Candidate Conservation
Agreement with Assurances (CCAA). For areas within the EOR+10 that have not been surveyed
for LPC (assume LPC presence) or are within 1.25 miles of a known lek, the conservation measures
restrict activities during the breeding season where humans are present during the hours of 3 A.M.
to 9 A.M., noise levels for facilities constructed and mitigated for under the WCA and CCAA,
restrict off road travel in rangeland or planted grass and require the marking of fences. Participants
have the option of considering an area occupied with active leks and following those restrictions
or conducting lek surveys as defined in the lek survey protocol, which covers both aerial and
ground-based surveys (see Appendix H and adaptive management section in the RWP).
To receive a project clearance determination from WAFWA, survey data must be submitted to
WAFWA and the data is checked to confirm it meets the lek survey protocol requirements. Project
clearance surveys will have the appropriate buffers added (1 mile for ground surveys and 200m
for aerial surveys), which are included in the lek survey layer on the CHAT website and are made
available for public use for project planning. WAFWA updates this layer annually once all lek
survey data is received and summarized in August. WAFWA uses this layer, and all lek survey
information received, to assess survey coverage of proposed development projects. The survey
coverage determines if breeding season restrictions apply. Surveys are considered valid for five
breeding seasons.
In the spring of 2016, 12 companies conducted independent lek surveys for project clearance,
while state and federal agencies did surveys for LPC leks. In addition, a cooperative effort funded
through contributions of the members of the Oklahoma Independent Producers Association and
Oklahoma Department of Wildlife Conservation began lek surveys intended to cover the EOR+10
within the State of Oklahoma. The total coverage of these 2016 surveys was 5,216,391 acres within
the EOR+10 (Table 1, Figure 2). The total area covered by surveys considered as “active” (2012-
2016) is 12,733,680 acres or 31.5% of the EOR+10 (Table 2). Companies, state and federal

Western Association of Fish and Wildlife Agencies March 2017
The 2016 Lesser Prairie-Chicken Range-wide Conservation Plan Annual Progress Report Page 17
agencies conduct lek surveys based on their own needs and many, if not most, of these surveys are
non-random. Inferences on these data for local, regional, or range-wide LPC populations should
not be made.
All lek detections from project clearance surveys are included in the WAFWA lek database, along
with lek locations from the range-wide population surveys and those reported from state agencies
and other data sources. If a new detection is recorded in an area that was surveyed in a prior year
without detections, that new lek location supersedes the previous data and breeding season
restrictions apply within 1.25 miles of that location for a minimum of five breeding seasons from
the last detection. This database currently includes 3,056 lek observations recorded between 2005
and 2016, with 1,539 being from 2012-2016 and are considered “current leks” using the 5-year
definition within the RWP. This total represents raw lek observations, and may include the same
lek observed across multiple years. There were 210 leks observed during the 2016 survey season
based on the data submitted to WAFWA (Figure 3). Of those leks observed between 2005 and
2016 (3,056 total) 2,305 were in CHAT 1 (75.4%), 304 were in CHAT 2 (9.9%), 355 were in
CHAT 3 (11.6%), and 73 in CHAT 4 (2.4%) and 19 were outside of the EOR+10 (0.6%). Leks
outside the EOR+10 were in northwest Kansas (18), and one lek was just across the border in
Colorado. Of those leks outside the EOR+10 in Kansas, four were identified by KDWPT through
ground surveys and 14 were identified from aerial surveys. Since this area of NW KS also has
greater prairie chickens, the certainty that these are lesser prairie chickens has been raised and
future aerial sightings in this region will be assessed with follow up ground observations.
Additional updates to leks and the surveyed areas may occur after August if new data is identified.
Data users are encouraged to check the SGP Chat website and data portal to ensure they have the
most current data available for their planning.
INDUSTRY ENROLLMENT AUDIT
As reported in the 2015 Annual Report, WAFWA has conducted a spatial audit of all enrollments
for the WCA and CCAA agreements. In 2014, prior to the listing decision, millions of acres were
enrolled by companies over a period of six weeks. The spatial data for parcel enrollments was
provided by the companies in a variety of different formats including legal descriptions, GIS
shapefiles, Google Earth.kml/kmz files, CAD files and even hand drawn maps. Each of these data
types required different methodologies to compile the data into a single database. Legal
descriptions and hand drawn maps required digitizing. GIS shapefiles were submitted in a variety
of different projections. Google Earth files and CAD files do not have a projection and require
geo-referencing. At the time of these enrollments, WAFWA had two full-time staff and occasional
interns to incorporate these data into a single database, while also addressing project submissions
and mitigation of those projects. To process enrollments and invoice the companies for their
enrollment fees, WAFWA allowed the participant companies to declare the number of acres
enrolled and used this acreage for billing.

Western Association of Fish and Wildlife Agencies March 2017
The 2016 Lesser Prairie-Chicken Range-wide Conservation Plan Annual Progress Report Page 18
Table 1. Summary of acreage covered by lek surveys in 2016 by ecoregion and CHAT category. Most
surveys are designed for industry clearance, but some are standard lek surveys by state/federal agencies.
Ecoregions CHAT Year Acres % of area
Shortgrass Prairie 1 2016 50,829.20 2.7%
Shortgrass Prairie 2 2016 0.00 0.0%
Shortgrass Prairie 3 2016 39,471.43 2.2%
Shortgrass Prairie 4 2016 18,844.45 0.4%
Shortgrass total 2016 109,145.08 1.3%
Sand Sagebrush Prairie 1 2016 288,718.50 18.2%
Sand Sagebrush Prairie 2 2016 30,950.61 12.6%
Sand Sagebrush Prairie 3 2016 46,569.82 2.5%
Sand Sagebrush Prairie 4 2016 18,007.64 0.4%
Sand Sagebrush total 2016 384,246.57 4.8%
Mixed Grass Prairie 1 2016 461,265.29 17.9%
Mixed Grass Prairie 2 2016 304,265.49 27.3%
Mixed Grass Prairie 3 2016 1,748,731.69 33.7%
Mixed Grass Prairie 4 2016 230,553.61 6.1%
Mixed Grass total 2016 2,744,816.07 21.7%
Shinnery Oak Prairie 1 2016 451,047.78 43.1%
Shinnery Oak Prairie 2 2016 220,289.88 24.7%
Shinnery Oak Prairie 3 2016 1,139,010.97 19.3%
Shinnery Oak Prairie 4 2016 167,834.78 5.3%
Shinnery Oak total 2016 1,978,183.42 17.9%
EOR+10 1 2016 1,251,860.76 17.7%
EOR+10 2 2016 555,505.98 22.8%
EOR+10 3 2016 2,973,783.91 20.2%
EOR+10 4 2016 435,240.49 2.7%
EOR+10 Grand total 2016 5,216,391.14 12.9%

Western Association of Fish and Wildlife Agencies March 2017
The 2016 Lesser Prairie-Chicken Range-wide Conservation Plan Annual Progress Report Page 19
Table 2. Summary of acreage covered by lek surveys performed in 2012-2016 (current active survey
area).
Ecoregions CHAT Year Acres % of area
Shortgrass Prairie 1 2012-2016 133,174.72 7.1%
Shortgrass Prairie 2 2012-2016 18,098.13 9.9%
Shortgrass Prairie 3 2012-2016 94,073.41 5.3%
Shortgrass Prairie 4 2012-2016 73,939.63 1.5%
Shortgrass total 2012-2016 319,285.89 3.7%
Sand Sagebrush Prairie 1 2012-2016 646,067.27 40.8%
Sand Sagebrush Prairie 2 2012-2016 112,455.82 45.9%
Sand Sagebrush Prairie 3 2012-2016 624,341.34 33.2%
Sand Sagebrush Prairie 4 2012-2016 357,357.70 8.3%
Sand Sagebrush total 2012-2016 1,740,222.13 21.7%
Mixed Grass Prairie 1 2012-2016 1,348,770.75 52.4%
Mixed Grass Prairie 2 2012-2016 705,121.90 63.2%
Mixed Grass Prairie 3 2012-2016 3,367,671.14 64.9%
Mixed Grass Prairie 4 2012-2016 801,945.31 21.3%
Mixed grass total 2012-2016 6,223,509.10 49.2%
Shinnery Oak Prairie 1 2012-2016 565,020.20 54.0%
Shinnery Oak Prairie 2 2012-2016 533,734.38 59.8%
Shinnery Oak Prairie 3 2012-2016 2,617,608.59 44.2%
Shinnery Oak Prairie 4 2012-2016 734,300.11 23.1%
Shinnery Oak total 2012-2016 4,450,663.29 40.3%
EOR+10 1 2012-2016 2,693,032.95 38.0%
EOR+10 2 2012-2016 1,369,410.24 56.2%
EOR+10 3 2012-2016 6,703,694.48 45.4%
EOR+10 4 2012-2016 1,967,542.75 12.2%
EOR+10 total 2012-2016 12,733,680.41 31.6%

Western Association of Fish and Wildlife Agencies March 2017
The 2016 Lesser Prairie-Chicken Range-wide Conservation Plan Annual Progress Report Page 20
Figure 2. Lek surveys conducted in 2016 (new), 2012-2015 (active), and 2011 (just expired) across the
estimated occupied range of the lesser prairie-chicken with a 10-mile buffer (EOR+10).

Western Association of Fish and Wildlife Agencies March 2017
The 2016 Lesser Prairie-Chicken Range-wide Conservation Plan Annual Progress Report Page 21
Figure 3. Leks identified in 2016 compared with those identified in 2012-2015 (still considered active) and
leks last observed in 2011 or prior which are considered historic leks.

Western Association of Fish and Wildlife Agencies March 2017
The 2016 Lesser Prairie-Chicken Range-wide Conservation Plan Annual Progress Report Page 22
The CCAA and WCA also cover non-parcel based point and linear data such as electric lines and
pipelines, as well as industrial sites such as compressor stations, trucking sites, gas plants, etc.
Each of these enrollment types use a fixed enrollment rate that is not based on a declared acreage.
These data were also submitted in a variety of data sources, and required incorporation and
consolidation into a single database. These enrollments also required buffering these features by a
fixed distance (15.25 meters, 50 feet) to represent the approximate right of way (30 meters/100feet)
and to enable reporting as enrolled acres.
Following the listing decision, WAFWA began incorporating and consolidating those enrollments
into a single GIS database. That process resulted in differences in the declared enrolled acreage
and the GIS acreage for parcel enrollments. These differences can arise from differences in spatial
projections, digitizing errors, calculation errors from both WAFWA and from the companies,
including some related to industry specific software for managing parcel data. However, WAFWA
staff were primarily focused on implementing the agreements and developing processes for that
implementation. In late 2015and throughout 2016, WAFWA staff began comparing and resolving
differences between the declared acreage in the accounting databases and the spatial database. This
process involved reviewing the initial enrollment data to confirm the declared acreage was
consistent with enrollment information, reviewing the projected or digitized spatial data in the
WAFWA database to ensure it was incorporated correctly, and sharing both data sources with the
participant company to confirm.
The enrollment audit process was very successful in resolving data discrepancies between what
was submitted as enrolled and what was intended to be enrolled. By working with each company
for the last two years to review data submitted and resolve discrepancies, the audit discovered and
resolved several major issues. Transmission lines submitted early in the program (WCA) were
mapped as enrolled using a 500-meter buffer, creating corridors 1,000 meters wide and one electric
cooperative had submitted their entire region as an enrollment area instead of the distribution lines
themselves. After reducing the transmission lines down to its correct 15.25-meter buffer (30
meter/100 ft.) right of way corridor and replacing the cooperative area with specific lines, the
electric enrollment acreage was reduced by 1,630,599.5 acres. There were 165,354 acres of “real”
losses in enrollment due to terminations or transfers of acreage to companies who were not enrolled
in the RWP. The remaining difference of 541,525 is the net difference of the parcel enrollment
audit where companies clarified their declared acres vs the acreage they submitted (Table 3).
For the parcel enrollment audit process, differences in enrollment acres were addressed on an
individual basis with each company. In cases where the GIS acreage was less than the declared
acreage, companies were given the option to either add parcels to bring the GIS acreage in line
with the declared acreage on which the enrollment fees were based or crediting the difference
towards their remaining enrollment fees. In cases where the GIS acreage is greater than the
declared acreage, companies were given the option of paying the additional enrollment fees or
removing parcels from that enrollment that have not been developed during that period of
enrollment so that the spatial extent of their enrollment matches the area they are paying enrollment
fees.

Western Association of Fish and Wildlife Agencies March 2017
The 2016 Lesser Prairie-Chicken Range-wide Conservation Plan Annual Progress Report Page 23
Table 3. Detailed view of how the difference in enrollment between 2015 and 2016 is accounted
for reveals most of the change is a result of data cleaning, not a real loss in enrollment.
a) total difference (2016-2015) -2,337,478.9
b) terminated CCAA -22,625.5
c) terminated WCA -27,780.4
d) terminated total (b+c) -50,405.9
e) trans out to non-RWP company -114,948.5
f) Total "real" loss (d+e) -165,354.4
g) electric difference (fix buffers and co-op) -1,630,599.5
h) parcel audit change (a - (f + g )) -541,525
i) total data clean difference (g + h) -2,172,124.5
j) check (f + i) = a 165,354.4+2,172,124.5= 2,337,478.9
Another issue identified with this spatial audit is addressing mitigation projects that are not
associated with enrolled parcels. During the initial RWP implementation, millions of acres of
enrolled parcels required digitizing to incorporate into the WAFWA spatial database. During that
time, companies were also submitting new development projects for mitigation. Without a spatial
database to compare project locations and enrollment, WAFWA had to rely on companies to
ensure their projects submitted were on or associated with enrolled parcels. WAFWA identified
129 projects that were not on enrolled parcels that were submitted to WAFWA and mitigation
payments were provided to acquire conservation offset units. Some of these projects are associated
with enrolled properties, while others were submission errors. WAFWA contacted each company
and requested documentation to confirm which projects are submission errors. Companies either
enrolled these parcels or enrollment was corrected via the audit process so that all mitigated
projects were on or accessing enrolled property. The retroactive assessment of past mitigated
projects against current enrollments will be difficult (but possible) since enrolled areas can be
dropped once fully paid for. Thus, a project that was once on enrollment and mitigated for may
not always be on enrollment in the future. Currently, enrollment status is determined at the time a
project is submitted/mitigated for and a project can’t be mitigated for until its enrollment is
confirmed. Because of the automation and data tests now built into the process, there were zero
projects not associated with enrollment in 2016.
Several changes in project submittal methodology were also initiated in 2015 and 2016 to ensure
enrollment acreage complications do not continue to occur. When new parcels are submitted to
WAFWA for enrollment (or transfer), the GIS calculated acreage is compared against the declared
acres and the GIS acres are confirmed with the company. Once agreed to by the company, it is the
GIS acres that are sent to accounting to be used for billing. To ensure new projects are located on
enrolled parcels, projects are intersected with the enrollment layer. If the project is not on a parcel,

Western Association of Fish and Wildlife Agencies March 2017
The 2016 Lesser Prairie-Chicken Range-wide Conservation Plan Annual Progress Report Page 24
the project is attributed as such and the company must enroll that area before the project can be
mitigated for.
Overall, enrollment in the RWP is relatively stable with only a slight decline despite the bird being
de-listed and the price of oil remaining very low. Looking strictly at the total number of acres
reported as enrolled in the CCAA and WCA programs in the 2015 report versus this report gives
a false impression of an overall loss of 2,337,479 acres. The bulk of this difference is due to
incorrect spatial data being summarized for the 2014 and 2015 report and having that data
corrected for the 2016 report.
The changes in acreage from the audit did not substantially affect the fees charged by the program.
More than 75% of those differences resulted from linear enrollments that use flat enrollment fees.
On the parcel-based enrollments, companies who declared more acres than they intended to enroll
retain those enrollment fees for future mitigation. Those who declared fewer acres than they
intended to enroll will be invoiced for that difference.
WAFWA CONSERVATION AGREEMENT PARTICIPATION BY INDUSTRY
The WAFWA conservation agreement (WCA) covers oil and gas, pipelines, wind energy, electric
distribution and transmission and other activities (See Sec. 10 of the WCA). During 2016, overall
participation in this agreement declined as oil and gas and pipeline companies transferred their
enrollments to the CCAA agreement for its stronger legal assurances. As of December 31, 2016,
there were 55 active WCA contracts by 55 companies (signed Certificates of Participation) and 28
inactive WCA contracts where the acres were transferred to the CCAA (Table 4). WAFWA
maintains those WCA contracts as inactive, so that the companies may enroll new properties as
they acquire them. Four companies are suspended for unpaid enrollment fees. Since 2014, five
companies voluntarily terminated their WCA enrollments. All Certificates of Participation for this
agreement have been scanned and made available to USFWS on a secure website.
Table 4. List of companies enrolled in the WCA and their current contract status for the 2016 reporting
year.
Company Name Agreement Status
American Electric Power Service Corporation Active
Anadarko E&P Onshore LLC Active
Bailey County Electric Cooperative, Association Active
Bloom Wind Active
Bluestem Wind Energy, LLC Active
BP America Active
Central Valley Electric Cooperative, Inc. Active
Cimarex Energy Co. Active

Western Association of Fish and Wildlife Agencies March 2017
The 2016 Lesser Prairie-Chicken Range-wide Conservation Plan Annual Progress Report Page 25
Cimarron Electric Cooperative Active
Coral Coast Petroleum, LC Active
Deaf Smith Electric Cooperative Inc. Active
E R Operating Company Active
Eagle Exploration Active
Edison Operating Company, LLC Active
Enterprise Products Operating Active
Gore Oil Company, Inc. Active
Grand Mesa Pipeline, LLC Active
Greenbelt Electric Cooperative, Inc. Active
Hess Oil Company Active
Indian Exploration Company, LLC Active
ITC Great Plains LLC Active
John O. Farmer, Inc. Active
Kaiser-Francis Oil Company Active
Kiwash Electric Cooperative, Inc. Active
Lyntegar Electric Cooperative, Inc. Active
Magellan Midstream Partners, LP Active
MarkWest OK Gas Company, LLC Active
North Plains Electric Cooperative Active
Northfork Electric Cooperative Active
Northwestern Electric Cooperative Active
OGE Energy Corp. Active
Opal Resources Active
P.O. & G. Operating LLC Active
Peregrine Petroleum Partners, Ltd. Active
Pioneer Resources, Inc. Active

Western Association of Fish and Wildlife Agencies March 2017
The 2016 Lesser Prairie-Chicken Range-wide Conservation Plan Annual Progress Report Page 26
Prairie Wind Transmission Active
Ramsey Property Management Active
Raydon Exploration Active
Raymond Oil Company, Inc. Active
Red Oak Energy Inc. Active
Regency Energy Partners LP Active
Roosevelt County Electric Cooperative Active
Slawson Exploration Company Active
Southern Star Central Gas Pipeline, Inc. Active
Sunflower Electric Power Corporation Active
Superior Pipeline Co. Active
Texakoma Exploration & Production, LLC Active
Toto Energy, LLC Active
Tower Assets Newco IX, LLC Active
Tri-County Electric Cooperative Active
VAL Energy Active
Western Farmers Electric Cooperative Active
Western Gas Partners, LP Active
Williams LLC Active
Xcel Energy Inc. Active
Tapstone Energy, LLC Partial Suspension
Alfalfa Electric Cooperative, Inc. Self Terminated
Eagle Oil & Gas Self Terminated
Nadel and Gussman Operating LLC Self Terminated
Stratakan Exploration, LLC Self Terminated
Access Midstream Partners Sold/Transferred
Eagle Rock Energy Services, LP Sold/Transferred

Western Association of Fish and Wildlife Agencies March 2017
The 2016 Lesser Prairie-Chicken Range-wide Conservation Plan Annual Progress Report Page 27
Eagle Rock Field Services, LP Sold/Transferred
Chaparral Energy LLP Suspended
Dolomite Resources Corporation Suspended
Forestar Petroleum Corporation Suspended
Monarch Oil Pipeline Suspended
T.H. McElvain Oil & Gas LLLP Suspended
Apache Corporation Transferred/Inactive
Centurion Pipeline L.P. Transferred/Inactive
COG Operating, LLC Transferred/Inactive
Conoco Phillips Transferred/Inactive
Continental Resources, Inc. Transferred/Inactive
DCP Midstream LP Transferred/Inactive
Devon Energy Corporation - Kansas Transferred/Inactive
Devon Energy Corporation - Oklahoma Transferred/Inactive
Devon Energy Corporation - Panhandle Transferred/Inactive
Devon Energy Corporation - Permian Basin Transferred/Inactive
Devon Energy Corporation - Rockies Transferred/Inactive
Enable Midstream Partners Transferred/Inactive
Energy Transfer Partners Transferred/Inactive
Enervest Operating LLC Transferred/Inactive
Jayhawk Pipeline LLC Transferred/Inactive
Jones Energy LLC Transferred/Inactive
Kirkpatrick Oil Company Inc. Transferred/Inactive
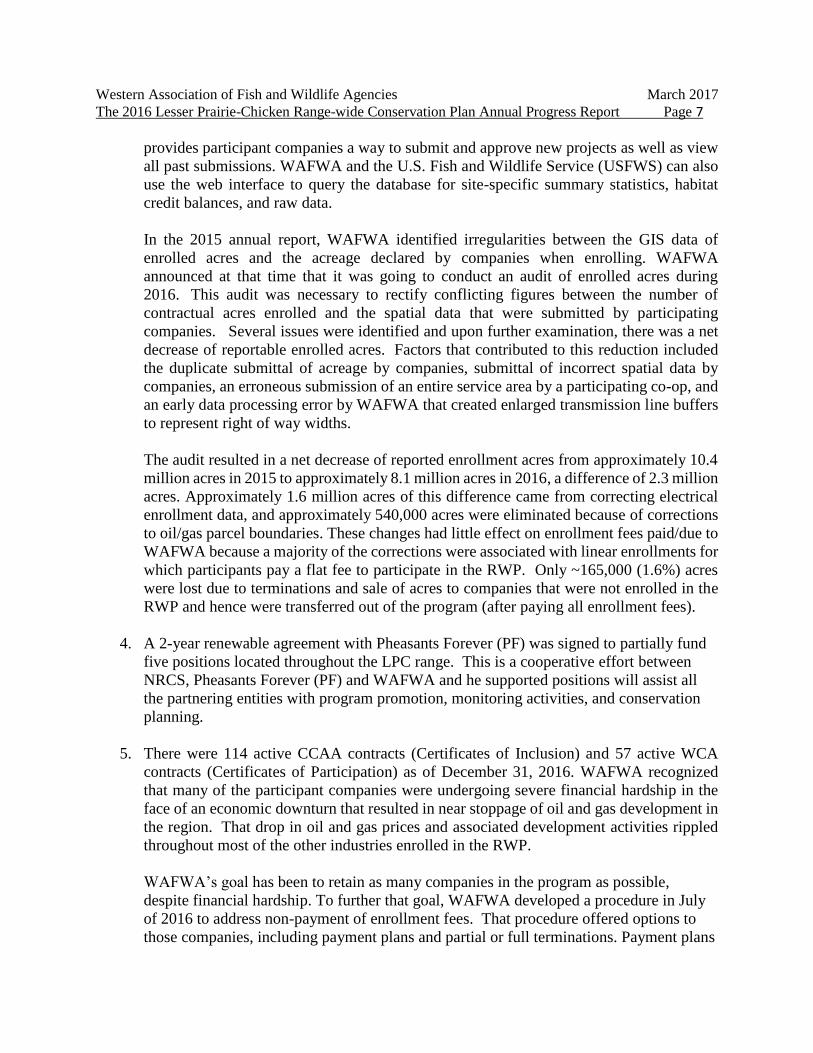
Landmark Resources, Inc. Transferred/Inactive
Linn Operating, Inc. Transferred/Inactive
Mewbourne Oil Company Transferred/Inactive
Midcoast Operating Transferred/Inactive

Western Association of Fish and Wildlife Agencies March 2017
The 2016 Lesser Prairie-Chicken Range-wide Conservation Plan Annual Progress Report Page 28
ONEOK Partners, LP Transferred/Inactive
Plains All American Pipeline Transferred/Inactive
Samson Resources Transferred/Inactive
Samuel L. Gary Jr. & Associates, Inc. Transferred/Inactive
SemGroup Corporation Transferred/Inactive
Unit Petroleum Company Transferred/Inactive
Versado Gas Processors Transferred/Inactive
*Contract status is as follows: active contracts have a current balance and no outstanding compliance notices,
suspended or partially suspended contracts have a past-due enrollment fee balance, self-terminated contracts indicate
a voluntary termination by the participant company, sold/transferred indicates that the enrollment was sold, transferred
to another enrolled company and remains in the program, and transferred/inactive indicates that the company
transferred the acreage to the CCAA program and retains the WCA contract without any enrolled acres.
WCA enrollments represent oil and gas leases, wind developments, pipelines, gas plants electric
lines and telecommunications towers. Oil and gas leases, wind developments and telecom sites
are enrolled as parcels. Linear impacts such as pipelines and electric lines are buffered by 50 feet
(15.25 meters) to define the enrolled acreage. The current active enrollment area totals for the
WCA is 663,198 acres (Table 5 & 6). WCA enrollments are down 74% from the 2,550,605 acres
reported in 2015. Since delisting, 1,777,452.5 acres have been transferred from the WCA to the
CCAA because companies desired stronger legal assurances associated with a CCAA permit.
Largely due to the downturn in the oil and gas industry, an additional 3223.8 acres are currently
suspended for non-payment of enrollment fees. Companies have voluntarily terminated 31,308.5
acres from the WCA since 2014. And finally, additional acreage differences have resulted from
the enrollment audit as described in the previous section of this report.
Figures 4 and 5 depict the distribution of the current active WCA enrollments across the extent of
the EOR+10. The majority of the WCA enrollments (67%) are in the Mixed Grass Ecoregion,
followed by the Shinnery Oak Prairie Ecoregion (20%), the Sand Sagebrush Ecoregion (9%), the
Shortgrass Prairie Ecoregion (4%). The enrollment in this agreement represents a small percentage
of the range of the species (1.7%) (Table 8 and 9). However, that enrollment has substantial
biological importance because it is nearly the entire electric grid within the EOR+10 across New
Mexico, Texas and Oklahoma, part of the electric grid in Kansas, and most of the pipelines across
the entire EOR+10 (Figure 5).

Western Association of Fish and Wildlife Agencies March 2017
The 2016 Lesser Prairie-Chicken Range-wide Conservation Plan Annual Progress Report Page 29
Table 5. Summary of active WCA acreage by ecoregion, CHAT category, and industry type and the
percentage of total area of the ecoregion and CHAT category that those enrollments represent as of
December 31, 2016.
Active Enrollment Acreage by Industry Type
Ecoregion/CHAT Oil and Gas Wind Pipelines Electric Total
%Total
Area
Mixed Grass 200,231.1 1,234.7 110,793.5 138,260.8 450,520.1 3.6%
CHAT1 7,003.2 0.0 9,545.8 17,312.9 33,861.9 1.3%
CHAT2 13,254.3 8.8 8,517.7 12,944.8 34,725.6 3.1%
CHAT3 116,828.4 359.6 45,102.3 64,821.9 227,112.3 4.4%
CHAT4 63,145.2 866.2 47,627.7 43,181.2 154,820.3 4.1%
Sand Sagebrush 7,043.4 0.0 39,193.8 16,207.9 62,445.0 0.8%
CHAT1 3,947.5 0.0 15,217.0 1,524.3 20,688.8 1.3%
CHAT2 63.4 0.0 406.9 152.9 623.2 0.3%
CHAT3 1,734.6 0.0 7,853.5 5,254.6 14,842.7 0.8%
CHAT4 1,297.9 0.0 15,716.3 9,276.1 26,290.2 0.6%
Shinnery Oak 1,445.2 0.0 10,912.4 120,528.2 132,885.8 1.2%
CHAT1 2.0 0.0 661.1 6,299.8 6,963.0 0.7%
CHAT2 0.0 0.0 387.0 7,995.0 8,382.0 0.9%
CHAT3 1,443.2 0.0 5,506.9 51,715.5 58,665.6 1.0%
CHAT4 0.0 0.0 4,357.3 54,517.8 58,875.2 1.9%
Shortgrass 2,438.5 0.0 9,307.1 5,602.3 17,347.8 0.2%
CHAT1 1,185.7 0.0 1,724.8 737.9 3,648.5 0.2%
CHAT2 0.0 0.0 270.4 148.4 418.8 0.2%
CHAT3 976.8 0.0 1,173.6 925.5 3,075.9 0.2%
CHAT4 276.0 0.0 6,138.2 3,790.5 10,204.7 0.2%
EOR+10 Total 211,158.2 1,234.7 170,206.7 280,599.2 663,198.7 1.6%

Western Association of Fish and Wildlife Agencies March 2017
The 2016 Lesser Prairie-Chicken Range-wide Conservation Plan Annual Progress Report Page 30
Table 6. Summary of active and suspended WCA enrollment acreage by ecoregion and CHAT category
and the percentage of the ecoregion and CHAT categories that those enrollments represent as of
December 31, 2016.
WCA Acreage by Agreement status
Ecoregion/CHAT Active Suspended Total Acres % Total Area
Mixed Grass 450,520.1 1,217.0 451,737.1 3.6%
CHAT1 33,861.9 727.5 34,589.4 1.3%
CHAT2 34,725.6 211.7 34,937.3 3.1%
CHAT3 227,112.3 268.8 227,381.2 4.4%
CHAT4 154,820.3 8.9 154,829.2 4.1%
Sand Sagebrush 62,445.0 0.0 62,445.0 0.8%
CHAT1 20,688.8 0.0 20,688.8 1.3%
CHAT2 623.2 0.0 623.2 0.3%
CHAT3 14,842.7 0.0 14,842.7 0.8%
CHAT4 26,290.2 0.0 26,290.2 0.6%
Shinnery Oak 132,885.8 320.4 133,206.2 1.2%
CHAT1 6,963.0 320.4 7,283.4 0.7%
CHAT2 8,382.0 0.0 8,382.0 0.9%
CHAT3 58,665.6 0.0 58,665.6 1.0%
CHAT4 58,875.2 0.0 58,875.2 1.9%
Shortgrass 17,347.8 1,686.4 19,034.2 0.2%
CHAT1 3,648.5 80.6 3,729.0 0.2%
CHAT2 418.8 0.0 418.8 0.2%
CHAT3 3,075.9 320.1 3,396.0 0.2%
CHAT4 10,204.7 1,285.7 11,490.4 0.2%
EOR+10 Total 663,198.7 3,223.8 666,422.5 1.7%

Western Association of Fish and Wildlife Agencies March 2017
The 2016 Lesser Prairie-Chicken Range-wide Conservation Plan Annual Progress Report Page 31
Figure 4. Oil and gas enrollments in the WAFWA Conservation Agreement as of December 31,
2016.

Western Association of Fish and Wildlife Agencies March 2017
The 2016 Lesser Prairie-Chicken Range-wide Conservation Plan Annual Progress Report Page 32
Figure 5. Electric and pipeline enrollments in the WAFWA Conservation Agreement as of December 31, 2016.

Western Association of Fish and Wildlife Agencies March 2017
The 2016 Lesser Prairie-Chicken Range-wide Conservation Plan Annual Progress Report Page 33
WCA COMPLIANCE
Section XXIV of the WCA covers participant compliance focusing on payment of enrollment fees
and compliance with the conservation measures in the agreement.
WCA SUSPENSIONS FOR NON-PAYMENT OF ENROLLMENT FEES
The slowdown in the oil and gas industry that began in 2012 continues to impact that industry and
other industries throughout the region. WAFWA recognizes the economic difficulty that many of
these companies are experiencing and we have worked extensively with those companies to
provide options to maintain their participation in the WCA. If a company fails to pay their
enrollment fees for the WCA and is ten days late on that payment, WAFWA issues a Notice of
Non-payment letter that gives the company 30 days to pay the past due amount. If payment is not
received prior to the end of that period, WAFWA issues a Compliance and Suspension Notice,
upon which the company’s enrollment in the program is suspended. US Fish and Wildlife Service
staff are notified of that suspension. Suspended companies are not allowed to finalize mitigation
for new development projects until their suspension is rescinded. If the past due balance is not
resolved within twenty business days, WAFWA issues a Delinquency Notice, which provides a
second twenty business day timeline to resolve that outstanding balance. If payment is not
received during that period, WAFWA issues a Notice of Noncompliance, which informs the
company of its options to seek redress through the Advisory Committee, establishes a final twenty
business day period to resolve the past-due balance, and informs them that the Initiative Council
may consider termination of all or part of their enrollment if the outstanding balance is not paid
prior to the deadline. Companies with past-due accounts and current accounts have multiple
options to resolve enrollment fee balances. They can pay their enrollment fees upon the predefined
3-year timeline, they can negotiate an extended payment plan that includes an interest sufficient to
cover the expected rate of return in the WAFWA conservation endowment and additional work by
WAFWA to invoice and track that payment plan, or they can work with WAFWA to negotiate a
partial or full termination.
In 2016, there were 15 instances where companies were late on payment of WCA enrollment
fees. Ten of those were resolved with the company remaining in good standing following
resolution. The remaining five companies are currently suspended with a total outstanding balance
of $14,513.03. All five companies received a Notice of Noncompliance in December 2016 or
January 2017. WAFWA is currently evaluating additional options to try to get these five
companies accounts current before considering termination.
SUMMARY OF WCA COMPLIANCE MONITORING
WAFWA also randomly selects mitigated projects to monitor compliance with the conservation
measures outlined in Section XIII of the WCA. That selection process draws a single sample of
projects from both CCAA and WCA projects. Due to staffing limitations, WAFWA limits that
sample to a maximum of 200 projects per year (50 from each of the four ecoregions). In an effort
to spread this compliance monitoring across a wide sample of companies, WAFWA selected those
projects at random in 2016, but established a maximum of 20 projects for compliance monitoring
per company. In subsequent years, we will limit the number of random samples per company to
10 in an effort to sample more companies. If a project is evaluated for compliance, it is removed

Western Association of Fish and Wildlife Agencies March 2017
The 2016 Lesser Prairie-Chicken Range-wide Conservation Plan Annual Progress Report Page 34
from the pool for future random samples.
The sampling process selected a total of 158 projects to evaluate in 2016. Of that total, 21 projects
were mitigated for under the WCA or 17.2% of the remaining pool of projects mitigated for under
the WCA from 2014 to present. Those 21 projects represented 13 companies. The breakdown of
projects by ecoregion was as follows: 5 in the Mixed Grass, 1 in the Sand Sagebrush, 12 in the
Shinnery Oak, and 3 in the Shortgrass.
The compliance monitoring process evaluates mapping accuracy for the project to confirm it was
mitigated for correctly, the possible presence of any structures on the site that the participant
company is responsible for that were not mitigated for, compliance with noise, off road travel, and
timing restrictions, the presence of escape ramps or rafts in man-made water sources, and herbicide
use. Of the 21 WCA projects that were monitored, 2 were sold and the company no longer had
access to the property, 5 were not constructed, 2 were unsuccessful oil and gas wells that were
remediated, and 12 were constructed. No instances of noncompliance were detected on any of
these projects.
WCA EMERGENCY AND NON-EMERGENCY OPERATIONS AND LPC MORTALITY
REPORTING
The WCA requires the reporting of emergency and non-emergency operations as well as any
incidents of LPC mortality. Emergency operations are those activities unexpectedly and urgently
required to prevent or address immediate threats to human health, safety, or property; the
environment; or national defense or security. The WCA requires the reporting of emergency
operations that occur during the hours of 3am to 9am, between March 1 and July 15 that are within
1.25 miles of leks active within the previous 5 years or within 1.25 miles of un-surveyed areas of
CHAT 1-3. Non-emergency activities occur on undisturbed areas in rangeland or planted grass
cover (e.g., off of a well pad, road, or facility) between March 1 and July 15 that are within 1.25
miles of leks active within the previous 5 years or within 1.25 miles of un-surveyed areas of CHAT
1-3.
No emergency or non-emergency operation or instances of LPC mortality were reported on WCA
enrolled properties by participant companies during the 2016 calendar year.
CCAA INDUSTRY PARTICIPATION
The CCAA covers oil and gas and related activities such as wells, roads, pipelines, storage tank
facilities, compressor and pumping stations, and electric service for oil and gas facilities. In 2016,
participation in the CCAA remained generally stable. Several companies transferred enrollments
from the WCA into the CCAA for its stronger legal assurances. Overall, the number of companies
remained fairly consistent except for a few self-terminations. As of December 31, 2016, there
were 116 active CCAA contracts by 112 companies, 13 contracts suspended for non-payment of
enrollment fees, and two companies whose CCAA enrollment is partially suspended for non-
payment of enrollment fees (Table 7). Since 2014, seven companies voluntarily terminated their
CCAA enrollment, and five companies were sold and their acreage was transferred to another
enrolled company. No new companies were added to the CCAA in 2016, but a substantial amount

Western Association of Fish and Wildlife Agencies March 2017
The 2016 Lesser Prairie-Chicken Range-wide Conservation Plan Annual Progress Report Page 35
of acreage was transferred from the WCA agreement to the CCAA. Certificates of Inclusion for
this agreement have been scanned and made available to FWS on a secure website.
Table 7. Companies enrolled in the CCAA and their current contract status for the 2016 reporting year.
Company Name Agreement Status
Anadarko Minerals, Inc. Active
Anadarko Petroleum Corporation Active
Apache Corporation Active
Apache Corporation - Permian Region Active
Beren Corporation Active
BP America Active
Castelli Exploration, Inc. Active
Centurion Pipeline L.P. Active
Chisholm Partners II, LLC Active
Cimarex Energy Co. Active
Cimarex Energy Co. - West Texas Active
CMX, Inc. Active
Coats Energy, Inc. Active
COG Operating, LLC Active
Conoco Phillips Active
Continental Resources, Inc. Active
Corlena Oil Company Active
Crawley Petroleum Corporation Active
Culbreath Oil & Gas Co., Inc. Active
Cynosure Energy LLC Active
DaMar Resources, Inc. Active
Daystar Petroleum Inc. Active
DCP Midstream LP Active
Devon Energy Corporation - Kansas Active

Western Association of Fish and Wildlife Agencies March 2017
The 2016 Lesser Prairie-Chicken Range-wide Conservation Plan Annual Progress Report Page 36
Devon Energy Corporation - Oklahoma Active
Devon Energy Corporation - Panhandle Active
Devon Energy Corporation - Permian Basin Active
Devon Energy Corporation - Rockies Active
Diehl Oil, Inc. Active
Dorchester Minerals Operating LP -
Oklahoma
Active
Duncan Oil Properties, Inc. Active
Edison Operating Company, LLC Active
Edmiston Oil Company, Inc. Active
Elevation Resources LLC Active
Empire Energy E&P LLC Active
Enable Midstream Partners Active
Encino Operating, LLC Active
Energy Alliance Company, Inc. Active
Energy Transfer Partners Active
Enervest Operating LLC Active
EOG Resources, Inc. Active
Fasken Oil and Ranch Active
Griffin Management LLC Active
IA Operating, Inc. Active
Jayhawk Pipeline LLC Active
JMA Energy Company, LLC Active
Jolen Operating Company Active
Jones Energy LLC Active
Kenneth W. Cory, Ltd. Active
Kinder Morgan Inc. Active
Kirkpatrick Oil Company Inc. Active
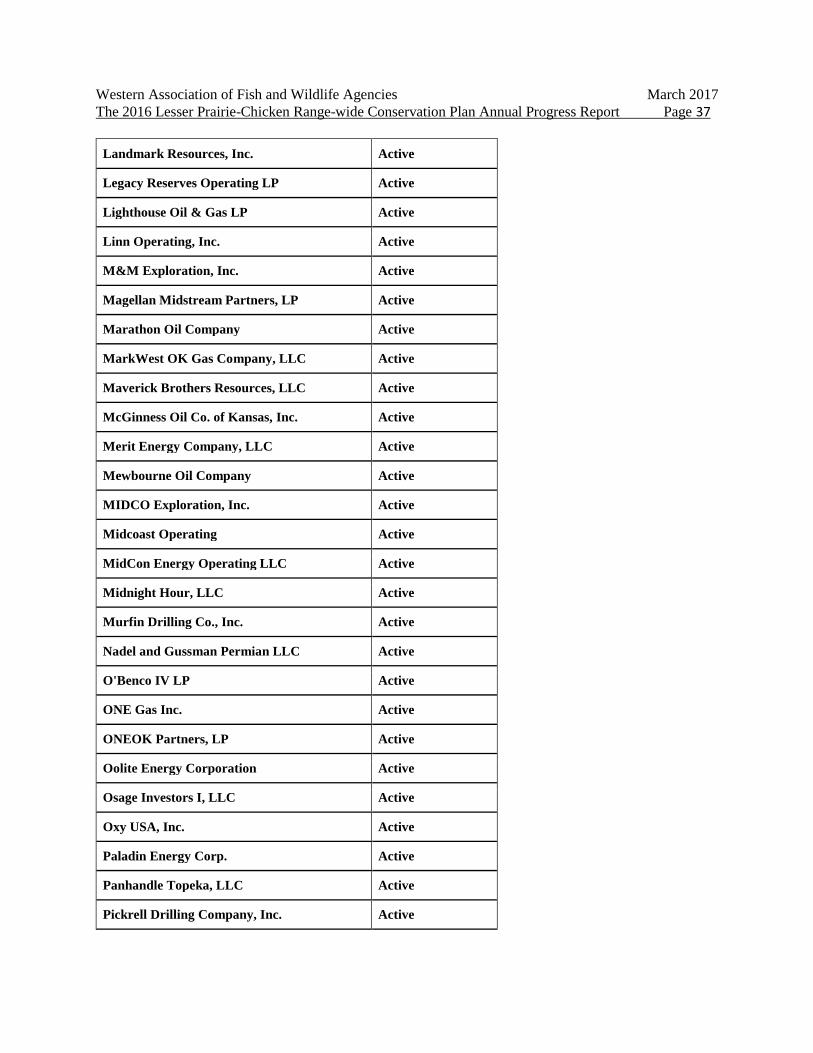
Western Association of Fish and Wildlife Agencies March 2017
The 2016 Lesser Prairie-Chicken Range-wide Conservation Plan Annual Progress Report Page 37
Landmark Resources, Inc. Active
Legacy Reserves Operating LP Active
Lighthouse Oil & Gas LP Active
Linn Operating, Inc. Active
M&M Exploration, Inc. Active
Magellan Midstream Partners, LP Active
Marathon Oil Company Active
MarkWest OK Gas Company, LLC Active
Maverick Brothers Resources, LLC Active
McGinness Oil Co. of Kansas, Inc. Active
Merit Energy Company, LLC Active
Mewbourne Oil Company Active
MIDCO Exploration, Inc. Active
Midcoast Operating Active
MidCon Energy Operating LLC Active
Midnight Hour, LLC Active
Murfin Drilling Co., Inc. Active
Nadel and Gussman Permian LLC Active
O'Benco IV LP Active
ONE Gas Inc. Active
ONEOK Partners, LP Active
Oolite Energy Corporation Active
Osage Investors I, LLC Active
Oxy USA, Inc. Active
Paladin Energy Corp. Active
Panhandle Topeka, LLC Active
Pickrell Drilling Company, Inc. Active

Western Association of Fish and Wildlife Agencies March 2017
The 2016 Lesser Prairie-Chicken Range-wide Conservation Plan Annual Progress Report Page 38
Pintail Petroleum, Ltd. Active
Pioneer Natural Resources USA, Inc. Active
Plains All American Pipeline Active
QEP Energy Company Active
Questa Energy Corporation Active
Range Resources Active
Red Oak Energy Inc. Active
Redland Resources, LLC Active
Regency Energy Partners LP Active
Rio Petroleum, Inc. Active
Sandridge Expl. & Prod. LLC Active
SemGroup Corporation Active
Shakespeare Oil Company Active
Stanolind Operating Inc. Active
Strand Energy LLC Active
Strat Land Exploration Co. Active
Tabula Rasa Partners LLC Active
Tandem Energy Corporation Active
Tengasco Inc. Active
Texakoma Exploration & Production, LLC Active
Texland Petroleum Active
Thomason Petroleum Inc. Active
Toto Energy, LLC Active
Triad Energy Inc. Active
Unit Petroleum Company Active
Versado Gas Processors Active
Viking Resources, Inc. Active

Western Association of Fish and Wildlife Agencies March 2017
The 2016 Lesser Prairie-Chicken Range-wide Conservation Plan Annual Progress Report Page 39
Vincent Oil Company Active
Williams Midstream Gas Services, LLC Active
W.R. Williams, Inc. Active
Ward Petroleum Corporation Active
Western Operating Company Active
White Exploration, Inc. Active
Whiting Petroleum Corporation Active
Younger Energy Company Active
Zinszer Oil Company, Inc. Active
Samson Resources Active
Vanguard Natural Resources Active
Samuel L. Gary Jr. & Associates, Inc. Patial Suspension
Tapstone Energy, LLC Patial Suspension
Berexco LLC Self Terminated
Central Operating Inc. Self Terminated
Meridian Energy Inc. Self Terminated
Mikol Oil, LLC Self Terminated
Nadel and Gussman Operating LLC Self Terminated
Trey Resources Inc. Self Terminated
Williford Energy Company Self Terminated
Access Midstream Partners Sold/Transferred
Eagle Rock Energy Services, LP Sold/Transferred
Eagle Rock Field Services, LP Sold/Transferred
Eagle Rock Mid-Continent Operating, LLC Sold/Transferred
Eagle Rock Operating Company, LLC Sold/Transferred
Ares Energy Ltd. Suspended
Cholla Production, LLC Suspended

Western Association of Fish and Wildlife Agencies March 2017
The 2016 Lesser Prairie-Chicken Range-wide Conservation Plan Annual Progress Report Page 40
Energex LLC Suspended
Eternity Exploration LLC Suspended
Forestar Petroleum Corporation Suspended
Joshi Technologies International, Inc. Suspended
Laddex Ltd. Suspended
LB Exploration, Inc. Suspended
Le Norman Operating LLC Suspended
Ol' Miss, LLC Suspended
Osage Oil, LLC Suspended
Pioneer Oil Company, Inc. Suspended
T.H. McElvain Oil & Gas LLLP Suspended
As of December 31, 2016, the CCCA included an active total of 7,041,548.9 acres (Table 8 and
9), which is down from 7,876,547 acres in 2015 (10.6%). This change in enrolled acreage is the
result of many factors. As discussed earlier in this report, the enrollment audit resulted in a
significant difference in the CCAA enrollment, but only reflected correction of industry provided
data as opposed to decreased industry participation. Since the LPC was listed in May 2014,
companies have transferred 1,777,452.5 acres from the WCA into the CCAA for the stronger legal
assurances that agreement provides. Those transfers offset much of the enrollment audit
differences. Largely due to the oil and gas industry downturn, 227,198.8 acres are enrolled in the
agreement but are suspended for non-payment of enrollment fees. Since implementation in 2014,
companies have terminated a total of 22,625.5 acres from the CCAA.
The majority of the CCAA enrollment (54.3%) is in the Mixed Grass ecoregion, followed by the
Sand Sagebrush ecoregion (32.7%), the Shinnery Oak Prairie ecoregion (10.4%), and the
Shortgrass Prairie Ecoregion (2.6%) (Figures 6 & 7). The CCAA has significant biological
importance because the enrollment encompasses nearly 20% of the EOR+10 and 30-50% of the
CHAT 1 and 2 areas that have substantial potential for oil and gas development (Table 8 and 9).
The exception to that pattern is the Shinnery Oak ecoregion. The low rate of enrollment in this
ecoregion is the result of industry participation in the New Mexico Oil and Gas CCAA for the
Dunes Sagebrush Lizard and Lesser Prairie-Chicken that is administered by the Center of
Excellence for Hazardous Materials Management which pre-dated the RWP. In addition, many of
the areas of CHAT 1 and 2 in the Texas portion of the Shinnery Oak ecoregion were selected
because they had low potential for oil and gas development.
Table 8. Summary of active CCAA enrollment acreage by ecoregion, CHAT category and industry and
the percentage of ecoregion and CHAT categories that these enrollments represent as of December 31,
2016.

Western Association of Fish and Wildlife Agencies March 2017
The 2016 Lesser Prairie-Chicken Range-wide Conservation Plan Annual Progress Report Page 41
Active Enrollment Acreage by Industry Type
Ecoregion/CHAT Oil and Gas Wind Pipelines Electric Total Acres
%Total
Area
Mixed Grass 3,491,054.1 0.0 489,562.9 0.0 3,980,616.9 31.5%
CHAT1 657,481.8 0.0 70,709.5 0.0 728,191.3 28.3%
CHAT2 351,568.2 0.0 47,509.6 0.0 399,077.9 35.8%
CHAT3 1,874,540.5 0.0 233,605.8 0.0 2,108,146.3 40.7%
CHAT4 607,463.6 0.0 137,737.9 0.0 745,201.5 19.8%
Sand Sagebrush 2,165,490.9 0.0 143,793.9 0.0 2,309,284.8 28.7%
CHAT1 733,971.9 0.0 39,652.0 0.0 773,623.9 48.9%
CHAT2 34,194.3 0.0 1,071.2 0.0 35,265.5 14.4%
CHAT3 304,121.0 0.0 24,961.1 0.0 329,082.1 17.5%
CHAT4 1,093,203.6 0.0 78,109.7 0.0 1,171,313.3 27.1%
Shinnery Oak 557,053.7 0.0 172,974.7 0.0 730,028.4 6.6%
CHAT1 2,146.3 0.0 12,765.3 0.0 14,911.7 1.4%
CHAT2 5,692.6 0.0 3,050.3 0.0 8,742.9 1.0%
CHAT3 247,538.2 0.0 93,062.0 0.0 340,600.2 5.8%
CHAT4 301,676.6 0.0 64,097.1 0.0 365,773.7 11.5%
Shortgrass 156,398.9 0.0 37,958.4 0.0 194,357.3 2.2%
CHAT1 38,830.0 0.0 4,499.8 0.0 43,329.8 2.3%
CHAT2 2,036.4 0.0 1,069.7 0.0 3,106.1 1.7%
CHAT3 32,603.6 0.0 5,935.6 0.0 38,539.2 2.2%
CHAT4 82,928.8 0.0 26,453.3 0.0 109,382.1 2.3%
EOR+10 Total 6,369,997.6 0.0 844,289.9 0.0 7,214,287.4 17.9%
Table 9. Summary of the active and suspended enrolled CCAA acreage by ecoregion and CHAT
category and the percentage of the ecoregion and CHAT categories that those enrollments represent as of
December 31, 2016.
CCAA Acreage Agreement Status
Ecoregion/CHAT Active Suspended Total
%
Total
Area

Western Association of Fish and Wildlife Agencies March 2017
The 2016 Lesser Prairie-Chicken Range-wide Conservation Plan Annual Progress Report Page 42
Mixed Grass 3,980,617.0 130,757.5 4,111,374.5 32.5%
CHAT1 728,190.3 25,105.6 753,295.9 29.2%
CHAT2 399,077.9 14,840.8 413,918.7 37.1%
CHAT3 2,108,146.3 65,327.6 2,173,473.9 41.9%
CHAT4 745,202.5 25,483.4 770,685.9 20.5%
Sand Sagebrush 2,309,284.8 132.7 2,309,417.5 28.7%
CHAT1 773,623.9 0.0 773,623.9 48.9%
CHAT2 35,265.5 0.0 35,265.5 14.4%
CHAT3 329,082.1 10.6 329,092.6 17.5%
CHAT4 1,171,313.3 122.1 1,171,435.5 27.1%
Shinnery Oak 730,028.4 11,815.8 741,844.2 6.7%
CHAT1 14,911.7 625.5 15,537.1 1.5%
CHAT2 8,742.9 0.0 8,742.9 1.0%
CHAT3 340,600.2 7,806.6 348,406.7 5.9%
CHAT4 365,773.7 3,383.8 369,157.4 11.6%
Shortgrass 194,357.3 66,256.1 260,613.4 3.0%
CHAT1 43,329.8 8,644.2 51,974.0 2.8%
CHAT2 3,106.1 4,005.1 7,111.3 3.9%
CHAT3 38,539.2 26,544.1 65,083.3 3.7%
CHAT4 109,382.1 27,062.8 136,444.8 2.8%
EOR+10 Total 7,214,287.4 208,962.1 7,423,249.6 18.4%

Western Association of Fish and Wildlife Agencies March 2017
The 2016 Lesser Prairie-Chicken Range-wide Conservation Plan Annual Progress Report Page 43
Figure 6. Oil and gas enrollments in the Range-wide Oil and Gas Candidate Conservation Agreement
with Assurances as of December 31, 2016

Western Association of Fish and Wildlife Agencies March 2017
The 2016 Lesser Prairie-Chicken Range-wide Conservation Plan Annual Progress Report Page 44
Figure 7. Map of pipeline enrollments in the Range-wide Oil and Gas Candidate Conservation Agreement
with Assurances as of December 31, 2016

Western Association of Fish and Wildlife Agencies March 2017
The 2016 Lesser Prairie-Chicken Range-wide Conservation Plan Annual Progress Report Page 45
CCAA COMPLIANCE
Section XXIX of the CCAA covers participant compliance focusing on payment of enrollment
fees and compliance with the conservation measures in the agreement.
CCAA SUSPENSIONS FOR NON-PAYMENT OF ENROLLMENT FEES
The slowdown in the oil and gas industry that began in 2012 continues to impact that industry and
other industries throughout the region. WAFWA recognizes the economic difficulty that many of
these companies are experiencing and we have worked extensively with those companies to
provide options to maintain their participation in the CCAA. If a company fails to pay their
enrollment fees for the CCAA and is ten days late on that payment, WAFWA issues a Notice of
Non-payment letter that gives the company 30 days to pay the past due amount. If payment is not
received prior to the end of that period, WAFWA issues a Compliance and Suspension Notice,
upon which the company’s enrollment in the program is suspended. US Fish and wildlife Service
staff are notified of that suspension. Suspended companies are not allowed to finalize mitigation
for new development projects until their suspension is rescinded. If the past due balance is not
resolved within twenty business days, WAFWA issues a Delinquency Notice, which provides a
second twenty business day timeline to resolve that outstanding balance. If payment is not
received during that period, WAFWA issues a Notice of Noncompliance, which informs the
company of its options to seek redress through the Advisory Committee, establishes a final twenty
business day period to resolve the past-due balance, and informs them that the Initiative Council
may consider termination of all or part of their enrollment if the outstanding balance is not paid
prior to the deadline. Companies with past-due accounts and current accounts have multiple
options to resolve enrollment fee balances. They can pay their enrollment fees upon the predefined
3-year timeline, they can negotiate an extended payment plan that includes an interest sufficient to
cover the expected rate of return in the WAFWA conservation endowment and additional work by
WAFWA to invoice and track that payment plan, or they can work with WAFWA to negotiate a
partial or full termination.
In 2016, there were 77 instances in which companies were late on payment of CCAA enrollment
fees. Sixty-two of those were resolved with the company remaining in good standing following
resolution. The remaining 15 occasions represent 14 companies that are currently suspended with
a total outstanding balance of $688,829.98. All 14 companies received a Notice of Noncompliance
in December 2016 or January 2017. Of those the suspended companies, 3 are currently
negotiating a termination or partial termination. Three additional companies are making payments
on their past due balance, but remain suspended because they have not signed an official payment
plan. WAFWA is currently evaluating additional options for 9 suspended companies to try to bring
their accounts up to date prior to considering to termination.
SUMMARY OF CCAA COMPLIANCE MONITORING
WAFWA also randomly selects mitigated projects to monitor compliance with the conservation
measures outlined in Section XII of the CCAA. That selection process draws a single sample of
projects from both CCAA and WCA projects. Due to staffing limitations, WAFWA limits that
sample to a maximum of 200 projects per year (50 from each of the four ecoregions). To spread
this compliance monitoring across a wide sample of companies, WAFWA selected those projects

Western Association of Fish and Wildlife Agencies March 2017
The 2016 Lesser Prairie-Chicken Range-wide Conservation Plan Annual Progress Report Page 46
at random in 2016, but established a maximum of 20 projects for compliance monitoring per
company. In subsequent years, the number of random samples per company will be limited to 10
in an effort to sample more companies. If a project is evaluated for compliance, it is removed from
the pool for future random samples.
The sampling process selected a total of 158 projects to evaluate in 2016. Of that total, 137 projects
were mitigated for under the CCAA This constitutes 16.1% of the remaining pool of CCAA
projects mitigated from 2014 to present, but not previously sampled for compliance. Those 137
projects represented 36 companies. The breakout of projects by ecoregion is as follows 44 in the
Mixed Grass, 21 in the Sand Sagebrush, 35 in the Shinnery Oak, and 37 in the Shortgrass.
The compliance monitoring process evaluates mapping accuracy for the project to confirm it was
mitigated for correctly, the possible presence of any structures on the site that the participant
company is responsible for that were not mitigated for, compliance with noise, off road travel, and
timing restrictions, the presence of escape ramps or rafts in man-made water sources, and herbicide
use. Of the 137 CCAA projects that were monitored, 8 projects were sold and the company no
longer had access to the site, 17 projects were unsuccessful oil and gas wells that were remediated,
21 projects were not constructed, 91 projects were constructed. Eight projects had instances of
noncompliance (5.8%) and received Noncompliance Notices. Those projects included 3 instances
of mapping errors, 2 instances of failure to mark fences, and four instances of failure to include
escape ramps or rafts in an open man-made water source. An additional two sites were initially
issued Noncompliance Notices for failure to include escape ramps or rafts in secondary
containment units. After further review WAFWA rescinded the Noncompliance Notices for the
secondary containment because they did not meet the definition of a man-made water source and
did not significantly pose a threat to LPCs.
In the case of Compliance Notices for conservation measure violations, companies are given time
to remedy the situation. All 8 cases were remedied within the allotted time and none of them
required a Deficiency Notice.
CCAA EMERGENCY AND NON-EMERGENCY OPERATIONS AND LPC MORTALITY
REPORTING
The CCAA requires the reporting of emergency and non-emergency operations as well as any
incidents of LPC mortality. Emergency operations are those activities unexpectedly and urgently
required to prevent or address immediate threats to human health, safety, or property; the
environment; or national defense or security. The CCAA requires the reporting of emergency
operations that occur during the hours of 3am to 9am, between March 1 and July 15 that are within
1.25 miles of leks active within the previous 5 years or within 1.25 miles of un-surveyed areas of
CHAT 1-3. Non-emergency activities occur on undisturbed areas in rangeland or planted grass
cover (e.g., off of a well pad, road, or facility) between March 1 and July 15 that are within 1.25
miles of leks active within the previous 5 years or within 1.25 miles of un-surveyed areas of CHAT
1-3.
During the 2016 calendar year, 3 emergency operations events and 17 non-emergency operations

Western Association of Fish and Wildlife Agencies March 2017
The 2016 Lesser Prairie-Chicken Range-wide Conservation Plan Annual Progress Report Page 47
events were reported on CCAA enrolled properties by participant companies. Those events are
summarized in Table 10. No instances of LPC mortality were reported.
Table 10. Summary of 2016 emergency and non-emergency operations reported for the CCAA.
Operation
Type Ecoregion CHAT Surveyed
for Leks Known Lek
Within 1.25
miles
Date Start Time
End Time
Safety Issue
Identified
Emergency Mixed
Grass 1 Partial No 3/11/2016 3:35
AM 4:00
AM Yes
Emergency Mixed
Grass 1 Partial No 3/11/2016 7:05
AM 7:30
AM Yes
Emergency Mixed
Grass 1 Partial No 3/19/2016 3:10
AM 4:00
AM Yes
Non-
Emergency Mixed
Grass 3 Partial No 3/2/2016 9:10
AM 5:15
PM No
Non-
Emergency Mixed
Grass 3 Partial No 3/3/2016 9:02
AM 5:08
PM No
Non-
Emergency Mixed
Grass 3 Partial No 3/10/2016 10:03
AM 12:52
PM No
Non-
Emergency Mixed
Grass 3 Partial No 4/7/2016 9:00
AM 4:00
PM No
Non-
Emergency Mixed
Grass 3 Partial No 4/8/2016 9:00
AM 1:30
PM No
Non-
Emergency Mixed
Grass 3 Partial No 4/11/2016 9:00
AM 5:00
PM No
Non-
Emergency Mixed
Grass 3 Partial No 4/12/2016 9:00
AM 4:30
PM No
Non-
Emergency Mixed
Grass 3 Partial No 4/13/2016 9:00
AM 5:00
PM No
Non-
Emergency Mixed
Grass 3 Partial No 4/14/2016 9:00
AM 5:00
PM No
Non-
Emergency Mixed
Grass 3 Partial No 4/15/2016 9:00
AM 6:00
PM No
Non-
Emergency Mixed
Grass 3 Partial No 4/18/2016 9:00
AM 1:00
PM No
Non-
Emergency Mixed
Grass 3 Partial No 4/19/2016 9:00
AM 5:00
PM No

Western Association of Fish and Wildlife Agencies March 2017
The 2016 Lesser Prairie-Chicken Range-wide Conservation Plan Annual Progress Report Page 48
Non-
Emergency Mixed
Grass 3 No No 6/1/2016 10:45
AM 11:15
AM No
Non-
Emergency Mixed
Grass 4 No No 6/1/2016 12:00
PM 1:30
PM No
Non-
Emergency Mixed
Grass 4 No No 6/29/2016 11:00
AM 4:30
PM No
Non-
Emergency Mixed
Grass 4 No No 6/30/2016 9:30
AM 5:00
PM No
Non-
Emergency Mixed
Grass 4 No No 7/1/2016 10:00
AM 4:00
PM No
RWP CONSERVATION PROGRAM
The RWP offers two basic enrollment options for landowners: non-offset and offset generating
conservation agreements. There are also two types of conservation plans available to landowners
regardless of which agreement type is being developed. The first is a rangeland conservation plan
which utilizes livestock grazing as the primary management practice. The other option is a planted
grass management plan which typically utilizes disturbance other than regular domestic livestock
grazing to create and maintain suitable vegetative conditions for LPC (e.g. disking and prescribed
fire).
The non-offset generating agreements provided participants with exemptions from the take
prohibitions of the ESA for the conservation practices that were being applied as prescribed when
the LPC was federally protected. Those take exemptions were eliminated after the September 1,
2015 court decision overturned the USFWS ruling that listed the species as threatened under the
ESA. WAFWA will advocate for these take exemptions to be reinstated by the USFWS if the LPC
regains federal protection in the future. WAFWA accepts landowner requests for non-offset
agreements continuously and processes them as quickly as possible. Any property that falls within
a WAFWA ecoregion is eligible to enroll in a non-offset generating conservation
agreement. WAFWA does not monitor compliance on these sites because the participants do not
receive any payments and the sites do not generate mitigation offset units.
The offset generating agreements offered by WAFWA provided the same take exemptions as the
non-offset agreement when the LPC was federally protected under the ESA. However, these
agreements also provide various types of payments to landowners for implementing conservation
practices that are beneficial to LPC. Enrolled properties produce mitigation credits to offset
industry impacts elsewhere in the same ecoregion. Basic eligibility requirements dictate that a
property must fall within a WAFWA ecoregion and contain at least 160 acres in one contiguous
block. Landowners can offer eligible acreage for 5 or 10-year term agreements or ask that it be
considered for a permanent conservation site. Sites that require restoration work such as range
planting or brush management must be enrolled for at least a 10-year term. WAFWA continuously

Western Association of Fish and Wildlife Agencies March 2017
The 2016 Lesser Prairie-Chicken Range-wide Conservation Plan Annual Progress Report Page 49
accepts landowner offers of eligible property for all the offset generating agreement options.
However, enrollment is competitive and depends on availability of mitigation funds and other
competing offers. Properties that do get enrolled in an offset generating agreement must be
managed in compliance with a WAFWA-approved conservation plan. Rangeland conservation
plans must include prescribed grazing. Planted grass management plans must include at least 1
disturbance practice during the term of the agreement. Both types of conservation plans must also
include all the additional conservation practices necessary to address each of the identified threats
to the LPC that exist on the property. WAFWA assesses compliance with conservation plans using
landowner self-reporting forms and annual vegetation sampling.
When WAFWA biologists make their initial visit to a property, a checklist is completed to identify
which LPC threats currently exist on the site. The biologists evaluate such things as the presence
of invasive vegetation, harmful infrastructure, grazing pressure, and presence of LPC non-
habitat. The biologists must attempt to address each of the LPC threats identified on the checklist
when they prepare a conservation plan for the property. WAFWA biologists can address those
threats using of 28 different conservation practices that must be prescribed to the standards
described in the range-wide plan. The practices and their standards mimic those approved in the
USFWS’s biological opinion of the NRCS’ Lesser Prairie-Chicken Initiative with three
exceptions. The grazing applied through the RWP will be prescribed at 33% total utilization rather
than 50%, all trees will be felled when brush management is prescribed, and there will be no
chemical treatment of sand sagebrush.
WAFWA NON-OFFSET AGREEMENTS
During 2016, WAFWA did not receive any landowner requests for non-offset
agreements. WAFWA did execute one non-offset agreement in 2014 which is still being
implemented by the landowner. The associated conservation plan includes prescribed grazing and
prescribed fire on 8,912 acres in the mixed grass ecoregion.
WAFWA CONSERVATION FUNDING STRATEGY
Currently, a ratio of 75/25 is used to split the WAFWA offset generating agreements between term
contracts and perpetually conserved sites. The term contracts can be for a 5 or 10-year
duration. When these term contracts expire, WAFWA will replace them with another term
contract with equal or greater value as determined by the CHAT priority area where the expiring
site occurred. The perpetually conserved sites are high quality habitats or sites with potential to be
restored to those conditions. The perpetually conserved sites adhere to the USFWS conservation
banking policy (USFWS 2003). Funding for management activities will be available in perpetuity
for both conservation options because only endowment interest is committed for that purpose.
The 75/25 split was chosen as the ratio for two primary reasons. First, WAFWA will be able to
affect a far greater number of acres with the most funding being targeted toward term contracts.
Applying beneficial conservation practices on the maximum possible acreage provides the best
opportunity to stabilize or increase the LPC population. This approach has proven to be successful
at recovering the LPC as demonstrated by the range expansion and population growth observed in
Kansas shortly after the implementation of the Conservation Reserve Program (Rodgers and

Western Association of Fish and Wildlife Agencies March 2017
The 2016 Lesser Prairie-Chicken Range-wide Conservation Plan Annual Progress Report Page 50
Hoffman 2005). Secondly, a dynamic approach provides WAFWA with some flexibility to adapt
to changing environmental conditions that may influence the ability of a specific site to support
LPCs. The 75/25 ratio will be evaluated periodically through the adaptive management process
described in the LPC range-wide plan.
WAFWA TERM CONTRACTS
WAFWA maintains all term contract applications on file for future funding consideration unless
the landowner asks to be removed. At the start of 2016, many of the applications that were on file
had been received more than 2 years prior and the landowners had not been contacted recently. So,
WAFWA biologists contacted all previous applicants to determine if they were still interested and
eligible for our program. The WAFWA database was updated accordingly based on those
contacts. A total of 22 applications have been removed from consideration since the initial
application period, which started in the fall of 2013. Those 22 applicants had offered 70,421 acres
in the Mixed Grass ecoregion, 7,424 in the Sand Sagebrush ecoregion, 11,031 in the Shinnery Oak
ecoregion, and 14,416 in the Shortgrass ecoregion (84,664 total acres). Their applications were
withdrawn for a variety of reasons but many of them were because the acreage had been enrolled
in federal conservation program making it no longer eligible for the WAFWA program. WAFWA
did receive one new application for a term contract during 2016 that encompassed 1,000 acres in
the shortgrass ecoregion (Table 11). At the end of this reporting period, WAFWA had 51 active
term applications on file that encompassed 278,480 acres. WAFWA did not extensively advertise
the program during this reporting period because there were more than enough suitable active
applications already on file to meet industry demands. WAFWA will do targeted promotion of
the program when industry demand dictates that it is necessary.
When contracts are needed to offset industry impacts, all applications are ranked using an
established set of criteria. Those ranking criteria were developed by the Lesser Prairie- Chicken
Interstate Working Group (IWG) and can be viewed on the WAFWA website
(http://www.wafwa.org/initiatives/grasslands/lesser_prairie_chicken/). Offers are made to
landowners based on their ranking score and the availability of funds. During this reporting period,
there were 2 new contracts offered to landowners across the LPC range. Those offered contracts
contained 13,522 acres all of which was in the mixed grass ecoregion (Table 11).

Western Association of Fish and Wildlife Agencies March 2017
The 2016 Lesser Prairie-Chicken Range-wide Conservation Plan Annual Progress Report Page 51
Table 11. Summary of term applications received and offered contracts for the WAFWA offset unit
generation program. Data are summarized through the end of the current reporting period (December 31,
2016).
Ecoregion New
Applicationsa
New
Application
Acres
Open
Applications
on File
Open
Application
Acres
Contracts
Offered
During
Reporting
Period
Acreage
Contained in
Offered
Contracts
Sand
Sagebrush 0 0 7 29,883 0 0
Shortgrass 1 1,000 5 7,099 0 0 Mixed
Grass 0 0 30 220,877 2 13,522
Shinnery
Oak 0 0 9 20,620 0 0
Range-
Wide 1 1,000 51 278,480 2 13,522
a Applications that have been received from landowners during the reporting period. b Open applications are those still being considered for funding and includes new applications received during the
reporting period as well as those previously received.
Both term contracts offered during this reporting period were rangeland conservation plans. One
of the contracts was executed and the other was still pending approval from the landowner at the
time of this report. The executed contract is a 10-year term agreement that encompasses 1,222
acres in the Mixed Grass ecoregion (Table 12). There were also two more 10-year term contracts
executed in early 2016 that encompass an additional 4,380 acres. Those 2 contracts were offered
to landowners during the previous reporting period but were not executed until 2016. One of those
contracts was a planted grass plan and the other was a rangeland conservation plan. In total, there
were 3 new term contracts executed during this reporting period that encompassed 5,602
acres. There were no term contract offers declined by landowners during 2016 but there has been
a total of 6 declined offers since the inception of the WAFWA program totaling 22,334
acres. Those declined offered consisted of 3,706 acres in the Mixed Grass ecoregion, 7,424 acres
in the Sand Sagebrush ecoregion, 0 acres in the Shinnery Oak ecoregion, and 11,204 acres in the
Shortgrass ecoregion. The landowners who have declined offers to enroll in the WAFWA program
have indicated several reasons for their decisions including: insufficient payment rates, more
lucrative offers to enroll in other conservation programs, and conflicts of interest. At the end of
this reporting period, WAFWA was administering 13 term contracts that are all 10 years in
duration. Those contracts include 10 rangeland conservation plans and three planted grass
conservation plans that encompass 100,861 acres of which 82,502 are currently un-impacted by
development (Table 12, Appendices A-D).

Western Association of Fish and Wildlife Agencies March 2017
The 2016 Lesser Prairie-Chicken Range-wide Conservation Plan Annual Progress Report Page 52
Table 12. Acreage summary of WAFWA term contract offers declined and executed during 2016. The
total contracts and associated acres that were generating mitigation offset units on December 31, 2016 are
also reported.
Ecoregion Contracts Raw
Acresa Un-impacted
Acresb CHAT 1
Raw Acres CHAT 2
Raw Acres CHAT 3
Raw Acres CHAT 4
Raw Acres
Sand
Sagebrush
declined 0 0 0 0 0 0 0 executed 0 0 0 0 0 0 0 total
contracted 1
12,683 8,954 12,683 0 0 0
Shortgrass
declined 0 0 0 0 0 0 0 executed 2 4,380 3,974 4,281 0 99 0 total
contracted 4
9,513 8,847 5,389 4,024 99 0
Mixed
Grass
declined 0 0 0 0 0 0 0 executed 1 1,222 1,169 1,217 0 0 5 total
contracted 5
62,621 51,934 43,554 538 817 17,713
Shinnery
Oak
declined 0 0 0 0 0 0 0 executed 0 0 0 0 0 0 0 total
contracted 3
16,044 12,767 14,061 0 1,984 0
Range-
Wide
declined 0 0 0 0 0 0 0 executed 3 5,602 5,143 5,497 0 99 5 total
contracted 13
100,650 82,314 75,476 4,562 2,900 17,713 a Includes acreage impacted by development b Excludes acreage impacted by development utilizing the impact buffers established in the RWP

Western Association of Fish and Wildlife Agencies March 2017
The 2016 Lesser Prairie-Chicken Range-wide Conservation Plan Annual Progress Report Page 53
WAFWA PERMANENT CONSERVATION ACQUISITIONS
WAFWA has multiple options to provide permanent conservation for the LPC and each one results
in a conservation property that complies with the USFWS conservation banking policy (USFWS
2003). The options available to WAFWA include purchasing mitigation credits directly from
USFWS-approved conservation banks, fee-title acquisition of property from willing sellers, and
purchase of privately-owned development rights through acquisition of perpetual conservation
easements that are held by a 3rd party organization. WAFWA has pre-defined eligibility criteria
based on a property’s location, size, mineral ownership, and proximity to known LPC lek sites.
Properties that meet the initial eligibility requirements are ranked using criteria that prioritize
properties that will provide the greatest benefit to LPCs. The ranking criteria prioritize properties
based on size, existing developments, LPC habitat potential, proximity to other permanent
conserved sites, and proximity to known LPC lek sites. The permanent conservation eligibility
and ranking criteria can be downloaded from the WAFWA website
(http://www.wafwa.org/initiatives/grasslands/lesser_prairie_chicken/). A packet of information is
prepared for each eligible property once the rankings have been completed and the information is
presented to the LPCIC at either their summer or winter meeting. The LPCIC reviews all the
available options collectively and chooses which ones to pursue based on mitigation needs, ranking
scores, available funding, and cost. Properties do not start generating mitigation offset units until
all the requirements of the USFWS conservation banking policy (2003) have been satisfied which
includes a recorded perpetual easement and establishment of endowments to provide for future
management and monitoring costs.
During this reporting period, WAFWA secured one permanent conservation site in the Mixed
Grass ecoregion. This site consists of 1,781 acres of privately owned native rangeland of which
1,670 acres are in CHAT 1 (Table 13, Appendix A). WAFWA purchased a perpetual conservation
easement on the property which is held by Pheasants Forever. The easement preserves the
conservation values of the site which includes both the LPC habitat and the ranching
heritage. WAFWA also developed a dynamic management agreement that will be implemented
in perpetuity by the landowner. Finally, endowments were established to provide adequate
funding for future management actions and administration of the agreements. The property began
generating mitigation offset units in late 2016 following compliance with the USFWS
Conservation Banking Policy (2003).
WAFWA also acquired the title to a 29,718-acre ranch in the Sand Sagebrush ecoregion (Table
13, Appendix A). This ranch was acquired by WAFWA from a willing seller during June
2016. The entirety of the property consists of native sand sagebrush prairie and all but 124 acres
occurs in CHAT 1. Despite minimal survey effort, there have been 5 different LPC lek sites
documented on the property and within 3 miles of its perimeter within the last 5 years. WAFWA
will continue to manage the property as a working cattle ranch and the grazing rights are currently
leased to a private producer. A management agreement has been developed by WAFWA for the
property and it is currently being implemented by the lessee. However, the ranch has not yet
generated mitigation offset units because a perpetual conservation easement has not yet been
recorded. It is anticipated that will be done by the end of March 2017 along with all the other
requirements for the property to comply with the USFWS Conservation Banking Policy

Western Association of Fish and Wildlife Agencies March 2017
The 2016 Lesser Prairie-Chicken Range-wide Conservation Plan Annual Progress Report Page 54
(2003). When the final conservation easement is in place, the property will immediately begin
generating mitigation units that can be used to offset industry impacts to LPC habitat.
Table 13. Permanently conserved sites secured by WAFWA through the lesser prairie-chicken range-
wide conservation plan, 2016. WAFW
A Site ID Ecoregion
Acquisition
Type
Raw
Acres
Unimpacted
Acres
Easement
Holder
First Year of Mitigation
Offset Unit Generation
CZ026 Shinnery
Oak Fee Title 1,554 1,208
The Nature
Conservancy 2015
CZ063 Mixed
Grass
Conservation
Easement 1,781 1,759
Pheasants
Forever 2016
CZ024 Sand
Sagebrush Fee Title 29,718 28,915
Not Completed 2017a
Total Range-
Wide
NA
33,053
31,882 NA
NA a It is anticipated that all the pieces will be in place by the end of March 2017 to be able to generate mitigation offset
units from this property.
NA = not applicable
In total, WAFWA has now secured 3 permanent conservation sites totaling 33,053 acres across 3
different ecoregions (Table 13). Prior to the end of this reporting period, all the necessary
requirements were in place to comply with the USFWS Conservation Banking Policy (2003) on 2
of the 3 sites (3,335 acres). Thus, both of those sites produced mitigation offset units during this
reporting period. It is anticipated that the remaining work will be completed on the Sand
Sagebrush property early in the next reporting period. WAFWA is also actively pursuing
additional new permanent conservation opportunities and it is anticipated that some of them will
also be finalized during the next reporting period.
WAFWA HABITAT RESTORATION EFFORTS
The WAFWA conservation agreements are not only maintaining existing LPC habitat but they are
facilitating the restoration of areas that are not likely currently occupied by the species. WAFWA
prescribes restoration practices when they are necessary to address an identified threat to the
species on contracted acreage. WAFWA can prescribe 3 different levels of mechanical brush
management which are all used to remove invasive woody vegetation (e.g. eastern red cedar and
mesquite). Chemical brush management can also be prescribed but only for the reduction of dense
stands of Shinnery Oak on tight soils. The objective of chemical treatments is to reduce the
dominance of the Shinnery Oak to encourage an increase in native grass distribution and
abundance. WAFWA also prescribes range planting which is used to convert non-native
grasslands or cropland to native vegetation which provides more suitable LPC habitat. WAFWA
also encourages prescribed burning on all contracted acreages to help maintain suitable vegetation
and prevent future encroachment of woody plants. Participants are not required to implement a
prescribed burn plan but it is encouraged and WAFWA biologists facilitate the development of
professional burn plans for all willing landowners.
Since inception of the WAFWA program, restoration practices have been completed on 12,476
acres of which 4,123 acres were completed during the 2016 calendar year (Table 14). Most of the

Western Association of Fish and Wildlife Agencies March 2017
The 2016 Lesser Prairie-Chicken Range-wide Conservation Plan Annual Progress Report Page 55
completed restoration to this point has been brush management in the Shinnery Oak and Mixed
Grass ecoregions. However, some range planting was also completed in the Shortgrass ecoregion
during the last reporting period. An additional 5,078 acres are prescribed for subsequent years
through the existing conservation agreements. Over the next few years, the existing 15 agreements
will have facilitated restoration on 16.9% of all the acreage contained within them (17,554 of
103,985 acres).
Table 14. Acreage of restoration completed and prescribed under WAFWA conservation agreements
through the end of the 2016 reporting period.
Ecoregion
Brush
Management
(Heavy)
Brush
Management
(Moderate)
Brush
Management
(Light)
Brush
Management
(Chemical)a
Range
Planting Total
Sand Sagebrush
Completed During
Reporting Period 0 0 0 0 0 0
Completed Since
Inception of RWP 0 0 0 0 0 0
Total Prescribed 0 0 0 0 0 0
Shortgrass
Completed During
Reporting Period 0 0 0 0 242 242
Completed Since
Inception of RWP 0 0 0 0 242 242
Total Prescribed 0 0 0 0 620 620
Mixed Grass
Completed During
Reporting Period 1,011 311 0 0 0
1,322
Completed Since
Inception of RWP 1,011 710 377 0 0
2,098
Total Prescribed 1,011 768 1,145 0 0 2,924
Shinnery Oak
Completed During
Reporting Period 0 1,687 1 551 320
2,559
Completed Since
Inception of RWP 0 1,687 1 8,128 320
10,136
Total Prescribed 1,148 4,094 1 8,128 640 14,011
Range-Wide
Completed During
Reporting Period 1,011 1,998 1 551 562
4,123
Completed Since
Inception of RWP 1,011 2,397 378 8,128 562
12,476
Total Prescribed 2,159 4,861 1,146 8,128 1,260 17,554 a This practice is only applied for the specific purpose of suppressing dense stands of Shinnery Oak on tight soils.

Western Association of Fish and Wildlife Agencies March 2017
The 2016 Lesser Prairie-Chicken Range-wide Conservation Plan Annual Progress Report Page 56
QUALITY OF WAFWA CONTRACTED PROPERTIES
The properties that produced mitigation offset units during 2016 ranged in size from 310 acres to
27,629 acres (Tables 15). Three of those agreements totaling 1,246 acres include planted grass
conservation plans which prescribe restoration of cropland to native grasses and maintenance of
restored or existing planted grass stands through regular disturbance activities. Twelve of the
agreements include rangeland conservation plans that prescribe domestic livestock grazing as the
core conservation practice. Most of the acreage (75.2%) being managed through the existing
agreements occurs in the highest priority areas (CHAT 1). There have also been 44 LPC lek
observations recorded on these properties or within three miles of their boundary during the last
five years. That is a high number considering that there has not been any known survey effort
associated with 5 of the properties and only 39% of the total affected area is known to have been
surveyed within the last 5 years. To increase that coverage, WAFWA will establish permanent
LPC lek survey locations on and around all enrolled conservation properties. WAFWA biologists
will attempt to survey each location at least once every 5 years and their efforts will begin during
spring 2017.
The habitat quality was also generally high across 15 sites that produced mitigation offset units in
2016 (Table 15). The average habitat quality score was 0.63 across all those sites in 2016. The
site-specific values were derived by scoring the HEG criteria using on-site vegetation sampling
data and spatial land cover information. The HEG includes four components consisting of foliar
cover, plant species composition, presence of tall woody vegetation, and availability of potentially
suitably habitat within 1-mile radius of the site (Van Pelt et al. 2013). Prescribed restoration efforts
had not yet been fully completed on several of the properties prior to the 2016 vegetation sampling
which is why a few sites scored low. The HEG scores associated with those properties should
improve greatly in the coming years as more of the restoration work gets completed. Graphs
depicting trends in the HEG scores will be provided in next year’s report when we have ≥3 years
of data for many of our enrolled properties.

Western Association of Fish and Wildlife Agencies March 2017
The 2016 Lesser Prairie-Chicken Range-wide Conservation Plan Annual Progress Report Page 57
Table 15. Property-specific information for each of the 15 WAFWA-contracted sites that produced
mitigation offset units during the 2016 reporting period.
WAFWA
Site ID Ecoregion Conservation
Plan Type Expiration
Year Primary
CHAT Total
Acres
Active Lek
Observations
within 3 mi. (2012-
2016)b
2016 Habitat
Evaluation Guide
Score (0-1)c
CZ016 Sand
Sagebrush Rangeland 2024 1 12,683 0 0.75
CZ061 Shortgrass Rangeland 2025 1 3,760 3 0.46
CZ062a Shortgrass Planted Grass 2025 1 620 3 0.02
CZ035 Shortgrass Rangeland 2024 1 1,109 6 0.51
CZ033 Shortgrass Rangeland 2024 2 4,024 0 0.32
CZ008 Mixed Grass Rangeland 2024 1 2,048 5 0.44
CZ038 Mixed Grass Rangeland 2024 1 21,256 0 0.60
CZ037 Mixed Grass Rangeland 2024 4 10,255 0 0.68
CZ036 Mixed Grass Rangeland 2024 1 27,629 0 0.80
CZ040d Mixed Grass Rangeland 2026 1 1,222 3 ND
CZ063 Mixed Grass Rangeland Perpetual 1 1,781 2 0.73
CZ014 Shinnery
Oak Planted Grass 2024 1 310 3 0.68
CZ003
Shinnery
Oak Rangeland 2024 1 15,418 2 0.39
CZ026
Shinnery
Oak Rangeland Perpetual 1 1,554 0 0.85
CZ013
Shinnery
Oak Planted Grass 2024 1 316 20 0.85
Total Range-
Wide NA NA NA
103,98
6 44e 0.63
a Habitat quality was poor because the site was newly enrolled cropland and native grasses had not yet established. b The WAFWA database indicates that only 39% of the affected area has been surveyed within the last 5 years. c Values are averaged across the evaluation units and weighted by the unimpacted acreage within each one. d Property was enrolled in 2016 and generated half of its expected year 1 offset units but implementation of the management
agreement won’t begin until spring 2017. Vegetation monitoring and the associated HEG scoring is not required prior to
implementation. e The total is less than the sum of the column because some lek sites occur within 3 miles of multiple enrolled properties.
ND = no data
NA = not applicable
WAFWA CONSERVATION AGREEMENT SUMMARY
Through this reporting period, WAFWA has enrolled 112,898 acres across the LPC range under
some type of conservation agreement (Table 14, Table 15). Most of that acreage is generating
conservation offset units (103,986 acres) with the majority occurring in the highest priority areas
(CHAT 1; Table 15). Only 3.2% of those acres are permanently conserved but that percentage
will jump to ~25% when the 29,718-acre WAFWA ranch begins generating conservation offset

Western Association of Fish and Wildlife Agencies March 2017
The 2016 Lesser Prairie-Chicken Range-wide Conservation Plan Annual Progress Report Page 58
units this spring. Through existing WAFWA conservation agreements there has already been
12,476 acres restored to more suitable LPC habitat with another 5,078 prescribed. The 15 term and
permanent conservation sites are distributed across the four ecoregions proportional to the
distribution of industry impacts. This is required because the conservation properties must mitigate
industry impacts at that scale. Thus, the majority of the acreage contracted for mitigation purposes
falls within the Mixed Grass ecoregion where the majority of the RWP industry impacts have
occurred (Table 15, Appendix A).
NON-WAFWA CONSERVATION PROGRAMS ADMINISTERED WITHIN LPC RANGE
A critical component of the RWP was coordination among the various agencies and organizations
that were already managing public land acreage or delivering private land conservation programs
in LPC range. During development of the RWP those entities were engaged by the Interstate
Working Group (IWG) through a series of targeted meetings and representatives from each agency
or organization were included on several committees to help provide input about various plan
components. The IWG also established state-specific implementation teams including
representatives from those entities to coordinate local delivery of private land LPC assistance
programs. At that time, the members of the implementation teams reviewed their current cross-
agency coordination, identified opportunities for improvements, and discussed how landowners
could be provided with “one stop shopping”. Most of the agencies and organizations operating in
LPC range are now using the WAFWA crucial habitat assessment tool to target their private land
conservation programs due in part to those coordination efforts. Those WAFWA partners have
also worked collectively to promote and explain the various conservation options and put more
boots on the ground to assist landowners. Additionally, all of the partnering conservation entities
are collectively working toward the population and habitat goals established in the RWP. The
current effort of our partners is summarized in this section along with a synopsis of our collective
achievements.
LESSER PRAIRIE-CHICKEN CONSERVATION INITIATIVE AND OTHER NRCS
PROGRAMS
In 2010, NRCS launched the Lesser Prairie-Chicken Conservation Initiative (LPCI). The objective
of this initiative is “to increase the abundance and distribution of the LPC and its habitat while
promoting the overall health of grazing lands and the long-term sustainability of ranching
operations.” The USFWS completed a biological opinion of the LPCI on August 13, 2014. The
NRCS continues to apply conservation practices within the standards laid out in the biological
opinion even though the LPC is not currently receiving federal protections under the ESA. The
opinion provides a description of 28 conservation practices that could be implemented through the
program that the USFWS deemed to be benign or beneficial to LPCs.
Two of the 28 approved practices are considered core conservation practices. The primary core
conservation practice is upland wildlife habitat management (645). Prescribed grazing (528) is
considered a secondary core management practice when livestock are present. Implementation of
core practices is required to develop a landowner’s conservation plan that focuses on improving
habitat and reducing threats to LPC. This is important because implementing LPCI under 645
ensures all other LPCI practices are implemented specifically to benefit LPCs.

Western Association of Fish and Wildlife Agencies March 2017
The 2016 Lesser Prairie-Chicken Range-wide Conservation Plan Annual Progress Report Page 59
Three of the practices applied under 645 are applied broadly and provide substantial benefit to
LPC. Those practices include the other core practice of prescribed grazing (528), brush
management (314), and range planting (550). Those practices, when applied as designed, either
create new habitat or ensure that existing habitat is providing usable cover for all the LPC life
stages. There are many other practices being applied through LPCI that provide benefit to
LPC. However, we only summarize the acreage for those 3 practices because they are among the
most beneficial to the LPC and they provide a reflection of the unique enrolled acreage (528) and
the new acres of restored habitat (314 and 550).
WAFWA was unable to acquire a summary of the 2016 LPCI accomplishments. A new
memorandum of understanding (MOU) is being developed for data sharing and it was not yet
completed at the time this report was finalized. It is anticipated that the new MOU will be
completed during Spring 2017 so future WAFWA annual reports should once again contain the
most up-to-date information about LPCI. In the interim, the LPCI data from 2015 are reported to
provide perspective about the amount of annual work typically accomplished by NRCS through
their LPCI. In 2015, a total of 179,805 acres of prescribed grazing (528) were applied through
LPCI (Table 19, Appendices A-B). Additionally, a total of 9,438 acres were treated with brush
management (314) and range planting (550) was applied to 47 acres. Many of those acres were
previously unusable by LPC and all the acres were at least in a degraded condition prior to
treatment. In addition to the applied practices that occurred in 2015, there were 114,438 additional
acres added to the program upon which practices were scheduled to occur during subsequent years.
Producers participating in other NRCS programs are also using conservation practices as described
in the biological opinion if it is determined that their property has habitat or potential habitat for
LPC. Producers in this situation are not required to implement these practices under a management
plan developed in accordance with the core practice of upland wildlife habitat management (645)
but the practices they implement generally still provide benefit to LPC. The acres from those other
NRCS programs (e.g. EQIP) were not available at the time of this report but it should be noted that
NRCS is applying beneficial conservation on a far greater number of acres than reported or LPCI.
CONSERVATION RESERVE PROGRAM (CRP)
The CRP is a voluntary program for agricultural landowners administered by the Farm Service
Agency (FSA) that incentivizes landowners to take cropland out of production and maintain it in
permanent vegetation (e.g. native grasses and forbs). The conversion of these lands back to
permanent vegetation promotes habitat connectivity, which helps address LPC threats like climate
change and extreme weather events. The program also addresses the threat of excessive grazing
utilization of grassland habitat by providing millions of acres of grass that isn’t regularly grazed
by domestic livestock. Participants in the program are required to maintain the prescribed
vegetation conditions which include regular control of noxious weeds. They are also required to
implement some type of periodic management to promote wildlife habitat. The various
management practices that can be implemented include shallow disking, prescribed burning,
herbicide usage, inter-seeding with legumes and forbs, and periodic managed grazing. The
USFWS completed a biological opinion of the CRP on April 14, 2014 which states that effective
implementation of the program is anticipated to result in a positive LPC population response by

Western Association of Fish and Wildlife Agencies March 2017
The 2016 Lesser Prairie-Chicken Range-wide Conservation Plan Annual Progress Report Page 60
reducing or eliminating adverse effects. The FSA continues to apply conservation practices within
the standards laid out in the biological opinion even though the LPC is not currently receiving
federal protections under the ESA.
There is fluidity in CRP enrollment as individual contracts expire at the end of a 10 or 15-year
term and new contracts get enrolled in other locations. These acres provide important habitat for
LPC and support a large proportion of the range-wide population; especially in the shortgrass
ecoregion (Fields 2004, Rodgers and Hoffman 2005, McDonald et al. 2014, Spencer et al.
2017). The most recent data available to WAFWA (August 2016) indicates that 3,230,432 acres
are enrolled within the range of the LPC (Table 19; Appendices A-B). Of those acres, there are
786,869 that lie within the boundaries of CHAT 1 and CHAT 2 which equates to 8.3% of that total
area. The total CRP enrollment in LPC range differs by only 582 acres from what was reported in
the last WAFWA annual report. However, there were likely substantial changes to the enrolled
acreage between August and the end of the calendar year due to scheduled expirations and a few
new enrollments. Those acreage changes will appear in the next data update that WAFWFA
receives from FSA and they will be reported in our next annual report.
PARTNERS FOR FISH AND WILDLIFE PROGRAM
The USFWS Partners for Fish and Wildlife (PFW) Program restores, improves and protects fish
and wildlife habitat on private lands through partnerships between the USFWS, landowners and
others. The objectives of this national program are to: 1) Restore, enhance and manage private
lands for fish and wildlife habitat, 2) Significantly improve fish and wildlife habitat while
promoting compatibility between agricultural and other land uses, 3) Restore declining species and
habitats; and 4) Promote a widespread and lasting land use ethic.
The PFW program applies habitat practices on private lands to address threats to the LPC. This
program utilizes practices and targets limiting factors similar to NRCS programs. Projects are
designed to benefit LPC and other wildlife while also supporting working lands including farming
and ranching operations. Typical conservation practices directed to LPC habitat conservation
include invasive species removal, fence marking or removal, native vegetation planting, prescribed
fire, prescribed grazing, and brush control. Through the PFW, the USFWS provides technical
assistance and financial incentives to landowners that improve habitat on their property for LPC
and other species. Cooperating landowners agree to use funds for approved wildlife-related
projects, and manage and maintain the project area for at least 10 years. The program provides
technical and financial assistance through a 10-year cost-share agreement. Landowners agree to
maintain the conservation practices for the duration of the agreement.
The USFWS provided data from their PFW program in all 5 states occupied by LPC. During this
reporting period, the USFWS implemented restoration and improvement practices on 10,782 acres
within the LPC action (Table 19). Those acres were distributed between the Shinnery Oak (630
acres) and Mixed Grass ecoregions (10,152 acres; Table 19, Appendices A-B). Mechanical
removal of eastern red cedar and prescribed fire were the two primary practices that were
implemented.

Western Association of Fish and Wildlife Agencies March 2017
The 2016 Lesser Prairie-Chicken Range-wide Conservation Plan Annual Progress Report Page 61
CANDIDATE CONSERVATION AGREEMENTS
Candidate Conservation Agreements (CCA) are formal, voluntary agreements between the
USFWS and one or more parties to address the conservation needs of a candidate species or a
species likely to become a candidate. Participants voluntarily commit to implement specific actions
designed to remove or reduce threats to the covered species. They can be entered by industry or
landowners and strong participation can be sufficient to preclude the need to list a species. There
are no payments, specific permits, or assurances associated with a CCA and they are entered
primarily by federal agencies or other entities operating on federally-owned lands. Candidate
Conservation Agreements with Assurances (CCAA) are formal agreement between the USFWS
and non-federal entities. A CCAA differs from a CCA in that it includes a permit that provides
assurances that the holder will never be required to implement additional conservation measures
beyond those in the agreement. These assurances apply even if the species is eventually listed
under the Endangered Species Act.
Landowner CCAs and CCAAs require the development of site-specific management plans for
addressing LPC threats in the following manner:
● Agricultural conversion: Landowner commits to refrain from plowing additional rangeland
when they are in the program. ● Loss of CRP: Landowner commits to re-enrolling or maintaining expired CRP in grass
when they are in the program.
● Woody invasive species: Landowner commits to addressing the spread of these species as
funding sources become available.
● Shrub control: Agreements restrict sand shinnery control but allow for shinnery oak
suppression using reduced rate chemical application.
● Altered fire regimes: Agreements use prescribed fire as a potential option for management
and provide cost share options for its application.
● Collision: Agreements require fence marking near known leks. ● Design grazing management plans for incompatible grazing regimes to meet habitat
specific goals for individual ranches. This may include stocking rates, rotation patterns,
grazing intensity and duration, and contingency plans for varying prolonged weather
patterns including drought. ● Climate Change: Increased habitat quality, quantity, and connectivity through the above
actions to improve the ability of the LPC to move and respond to climate change. ● Extreme weather events: Increased habitat quality, quantity, and connectivity improve the
ability of the LPC to move and respond to weather events like droughts and storms.
● Predation: Increased habitat quantity and improved habitat quality decrease predation on
nests, juveniles and adults.
● Disease: Increased habitat quality results in improved physical condition of individual
LPC.
There is a CCA available to landowners operating on public land in New Mexico and CCAAs
available to all other landowners in New Mexico, Texas, and Oklahoma. The New Mexico CCA
and CCAA are administered by the Center of Excellence for Hazardous Materials Management
(CEHMM). The Oklahoma and Texas CCAAs are administered by ODWC and TPWD,

Western Association of Fish and Wildlife Agencies March 2017
The 2016 Lesser Prairie-Chicken Range-wide Conservation Plan Annual Progress Report Page 62
respectively. Enrollment is currently open for the CCAA in Texas and the CCA/CCAA in New
Mexico. The ODWC is not currently taking new enrollments into their CCAA because they have
reached their acreage cap of 400,000. Currently, implementation is occurring on 890,909 acres
enrolled in the landowner CCA in New Mexico and 2,923,552 acres enrolled in all three CCAAs
within the WAFWA EOR+10 (Table 16, Appendices A-B).
NON-CCAA PRIVATE LAND CONSERVATION PROGRAMS DELIVERED BY STATE
WILDLIFE AGENCIES
Most of the state wildlife agencies operating within the range of the LPC deliver non-CCAA
private land conservation programs. Those programs are funded from a variety of sources
including license fee funds from the wildlife agency constituents. The available conservation
programs generally allow the agencies to cost-share with private landowners for conservation
practices such as brush management, range planting, prescribed fire, fence marking and removal,
prescribed grazing, livestock deferment, etc. WAFWA acquired data from 4 of the 5 state wildlife
agencies operating within LPC range including the Texas Parks and Wildlife Department (TPWD),
Oklahoma Department of Wildlife Conservation (ODWC), Kansas Department of Wildlife, Parks,
& Tourism (KDWPT) and Colorado Parks and Wildlife (CPW). The available data indicated that
the state wildlife agencies applied conservation practices to at least 40,960 acres within the LPC
EOR+10 within the 4 states from which data were provided (Table 16, Appendices A-B).
NON-WAFWA PROPERTIES IDENTIFIED AS POTENTIAL STRONGHOLDS
Several land trusts, government agencies, and for-profit businesses are managing land for the
benefit of LPC or delivering conservation easements within the range of the species. Some of these
sites were identified as potential stronghold sites in the RWP (Van Pelt et al. 2013). Subsequently,
there have been 3 USFWS-approved conservation banks created in LPC range that also fall into
this category. The total acreage encompassed by all the properties in this category is 466,474
(Table 16, Appendices A-B). Those sites include properties under private ownership as well as
those owned and managed by state and federal agencies. It is believed that a fair number of those
acres are already permanently conserved sufficiently to qualify as a stronghold (USFWS 2012).
However, the exact spatial extent of all the qualifying acreage has not yet been identified by
WAFWA. WAFWA will continue to try and identify the exact location of all qualifying
stronghold acreage so that we can more accurately track progress towards the stronghold goals
established in the RWP. WAFWA is committed to getting at least one stronghold established
within each of the four ecoregions through the collective efforts of all entities who have secured
qualifying acreage.
OTHER PUBLIC LANDS AND NON-GOVERNMENT ORGANIZATION LAND
OWNERSHIP
There are an additional 3,161,200 acres of land within the LPC EOR+10 owned by public entities
or non-government conservation organizations excluding those sites that have already been
identified as potential strongholds in the RWP (Table 16, Appendices A-B). These acreages are
owned by Department of Defense; Non-Government Organizations; State Land Boards; State
Parks, Recreation, and Wildlife Agencies; Fish & Wildlife Service; Bureau of Land Management;
Forest Service; Privately Owned Parks; National Park Service; Agricultural Research Service;

Western Association of Fish and Wildlife Agencies March 2017
The 2016 Lesser Prairie-Chicken Range-wide Conservation Plan Annual Progress Report Page 63
Bureau of Reclamation; and City or County Government. This acreage is managed for a multitude
of purposes and some of the properties currently provide benefits to LPC. There is potential to
improve LPC habitat on some of these properties through partnerships with the
landowners. WAFWA and its state wildlife agency members readily pursue those opportunities
when they arise.
SUMMARY OF ALL CONSERVATION EFFORTS BEING DELIVERED IN LPC RANGE
It is evident that an enormous amount of effort continues to be placed on conserving the LPC
across its range (Table 16, Appendices A-B). There are numerous voluntary conservation
programs being delivered on private lands by multiple government agencies and non-government
organizations. However, some of the reported non-mitigation acreages overlap so it is not possible
to identify the total number of unique acres enrolled in private land conservation programs across
the range. Additionally, WAFWA was not able to acquire the most current enrollment data for
some of the programs. Despite those imprecisions, it is likely that during 2016 there was at least
6.4 million acres of private land enrolled in voluntary conservation programs across the LPC
range. This amount equates to approximately 16% of the 40 million acre LPC range that is in
CHAT 1 – CHAT 4. It is also apparent the private land programs are being targeted towards the
higher priority LPC areas as evidenced by a higher percentage of CHAT 1 and CHAT 2 acreages
being enrolled in some type of voluntary conservation program (Table 16; Appendices A - B). The
approximate range-wide percentage of each CHAT priority area enrolled in a private land
conservation program is as follows: CHAT 1 (17.0%), CHAT 2 (13.9%), CHAT 3 (12.6%), and
CHAT 4 (7.0%). The good conservation practices being implemented by landowners outside of
voluntary conservation programs should not be overlooked. Private landowners are managing
thousands of additional acres across the LPC range in a way that is beneficial to the species without
participating in any of the available programs. Their efforts should not be discounted just because
they can’t be easily quantified.

Western Association of Fish and Wildlife Agencies March 2017
The 2016 Lesser Prairie-Chicken Range-wide Conservation Plan Annual Progress Report Page 64
Table 16. Public land and conservation program acreage within each LPC ecoregion by CHAT category,
2016.
Ecoregion
– Location Total Area
WAFWA
Term
Contracts
WAFWA
Permanent
Conservation
Agreementsa
WAFWA
Non-Offset
Agreements
Conservation
Reserve
Program
NRCS
Lesser
prairie-
chicken
initiativeb
USFWS
Partners
for Fish
&
Wildlife
State
Wildlife
Agency
Private
Land
Programsc
New
Mexico
Ranching
CCA
New
Mexico
Ranching
CCAA
Texas
Ranching
CCAAd
Oklahoma
Ranching
CCAAe
Potential
Stronghold
Acreagef
Other Public
and
Conservation
Propertiesg
Total Public
and
Conservation
Acreageh
Shinnery
Oak
CHAT 1 1,046,405 14,088 1,057 0 109,303 60,015 630 ND ND ND 48,262 NA 363,402 60,052 656,809
CHAT 2 892,804 0 396 0 131,763 9,008 0 ND ND ND 17,433 NA 0 91,836 250,436
CHAT 3 5,917,159 2,001 110 0 676,183 21,344 0 ND ND ND 109,537 NA 12,525 1,565,979 2,387,679
CHAT 4 3,177,658 16 0 0 201,460 2,013 0 ND ND ND 20,579 NA 0 530,575 754,643
Total 11,034,026 16,105 1,563 0 1,118,710 92,381 630 3,175 890,909 1,597,529 195,811 NA 375,927 2,248,442 6,541,182i
Mixed
Grass
CHAT 1 2,576,012 43,331 1,670 1,071 124,481 43,999 4,865 65 NA NA 241,985 145,943 49,693 46,293 703,396
CHAT 2 1,116,165 536 0 0 65,464 5,366 0 ND NA NA 33,055 40,616 71 18,279 163,387
CHAT 3 5,185,506 823 0 965 285,731 16,115 5,287 ND NA NA 81,093 158,134 1,735 160,373 710,257
CHAT 4 3,768,280 17,726 111 6,875 134,287 2,420 0 ND NA NA 56,598 23,409 0 31,477 272,936
Total 12,645,963 62,473 1,782 8,912 609,963 67,900 10,152 31,488 NA NA 412,731 368,102 51,499 256,422 1,881,424
Sand
Sagebrush
CHAT 1 1,583,367 12,682 0 0 154,889 9,758 0 3,939 NA NA NA NA 33,884 195,977 411,130
CHAT 2 245,121 0 0 0 19,915 0 0 0 NA NA NA NA 0 13,679 33,594
CHAT 3 1,883,282 0 0 0 339,557 136 0 111 NA NA NA NA 24,430 170,347 534,581
CHAT 4 4,322,390 0 0 0 414,937 396 0 1,102 NA NA NA NA 16,152 255,026 687,613
Total 8,034,160 12,682 0 0 929,297 10,289 0 5,152 NA NA NA NA 74,466 635,028 1,666,915
Shortgrass
CHAT 1 1,872,009 5,394 0 0 169,747 8,082 0 353 NA NA NA NA 17,940 15,183 216,699
CHAT 2 183,681 4,029 0 0 11,308 0 0 80 NA NA NA NA 0 0 15,417
CHAT 3 1,769,583 99 0 0 155,228 975 0 56 NA NA NA NA 17,280 0 173,638
CHAT 4 4,820,373 0 0 0 236,230 178 0 656 NA NA NA NA 0 6,126 243,190
Total 8,645,645 9,522 0 0 572,512 9,235 0 1,145 NA NA NA NA 35,220 21,308 648,942
Range-
wide
CHAT 1 7,077,792.5 75,495 2,727 1,071 558,419 121,854 5,495 4,357 ND ND 290,248 145,943 464,919 317,504 1,988,032
CHAT 2 2,437,771.2 4,565 507 0 228,450 14,375 0 80 ND ND 50,489 40,616 71 123,794 462,947
CHAT 3 14,755,529.9 2,923 110 966 1,456,699 38,570 5,287 167 ND ND 190,630 158,134 55,970 1,896,699 3,806,155
CHAT 4 16,088,701.0 17,743 111 6,908 986,914 5,006 0 1,758 ND ND 77,177 23,409 16,152 823,204 1,958,382
Grand
Total 40,359,794.6 100,782 3,344 8,912 3,230,482 179,805 10,782 40,960i
890,909 1,055,999 608,542 368,102 537,112 3,161,200 10,738,463i
ND = no data provided; NA = not applicable a The WAFWA acquired 1,604 acres but the existing perimeter fence does not currently encompass the entire property. The fence will be moved to the correct boundary in the near future so that a WAFWA management plan can be implement across the entire property. b These figures represent the acres of prescribed grazing (528) that were implemented in 2015. This practice is a core conservation practice that is supposed to occur on every contracted LPCI acre. The acreage contained within other NRCS programs was not available for this report but those
efforts also provide benefit to the LPC. c The acreages are not unique because they are summed across numerous conservation practices that could have overlapped. d An additional 42,085 acres are enrolled outside the CHAT areas because the eligibility area for the program is larger than the CHAT boundary. e An additional 26,942 acres are enrolled outside the CHAT areas because the eligibility area for the program is larger than the CHAT boundary. f Includes acreages from properties identified as potential strongholds in the WAFWA range-wide plan (Van Pelt et al. 2013) and properties contained with USFWS conservation banking agreements. These figures do not include the acres that have been permanently conserved through the
WAFWA program. g This category includes other protected or publicly owned properties not identified as potential strongholds in the range-wide plan. These acreages are owned by U.S. Department of Defense, Non-Government Organizations, State Land Boards, State Parks, Recreation, and Wildlife Agencies,
U.S. Fish & Wildlife Service, U.S. Bureau of Land Management, U.S. Forest Service, Privately Owned Parks, U.S. National Park Service, Agricultural Research Service, U.S. Bureau of Reclamation, and City or County Government. The acreages also include privately owned sites contained
within conservation easements. h Some of the acreages overlap the same areas and no data were available for some of the listed programs or the EQIP which also provides benefit to LPC. i The total is greater than the sum of the CHAT-specific acreages because some of the figures were not reported at the finer scale.

Western Association of Fish and Wildlife Agencies March 2017
The 2016 Lesser Prairie-Chicken Range-wide Conservation Plan Annual Progress Report Page 65
There are also millions of acres of publicly owned land and conservation easements within the
range of the LPC. Many of those tracts are being managed in a way that is beneficial to LPC and
some of them even meet all the criteria to be counted towards a stronghold as defined by the
USFWS (USFWS 2012). WAFWA has not yet been able to identify exactly how many of those
acres fall into each of those categories. However, there are roughly 466,000 acres across the LPC
range that meet at least some of the qualifying stronghold criteria (Van Pelt et al. 2013; Table 16;
Appendices A-B). WAFWA will likely be able to count some of that acreage towards strongholds
along with the 3,344 acres of permanent conservation that has been acquired by WAFWA and the
29,717-acre acquisition once the conservation easement is in place. In addition to those areas there
are nearly 3.2 million more acres of land within the LPC range owned by a government entity or
encumbered by some type of easement. These acreages were not identified in the RWP as potential
strongholds because they are not generally owned by entities that identify conservation as their
primary mission or the site does not have much potential to provide LPC habitat. The acreage in
this category with LPC habitat potential does provide some opportunity to benefit the
species. Thus, WAFWA and our member state wildlife agencies will seek to work with the entities
that own or operate those lands when opportunities arise to improve or maintain habitat for LPC.
WAFWA MITIGATION TRACKING
WAFWA’s mitigation framework incentivizes avoidance and minimization of impacts to LPC
habitat from development. The metrics system within this framework also provides a pathway to
mitigate for new impacts to habitat through a biologically-based system that incorporates project
location, duration, affected acreage, and habitat quality (Van Pelt et al. 2013). The system utilizes
a 2:1 mitigation ratio to ensure that mitigation offsets are greater than impacts which results in a
net conservation benefit for the LPC. Offsetting mitigation units must be secured from the same
ecoregion as a planned impact and assigned to the project before construction can start. In
addition, the offsetting conservation must occur in a location that is of equal or higher priority for
LPC conservation as defined by the CHAT.
Industry sites annually produce mitigation impact units in perpetuity based on a one-time
assessment that is completed prior to construction. The annual impact units are entered into the
mitigation ledger each year and must be continually balanced with conservation forever. WAFWA
can provide perpetual conservation for each of the impact sites because the mitigation fees are
assessed after an endowment multiplier has been applied to the impact units. That endowment
multiplier is currently set at 25 and is based on a 4% expected rate of return on WAFWA
investments. The mitigation fees are assessed on the endowment impact units after the multiplier
has been applied. Thus, the assessed mitigation fees produce enough interest to provide for annual
payments to landowners who are implementing offsetting conservation actions.
Conservation offset units are generated from WAFWA term and permanent conservation sites.
One-half of the expected annual conservation offset units are immediately generated upon
execution of a management agreement. The true number of annual units produced in year one of
an agreement is calculated using vegetation data collected during the breeding season (March 15
– July 15). The difference between the calculated year one total and the initial release is then
generated and available to offset industry projects. In subsequent contract years, all the annually

Western Association of Fish and Wildlife Agencies March 2017
The 2016 Lesser Prairie-Chicken Range-wide Conservation Plan Annual Progress Report Page 66
generated conservation offset units are released upon completion of the breeding season vegetation
monitoring. The maximum rate that offset units may be generated is 1.25 units per acre per year
where the habitat quality is perfect (HEG = 1.0) and the property falls within a focal area.
Remediation offset units are generated one-time upon removal of an existing impact’s
infrastructure and completion of native grass seeding activities. If the remediated impact was
previously mitigated through the plan the resulting remediation offset units are calculated using
the mitigation impact multipliers that are utilized for industry sites. So, the resulting remediation
offset units will equal the impact units that were originally calculated for the site if the habitat
quality has not changed. If the remediated site was not previously mitigated through the plan, the
remediation offset units are calculated using the mitigation offset multipliers that are utilized for
conservation sites. Using the offset multipliers results in half the remediation units that would be
generated by using the impact multipliers (i.e. 2:1 mitigation ratio).
Participating companies can use conservation offset units, remediation offset units, or in some
cases, a combination of the two to mitigate future impacts. The two types of offset units have the
same mitigation value, but they do have different utility. Conservation offset units are purchased
by industry participants on a first-come first-served basis. Construction of a project being mitigated
with conservation offset units must begin within one year of the units being assigned. If
construction has not started by that date, WAFWA can reallocate the conservation offset units to
another project and credit the company’s account with the original purchase amount. The
company will then have to re-submit their project and get different offset units assigned to it before
they can begin construction of their project. Remediation offset units are reserved for the company
that completed the restoration work. The company that owns the resulting remediation offset units
can use them toward a future mitigation need or continue purchasing conservation offset units. The
RWP requires that remediation units be used to offset any new impacts that occur in reporting
units that exceed the impact goals for CHAT 1 (30%) and CHAT 2 (60%). Appendices C-D track
progress to date. A participant company may choose to bank their remediation offset units if they
anticipate having future projects within an area that is approaching or currently exceeding the
established impact goal. A company can also sell their remediation offset units directly to another
WAFWA participant who has a need for that type of mitigation.
INDUSTRY IMPACT UNIT GENERATION
In this portion of the report, impact generation at the scale of ecoregions, CHAT categories, and
agreement types will be provided. Impact unit generation and mitigation fees are summarized at
the reporting unit scale in Appendices E-F. For the 2016 reporting period, there were 114 projects
that had 3,179 annual impact units and paid $4,172,852 in mitigation fees. By ecoregion, the
Shinnery Oak region had the most projects (73 or 64.6%), however, the Mixed grass region had
the most impacts (3,069 or 96.5%) (Table 17). This difference was due to most of the impacts in
the Shinnery Oak region being infield drilling with little new impact, and two wind power facilities
being completed in the Mixed grass region.
The total number of projects processed and mitigated for was down to 114 from 409 projects in
2015. This decrease in mitigation projects can be attributed to the continued downturn in oil and
gas markets which began in June 2014 and resulted in a 70% decline in oil prices. The number of

Western Association of Fish and Wildlife Agencies March 2017
The 2016 Lesser Prairie-Chicken Range-wide Conservation Plan Annual Progress Report Page 67
active drilling rigs has also declined by roughly 70% since June 2014. Overall, the CCAA has a
much larger share of the total number of projects (85.8%), but it accounts for a much lower
percentage of the annual impact units (4.1%) and the mitigation fees (2.5%). This is because the
CCAA projects are primarily oil and gas wells which have smaller impact buffers than many of
the WCA projects such as wind farms, and electric transmission lines. Table 18 provides a
summary of all the mitigated projects since the plan began in 2014.
Table 17. Summary of projects mitigated for under the Lesser Prairie-Chicken Range-wide Conservation
Plan during 2016 reporting period by ecoregion and agreement type with the potential (full impact buffer)
and actual impact acres (new impact area), annual impact units and mitigation fees.
Ecoregion/Agreement
Type # of projects Potential Acres Impact Acres Annual Units Cost
Mixed Grass 16 27,808.43 16,245.41 3,068.79 $ 4,092,554.56
CCAA 3 154.24 44.59 20.15 $ 26,899.47
WCA 13 27,654.19 16,200.82 3,048.64 $ 4,065,655.09
Sand Sagebrush 21 651.64 307.73 44.5 $ 23,944.24
CCAA 21 651.64 307.73 44.5 $ 23,944.24
WCA 0 0 0 0 0
Shinnery Oak 73 2,158.08 188.19 65.41 $ 56,158.38
CCAA 69 2,141.08 182.09 65.09 $ 55,872.86
WCA 4 17 6.1 0.32 $ 285.52
Shortgrass 4 124.14 65.04 0.24 $ 195.43
CCAA 4 124.14 65.04 0.24 $ 195.43
WCA 0 0 0 0 0
Grand Total 114 30,742.29 16,806.37 3,178.94 $ 4,172,852.61
CCAA 97 3071.1 599.45 129.98 $ 106,912.00
WCA 17 27,671.19 16,206.92 3,048.96 $ 4,065,940.61
Western Association of Fish and Wildlife Agencies March 2017
The 2016 Lesser Prairie-Chicken Range-wide Conservation Plan Annual Progress Report Page 68
Table 18. Summary of projects mitigated for under the Lesser Prairie-Chicken Range-wide Conservation
Plan since inception (2014- 2016) by ecoregion and agreement type with the potential (full impact buffer)
and actual impact acres (new impact area), annual impact units and mitigation fees.
Ecoregion/Agreement
Type # of
projects Potential
Acres Impact
Acres Annual
Units Cost
Mixed grass 550 72,003.5 30,985.4 14,994.1 $ 19,815,639.39
CCAA 441 13,818.5 8,150.0 6,526.9 $ 8,495,256.31
WCA 98 57,838.6 22,643.9 8,426.7 $ 11,266,435.76
Not on Enrollment 11 346.5 191.6 40.5 $ 53,947.32
Sand Sagebrush 136 4192.13 2332.67 740.77 $ 382,977.52
CCAA 131 4036.97 2245.04 702.94 $ 364,742.52
WCA 1 31.0 31.0 37.2 $ 17,792.00
Not on Enrollment 4 124.1 56.6 0.6 $ 443.00
Shinnery Oak 212 18542.32 7645.28 1174.86 $ 1,037,646.31
CCAA 194 6016.16 907.27 682.56 $ 592,551.16
WCA 18 12526.16 6738.01 492.3 $ 445,095.15
Shortgrass 120 3526.52 2463.65 593.16 $ 492,003.14
CCAA 93 2667.19 1909.69 510.45 $ 426,141.78
WCA 15 512.42 358.43 45.8 $ 36,003.07
Not on Enrollment 12 346.91 195.53 36.91 $ 29,858.29
Grand Total 1018 98264.48 43427 17502.84 $ 1,728,266.36
CCAA 859 26,538.79 13,211.95 8,422.81 $ 9,878,691.77
WCA 132 70,835.76 29,695.74 9,001.08 $ 11,765,881.29
Not on Enrollment 27 889.93 519.31 78.95 $ 83,693.30
While oil and gas wells are the most common type of impact, the larger impact buffers of wind
turbines, compressor stations, communications towers, and electric transmission lines usually
generate more annual impact units and mitigation fees per project. These projects are more
common on WCA enrollments than CCAAs. The larger the impact buffer, the more important it
is to site these projects to take advantage of pre-existing impact buffers and cropland to minimize
impacts on LPC habitat and mitigation fees. Electric distribution lines are an example of a

Western Association of Fish and Wildlife Agencies March 2017
The 2016 Lesser Prairie-Chicken Range-wide Conservation Plan Annual Progress Report Page 69
smaller scale project that produces few annual impact units or mitigation fees. These projects
have smaller impact buffers and are often sited within pre-existing impact buffers along roads.
Table 19 and 20 break impact unit generation and mitigation fees down further to demonstrate
the proportion of impact types mitigated for in 2016 and since the plan began.
Table 19. Summary of 2016 projects by impact type.
Ecoregions Impact Type Count Full Acres Impact
Acres Impact
Units Mitigation
Cost
Mixed Grass Compressor Station > 5 acres
1 92.18 0 0 $0
Electrical Distribution < 69 KV
6 58.33 23.94 32.34 $38,514.94
Electrical Transmission >=
69 KV 1 5,741.02 93.78 79.35 $105,947.06
Well 5 155.14 126.34 150.56 $200,994.13
Wind Turbines 3 21,761.76 16,001.35 2,806.54 $3,747,098.43
Total: 16 27,808.43 16,245.41 3,068.79 $4,092,554.56
Sand Sagebrush Well 21 651.64 307.73 44.50 $23,944.24
Total: 21 651.64 307.73 44.50 $23,944.24
Shinnery Oak Electrical Distribution < 69 KV
4 17.00 6.10 0.32 $285.52
Well 69 2,141.08 182.09 65.09 $55,872.86
Total: 73 2,158.08 188.19 65.41 $56,158.38
Shortgrass Well 4 124.14 65.04 0.24 $195.43
Total: 4 124.14 65.04 0.24 $195.43
Grand Total: 114 30,742.29 16,806.37 3,178.94 $4,172,852.61

Western Association of Fish and Wildlife Agencies March 2017
The 2016 Lesser Prairie-Chicken Range-wide Conservation Plan Annual Progress Report Page 70
Table 20. Summary of projects (2014-2016) by impact type.
Region/impact type Count Full Acres Impact Acres Units Mitigation Cost
Mixed Grass 550 72,003.51 30,985.40 14,994.05 $ 19,815,639.39
Compressor Station <= 5 acres 4 124.13 57.44 38.71 $ 51,571.21
Compressor Station > 5 acres 1 92.18 - - -
Electrical Distribution Line < 69 KV 33 168.02 43.55 53.19 $ 63,771.17
Electrical Transmission Line >= 69 KV 7 33,918.84 5,450.80 4,593.68 $ 6,160,043.14
Private Road 1 3.28 2.87 2.22 $ 2,639.00
Raised Pipeline 1 30.60 26.62 24.89 $ 29,543.00
Well 500 15,904.70 9,402.77 7,474.82 $ 9,760,973.44
Wind Turbine 3 21,761.76 16,001.35 2,806.54 $ 3,747,098.43
Sand Sagebrush Prairie 136 4,192.13 2,332.67 740.77 $ 382,977.52
Private Road 1 1.56 0.73 0.70 $ 865.00
Well 135 4,190.57 2,331.94 740.07 $ 382,112.52
Shinnery Oak Prairie 212 18,542.32 7,645.28 1,174.86 $ 1,037,646.31
Cell / Radio Tower 1 345.30 32.41 14.58 $ 19,471.67
Compressor Station > 5 acres 2 541.50 463.69 250.19 $ 223,056.74
Electrical Distribution Line < 69 KV 13 56.53 14.11 5.47 $ 4,585.73
Electrical Transmission Line >= 69 KV 1 11,551.80 6,209.57 216.32 $ 192,861.26
Well 195 6,047.19 925.50 688.30 $ 597,670.91
Shortgrass Prairie 120 3,526.52 2,463.65 593.16 $ 492,003.14
Compressor Station <= 5 acres 3 93.10 24.22 1.25 $ 1,008.31
Electrical Substation <= 5 acres 1 31.04 - - $ -
Private Road 2 10.91 5.15 1.12 $ 470.36
Tank Battery 12 125.00 26.84 1.73 $ 2,063.48
Well 102 3,266.47 2,407.44 589.06 $ 488,460.99
Grand Total 1,018 98,264.48 43,427.00 17,502.84 $ 21,728,266.36

Western Association of Fish and Wildlife Agencies March 2017
The 2016 Lesser Prairie-Chicken Range-wide Conservation Plan Annual Progress Report Page 71
When comparing, projects completed by CHAT category in 2016 (Table 21), it can be
demonstrated how industry is avoiding higher quality habitat. The overall number of projects is
much lower in CHAT’s 1-2 (9) compared to the number of projects in CHAT’s 3-4 (104) indicating
companies may be choosing these areas over focal areas and connectivity zones. Similarly, the
total acreage of new impacts is lower in the CHAT 1-2 than CHAT 3-4 (141.9 vs 16,666.4
acres). In the 2016 reporting period, mitigation totaled $234,658.75 in CHAT 1-2 compared to
$3,948,876.68 in CHAT 3-4. The impacts in CHAT 1-2 are described in more detail in Appendix
E where they are summarized by reporting unit.
Table 21. Summary of the project's mitigated for in 2016 by CHAT category, including the number of
projects, potential acres impacted, the actual impact acres, annual units and mitigation.
CHAT/impact type Count Potential acres Actual acres Habitat units Mitigation
CHAT 1 5 167.5 99.0 161.2 $ 177,751.49
Distribution Line < 69 KV 1 43.4 15.9 24.6 $ 29,234.00
Well 4 124.1 83.1 136.6 $ 148,517.49
CHAT 2 4 138.3 42.9 43.5 $ 56,907.26
Compressor Station 1 92.2 - - $ -
Distribution Line < 69 KV 2 15.1 13.3 7.2 $ 8,474.52
Well 1 31.0 29.7 36.3 $ 48,432.74
CHAT 3 17 6,565.1 5,240.6 2,409.8 $ 3,208,851.59
Distribution Line < 69 KV 6 15.0 0.3 0.4 $ 529.06
Well 10 310.3 179.8 38.4 $ 42,728.72
Wind Turbine 1 6,239.8 5,060.5 2,371.0 $ 3,165,593.81
CHAT 4 88 23,871.4 11,423.9 564.4 $ 729,342.3
Distribution Line < 69 KV 1 1.9 0.6 0.4 $ 562.9
Transmission Line >= 69
KV 1 5,741.0 93.8 79.4 $ 105,947.1
Well 84 2,606.6 388.6 49.1 $ 41,327.7
Wind Turbine 2 15,522.0 10,940.9 435.5 $ 581,504.6
Grand Total 114 30,742.3 16,806.4 3,179.0 $ 4,172,852.6
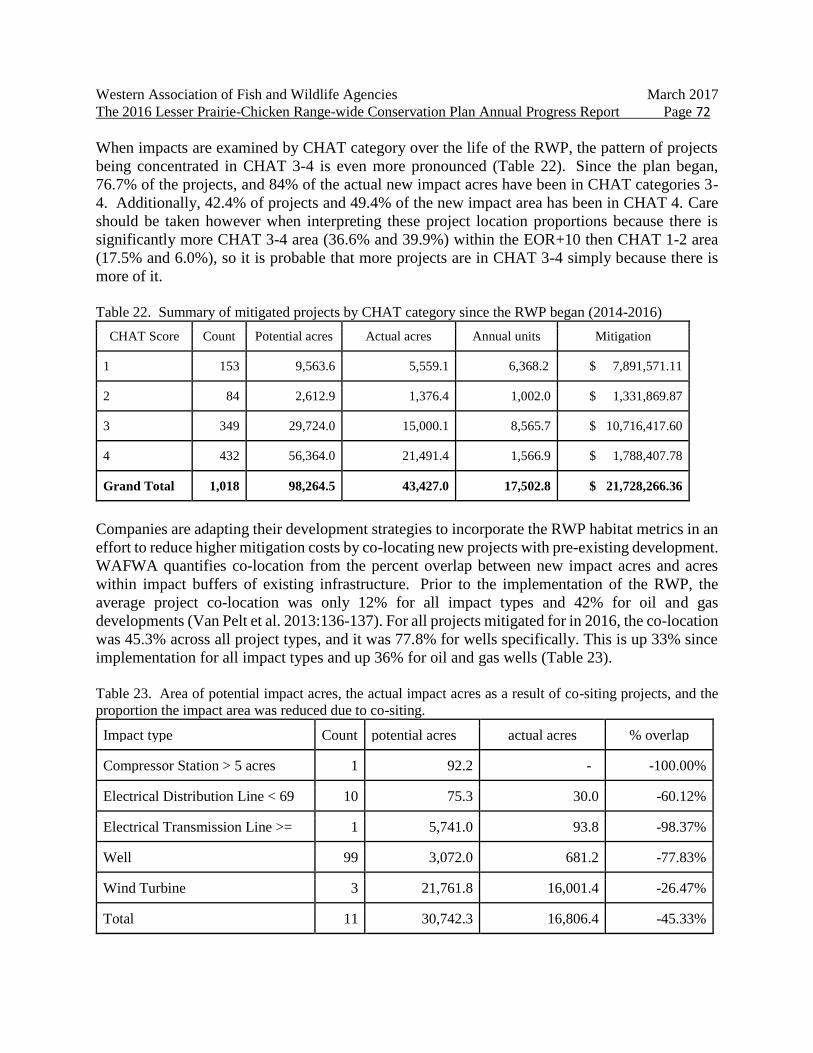
Western Association of Fish and Wildlife Agencies March 2017
The 2016 Lesser Prairie-Chicken Range-wide Conservation Plan Annual Progress Report Page 72
When impacts are examined by CHAT category over the life of the RWP, the pattern of projects
being concentrated in CHAT 3-4 is even more pronounced (Table 22). Since the plan began,
76.7% of the projects, and 84% of the actual new impact acres have been in CHAT categories 3-
4. Additionally, 42.4% of projects and 49.4% of the new impact area has been in CHAT 4. Care
should be taken however when interpreting these project location proportions because there is
significantly more CHAT 3-4 area (36.6% and 39.9%) within the EOR+10 then CHAT 1-2 area
(17.5% and 6.0%), so it is probable that more projects are in CHAT 3-4 simply because there is
more of it.
Table 22. Summary of mitigated projects by CHAT category since the RWP began (2014-2016)
CHAT Score Count Potential acres Actual acres Annual units Mitigation
1 153 9,563.6 5,559.1 6,368.2 $ 7,891,571.11
2 84 2,612.9 1,376.4 1,002.0 $ 1,331,869.87
3 349 29,724.0 15,000.1 8,565.7 $ 10,716,417.60
4 432 56,364.0 21,491.4 1,566.9 $ 1,788,407.78
Grand Total 1,018 98,264.5 43,427.0 17,502.8 $ 21,728,266.36
Companies are adapting their development strategies to incorporate the RWP habitat metrics in an
effort to reduce higher mitigation costs by co-locating new projects with pre-existing development.
WAFWA quantifies co-location from the percent overlap between new impact acres and acres
within impact buffers of existing infrastructure. Prior to the implementation of the RWP, the
average project co-location was only 12% for all impact types and 42% for oil and gas
developments (Van Pelt et al. 2013:136-137). For all projects mitigated for in 2016, the co-location
was 45.3% across all project types, and it was 77.8% for wells specifically. This is up 33% since
implementation for all impact types and up 36% for oil and gas wells (Table 23).
Table 23. Area of potential impact acres, the actual impact acres as a result of co-siting projects, and the
proportion the impact area was reduced due to co-siting.
Impact type Count potential acres actual acres % overlap
Compressor Station > 5 acres 1 92.2 - -100.00%
Electrical Distribution Line < 69
KV
10 75.3 30.0 -60.12%
Electrical Transmission Line >=
69 KV
1 5,741.0 93.8 -98.37%
Well 99 3,072.0 681.2 -77.83%
Wind Turbine 3 21,761.8 16,001.4 -26.47%
Total 11
4
30,742.3 16,806.4 -45.33%

Western Association of Fish and Wildlife Agencies March 2017
The 2016 Lesser Prairie-Chicken Range-wide Conservation Plan Annual Progress Report Page 73
The degree of co-location in 2016 varied widely between ecoregions, but was most effective in the
Shinnery Oak, where wells had a combined overlap of 91% with existing impacts. (Table 24, Table
25).
Table 24. Overall percentage that new impact areas (all project types) in 2016 were reduced by co-
locating the project so that it overlapped with existing impact areas.
Ecoregion count potential acres actual new acres % overlap
Mixed Grass Prairie 16 27,808.4 16,245.4 -41.58%
Sand Sagebrush Prairie 21 651.6 307.7 -52.78%
Shinnery Oak Prairie 73 2,158.1 188.2 -91.28%
Shortgrass Prairie 4 124.1 65.0 -47.61%
Total 114 30,742.3 16,806.4 -45.33%
Table 25. Overall percentage that new impact areas (all project types) in 2014-2016 were reduced by
co-locating the project so that it overlapped with existing impact areas.
Ecoregion count potential acres actual new acres % overlap
Mixed Grass Prairie 550 72,003.5 30,985.4 -56.97%
Sand Sagebrush Prairie 136 4,192.1 2,332.7 -44.36%
Shinnery Oak Prairie 212 18,542.3 7,645.3 -58.77%
Shortgrass Prairie 120 3,526.5 2,463.7 -30.14%
Total 1,018 98,264.5 43,427.0 -55.81%
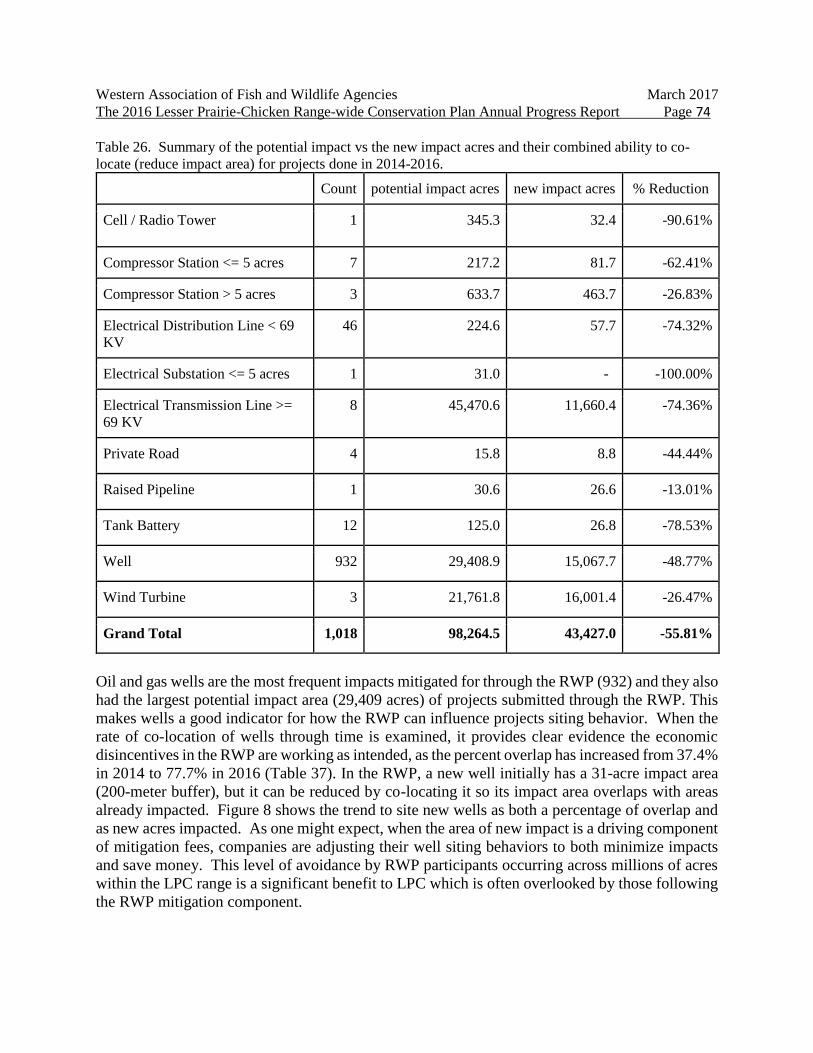
Western Association of Fish and Wildlife Agencies March 2017
The 2016 Lesser Prairie-Chicken Range-wide Conservation Plan Annual Progress Report Page 74
Table 26. Summary of the potential impact vs the new impact acres and their combined ability to co-
locate (reduce impact area) for projects done in 2014-2016.
Count potential impact acres new impact acres % Reduction
Cell / Radio Tower 1 345.3 32.4 -90.61%
Compressor Station <= 5 acres 7 217.2 81.7 -62.41%
Compressor Station > 5 acres 3 633.7 463.7 -26.83%
Electrical Distribution Line < 69
KV
46 224.6 57.7 -74.32%
Electrical Substation <= 5 acres 1 31.0 - -100.00%
Electrical Transmission Line >=
69 KV
8 45,470.6 11,660.4 -74.36%
Private Road 4 15.8 8.8 -44.44%
Raised Pipeline 1 30.6 26.6 -13.01%
Tank Battery 12 125.0 26.8 -78.53%
Well 932 29,408.9 15,067.7 -48.77%
Wind Turbine 3 21,761.8 16,001.4 -26.47%
Grand Total 1,018 98,264.5 43,427.0 -55.81%
Oil and gas wells are the most frequent impacts mitigated for through the RWP (932) and they also
had the largest potential impact area (29,409 acres) of projects submitted through the RWP. This
makes wells a good indicator for how the RWP can influence projects siting behavior. When the
rate of co-location of wells through time is examined, it provides clear evidence the economic
disincentives in the RWP are working as intended, as the percent overlap has increased from 37.4%
in 2014 to 77.7% in 2016 (Table 37). In the RWP, a new well initially has a 31-acre impact area
(200-meter buffer), but it can be reduced by co-locating it so its impact area overlaps with areas
already impacted. Figure 8 shows the trend to site new wells as both a percentage of overlap and
as new acres impacted. As one might expect, when the area of new impact is a driving component
of mitigation fees, companies are adjusting their well siting behaviors to both minimize impacts
and save money. This level of avoidance by RWP participants occurring across millions of acres
within the LPC range is a significant benefit to LPC which is often overlooked by those following
the RWP mitigation component.

Western Association of Fish and Wildlife Agencies March 2017
The 2016 Lesser Prairie-Chicken Range-wide Conservation Plan Annual Progress Report Page 75
Table 27. Trend in co-locating wells with other existing infrastructure to minimize new impact area (and
corresponding mitigation costs) is evident here as the rate of co-location has increased since the plan began.
Year Count Potential Impact Acres New Impact Acres % reduction
2014 485 15,362.83 9,611.79 -37.43%
2015 348 10,974.1 4,774.66 -56.49%
2016 99 3,072 683.19 -77.76%
total 932 29,408.93 15,069.64 -48.76%
Figure 8. Plot showing the increasing trend by companies to co-locate wells to reduce new impact area on
new well projects with existing infrastructure, thereby lowering the total impact area.
RECLAMATION OF IMPACTS TO GENERATE OFFSET UNITS
Offset units can also be generated by remediation of existing impacts as described in the
RWP. Those remediation units are reserved for the company which generates them and can be
banked for their use for future developments. In some instances, remediation offset units are
required before development can occur. The RWP establishes impact goals of 30% for CHAT 1
reporting units and 60% for CHAT 2 reporting units. Five focal area reporting units already exceed
those goals which means that remediation must occur to offset any new impacts by participants in
these units (Appendix E & F, Van Pelt et.al 2013). Within the RWP there are two primary impact
credit processes, one for projects initially mitigated through the RWP and a second process for the
remediation of projects not mitigated through the RWP (existing infrastructure).
For projects initiated within the RWP, it is required that mitigation and habitat offsets units be paid
and allocated before construction begins. Companies often plan and pay mitigation months before
a project starts. When this is done, WAFWA assesses the habitat impact and then calculates the

Western Association of Fish and Wildlife Agencies March 2017
The 2016 Lesser Prairie-Chicken Range-wide Conservation Plan Annual Progress Report Page 76
habitat units and the mitigation fee that will offset this development. The mitigation fee is
deducted from the companies’ mitigation account with WAFWA and the habitat units are deducted
from an appropriate conservation offset site. Once the mitigation of new impacts is completed, one
of the following things will occur:
1) The project gets cancelled after the mitigation was paid, but before any ground disturbances
or infrastructure are installed.
a. As development plans change for whatever reason, projects may be cancelled before any
habitat impacts occurred. In these instances, the company should notify WAFWA that the
project was cancelled before any impacts occurred and WAFWA will credit the company
back its full mitigation payment (minus the administrative fee) to its account and the habitat
credits will be added back to the conservation offset site they were deducted from. The net
result is no mitigation fees and no habitat units used.
2) The project is initiated, completed, and remains on the landscape (i.e. viable well). Each
year on the anniversary of the project's completion, the annual impact units will be associated with
a conservation offset site and units deducted from that site.
3) The project was started (ground disturbed or infrastructure installed) after mitigation
payments were made, but the project was not completed and subsequently removed (i.e. dry
well). These projects may be credited back in full (minus the administrative fee) after the site is
verified to be reclaimed. To reclaim the site back to its original state and be credited as doing so,
the company should follow the below process.
a. The company should remove any/all infrastructure they installed, refill and level any
pits, and grade the ground back to a slope and condition approximating the condition before
impacts were made.
b. The company should contact WAFWA regional biologists for a recommended native
seed mixture for that site and apply the seed mix per recommendations. If restoring back
to active cropland, no seeding mixture is required.
c. Once the site is repaired and the seed is distributed, the company should notify WAFWA
regional biologist to assess and verify the completed reclamation work.
d. Once verified, the regional biologist will notify WAFWA GIS that the work was done
and then WAFWA GIS will refund all the habitat credits to the offset property they were
initially deducted from and notify accounting to credit the companies account back for the
full impact mitigation (less the 12.5% administration fee) paid towards the project.
4) If the project is completed and mitigated within the RWP, then at some future date the
project is to be reclaimed, a process similar to scenario 2 (project started but not completed) would
be utilized. After the site has been confirmed reclaimed, the company receives credit back on
mitigation dollars paid (less the administration fee), the impact no longer generates annual debits
in the impact ledger, and the impact units are no longer deducted from its associated conservation

Western Association of Fish and Wildlife Agencies March 2017
The 2016 Lesser Prairie-Chicken Range-wide Conservation Plan Annual Progress Report Page 77
site. Habitat units from the project and the conservation site are not credited, they just stop
occurring annually as they were when the project was on the landscape.
5) For projects that were developed on the landscape without mitigation through the RWP,
there exists the opportunity for companies to remove these existing infrastructure impacts and
receive habitat credits that can be applied to future projects. If a company removes the
infrastructure and reseeds the area in native vegetation to reclaim the habitat, the company will
receive a company specific allocation of half the habitat units identified as reclaimed by a HEG
habitat evaluation of the surrounding area. So far in the RWP, there has been one transmission line
project reclaimed and three wells submitted for reclamation credits. These projects are inventoried
and associated with the appropriate company that will earn the credits, but the credit allocation has
not been issued yet because WAFWA is working with the USFWS to resolve some details on how
these will be tracked and credited.
Not all wells submitted into the RWP have been completed, and not all wells that were drilled
were successful. During the 2016 reporting period, there were several projects cancelled and
credited back. Specifically, there were 74 projects cancelled before impacts occurred and nine
projects reclaimed after they failed to be successful (Table 28). Since the RWP began, 160 have
been canceled prior to impacts, and 17 were unsuccessful and reclaimed (Table 29) Each of these
projects were reclaimed per the specifications, verified by WAFWA staff, and then the
mitigation was credited back to the company and the impacts were credited back to the
conservation offset property.
Table 28. Details on the nine well projects that were reclaimed in 2016 after
the project failed to be successful
Feature/ecoregion/CHAT Count potential acres actual acres annual units
Mixed grass Prairie 1 31.0 - -
4 1 31.0 - -
Shortgrass Prairie 8 248.3 176.4 91.1
1 4 124.1 96.2 72.0
4 4 124.1 80.2 19.0
Grand Total 9 279.3 176.4 91.1

Western Association of Fish and Wildlife Agencies March 2017
The 2016 Lesser Prairie-Chicken Range-wide Conservation Plan Annual Progress Report Page 78
Table 29. Projects that were reclaimed since the plan began (2014-2016) after the project failed to be
successful
Feature/ecoregion/CHAT Count potential acres actual acres annual units
Tank Battery 1 13.7 3.6 0.2
Shortgrass 1 13.7 3.6 0.2
CHAT 4 1 13.7 3.6 0.2
Wells 17 531.1 381.0 276.9
Mixed grass 4 124.1 73.3 94.3
CHAT 1 2 62.1 55.1 93.7
CHAT 4 2 62.1 18.2 0.6
Sand Sagebrush 1 31.0 22.8 3.2
CHAT 1 1 31.0 22.8 3.2
Shortgrass 12 375.9 284.9 179.5
CHAT 1 7 220.7 188.2 158.3
CHAT 4 5 155.2 96.7 21.2
Grand Total 18 544.8 384.5 277.1
OFFSET UNIT GENERATION
The 15 conservation sites currently enrolled in the RWP produced 59,292 conservation offset units
during this reporting period from 96,750 acres. This does not include the new WAFWA purchased
property in the Sand Sagebrush region of 29,717 acres since the conservation easement was not
completed before close of this reporting period. The total number of offset units generated since
inception of the RWP is 114,172.4 and 89.3% of them have been produced by properties located
primarily in CHAT 1. Assuming habitat quality and credits generated during 2016 remains
constant (though it should increase due to improved management) the conservation sites under
contract at the end of the reporting period are expected to produce at least approximately 593,000
conservation offset units over the next 10 years. WAFWA maintains a surplus of offset units in
each region by appropriating all available funds in the conservation endowment and targeting
conservation agreements in proportion to the distribution of industry impacts. The individual
industry impacts have a total annual impact of -17,502 habitat units, and cumulatively since the
plan began these projects have netted a total impact of -42,527 habitat units. When the 42,527
total impacts are subtracted from the 114,172 credits, the result is a credit surplus of 71,645 habitat
units across the range. This surplus varies by region, ranging from a low of 4,374 in the shortgrass
to 37,284 in the mixed grass. Maintaining a constant and adequate surplus minimizes the risk of

Western Association of Fish and Wildlife Agencies March 2017
The 2016 Lesser Prairie-Chicken Range-wide Conservation Plan Annual Progress Report Page 79
any industry delays.
Habitat units to offset industry impacts are generated through land management contracts,
conservation easements, and reclamation of previously impacted habitat. The RWP tracks credits
generated on enrolled conservation parcels through annual field assessments. The annual credits
generated are summarized by Ecoregion and CHAT in Table 30, and listed individually by
property in Table 31. Getting information on the restoration of habitat removal of the existing
infrastructure being removed has proven difficult and currently WAFWA has not recorded any
reclamation projects outside of the RWP. Oil and gas wells are routinely plugged and restored,
but a way to access and quantify that data has not been available through our IHS well database
subscription service. WAFWA is exploring other data options for accessing data that would show
the wells plugged and restored to state environmental requirements.
Table 30. Conservation offset units generated each reporting period and cumulatively since the inception
of the RWP. Data are reported for the primary CHAT category within which the site occurs.
Credits
Year/Region/CHAT 2014 2015 2016 2014-2016
Mixed Grass Prairie 6,119.4 27,267.8 40,041.8 73,429.0
CHAT 1 4,541.9 24,511.8 3,4892.4 63,946.2
CHAT 4 1,577.5 2,756.0 5,149.4 9,482.8
Sand Sagebrush Prairie 4,173.9 4,021.2 8,385.4 16,580.5
CHAT 1 4,173.9 4,021.2 8,385.4 16,580.5
Shinnery Oak Prairie 4,654.9 5,772.7 7,649.2 18,076.7
CHAT 1 4,654.9 5,772.7 7,649.2 18,076.7
Shortgrass Prairie 1,187.8 952.7 3,945.7 6,086.2
CHAT 1 146.5 511.1 2,671.8 3,329.4
CHAT 2 1,041.3 441.6 1,273.9 2,756.8
Annual total 16,135.9 38,014.4 60,022.0 114,172.4
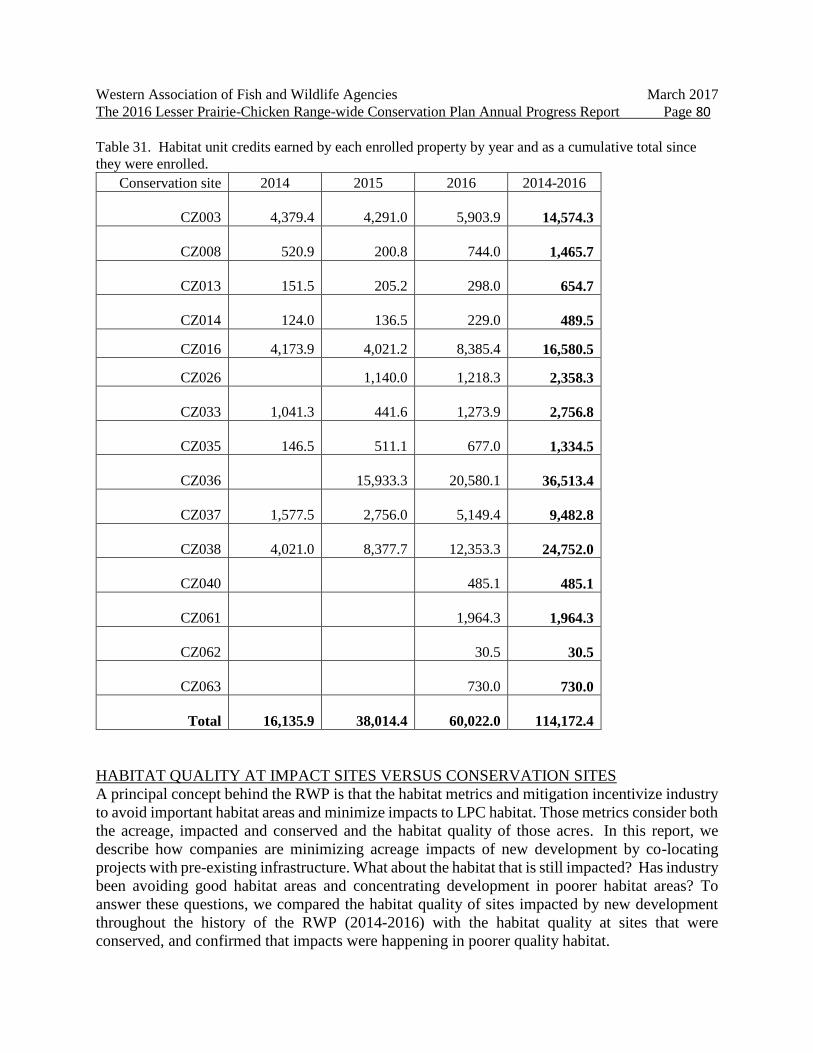
Western Association of Fish and Wildlife Agencies March 2017
The 2016 Lesser Prairie-Chicken Range-wide Conservation Plan Annual Progress Report Page 80
Table 31. Habitat unit credits earned by each enrolled property by year and as a cumulative total since
they were enrolled.
Conservation site 2014 2015 2016 2014-2016
CZ003
4,379.4 4,291.0
5,903.9
14,574.3
CZ008
520.9
200.8 744.0
1,465.7
CZ013
151.5
205.2
298.0
654.7
CZ014
124.0
136.5
229.0
489.5
CZ016 4,173.9 4,021.2 8,385.4 16,580.5
CZ026 1,140.0 1,218.3 2,358.3
CZ033 1,041.3
441.6 1,273.9 2,756.8
CZ035
146.5
511.1
677.0
1,334.5
CZ036 15,933.3 20,580.1
36,513.4
CZ037 1,577.5
2,756.0
5,149.4
9,482.8
CZ038 4,021.0
8,377.7
12,353.3
24,752.0
CZ040 485.1
485.1
CZ061
1,964.3
1,964.3
CZ062
30.5
30.5
CZ063
730.0
730.0
Total 16,135.9
38,014.4
60,022.0 114,172.4
HABITAT QUALITY AT IMPACT SITES VERSUS CONSERVATION SITES
A principal concept behind the RWP is that the habitat metrics and mitigation incentivize industry
to avoid important habitat areas and minimize impacts to LPC habitat. Those metrics consider both
the acreage, impacted and conserved and the habitat quality of those acres. In this report, we
describe how companies are minimizing acreage impacts of new development by co-locating
projects with pre-existing infrastructure. What about the habitat that is still impacted? Has industry
been avoiding good habitat areas and concentrating development in poorer habitat areas? To
answer these questions, we compared the habitat quality of sites impacted by new development
throughout the history of the RWP (2014-2016) with the habitat quality at sites that were
conserved, and confirmed that impacts were happening in poorer quality habitat.

Western Association of Fish and Wildlife Agencies March 2017
The 2016 Lesser Prairie-Chicken Range-wide Conservation Plan Annual Progress Report Page 81
This habitat quality of site comparisons uses the Habitat Evaluation Guide (HEG) score described
in Appendix I of the RWP (Van Pelt, et al. 2013). This robust scoring system ranks LPC habitat
quality on a scale from 0 to 1, where 1 is the highest quality. This system uses a simple set of
criteria to identify LPC habitat including the percent bare ground, percent cover of seven preferred
species of grasses and shrubs, percent cover of trees greater than three feet tall, and the percent
suitable habitat within a one-mile radius of the evaluation site.
Of the 4036 habitat evaluations conducted at proposed industry impacts sites (stages 5,6,7) across
the EOR+10 for wells, tank batteries, wind turbines, and electrical lines, the mean HEG habitat
quality score was 0.23 with a median of 0.13 (Table 32, Figure 9). These impacts to low quality
habitat are mitigated for and generate funds used to secure and improve moderate to high quality
habitat on targeted private conservation properties.
Table 32. Habitat Evaluation Guide (HEG) scores relating habitat quality across all evaluation units
associated with industry impact areas.
Industry
impact Shortgrass
Mixed
Grass
Sand
sagebrush
Shinnery
Oak EOR+10
Mean 0.18 0.29 0.18 0.12 0.23
Median 0.10 0.23 0.05 0.00 0.13
Min - max 0.0 - 1.0 0.0 - 1.0 0.0 - 1.0 0.0 - 1.0 0.0 - 1.0
Variance 0.05 0.08 0.06 0.06 0.08
Count 325 2447 627 637 4036

Western Association of Fish and Wildlife Agencies March 2017
The 2016 Lesser Prairie-Chicken Range-wide Conservation Plan Annual Progress Report Page 82
Figure 9. Habitat quality scores from evaluation units showing that most of the areas impacted were of
lower quality habitat.
At the end of the 2016 reporting period, WAFAW had 15 conservation properties across the
EOR+10 generating conservation offset credits. Vegetation transects done across the properties
during the 2016 spring monitoring season showed these properties to have a mean habitat score of
0.61 and a median of 0.68 (Table 33, Figure 10). This difference between the quality of the habitat
being impacted and the habitat being conserved is evidence industry is minimizing their impacts
by selecting low quality sites to develop and the mitigation funds from those developments is being
spent to maintain and improve high quality habitat.
Table 33. Habitat Evaluation Guide (HEG) scores from the 2016 monitoring season relating habitat quality
across all evaluation units associated with conservation offset properties.
Conservation Shortgrass Mixed Grass Sand sagebrush Shinnery Oak EOR+10
Mean 0.35 0.65 0.74 0.52 0.61
Median 0.22 0.76 0.80 0.60 0.68
Min - max 0.015 - .9 0.05 - 1.0 0.015 - 1.0 0.2 - 0.85 0.015 - 1.0
Variance 0.06 0.08 0.06 0.09 0.09
Count 28 77 46 21 172

Western Association of Fish and Wildlife Agencies March 2017
The 2016 Lesser Prairie-Chicken Range-wide Conservation Plan Annual Progress Report Page 83
Figure 10. Habitat quality scores collected in 2016 from evaluation units in conservation properties
showing that most of the areas conserved are of higher quality habitat.
Reducing a project’s new impact footprint has a direct result on the mitigation fees associated with
that project. The formula for calculating mitigation fees start with the habitat quality at the site
multiplied by the new impact acreage, and then the CHAT category, 25-year term, and
administration fees are factored in. Of these variables, the impact footprint is often the variable
companies have the most control over.
After three years of implementation, a review of projects completed under the plan shows that the
mean cost of all the projects (excluding wind farms and Transmission lines) varies by ecoregion
from $2,732 in the Sand Sagebrush to $18,179 in the Mixed Grass for an EOR+10 mean of $11,361
(Table 34). A histogram plot of all the mitigation fees (except wind facilities and transmission
lines) (Figure 11), indicates a bimodal distribution where most of the fees are relatively low, with
428 of the 1016 projects (42%) of the projects less than $500. This trend of low mitigation fees is
a reflection of companies avoiding good habitat and minimizing impact area.
Large projects such as transmission lines and wind farms have also been successfully mitigated in
the RWP. Wind farms and transmission lines were excluded from the general project summary
because they are of a frequency and scale that would distort the results. There has been a total of

Western Association of Fish and Wildlife Agencies March 2017
The 2016 Lesser Prairie-Chicken Range-wide Conservation Plan Annual Progress Report Page 84
5 transmission lines completed under the RWP ranging from 2,000 - 11,000 potential acres of
impact that resulted in costs between $0 - $1.3 million (avg. = $794,000). The average fee of a
transmission line (>69kV) was $39,248 per mile. The RWP also enrolled and is offsetting impacts
from two wind power facilities in the mixed grass region. The two wind farms have total project
costs that averages out to $31,577 per turbine. Both facilities are about 11,000 acres and have
around 60 turbines. The average fee for these wind facilities is about $1.2 million, yet individually
the two facilities are quite different. One project had an average HEG habitat quality score of
0.213 (2,426 habitat units) and cost over $3 million, and the other was sited largely in cropland in
CHAT 4 with an average habitat quality score of 0.069 (380 habitat units) and had a final cost of
less than $600,000. This difference in final impacts and mitigation costs for two windfarms of
similar size in the same ecoregion show that project siting and configuration can have a huge
impact.
Table 34. Summary statistics of the mitigation fees associated with all projects mitigated for within the
Range Wide Plan since implementation (2014-2016). The Mean and Sum row exclude transmission and
wind facilities, while the Sum (all) row includes all feature types.
Shortgrass Mixed Grass Sand sagebrush Shinnery Oak EOR+10
Mean $4,100.03 $18,349.07 $2,816.018 $4,003.72 $11,547.43
Sum 492,003.14 9,908,497.82 382,977.52 844,785.05 11,628,263.53
Sum
(all) $492,003.14 $19,815,639.39 $382,977.52 $1,037,646.31
$21,728,266.36

Western Association of Fish and Wildlife Agencies March 2017
The 2016 Lesser Prairie-Chicken Range-wide Conservation Plan Annual Progress Report Page 85
Figure 11. Distribution of mitigation fees for projects assessed within the Range-wide Plan (2014-2016),
excluding wind power facilities and transmission lines.
Looking just at 2016 impact mitigation fees, a couple things can be seen. While there were far
fewer projects completed in 2016 because of generally low oil prices, the development that did
take place was done with minimal impact to LPC habitat. The mean mitigation cost across all
ecoregions was $36,603.97, ranging from $48 in shortgrass to $255,784 in mixed grass (Table
35). The mean is skewed by of a couple large projects, so the median values may be more
informative, and show that three ecoregions plus the EOR+10 had median mitigation costs of
$0.00. This shows that for the majority of projects done, there was zero new impact to LPC
habitat.
Table 35. Summary of mitigation by ecoregion for 114 projects in 2016.
Shortgrass Mixed Grass Sand sagebrush Shinnery Oak EOR+10
Count 4 16 21 73 114
Mean $48.86 $255,784.66 $1,140.20 $769.29 $36,603.97
Median $27.19 $25,994.81 $0.00 $0.00 $1,595.03
Sum $195.43 $4,092,554.56 $23,944.24 $56,158.38 $4,172,852.61

Western Association of Fish and Wildlife Agencies March 2017
The 2016 Lesser Prairie-Chicken Range-wide Conservation Plan Annual Progress Report Page 86
PROJECT LOGS AND LEDGERS
The tracking of information about a project and its implementation status within the RWP
workflow is an important component. During the first year of the RWP, a tracking log was created
in a shared online spreadsheet. Each new project was entered as a new record row and attribute
columns regarding the project stage, date it was evaluated, impact costs, impact units, and dates
the project was approved and sent to accounting for completion were manually entered every time
new information was collected. The tracking log and ledgers could be accessed via a secure website
(USFWS had access) and a summary of projects status and important project details (region,
CHAT score, habitat impact units, mitigation cost) could be obtained. This process worked well,
but it was a manual process and it was not directly linked to the GIS data. In 2015, great effort
was expended getting all the tracking information into a comprehensive GIS geodatabase and a
relational geodatabase was created that had automatic daily updates of project information pulled
from the GIS data. This new tracking log and ledgers were not available via a web interface, but
they were part of the geodatabase shared with the USFWS. With the new SQL database,
improvements to sorting, querying, and linking to GIS data were achieved.
In 2016, WAFWA launched new web interface and mobile tablet interface tools (collectively
referred to as the Western Conservation Toolkit - WCT) to access project data and submit field
data. The WCT was created to help provide several important improvements to implementing and
accessing data in the Range Wide Plan (Figure 12).
● Secure online access to WAFWA, USFWS, and company participants to review their
pending/completed projects and their enrollment area.
● Provide companies an interface to draft projects, review impact estimates and potential
restrictions, submit proposals for field assessment, and approve final mitigation costs.
● Provide a mobile application for tablets (iOS and Android) to collect field data, transect
coordinates and a photograph, then upload them all directly to the database.
● Provide an interface for companies to submit incident reports for emergency operations. ● Provide an online portal for access to the ArcSDE SQL geodatabase where authorized users
can see projects logs, query for projects, and generate custom summary reports.
The web interface for the WCT provides secure, role based access to authorized data
sets. Company representatives will only have access to information for the company they are
connected to, while users from WAFWA and USFWS can access information for all companies,
conservation enrollments, as well as access the summary logs, and the impact balance
ledgers. Figure 13 shows an example of a page that lists and maps projects that are under review,
but not yet finalized. The information displayed in the WCT web site is from a direct link to the
relational ArcSDE SQL geodatabase, so it is always synchronized with displaying current data.

Western Association of Fish and Wildlife Agencies March 2017
The 2016 Lesser Prairie-Chicken Range-wide Conservation Plan Annual Progress Report Page 87
Figure 12. View of the WCT web interface showing enrollment parcels for a hypothetical
“WAFWA Test” company. Tabs within the view provide access to unique sets of data and tools.
Figure 13. View of projects listed in “Under Review” tab for the hypothetical WAFWA
Test company. Projects are listed and mapped, with the list functioning as a link to specific project details.

Western Association of Fish and Wildlife Agencies March 2017
The 2016 Lesser Prairie-Chicken Range-wide Conservation Plan Annual Progress Report Page 88
The RWP requires WAFWA to always have enough conservation credits in a region to cover new
impacts occurring in the region. To track the balance of conservation offset credits and impact
debits, a series of ecoregion specific ledgers was created. Within each ecoregion ledger,
conservation offsets from enrolled properties create a balance of available credits. As projects are
mitigated for through WAFWA, the projects are associated with a specific conservation offset
property and the impact units for that project are then deducted from that properties’ available
credits. If a mitigated project is cancelled or the well is a dry hole, then the company can receive
financial credit for the site by repairing the impacts and the habitat units are credited back to the
conservation site they were deducted from in the ledger.
The ledgers, ledger summaries, and project log are created daily with a SQL script triggered to run
at 5:00 am Central Time. Inputs and outputs are fully contained within the geodatabase. Within
the ledger creation script, each new debit entry is assigned a conservation offset within the specific
ecoregion given the following selection criteria, ranking order, and restraints (Table 36).
Table 36. Order of priorities used when the model assigns impact units to a conservation offset property.
# Factor Equation Sort Order Constraints
1 Ecoregion Impact ecoregion = Conservation ecoregion
2 CHAT (Project CHAT – Conservation CHAT) Ascending ≥ 0
3 Contract Term (CZ Site Exp. Date – CZ Site Start Date) Ascending None
4 Days Available (Line Entry Date – CZ Site Start Date) Descending ≥ 0 and < Contract Term
5 Percent Balance (Running Balance + Impact Effect)/Site Total Ascending None
6 Running
Balance (Running Balance + Impact Effect) Ascending ≥ 0
7 Site ID None Ascending None
Once the conservation properties in the same ecoregion as the impact are identified, factor
preferences start with the CHAT score requiring the offset CHAT to be less than or equal to the
project CHAT score. The contract term factor assures that conservation sites with 5-year term
contracts are used before 10-year terms and then permanent sites. Subsequently, the numbers of
days the contract has been available order sets the preference to use the oldest contract limiting
that the number of days cannot exceed the term. The potential impact on the available conservation
site balance is factored into the selection process twice, first using the percent remaining if the
impact is assigned to the site (preference given to the site that would have the lower proportion of
its total units impacted) and then the cumulative balance (preference give to the site that has the
least credits available that will cover the impact units needed). If all variables are between two or
more sites, the decisive factor then becomes the minimum conservation site ID. By automating

Western Association of Fish and Wildlife Agencies March 2017
The 2016 Lesser Prairie-Chicken Range-wide Conservation Plan Annual Progress Report Page 89
this process, we have removed the possibility of transcription errors and ensured each impact can
be fully accounted moving forward.
The line-by-line ecoregion ledgers that track every credit and debit, show which projects are
associated with which conservation sites, and provide a running balance of that conservation sites
available credit are available by ecoregion in the WCT app through the Ledger tab. A subset of
this ledger is shown in Figure 14. Within the ledgers, the entry date references the date the action
was taken, the WAFWA ID is the unique project identification code, project name is the name of
the project and the ecoregion and CHAT columns identify where the project occurred. The Charge
Type column identifies the type of action taken. Entries with a date range charge type (i.e. 2014-
2016) signify these impacts were made in 2014, and this is the latest annual re-application of that
impact. A Final Impact entry indicates the debits of units for a new project. Since the estimator
tool was discontinued in September 2015, there are no entries with a charge type of Impact
Estimate in this, but they do occur as debits in 2014-2015. On November 2, 2015, there are many
entries for Estimates Reconciled and Final Impacts as November 1 was set as the deadline for any
field work to finalize estimates. Any estimates not validated by that date were converted to Final
Impacts. The other Charge Type not visible in this December subset is Conservation Credit, which
indicates the addition of conservation credits added to a conservation offset property. The
Conservation offset properties have WAFWA IDs that begin with CZ (for Conservation Zone) and
then a unique number associated with each property. For each ledger transaction line, the debits or
credits for that project are associated with a specific conservation property as indicated in the
Offset Site column of the table. The last column in the table is the Site Balance, which is a running
balance of that conservation site’s available credits. The balances from these ledgers are also
available as a summary report (Figure 15), or the credits, debits, and balances can be viewed per
each individual conservation site. (Figure 16).
Figure 14. Subset of the line-item ledger for the Shinnery Oak ecoregion where the habitat unit credits and
debits for each project and conservation site are tracked. For each impact, the region, CHAT category,
impact units, and offset site associated with it are shown.

Western Association of Fish and Wildlife Agencies March 2017
The 2016 Lesser Prairie-Chicken Range-wide Conservation Plan Annual Progress Report Page 90
Figure 15. Summary of the total credits, debits, and balance of habitat units remaining in each ecoregion.
The mixed grass region has had many more impact units debited, but all ecoregions maintain a positive
balance of habitat units.

Western Association of Fish and Wildlife Agencies March 2017
The 2016 Lesser Prairie-Chicken Range-wide Conservation Plan Annual Progress Report Page 91
Figure 16. Conservation properties in the RWP with details of the ecoregion and CHAT it is associated
with, the total credits it has generated, total impact debits being offset by the property and remaining
credit balance of the property. Ledger balance of 71,639 is slightly lower than other reported numbers
because this ledger graphic was generated after some 2017 projects had been debited.
Within this summary table, the Conservation Site is the unique ID give to each property, the CHAT
category represents the CHAT that the majority of the site is located in, Credits relates the total
amount of offset units generated and available to be applied towards impacts, while Net Debits
represent the total impact units debited against that site and the Balance column is the amount of
remaining habitat credits for a given conservation site.
Another way to summarize the ledgers, are totaling the conservation credits and impact debits to
the ecoregion and CHAT level, but not at the conservation property level. For this CHAT level
summary, it should be remembered impacts from one CHAT level can be offset by credits in a
higher level CHAT, and create negatives in CHAT levels 2-4 that are accounted for by the
surplus credit balance in CHAT 1. Figure 17 summarizes these credits and debits to the
ecoregion level and shows that each ecoregion has a positive balance.
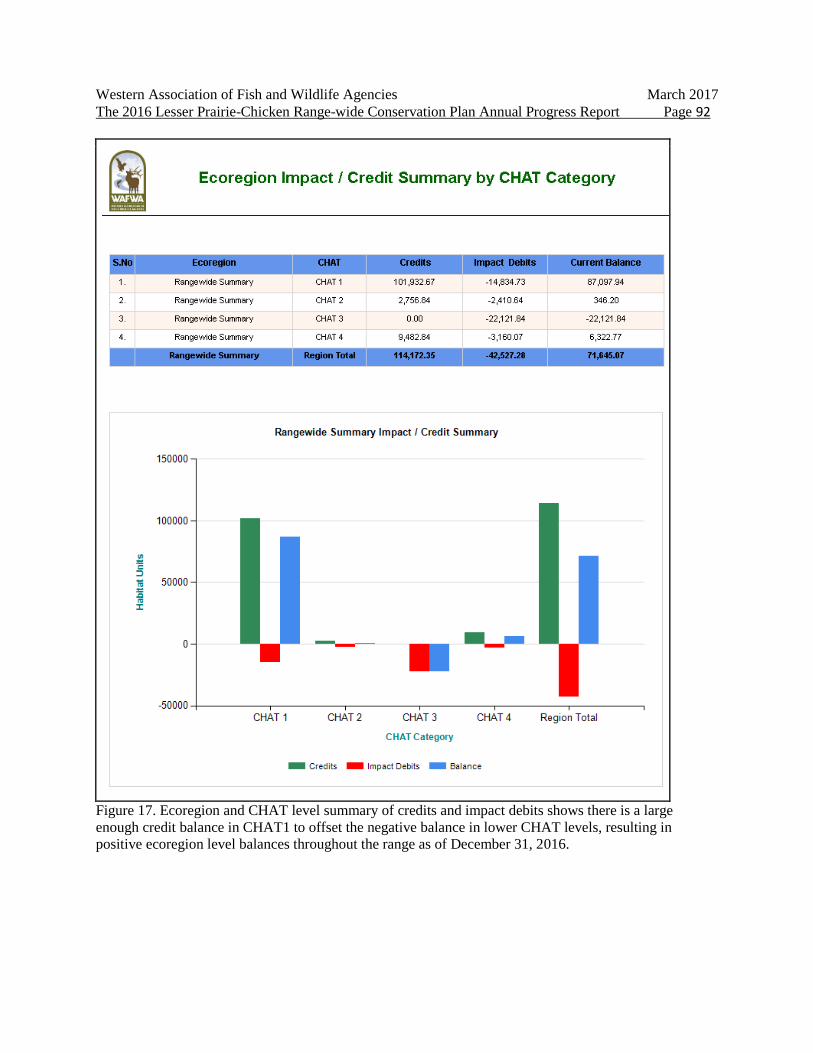
Western Association of Fish and Wildlife Agencies March 2017
The 2016 Lesser Prairie-Chicken Range-wide Conservation Plan Annual Progress Report Page 92
Figure 17. Ecoregion and CHAT level summary of credits and impact debits shows there is a large
enough credit balance in CHAT1 to offset the negative balance in lower CHAT levels, resulting in
positive ecoregion level balances throughout the range as of December 31, 2016.

Western Association of Fish and Wildlife Agencies March 2017
The 2016 Lesser Prairie-Chicken Range-wide Conservation Plan Annual Progress Report Page 93
REPORTING UNITS AND DEVELOPMENT LEVEL THRESHOLDS
Within the RWP, the maximum recommended development level within reporting units was
established to define acceptable limits of development related impacts within focal area and
connectivity zones. A development proportion threshold of 30% was established for focal areas,
and a threshold of 60% was established for connectivity zones. These thresholds are defined as a
percentage of the total reporting unit area that is covered by existing infrastructures impact
buffers. This area of impact is calculated twice a year (July and January) and includes impact
buffers around the latest download of vertical structure data, the latest IHS active well data, new
RWP wells, tank batteries, and all known roads and electrical distribution/transmission lines as
updated and represented within the SGP CHAT website. The totals of these impact buffers are
then divided by the reporting unit area to identify the percentage of impact.
Each reporting unit has a unique ID number associated with it (Figures 18 and 19) so that they
can be related back to tables conveying the percent of impact within each unit. Appendix E and F
show the percentages of impact within each reporting unit in focal areas and the reporting units
of connectivity zones respectively. The percentages of impact based on the January 2017
assessment are presented graphically in Figures 20 and 21 to help illustrate the areas that are
either above, below, or approaching the threshold. There are currently five focal areas reporting
units over the 30% threshold, three in the sand sagebrush and two in the mixed grass. The
highest impacted focal area is calculated at 39.5% (unit 14) followed by one unit with 33.7%
impact (31C). Unit 14 is an anomaly in that it is only nine square miles after it was separated
from its larger unit when the units were being delineated. Due to its small size, the primary road
running through it and the existing wells, it has been over the 30% threshold since it was
created. For all focal areas over the threshold, remediation of existing infrastructure must occur
to balance any new impact areas before a project can be approved. There are five focal areas
that are near the threshold with between 28% 30% impact. There are no connectivity zones over
the 60% threshold, with the highest impact to a connectivity zone calculated at 53.3%.

Western Association of Fish and Wildlife Agencies March 2017
The 2016 Lesser Prairie-Chicken Range-wide Conservation Plan Annual Progress Report Page 94
Figure 18. Reporting unit numbers for focal area and connectivity zones in the shortgrass, sand sagebrush,
and mixed grass regions of the range.

Western Association of Fish and Wildlife Agencies March 2017
The 2016 Lesser Prairie-Chicken Range-wide Conservation Plan Annual Progress Report Page 95
Figure 19. Reporting unit numbers for focal area and connectivity zones in the shinnery oak portion of
the range.

Western Association of Fish and Wildlife Agencies March 2017
The 2016 Lesser Prairie-Chicken Range-wide Conservation Plan Annual Progress Report Page 96
Figure 20. Focal area reporting units color coded to show the proportion of impact within each
unit. Focal areas have a 30% threshold, after which remediation of existing impacts must occur before
new impacts can be developed.

Western Association of Fish and Wildlife Agencies March 2017
The 2016 Lesser Prairie-Chicken Range-wide Conservation Plan Annual Progress Report Page 97
Figure 21. Connectivity zone reporting units color coded to show the proportion of impact within each
unit. Connectivity zones have a 60% threshold, after which remediation of existing impacts must occur
before new impacts can be developed.

Western Association of Fish and Wildlife Agencies March 2017
The 2016 Lesser Prairie-Chicken Range-wide Conservation Plan Annual Progress Report Page 98
TRACKING PROGRESS TOWARDS RWP CONSERVATION GOALS
The RWP establishes goals for four basic conservation components. They are:1) LPC breeding
population size; 2) habitat restoration acreages; 3) habitat availability; and; 4) permanently
conserved acreage. This section will outline the specific goals, the methodology that will be used
to assess them, and the frequency at which the goals will be evaluated by the various committees
that administer the RWP.
POPULATION GOALS
A committee consisting of academics and the LPC interstate working group developed the RWP
population goals for each ecoregion and range-wide (Figure 22). Those goals will be assessed in
full after the 10th year of RWP implementation using the average estimated population size over
the previous 10-year period. Moving averages better represent the number of birds that can be
supported by existing habitat because they smooth variations that are associated solely with
environmental conditions. If the 10-year population goals are not achieved the LPC Initiative
Council could take corrective actions by making adaptive management changes. Action may
include reallocation of conservation dollars, shifting of priority area locations, and adjustment of
offset ratios.
Figure 22. Lesser prairie-chicken population goals established by the WAFWA range-wide plan.
The goals will be assessed using population estimates averaged over the previous 10-year period.

Western Association of Fish and Wildlife Agencies March 2017
The 2016 Lesser Prairie-Chicken Range-wide Conservation Plan Annual Progress Report Page 99
The adaptive management section of the RWP also calls for annual evaluations of population size
starting after the 2016 breeding season survey. The annual evaluations will assess whether a 3-
year moving average of the estimated population size is >50% of the goal at the ecoregion and
range-wide scales. If the 3-year average population size falls below that level in any ecoregion,
or range-wide, it will trigger a discussion with the WAFWA Science Sub-committee. The sub-
committee will attempt to identify causes of the low population size and will have the opportunity
to make recommendations for corrective actions that include such changes as reprioritization of
conservation actions and adjustment of mitigation multipliers and ratios.
The LPC population estimates are derived from the annual range-wide aerial survey that was
initiated by WAFWA in 2012 (McDonald et al. 2012). The survey utilizes helicopters flying two
standard transects within 15 X 15 km grid cells distributed across the four WAFWA
ecoregions. The same transects within 283 grid cells are now being surveyed annually during the
LPC breeding season. The survey field methodology and analyses are described in detail in
McDonald et al (2012, 2016). The data from the 2016 aerial survey produced an estimated range-
wide population of 25,651 breeding birds which was a decrease of 14.5% from the previous year
(Table 37). However, that difference was not statistically significant at P = 0.1.
Table 37. Lesser prairie-chicken breeding population estimates for 2016 and 3 and 10-year moving
averages for each of WAFWA ecoregions and range-wide (McDonald et al. 2016).
Ecoregion 2016 Population Estimate
(90% CIs)
Percent Annual
Change 3-Yr Ave. Pop.
Size
(% of goal)
10-Yr Ave. Pop.
Size
(% of goal)
Shinnery Oak 3,255 (2,035 – 6,198) +263.3%a 1,875 (23.4%) 3,747 (46.8%)
Sand
Sagebrush 1,479 (762 – 2,310)
+64.9% 963 (9.6%) 2,222 (22.2%)
Mixed Grass 6,891 (4,579 – 9,793) -31.3% 8,201 (34.2%) 12,021 (50.1%)
Shortgrass 14,025 (8,354 – 20,055) -22.8% 15,493 (62.0%) 20,983 (83.8%)
Total 25,651 (18,692 – 34,991) -14.5% 26,533 (39.7%) 38,929 (58.1%) a P < 0.1
At the ecoregion scale, the only statistically significant annual population change occurred in the
Shinnery Oak ecoregion were the population was estimated to have increased from 2015 (Table
38). Data from the 2016 aerial survey generally indicate that the population remained stable from
the previous year except for the Shinnery Oak where a significant increase was observed. That
increase was likely due to good production because of suitable habitat conditions during the
previous summer.

Western Association of Fish and Wildlife Agencies March 2017
The 2016 Lesser Prairie-Chicken Range-wide Conservation Plan Annual Progress Report Page 100
Figure 23. Lesser prairie-chicken population goals established in the RWP and 10-year trends for
each ecoregion and range-wide (Garton 2012, McDonald et al. 2016). Confidence intervals (90%)
are depicted around the population estimates that were derived from the aerial survey (2012-present).
Despite the general population stability, the 3-year and 10-year moving averages are still below
the population goals in every ecoregion and range-wide (Figure 23, Table 38). The 3-year
moving averages are <50% of the population goal for 3 of 4 ecoregions and range-wide. That
fact will trigger a discussion with the Science Sub-committee at their next face-to-face meeting
which should occur sometime during early 2017. After that discussion, the sub-committee could
make recommendations for corrective actions to the LPC Advisory Committee.

Western Association of Fish and Wildlife Agencies March 2017
The 2016 Lesser Prairie-Chicken Range-wide Conservation Plan Annual Progress Report Page 101
HABITAT RESTORATION GOALS
The RWP establishes long-term and annual reporting unit-specific acreage goals for cropland
restoration and remediation of existing impacts (Van Pelt et al. 2013, (Appendices C-D)). Those
goals are intended to be assessed using the collective efforts of all the conservation agencies and
organizations who are delivering those practices in LPC range. The long-term range-wide acreage
goals for cropland restoration and remediation are 953,693 and 27,820, respectively. Those figures
represent the minimum amount of restoration needed to achieve 70% and 40% suitable habitat in
focal areas and connectivity zones, respectively. The annual restoration goals assume a 10-year
timeline to achieve the long-term acreage goals and call for >93,000 acres of cropland restoration
and >2,700 acres of remediation annually.
WAFWA, USFWS, and state wildlife agencies completed 2,781 acres of range planting during
this reporting period (Appendices C-D). However, the amount of range planting completed by
USDA through their programs was not reported to WAFWA. The vast majority of cropland
restoration is completed through their programs so it was not possible at the time of this report to
accurately assess progress toward the annual acreages goals in the RWP. WAFWA will continue
trying to acquire range planting data from our conservation partners so those goals can be more
accurately assessed in future reports.
The amount of remediation that occurred during 2016 in high priority LPC areas was estimated by
comparing spatial data from January 2016 to January 2017. The identified developments were
classified into the categories defined in the RWP and buffered by the associated impact radii to
identify the impacted acreage associated with each feature. The impacted acreages were tabulated
for each reporting unit and the difference between 2016 and 2017 was the estimated annual change
that occurred. The data sources used for these comparisons are as follows: IHS well data, RWP
project data, Tiger roads data augmented with the roads layer from ArcGIS, ITC electric line data,
distribution line data from WAFWA enrollments, FAA vertical structures >150 ft., and WAFWA
tank battery and building layers. The IHS well data and the FAA vertical structures data are
updated monthly and bi-monthly, respectively. The other layers are updated manually by
WAFWA staff when inaccuracies are identified on aerial imagery or through field observations.
While the listed data sources represent the best available information, there are still several known
issues that make it difficult to accurately assess the impacted acreage that has been added or
remediated. Those issues include changes associated only with geospatial data clean-up as
opposed to real activities that occurred on-the-ground. Additionally, the IHS database only
includes the locations of wells that have actively produced within the last 3 months. A well is
removed from the IHS database when it sits idle for >3 months with no production. Thus, it is
impossible to differentiate from the IHS database whether a well has been remediated or just
simply not produced in >3 months.
Despite the listed issues, the process followed by WAFWA to estimate annual impact changes
used the best data available at the time of this report. Those data indicate that up to 38,384 acres
of impact were removed during 2016 in CHAT 1 and CHAT 2 (Appendices C-D). The bulk of
the estimated impact reduction occurred in CHAT 1 (37,618 acres) indicating that industry might
be targeting the highest priority LPC areas for their remediation activities or at least prioritizing

Western Association of Fish and Wildlife Agencies March 2017
The 2016 Lesser Prairie-Chicken Range-wide Conservation Plan Annual Progress Report Page 102
those wells for closure when they cut production. The accuracy of these impact estimates is highly
questionable but the figures clearly do not indicate any kind of annual increase in the amount of
impact in the high priority LPC areas. WAFWA is currently working to develop our own spatial
oil and gas well layer using state permitting data that are updated monthly. The state oil and gas
data include spud and plug dates and wells are not removed merely based on production. This
upcoming change will greatly increase our ability to detect annual impact changes because oil and
gas wells account for a large proportion of all development throughout LPC range.
The RWP did not specify acreage goals for brush management because at the time it was written
there were no spatial data available that could be used to accurately assess the extent of woody
invasion across the LPC range. However, WAFWA recognizes that woody invasion is a major
threat to the species and utilizes brush management practices to restore habitat. WAFWA has
facilitated the completion of 11,914 acres of brush management since inception of the plan. There
are now spatial data available from NRCS that are being used to identify the extent of the tree
encroachment problem and target conservation efforts. Those data will likely be used to
established brush management acreage goals during the 5-year review of the RWP.
HABITAT AVAILABILITY GOALS
The RWP established goals of 70% and 40% LPC occupancy for focal area and connectivity zone
reporting units, respectively (Van Pelt et al. 2013). The adaptive management section of the RWP
specifies that those goals will be assessed after the 5th year of implementation using results from
an occupancy model and progress towards the stated habitat restoration goals. WAFWA has
already helped to support development of an initial occupancy model in hopes of having the
process more refined by the time of the 5-year assessment (McDonald et al. 2013). Shortly after
the 5th year of implementation (2019), WAFWA will support the development of a new occupancy
model with the most current spatial data. The result from that effort will be presented to the
Science Sub-committee which will determine whether to recommend any adaptive management
changes. If the established occupancy goals have not been achieved or maintained, the LPCIC
could adopt adaptive management changes such as shifting reporting unit boundaries, adjusting
mitigation multipliers, and reprioritizing WAFWA-delivery of conservation practices.
PROGRESS TOWARD PERMANENT CONSERVATION GOALS
The RWP establishes a goal of creating at least one stronghold within each WAFWA ecoregion
by the end of the 10th year of RWP implementation (Van Pelt et al. 2013). The adaptive
management section of the RWP dictates that progress towards the stronghold goals will be
assessed after the 5th full year of implementation (2019). If the LPCIC deems that insufficient
progress has been made at that point they can take corrective actions through the adaptive
management process laid out in the RWP. Some of the changes that they might consider include
an increase to the percentage of mitigation offset units going into permanent conservation and an
increased mitigation offset ratio.
A landscape must meet all the criteria identify by the USFWS to be considered a stronghold
(USFWS 2012). A stronghold must be at least 25,000 acres in size but could be as much as 50,000
acres, if lower quality habitat is interspersed. The acreage counted toward the stronghold must

Western Association of Fish and Wildlife Agencies March 2017
The 2016 Lesser Prairie-Chicken Range-wide Conservation Plan Annual Progress Report Page 103
also meet all the additional criteria listed in the RWP. Some of those criteria include the presence
of at least six LPC leks containing 6 males each, verifiable long-term development protection,
addressed surface and subsurface development threats, full range of LPC habitat needs, and long-
term management certainty. All acreage meeting the full list of criteria will be counted toward the
stronghold goals; not just those sites secured through the WAFWA program.
At the end of 2016, WAFWA had secured 3,344 qualifying acres in the Shinnery Oak (1,563) and
Mixed Grass (1,782) ecoregions (Table 38). Within the LPC range, there are currently 537,112
potential stronghold acres that have been identified by WAFWA. This figure includes all the tracts
identified as potential strongholds in the RWP (Van Pelt et al. 2013) and 3 USFWS-approved
conservation bank sites. Additionally, there are also 3,161,200 mutually exclusive acres within
LPC range that are under public ownership or encumbered by some type of easement. Some of
these non-WAFWA acres meet all the criteria to be considered as permanently conserved and
could be counted towards a stronghold. However, the exact spatial footprint of all the qualifying
acreage has not yet been identified. WAFWA staff will continue to try and delineate the qualifying
tracts so that progress towards the 10-year stronghold goals can be adequately assessed after the
5th year of RWP implementation.
In a letter to the USFWS Director dated March 31, 2015, WAFWA also expressed its intention to
pursue two additional permanent conservation goals in addition to the 10-year stronghold
goals. That letter committed WAFWA to offsetting 10% of the RWP industry impacts with
permanent conservation within 90 days. The letter also stated WAFWA’s intention to offset
25% of industry impacts in each ecoregion by the end of the 3rd full year of RWP implementation
(March 31, 2017). WAFWA achieved the first commitment satisfactorily on June 29, 2015
when it acquired 1,604 acres of permanent conservation in the Shinnery Oak ecoregion in
Texas. That property immediately generated 1,140 conservation offset units which was 10.2% of
the 11,123 impact units that were in the mitigation ledger at that time. The next annual report
will assess whether WAFWA fulfilled its intention to offset 25% of the impacts in each
ecoregion with permanent conservation by the end of the 3rd full year of RWP implementation
(March 31, 2017).
WAFWA has already made good progress towards achieving its 3-year permanent conservation
commitment. At the end of this reporting period, WAFWA permanent conservation sites had
generated enough mitigation units to offset 7.8% of the impacts range-wide. The available offset
units were also sufficient to offset 2.2% of the impacts in the Mixed Grass ecoregion, 87.1% of
the impacts in the Shinnery Oak ecoregion, and 0% of the impacts in the Sand Sagebrush and
Shortgrass ecoregions. Of course, WAFWA also purchased a large ranch in the Sand Sagebrush
ecoregion during this reporting period. That property is not yet producing mitigation units but it
is anticipated to do so before the end of March, 2017. That one property will be sufficient to
offset more than 25% of the impacts in the Sand Sagebrush ecoregion and range-wide when it
begins generating mitigation units. Additionally, WAFWA also anticipates securing some more
permanent conservation in the Mixed Grass and Shortgrass ecoregion during early 2017.

Western Association of Fish and Wildlife Agencies March 2017
The 2016 Lesser Prairie-Chicken Range-wide Conservation Plan Annual Progress Report Page 104
Table 38. Acreage summary of WAFWA permanent conservation agreements, identified potential
stronghold properties, and other publicly owned lands, 2016. A property must be located primarily in
CHAT 1-3 to qualify as stronghold.
Ecoregion –
Location
WAFWA Permanent
Conservation Agreementsa
Potential Stronghold
Acreageb
Other Public and
Conservation Propertiesc Total
Shinnery Oak
CHAT 1 1,057 363,402 60,052 424,511
CHAT 2 396 0 91,836 92,232
CHAT 3 110 12,525 1,565,979 1,578,614
CHAT 4 0 0 530,575 530,575
Total 1,563 375,927 2,248,442 2,625,932
Mixed Grass
CHAT 1 1,670 49,693 46,293 97,656
CHAT 2 0 71 18,279 18,350
CHAT 3 0 1,735 160,373 162,108
CHAT 4 111 0 31,477 31,588
Total 1,782 51,499 256,422 309,703
Sand Sagebrush
CHAT 1 0 33,884 195,977 229,861
CHAT 2 0 0 13,679 13,679
CHAT 3 0 24,430 170,347 194,777
CHAT 4 0 16,152 255,026 271,178
Total 0 74,466 635,028 709,494
Shortgrass
CHAT 1 0 17,940 15,183 33,123
CHAT 2 0 0 0 0
CHAT 3 0 17,280 0 17,280
CHAT 4 0 0 6,126 6,126
Total 0 35,220 21,308 56,528
Range-wide
CHAT 1 2,727 464,919 317,504 785,150
CHAT 2 507 71 123,794 124,372
CHAT 3 110 55,970 1,896,699 1,952,779
CHAT 4 111 16,152 823,204 839,467
Grand Total 3,344 537,112 3,161,200 3,701,656 a WAFWA acquired 1,604 acres but the existing perimeter fence does not currently encompass the entire property. The fence
will be moved to the correct boundary in the future so that a WAFWA management plan can be implement across the entire
property. b Includes acreages from properties identified as potential strongholds in the RWP (Van Pelt et al. 2013) and properties contained
with USFWS conservation banking agreements. These figures do not include the acres that have been permanently conserved
through the WAFWA program. c This category includes other protected or publicly owned properties not identified as potential strongholds in the range-wide
plan. These acreages are owned by U.S. Department of Defense, Non-Government Organizations, State Land Boards, State
Parks, Recreation, and Wildlife Agencies, U.S. Fish & Wildlife Service, U.S. Bureau of Land Management, U.S. Forest Service,
Privately Owned Parks, U.S. National Park Service, Agricultural Research Service, U.S. Bureau of Reclamation, and City or
County Government. The acreages also include privately owned sites contained within conservation easements.
Western Association of Fish and Wildlife Agencies March 2017
The 2016 Lesser Prairie-Chicken Range-wide Conservation Plan Annual Progress Report Page 105
FINANCIAL SUMMARY
The Range Wide Business Plan utilizes a defined investment strategy that is expected to achieve
or exceed the conservative investment earnings, projecting a ‘real’ rate of return over the long term
of 4%. The investment asset allocation targets 50% Equities, 10% Alternatives/ Real Assets, and
40% Fixed Income. Two separate investment trusts are used to distribute enrollment and impact
fees. When companies are invoiced, revenue is recognized by WAFWA. Upon receipt, fee
revenues are split accordingly; 87.5% are allocated to a conservation trust for conservation offsets
and 12.5% are deposited into an administration trust for operation related expenses, such as
salaries, aerial surveys GIS support and other program needs. When permanent easements are
purchased, individual endowments are established and individual investment strategies are defined
and monitored to achieve conservation management perpetuity payments. WAFWA has an outside
audit firm conduct a consolidated audit annually and posts three years of 990s on its website.
The annual real rate of return is calculated by taking the rate of return and subtracting the inflation
average rate. The rate represents the rate of return one would achieve if they were to sell the
investments now. The conservation endowment average annual rate of return for the 12-month
reporting period (January 1-December 31, 2016) was 7.41% and an average annual real rate of
return of 7.11%. The conservation endowment was implemented in February 2015 and since
inception has yielded an average rate of return of 2.37%.
The TPWD Permanent Trust has a December 31, 2016 balance of $338,739 and a real rate of return
of 4.71%. WAFWA Ranch’s Trust was effective August 18, 2016 and represents a four and one
half month reporting period. The trust is partially funded and reflects a balance of $2,397,611; rate
of return of 5.76% and a real rate of return of 5.46%. As mentioned above, the expected ‘real’ rate
of return over the long term is 4% and due to market conditions there will be years of up markets
and down market trends. The investment assets are closely monitored and investment adjustment
decisions are made to take advantage of up market years and limit negative impacts during down
market years.
Since the inception of the RWP, WAFWA has invoiced $64.8 million in enrollment and impact
fees and collected $62.3million of which 87.5% or $54.6 million is restricted for conservation
efforts. As of December 31, 2016, and not included in the $62.3 million, $1,477,418 are in account
receivables and $902,676 has been written off to bad debt.
During the current enrollment period, conservation income has resulted in $13 million of
enrollment and impact fees. (Table 39) Landowner contracts, permanent easements, land purchase
and associated costs, outstanding account receivables and investment gain/loss make up the
conservation related expenses. These expenses total $15.7 million for the reporting period and
$23.4 million since inception of the RWP. A net position of approximately $35 million is
restricted for future conservation endeavors. During this reporting period, WAFWA added three
new 10-year landowner contracts. Also during this reporting period, WAFWA purchased one
permanent easement in the Mixed Grass ecoregion consisting of approximately 1,781 acres and a
acquired a 29,718-acre ranch fee simple in the Sand Sagebrush ecoregion.

Western Association of Fish and Wildlife Agencies March 2017
The 2016 Lesser Prairie-Chicken Range-wide Conservation Plan Annual Progress Report Page 106
Table 39. Conservation Trust Account Activity
Current
Reporting Period
Since Inception to
start of reporting
period
01/01/2016 -
12/31/2016 03/1/2014 -
12/31/2015 TOTAL Enrollment Fees $ 9,910,553 $ 32,385,788 $ 42,296,340 Impact Fees $ 3,111,840 $ 11,235,795 $ 14,347,635 Investment Income / Loss $ 1,146,966 $ 947,647 $ 2,094,613 Total Revenue $ 14,169,358 $ 44,569,230 $ 58,738,588 Landowner Short Term Contracts $ 1,866,748 $ 1,806,886 $ 3,673,634 Permanent Easements $ 154,493 $ 14,851 $ 169,344 Land purchase costs, Account
Receivables and Investment Gain/Loss $ 13,700,582 $ 5,838,526 $ 19,539,109 Total Deductions $ 15,721,823 $ 7,660,263 $ 23,382,086 Net Position $ 35,356,502
As stated earlier, WAFWA secured three additional landowner contracts bringing the total
number of term contracts to thirteen. The three contracts are located within the Shortgrass and
Mixed Grass ecoregions. In addition to the term contracts, each representing ten year terms,
WAFWA ‘s permanent conservation habitats total three, including an easement in the Shinnery
Oak, an easement in the Mixed Grass and the 29,718 acre ranch purchased by WAFWA in the
Sand Sagebrush ecoregion. The landowner contracts and permanent easement reflect
conservation efforts within the four designated LPC ecoregions. (Table 40) Average annual
habitat replacement costs per acre are utilized in calculating the mitigation fees charged to
industry and in the payments to secure offset habitats. The calculation is based on total
expenditures to landowners in the current reporting period including the actual cost of acquiring
permanent conservation and spread over twenty-five years, even though the actual payment to
the landowner is made during year one. This is done to align with the way the industry fees are
calculated and therefore a more stabilized value of what is paid to landowners for offsets in
comparison to what is charged to industry for impacts. Even though some of the payments for
offsets are higher than what is currently charged to industry, as WAFWA acquires more
permanent conservation, you will see the future cost of the landowner offsets decrease.
Table 40. Mitigation per unit cost by ecoregion 1/1-12/31, 2016
Industry Impacts Landowner / Offsets
Mixed Grass 48.47 29.58
Short Grass 29.56 20.13
Shinnery Oak 32.12 66.03
Sand Sagebrush 19.69 25.66

Western Association of Fish and Wildlife Agencies March 2017
The 2016 Lesser Prairie-Chicken Range-wide Conservation Plan Annual Progress Report Page 107
The decision regarding ecoregion fund allocation is based upon current conservation habitats that
are experiencing impacts. When contracts and permanent easements are acquired, payments are
issued for a one-time incentive payment; an annual rangeland management payment each
October; and if applicable, habitat restoration upon completion. The incentive and rangeland
management payments within term contracts and permanent easements reflect $1.3 million in fee
revenues (Table 41 and 42) that were used for conservation offsets in this reporting period and
$3.9 million since the plan’s inception (Table 43).
Table 41. Term Contract Payments by Ecoregion: 1/1/2016 - 12/31/2016
Mixed Grass Short Grass Shinnery Oak Sand Sagebrush TOTAL
Incentive Payments $ 5,859 $ 19,478 $ - $ - $ 25,337
Rangeland
Management Plan $ 848,388 $ 59,934 $ 65,448 $ 120,405 $1,094,175
Habitat Restoration
Payments $ 307,874 $ - $ 439,362 $ - $ 747,236
TOTAL $ 1,162,121 $ 79,412 $ 504,810 $ 120,405 $1,866,748
Table 42. Permanent Easement Payments by Ecoregion: 1/1/2016 - 12/31/2016
Mixed Grass Short Grass Shinnery Oak Sand Sagebrush TOTAL Incentive
Payments $ - $ - $ 148,735 $ 148,735
Rangeland
Management Plan $ - $ - $ 9,627 $ - $ 9,627
Habitat Restoration
Payments $ - $ - $ 15,646 $ - $ 15,646
TOTAL $ - $ - $ 25,273 $ 148,735 $ 174,008
Current ecoregion impacts (Table 43) reflect $3.9 million in fee revenues that were used for
conservation offsets for both landowner contracts and permanent conservation since the
inception of the RWP in 2014. Table 43 summarizes the percentage of dollars spent in each
payment category by ecoregion to the total dollars within that payment category. For instance, of
the $507,408 in landowner incentive payments issued, 40% of the funds were allocated to Mixed
Grass whereas 7% of the funds were allocated to the Shortgrass ecoregion. Overall, 33% of the
total $3.9 million in payments are going toward habitat restoration.

Western Association of Fish and Wildlife Agencies March 2017
The 2016 Lesser Prairie-Chicken Range-wide Conservation Plan Annual Progress Report Page 108
Table 43. Contract and Permanent Easement payments by Ecoregion and % to total since plan inception
Mixed
Grass
% of
Total Short
Grass
% of
Total Shinnery
Oak
% of
Total Sand Sage
% of
Total TOTAL
Landowner Incentive
Payments *includes contract and
permanent
$ 204,943 40% $37,102 7% $ 66,640 13% $ 198,723 39% $ 507,408
Landowner Contract Restoration Payments
$ 373,309 30% $ - 0% $ 872,436 70% $ - 0% $ 1,245,745
Landowner
Management
Plan/Maint Payments
$1,586,087 76% $ 92,262 4% $ 155,287 7% $ 241,426 12% $ 2,075,062
Landowner Permanent
Maint Exp $ - 0% $ - 0% $ 18,634 100% $ - 0% $ 18,634
Landowner Long Term Restoration Exp
$ - 0% $ - 0% $ 15,646 0% $ - 0% $ 15,646
TOTAL
CONSERVATION
EXPENSES
$ 2,164,339 $ 129,364 $ 1,128,643 $ 440,149 $ 3,862,494
RESPONSIBLE PARTIES FOR RWP ADMINISTRATION
WAFWA was founded in 1922. It currently consists of 23 member states and provinces that have
primary responsibility and authority for protecting and managing fish and wildlife in the western
United States and Canada. The 19 member states encompass over 2.5 million square miles. The
chief executive officer of each fish and wildlife agency is on the Board of Directors of three non-
profit business entities, the Western Association of Fish and Wildlife Agencies, its fund-raising
arm, the Foundation for Western Fish and Wildlife (FWFW) and the Western Conservation
Foundation (WCF).
The WAFWA Board of Directors established the LPCIC in October 2013 when the RWP was
endorsed by the USFWS. The directors of the state fish and wildlife agencies within the LPC
range are members of WAFWA, FWFW, and WCF Boards of Directors and comprise the LPCIC,
along with a member of the Executive Committee, appointed by the President, and representing
an agency with extensive experience with ESA issues as it pertains to private lands. This
relationship ensures decision-making roles regarding how and where funds are spent for the state
agencies, as well as coordination with other WAFWA/WCF conservation efforts. The LPCIC
annually reports RWP decisions.

Western Association of Fish and Wildlife Agencies March 2017
The 2016 Lesser Prairie-Chicken Range-wide Conservation Plan Annual Progress Report Page 109
The LPCIC established a Lesser Prairie-Chicken Advisory Committee (LPCAC) and associated
working groups and maintained the Interstate Working Group (IWG). The LPCAC and IWG are
strictly advisory in nature and provide recommendations to the LPCIC for final approval through
the adaptive management process. The intent of these groups is to support the RWP, promote
effective communication between the parties, resolve disputes, revise cost structures, and make
adaptive management recommendations. The LPCAC is supported by two sub-committees: (1)
Fee Structure Sub-committee and (2) Science Sub-committee.
COMMITTEE COMPOSITION
Interstate Working Group
● One representative from each of the five state fish and wildlife agencies ● The WAFWA Grassland Coordinator as an ex officio member
Advisory Committee
● The WAFWA LPC Program Manager will coordinate and facilitate the Advisory
Committee as an ex officio member ● An additional 17 representatives will compose the committee
● One representative from three of the five state fish and wildlife agencies, to serve
on a rotating schedule ● One representative from each of the 2 primary federal agencies closely involved
with LPC conservation (USFWS and NRCS) ● Three representatives from industry organizations (e.g. oil & gas, wind,
transmission, etc.) ● Three representatives from agricultural and landowner organizations
(e.g. Cattlemen’s Association, Corn Grower’s Farm Bureau etc.) ● Three representatives from conservation organizations (e.g. The Nature
Conservancy, North American Grouse Partnership, National Audubon Society,
etc.) ● Three representatives from local government or municipalities
Fee Structure Sub-committee
● The WAFWA LPC Program Manager will coordinate and facilitate the Fee Structure
Sub-committee as an ex officio member. ● An additional 13-15 representatives will compose the Sub-committee
● One representative from three of the five state fish and wildlife agencies
● One representative from each of the five LPC states from NRCS ● One representative from each of the five LPC states from FSA
● One representative from FWS Regions 2 and 6 from the Partners for Fish and
Wildlife Program, if desired
Science Sub-committee
● The WAFWA LPC Program Manager will coordinate and facilitate the Science Sub-
committee as an ex officio member.
Western Association of Fish and Wildlife Agencies March 2017
The 2016 Lesser Prairie-Chicken Range-wide Conservation Plan Annual Progress Report Page 110
● Up to a maximum of an additional 15 representatives will compose the sub-committee
● One representative from each of the five state fish and wildlife agencies and
USFWS ● Up to nine additional members with expertise in LPC ecology, habitat
modeling, population monitoring, impact evaluation, and other relevant topics
may serve on the sub-committee
COMMITTEE RESPONSIBILITIES
Committees will have the following responsibilities and will make recommendations to the LPCIC
for final decisions:
Interstate Working Group
The Interstate working group will:
● Update and revise the LPC RWP ● Update and revise the CHAT
● Review and update, as necessary, ecoregions, focal areas, and connectivity zones ● Make nominations to the Science Sub-committee
● Annually provide a report to the LPCIC
Advisory Committee
The Advisory Committee will:
● Review annual reports from Ecoregion Implementation Teams and Technical
Service Providers concerning enrollment, monitoring and conservation delivery
related to the RWP
● Review overall progress toward meeting conservation goals through the mitigation
framework and, as necessary, make recommendations for changes to the mitigation
framework ● Review and recommend applications for Technical Service Providers to the LPCIC
and review compliance and reporting by Technical Service Providers ● Review non-compliance issues by participants and terminate agreements if
necessary ● Review research needs and, if needed, recommend a portion of annual Habitat
Conservation Fees as noncash (e.g. in-kind) match for research ● Review reports and evaluate recommendations from the Fee Structure and Science
Sub-committee and the Interstate Working Group
● Annually provide a report to the LPCIC
Fee Structure Sub-committee
The Fee Structure Sub-committee will:
● Annually review and update mitigation costs and landowner enrollments in specific
practices ● Annually review adaptive management triggers and evaluated actions related to the
fee structure for the mitigation framework

Western Association of Fish and Wildlife Agencies March 2017
The 2016 Lesser Prairie-Chicken Range-wide Conservation Plan Annual Progress Report Page 111
● Annually provide a report to the Advisory Committee
Science Sub-committee
The Science Sub-committee will:
● Review annual reports related to population estimates and trends, including aerial
and ground-based surveys
● Evaluate emerging science related to LPC, including habitat selection, responses to
conservation practices, responses to impacts, etc. ● Annually review adaptive management triggers and evaluated actions related to
LPC population trends and emerging science ● Review and update research needs for LPC
● Annually provide a report to the Advisory Committee
COMMITTEE MEETINGS
The committees, working groups and sub-committees will meet, at minimum, annually. Additional
meetings of these committees may be scheduled as requested by members of the committees, LPC
Program Manager or the LCPIC. The general timeframe for the meetings will be from mid-fall
through mid-winter. This allows time for the population survey and vegetation monitoring data to
be summarized and available for discussion at the meetings. The order of the meetings will be as
follows: 1.) Science Sub-committee; 2.) Fee Structure Sub-committee; 3.) IWG; 4.) Advisory
Committee; and 5.) LPCIC.
REPORTING PERIOD
The reporting period for this annual report is January 1, 2016 through December 31, 2016.
Reporting periods have varied during the first two annual reports but the reporting period has been
formalized to be the calendar year, starting in 2016.
During the reporting period, the LPC Program Manager, with assistance of WAFWA LPC program
staff, coordinated conference calls and in person meetings of the various committees and sub-
committees described in the RWP.
Interstate Working Group
During the reporting period the interstate working group conducted one conference call.
Advisory Committee
The Advisory Committee met three times during this reporting period via conference call. During
these meetings, the Advisory Committee received updates from WAFWA LPC staff on RWP
implementation and progress towards goals as well as species listing updates.
Fee Structure Sub-Committee
During the reporting year this committee did not meet. There was correspondence from the LPC
Program Manager about by-law establishment and updates but no formal meetings.

Western Association of Fish and Wildlife Agencies March 2017
The 2016 Lesser Prairie-Chicken Range-wide Conservation Plan Annual Progress Report Page 112
Science Sub-Committee
The Science Sub-Committee met four times (once in person in Edmund, Oklahoma and three
conference calls). The SSC developed by-laws to formalize the process for proposal submittal and
action. The Science Sub-Committee by-laws are posted on the LPC webpage
(http://www.wafwa.org/initiatives/grasslands/lesser_prairie_chicken/). A chair and vice-chair
were also elected.
STAFFING
There is flexibility built into the RWP as to the location of personnel associated with this effort.
Field personnel will need to be located within the five-state range of the LPC (Kansas, Texas,
Oklahoma, Colorado, and New Mexico), but administrative services can occur from remote
locations.
● LPC Program Manager. There was turnover in the LPC Program Manager position in 2016.
The new LPC Program Manager assumed duties in July, 2016. This person directs
operations, supervises staff, is responsible for annual reports to USFWS, and reports to the
WAFWA Grassland Coordinator. The LPC Program Manager is responsible for ensuring
thorough communication and coordination among affected state, federal, and local
agencies for the RWP. This position staffs the various committees and sub-committees as
described in the RWP and is responsible for annual monitoring and reporting related to the
RWP. To the extent consistent with applicable state law, information in annual reports
includes, but not be limited to, the following:
1. Number of participants enrolled under the WCA over the past year, including copies of
the completed WCP, excluding any identifying information related to participants
2. A summary of habitat management and habitat conditions in the covered area and on
all enrolled property over the past year with any identifying information related to
participants removed
3. Effectiveness of habitat management activities implemented in previous years at
meeting the intended conservation benefits
4. Population surveys and studies conducted over the past year with any identifying
information related to participants removed
5. Any mortality or injury of the species that was observed over the previous year
6. A discussion of the funds used for habitat conservation within the states
● Four Regional Biologists. They are responsible for working with industry and private
landowners to enroll and monitor leases, working with landowners to direct conservation
funding, and coordinating with local state fish and wildlife, NRCS, and USFWS Partners
for Fish and Wildlife Program staff. In addition, WAFWA partnered with Pheasants
Forever to provide cost share partner for biologists that will be working in the LPC range
delivering conservation. These biologists will have range planning expertise to assist with
range management components associated with the RWP. ● A LPC Conservation Delivery Director and Industry Service Director supervise the four
biologist positions and are responsible for interacting with participants and potential
partners in the RWP.

Western Association of Fish and Wildlife Agencies March 2017
The 2016 Lesser Prairie-Chicken Range-wide Conservation Plan Annual Progress Report Page 113
WCF administrative staff report through the CFO/Treasurer. They consist of:
● Supervisor of Business Operations, who prepares, analyzes, and/or audits financial records
and documents, accounting systems, financial statements, work papers, budgets, tax and
payroll records, and other related documents. ● One Business Operation technician, who analyzes, researches, and reconciles financial
documents, ensure compliance with laws, rules, and policies, and prepares invoices for
payment. ● One contract/grant administrator, who maintains records on incoming funds, expenditures
for conservation, travel costs, and salary. ● Business Administrative Assistant, who is the main receptionist, assists with general
accounting functions and special projects.
● One GIS coordinator, who ensures field staff is producing data in a consistent fashion and
maintains a central database of all enrolled leases and conservation efforts, and coordinates
with Software Service suppliers. This is contracted to the University of Kansas.
In addition to the staffing structure above, the RWP affords the LPCIC flexibility to contract out
work to qualified 3rd party, technical service providers and other entities to perform certain
elements of the work detailed in this plan.
RESEARCH PRIORITIES
The RWP identifies the LPC Sub-Committee as the entity to identify potential research needs and
monitor for new and emerging science.
Current Research Projects:
Relationship between remotely-sensed vegetation phenology and lesser prairie-chicken
population dynamics.
Lesser prairie-chicken ecology in CRP lands in Texas.
Brood survival of lesser prairie chickens in the Sand Shinnery Oak Ecoregion of Texas and New
Mexico.
Assessing wildlife use of artificial water sources in west Texas. (Not directly related to LPC, but
may provide some info)
The Economic Impact of Lesser Prairie Chicken Protection in Oklahoma which will construct a
database of county employment and related economic conditions for the areas in and around
designated-LPC habitat in Colorado, Kansas, New Mexico, Oklahoma and Texas, and link this
data to county-scale LPC habitat quality data contained in the RWP's Crucial Habitat Assessment
Tool (CHAT), model the impact of the LPC listing decision and CHAT habitat levels on
employment in the five-state LPC habitat region; break down the total impact at the individual
CHAT level, and model the decision of firms in Oklahoma to enroll in the RWP and either
proceed with the development project as originally planned or alter the project in response to
LPC habitat mitigation conditions. ODWC has received a 1 year grant progress report
September 30, 2016.

Western Association of Fish and Wildlife Agencies March 2017
The 2016 Lesser Prairie-Chicken Range-wide Conservation Plan Annual Progress Report Page 114
Impacts of Fragmentation and Heterogeneity on Resource Selection, Survival, and Recruitment
of Lesser Prairie-Chickens in Oklahoma which had objectives to evaluate population
demography including survival, nest success, and recruitment of LPC, and evaluate seasonal
habitat selection of LPC with emphasis on nesting and brood site selection; evaluate weekly,
monthly, and seasonal movements and homes ranges of adult LPC; evaluate the impacts of
energy development and other anthropogenic features on habitat use, movements, and survival of
LPC; evaluate the impacts of management actions on habitat use, movements, and survival of
LPC; compare vital rates among LPC populations in Oklahoma and Kansas and model future
population change based on demographic data; determine the effect of landscape metrics (e.g.,
patch size, habitat fragmentation, and level of connectivity) on vital rates of LPC; evaluate
potential radio-mark handicap between 2 radio transmitter types; and evaluate microclimate
(temperature) characteristics, variability across the landscape, and LPC selection at nest, brood,
winter, and summer locations. ODWC has received the final grant report but are awaiting the
dissertation presentation at the end of the spring 2017 semester.
Lesser prairie-chicken translocation proposal for the Sand Sagebrush Ecoregion: population
recovery on the Cimarron and Comanche National Grasslands (FY 2017)
Recently Published Research:
Earl, J. E., S. D. Fuhlendorf, D. Haukos, A. M. Tanner, D. Elmore, and S. A. Carleton. 2016.
Characteristics of lesser prairie-chicken (Tympanuchus pallidicinctus) long-distance movements
across their distribution. Ecosphere 7(8): doi:10.10002/(ISSN)2150-8925.
Early, J. E. and S. D. Fuhlendorf. 2016. Relative importance of climate variables to population
vital rates: A quantitative synthesis for the lesser prairie-chicken. PLOS ONE 11(9): e0163585.
doi: 10.1371/journal.pone.0163585.
Fritts, S. R. B. A. Grisham, D. A. Haukos, C. W. Boal, M. Patten, D. H. Wolfe, C. Dixon, R. D.
Cox, and W. R. Heck. 2016. Long-term prairie-chicken nest ecology in response to grassland
management. Journal of Wildlife Management 80: 527-539.
Godar, A. J. Influence of climate change and land use on lesser prairie-chicken (Tympanuchus
pallidicinctus) population persistence in the sand sagebrush and short-grass prairies. 2016.
Lubbock, Texas, USA, Texas Tech University.
Griffin, C. The influence of environmental and landscape variables on lesser prairie-chickens in
the Sand Shinnery Oak Prairie Ecoregion of Texas and New Mexico and the Mixed-Grass Prairie
Ecoregion of Oklahoma and Kansas. 2016. Lubbock, Texas, USA, Texas Tech University.
Hagen, C.A., Jr. D. C. Pavlacky, K. Adachi, F. E. Hornsby, T. J. Rintz, and L. L. McDonald.
2016. Multiscale occupancy modeling provides insights into range-wide conservaton needs of
lesser prairie-chicken (Tympanuchus pallidicinctus). Condor 118: 597-612.
Haukos, D.A. and C. Boal (eds). Ecology and conservation of lesser prairie-chickens. CRC
Press, Boca Raton, Florida, USA.

Western Association of Fish and Wildlife Agencies March 2017
The 2016 Lesser Prairie-Chicken Range-wide Conservation Plan Annual Progress Report Page 115
Jarnevich, C.S., R. T. Holcombe, J.T. B. A. Grisham, C. W. Boal, M. J. Butler, J. Pitman, S. C.
Kyle, D. Klute, G. M. Beauprez, A. Janus, and W. E. VanPelt. 2016. Assessing range-wide
habitat suitability of the lesser prairie-chicken. Avian Conservation and Ecology 11: Article 2.
Kraft, J. D. Vegetation characteristics and lesser prairie chicken responses to land cover types
and grazing management in western Kansas. 2016. Manhattan, Kansas, USA, Kansas State
University.
Lipp, T. W. Geospatial analysis of how oil and gas energy development influences lesser prairie-
chicken spatial ecology in Kansas. 2016. Bowling Green, Ohio, USA, Bowling Green State
University.
Lusk, D. Non-breeding season ecology of lesser prairie-chickens (Tympanuchus pallidicinctus)
assessing survival and resource selection within southeastern New Mexico. 2016. Las Cruces,
New Mexico, USA, New Mexico State University.
Oyler-McCance, S.J., R. W. DeYoung, J. A. Fike, C. A. Hagen, J. A. Johnson, L. C. Larsson,
and M. A. Patten. 2016. Rangewide genetic analysis of lesser prairie-chicken reveals population
structure, range expansion, and possible introgression. Conservation Genetics DOI:
10.1007/s10592-016-0812-y.
Robinson, S.G., D. A. Haukos, R. T. Plumb, C. A. Hagen, J. C. Pitman, J. M. Lautenbach, D. S.
Sullins, J. D. Kraft, and J. D. Lautenbach. 2016. Lesser prairie-chicken fence collision risk across
its northern distribution. Journal of Wildlife Management 80: 906-915.
Ross, B.E., D. A. Haukos, C. A. Hagen, and J. C. Pitman. 2016. Landscape composition creates a
threshold influencing lesser prairie-chicken population resilience to extreme drought. Global
Ecology and Conservation 6: 179-188.
Ross, B.E., D. Haukos, C. Hagen, and J. Pitman. 2016. The relative contribution of variation in
climate to changes in lesser prairie-chicken abundance. Ecosphere 7(6):e01323.
Robinson, S. G., D. A. Haukos, D. S. Sullins, R. T. Plumb. 2016. Use of free-water by nesting
lesser prairie-chickens. Southwestern Naturalist 61: 187-193.
Sadoti, G., T. P. Albright, and K. Johnson. 2016. Applying dynamic species distribution
modelling to lek-mating species. Journal of Biogeography doi: 10.1111/jbi.12886: 1-13.
Spencer, D, D. Haukos, C. Hagen, M. Daniels, and D. Goodin. 2016. Conservation reserve
program mitigates grassland loss in the lesser prairie-chicken range of Kansas. Global Ecology
and Conservation 9: 21-38.
Strong, C. Investigating lesser prairie-chicken (Tympanuchus pallidicinctus) breeding season
survival, habitat use, and space use to understand patterns of declining lek attendance. 2016. Las
Cruces, New Mexico, USA, New Mexico State University.

Western Association of Fish and Wildlife Agencies March 2017
The 2016 Lesser Prairie-Chicken Range-wide Conservation Plan Annual Progress Report Page 116
Zavaleta, J. C., D. A. Haukos, B. Grisham, C. Boal, and C. Dixon. 2016. Restoring sand
shinnery oak prairies with herbicide and grazing in New Mexico. Southwestern Naturalist 61:
225-232.
LITERATURE CITED
Fields, T.L. 2004. Breeding season habitat use of conservation reserve program (CRP) land by
lesser prairie-chickens in west central Kansas. 70. 2004. Fort Collins, Colorado, USA, Colorado
State University
Garton, E. O. 2012. An Assessment of Population Dynamics and Persistence of Lesser Prairie-
Chickens. Unpublished manuscript. Western Association of Fish and Wildlife Agencies.
McDonald, L., J. Griswold, T. Rintz, and G. Gardner. 2012. Results of the 2012 range-wide survey
of lesser Prairie-chickens (Tympanuchus pallidicinctus). Unpublished manuscript. Western
Association of Fish and Wildlife Agencies
McDonald, L., K. Adachi, T. Rintz, G. Gardner, and F. Hornsby. 2014. Range-wide population
size of the lesser prairie-chicken: 2012, 2013, and 2014. Technical report prepared for the Western
Association of Fish & Wildlife Agencies. Laramie, Wyoming, USA.
McDonald, L., K. Nasman, T. Rintz, F. Hornsby, and G. Gardner. 2016. Range-wide population
size of the lesser prairie-chicken: 2012, 2013, 2014, 2015 and 2016. Technical report prepared for
the Western Association of Fish & Wildlife Agencies. Laramie, Wyoming, USA.
Rodgers, R.D. & R. W. Hoffman. 2005. Prairie grouse population responses to conservation
reserve program grasslands: an overview. The Conservation Reserve Program - Planning for the
Future: Proceedings of a National Conference, Fort Collins, Colorado, June 6-9, 2004 (ed. by
A.W. Allen and M. W. Vandever), pp. 120-128. U.S. Geological Survey, Biological Resources
Division, Scientific Investigation Report 2005-5145, Fort Collins, Colorado, USA.
Spencer, D. G., D. Haukos, C. Hagen, M. Daniels, and D. Goodin. 2017. Conservation reserve
program mitigates grassland loss in the lesser prairie-chicken range of Kansas. Global Ecology
and Conservation 9:21-38.
USDA Natural Resources Conservation Service. 2012. USDA conservation program
contributions to lesser prairie-chicken conservation in the context of projected climate
change. Conservation effects assessment project.
U.S. Fish and Wildlife Service [USFWS]. 1997. Endangered and threatened wildlife and plants;
90-day finding for a petition to list the Lesser Prairie-Chicken as threatened. Federal Register
62:36482–36484.
U.S. Fish and Wildlife Service [USFWS]. 2003. Guidance for the establishment, use, and
operation of conservation banks. Agency Memorandum.
U.S. Fish and Wildlife Service [USFWS]. 2012. Conservation needs of the lesser prairie-chicken.

Western Association of Fish and Wildlife Agencies March 2017
The 2016 Lesser Prairie-Chicken Range-wide Conservation Plan Annual Progress Report Page 117
Technical white paper.
U.S. Fish and Wildlife Service [USFWS]. 2012. Endangered and threatened wildlife and plants;
listing the Lesser Prairie-Chicken as a threatened species. Federal Register 77238:73827–73888.
U.S. Fish and Wildlife Service [USFWS]. 2014. Endangered and threatened wildlife and plants;
special rule for the Lesser Prairie-Chicken. Federal Register 79:20074‒20085.
U.S. Fish and Wildlife Service. 2014. Biological opinion for the implementation of the
conservation reserve program (CRP) within the occupied range of the lesser prairie-chicken as
described in Farm Service Agency’s (FSA) Biological Assessment for the CRP.
Van Pelt, W. E., S. Kyle, J. Pitman, D. Klute, G. Beauprez, D. Schoeling, A. Janus, J.
Haufler. 2013. The lesser prairie-chicken range-wide conservation plan. Western Association of
Fish and Wildlife Agencies, Cheyenne, Wyoming.
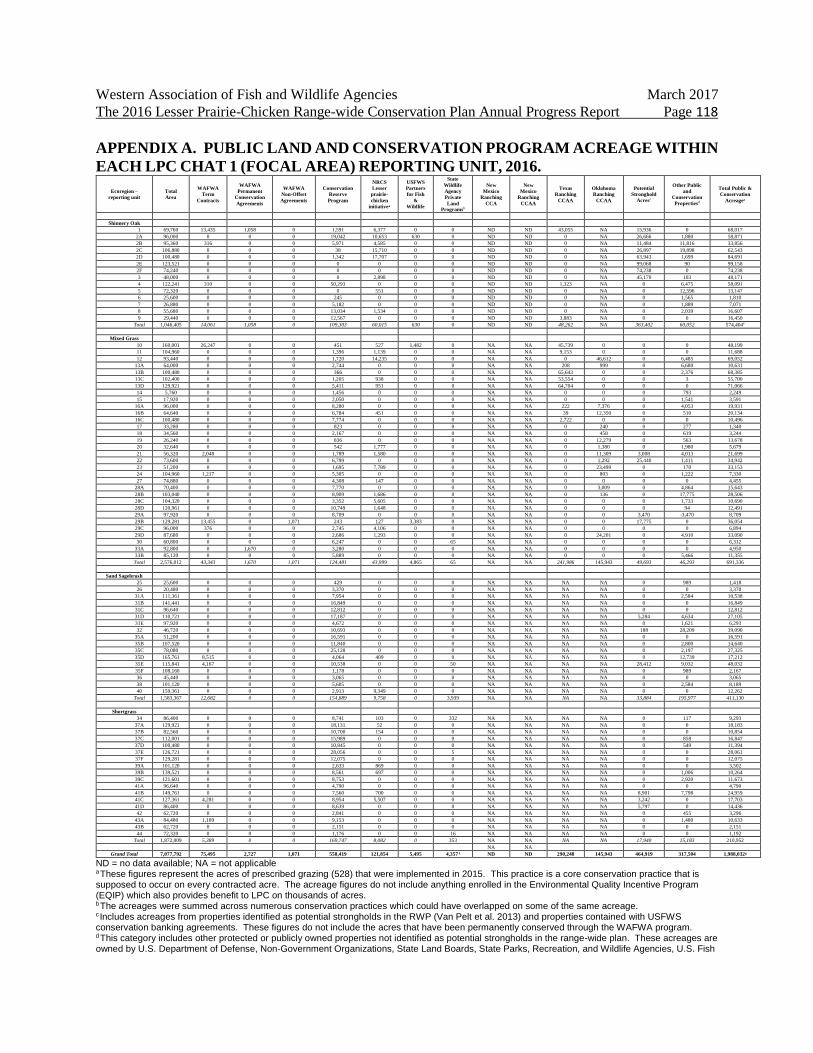
Western Association of Fish and Wildlife Agencies March 2017
The 2016 Lesser Prairie-Chicken Range-wide Conservation Plan Annual Progress Report Page 118
APPENDIX A. PUBLIC LAND AND CONSERVATION PROGRAM ACREAGE WITHIN
EACH LPC CHAT 1 (FOCAL AREA) REPORTING UNIT, 2016.
Ecoregion –
reporting unit
Total
Area
WAFWA
Term
Contracts
WAFWA
Permanent
Conservation
Agreements
WAFWA
Non-Offset
Agreements
Conservation
Reserve
Program
NRCS
Lesser
prairie-
chicken
initiativea
USFWS
Partners
for Fish
&
Wildlife
State
Wildlife
Agency
Private
Land
Programsb
New
Mexico
Ranching
CCA
New
Mexico
Ranching
CCAA
Texas
Ranching
CCAA
Oklahoma
Ranching
CCAA
Potential
Stronghold
Acresc
Other Public
and
Conservation
Propertiesd
Total Public &
Conservation
Acreagee
Shinnery Oak
1 69,760 13,435 1,058 0 1,591 6,377 0 0 ND ND 43,055 NA 15,936 0 68,017
2A 96,000 0 0 0 19,042 10,653 630 0 ND ND 0 NA 26,666 1,880 58,871
2B 95,360 316 0 0 5,971 4,585 0 0 ND ND 0 NA 11,484 11,816 33,856
2C 106,880 0 0 0 38 15,710 0 0 ND ND 0 NA 26,897 19,898 62,543
2D 100,480 0 0 0 1,342 17,707 0 0 ND ND 0 NA 63,943 1,699 84,691
2E 123,521 0 0 0 0 0 0 0 ND ND 0 NA 99,068 90 99,158
2F 74,240 0 0 0 0 0 0 0 ND ND 0 NA 74,238 0 74,238
3 48,000 0 0 0 0 2,898 0 0 ND ND 0 NA 45,170 103 48,171
4 122,241 310 0 0 50,293 0 0 0 ND ND 1,323 NA 0 6,475 58,091
5 72,320 0 0 0 0 551 0 0 ND ND 0 NA 0 12,596 13,147
6 25,600 0 0 0 245 0 0 0 ND ND 0 NA 0 1,565 1,810
7 26,880 0 0 0 5,182 0 0 0 ND ND 0 NA 0 1,889 7,071
8 55,680 0 0 0 13,034 1,534 0 0 ND ND 0 NA 0 2,039 16,607
9 29,440 0 0 0 12,567 0 0 0 ND ND 3,883 NA 0 0 16,450
Total 1,046,405 14,061 1,058 0 109,303 60,015 630 0 ND ND 48,262 NA 363,402 60,052 574,404e
Mixed Grass
10 160,001 26,247 0 0 451 527 1,482 0 NA NA 45,739 0 0 0 48,199
11 104,960 0 0 0 1,396 1,139 0 0 NA NA 9,153 0 0 0 11,688
12 93,440 0 0 0 1,720 14,235 0 0 NA NA 0 46,612 0 6,485 69,052
13A 64,000 0 0 0 2,744 0 0 0 NA NA 208 999 0 6,680 10,631
13B 100,480 0 0 0 366 0 0 0 NA NA 65,643 0 0 2,376 68,385
13C 102,400 0 0 0 1,205 938 0 0 NA NA 53,554 0 0 3 55,700
13D 129,921 0 0 0 5,411 951 0 0 NA NA 64,704 0 0 0 71,066
14 5,760 0 0 0 1,456 0 0 0 NA NA 0 0 0 793 2,249
15 17,920 0 0 0 2,050 0 0 0 NA NA 0 0 0 1,541 3,591
16A 96,000 0 0 0 8,280 0 0 0 NA NA 222 7,376 0 4,053 19,931
16B 64,640 0 0 0 6,784 451 0 0 NA NA 39 12,350 0 510 20,134
16C 100,480 0 0 0 7,774 0 0 0 NA NA 2,722 0 0 0 10,496
17 33,280 0 0 0 823 0 0 0 NA NA 0 240 0 277 1,340
18 34,560 0 0 0 2,167 0 0 0 NA NA 0 458 0 619 3,244
19 26,240 0 0 0 836 0 0 0 NA NA 0 12,279 0 563 13,678
20 32,640 0 0 0 542 1,777 0 0 NA NA 0 1,380 0 1,980 5,679
21 56,320 2,048 0 0 1,789 1,580 0 0 NA NA 0 11,309 3,008 4,013 21,699
22 73,600 0 0 0 6,799 0 0 0 NA NA 0 1,292 25,440 1,411 34,942
23 51,200 0 0 0 1,695 7,789 0 0 NA NA 0 23,499 0 170 33,153
24 104,960 1,217 0 0 5,305 0 0 0 NA NA 0 803 0 1,222 7,330
27 74,880 0 0 0 4,308 147 0 0 NA NA 0 0 0 0 4,455
28A 70,400 0 0 0 7,770 0 0 0 NA NA 0 3,009 0 4,864 15,643
28B 103,040 0 0 0 8,909 1,686 0 0 NA NA 0 136 0 17,775 28,506
28C 104,320 0 0 0 3,352 5,605 0 0 NA NA 0 0 0 1,733 10,690
28D 120,961 0 0 0 10,749 1,648 0 0 NA NA 0 0 0 94 12,491
29A 97,920 0 0 0 8,709 0 0 0 NA NA 0 0 3,470 -3,470 8,709
29B 129,281 13,455 0 1,071 243 127 3,383 0 NA NA 0 0 17,775 0 36,054
29C 96,000 376 0 0 2,745 4,106 0 0 NA NA 0 0 0 0 6,894
29D 87,680 0 0 0 2,686 1,293 0 0 NA NA 0 24,201 0 4,910 33,090
30 60,800 0 0 0 6,247 0 0 65 NA NA 0 0 0 0 6,312
33A 92,800 0 1,670 0 3,280 0 0 0 NA NA 0 0 0 0 4,950
33B 85,120 0 0 0 5,889 0 0 0 NA NA 0 0 0 5,466 11,355
Total 2,576,012 43,343 1,670 1,071 124,481 43,999 4,865 65 NA NA 241,986 145,943 49,693 46,293 691,336
Sand Sagebrush
25 25,600 0 0 0 429 0 0 0 NA NA NA NA 0 989 1,418
26 20,480 0 0 0 3,370 0 0 0 NA NA NA NA 0 0 3,370
31A 111,361 0 0 0 7,954 0 0 0 NA NA NA NA 0 2,584 10,538
31B 141,441 0 0 0 16,849 0 0 0 NA NA NA NA 0 0 16,849
31C 96,640 0 0 0 12,812 0 0 0 NA NA NA NA 0 0 12,812
31D 110,721 0 0 0 17,187 0 0 0 NA NA NA NA 5,284 4,634 27,105
31E 97,920 0 0 0 4,672 0 0 0 NA NA NA NA 0 1,621 6,293
32 46,720 0 0 0 10,693 0 0 0 NA NA NA NA 188 28,209 39,090
35A 51,200 0 0 0 16,591 0 0 0 NA NA NA NA 0 0 16,591
35B 107,520 0 0 0 11,840 0 0 0 NA NA NA NA 0 2,800 14,640
35C 78,080 0 0 0 25,128 0 0 0 NA NA NA NA 0 2,197 27,325
35D 165,761 8,515 0 0 4,064 409 0 0 NA NA NA NA 0 12,739 17,212
35E 115,841 4,167 0 0 10,538 0 0 50 NA NA NA NA 28,412 9,032 48,032
35F 108,160 0 0 0 1,178 0 0 0 NA NA NA NA 0 989 2,167
36 45,440 0 0 0 3,065 0 0 0 NA NA NA NA 0 0 3,065
38 101,120 0 0 0 5,605 0 0 0 NA NA NA NA 0 2,584 8,189
40 159,361 0 0 0 2,913 9,349 0 0 NA NA NA NA 0 0 12,262
Total 1,583,367 12,682 0 0 154,889 9,758 0 3,939 NA NA NA NA 33,884 195,977 411,130
Shortgrass
34 86,400 0 0 0 8,741 103 0 332 NA NA NA NA 0 117 9,293
37A 129,921 0 0 0 18,131 52 0 0 NA NA NA NA 0 0 18,183
37B 82,560 0 0 0 10,700 154 0 0 NA NA NA NA 0 0 10,854
37C 112,001 0 0 0 15,989 0 0 0 NA NA NA NA 0 858 16,847
37D 100,480 0 0 0 10,845 0 0 0 NA NA NA NA 0 549 11,394
37E 126,721 0 0 0 28,056 0 0 5 NA NA NA NA 0 0 28,061
37F 129,281 0 0 0 12,075 0 0 0 NA NA NA NA 0 0 12,075
39A 101,120 0 0 0 2,633 869 0 0 NA NA NA NA 0 0 3,502
39B 139,521 0 0 0 8,561 697 0 0 NA NA NA NA 0 1,006 10,264
39C 121,601 0 0 0 8,753 0 0 0 NA NA NA NA 0 2,920 11,673
41A 96,640 0 0 0 4,790 0 0 0 NA NA NA NA 0 0 4,790
41B 149,761 0 0 0 7,560 700 0 0 NA NA NA NA 8,901 7,798 24,959
41C 127,361 4,281 0 0 8,954 5,507 0 0 NA NA NA NA 3,242 0 17,703
41D 86,400 0 0 0 8,639 0 0 0 NA NA NA NA 5,797 0 14,436
42 62,720 0 0 0 2,841 0 0 0 NA NA NA NA 0 455 3,296
43A 84,480 1,109 0 0 9,153 0 0 0 NA NA NA NA 0 1,480 10,633
43B 62,720 0 0 0 2,151 0 0 0 NA NA NA NA 0 0 2,151
44 72,320 0 0 0 1,176 0 0 16 NA NA NA NA 0 0 1,192
Total 1,872,009 5,389 0 0 169,747 8,082 0 353 NA NA NA NA 17,940 15,183 210,952
NA NA
Grand Total 7,077,792 75,495 2,727 1,071 558,419 121,854 5,495 4,357 f ND ND 290,248 145,943 464,919 317,504 1,988,032g
ND = no data available; NA = not applicable a These figures represent the acres of prescribed grazing (528) that were implemented in 2015. This practice is a core conservation practice that is supposed to occur on every contracted acre. The acreage figures do not include anything enrolled in the Environmental Quality Incentive Program (EQIP) which also provides benefit to LPC on thousands of acres. b The acreages were summed across numerous conservation practices which could have overlapped on some of the same acreage. c Includes acreages from properties identified as potential strongholds in the RWP (Van Pelt et al. 2013) and properties contained with USFWS conservation banking agreements. These figures do not include the acres that have been permanently conserved through the WAFWA program. d This category includes other protected or publicly owned properties not identified as potential strongholds in the range-wide plan. These acreages are owned by U.S. Department of Defense, Non-Government Organizations, State Land Boards, State Parks, Recreation, and Wildlife Agencies, U.S. Fish

Western Association of Fish and Wildlife Agencies March 2017
The 2016 Lesser Prairie-Chicken Range-wide Conservation Plan Annual Progress Report Page 119
& Wildlife Service, U.S. Bureau of Land Management, U.S. Forest Service, Privately Owned Parks, U.S. National Park Service, Agricultural Research Service, U.S. Bureau of Reclamation, and City or County Government. The acreages also include privately owned sites contained within conservation easements. e The total does not equal the sum of the CHAT-specific acreages because some data were not reported at the finer scale. The total is also an underrepresentation because the 1,946,908 acres enrolled in the New Mexico CCA/CCAA were not reported to WAFWA at this scale. f There were an additional 36,374 acres reported for Texas and Oklahoma but not attributed to a specific CHAT category or reporting unit. g Some of the acreages overlap the same areas and no data were available for the EQIP or the New Mexico Ranching CCA/CCAA at this scale.

Western Association of Fish and Wildlife Agencies March 2017
The 2016 Lesser Prairie-Chicken Range-wide Conservation Plan Annual Progress Report Page 120
APPENDIX B. PUBLIC LAND AND CONSERVATION PROGRAM ACREAGE
WITHIN EACH LPC CHAT 2 (CONNECTIVITY ZONE) REPORTING UNIT, 2016.
Ecoregion –
reporting unit Total Area
WAFWA
Term
Contracts
WAFWA
Permanent
Conservation
Agreements
WAFWA
Non-Offset
Agreements
Conservation
Reserve
Program
NRCS
Lesser
prairie-
chicken
initiativea
USFWS
Partners
for Fish
&
Wildlife
State
Wildlife
Agency
Private
Land
Programsb
New
Mexico
Ranching
CCA
New
Mexico
Ranchin
g CCAA
Texas
Ranching
CCAA
Oklahoma
Ranching
CCAA
Potential
Stronghold
Acresc
Other Public
and
Conservation
Propertiesd
Total Public
&
Conservation
Acreagee
Shinnery Oak
100 148,481 0 391 0 15,225 0 0 ND ND ND 1,440 NA 0 26,183 43,239
101 20,480 0 0 0 0 0 0 ND ND ND 0 NA 0 8,132 8,132
102 64,000 0 0 0 18,239 1,146 0 ND ND ND 2,371 NA 0 840 22,596
103 33,280 0 0 0 10,172 0 0 ND ND ND 2,857 NA 0 0 13,029
104 599,043 0 0 0 74,801 7,862 0 ND ND ND 10,761 NA 0 56,681 150,105
105 27,520 0 0 0 13,328 0 0 ND ND ND 4 NA 0 0 13,332
Total 892,804 0 391 0 131,763 9,008 0 ND ND ND 17,433 NA 0 91,836 250,433e
Mixed Grass
106 49,920 538 0 0 0 0 0 ND NA NA 9,770 0 0 0 10,308
107 112,641 0 0 0 2,592 0 0 ND NA NA 1,287 0 0 0 3,879
108 42,240 0 0 0 1,374 81 0 ND NA NA 0 3,571 0 405 5,431
109 119,681 0 0 0 6,836 3,356 0 ND NA NA 10,013 4,984 0 809 25,998
110 72,320 0 0 0 3,527 11 0 ND NA NA 11,986 0 0 0 15,524
111 99,840 0 0 0 8,152 137 0 ND NA NA 0 17,734 0 2,916 28,939
112 13,440 0 0 0 1,003 0 0 ND NA NA 0 477 0 0 1,480
113 19,840 0 0 0 957 0 0 ND NA NA 0 0 0 40 997
114 37,760 0 0 0 715 0 0 ND NA NA 0 0 0 2,101 2,816
115 12,160 0 0 0 734 0 0 ND NA NA 0 544 0 526 1,804
116 12,800 0 0 0 511 0 0 ND NA NA 0 0 0 225 736
117 22,400 0 0 0 2,229 0 0 ND NA NA 0 242 0 2,104 4,575
118 29,440 0 0 0 2,808 0 0 ND NA NA 0 0 0 2,121 4,929
119 12,800 0 0 0 0 1,076 0 ND NA NA 0 8,017 0 531 9,624
120 18,560 0 0 0 484 0 0 ND NA NA 0 2,280 71 1,062 3,897
121 55,680 0 0 0 4,517 92 0 ND NA NA 0 2,171 0 1,710 8,490
122 14,720 0 0 0 2,780 0 0 ND NA NA 0 0 0 1,967 4,747
123 99,200 0 0 0 7,986 453 0 ND NA NA 0 596 0 492 9,527
126 69,120 0 0 0 1,884 0 0 ND NA NA 0 0 0 0 1,884
128 30,080 0 0 0 3,587 160 0 ND NA NA 0 0 0 0 3,747
130 34,560 0 0 0 2,421 0 0 ND NA NA 0 0 0 0 2,421
132 35,200 0 0 0 4,399 0 0 ND NA NA 0 0 0 0 4,399
133 64,640 0 0 0 1,212 0 0 ND NA NA 0 0 0 1,269 2,481
134 37,120 0 0 0 4,756 0 0 ND NA NA 0 0 0 0 4,756
Total 1,116,165 538 0 0 65,464 5,366 0 ND NA NA 33,055 40,616 0 18,279 163,318
Sand Sagebrush
124 5,120 0 0 0 0 0 0 ND NA NA 0 NA 0 456 456
125 3,200 0 0 0 0 0 0 ND NA NA 0 NA 0 113 113
127 1,920 0 0 0 0 0 0 ND NA NA 0 NA 0 552 552
129 14,720 0 0 0 1,943 0 0 ND NA NA 0 NA 0 6,728 8,671
131 23,680 0 0 0 5,010 0 0 ND NA NA 0 NA 0 206 5,216
135 29,440 0 0 0 2,695 0 0 ND NA NA 0 NA 0 0 2,695
136 53,120 0 0 0 6,096 0 0 ND NA NA 0 NA 0 0 6,096
138 14,080 0 0 0 98 0 0 ND NA NA 0 NA 0 1,219 1,317
139 15,360 0 0 0 276 0 0 ND NA NA 0 NA 0 642 918
140 23,040 0 0 0 620 0 0 ND NA NA 0 NA 0 639 1,259
142 61,440 0 0 0 3,176 0 0 ND NA NA 0 NA 0 3,125 6,301
Total 245,121 0 0 0 19,915 0 0 ND NA NA 0 NA 0 13,679 33,594
Shortgrass
137 32,640 0 0 0 2,373 0 0 ND NA NA 0 NA 0 0 2,373
141 52,480 0 0 0 6,153 0 0 ND NA NA 0 NA 0 0 6,153
143 26,240 0 0 0 317 0 0 ND NA NA 0 NA 0 0 317
144 46,720 4,024 0 0 1,557 0 0 ND NA NA 0 NA 0 0 5,581
145 25,600 0 0 0 908 0 0 80 NA NA 0 NA 0 0 988
Total 183,681 4,024 0 0 11,308 0 0 80 NA NA 0 NA 0 0 15,412
Grand Total 2,437,771 4,562 391 0 228,450 14,375 0 80f ND ND 50,489 40,616 71 123,794 462,757g
ND = no data provided; NA = not applicable a These figures represent the acres of prescribed grazing (528) that were implemented in 2015. This practice is a core conservation practice that is supposed to occur on every contracted acre. The acreage figures do not include anything enrolled in the Environmental Quality Incentive Program (EQIP) which also provides benefit to LPC on thousands of acres. b The acreages were summed across numerous conservation practices which could have overlapped on some of the same acreage. c Includes acreages from properties identified as potential strongholds in the RWP (Van Pelt et al. 2013) and properties contained with USFWS conservation banking agreements. These figures do not include the acres that have been permanently conserved through the WAFWA program. d This category includes other protected or publicly owned properties not identified as potential strongholds in the range-wide plan. These acreages are owned by U.S. Department of Defense, Non-Government Organizations, State Land Boards, State Parks, Recreation, and Wildlife Agencies, U.S. Fish & Wildlife Service, U.S. Bureau of Land Management, U.S. Forest Service, Privately Owned Parks, U.S. National Park Service, Agricultural Research Service, U.S. Bureau of Reclamation, and City or County Government. The acreages also include privately owned sites contained within conservation easements. e The total does not equal the sum of the CHAT-specific acreages because some data were not reported at the finer scale. The total is also an underrepresentation because the 1,946,908 acres enrolled in the New Mexico CCA/CCAA were not reported to WAFWA at this scale. f There were an additional 36,374 acres reported for Texas and Oklahoma but not attributed to a specific CHAT category or reporting unit. g Some of the acreages overlap the same areas and no data were available for the EQIP or the New Mexico Ranching CCA/CCAA at this scale.

Western Association of Fish and Wildlife Agencies March 2017
The 2016 Lesser Prairie-Chicken Range-wide Conservation Plan Annual Progress Report Page 121
APPENDIX C. ANNUAL CROPLAND RESTORATION AND REMEDIATION
ACREAGE ACCOMPLISHMENTS AND LONG-TERM GOALS WITHIN EACH LPC
CHAT 1 (FOCAL AREA) REPORTING UNIT, 2016.
Ecoregion– reporting unit
Total Area
WAFWA Cropland
Restoration
FSA Cropland
Restoration
NRCS Cropland
Restorationa
USFWS Cropland
Restoration
State Wildlife Agency
Cropland Restoration
Total Annual Cropland
Restoration
Annual Cropland
Restoration Goal
Total Annual Impact
Remediationb
Annual Impact
Remediation Goal
Shinnery Oak
1 69,760 0 ND ND 0 0 0 0 696 0
2A 96,000 0 ND ND 0 0 0 97 -86 0
2B 95,360 0 ND ND 0 0 0 0 -21 0
2C 106,880 0 ND ND 0 0 0 0 235 0
2D 100,480 0 ND ND 0 0 0 0 1,796 0
2E 123,521 0 ND ND 0 0 0 0 7,269 0
2F 74,240 0 ND ND 0 0 0 0 114 0
3 48,000 0 ND ND 0 0 0 0 122 0
4 122,241 310 ND ND 0 0 310 2,639 -11 0
5 72,320 0 ND ND 0 0 0 0 -70 0
6 25,600 0 ND ND 0 0 0 4 217 0
7 26,880 0 ND ND 0 0 0 216 -32 0
8 55,680 0 ND ND 0 0 0 589 -256 0
9 29,440 0 ND ND 0 0 0 0 -90 0
Total 1,046,405 310 ND ND 0 0 310 3,545 9,883 0
Mixed Grass
10 160,001 0 ND ND 0 0 0 703 665 382
11 104,960 0 ND ND 0 0 0 0 1,413 0
12 93,440 0 ND ND 0 0 0 0 176 0
13A 64,000 0 ND ND 0 0 0 282 233 0
13B 100,480 0 ND ND 0 0 0 0 154 0
13C 102,400 0 ND ND 0 0 0 0 -167 0
13D 129,921 0 ND ND 0 0 0 0 116 0
14 5,760 0 ND ND 0 0 0 69 -2 58
15 17,920 0 ND ND 0 0 0 287 -14 0
16A 96,000 0 ND ND 0 0 0 482 332.9 0
16B 64,640 0 ND ND 0 0 0 228 333.2 0
16C 100,480 0 ND ND 0 0 0 1,343 260.1 8
17 33,280 0 ND ND 0 0 0 0 1,911 0
18 34,560 0 ND ND 0 0 0 0 155 0
19 26,240 0 ND ND 0 0 0 0 60 0
20 32,640 0 ND ND 0 0 0 0 23 0
21 56,320 0 ND ND 0 0 0 0 760 0
22 73,600 0 ND ND 0 0 0 0 -415 0
23 51,200 0 ND ND 0 0 0 0 186 0
24 104,960 0 ND ND 0 0 0 0 247 0
27 74,880 0 ND ND 0 0 0 0 75 0
28A 70,400 0 ND ND 0 0 0 1,219 453 0
28B 103,040 0 ND ND 0 0 0 0 115 0
28C 104,320 0 ND ND 0 0 0 0 -1,783 0
28D 120,961 0 ND ND 0 0 0 0 721 0
29A 97,920 0 ND ND 0 0 0 0 949 0
29B 129,281 0 ND ND 0 0 0 0 1,341 0
29C 96,000 0 ND ND 0 0 0 0 370 0
29D 87,680 0 ND ND 0 0 0 0 50 0
30 60,800 0 ND ND 0 0 0 2,341 -264 0
33A 92,800 0 ND ND 0 0 0 472 325 0
33B 85,120 0 ND ND 0 0 0 1,403 894 0
Total 2,576,012 0 ND ND 0 0 0 8,830 9,889 447
Sand Sagebrush
25 25,600 0 ND ND 0 0 0 0 -82 0
26 20,480 0 ND ND 0 0 0 326 0 0
31A 111,361 0 ND ND 0 0 0 0 -116 0
31B 141,441 0 ND ND 0 0 0 1,757 574 0
31C 96,640 0 ND ND 0 0 0 3,245 887 478
31D 110,721 0 ND ND 0 0 0 2,941 2,063 558
31E 97,920 0 ND ND 0 0 0 2,576 1,314 160
32 46,720 0 ND ND 0 0 0 3,209 -57 0
35A 51,200 0 ND ND 0 0 0 147 1,907 0
35B 107,520 0 ND ND 0 0 0 2,321 4,127 0
35C 78,080 0 ND ND 0 0 0 2,456 -38 0
35D 165,761 0 ND ND 0 0 0 0 823 0
35E 115,841 0 ND ND 0 50 50 5,758 2,705 280
35F 108,160 0 ND ND 0 0 0 4,619 2,244 279
36 45,440 0 ND ND 0 0 0 0 -87 0
38 101,120 0 ND ND 0 0 0 0 -278 0
40 159,361 0 ND ND 0 0 0 0 -30 0
Total 1,583,367 0 ND ND 0 2,319c 2,319c 43,617 15,955 2,202
Shortgrass
34 86,400 0 ND ND 0 0 0 1,734 1,326 0
37A 129,921 0 ND ND 0 0 0 3,278 937 0
37B 82,560 0 ND ND 0 0 0 827 -25 0
37C 112,001 0 ND ND 0 0 0 1,325 0 0
37D 100,480 0 ND ND 0 0 0 4,756 0 0
37E 126,721 0 ND ND 0 0 0 3,409 69 0
37F 129,281 0 ND ND 0 0 0 1,990 779 0
39A 101,120 0 ND ND 0 0 0 2,518 105 0
39B 139,521 0 ND ND 0 0 0 3,944 -1,238 0
39C 121,601 0 ND ND 0 0 0 2,111 203 0
41A 96,640 0 ND ND 0 0 0 511 0 0
41B 149,761 0 ND ND 0 0 0 1,432 -690 0
41C 127,361 242 ND ND 0 0 242 739 -99 0

Western Association of Fish and Wildlife Agencies March 2017
The 2016 Lesser Prairie-Chicken Range-wide Conservation Plan Annual Progress Report Page 122
41D 86,400 0 ND ND 0 0 0 677 189 0
42 62,720 0 ND ND 0 0 0 1,571 29 0
43A 84,480 0 ND ND 0 0 0 0 56 0
43B 62,720 0 ND ND 0 0 0 0 0 0
44 72,320 0 ND ND 0 0 0 1,201 251 0
Total 1,872,009 242 ND ND 0 0 242 32,022 1,890 0
Grand Total 7,077,792 552 ND ND 0 2,319c 2,871d 88,014 37,618 2,649
ND = no data provided; NA = not available a Summarizes acres of the range planting practice (550) applied through the Lesser Prairie-Chicken Initiative. The acreage figures do not include any range planting applied through the Environmental Quality Incentives Program (EQIP). b These figures are the estimated annual change in impact acres estimated by WAFWA using numerous spatial layers. The methods are further explain in the text along with some known issues that affect the accuracy of these estimates. c The total does not equal the sum of the unit-specific acreages because some data were not reported at the finer scale. d The total is an underrepresentation of the annual range planting that occurred. Most of the cropland that is converted to grass is accomplished through the CRP and those data were not provided by FSA.

Western Association of Fish and Wildlife Agencies March 2017
The 2016 Lesser Prairie-Chicken Range-wide Conservation Plan Annual Progress Report Page 123
APPENDIX D. ANNUAL CROPLAND RESTORATION AND REMEDIATION
ACREAGE ACCOMPLISHMENTS AND LONG-TERM GOALS WITHIN EACH LPC
CHAT 2 (CONNECTIVITY ZONE) REPORTING UNIT, 2016.
Ecoregion – reporting unit
Total Area
WAFWA Cropland
Restoration
FSA Cropland
Restoration
NRCS Cropland
Restorationa
USFWS Cropland
Restoration
State Wildlife Agency
Cropland Restoration
Total Annual Cropland
Restoration
Annual Cropland
Restoration Goal
Total Annual Impact
Remediation
Annual Impact
Remediation Goal
Shinnery Oak
100 148,481 0 ND ND 0 0 0 0 -8 0
101 20,480 0 ND ND 0 0 0 0 176 0
102 64,000 0 ND ND 0 0 0 74 -1 0
103 33,280 0 ND ND 0 0 0 205 -0.5 0
104 599,043 0 ND ND 0 0 0 0 -2,455 0
105 27,520 0 ND ND 0 0 0 0 -32 0
Total 892,804 0 ND ND 0 0 0 279 -2,319 0
Mixed Grass
106 49,920 0 ND ND 0 0 0 135 27 133
107 112,641 0 ND ND 0 0 0 0 367 0
108 42,240 0 ND ND 0 0 0 0 103 0
109 119,681 0 ND ND 0 0 0 0 -851 0
110 72,320 0 ND ND 0 0 0 0 564 0
111 99,840 0 ND ND 0 0 0 0 -2,882 0
112 13,440 0 ND ND 0 0 0 0 109 0
113 19,840 0 ND ND 0 0 0 0 54 0
114 37,760 0 ND ND 0 0 0 0 299 0
115 12,160 0 ND ND 0 0 0 0 1,366 0
116 12,800 0 ND ND 0 0 0 0 85 0
117 22,400 0 ND ND 0 0 0 0 265 0
118 29,440 0 ND ND 0 0 0 0 336 0
119 12,800 0 ND ND 0 0 0 0 27 0
120 18,560 0 ND ND 0 0 0 0 153 0
121 55,680 0 ND ND 0 0 0 0 448 0
122 14,720 0 ND ND 0 0 0 0 112 0
123 99,200 0 ND ND 0 0 0 0 302 0
126 69,120 0 ND ND 0 0 0 0 141 0
128 30,080 0 ND ND 0 0 0 0 25 0
130 34,560 0 ND ND 0 0 0 0 111 0
132 35,200 0 ND ND 0 0 0 62 187 0
133 64,640 0 ND ND 0 0 0 0 -858 0
134 37,120 0 ND ND 0 0 0 709 98 0
Total 1,116,165 0 ND ND 0 0 0 906 587 133
Sand Sagebrush
124 5,120 0 ND ND 0 0 0 25 -4 0
125 3,200 0 ND ND 0 0 0 0 0 0
127 1,920 0 ND ND 0 0 0 0 -28 0
129 14,720 0 ND ND 0 0 0 0 -165 0
131 23,680 0 ND ND 0 0 0 120 0 0
135 29,440 0 ND ND 0 0 0 1,071 1,511 0
136 53,120 0 ND ND 0 0 0 1,775 0 0
138 14,080 0 ND ND 0 0 0 0 1,071 0
139 15,360 0 ND ND 0 0 0 0 161 0
140 23,040 0 ND ND 0 0 0 0 -83 0
142 61,440 0 ND ND 0 0 0 0 0 0
Total 245,121 0 ND ND 0 0 0 2,991 2,463 0
Shortgrass
137 32,640 0 ND ND 0 0 0 614 68 0
141 52,480 0 ND ND 0 0 0 0 -31 0
143 26,240 0 ND ND 0 0 0 495 61 0
144 46,720 0 ND ND 0 0 0 0 -14 0
145 25,600 0 ND ND 0 0 0 393 -49 0
Total 183,681 0 ND ND 0 0 0 1,502 36 0
ND ND
Grand Total 2,437,771 0 ND ND 0 0 0c 5,678 766 133
ND = no data provided; NA = not available a Summarizes acres of the range planting practice (550) applied through the Lesser Prairie-Chicken Initiative. The acreage figures do not include any range planting applied through the Environmental Quality Incentives Program (EQIP). b These figures are the estimated annual change in impact acres estimated by WAFWA using numerous spatial layers. The methods are further explain in the text along with some known issues that affect the accuracy of these estimates. c The total is an underrepresentation of the range planting that occurred. Most of the cropland that is converted to grass is accomplished through the CRP and those data were not provided by FSA.

Western Association of Fish and Wildlife Agencies March 2017
The 2016 Lesser Prairie-Chicken Range-wide Conservation Plan Annual Progress Report Page 124
APPENDIX E. FOCAL AREA REPORTING UNITS SORTED BY PERCENT IMPACT AS OF
JAN. 1, 2016.
FACZ Unit Acres
FACZ
Class Ecoregions 2015 % 2016 %
2017 %
14 5760.03 Focal Area Mixed grass Prairie 39.45% 39.08% 39.12%
31C 96640.44 Focal Area Sand Sagebrush Prairie 34.65% 34.18% 33.27%
35F 108160.50 Focal Area Sand Sagebrush Prairie 32.00% 34.36% 32.28%
11 104960.48 Focal Area Mixed grass Prairie 30.71% 33.38% 32.03%
31D 110720.51 Focal Area Sand Sagebrush Prairie 33.51% 33.21% 31.34%
35E 115840.53 Focal Area Sand Sagebrush Prairie 31.78% 32.02% 29.68%
31E 97920.45 Focal Area Sand Sagebrush Prairie 30.74% 30.74% 29.40%
10 160000.73 Focal Area Mixed grass Prairie 29.24% 29.02% 28.61%
15 17920.08 Focal Area Mixed grass Prairie 28.84% 28.01% 28.09%
13A 64000.29 Focal Area Mixed grass Prairie 27.73% 28.32% 27.96%
13D 129920.60 Focal Area Mixed grass Prairie 24.10% 25.20% 25.11%
4 122240.56 Focal Area Shinnery Oak Prairie 24.79% 24.76% 24.77%
18 34560.16 Focal Area Mixed grass Prairie 25.50% 25.00% 24.55%
13C 102400.47 Focal Area Mixed grass Prairie 23.27% 23.77% 23.94%
30 60800.28 Focal Area Mixed grass Prairie 23.19% 23.19% 23.62%
8 55680.26 Focal Area Shinnery Oak Prairie 22.98% 22.96% 23.42%
31B 141440.65 Focal Area Sand Sagebrush Prairie 22.83% 22.66% 22.25%
16C 100480.46 Focal Area Mixed grass Prairie 22.40% 22.32% 22.06%
16A 96000.44 Focal Area Mixed grass Prairie 21.51% 21.28% 20.93%
7 26880.12 Focal Area Shinnery Oak Prairie 20.54% 20.34% 20.46%
16B 64640.30 Focal Area Mixed grass Prairie 20.85% 20.81% 20.29%
39C 121600.56 Focal Area Shortgrass Prairie 20.52% 20.42% 20.25%
37A 129920.60 Focal Area Shortgrass Prairie 19.43% 20.39% 19.67%
2D 100480.46 Focal Area Shinnery Oak Prairie 19.75% 21.42% 19.63%
35B 107520.49 Focal Area Sand Sagebrush Prairie 23.42% 23.43% 19.59%
32 46720.21 Focal Area Sand Sagebrush Prairie 18.58% 18.58% 18.70%
13B 100480.46 Focal Area Mixed grass Prairie 18.49% 18.80% 18.64%
20 32640.15 Focal Area Mixed grass Prairie 19.14% 18.96% 18.23%
37F 129280.59 Focal Area Shortgrass Prairie 18.33% 18.71% 18.11%
17 33280.15 Focal Area Mixed grass Prairie 23.50% 23.56% 17.82%
23 51200.24 Focal Area Mixed grass Prairie 19.96% 17.81% 17.44%
22 73600.34 Focal Area Mixed grass Prairie 16.41% 16.59% 17.15%
2A 96000.44 Focal Area Shinnery Oak Prairie 15.90% 15.91% 16.00%
28A 70400.32 Focal Area Mixed grass Prairie 16.20% 16.35% 15.71%
2B 95360.44 Focal Area Shinnery Oak Prairie 15.72% 15.65% 15.68%
1 69760.32 Focal Area Shinnery Oak Prairie 16.77% 16.65% 15.66%
42 62720.29 Focal Area Shortgrass Prairie 15.68% 15.69% 15.64%

Western Association of Fish and Wildlife Agencies March 2017
The 2016 Lesser Prairie-Chicken Range-wide Conservation Plan Annual Progress Report Page 125
34 86400.40 Focal Area Shortgrass Prairie 15.45% 17.04% 15.51%
39B 139520.64 Focal Area Shortgrass Prairie 13.38% 13.35% 14.24%
21 56320.26 Focal Area Mixed grass Prairie 15.54% 15.55% 14.20%
31A 111360.51 Focal Area Sand Sagebrush Prairie 14.06% 14.06% 14.16%
35D 165760.76 Focal Area Sand Sagebrush Prairie 13.57% 13.91% 13.41%
6 25600.12 Focal Area Shinnery Oak Prairie 14.16% 14.16% 13.31%
39A 101120.46 Focal Area Shortgrass Prairie 13.29% 13.27% 13.16%
44 72320.33 Focal Area Shortgrass Prairie 13.29% 13.27% 12.92%
26 20480.09 Focal Area Sand Sagebrush Prairie 12.71% 12.67% 12.67%
28D 120960.55 Focal Area Mixed grass Prairie 12.68% 13.18% 12.58%
33A 92800.43 Focal Area Mixed grass Prairie 12.80% 12.75% 12.40%
12 93440.43 Focal Area Mixed grass Prairie 12.41% 12.37% 12.18%
29A 97920.45 Focal Area Mixed grass Prairie 13.21% 13.08% 12.11%
2C 106880.49 Focal Area Shinnery Oak Prairie 12.35% 12.24% 12.02%
33B 85120.39 Focal Area Mixed grass Prairie 12.32% 12.92% 11.87%
35C 78080.36 Focal Area Sand Sagebrush Prairie 11.27% 11.25% 11.30%
41D 86400.40 Focal Area Shortgrass Prairie 11.17% 11.24% 11.02%
29B 129280.59 Focal Area Mixed grass Prairie 11.18% 11.70% 10.67%
41C 127360.58 Focal Area Shortgrass Prairie 10.45% 10.52% 10.60%
28C 104320.48 Focal Area Mixed grass Prairie 9.05% 8.86% 10.57%
37C 112000.51 Focal Area Shortgrass Prairie 10.43% 10.43% 10.43%
41B 150400.69 Focal Area Shortgrass Prairie 9.83% 9.79% 10.25%
25 25600.12 Focal Area Sand Sagebrush Prairie 9.89% 9.85% 10.17%
29D 87680.40 Focal Area Mixed grass Prairie 10.01% 10.12% 10.07%
28B 103040.47 Focal Area Mixed grass Prairie 10.24% 10.02% 9.91%
24 104960.48 Focal Area Mixed grass Prairie 10.22% 10.08% 9.85%
43A 84480.39 Focal Area Shortgrass Prairie 10.10% 9.89% 9.82%
35A 51200.24 Focal Area Sand Sagebrush Prairie 13.61% 13.49% 9.76%
29C 96000.44 Focal Area Mixed grass Prairie 9.49% 9.73% 9.34%
40 159360.73 Focal Area Sand Sagebrush Prairie 9.32% 9.32% 9.34%
36 45440.21 Focal Area Sand Sagebrush Prairie 8.55% 8.55% 8.74%
37E 126720.58 Focal Area Shortgrass Prairie 8.66% 8.65% 8.60%
19 26240.12 Focal Area Mixed grass Prairie 8.11% 8.10% 7.87%
3 48000.22 Focal Area Shinnery Oak Prairie 8.08% 8.08% 7.82%
38 101120.46 Focal Area Sand Sagebrush Prairie 7.36% 7.36% 7.63%
2E 123520.57 Focal Area Shinnery Oak Prairie 11.27% 13.47% 7.59%
41A 96640.44 Focal Area Shortgrass Prairie 7.57% 7.55% 7.55%
27 74880.34 Focal Area Mixed grass Prairie 7.76% 7.55% 7.45%
37B 82560.38 Focal Area Shortgrass Prairie 7.33% 7.25% 7.28%
37D 100480.46 Focal Area Shortgrass Prairie 6.99% 6.76% 6.76%
9 29440.14 Focal Area Shinnery Oak Prairie 5.25% 5.22% 5.52%

Western Association of Fish and Wildlife Agencies March 2017
The 2016 Lesser Prairie-Chicken Range-wide Conservation Plan Annual Progress Report Page 126
2F 74240.34 Focal Area Shinnery Oak Prairie 5.37% 5.32% 5.17%
43B 62720.29 Focal Area Shortgrass Prairie 4.41% 4.40% 4.40%
5 72320.33 Focal Area Shinnery Oak Prairie 3.63% 3.63% 3.72%
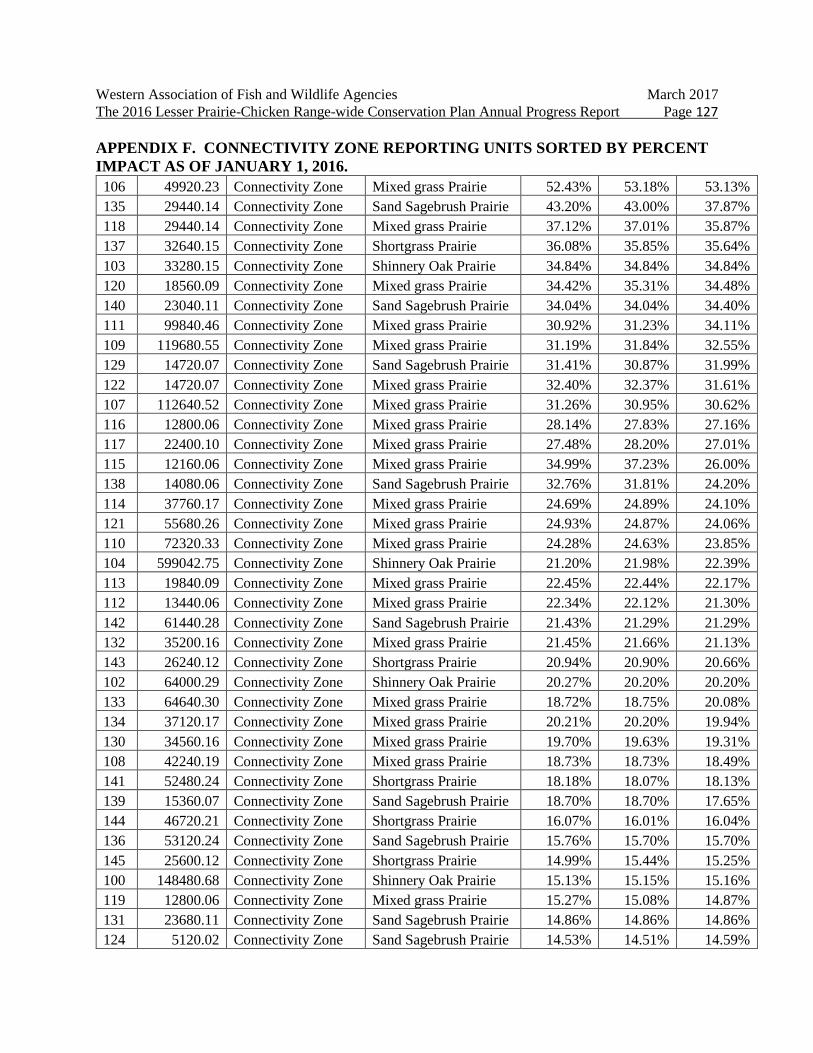
Western Association of Fish and Wildlife Agencies March 2017
The 2016 Lesser Prairie-Chicken Range-wide Conservation Plan Annual Progress Report Page 127
APPENDIX F. CONNECTIVITY ZONE REPORTING UNITS SORTED BY PERCENT
IMPACT AS OF JANUARY 1, 2016.
106 49920.23 Connectivity Zone Mixed grass Prairie 52.43% 53.18% 53.13%
135 29440.14 Connectivity Zone Sand Sagebrush Prairie 43.20% 43.00% 37.87%
118 29440.14 Connectivity Zone Mixed grass Prairie 37.12% 37.01% 35.87%
137 32640.15 Connectivity Zone Shortgrass Prairie 36.08% 35.85% 35.64%
103 33280.15 Connectivity Zone Shinnery Oak Prairie 34.84% 34.84% 34.84%
120 18560.09 Connectivity Zone Mixed grass Prairie 34.42% 35.31% 34.48%
140 23040.11 Connectivity Zone Sand Sagebrush Prairie 34.04% 34.04% 34.40%
111 99840.46 Connectivity Zone Mixed grass Prairie 30.92% 31.23% 34.11%
109 119680.55 Connectivity Zone Mixed grass Prairie 31.19% 31.84% 32.55%
129 14720.07 Connectivity Zone Sand Sagebrush Prairie 31.41% 30.87% 31.99%
122 14720.07 Connectivity Zone Mixed grass Prairie 32.40% 32.37% 31.61%
107 112640.52 Connectivity Zone Mixed grass Prairie 31.26% 30.95% 30.62%
116 12800.06 Connectivity Zone Mixed grass Prairie 28.14% 27.83% 27.16%
117 22400.10 Connectivity Zone Mixed grass Prairie 27.48% 28.20% 27.01%
115 12160.06 Connectivity Zone Mixed grass Prairie 34.99% 37.23% 26.00%
138 14080.06 Connectivity Zone Sand Sagebrush Prairie 32.76% 31.81% 24.20%
114 37760.17 Connectivity Zone Mixed grass Prairie 24.69% 24.89% 24.10%
121 55680.26 Connectivity Zone Mixed grass Prairie 24.93% 24.87% 24.06%
110 72320.33 Connectivity Zone Mixed grass Prairie 24.28% 24.63% 23.85%
104 599042.75 Connectivity Zone Shinnery Oak Prairie 21.20% 21.98% 22.39%
113 19840.09 Connectivity Zone Mixed grass Prairie 22.45% 22.44% 22.17%
112 13440.06 Connectivity Zone Mixed grass Prairie 22.34% 22.12% 21.30%
142 61440.28 Connectivity Zone Sand Sagebrush Prairie 21.43% 21.29% 21.29%
132 35200.16 Connectivity Zone Mixed grass Prairie 21.45% 21.66% 21.13%
143 26240.12 Connectivity Zone Shortgrass Prairie 20.94% 20.90% 20.66%
102 64000.29 Connectivity Zone Shinnery Oak Prairie 20.27% 20.20% 20.20%
133 64640.30 Connectivity Zone Mixed grass Prairie 18.72% 18.75% 20.08%
134 37120.17 Connectivity Zone Mixed grass Prairie 20.21% 20.20% 19.94%
130 34560.16 Connectivity Zone Mixed grass Prairie 19.70% 19.63% 19.31%
108 42240.19 Connectivity Zone Mixed grass Prairie 18.73% 18.73% 18.49%
141 52480.24 Connectivity Zone Shortgrass Prairie 18.18% 18.07% 18.13%
139 15360.07 Connectivity Zone Sand Sagebrush Prairie 18.70% 18.70% 17.65%
144 46720.21 Connectivity Zone Shortgrass Prairie 16.07% 16.01% 16.04%
136 53120.24 Connectivity Zone Sand Sagebrush Prairie 15.76% 15.70% 15.70%
145 25600.12 Connectivity Zone Shortgrass Prairie 14.99% 15.44% 15.25%
100 148480.68 Connectivity Zone Shinnery Oak Prairie 15.13% 15.15% 15.16%
119 12800.06 Connectivity Zone Mixed grass Prairie 15.27% 15.08% 14.87%
131 23680.11 Connectivity Zone Sand Sagebrush Prairie 14.86% 14.86% 14.86%
124 5120.02 Connectivity Zone Sand Sagebrush Prairie 14.53% 14.51% 14.59%

Western Association of Fish and Wildlife Agencies March 2017
The 2016 Lesser Prairie-Chicken Range-wide Conservation Plan Annual Progress Report Page 128
126 69120.32 Connectivity Zone Mixed grass Prairie 14.50% 14.38% 14.17%
123 99200.46 Connectivity Zone Mixed grass Prairie 14.40% 14.27% 13.97%
128 30080.14 Connectivity Zone Mixed grass Prairie 8.93% 8.93% 8.85%
125 3200.01 Connectivity Zone Sand Sagebrush Prairie 7.14% 7.14% 7.14%
105 27520.13 Connectivity Zone Shinnery Oak Prairie 5.87% 5.87% 5.98%
101 20480.09 Connectivity Zone Shinnery Oak Prairie 3.68% 4.54% 3.68%
127 1920.01 Connectivity Zone Sand Sagebrush Prairie 1.63% 1.62% 3.08%

Western Association of Fish and Wildlife Agencies March 2017
The 2016 Lesser Prairie-Chicken Range-wide Conservation Plan Annual Progress Report Page 129
APPENDIX G. LESSER PRAIRIE-CHICKEN ADVISORY COMMITTEE ANNUAL
REPORT AND RWP COMMITTEE INFORMATION
Date: March 31, 2017
To: Western Association of Fish and Wildlife Agencies – Lesser Prairie Chicken
Initiative Council
From: The Lesser Prairie Chicken Advisory Council
Subject: 2016 LPCAC Annual Report
Summary
The Lesser Prairie-Chicken Range-wide Conservation Plan (“RWP”) is the culmination
of an unprecedented collaboration between the United States Fish and Wildlife Service (“FWS”),
the Western Association of Fish and Wildlife Agencies (“WAFWA”), wildlife agencies in each
of the five states in the range of the lesser prairie chicken, conservation groups, property owners
and industry members.
WAFWA is responsible for the administration of the RWP. The WAFWA Board of
Directors established the lesser prairie chicken initiative council (“LPCIC”). Directors of the
state wildlife agencies within the LPC range comprise the LPCIC along with members of the
Executive Committee.
In accordance with the RWP, the LPCIC established an Advisory Committee
(“LPCAC”), Fee Structure Sub-committee (“FSSC”), Science Sub-committee (“SSC”) and
Interstate Working Group (“IWG”). The LPCAC and IWG are advisory in nature and provide
recommendations to the LPCIC for final approval. The LPCAC serves to inform and support the
RWP, to promote effective communication between the parties, resolve disputes, revise cost
structures and make adaptive management recommendations for consideration and/or approval
by the LPCIC. The LPCAC is supported by the FSSC and SSC.
With this report, the annual reporting period for the LPCAC is changing from April 1 to
March 31 to a calendar year basis. Consequently, certain items reported in the LPCAC 2015-
2016 annual report may reappear in this report. In addition, first quarter 2017 meetings will now
be reported in the 2017 annual report. During the period January 2016 to December 2016, the
LPCAC convened by telephone on three occasions. This report summarizes the activities of the
LPCAC over the calendar-year reporting period.
Lesser Prairie Chicken Advisory Council Composition
The LPCAC is composed of 17 representatives, including:

Western Association of Fish and Wildlife Agencies March 2017
The 2016 Lesser Prairie-Chicken Range-wide Conservation Plan Annual Progress Report Page 130
One representative from three of the five state wildlife agencies, serving on a rotating
schedule;
One representative from each of the two primary federal agencies closely involved with
LPC conservation (FWS and the Natural Resources Conservation Service, “NRCS”);
Three representatives from industry organizations (e.g., oil and gas, wind, transmission,
etc.);
Three representatives from agricultural and landowner organizations (e.g., Cattleman’s
Association, Corn Growers Farm Bureau, etc.);
Three representatives from conservation organizations (e.g., the Nature Conservancy,
North American Grouse Partnership, National Audubon Society, etc.); and,
Three representatives from local government or municipalities.
During the period January 2016 through December 2016, the membership of the LPCAC
comprised the following individuals:
State Fish & Wildlife Agencies
Mr. Russ Horton, Lands and Wildlife Diversity Supervisor, Oklahoma Dept. Wildlife
Conservation
Mr. Jake George, Wildlife Section Chief, KS Dept. Wildlife/Parks/Tourism
Mr. Stewart Liley, Chief, Wildlife Management Division, New Mexico Dept. of Game and Fish
Federal Agencies
Mr. Jon Ungerer, LPC Initiative Coordinator, Natural Resources Conservation Service*
Ms. Debra Bills, US Fish and Wildlife Service, Field Supervisor
Industry Organizations
Mr. Myles Culhane (Chairman), Managing Counsel, Occidental Oil & Gas Corp
Ms. Alyssa Edwards, Associate Director, Environmental Permitting, EDF Renewable Energy
Mr. Erv Warren, Manager of Wildlife, OGE Energy Corp
Agricultural and Landowner Association
Mr. Bill Barby, B bar B Ranch
Western Association of Fish and Wildlife Agencies March 2017
The 2016 Lesser Prairie-Chicken Range-wide Conservation Plan Annual Progress Report Page 131
Mr. Jay Evans, Ranch Manager and President
Mr. Alan Jett, Owner/Operator, Jett Ranch, LLC
Conservation Organizations
Mr. Steve Riley, Director-South Region Pheasants Forever*
Ms. Gillian Bee, Stewardship Director, Rocky Mountain Bird Observatory *
Mr. Rob Manes, Director, The Nature Conservancy, KS
Local Government, Municipalities, Co-ops
Mr. Robert J. LeForce, Environmental Specialist, Western Farmers Electric Co-op*
Mr. Steven Hausler, Sunflower Electric Power Corp. *
Mr. Bill Carson, Manager of Member Services, North Plains Electric Co-op
* Representation on the LPCAC completed and replacements nominated and either selected
or pending selection and acceptance.
LPCAC Meetings
LPCAC convened via conference calls on March 8, 2016, July 15, 2016, September 16,
2016. At each meeting the LPCAC reviewed reports from the LPCIC, progress toward meeting
conservation goals through the mitigation framework, made recommendations regarding the
qualifications and use of technical service providers, reviewed research needs, and made
recommendations to the FSSC, SSC and LPCIC. The meetings generated the following
recommendations that were communicated to appropriate committee for further consideration
and action.
1. Electric Distribution Proposal
The Electric Distribution Proposal is a carry-over from the 2014-2015 implementation
year (please refer to the 2014-2015 LPCAC Annual Report). Electric distribution cooperatives
had expressed significant concerns over RWP requirements for burial of electric distribution
lines in areas that are within 1.25 miles of leks or in areas that are not surveyed for leks because:
• Electric coops are member-owned entities and have very limited resources;
Western Association of Fish and Wildlife Agencies March 2017
The 2016 Lesser Prairie-Chicken Range-wide Conservation Plan Annual Progress Report Page 132
• The cost of implementing conservation measures such as the burial of electric
distribution lines is significantly greater than mitigation - these costs are passed
on to users, often rural residents;
• Rural residents consider electrical service to be a basic human right; and,
• Lek surveys have proven impractical because coops have large service areas (up
to 12 counties) and distribution projects have a rapid timeline (generally two
weeks or less).
Consequently, many coops report that they experience significant difficulties remaining
compliant with the RWP while meeting their member’s service needs. In addition, the burial
requirements for electric distribution lines hold the coops to a higher standard than other energy
industries covered under the RWP. With the exception of pipelines, no other activities require
burial under the RWP.
On October 12, 2015, the LPCAC was provided a proposal developed by an ad hoc
committee that contained a series of guidelines designed to identify areas that already have a
level of development such that they are unlikely to be suitable habitat for LPCs. Pursuant to the
proposal guidelines, electric cooperatives and other participant companies may be permitted to
erect overhead electric distribution lines under the CCAA and WCA agreements subject to fewer
restrictions. Spatial analysis performed in support of the proposal found that the following seven
elements were expected to impact less than 2% of all known active and historic leks identified
over the last 10 years.
1) Construction of above ground electric distribution lines without lek surveys
within a 2-mile buffer of incorporated areas as defined in 2015.
2) Construction of above ground electric distribution lines that follow primary roads
and electric transmission lines.
3) Construction of above ground electric distribution lines in un-surveyed areas of
CHAT 2-4 along secondary roads with less than 50% potential suitable habitat
within 1 mile as long as the road is bounded by cropland on one or both sides.
4) Construction of above ground electric distribution lines within a 400 m buffer of
identified electric meter clusters.
5) Outside of defined meter clusters, above ground tap lines or terminal spurs may
be constructed from existing primary and secondary roads where they extend to
another impact buffer such that no new nesting habitat is impacted.
6) Implementation of a retirement program that incentivizes the removal of existing
distribution lines by giving cooperatives credit to build new lines in un-surveyed
areas as long as it results in a net reduction in the miles of distribution line under
their control within CHAT 1-3.
7) Construction of above ground distribution lines within some agricultural and
industrial sites.
Western Association of Fish and Wildlife Agencies March 2017
The 2016 Lesser Prairie-Chicken Range-wide Conservation Plan Annual Progress Report Page 133
After review and discussion at its October 12, 2015 meeting, the LPCAC recommended
sending the proposal to the SSC for review and development of questions and/or revisions. The
SSC reviewed, revised and returned the proposal to the LPCAC on February 19, 2016. The
LPCAC discussed the proposal during its February 23, 2016 call. The LPCAC reviewed and
requested that members of the SSC provide prompt feedback on the proposal so that a final
recommendation might be developed for submittal to the LPCIC. The LPCAC received feedback
on March 3, 2016. The LPCAC again convened via conference call on March 8, 2016 and
reviewed the proposal and developed a recommendation for the LPCIC.
A final recommendation for proposal adoption was forwarded to the LPCIC on March 8,
2016. The LPCIC reviewed and discussed the Advisory Committee recommendation and the
comments from the Science Sub-committee on March 14, 2016. The council discussed the
concerns raised by the Science Sub-committee and agreed that regular reviews are the best
approach to addressing that uncertainty. Two members of the Advisory Committee representing
the electric cooperatives attended the meeting. They stated that the cooperatives were committed
to that review process and were open to research efforts to further define relationships between
lesser prairie-chicken habitat use and electric lines. The cooperatives also noted the importance
of this guidance for the enrollment of other electric cooperatives across the range. Director
Hatcher then moved to accept the recommendation from the Advisory Committee. Director
Sandoval, the chair, called for a vote, and the motion was passed unanimously.
2. Landowner Fee Increase for Certain Practices
On February 19, 2016, WAFWA staff and the FSSC provided the LPCAC a proposal
changing some base payment rates under the LPC conservation agreements. The proposed
changes would take effect for active and new contracts on January 1, 2017. The LPCAC
discussed the proposal on February 23, 2016. The LPCAC Chair requested that WAFWA staff
finalize the proposal for action on its next call.
A final recommendation for proposal adoption was forwarded to the LPCIC on March 8,
2016. The LPCIC reviewed and discussed the Advisory Committee recommendation on March
14, 2016. A member of the FSSC provided the LPCIC with an overview of the recommendation
including the rate of increase in each ecoregion, the fact that these increases are within the limits
allowed by the Range-wide Plan and its associated agreements, and that the effective date for
these changes would be January 1, 2017. No concerns were raised, and a motion was put forth to
approve the recommendation as written. Director Sandoval, the chair, called for a vote, and the
motion was approved unanimously.
Fee Structure Sub-committee
The Lesser Prairie Chicken FSSC serves to inform and support the RWP, promote
effective communication, resolve disputes, revise cost structures and make adaptive management

Western Association of Fish and Wildlife Agencies March 2017
The 2016 Lesser Prairie-Chicken Range-wide Conservation Plan Annual Progress Report Page 134
and policy recommendations for the consideration and/or approval by the LPCIC through the
LPCAC.
The FSSC meets, at a minimum, annually and each member is asked to serve a two year
term. The role of the FSSC is as follows:
Annually review and update mitigation costs and landowner enrollments in specific
practices.
Annually review adaptive management triggers and evaluated actions related to the fee
structure for the mitigation framework.
Annually provide a report to the LPC Advisory Committee
The Fee Structure Sub-committee met on December 14, 2015 via conference call to
discuss the proposed increases in conservation payments that was shared with them by email on
December 7, 2015. Six members of the sub-committee participated in the initial discussion of
the proposal. Those members asked some questions about WAFWA conservation practice
standards and the process that was used to developed the proposed rates which were answered on
the call by WAFWA staff. The call participants did not voice any concerns about the preliminary
proposal and asked WAFWA staff to prepare a full proposal and distribute it to them for further
review. The full proposal was prepared and distributed back to the committee on February 4,
2016. Seven committee members had responded prior to development of this recommendation
and they were all in favor of moving the proposal forward as the committee’s recommendation.
Four of those committee members did provide some suggestions about how to standardize the
process for developing proposed fee/payment changes in future years. The committee will be
discussing that topic during their next meeting in hopes of developing a more standardized
method for WAFWA staff to utilize when preparing proposals in future years.
Science Sub-committee
The Science Sub-committee met once in person and met via conference call five times
from January 2016 to December 2016.
January 14, 2016—The SSC met via conference call to discuss the proposal review process, SSC
roles and responsibilities and the electric distribution proposal. No decision was made on this
proposal.
February 11-12, 2016—The SSC met in Edmund, OK to discuss science priorities for the LPC
and the Electric distribution proposal.
March 1, 2016—The SSC met via conference call to discuss the electric distribution proposal
and the proposal review process. The members elected to provide individual responses to the
proposal for the LPCAC and decided to suspend the review of additional proposals until the new
members of the committee were seated and a more defined review process was established.

Western Association of Fish and Wildlife Agencies March 2017
The 2016 Lesser Prairie-Chicken Range-wide Conservation Plan Annual Progress Report Page 135
September 15, 2016—The SSC met via conference call to discuss the need for by-laws and
historic issues associated with project submittal and committee processes. The need for a chair
was also discussed. LPC Program Manager sent the SSC draft by-laws to review and asked for
nominations for chair.
October 21, 2016—The SSC met via conference call and discussed latest version of by-laws. A
chair was elected (Kent Fricke, Small Game Coordinator with KDWPT). There was a call for
final drafts to the by-laws and the chair submitted them via email for final vote of approval.
Final approval of by-laws was completed November 14, 2016. Election of vice-chair (Brett
Cooper) was also approved on the email vote.
Questions regarding this report should be forwarded to the WAFWA LPC Program Manager.
Respectfully submitted on behalf of the LPCAC,
Myles Culhane
Chair, Lesser Prairie Chicken Advisory Council