Embed Size (px)
Citation preview

The 2017 Vermont Transportation
Energy Profile September 2017

The Vermont Transportation Energy Profile — 2017
Acknowledgements
This VTrans report was undertaken with assistance from the UVM Transportation
Research Center. It was prepared by Jonathan Dowds, Jim Sullivan, Abby Bleything, and
Karen Sentoff.
Support from the Vermont Agency of Transportation, including the Policy and Planning
Division, the Department of Motor Vehicles, Go! Vermont, and staff at the Agency of
Natural Resources, were critical in accessing key data and information for this report.
Disclaimer
The Profile was developed and written as a collaborative project. The UVM Transportation
Research Center is responsible for the facts and the accuracy of the data presented herein.
The contents do not necessarily reflect the official view or policies of the UVM
Transportation Research Center or the Vermont Agency of Transportation. This Profile
does not constitute a standard, specification, or regulation.
The Vermont Transportation Energy Profile — 2017
Table of Contents
Executive Summary ..................................................................................................................................... i
Glossary of Selected Abbreviations ........................................................................................................... iii
1 Introduction ......................................................................................................................................... 1
1.1 Additions to the 2017 Profile ............................................................................................ 2
1.2 Vermont in Context ........................................................................................................... 2
1.3 Data Sets Used in the Energy Profile .............................................................................. 3
2 Vermonters’ Travel Behavior .............................................................................................................. 5
2.1 Vehicle Miles of Travel ...................................................................................................... 5
2.2 Mode Share ...................................................................................................................... 10
2.3 Vehicle Occupancy ........................................................................................................... 14
2.4 Active Transport .............................................................................................................. 16
2.5 Bus and Rail Service ....................................................................................................... 17
3 Privately Owned Vehicle Fleet ......................................................................................................... 22
3.1 Vehicle Registrations....................................................................................................... 22
3.2 Vehicle Type ..................................................................................................................... 24
3.3 Fleet Age .......................................................................................................................... 27
3.4 Fleet-Wide Fuel Economy ............................................................................................... 28
4 Transportation Energy Consumption .............................................................................................. 30
4.1 Petroleum-Based Fuel Sales ........................................................................................... 31
4.2 Biofuels ............................................................................................................................. 32
4.3 Electricity ......................................................................................................................... 33
4.4 Compressed and Liquefied Natural Gas ........................................................................ 34
5 Greenhouse Gas Emissions ............................................................................................................... 36
6 Freight Transport .............................................................................................................................. 39
6.1 Vermont Rail Freight Infrastructure ............................................................................. 40
6.2 Modal Flows ..................................................................................................................... 40
6.3 Future Freight Enhancements ....................................................................................... 41
7 Progress toward 2016 CEP Transportation Targets ....................................................................... 42
7.1 Goal 1: Reduce Total Transportation Energy Use......................................................... 42
7.2 Goal 2: Increase Renewable Energy Use in Transportation ......................................... 43
The Vermont Transportation Energy Profile — 2017
7.3 Goal 3: Reduce Transportation GHG Emissions ........................................................... 43
7.4 Objective 1: Per Capita VMT .......................................................................................... 44
7.5 Objective 2: Reduce SOV Commute Trips ...................................................................... 44
7.6 Objective 3: Increase Bike/Ped Commute Trips ............................................................ 45
7.7 Objective 4: Increase State Park-and-Ride Spaces ....................................................... 45
7.8 Objective 5: Increase Transit Trips ................................................................................ 45
7.9 Objective 6: Increase Passenger Rail Trips ................................................................... 46
7.10 Objective 7: Increase Rail-Based Freight ....................................................................... 46
7.11 Objective 8: Increase Registration of Electric Vehicles ................................................. 46
7.12 Objective 9: Increase Renewable Fuel Use in Heavy-Duty Fleets ............................... 47
8 Recommendations for Metrics, Data, and Modeling ....................................................................... 48
8.1 Expanding/Improving Data Collection for Existing Metrics ........................................ 48
8.2 Additional Metrics Recommended .................................................................................. 48
8.3 New Data Needed ............................................................................................................ 49
8.4 Improved Modeling Needed ............................................................................................ 49
9 Conclusions ........................................................................................................................................ 51
10 References .......................................................................................................................................... 52
The Vermont Transportation Energy Profile — 2017
List of Tables
Table E-1. Current Progress toward Achieving CEP Transportation Targets ........................................ ii
Table 1-1. 2016 CEP Supporting Transportation Objectives.................................................................... 2 Table 2-1. Total and Per Capita VMT, 2007–2015 .................................................................................... 6 Table 2-2. Vermont VMT by Road Class, 2015 .......................................................................................... 6 Table 2-3. Driver’s Licenses and Permits in Vermont, 2008–2016 .......................................................... 8 Table 2-4. Comparison of Commuter Mode Share (%) for Vermonters, 2009 – 2015 ............................ 12
Table 2-5. Average Vehicle Occupancy, 2009 .......................................................................................... 14 Table 2-6. Go! Vermont Program Benefits, SFY 2017............................................................................. 15 Table 2-7. State Park-and-Ride Facilities in Vermont (2012 – 2017) .................................................... 15 Table 2-8. Municipal Park-and-Ride Facilities in Vermont, (2012 – 2017) ........................................... 16 Table 2-9. Vermonters’ and Nationwide Biking and Walking Tendencies, 2009 .................................. 17
Table 2-10. Walking and Biking Frequency among Vermonters, 2016 ................................................. 17 Table 2-11. Bus Ridership for Vermont Transit Authority Providers, FY 2011–16 ............................. 19 Table 3-1. Vehicle Registrations and Driver’s Licenses in Vermont and the U.S., 2007–2015 ............ 23 Table 3-2. Vehicles Registered in Vermont by Fuel Type, 2008–2017 ................................................... 24 Table 3-3. Vermont PEV Registration and MPGe by Vehicle Model ..................................................... 25
Table 3-4. EPA Fuel Economy for Vehicles Registered in Vermont, 2011–2017 .................................. 29 Table 3-5. Realized MPG (VMT/Fuel Sales) ............................................................................................ 29 Table 4-1. Fuels Sales for Ground Transportation in Vermont, 2011–2016.......................................... 31 Table 4-2. Estimated PEV Electricity Consumption in Vermont for 2016 ............................................ 33 Table 4-3. Sample of Electricity Demand at Vermont PEV Charging Stations .................................... 34
Table 4-4. Aggregate electricity demand at GMP EVgo PEV charging stations in VT ........................ 34 Table 4-5. Aggregate electricity demand at ChargePoint PEV charging stations in VT ...................... 34 Table 4-6. Vermont CNG Fleet ................................................................................................................. 35
Table 5-1 Transportation Sector GHG Emissions (MMTCO2e) .............................................................. 37
Table 6-1. Freight Movement in Vermont by Mode, 2014 ...................................................................... 40 Table 6-2. Vermont Rail-Tonnage 2011 and 2014 ................................................................................... 41

The Vermont Transportation Energy Profile — 2017
List of Figures
Figure E-1. Vermont Energy Consumption, 2015 (U.S. EIA, 2017) .......................................................... i
Figure E-2. Per Capita Transportation Sector Energy Consumption, 2015 (U.S. EIA 2017) ................. i Figure 1-1. Vermont and Comparison States ............................................................................................ 3 Figure 2-1. Trends in Per Capita VMT (FHWA, 2008–2016) ................................................................... 5 Figure 2-2. 2015 Per Capita VMT for U.S. States (FHWA, 2016; USCB, 2016) ..................................... 7 Figure 2-3. Per Capita Licensure, 2015 (FHWA, 2016; USCB, 2017) ...................................................... 8
Figure 2-4. Distribution of Trip Purpose or Destination for Vermonters, 2009 (USDOT, 2010) ........... 9 Figure 2-5. Vermonters’ Mode Share, 2009 (USDOT, 2010) ................................................................... 10 Figure 2-6. Mode Share for Non-SOV Vermont Commuters, 2009–2015 (ACS, 2011-2017) ................ 11 Figure 2-7. Commute Mode Share for Non-SOV Trips, 2015 (ACS, 2011-2017) ................................... 12 Figure 2-8. Energy Intensities of Common Transport Modes (Davis et al., 2016) ................................ 13
Figure 2-9. Transit Service Providers (KFH Group, 2017) ..................................................................... 18 Figure 2-10. Transit Ridership FY 2012–2016 (KFH Group, 2017) ....................................................... 19 Figure 2-11. Amtrak Boardings and Alightments at Vermont Stations, FY 2003–2016 (Pappis, 2015;
Amtrak, 2016 - 2017) ................................................................................................................................. 20 Figure 3-1. Vermont Vehicle Registrations by Fuel Type, 2017 (VDMV, 2017) .................................... 22
Figure 3-2. Vehicles per Capita and per Licensed Driver, 2015 (FHWA, 2016) ................................... 23 Figure 3-3. Top 20 Vehicle Models Registered in Vermont, 2017 (VDMV, 2017) ................................. 26 Figure 3-4. WTW Energy and GHG Intensity (Onat et al., 215) ............................................................ 27 Figure 3-5. Distribution of Model Years for Vehicles in Vermont, 2017 (VDMV, 2017) ....................... 28 Figure 4-1. Vermont Sectoral Energy Consumption, 2015 (U.S. EIA, 2017) ......................................... 30
Figure 4-2. 2015 Per Capita Transportation Sector Energy Consumption (U.S. EIA, 2017) ............... 30 Figure 4-3. Total Vermont Transportation Energy Consumption, 1990 - 2015 (U.S. EIA, 2017) ........ 31 Figure 4-4. VT Gasoline and Diesel Sales, Rolling 12-Mo. Total, 2011 – 2017 (VT JFO, 2017) .......... 32
Figure 4-5. Monthly CNG for Transportation in Vermont, 2006–2017 (Vermont Gas, 2017) ............. 35
Figure 5-1. Vermont GHG Emissions by Sector, 2013 (VT ANR, 2017) ................................................ 36 Figure 5-2. CO2 Emissions: Transportation Sector Fossil Fuel Consumption (U.S. EPA, 2016a) ....... 37 Figure 5-3. Vermont CO2 Emissions from Gasoline and Diesel Sales ................................................... 38 Figure 6-1. Vermont’s Rail Network (VTrans, 2015) .............................................................................. 39

The Vermont Transportation Energy Profile — 2017
i
Executive Summary
The transportation sector is responsible for 37% of
the total energy consumed in Vermont (see Figure
E-1), more than any other sector in the State. The
energy used by the transportation sector is derived
overwhelmingly from fossil fuels, almost 75% in the
form of gasoline and an additional 22% in the form
of diesel. Consequently, the 2016 Vermont
Comprehensive Energy Plan (CEP) included three
goals and nine supporting objectives related to
reducing transportation sector energy consumption
and greenhouse gas emissions (VDPS, 2016). The
2017 Vermont Transportation Energy Profile (“the
Profile”) is the third installment of a biannual
reporting series that evaluates the State’s
progress toward achieving these transportation
sector goals and objectives (together referred to
as targets).
Though the industrial sector
is the largest consumer of
energy nationally, this is not
the case in Vermont.
Vermont is one of 23 U.S.
states that consumes more
energy for transportation
than for any other sector
(U.S. EIA, 2017).
Nonetheless, as shown in
Figure E-2, the State’s per
capita transportation sector
energy use is below the
national average, at 78.4
million Btu annually in 2015,
and below levels seen in four
rural comparisons states
selected on the basis of
similarities in population and
development characteristics.
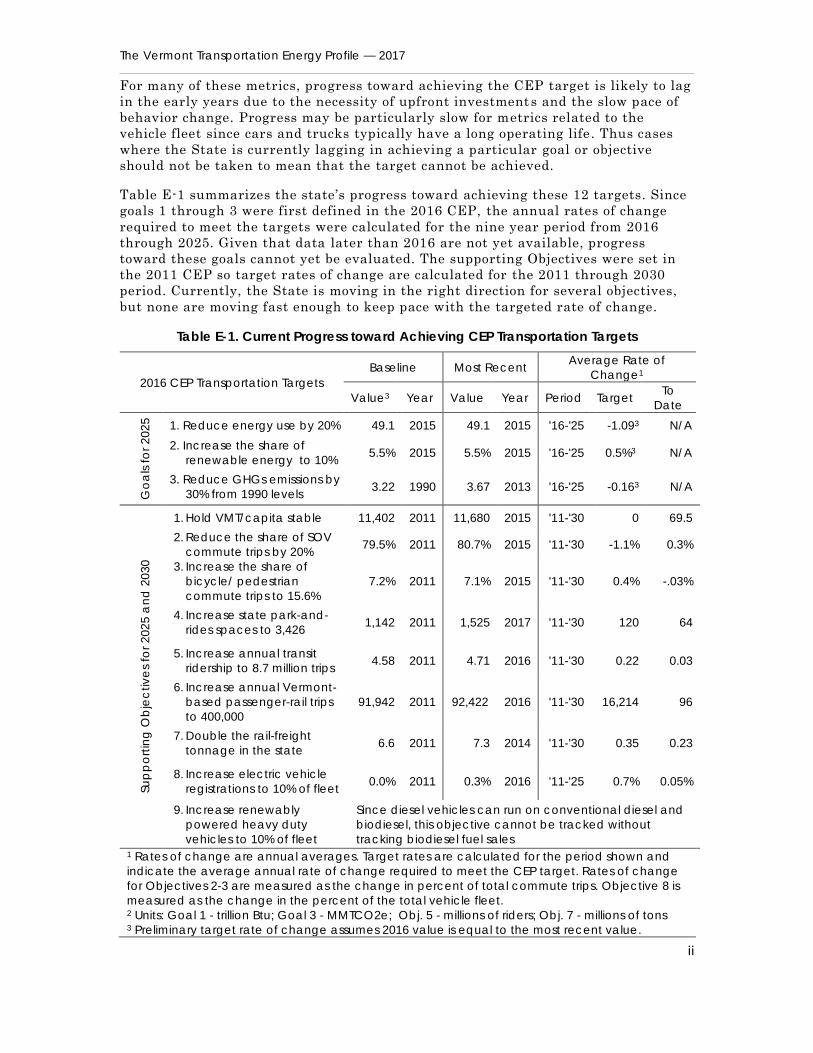
The short-term CEP transportation targets are presented in Table E-1. In order to
conduct this assessment, the change in each metric is compared to the average
annual rate of change required to hit the CEP target. For example, since 2011, the
CEP has called for the State to add 2,284 park-and-ride parking spaces by 2030. In
order to achieve this target, the State must add an average of 120 spaces per year
over the 2011 to 2030 period. When the average number of new parking spaces is at
or above 120 spaces per year, the State is on pace to meet the CEP target. When the
average number of new parking spaces falls below this rate, the State is lagging
behind the CEP target.
Figure E-2. Per Capita Transportation Sector Energy Consumption, 2015 (U.S. EIA 2017)
Figure E-1. Vermont Energy
Consumption, 2015 (U.S. EIA, 2017)
The Vermont Transportation Energy Profile — 2017
ii
For many of these metrics, progress toward achieving the CEP target is likely to lag
in the early years due to the necessity of upfront investments and the slow pace of
behavior change. Progress may be particularly slow for metrics related to the
vehicle fleet since cars and trucks typically have a long operating life. Thus cases
where the State is currently lagging in achieving a particular goal or objective
should not be taken to mean that the target cannot be achieved.
Table E-1 summarizes the state’s progress toward achieving these 12 targets. Since
goals 1 through 3 were first defined in the 2016 CEP, the annual rates of change
required to meet the targets were calculated for the nine year period from 2016
through 2025. Given that data later than 2016 are not yet available, progress
toward these goals cannot yet be evaluated. The supporting Objectives were set in
the 2011 CEP so target rates of change are calculated for the 2011 through 2030
period. Currently, the State is moving in the right direction for several objectives,
but none are moving fast enough to keep pace with the targeted rate of change.
Table E-1. Current Progress toward Achieving CEP Transportation Targets
2016 CEP Transportation Targets
Baseline Most Recent Average Rate of
Change1
Value3 Year Value Year Period Target To
Date
Go
als
fo
r 2
02
5
1. Reduce energy use by 20% 49.1 2015 49.1 2015 '16-'25 -1.093 N/A
2. Increase the share of
renewable energy to 10% 5.5% 2015 5.5% 2015 '16-'25 0.5%3 N/A
3. Reduce GHGs emissions by
30% from 1990 levels 3.22 1990 3.67 2013 '16-'25 -0.163 N/A
Su
pp
ort
ing
Ob
jec
tiv
es
for
202
5 a
nd
20
30
1. Hold VMT/capita stable 11,402 2011 11,680 2015 '11-'30 0 69.5
2. Reduce the share of SOV
commute trips by 20% 79.5% 2011 80.7% 2015 '11-'30 -1.1% 0.3%
3. Increase the share of
bicycle/ pedestrian
commute trips to 15.6%
7.2% 2011 7.1% 2015 '11-'30 0.4% -.03%
4. Increase state park-and-
rides spaces to 3,426 1,142 2011 1,525 2017 '11-'30 120 64
5. Increase annual transit
ridership to 8.7 million trips 4.58 2011 4.71 2016 '11-'30 0.22 0.03
6. Increase annual Vermont-
based passenger-rail trips
to 400,000
91,942 2011 92,422 2016 '11-'30 16,214 96
7. Double the rail-freight
tonnage in the state 6.6 2011 7.3 2014 '11-'30 0.35 0.23
8. Increase electric vehicle
registrations to 10% of fleet 0.0% 2011 0.3% 2016 '11-'25 0.7% 0.05%
9. Increase renewably
powered heavy duty
vehicles to 10% of fleet
Since diesel vehicles can run on conventional diesel and
biodiesel, this objective cannot be tracked without
tracking biodiesel fuel sales 1 Rates of change are annual averages. Target rates are calculated for the period shown and
indicate the average annual rate of change required to meet the CEP target. Rates of change
for Objectives 2-3 are measured as the change in percent of total commute trips. Objective 8 is
measured as the change in the percent of the total vehicle fleet. 2 Units: Goal 1 - trillion Btu; Goal 3 - MMTCO2e; Obj. 5 - millions of riders; Obj. 7 - millions of tons 3 Preliminary target rate of change assumes 2016 value is equal to the most recent value.

The Vermont Transportation Energy Profile — 2017
iii
Glossary of Selected Abbreviations
AEV: All-Electric Vehicle – Any vehicle powered solely by an electric motor. Also
referred to as electric vehicles or battery electric vehicles , AEV is used throughout
the profile to avoid confusion with plug-in hybrid electric vehicles. As of July, 2017,
the Nissan Leaf is the most common AEV in Vermont.
ACS: American Community Survey – An annual survey conducted by the U.S.
Census Bureau that collects demographic, economic, housing and social information,
including information about commuting behavior and vehicle ownership.
CEP: Comprehensive Energy Plan – A statutorily mandated framework for
implementing state energy policy produced by the Vermont Department of Public
Service in conjunction with other agencies and stakeholders. The most recent CEP
was adopted in 2016.
CNG: Compressed Natural Gas – An alternative fuel currently used primarily in
heavy-duty fleets in Vermont. Compressed natural gas is pressurized to reduce the
volume that it occupies and increase its energy density. Most natural gas is
extracted from finite underground reserves that are not renewable but natural gas
can also be produced renewably from organic materials including from landfill and
agricultural waste. Conventional natural gas offers modest greenhouse gas benefits
relative to gasoline and diesel while renewable natural gas offers greater benefits.
CO2 and CO2e: Carbon Dioxide and Carbon Dioxide Equivalent – CO2 is a
greenhouse gas. CO2 emissions are the most significant transportation-sector
contributor to climate change. CO2e express the climate impacts of different
greenhouse gases in terms of their climate impact relative to CO 2. It allows for the
consistent comparison of different greenhouses in a manner that accounts for their
differential impacts on climate change.
HEV: Hybrid Electric Vehicles – Any vehicle with both an internal combustion
engine and an electric motor that cannot be plugged into an external source. HEVs
have fuel efficiency advantages over conventional internal combustion engine
vehicles.
ICEV: Internal Combustion Engine Vehicle – Any vehicle powered solely by the
combustion of fuel in an engine. Also referred to as conventional vehicles, ICEVs
can use a variety of liquid and gaseous fuels including gasoline, diesel, natural gas
and biofuels.
GHG: Greenhouse gas – Any of several gases that contribute to climate change by
trapping heat in the atmosphere. Carbon dioxide emissions from the combustion of
fossil fuels are the largest contributor to climate change in the transportation
sector.
LRTPS: Long Range Transportation Planning Survey – A survey commissioned by
VTrans, conducted in 2016, to gather public opinion on transportation issues to
inform updates to the State’s Long Range Transportation Plan .
LNG: Liquefied Natural Gas – An alternative fuel currently used exclusively in
heavy-duty fleets in Vermont. Liquefied natural gas is cooled until it reaches a
liquid state to the volume that it occupies and increase its energy density. Most
The Vermont Transportation Energy Profile — 2017
iv
natural gas is extracted from finite underground reserves that are not renewable
but natural gas can also be produced renewably from organic materials including
from landfill and agricultural waste. Conventional natural gas offers modest
greenhouse gas benefits relative to gasoline and diesel while renewable natural gas
offers greater benefits.
LCA: Life Cycle Assessment – A technique used to evaluate the environmental
impacts of a product comprehensively, including the impacts related to producing,
operating, and decommissioning the product.
MPG and MPGe: Miles per Gallon and Miles per Gallon Equivalent – MPG is the
measure of the distance a vehicle can travel on a gallon of fuel. MPGe is the
measure of the distance a vehicle can travel using the equivalent energy that is in a
gallon of gasoline. MPGe is used to compare the fuel efficiency of vehicles that use
different energy sources (e.g. gasoline and electricity).
PEV: Plug-in Electric Vehicle – Any vehicle with an electric motor that plugs into
an external power source to charge. This includes plug-in hybrid electric vehicles,
which use a combination of gasoline and electricity, and all-electric vehicles, which
use electricity exclusively.
PHEV: Plug-in Hybrid Electric Vehicle – Any vehicle with both an internal
combustion engine and an electric motor that can be plugged into an external power
source to charge. As of July, 2017, the Ford C-Max Energi Plug-in Hybrid is the
most common PHEV in Vermont.
NHTS: National Household Travel Survey – A national survey conducted on a
periodic basis (generally every 6 – 8 years) by the U.S. Department of
Transportation. The survey collects a wide range of travel data. Data collection for
the 2016 NHTS has been completed and is slated for release in 2018. The 2009
NHTS is the last edition of the survey for which data is available.
RFS: Renewable Fuel Standard – A regulatory mechanism that mandates sales of
specific renewable fuels. The U.S. RFS was established in 2005 and update d in 2007
and mandates sales volumes for biomass-based diesel, cellulosic biofuel, advanced
biofuel and total renewable fuel.
SOV: Single Occupancy Vehicle – Any vehicle occupied only by the driver. SOV trips
have lower energy efficiency per passenger mile than trips which include
passengers. Reducing SOV trips is one strategy for reducing transportation sector
energy consumption.
VMT: Vehicle Miles Traveled – The total on-road distance driven by all vehicles
within a given jurisdiction. Reducing VMT is one strategy for reducing
transportation sector energy consumption.
The Vermont Transportation Energy Profile — 2017
1
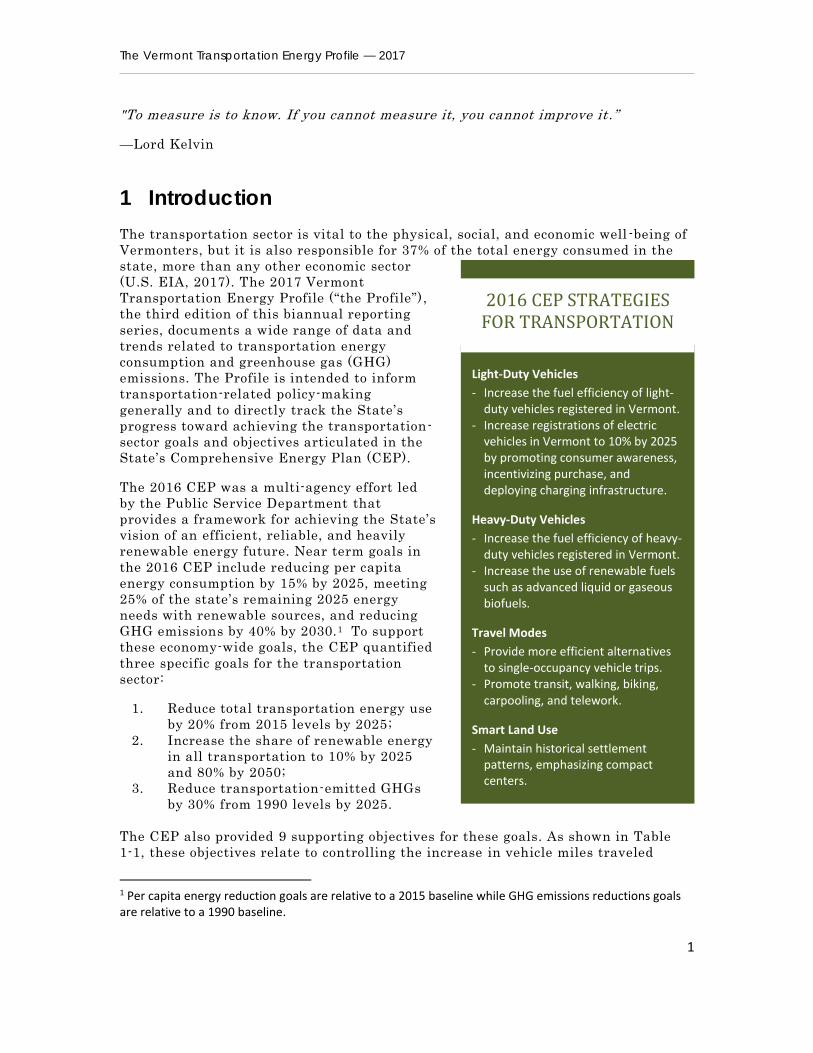
Light-Duty Vehicles
- Increase the fuel efficiency of light-duty vehicles registered in Vermont.
- Increase registrations of electric vehicles in Vermont to 10% by 2025 by promoting consumer awareness, incentivizing purchase, and deploying charging infrastructure.
Heavy-Duty Vehicles
- Increase the fuel efficiency of heavy-duty vehicles registered in Vermont.
- Increase the use of renewable fuels such as advanced liquid or gaseous biofuels.
Travel Modes
- Provide more efficient alternatives to single-occupancy vehicle trips.
- Promote transit, walking, biking, carpooling, and telework.
Smart Land Use
- Maintain historical settlement patterns, emphasizing compact centers.
2016 CEP STRATEGIES FOR TRANSPORTATION
"To measure is to know. If you cannot measure it, you cannot improve it .”
—Lord Kelvin
1 Introduction
The transportation sector is vital to the physical, social, and economic well -being of
Vermonters, but it is also responsible for 37% of the total energy consumed in the
state, more than any other economic sector
(U.S. EIA, 2017). The 2017 Vermont
Transportation Energy Profile (“the Profile”) ,
the third edition of this biannual reporting
series, documents a wide range of data and
trends related to transportation energy
consumption and greenhouse gas (GHG)
emissions. The Profile is intended to inform
transportation-related policy-making
generally and to directly track the State’s
progress toward achieving the transportation-
sector goals and objectives articulated in the
State’s Comprehensive Energy Plan (CEP).
The 2016 CEP was a multi-agency effort led
by the Public Service Department that
provides a framework for achieving the State’s
vision of an efficient, reliable, and heavily
renewable energy future. Near term goals in
the 2016 CEP include reducing per capita
energy consumption by 15% by 2025, meeting
25% of the state’s remaining 2025 energy
needs with renewable sources, and reducing
GHG emissions by 40% by 2030.1 To support
these economy-wide goals, the CEP quantified
three specific goals for the transportation
sector:
1. Reduce total transportation energy use
by 20% from 2015 levels by 2025;
2. Increase the share of renewable energy
in all transportation to 10% by 2025
and 80% by 2050;
3. Reduce transportation-emitted GHGs
by 30% from 1990 levels by 2025.
The CEP also provided 9 supporting objectives for these goals. As shown in Table
1-1, these objectives relate to controlling the increase in vehicle miles traveled
1 Per capita energy reduction goals are relative to a 2015 baseline while GHG emissions reductions goals are relative to a 1990 baseline.

The Vermont Transportation Energy Profile — 2017
2
(VMT)—an estimate of the total on-road distance driven by all vehicles in Vermont,
increasing the percent of trips taken using lower-energy-intensity travel modes such
as walking and public transit, and increasing renewable fuel usage for vehicle trips.
Table 1-1. 2016 CEP Supporting Transportation Objectives
Control Vehicle Miles Traveled:
1. Hold per capita VMT to 2011 levels.
Increase the Share of Travel Modes with Lower Energy Intensities:
2. Reduce the share of SOV commute trips by 20%.
3. Double the share of bicycle and pedestrian commute trips to 15.6%.
4. Triple the number of state park-and-rides spaces to 3,426.
5. Increase public transit ridership by 110% to 8.7 million trips annually.
6. Quadruple Vermont-based passenger-rail trips to 400,000 trips annually.
7. Double the rail-freight tonnage in the state.
Increase Renewable Fuel Usage:
8. Increase the number of electric vehicles registered in Vermont to 10% of the fleet by 2025.
9. Increase the number of heavy duty vehicles that are renewably powered to 10% by 2025.
Note: All objectives are for 2030 and relative to a 2011 baseline except where noted otherwise.
As articulated in the CEP, achieving the goals of reducing transportation energy
use and GHG emissions while also increasing renewable energy use in the
transportation sector will require a multifaceted approach that reduces VMT,
improves fuel economy, and reduces GHG emissions per mile traveled. Currently,
none of the eight objectives that can be assessed quantitatively are on pace to
achieve the CEP targets. Additional policy initiatives that accelerate mode shifts
and vehicle electrification may be needed to succeed in meeting the vision put forth
in the 2016 CEP.
Sections 2 through 6 of the Profile provide the data needed to evaluate the CEP
transportation objectives in a broader transportation context. Progress toward
achieving each of the three goals and nine supporting objectives are evaluated in
Section 7. Final recommendations for CEP goal revisions and additional data
collection needs are provided in Section 8.
1.1 Additions to the 2017 Profile
The 2017 edition of the Profile expands on the data collection and reporting in
previous Profiles in several ways. For the first time the Profile provides an estimate
of the total electricity used for vehicle charging (Section 4.3). The 2017 profile also
includes a new tracking of GHG emissions (Section 5) and incorporates new data
sources, including the results from the VTrans Long Range Transportation Planning
Survey (LRTPS) (RSG, 2016).
1.2 Vermont in Context
In order to provide context for the data outlined in this Profile, national data are
provided alongside Vermont data whenever possible. In addition, since

The Vermont Transportation Energy Profile — 2017
3
transportation demand is closely tied to development patterns, Vermont data are
juxtaposed with four comparison states: Maine, North Dakota, South Dakota, and
West Virginia. These four states, shown in Figure 1-1, were selected based on
similarities in terms of (1) the proportion of each state that is rural versus urba n,
(2) residential density distribution, (3) household size distribution, (4) the
distribution of the number of workers in each household, and (5) overall population.
In addition, potential comparison states were limited to states that experience
significant winter weather and its associated impact on travel.
Figure 1-1. Vermont and Comparison States
1.3 Data Sets Used in the Energy Profile
This report draws on a variety of data sets to illustrate trends in Vermonters’ travel
behavior, vehicle fleet composition, and fuel sources that are relevant to CEP
metrics and broader transportation policy-making initiatives. These data sources
are expected to be available at regular intervals in the future. They include but are
not limited to:
American Community Survey (ACS), U.S. Census Bureau
o Data Collection Cycle: Annual
o Most Recent Data Available: 2015
Highway Statistics Series, Federal Highway Administration
o Data Collection Cycle: Annual
o Most Recent Data Available: 2015
National Household Travel Survey (NHTS)
o Data Collection Cycle: Six- to eight-years
o Most Recent Data Available: 2009
State Energy Data System, U.S. Energy Information Administration (EIA)
o Data Collection Cycle: Annual
o Most Recent Data Available: 2015
Vermont Department of Motor Vehicles (VDMV) licensing/vehicle
registration
o Data Collection Cycle: Annual
The Vermont Transportation Energy Profile — 2017
4
o Most Recent Data Available: 2016
Vermont Greenhouse Gas Emissions Inventory, Agency of Natural Resources
o Data Collection Cycle: Annual
o Most Recent Data Available :2013
Vermont Legislative Joint Fiscal Office (JFO) gasoline/diesel sales
o Data Collection Cycle: Monthly
o Most Recent Data Available: 2016
VTrans Public Transit Route Performance Reviews
o Data Collection Cycle: Annual
o Most Recent Data Available: SFY 2016
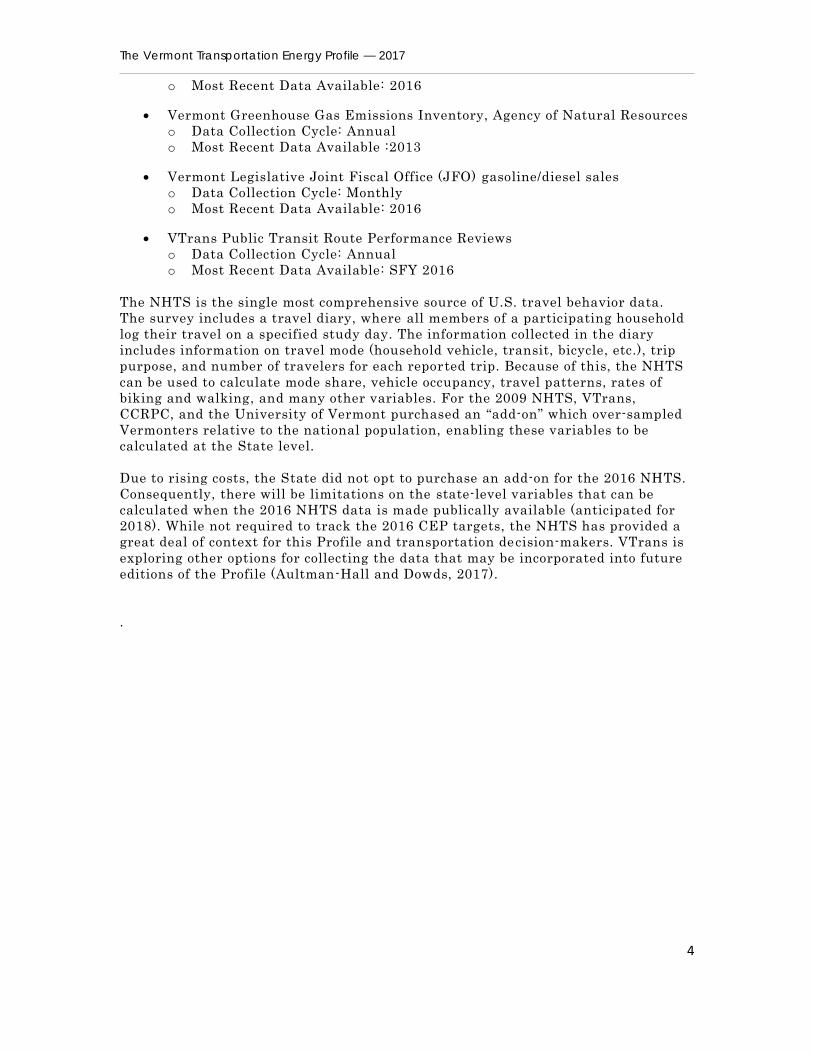
The NHTS is the single most comprehensive source of U.S. travel behavior data.
The survey includes a travel diary, where all members of a participating household
log their travel on a specified study day. The information collected in the diary
includes information on travel mode (household vehicle, transit, bicycle, etc.), trip
purpose, and number of travelers for each reported trip. Because of this, the NHTS
can be used to calculate mode share, vehicle occupancy, travel patterns, rates of
biking and walking, and many other variables. For the 2009 NHTS, VTrans,
CCRPC, and the University of Vermont purchased an “add-on” which over-sampled
Vermonters relative to the national population, enabling these variables to be
calculated at the State level.
Due to rising costs, the State did not opt to purchase an add-on for the 2016 NHTS.
Consequently, there will be limitations on the state-level variables that can be
calculated when the 2016 NHTS data is made publically available (anticipated for
2018). While not required to track the 2016 CEP targets, the NHTS has provided a
great deal of context for this Profile and transportation decision-makers. VTrans is
exploring other options for collecting the data that may be incorporated into future
editions of the Profile (Aultman-Hall and Dowds, 2017).
.

The Vermont Transportation Energy Profile — 2017
5
Definition: Annual VMT is an estimate of the total miles driven by all vehicles on a road network. VMT can provide insight into transportation energy use, emissions, and economic activity.
Trends: Vermont’s total and per capita VMT fell between 2007 and 2014 but increased in 2015. A similar pattern is apparent at the national level. Vermont’s per capita VMT remains higher than the national and rural comparison state averages.
Figure 2-1. Trends in Per Capita
VMT (FHWA, 2008–2016)
Driving Factors: The upward movement in VMT likely reflects improved economic conditions and lower gas prices.
VEHICLE MILES OF TRAVEL (VMT)
2 Vermonters’ Travel Behavior
Individuals’ travel behaviors (where, how , and how often they travel) are a key
determinant of the total energy and specific fuels consumed by the transportation
sector. Travel behavior in Vermont is heavily influenced by the State’s rural and
village-based land-use patterns. Automobile usage is the dominant mode of travel,
accounting for approximately 85% of all trips made in the State. Per capita VMT in
Vermont has fallen since its peak in 2007 but remains above the national average
and increased modestly in 2015.
2.1 Vehicle Miles of Travel
Total annual VMT is an estimate of the total
mileage driven by all vehicles on a given road
network. VMT is an important metric that is
used in several capacities: in highway
planning and management, to estimate fuel
consumption and mobile-source emissions, to
project potential gasoline tax revenues, and
as a proxy for economic activity. Total VMT is
influenced by how far and how frequently
people drive and by vehicle occupancy rates.
After climbing steadily through the mid-
2000s, VMT declined for several years at both
the state and national level beginning in 2008
(see Table 2-1 and Figure 2-1). At the
national level, total VMT has risen since 2011
and per capita VMT has risen since 2013. In
Vermont, total and per capita VMT hit their
lowest levels in 2014 and both increased in
2015. These increases in VMT have been
linked to increased economic activity and
lower gasoline prices (McCahill, 2017).
Demographic trends and changing travel
preferences, particularly among teens and
young adults, may mitigate future VMT
growth. Drivers age 65 and older, a growing
proportion of the Vermont population, drive
considerably less than drivers between the
ages of 20 and 64 (FHWA 2015). In addition,
teens and young adults are traveling less
than their counterparts in previous
generations did (Blumenberg et al., 2013).
Rates of licensure, trip chaining, and the use
of car sharing may also impact VMT and are
discussed in Sections 2.1.1 through 2.1.3.
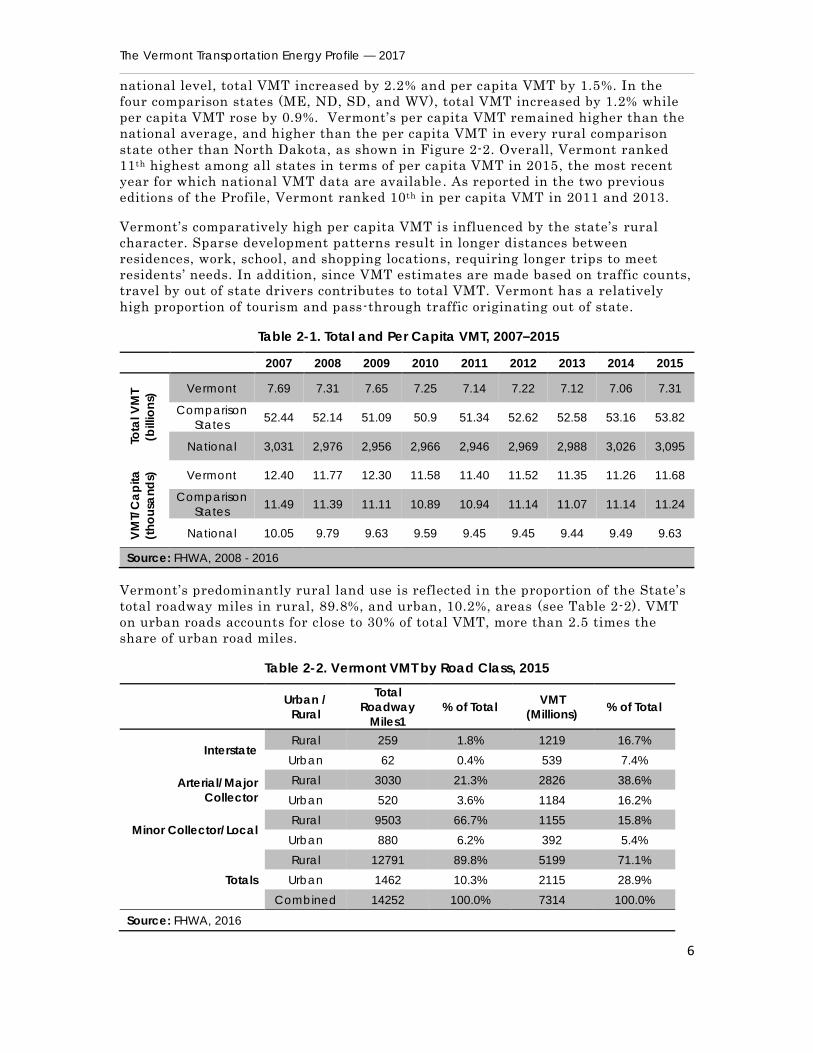
In 2015, total and per capita VMT in Vermont
increased by 3.5% and 3.7%, respectively. Over this same time period, at the
The Vermont Transportation Energy Profile — 2017
6
national level, total VMT increased by 2.2% and per capita VMT by 1.5%. In the
four comparison states (ME, ND, SD, and WV), total VMT increased by 1.2% while
per capita VMT rose by 0.9%. Vermont’s per capita VMT remained higher than the
national average, and higher than the per capita VMT in every rural comparison
state other than North Dakota, as shown in Figure 2-2. Overall, Vermont ranked
11th highest among all states in terms of per capita VMT in 2015, the most recent
year for which national VMT data are available . As reported in the two previous
editions of the Profile, Vermont ranked 10th in per capita VMT in 2011 and 2013.
Vermont’s comparatively high per capita VMT is influenced by the state’s rural
character. Sparse development patterns result in longer distances between
residences, work, school, and shopping locations, requiring longer trips to meet
residents’ needs. In addition, since VMT estimates are made based on traffic counts,
travel by out of state drivers contributes to total VMT. Vermont has a relatively
high proportion of tourism and pass-through traffic originating out of state.
Table 2-1. Total and Per Capita VMT, 2007–2015
2007 2008 2009 2010 2011 2012 2013 2014 2015
Tota
l V
MT
(billio
ns)
Vermont 7.69 7.31 7.65 7.25 7.14 7.22 7.12 7.06 7.31
Comparison
States 52.44 52.14 51.09 50.9 51.34 52.62 52.58 53.16 53.82
National 3,031 2,976 2,956 2,966 2,946 2,969 2,988 3,026 3,095
VM
T/C
ap
ita
(th
ou
san
ds)
Vermont 12.40 11.77 12.30 11.58 11.40 11.52 11.35 11.26 11.68
Comparison
States 11.49 11.39 11.11 10.89 10.94 11.14 11.07 11.14 11.24
National 10.05 9.79 9.63 9.59 9.45 9.45 9.44 9.49 9.63
Source: FHWA, 2008 - 2016
Vermont’s predominantly rural land use is reflected in the proportion of the State’s
total roadway miles in rural, 89.8%, and urban, 10.2%, areas (see Table 2-2). VMT
on urban roads accounts for close to 30% of total VMT, more than 2.5 times the
share of urban road miles.
Table 2-2. Vermont VMT by Road Class, 2015
Urban /
Rural
Total
Roadway
Miles1
% of Total VMT
(Millions) % of Total
Interstate Rural 259 1.8% 1219 16.7%
Urban 62 0.4% 539 7.4%
Arterial/Major
Collector
Rural 3030 21.3% 2826 38.6%
Urban 520 3.6% 1184 16.2%
Minor Collector/Local Rural 9503 66.7% 1155 15.8%
Urban 880 6.2% 392 5.4%
Totals
Rural 12791 89.8% 5199 71.1%
Urban 1462 10.3% 2115 28.9%
Combined 14252 100.0% 7314 100.0%
Source: FHWA, 2016

The Vermont Transportation Energy Profile — 2017
7
Figure 2-2. 2015 Per Capita VMT for U.S. States (FHWA, 2016; USCB, 2016)
The Vermont Transportation Energy Profile — 2017
8
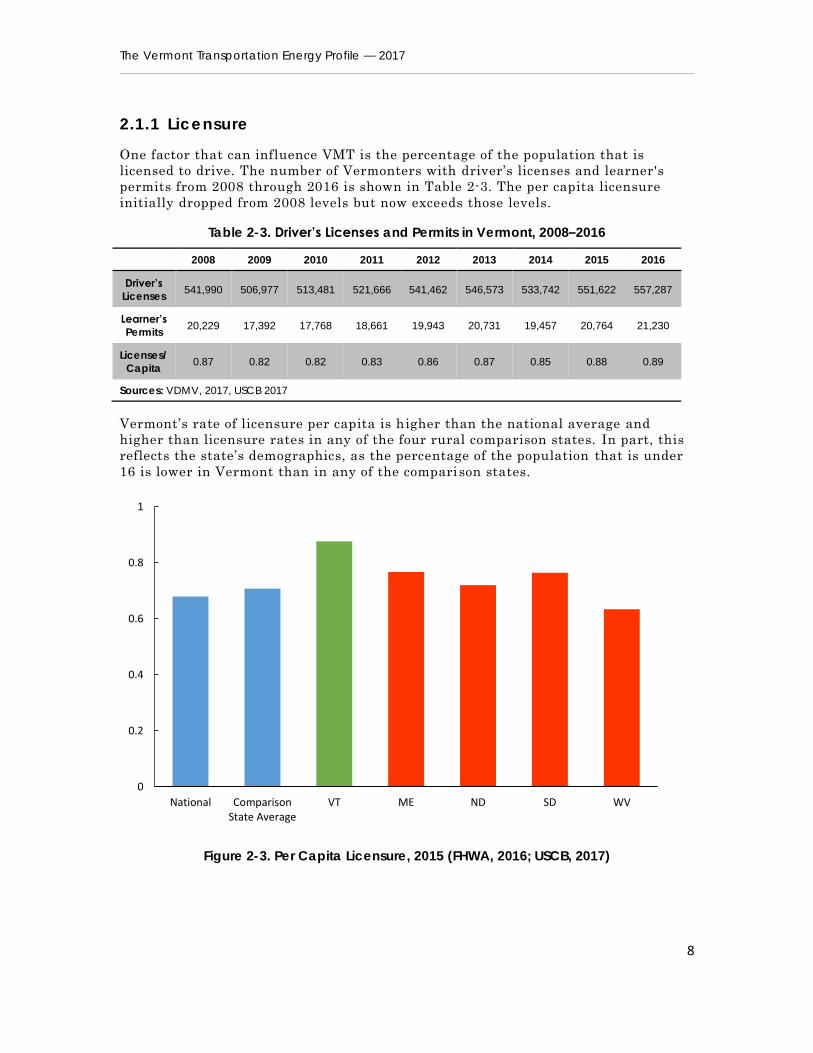
2.1.1 Licensure
One factor that can influence VMT is the percentage of the population that is
licensed to drive. The number of Vermonters with driver’s licenses and learner's
permits from 2008 through 2016 is shown in Table 2-3. The per capita licensure
initially dropped from 2008 levels but now exceeds those levels.
Table 2-3. Driver’s Licenses and Permits in Vermont, 2008–2016
2008 2009 2010 2011 2012 2013 2014 2015 2016
Driver’s
Licenses 541,990 506,977 513,481 521,666 541,462 546,573 533,742 551,622 557,287
Learner’s
Permits 20,229 17,392 17,768 18,661 19,943 20,731 19,457 20,764 21,230
Licenses/
Capita 0.87 0.82 0.82 0.83 0.86 0.87 0.85 0.88 0.89
Sources: VDMV, 2017, USCB 2017
Vermont’s rate of licensure per capita is h igher than the national average and
higher than licensure rates in any of the four rural comparison states. In part, this
reflects the state’s demographics, as the percentage of the population that is under
16 is lower in Vermont than in any of the comparison states.
Figure 2-3. Per Capita Licensure, 2015 (FHWA, 2016; USCB, 2017)
0
0.2
0.4
0.6
0.8
1
National ComparisonState Average
VT ME ND SD WV

The Vermont Transportation Energy Profile — 2017
9
2.1.2 Trip Chaining
Travelers’ propensity for trip chaining is an additional determinant of VMT. Within
the transportation field, a trip is defined as a single leg of a journey, with a discrete
beginning and end. Traveling from home to work or from home to a store each
constitutes a single trip. Trip chaining occurs when multiple trips are combined in a
single journey. Traveling from work to the store to home is considered a single
journey that chains together two trips. Trip chaining frequently results in fewer
miles traveled than completing each trip independently. One method for tracking
the frequency of trip chaining is to look at the percentage of trips that end at home.
A reduction in the proportion of trips ending at home may indicate an increase in
trip chaining. The distribution of trip destinations by Vermonters for all modes in
2009 is shown in Figure 2-4. This Profile establishes a baseline for trip chaining for
use in future reports.
Figure 2-4. Distribution of Trip Purpose or Destination for Vermonters, 2009 (USDOT, 2010)
2.1.3 Car-Sharing Services
Vehicle-sharing organizations provide an alternative to personal vehicle ownership
and are gaining popularity in Vermont. The net impact of car sharing on VMT is not
yet known (Lovejoy et al., 2013). Researchers have alternatively suggested either
that car sharing may increase VMT by giving non-car-owners access to a vehicle, or
that it may decrease VMT by reducing overall car ownership rates. Several recent
studies suggest that car sharing programs reduce overall car ownership rates,
especially in urban areas (Martin, Shaheen, and Lidicker 2010; Clewlow 2016), and
also produce a net decrease in VMT and GHG emissions (Shaheen and Cohen 2013),
though the extent to which these impacts relate to self-selection among car share
members has not yet been determined (Clewlow 2016).
Two car-sharing services operate in Vermont. CarShare Vermont currently has a
total of 18 vehicles at locations in Burlington, Winooski, and Montpelier
(CarShareVT.org). ZipCar, a national for-profit car-sharing outfit, has a total of five

The Vermont Transportation Energy Profile — 2017
10
vehicles located on the campuses of Middlebury College, Norwich University, and
Vermont Law School (http://www.zipcar.com/cities). Person-to-person (P2P) car-
sharing services, such as RelayRides, provide web-based options to search for
privately owned vehicles available for hourly or daily rental.
2.2 Mode Share
Mode share refers to the proportion of all trips taken with a specific mode (e.g.
private automobile, transit, or active transportation). It is commonly measured
using travel surveys such as the NHTS. As shown in Figure 2-5, motorized modes,
especially personal automobiles, were the dominant mode of travel reported by
Vermonters in the 2009 NHTS. According to these data, cars, SUVs, trucks, and
vans accounted for nearly 85% of all Vermonters’ trips. Notably, nearly half of these
vehicle trips take place in larger, generally less energy-efficient vehicles—SUVs,
light trucks, and vans. Further discussion of Vermont’s privately owned vehicle
fleet is provided in Section 3. Active transportation—walking and biking—
accounted for 12% of all trips in the NHTS data set.
In addition to the NHTS, mode share data specifically for commute trips have been
collected in the ACS and in the VTrans LRTPS (RSG, 2016). Mode share for
commuting trips is discussed in Section 2.2.1.
VERMONT MODE SHARE
Definition: Mode share measures how people travel from location to location—that is, the proportion of trips that are made by private vehicle, public transit, active transport, or other means. Mode share is important for determining the overall energy efficiency of travel. Some modes, such as walking or taking a bus with high ridership, are considerably more energy efficient than others, notably SOV trips.
Status: The overwhelming majority of trips in Vermont, nearly 85%, are taken in passenger vehicles. However, Vermont’s SOV commute rate is below that of the comparison states, reflecting higher rates of biking and walking by Vermont commuters than by commuters in ME, ND, SD, and WV. Since 2009, SOV commute mode share has increased by 1.4% and carpooling has declined by an equivalent amount. Transit, walking, and biking commute mode shares have remained relatively stable over this period.
Figure 2-5. Vermonters’ Mode Share, 2009 (USDOT, 2010)
The Vermont Transportation Energy Profile — 2017
11
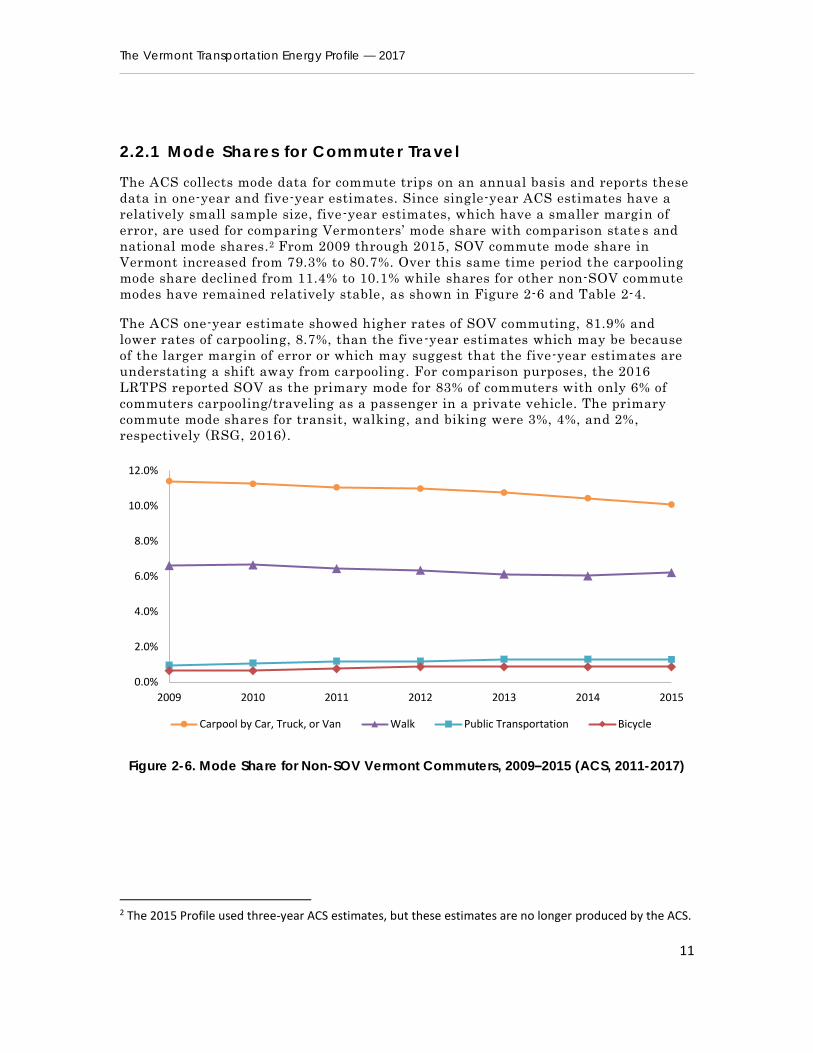
2.2.1 Mode Shares for Commuter Travel
The ACS collects mode data for commute trips on an annual basis and reports these
data in one-year and five-year estimates. Since single-year ACS estimates have a
relatively small sample size, five-year estimates, which have a smaller margin of
error, are used for comparing Vermonters’ mode share with comparison state s and
national mode shares.2 From 2009 through 2015, SOV commute mode share in
Vermont increased from 79.3% to 80.7%. Over this same time period the carpooling
mode share declined from 11.4% to 10.1% while shares for other non-SOV commute
modes have remained relatively stable, as shown in Figure 2-6 and Table 2-4.
The ACS one-year estimate showed higher rates of SOV commuting, 81.9% and
lower rates of carpooling, 8.7%, than the five-year estimates which may be because
of the larger margin of error or which may suggest that the five-year estimates are
understating a shift away from carpooling. For comparison purposes, the 2016
LRTPS reported SOV as the primary mode for 83% of commuters with only 6% of
commuters carpooling/traveling as a passenger in a private vehicle. The primary
commute mode shares for transit, walking, and biking were 3%, 4%, and 2%,
respectively (RSG, 2016).
Figure 2-6. Mode Share for Non-SOV Vermont Commuters, 2009–2015 (ACS, 2011-2017)
2 The 2015 Profile used three-year ACS estimates, but these estimates are no longer produced by the ACS.
0.0%
2.0%
4.0%
6.0%
8.0%
10.0%
12.0%
2009 2010 2011 2012 2013 2014 2015
Carpool by Car, Truck, or Van Walk Public Transportation Bicycle
The Vermont Transportation Energy Profile — 2017
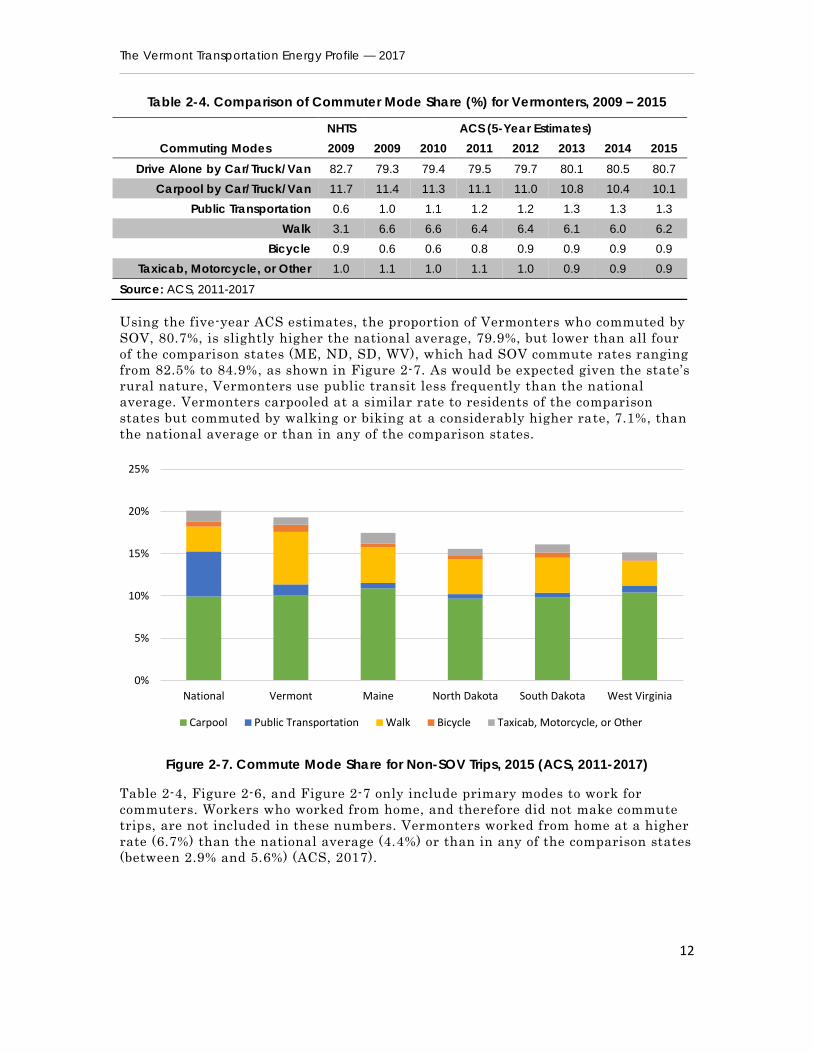
12
Table 2-4. Comparison of Commuter Mode Share (%) for Vermonters, 2009 – 2015
NHTS ACS (5-Year Estimates)
Commuting Modes 2009 2009 2010 2011 2012 2013 2014 2015
Drive Alone by Car/Truck/Van 82.7 79.3 79.4 79.5 79.7 80.1 80.5 80.7
Carpool by Car/Truck/Van 11.7 11.4 11.3 11.1 11.0 10.8 10.4 10.1
Public Transportation 0.6 1.0 1.1 1.2 1.2 1.3 1.3 1.3
Walk 3.1 6.6 6.6 6.4 6.4 6.1 6.0 6.2
Bicycle 0.9 0.6 0.6 0.8 0.9 0.9 0.9 0.9
Taxicab, Motorcycle, or Other 1.0 1.1 1.0 1.1 1.0 0.9 0.9 0.9
Source: ACS, 2011-2017
Using the five-year ACS estimates, the proportion of Vermonters who commuted by
SOV, 80.7%, is slightly higher the national average, 79.9%, but lower than all four
of the comparison states (ME, ND, SD, WV), which had SOV commute rates ranging
from 82.5% to 84.9%, as shown in Figure 2-7. As would be expected given the state’s
rural nature, Vermonters use public transit less frequently than the national
average. Vermonters carpooled at a similar rate to residents of the comparison
states but commuted by walking or biking at a considerably higher rate, 7.1%, than
the national average or than in any of the comparison states.
Figure 2-7. Commute Mode Share for Non-SOV Trips, 2015 (ACS, 2011-2017)
Table 2-4, Figure 2-6, and Figure 2-7 only include primary modes to work for
commuters. Workers who worked from home, and therefore did not make commute
trips, are not included in these numbers. Vermonters worked from home at a higher
rate (6.7%) than the national average (4.4%) or than in any of the comparison states
(between 2.9% and 5.6%) (ACS, 2017).
0%
5%
10%
15%
20%
25%
National Vermont Maine North Dakota South Dakota West Virginia
Carpool Public Transportation Walk Bicycle Taxicab, Motorcycle, or Other

The Vermont Transportation Energy Profile — 2017
13
2.2.2 Energy Intensity by Mode
Shifting travel to modes with lower energy intensities is one method for reducing
energy use in transportation. Energy intensity can be considered at either the
vehicle level or the passenger level. Vehicle energy intensity measures how many
Btus are required to move a vehicle one mile without adjusting for the number of
passengers it carries. Passenger energy intensity measures the energy used to move
each passenger one mile. An inverse relationship exists between occupancy and
passenger energy intensity—the higher the occupancy, the lower the passenger
energy intensity. For many applications, passenger energy intensity provides a
more useful measure of energy efficiency than does vehicle efficiency.
Figure 2-8 shows U.S. DOE estimates of vehicle and passenger energy intensity for
several commonly used motorized modes (Davis et al., 2016). In Figure 2-8,
passenger energy intensity is calculated using national average occupancy rates for
rail, air, transit buses, and demand-response transit. Passenger energy-intensities
for cars and light-duty trucks are calculated with both one and two occupants as
well as for average occupancy to illustrate the impact of increased vehicle occupancy
on passenger energy intensity. After demand-response transit, which frequently
uses larger vehicles and has a low average occupancy rate, SOV trips in light-duty
trucks and passenger cars have the highest energy intensity of the modes shown
here. Policies aimed at reducing transportation energy use in Vermont may be able
to achieve this objective by promoting mode shifting and increases in average
vehicle occupancy rates. Shifting vehicle trips to vehicle types with lower energy
intensity will also reduce energy use and is discussed in Section 3.2.1.
Figure 2-8. Energy Intensities of Common Transport Modes (Davis et al., 2016)

The Vermont Transportation Energy Profile — 2017
14
2.3 Vehicle Occupancy
Vehicle occupancy rates measure the average number of vehicle occupants per
vehicle trip. Vehicle occupancy is an important component of transportation energy
intensity, as described in Section 2.2.2. Increasing vehicle occupancy decreases the
per passenger energy intensity per mile traveled. Generally, increasing vehicle
occupancy also results in lower total VMT.
Occupancy data are generally collected via travel surveys. The most recent survey
to collect vehicle occupancy data for Vermont was the 2009 NHTS. Vehicle
occupancy rates from the NHTS are summarized for Vermont, the nation , and the
four comparison states in Table 2-4. Vehicle occupancy is generally lower for trips
that take place entirely in-state than for trips that include travel in other states or
Canada. Trips to work have the lowest occupancy rates of all trip types. Trips for
meals and social or recreational purposes as well as trips to transport another
individual, which by definition included multiple people per vehicle, have the
highest vehicle occupancy rates (USDOT, 2010).
Table 2-5. Average Vehicle Occupancy, 2009
Average Vehicle Occupancy
National 1.67
Vermont 1.57
Maine 1.54
North Dakota 1.70
South Dakota 1.73
West Virginia 1.41
Source: USDOT, 2010.
VERMONT VEHICLE OCCUPANCY
Definition: Vehicle occupancy rates are a measure of the average number vehicle occupants per vehicle trip. Increasing vehicle occupancy can decrease VMT and the per passenger energy intensity of travel.
Status: Vehicle occupancy data are collected by travel surveys such as the NHTS. As of 2009, Vermonters’ averaged a vehicle occupancy rate of 1.57 people per vehicle, below the national average of 1.67. The loss of carpooling commute mode share may indicate that Vermont’s vehicle occupancy rate has declined since then. Trends in vehicle occupancy will be reported in future Profiles as new survey data becomes available.
New Factors: The State has undertaken several initiatives to increase carpooling, and thus vehicle occupancy rates, since 2009, including expanding park-and-ride coverage and the Go! Vermont program. Since 2012, over 1,100 new parking spaces have been added to state and municipal park-and-rides. In the same time frame, Go! Vermont has registered 5,207 commuters for carpools and vanpools. The impact of these initiatives on vehicle occupancy rates is not yet known, though evidence from the ACS suggests carpooling may be falling in spite of these efforts.

The Vermont Transportation Energy Profile — 2017
15
2.3.1 Carpooling Incentives
According to NHTS and ACS data, carpooling rates in the U.S. have steadily
declined from 20% in 1980 to its current estimated level of 10%. This 30-year
decline may be attributable to a number of factors such as rising rates of vehicle
ownership, declining household size, sustained low fuel prices , and an increase in
suburban settlement patterns. In 2008, the state of Vermont established Go!
Vermont, a carpooling initiative designed to reduce single-occupancy trips by
encouraging higher rates of carpooling, transit use, biking, and walking. This
initiative includes a website to link potential carpool participants and provide
information for those seeking to share rides to work, meetings, and conferences.
Results of Go! Vermont activities are summarized in Table 2-6.
Table 2-6. Go! Vermont Program Benefits, SFY 2017
Tracking Metric SFY 2012-2015 SFY 2016 SFY 2017
Registered Commuters 3455 943 811
Rides Posted 4224 970 837
Vanpools 19 14 11
Total Estimated Reduction of VMT 16,466,000 3,085,636 2,453,499
Estimated Commute Cost Savings $9,276,000 $1,681,814 $1,338,524
Source: McDonald, 2017
2.3.2 Park-and-Ride Facilities
Park-and-ride facilities provide safe, no-cost parking spaces for those who carpool or
ride the bus. Currently, the state operates 30 park-and-ride sites with
approximately 1,525 total spaces (see Table 2-7), while individual municipalities
maintain an additional 65 sites with a total of approximately 1,293 spaces (see
Table 2-8). Overall, the number of park-and-ride parking spaces has increased by
67% since 2012. In addition, park-and-ride facilities at both the state and municipal
levels are considerably more likely to function as multi-modal hubs by including
connections to transit and bicycle parking. Charging facilities for plug-in electric
vehicles (PEVs) are also starting to be installed at park-and-rides.
Table 2-7. State Park-and-Ride Facilities in Vermont (2012 – 2017)
Number of State: 2012 2015 2017
Park-and-Rides 25 29 30
Parking Spaces (approximate) 1,140 1,380 1,525
Facilities with Bike Racks 11 20 30
Facilities with Transit Connection 3 19 21
Facilities with Paved Surface 17 24 26
Facilities Lighted 18 24 28
Facilities with PEV Charging 0 1 5
Source: Davis, 2017

The Vermont Transportation Energy Profile — 2017
16
Table 2-8. Municipal Park-and-Ride Facilities in Vermont, (2012 – 2017)
Number of Municipal: 2012 2015 2017
Park-and-Rides 26 53 65
Parking Spaces (approximate) 550 1,012 1,293
Facilities with Bike Racks 2 19 22
Facilities with Transit Connection 9 20 22
Facilities with Paved Surface 20 42 52
Facilities Lighted 18 37 49
Facilities with PEV Charging 0 0 3
Source: VTrans, 2017
2.4 Active Transport
Active transportation – primarily walking and biking – has a very low energy
intensity and, consequently, replacing vehicle trips with these modes can help
reduce transportation energy use and GHG emissions. Of the nearly 10,800 unique
trips recorded in the 2009 Vermont NHTS data set, 39% are less than two miles and
28% are less than one mile. Roughly 87% of the trips shorter than two miles were
made by motor vehicle, suggesting an opportunity for increasing active
transportation trips. The CEP includes an objective of increase the share of
commute trips completed by walking or biking to 15.6% of all commute trips.
To better understand the role of active transportation in the State, VTrans and the
University of Vermont Transportation Research Center are collaborating to create a
data portal to facilitate sharing bicycle and pedestrian counts among local, regional
and state agencies. Because walking and biking count data are still not collected as
widely as vehicle count data, travel surveys remain the best source of biking and
walking data. The 2009 NHTS and the 2016 LRTPS both provide indications of the
level of biking and walking in Vermont. Because the trip frequency estimates in
these surveys are not collected as part of travel diaries that also capture the total
number of trips taken, they cannot be used to calculate mode share. Nonetheless,
they can provide some indication of biking and walking patterns in Vermont.
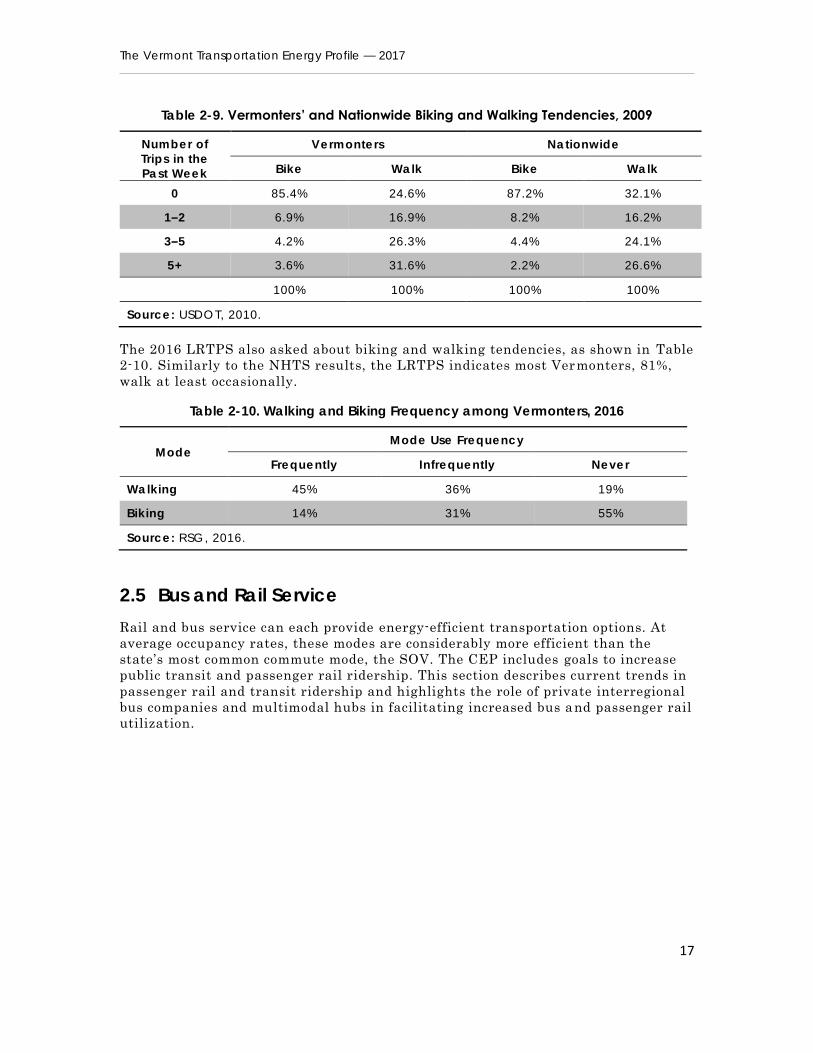
The active transportation tendencies of Vermonters, as reported in the 2009 NHTS,
are shown in Table 2-9. Active transportation rates in Vermont are similar to those
found nationally. Approximately 14% of Vermonters in the data set had taken at
least one bike trip and 75% had taken at least one walking trip within the previous
week.
The Vermont Transportation Energy Profile — 2017
17
Table 2-9. Vermonters’ and Nationwide Biking and Walking Tendencies, 2009
Number of
Trips in the
Past Week
Vermonters Nationwide
Bike Walk Bike Walk
0 85.4% 24.6% 87.2% 32.1%
1–2 6.9% 16.9% 8.2% 16.2%
3–5 4.2% 26.3% 4.4% 24.1%
5+ 3.6% 31.6% 2.2% 26.6%
100% 100% 100% 100%
Source: USDOT, 2010.
The 2016 LRTPS also asked about biking and walking tendencies, as shown in Table
2-10. Similarly to the NHTS results, the LRTPS indicates most Vermonters, 81%,
walk at least occasionally.
Table 2-10. Walking and Biking Frequency among Vermonters, 2016
Mode Mode Use Frequency
Frequently Infrequently Never
Walking 45% 36% 19%
Biking 14% 31% 55%
Source: RSG, 2016.
2.5 Bus and Rail Service
Rail and bus service can each provide energy-efficient transportation options. At
average occupancy rates, these modes are considerably more efficient than the
state’s most common commute mode, the SOV. The CEP includes goals to increase
public transit and passenger rail ridership. This section describes current trends in
passenger rail and transit ridership and highlights the role of private interregional
bus companies and multimodal hubs in facilitating increased bus and passenger rail
utilization.

The Vermont Transportation Energy Profile — 2017
18
2.5.1 Public Transit Ridership
As noted in the Public Transit Route Performance Reviews (KFH Group 2017), the
organization of Vermont’s public transit system has changed substantially in recent
years. The Chittenden
County Transportation
Authority (CCTA) and Green
Mountain Transit Agency
(GMTA) merged in 2011, and
the merged entity began
operating as Green
Mountain Transit (GMT) in
2016. In 2015, the Deer
Valley Regional Transit
Association assumed the
assets of Connecticut River
Transit and now operates as
Southeast Vermont Transit
(SEVT). Transit service
territories are shown in
Figure 2-9. The Profile
reports on transit ridership
for 10 transit divisions, see
Table 2-11, as well as on
volunteer driver services
provided by the Vermont
Association for the Blind
and Visually Impaired
(VABVI) and intercity bus
routes operated by
Greyhound and Vermont
Translines. Greyhound and
Vermont Transline data is
included only for routes that
receive financial assistance
from VTrans.
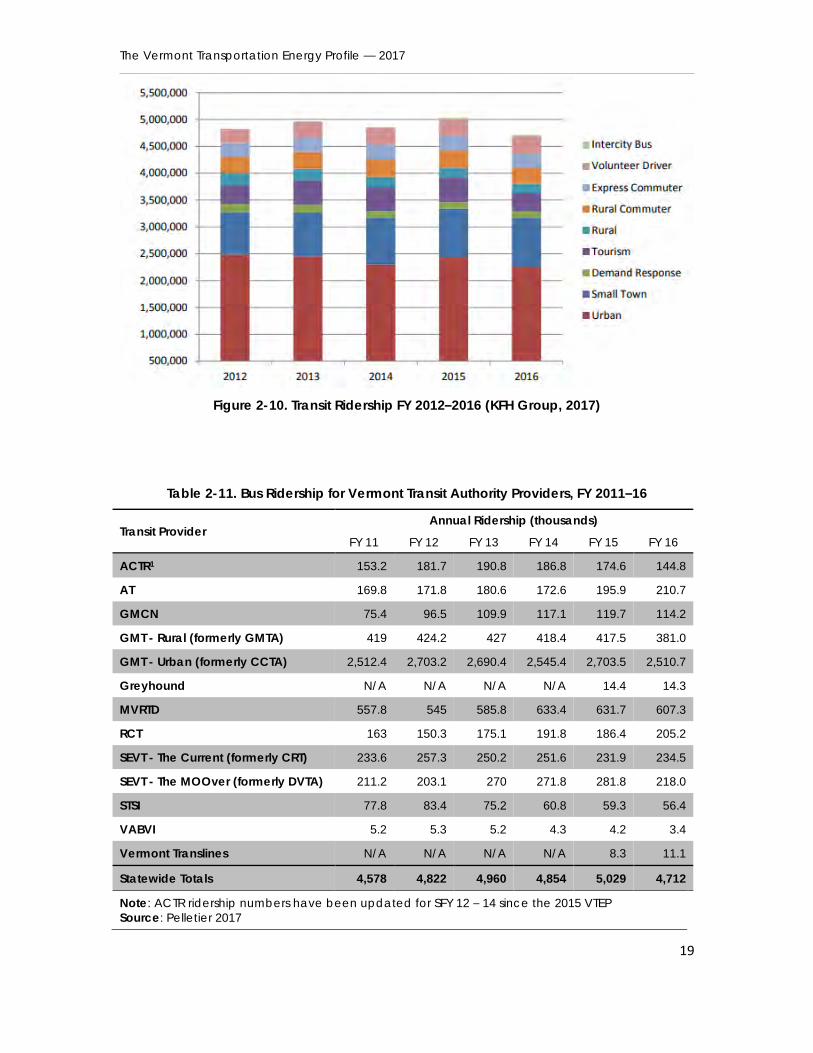
In SFY 2016, total public transit ridership was measured at 4.7 million passenger
boardings, as shown in Table 2-11. Figure 2-10 shows the trend in transit ridership,
across all trip types, from SFY 2012 through SFY 2016. Overall, transit ridership
increased from SFY 2012 through SFY 2015 but declined by 6% in SFY 2016 . This
decline is primarily attributable to a drop in ridership of seasonal routes serving
tourist destinations due to the poor 2015/2016 ski season (KFH Group, 2017).
Figure 2-9. Transit Service Providers (KFH Group, 2017)
The Vermont Transportation Energy Profile — 2017
19
Figure 2-10. Transit Ridership FY 2012–2016 (KFH Group, 2017)
Table 2-11. Bus Ridership for Vermont Transit Authority Providers, FY 2011–16
Transit Provider Annual Ridership (thousands)
FY 11 FY 12 FY 13 FY 14 FY 15 FY 16
ACTR1 153.2 181.7 190.8 186.8 174.6 144.8
AT 169.8 171.8 180.6 172.6 195.9 210.7
GMCN 75.4 96.5 109.9 117.1 119.7 114.2
GMT - Rural (formerly GMTA) 419 424.2 427 418.4 417.5 381.0
GMT - Urban (formerly CCTA) 2,512.4 2,703.2 2,690.4 2,545.4 2,703.5 2,510.7
Greyhound N/A N/A N/A N/A 14.4 14.3
MVRTD 557.8 545 585.8 633.4 631.7 607.3
RCT 163 150.3 175.1 191.8 186.4 205.2
SEVT - The Current (formerly CRT) 233.6 257.3 250.2 251.6 231.9 234.5
SEVT - The MOOver (formerly DVTA) 211.2 203.1 270 271.8 281.8 218.0
STSI 77.8 83.4 75.2 60.8 59.3 56.4
VABVI 5.2 5.3 5.2 4.3 4.2 3.4
Vermont Translines N/A N/A N/A N/A 8.3 11.1
Statewide Totals 4,578 4,822 4,960 4,854 5,029 4,712
Note: ACTR ridership numbers have been updated for SFY 12 – 14 since the 2015 VTEP
Source: Pelletier 2017
The Vermont Transportation Energy Profile — 2017
20
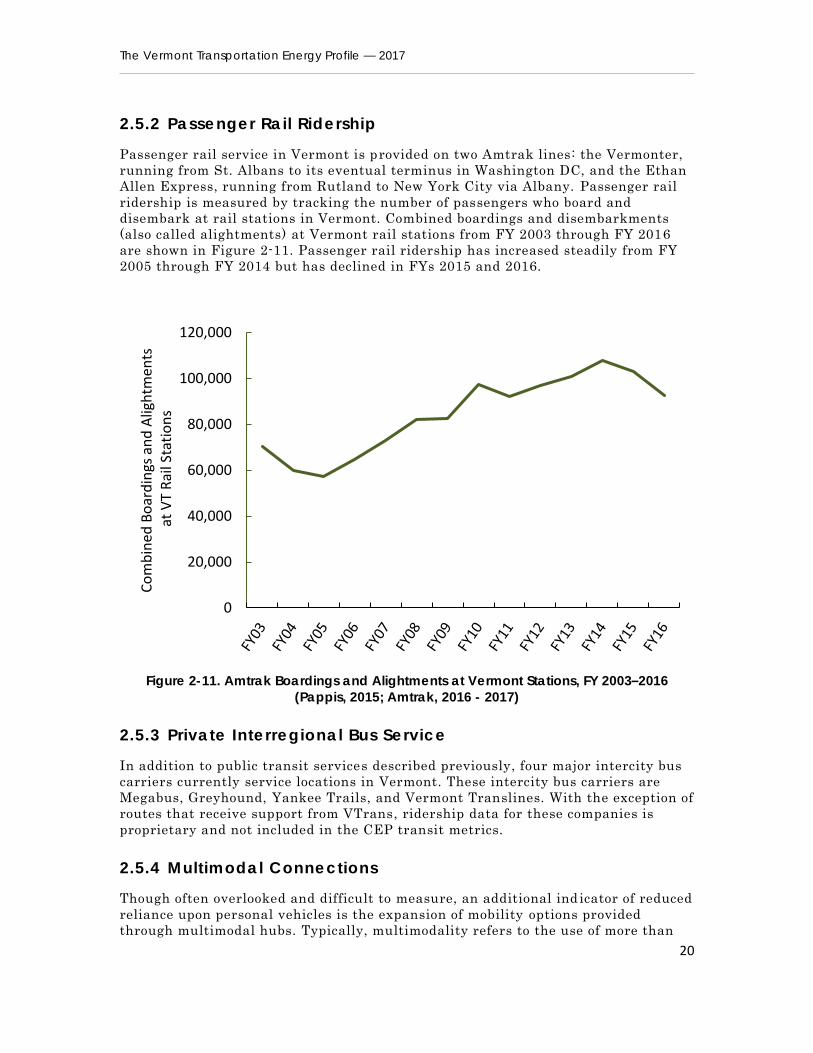
2.5.2 Passenger Rail Ridership
Passenger rail service in Vermont is provided on two Amtrak lines: the Vermonter,
running from St. Albans to its eventual terminus in Washington DC, and the Ethan
Allen Express, running from Rutland to New York City via Albany. Passenger rail
ridership is measured by tracking the number of passengers who board and
disembark at rail stations in Vermont. Combined boardings and disembarkments
(also called alightments) at Vermont rail stations from FY 2003 through FY 2016
are shown in Figure 2-11. Passenger rail ridership has increased steadily from FY
2005 through FY 2014 but has declined in FYs 2015 and 2016.
Figure 2-11. Amtrak Boardings and Alightments at Vermont Stations, FY 2003–2016
(Pappis, 2015; Amtrak, 2016 - 2017)
2.5.3 Private Interregional Bus Service
In addition to public transit services described previously, four major intercity bus
carriers currently service locations in Vermont. These intercity bus carriers are
Megabus, Greyhound, Yankee Trails, and Vermont Translines. With the exception of
routes that receive support from VTrans, ridership data for these companies is
proprietary and not included in the CEP transit metrics.
2.5.4 Multimodal Connections
Though often overlooked and difficult to measure, an additional ind icator of reduced
reliance upon personal vehicles is the expansion of mobility options provided
through multimodal hubs. Typically, multimodality refers to the use of more than
0
20,000
40,000
60,000
80,000
100,000
120,000
Co
mb
ined
Bo
ard
ings
an
d A
ligh
tmen
tsat
VT
Rai
l Sta
tio
ns
The Vermont Transportation Energy Profile — 2017
21
one mode in travel along a journey. From an energy-use perspective, the ability to
access multiple modes along a journey increases the potential for reducing the use
of the highest energy intensity modes of travel by shifting part of the trip to a less
energy-intensive mode. Multimodal facilitation is an evolving priority within
Vermont’s transportation infrastructure.
Park-and-ride facilities are, by nature, multimodal because they facilitate shifts
from automobiles to transit buses or from an SOV to a multi -passenger vehicle. As
discussed previously, an increasing number of park-and-rides offer transit
connections and bicycle parking, increasing their value as multimodal hubs. Co-
locating bus lines at rail stops and airports is another example of the creation of
multimodal hubs, providing options for the first leg of a passenger rail or airplane
trip. Many CCTA buses are equipped with bike racks for their riders, allowing for
the combination of biking and bus transit on a trip. Bike boardings may be a trend
that can be tracked statewide if other transit providers equip their buses wi th bike
racks.
The Vermont Transportation Energy Profile — 2017
22
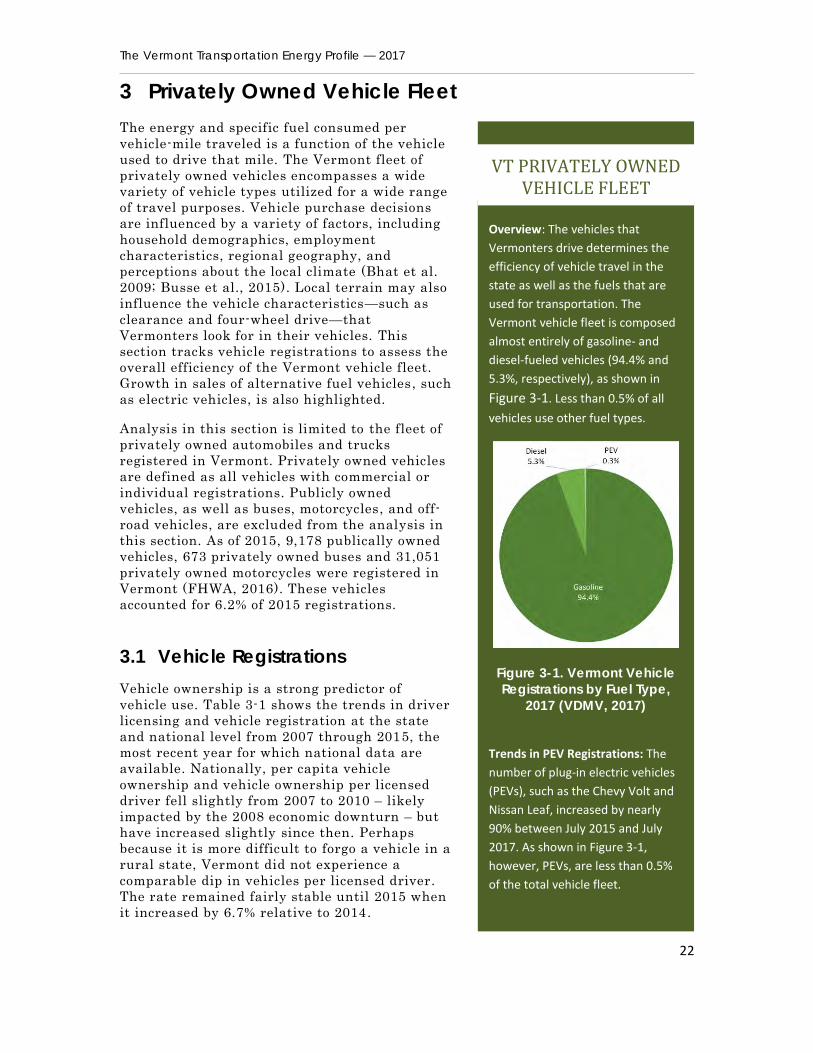
Overview: The vehicles that
Vermonters drive determines the
efficiency of vehicle travel in the
state as well as the fuels that are
used for transportation. The
Vermont vehicle fleet is composed
almost entirely of gasoline- and
diesel-fueled vehicles (94.4% and
5.3%, respectively), as shown in
Figure 3-1. Less than 0.5% of all
vehicles use other fuel types.
Figure 3-1. Vermont Vehicle
Registrations by Fuel Type,
2017 (VDMV, 2017)
Trends in PEV Registrations: The
number of plug-in electric vehicles
(PEVs), such as the Chevy Volt and
Nissan Leaf, increased by nearly
90% between July 2015 and July
2017. As shown in Figure 3-1,
however, PEVs, are less than 0.5%
of the total vehicle fleet.
VT PRIVATELY OWNED VEHICLE FLEET
3 Privately Owned Vehicle Fleet
The energy and specific fuel consumed per
vehicle-mile traveled is a function of the vehicle
used to drive that mile. The Vermont fleet of
privately owned vehicles encompasses a wide
variety of vehicle types utilized for a wide range
of travel purposes. Vehicle purchase decisions
are influenced by a variety of factors, including
household demographics, employment
characteristics, regional geography, and
perceptions about the local climate (Bhat et al.
2009; Busse et al., 2015). Local terrain may also
influence the vehicle characteristics—such as
clearance and four-wheel drive—that
Vermonters look for in their vehicles. This
section tracks vehicle registrations to assess the
overall efficiency of the Vermont vehicle fleet.
Growth in sales of alternative fuel vehicles, such
as electric vehicles, is also highlighted.
Analysis in this section is limited to the fleet of
privately owned automobiles and trucks
registered in Vermont. Privately owned vehicles
are defined as all vehicles with commercial or
individual registrations. Publicly owned
vehicles, as well as buses, motorcycles, and off-
road vehicles, are excluded from the analysis in
this section. As of 2015, 9,178 publically owned
vehicles, 673 privately owned buses and 31,051
privately owned motorcycles were registered in
Vermont (FHWA, 2016). These vehicles
accounted for 6.2% of 2015 registrations.
3.1 Vehicle Registrations
Vehicle ownership is a strong predictor of
vehicle use. Table 3-1 shows the trends in driver
licensing and vehicle registration at the state
and national level from 2007 through 2015, the
most recent year for which national data are
available. Nationally, per capita vehicle
ownership and vehicle ownership per licensed
driver fell slightly from 2007 to 2010 – likely
impacted by the 2008 economic downturn – but
have increased slightly since then. Perhaps
because it is more difficult to forgo a vehicle in a
rural state, Vermont did not experience a
comparable dip in vehicles per licensed driver.
The rate remained fairly stable until 2015 when
it increased by 6.7% relative to 2014.
The Vermont Transportation Energy Profile — 2017
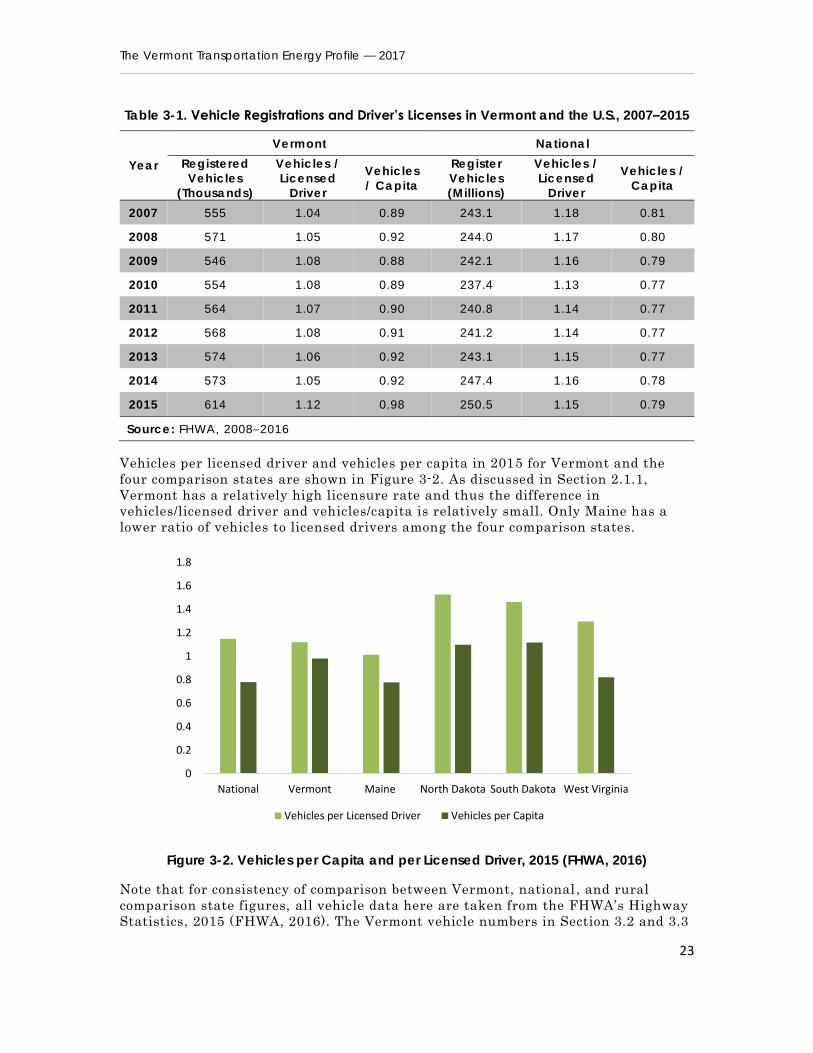
23
Table 3-1. Vehicle Registrations and Driver’s Licenses in Vermont and the U.S., 2007–2015
Year
Vermont National
Registered
Vehicles
(Thousands)
Vehicles /
Licensed
Driver
Vehicles
/ Capita
Register
Vehicles
(Millions)
Vehicles /
Licensed
Driver
Vehicles /
Capita
2007 555 1.04 0.89 243.1 1.18 0.81
2008 571 1.05 0.92 244.0 1.17 0.80
2009 546 1.08 0.88 242.1 1.16 0.79
2010 554 1.08 0.89 237.4 1.13 0.77
2011 564 1.07 0.90 240.8 1.14 0.77
2012 568 1.08 0.91 241.2 1.14 0.77
2013 574 1.06 0.92 243.1 1.15 0.77
2014 573 1.05 0.92 247.4 1.16 0.78
2015 614 1.12 0.98 250.5 1.15 0.79
Source: FHWA, 2008–2016
Vehicles per licensed driver and vehicles per capita in 2015 for Vermont and the
four comparison states are shown in Figure 3-2. As discussed in Section 2.1.1,
Vermont has a relatively high licensure rate and thus the difference in
vehicles/licensed driver and vehicles/capita is relatively small. Only Maine has a
lower ratio of vehicles to licensed drivers among the four comparison states.
Figure 3-2. Vehicles per Capita and per Licensed Driver, 2015 (FHWA, 2016)
Note that for consistency of comparison between Vermont, national , and rural
comparison state figures, all vehicle data here are taken from the FHWA’s Highway
Statistics, 2015 (FHWA, 2016). The Vermont vehicle numbers in Section 3.2 and 3.3
0
0.2
0.4
0.6
0.8
1
1.2
1.4
1.6
1.8
National Vermont Maine North Dakota South Dakota West Virginia
Vehicles per Licensed Driver Vehicles per Capita

The Vermont Transportation Energy Profile — 2017
24
are directly from the Vermont DMV data and vary with respect to the FHWA data
by as much as 4%. Vermont DMV data also show an increase in vehicles per licensed
driver between 2013 and 2015, but it is slightly smaller than that shown in the
FHWA data.
3.2 Vehicle Type
The vehicle fleet can be characterized by the type of fuel or propulsion system that
powers it as well as by vehicle body type. As shown in Table 3-2, the Vermont fleet
is dominated by conventionally powered vehicles, running on either gasoline or
diesel. While gasoline internal combustion engine vehicles (ICEVs) are by far the
most common vehicles registered in Vermont, gasoline-powered hybrid electric
vehicles (HEVs) such as the Toyota Prius, plug-in hybrid electric vehicles (PHEVs)
such as the Chevy Volt, and all-electric vehicles (AEVs) such as the Nissan Leaf
have all grown in popularity. PHEVs and AEVs, collectively known as PEVs, derive
some or all of their energy from electricity, helping to reduce the amount of
petroleum-based fuels used for transportation. HEVs are powered entirely by
gasoline but tend to have significantly better fuel efficiency than comparable ICEVs
and thus also help reduce transportation energy use.
Table 3-2. Vehicles Registered in Vermont by Fuel Type, 2008–2017
Year PEV Propane/
CNG Diesel
Gasoline
AEV PHEV ICEV HEV
2008 NA NA 75 32,140 578,881 4,656
2009 NA NA 69 30,724 528,930 5,473
2010 NA NA 59 25,932 524,810 5,877
2011 NA NA 51 28,513 550,711 7,056
2012 48 140 48 38,684 541,872 7,693
2013 130 466 43 28,209 516,339 7,945
2014 197 670 43 29,879 525,199 9,242
2015 248 865 44 31,239 533,118 9,895
2016 330 1,192 43 31,213 533,021 10,676
20171 381 1,387 47 30,205 532,370 10,901
1 2017 data through June 30th, data for all other years through December 31st.
Sources: VDMV, 2017; Drive Electric Vermont, 2017.
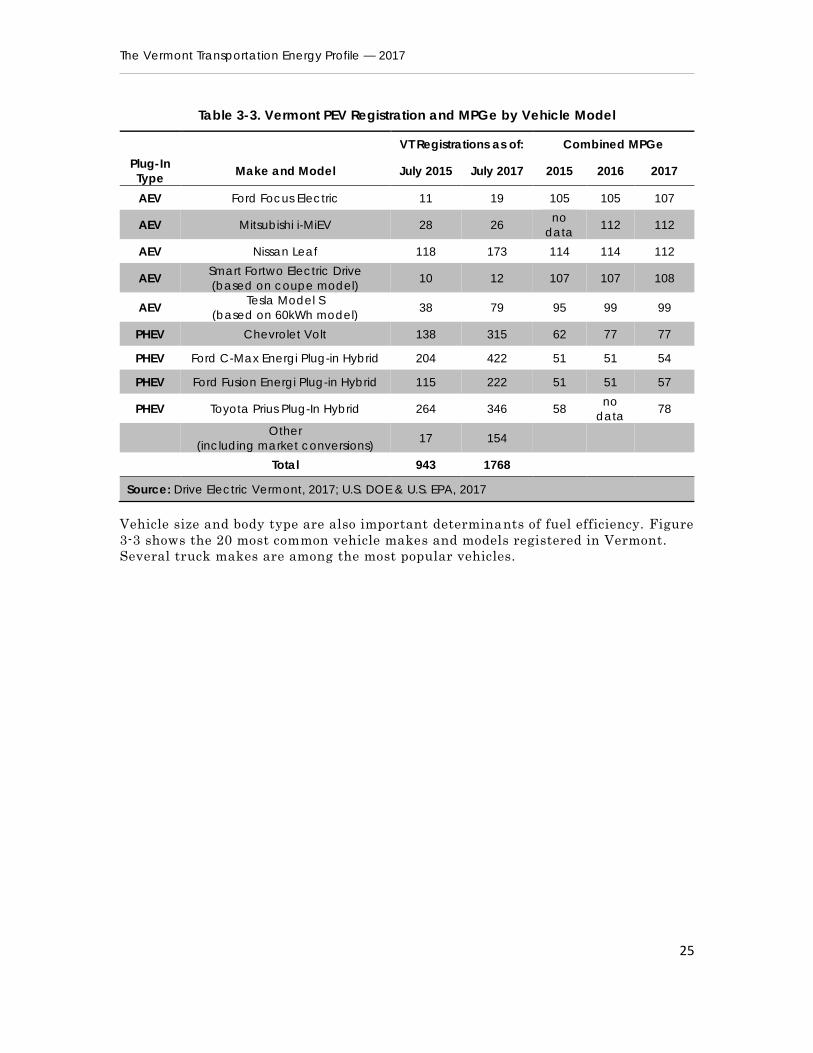
A breakdown of the most popular PEV models registered in Vermont and the
efficiency of the vehicles measured in mile per gallon equivalent (MPGe) is provided
in Table 3-3. MPGe is used to compare the energy use of PEVs to conventional
gasoline vehicles. The efficiency of the most popular PHEVs in Vermont ranges from
51 – 78 MPGe. As of the 2017 model year, the lowest MPGe of the AEVs in Table 3-3
is 99.
The Vermont Transportation Energy Profile — 2017
25
Table 3-3. Vermont PEV Registration and MPGe by Vehicle Model
VT Registrations as of: Combined MPGe
Plug-In
Type Make and Model July 2015 July 2017 2015 2016 2017
AEV Ford Focus Electric 11 19 105 105 107
AEV Mitsubishi i-MiEV 28 26 no
data 112 112
AEV Nissan Leaf 118 173 114 114 112
AEV Smart Fortwo Electric Drive
(based on coupe model) 10 12 107 107 108
AEV Tesla Model S
(based on 60kWh model) 38 79 95 99 99
PHEV Chevrolet Volt 138 315 62 77 77
PHEV Ford C-Max Energi Plug-in Hybrid 204 422 51 51 54
PHEV Ford Fusion Energi Plug-in Hybrid 115 222 51 51 57
PHEV Toyota Prius Plug-In Hybrid 264 346 58 no
data 78
Other
(including market conversions) 17 154
Total 943 1768
Source: Drive Electric Vermont, 2017; U.S. DOE & U.S. EPA, 2017
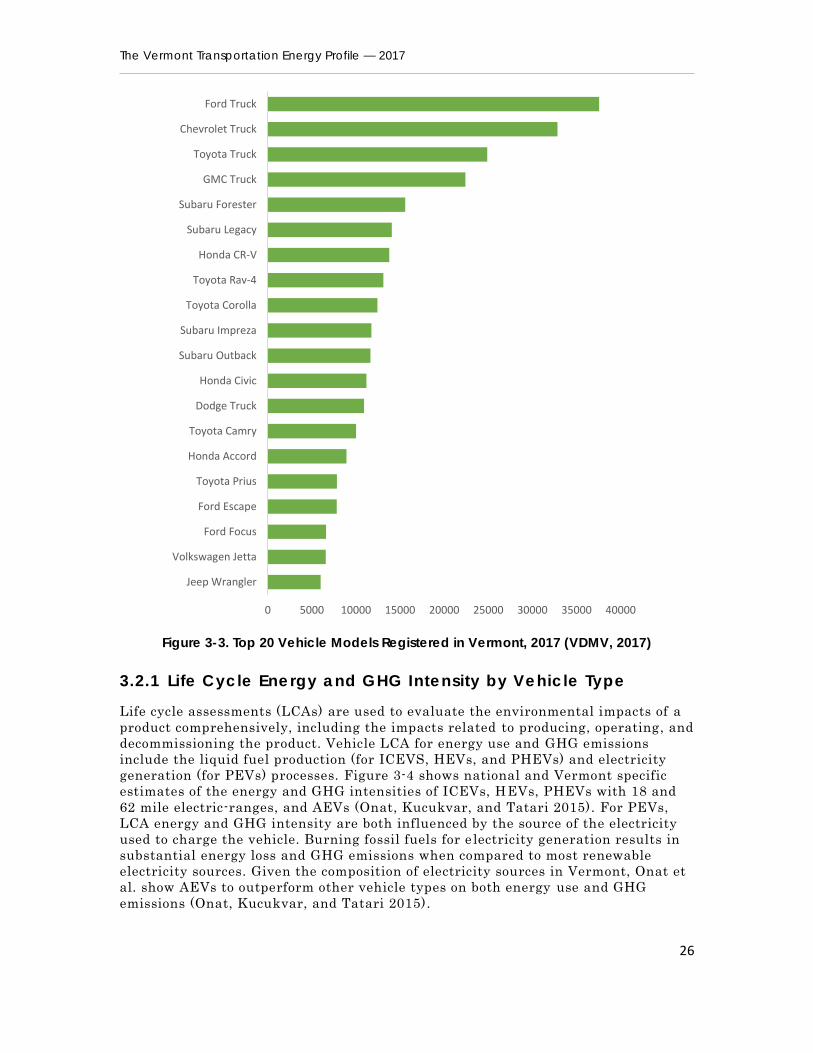
Vehicle size and body type are also important determinants of fuel efficiency. Figure
3-3 shows the 20 most common vehicle makes and models registered in Vermont.
Several truck makes are among the most popular vehicles.
The Vermont Transportation Energy Profile — 2017
26
Figure 3-3. Top 20 Vehicle Models Registered in Vermont, 2017 (VDMV, 2017)
3.2.1 Life Cycle Energy and GHG Intensity by Vehicle Type
Life cycle assessments (LCAs) are used to evaluate the environmental impacts of a
product comprehensively, including the impacts related to producing, operating, and
decommissioning the product. Vehicle LCA for energy use and GHG emissions
include the liquid fuel production (for ICEVS, HEVs, and PHEVs) and electricity
generation (for PEVs) processes. Figure 3-4 shows national and Vermont specific
estimates of the energy and GHG intensities of ICEVs, HEVs, PHEVs with 18 and
62 mile electric-ranges, and AEVs (Onat, Kucukvar, and Tatari 2015). For PEVs,
LCA energy and GHG intensity are both influenced by the source of the electricity
used to charge the vehicle. Burning fossil fuels for e lectricity generation results in
substantial energy loss and GHG emissions when compared to most renewable
electricity sources. Given the composition of electricity sources in Vermont, Onat et
al. show AEVs to outperform other vehicle types on both energy use and GHG
emissions (Onat, Kucukvar, and Tatari 2015).
0 5000 10000 15000 20000 25000 30000 35000 40000
Ford Truck
Chevrolet Truck
Toyota Truck
GMC Truck
Subaru Forester
Subaru Legacy
Honda CR-V
Toyota Rav-4
Toyota Corolla
Subaru Impreza
Subaru Outback
Honda Civic
Dodge Truck
Toyota Camry
Honda Accord
Toyota Prius
Ford Escape
Ford Focus
Volkswagen Jetta
Jeep Wrangler

The Vermont Transportation Energy Profile — 2017
27
Figure 3-4. WTW Energy and GHG Intensity (Onat et al., 215)
3.3 Fleet Age
Though new vehicles with increased fuel efficiency are being introduced rapidly into
the American market, the fuel-saving effect of these models is highly dependent
upon the turnover rate of vehicles in the current fleet. Figure 3-5 shows the
distribution of automobile and truck model years for the vehicles registered in
Vermont as of June 2017. Approximately 63% of Vermont’s registered vehicles were
manufactured in the last ten years. A decrease in the average age of the fleet is
likely to result in an improvement in the fuel economy of Vermont’s privately owned
vehicle fleet.

The Vermont Transportation Energy Profile — 2017
28
Figure 3-5. Distribution of Model Years for Vehicles in Vermont, 2017 (VDMV, 2017)
3.4 Fleet-Wide Fuel Economy
Vehicle fuel efficiency is a critical determinant of transportation energy use. Higher
fuel economy vehicles can provide comparable mobility benefits with lower energy
consumption than equivalent vehicles with lower fuel economy. The combined MPG
of vehicles registered in Vermont has increased by an average 0.3 combined MPG
per year from 2011 through the middle of 2017, as shown in Table 3-4. The values in
Table 3-4 were calculated by matching DMV vehicle registration data to EPA fuel
economy data available from FuelEconomy.gov. Because the DMV vehicle-make-
and-model data are manually recorded in abbreviated form, matching these records
to the EPA MPG data required identifying irregularities in the abbreviations used
and translating these abbreviations into the complete make-and-model names in the
FuelEconomy.gov data set. For instance, the Nissan Versa could be entered into the
DMV database with the make defined as NISS, and model defined as VSA or VRS.
Approximately 85% of the registered vehicles in the reported time period (2011-
2017) could be matched to MPG data. The remaining 15% of the vehicle fleet could
not be matched either because the vehicles were not in the FuelEconomy.gov data
set, which is only available for vehicle model years after 1984 and does not include
medium- and heavy-duty trucks, or because of anomalous make-and-model
abbreviations. Since older and heavier vehicles are less well represented in the
matched data set, the actual fuel economy of the Vermont fleet is likely lower than
the values shown here.
0
5000
10000
15000
20000
25000
30000
35000
40000
45000
50000
20
18
20
16
20
14
20
12
20
10
20
08
20
06
20
04
20
02
20
00
19
98
19
96
19
94
19
92
19
90
19
88
19
86
19
84
19
82
19
80

The Vermont Transportation Energy Profile — 2017
29
Table 3-4. EPA Fuel Economy for Vehicles Registered in Vermont, 2011–2017
Year Registered
Vehicles
MPG Match
Rate
Average
City MPG
Average
Highway MPG
Combined MPG
Average Std Dev
2011 586,422 85.00% 18.1 24.2 20.3 5.7
2012 578,415 85.60% 18.4 24.5 20.7 6.1
2013 552,665 85.80% 18.7 24.8 20.9 6.5
2014 564,591 86.40% 19.1 25.3 21.4 7.1
2015 589,608 85.44% 19.5 25.6 21.8 7.3
2016 591,864 85.64% 19.8 25.9 22.1 7.5
20171 596,783 85.52% 20.0 26.1 22.2 7.6
1 As of June 2017, all other values as of yearend.
Source: VDMV, 2017.
In addition, the realized fuel economy for Vermont drivers depends on the distance
that each vehicle is driven. If lower-MPG vehicles are driven over longer distances
than more fuel-efficient vehicles, fuel consumption is higher than if more fuel-
efficient vehicles are driven preferentially. The 2009 NHTS suggests that highly
fuel-efficient vehicles may be driven less than vehicles with lower fuel efficiency.
For example, HEVs are driven only about 5,000 miles per year as compared with the
statewide average of 10,275 miles per vehicle per year (USDOT, 2010).
One method for estimating the realized fuel economy in Vermont is dividing the
annual VMT by the annual fuel sales in the state. Table 3-5 shows the MPG values
that result from this approach.
Table 3-5. Realized MPG (VMT/Fuel Sales)
Year Average MPG1
2011 18.3
2012 18.8
2013 18.7
2014 18.7
2015 18.9
1 Annual VMT divided by combined
annual gas and diesel sales.
Source: FHWA, 2016; VT JFO, 2017
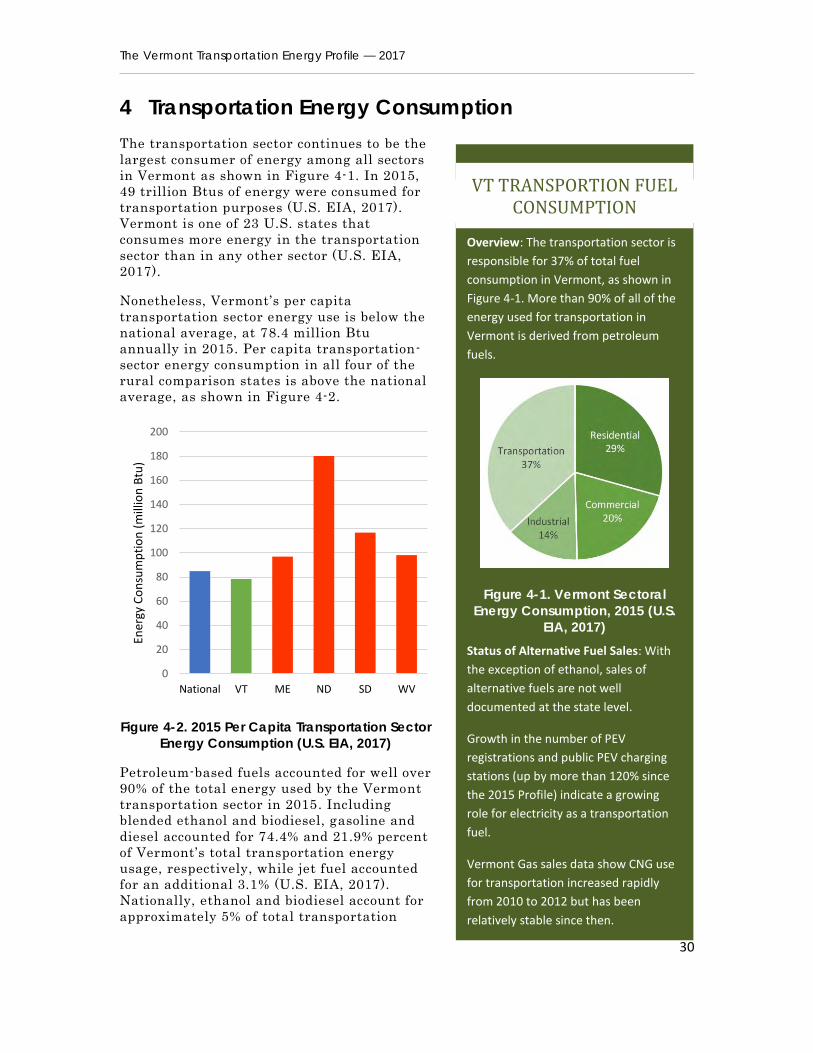
The Vermont Transportation Energy Profile — 2017
30
Overview: The transportation sector is
responsible for 37% of total fuel
consumption in Vermont, as shown in
Figure 4-1. More than 90% of all of the
energy used for transportation in
Vermont is derived from petroleum
fuels.
Figure 4-1. Vermont Sectoral
Energy Consumption, 2015 (U.S.
EIA, 2017)
Status of Alternative Fuel Sales: With
the exception of ethanol, sales of
alternative fuels are not well
documented at the state level.
Growth in the number of PEV
registrations and public PEV charging
stations (up by more than 120% since
the 2015 Profile) indicate a growing
role for electricity as a transportation
fuel.
Vermont Gas sales data show CNG use
for transportation increased rapidly
from 2010 to 2012 but has been
relatively stable since then.
VT TRANSPORTION FUEL CONSUMPTION
4 Transportation Energy Consumption
The transportation sector continues to be the
largest consumer of energy among all sectors
in Vermont as shown in Figure 4-1. In 2015,
49 trillion Btus of energy were consumed for
transportation purposes (U.S. EIA, 2017).
Vermont is one of 23 U.S. states that
consumes more energy in the transportation
sector than in any other sector (U.S. EIA,
2017).
Nonetheless, Vermont’s per capita
transportation sector energy use is below the
national average, at 78.4 million Btu
annually in 2015. Per capita transportation-
sector energy consumption in all four of the
rural comparison states is above the national
average, as shown in Figure 4-2.
Figure 4-2. 2015 Per Capita Transportation Sector
Energy Consumption (U.S. EIA, 2017)
Petroleum-based fuels accounted for well over
90% of the total energy used by the Vermont
transportation sector in 2015. Including
blended ethanol and biodiesel, gasoline and
diesel accounted for 74.4% and 21.9% percent
of Vermont’s total transportation energy
usage, respectively, while jet fuel accounted
for an additional 3.1% (U.S. EIA, 2017).
Nationally, ethanol and biodiesel account for
approximately 5% of total transportation
0
20
40
60
80
100
120
140
160
180
200
National VT ME ND SD WV
Ener
gy C
on
sum
pti
on
(m
illio
n B
tu)
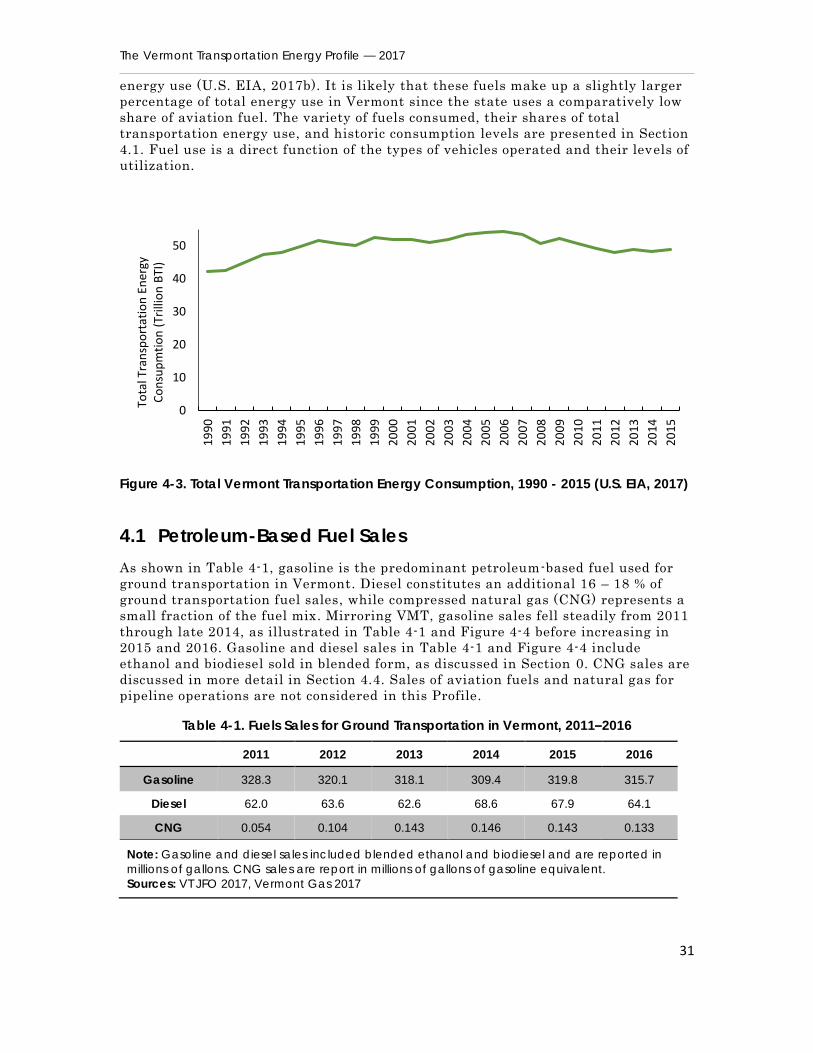
The Vermont Transportation Energy Profile — 2017
31
energy use (U.S. EIA, 2017b). It is likely that these fuels make up a slightly larger
percentage of total energy use in Vermont since the state uses a comparatively low
share of aviation fuel. The variety of fuels consumed, their shares of total
transportation energy use, and historic consumption levels are presented in Section
4.1. Fuel use is a direct function of the types of vehicles operated and their levels of
utilization.
Figure 4-3. Total Vermont Transportation Energy Consumption, 1990 - 2015 (U.S. EIA, 2017)
4.1 Petroleum-Based Fuel Sales
As shown in Table 4-1, gasoline is the predominant petroleum-based fuel used for
ground transportation in Vermont. Diesel constitutes an additional 16 – 18 % of
ground transportation fuel sales, while compressed natural gas (CNG) represents a
small fraction of the fuel mix. Mirroring VMT, gasoline sales fell steadily from 2011
through late 2014, as illustrated in Table 4-1 and Figure 4-4 before increasing in
2015 and 2016. Gasoline and diesel sales in Table 4-1 and Figure 4-4 include
ethanol and biodiesel sold in blended form, as discussed in Section 0. CNG sales are
discussed in more detail in Section 4.4. Sales of aviation fuels and natural gas for
pipeline operations are not considered in this Profile.
Table 4-1. Fuels Sales for Ground Transportation in Vermont, 2011–2016
2011 2012 2013 2014 2015 2016
Gasoline 328.3 320.1 318.1 309.4 319.8 315.7
Diesel 62.0 63.6 62.6 68.6 67.9 64.1
CNG 0.054 0.104 0.143 0.146 0.143 0.133
Note: Gasoline and diesel sales included blended ethanol and biodiesel and are reported in
millions of gallons. CNG sales are report in millions of gallons of gasoline equivalent.
Sources: VT JFO 2017, Vermont Gas 2017
0
10
20
30
40
50
19
90
19
91
19
92
19
93
19
94
19
95
19
96
19
97
19
98
19
99
20
00
20
01
20
02
20
03
20
04
20
05
20
06
20
07
20
08
20
09
20
10
20
11
20
12
20
13
20
14
20
15
Tota
l Tra
nsp
ort
atio
n E
ner
gy
Co
nsu
pm
tio
n (
Trill
ion
BTI
)

The Vermont Transportation Energy Profile — 2017
32
4.2 Biofuels
The two primary transportation biofuels are ethanol and biodiesel. Commercially,
ethanol is produced from sugars in organic materials such as corn and sugar cane.
Research on the use of cellulosic feedstocks is on-going, but they are not yet widely
commercialized. Biodiesel is chemically processed from either raw feedstocks (e.g.
soybeans and rapeseed) or waste vegetable oil.
Ethanol sales are tracked at the federal level in order to ensure compliance with the
National Renewable Fuel Standard (RFS) that was passed in 2007. It is sold
primarily in blended gasolines. In 2015, approximately 28.7 million gallons of
ethanol were consumed in Vermont (U.S. EIA, 2017) which is equal to just under 9%
of “at the pump” gasoline sales.
Biodiesel production, though not state level biodiesel sales, is also tracked at the
national level. Nationally, biodiesel accounted for approximately 3.3% of the volume
of diesel fuel consumed by the transportation sector (U.S. EIA 2017b). As with
ethanol, biodiesel is consumed predominantly in blended form. If the ratio of
biodiesel to total diesel sold in Vermont matches that reported at the national level,
this would equate to 2.2 million gallons of biodiesel sales in the state.
On an energy basis, 28.7 million gallons of ethanol and 2.2 million gallons of
biodiesel provide 2.7 trillion Btus. This represents 5.5% of the total energy
consumed by the transportation sector. As noted in the CEP, the environmental
benefits of biofuels vary with fuel type, feedstock, and production methods (VDPS
2016). There are several social and environmental uncertainties associated with
corn ethanol that are noted in the CEP. Nonetheless, as a result of federal policies
promoting ethanol, ethanol currently accounts for nearly 90% of the biofuel energy
consumed in the State.
Figure 4-4. VT Gasoline and Diesel Sales, Rolling 12-Mo. Total, 2011 – 2017 (VT JFO, 2017)
58M
60M
62M
64M
66M
68M
70M
72M
300M
305M
310M
315M
320M
325M
330M
335M
340M
Jan
-11
Au
g-1
1
Feb
-12
Sep
-12
Mar
-13
Oct
-13
May
-14
No
v-1
4
Jun
-15
Dec
-15
Jul-
16
Jan
-17
Au
g-1
7
Die
sel (
mill
ion
s o
f ga
llon
s)
Gas
olin
e (m
illio
ns
of
gallo
ns)
Gasoline Diesel

The Vermont Transportation Energy Profile — 2017
33
4.3 Electricity
As discussed in Section 3, PEV registration has increased rapidly in recent years,
though the absolute number of PEVs in the Vermont fleet remains small . PEVs can
be charged at home outlets or at public charging stations. As of July 2017 there are
a total of 156 public electric charging stations in Vermont, an increase of 86
charging stations since 2015. Of these stations, 11 are Level 1, 129 are Level 2, and
23 are DC Fast Charging.
There are currently no reporting requirements for either home-based or public
charging, so directly tracking the total electricity used for vehicle charging is not
possible. Electricity consumption can be estimated based on the number of
registered PEVs, however, as shown in Table 4-2. Several assumptions must be
made to make these calculations, including the distance that PEVs drive and their
electric drive efficiency. For the Table 4-2, PEVs are assumed to be driven at the
average VMT per vehicle for the state of Vermont. Average electric drive efficiency
is calculated based on DOE estimates for electric drive efficiency for the vehicles
listed in Table 3-3, weighted by number of vehicles registered in Vermont. PHEVs
are assumed to travel 55% of the time on electric power (AFDC 2017). Based on
these assumptions, total electricity demand can be est imated at 3.8 million kWhs
for 2016. This equates to almost 13 billion Btus or approximately 0.03% of the direct
transportation energy use in the state. Some fraction of this energy comes from
renewable sources but it does not yet contribute significant ly toward the CEP goal
of increased renewable energy use.
Table 4-2. Estimated PEV Electricity Consumption in Vermont for 2016
EV
Type
Register Vehicles
(Dec 2016)
Average
Annual Miles
Driven
Average
Miles Driven
On Electricity
Average Electric
Drive Efficiency
(kWh/mi.)
Total
Electricity Use
(kWhs)
AEV 330 11,905 100% 0.313 1,228,688
PHEV 1,192 11,905 55% 0.329 2,567,290
Total 3,795,978
The availability of public charging infrastructure is an impor tant component of PEV
adoption as access to charging away from the home increases the effective range of
PEVs and reduces range anxiety. To illustrate the current levels of charging at
publically accessible charging stations, Green Mountain Power and ChargePoint
have voluntarily provided charging data through the Vermont Clean Cities
Coalition. Detailed use data at several GMP locations are highlighted in Table 4-3
for the period of October 2016 – July 2017. (The start of the data collection period
coincides with a switchover from Lite-On to SemaConnect charging stations.)
Aggregate data for all GMP stations on the EVgo network, representing 92 ports,
are provided in Table 4-4. Aggregate charging data for all 72 ChargePoint charging
stations, representing 139 ports, are provided in Table 4-5. ChargePoint continues
to provide the single largest network of public charging station in Vermont.

The Vermont Transportation Energy Profile — 2017
34
Table 4-3. Sample of Electricity Demand at Vermont PEV Charging Stations
EV Station Location Charge
Events Ports
Total
Energy
Usage
(kwh)
Total
Charge
Time
(hrs)
Mean
Charge
(kWh)
Mean
Charge
Time
(Min)
Le
ve
l 2
Ch
arg
ing
St. Michaels College,
Winooski 115 1 191 235 1.7 120
Healthy Living,
S. Burlington 337 2 1,976 213 5.9 38
City Hall, Montpelier 222 1 1,441 222 6.5 60
VSECU, Montpelier 344 2 3,550 761 10.3 133
DC
Fa
st
VSECU, Montpelier 279 1 2,256 126 8.1 27
Note: All level 2 charging data are for the period of Oct. 2016 – Jul. 2017. DC Fast
charging data are for calendar 2016.
Sources: GMP, 2017.
Table 4-4. Aggregate electricity demand at GMP EVgo PEV charging stations in VT
Charging Station Type Charging
Episodes
Total Energy
Usage (kWh)
Mean
Charge
(kWh)
Mean
Charge Time
(Min)
Level 2 (10/16-7/17) 3,168 25,943 8.19 148.8
DC Fast (2016) 920 8671 9.43 24.6
Source: GMP, 2017.
Table 4-5. Aggregate electricity demand at ChargePoint PEV charging stations in VT
Charging Station Type Charging
Episodes
Total Energy
Usage (kWh)
Mean
Charge
(kWh)
Mean
Charge Time
(Min)
Level 1 190 578 3.06 1,219
Level 2 15,192 107,131 7.05 123
DC Fast 1,342 7,986 5.95 25
Source: ChargePoint, 2017.
4.4 Compressed and Liquefied Natural Gas
Utilization of natural gas as a transportation fuel is on the rise as can be seen in
the monthly CNG sales shown in Figure 4-5. Overall CNG sales in 2016 totaled
169,575 gasoline-gallon equivalents. Growth in sales of CNG for transportation fuel
increased dramatically between late 2010 and 2012 but has been comparatively
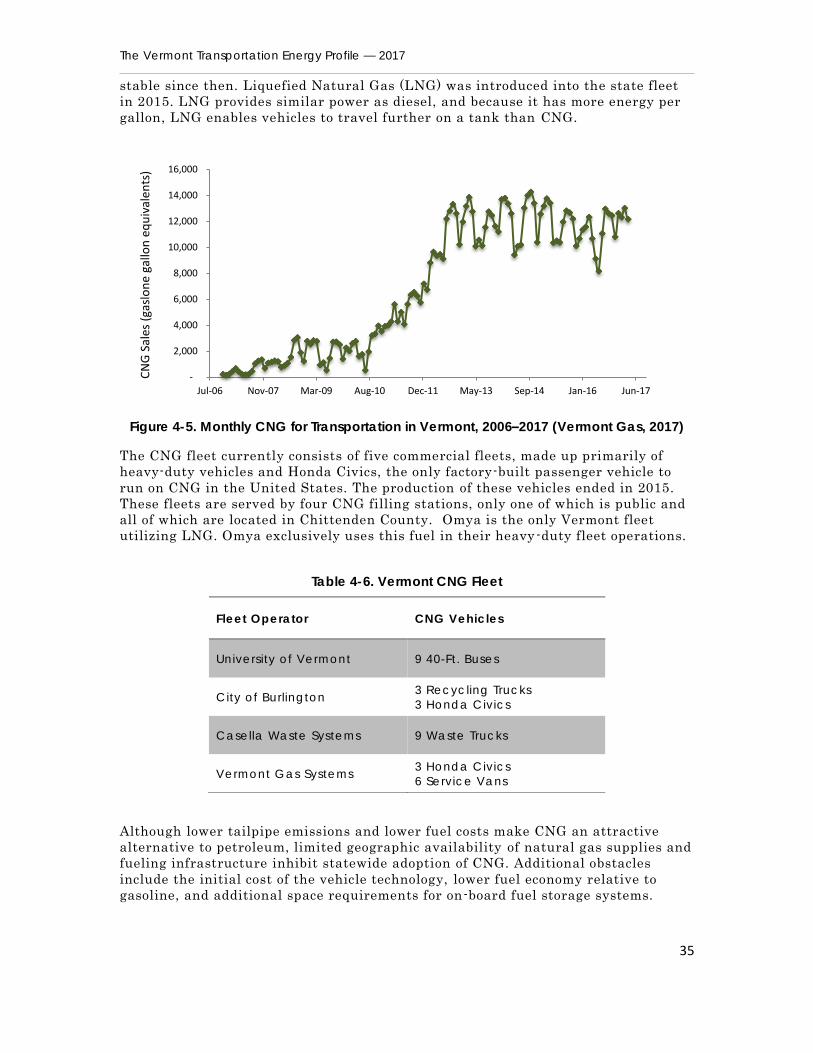
The Vermont Transportation Energy Profile — 2017
35
stable since then. Liquefied Natural Gas (LNG) was introduced into the state fleet
in 2015. LNG provides similar power as diesel, and because it has more energy per
gallon, LNG enables vehicles to travel further on a tank than CNG.
Figure 4-5. Monthly CNG for Transportation in Vermont, 2006–2017 (Vermont Gas, 2017)
The CNG fleet currently consists of five commercial fleets, made up primarily of
heavy-duty vehicles and Honda Civics, the only factory-built passenger vehicle to
run on CNG in the United States. The production of these vehicles ended in 2015.
These fleets are served by four CNG filling stations, only one of which is public and
all of which are located in Chittenden County. Omya is the only Vermont fleet
utilizing LNG. Omya exclusively uses this fuel in their heavy-duty fleet operations.
Table 4-6. Vermont CNG Fleet
Although lower tailpipe emissions and lower fuel costs make CNG an attractive
alternative to petroleum, limited geographic availability of natural gas supplies and
fueling infrastructure inhibit statewide adoption of CNG. Additional obstacles
include the initial cost of the vehicle technology, lower fuel economy relative to
gasoline, and additional space requirements for on-board fuel storage systems.
-
2,000
4,000
6,000
8,000
10,000
12,000
14,000
16,000
Jul-06 Nov-07 Mar-09 Aug-10 Dec-11 May-13 Sep-14 Jan-16 Jun-17
CN
G S
ales
(ga
slo
ne
gallo
n e
qu
ival
ents
)
Fleet Operator CNG Vehicles
University of Vermont 9 40-Ft. Buses
City of Burlington 3 Recycling Trucks
3 Honda Civics
Casella Waste Systems 9 Waste Trucks
Vermont Gas Systems 3 Honda Civics
6 Service Vans

The Vermont Transportation Energy Profile — 2017
36
5 Greenhouse Gas Emissions
The transportation sector is the largest single source of GHG emissions in the state of
Vermont as shown in Figure 5-1. These emission are largely the result of burning fossil fuels
though a smaller portion are from biofuel combustion and PEV charging, as discussed in
Sections 4.2 and 4.3. Three different transportation sector GHG emissions estimates are
reported here.
The first emissions estimate is from the Vermont Greenhouse Gas Emissions Inventory
produced by the Agency of Natural Resources (VT ANR, 2017). For the Inventory,
transportation emissions are calculated using outputs from the EPA’s Motor Vehicle
Emissions Simulator, also known as MOVES. This “bottom up” approach simulates the GHG
emissions, including methane and nitrous oxide, for vehicles registered in Vermont. MOVES
accounts for a wide variety of factors that influence emissions including vehicle fuel and body
type, vehicle age, vehicle speeds, and road types and is calibrated with both fuels sales and
VMT data. MOVES is considered the state-of-the-art for mobile source emissions (U.S. EPA,
2016b). The transportation sector GHG emissions reported in the most recent edition of the
state’s GHG inventory are shown in Table 5-1.
The GHG estimate from ANR is supplemented by two “top down” emissions estimates that
calculate GHG emissions based on fuels sales data. The U.S. EPA (U.S. EPA, 2016a)
calculates CO2 emissions by sector at the state level based on EIA fuel sales data. These
emissions estimates are shown in Figure 5-2. Finally, GHG emissions estimates were
Greenhouse Gas Emissions
Emissions Goals: The 2016 CEP calls for a 30% reduction in transportation sector GHGs relative to 1990 levels by 2025.
Drivers of Transportations Emissions: Three primary factors influence transportation sector GHG emissions: VMT, vehicle energy efficiency, and vehicle fuel type. Reducing VMT, increasing vehicle energy efficiency, and switching to low-carbon fuels (e.g. electricity generated by renewable sources) will all help to reduce GHG emissions.
Historical Trend: Transportation GHG emissions closely follow trends in VMT, peaking in the mid-2000s and declining from 2008 through 2011 and remaining relatively stable since then. As of 2013, transportation GHG emissions were between 11% (U.S. EPA, 2016a) and 14% (VT ANR, 2017) above 1990 levels.
Figure 5-1. Vermont GHG Emissions by Sector, 2013 (VT ANR, 2017)
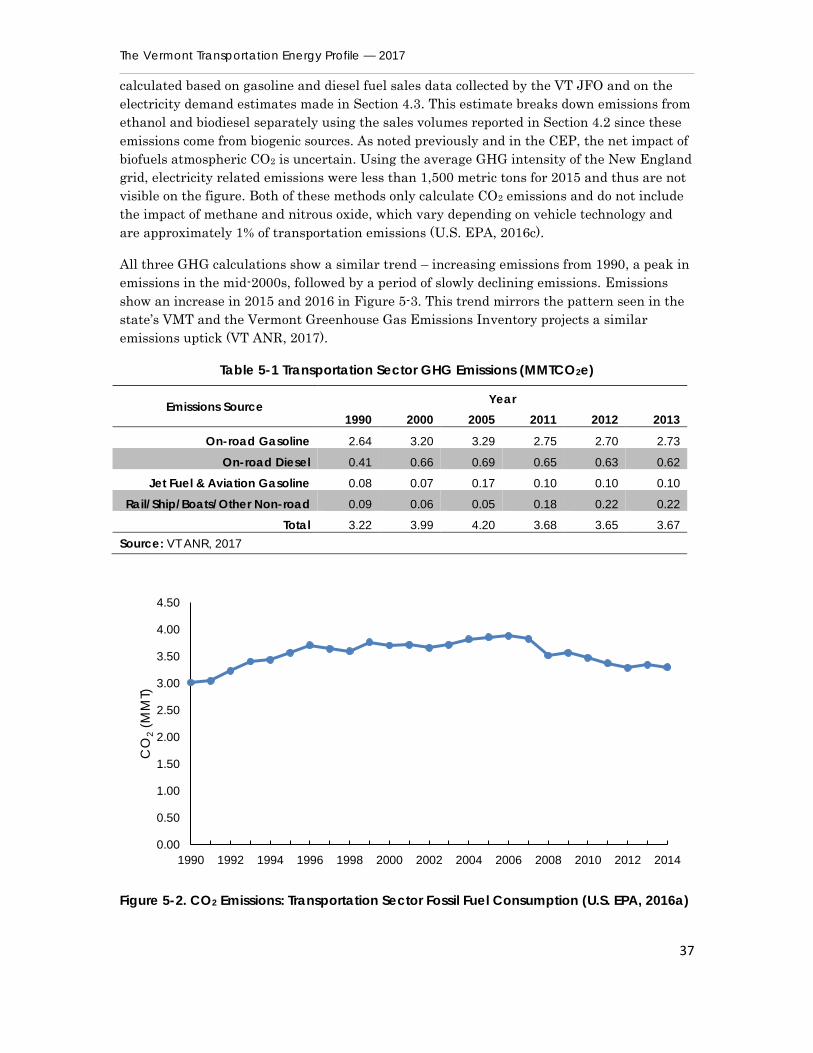
The Vermont Transportation Energy Profile — 2017
37
calculated based on gasoline and diesel fuel sales data collected by the VT JFO and on the
electricity demand estimates made in Section 4.3. This estimate breaks down emissions from
ethanol and biodiesel separately using the sales volumes reported in Section 4.2 since these
emissions come from biogenic sources. As noted previously and in the CEP, the net impact of
biofuels atmospheric CO2 is uncertain. Using the average GHG intensity of the New England
grid, electricity related emissions were less than 1,500 metric tons for 2015 and thus are not
visible on the figure. Both of these methods only calculate CO2 emissions and do not include
the impact of methane and nitrous oxide, which vary depending on vehicle technology and
are approximately 1% of transportation emissions (U.S. EPA, 2016c).
All three GHG calculations show a similar trend – increasing emissions from 1990, a peak in
emissions in the mid-2000s, followed by a period of slowly declining emissions. Emissions
show an increase in 2015 and 2016 in Figure 5-3. This trend mirrors the pattern seen in the
state’s VMT and the Vermont Greenhouse Gas Emissions Inventory projects a similar
emissions uptick (VT ANR, 2017).
Table 5-1 Transportation Sector GHG Emissions (MMTCO2e)
Emissions Source Year
1990 2000 2005 2011 2012 2013
On-road Gasoline 2.64 3.20 3.29 2.75 2.70 2.73
On-road Diesel 0.41 0.66 0.69 0.65 0.63 0.62
Jet Fuel & Aviation Gasoline 0.08 0.07 0.17 0.10 0.10 0.10
Rail/Ship/Boats/Other Non-road 0.09 0.06 0.05 0.18 0.22 0.22
Total 3.22 3.99 4.20 3.68 3.65 3.67
Source: VT ANR, 2017
Figure 5-2. CO2 Emissions: Transportation Sector Fossil Fuel Consumption (U.S. EPA, 2016a)
0.00
0.50
1.00
1.50
2.00
2.50
3.00
3.50
4.00
4.50
1990 1992 1994 1996 1998 2000 2002 2004 2006 2008 2010 2012 2014
CO
2(M
MT)
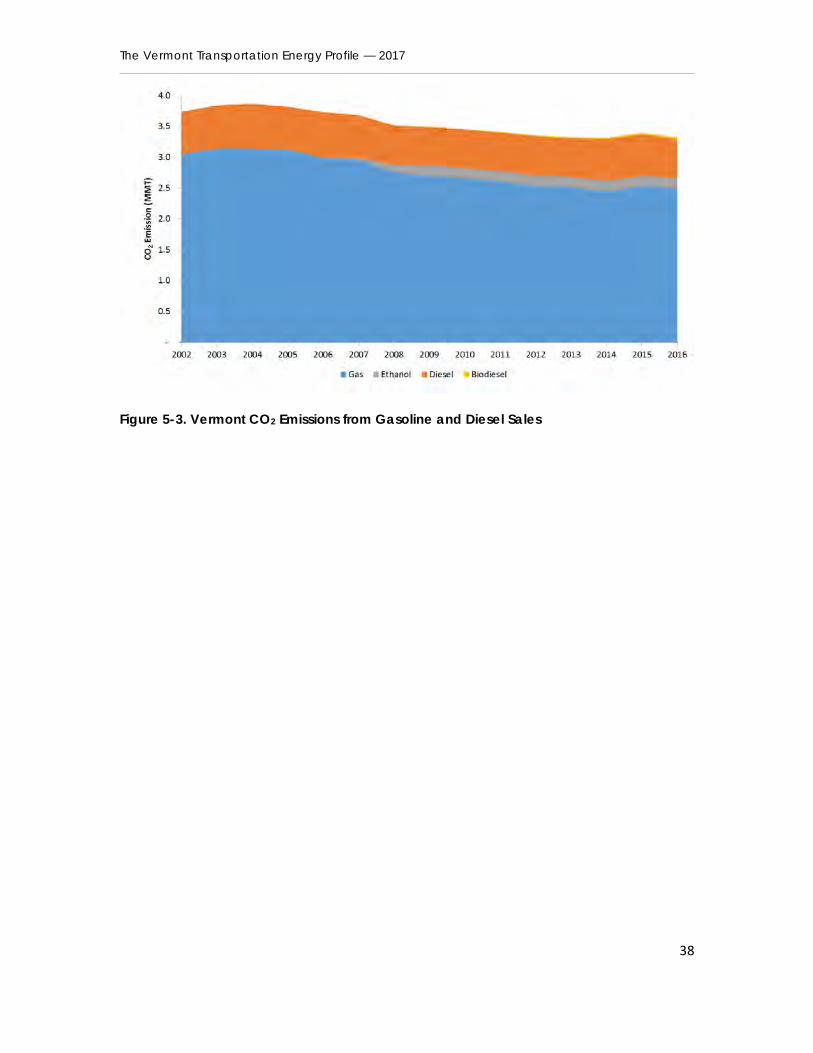
The Vermont Transportation Energy Profile — 2017
38
Figure 5-3. Vermont CO2 Emissions from Gasoline and Diesel Sales
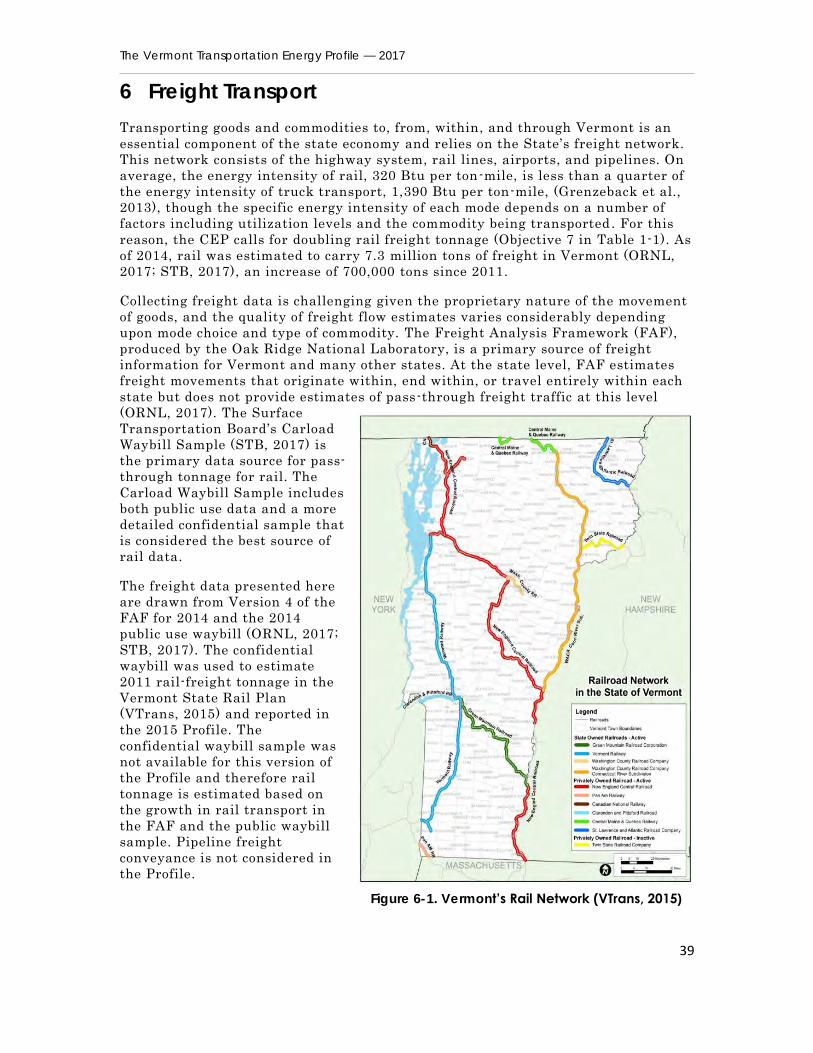
The Vermont Transportation Energy Profile — 2017
39
6 Freight Transport
Transporting goods and commodities to, from, within, and through Vermont is an
essential component of the state economy and relies on the State’s freight network.
This network consists of the highway system, rail lines, airports, and pipelines. On
average, the energy intensity of rail, 320 Btu per ton-mile, is less than a quarter of
the energy intensity of truck transport, 1,390 Btu per ton-mile, (Grenzeback et al.,
2013), though the specific energy intensity of each mode depends on a number of
factors including utilization levels and the commodity being transported . For this
reason, the CEP calls for doubling rail freight tonnage (Objective 7 in Table 1-1). As
of 2014, rail was estimated to carry 7.3 million tons of freight in Vermont (ORNL,
2017; STB, 2017), an increase of 700,000 tons since 2011.
Collecting freight data is challenging given the proprietary nature of the movement
of goods, and the quality of freight flow estimates varies considerably depending
upon mode choice and type of commodity. The Freight Analysis Framework (FAF),
produced by the Oak Ridge National Laboratory, is a primary source of freight
information for Vermont and many other states. At the state level, FAF estimates
freight movements that originate within, end within, or travel entirely within each
state but does not provide estimates of pass-through freight traffic at this level
(ORNL, 2017). The Surface
Transportation Board’s Carload
Waybill Sample (STB, 2017) is
the primary data source for pass-
through tonnage for rail. The
Carload Waybill Sample includes
both public use data and a more
detailed confidential sample that
is considered the best source of
rail data.
The freight data presented here
are drawn from Version 4 of the
FAF for 2014 and the 2014
public use waybill (ORNL, 2017;
STB, 2017). The confidential
waybill was used to estimate
2011 rail-freight tonnage in the
Vermont State Rail Plan
(VTrans, 2015) and reported in
the 2015 Profile. The
confidential waybill sample was
not available for this version of
the Profile and therefore rail
tonnage is estimated based on
the growth in rail transport in
the FAF and the public waybill
sample. Pipeline freight
conveyance is not considered in
the Profile.
Figure 6-1. Vermont’s Rail Network (VTrans, 2015)
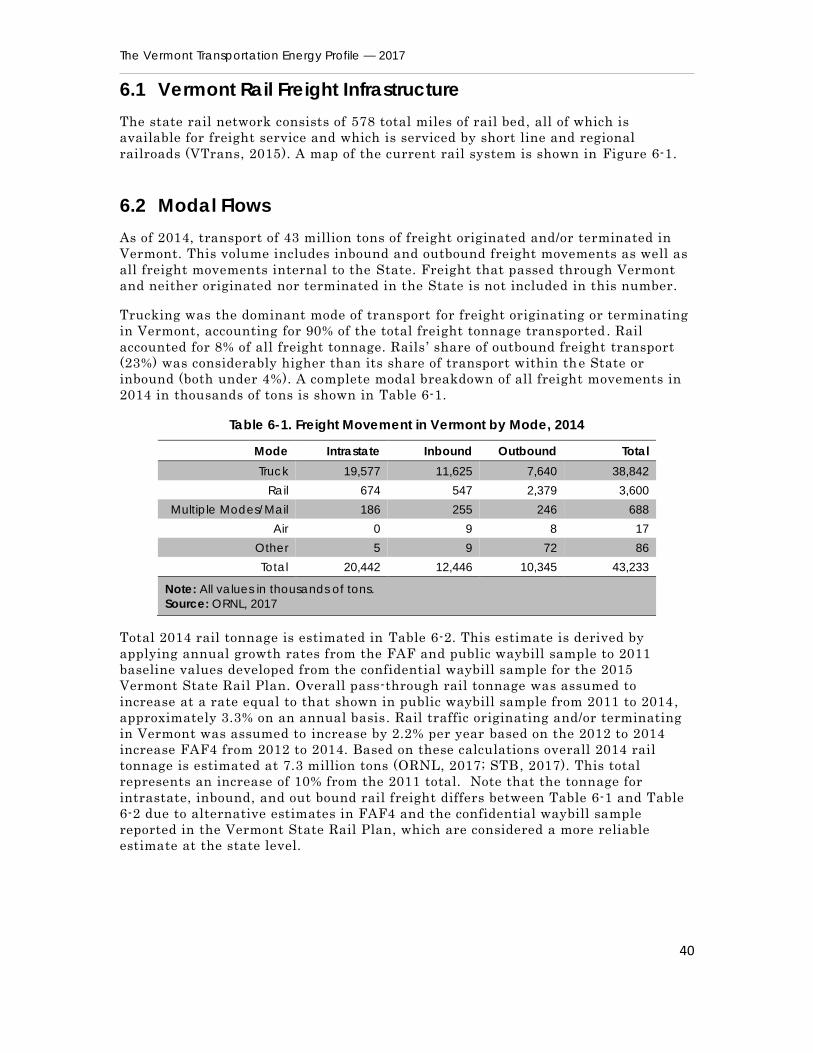
The Vermont Transportation Energy Profile — 2017
40
6.1 Vermont Rail Freight Infrastructure
The state rail network consists of 578 total miles of rail bed, all of which is
available for freight service and which is serviced by short line and regional
railroads (VTrans, 2015). A map of the current rail system is shown in Figure 6-1.
6.2 Modal Flows
As of 2014, transport of 43 million tons of freight originated and/or terminated in
Vermont. This volume includes inbound and outbound freight movements as well as
all freight movements internal to the State. Freight that passed through Vermont
and neither originated nor terminated in the State is not included in this number.
Trucking was the dominant mode of transport for freight originating or terminating
in Vermont, accounting for 90% of the total freight tonnage transported . Rail
accounted for 8% of all freight tonnage. Rails ’ share of outbound freight transport
(23%) was considerably higher than its share of transport within the State or
inbound (both under 4%). A complete modal breakdown of all freight movements in
2014 in thousands of tons is shown in Table 6-1.
Table 6-1. Freight Movement in Vermont by Mode, 2014
Mode Intrastate Inbound Outbound Total
Truck 19,577 11,625 7,640 38,842
Rail 674 547 2,379 3,600
Multiple Modes/Mail 186 255 246 688
Air 0 9 8 17
Other 5 9 72 86
Total 20,442 12,446 10,345 43,233
Note: All values in thousands of tons.
Source: ORNL, 2017
Total 2014 rail tonnage is estimated in Table 6-2. This estimate is derived by
applying annual growth rates from the FAF and public waybill sample to 2011
baseline values developed from the confidential waybill sample for the 2015
Vermont State Rail Plan. Overall pass-through rail tonnage was assumed to
increase at a rate equal to that shown in public waybill sample from 2011 to 2014,
approximately 3.3% on an annual basis. Rail traffic originating and/or terminating
in Vermont was assumed to increase by 2.2% per year based on the 2012 to 2014
increase FAF4 from 2012 to 2014. Based on these calculations overall 2014 rail
tonnage is estimated at 7.3 million tons (ORNL, 2017; STB, 2017). This total
represents an increase of 10% from the 2011 total. Note that the tonnage for
intrastate, inbound, and out bound rail freight differs between Table 6-1 and Table
6-2 due to alternative estimates in FAF4 and the confidential waybill sample
reported in the Vermont State Rail Plan, which are considered a more reliable
estimate at the state level.
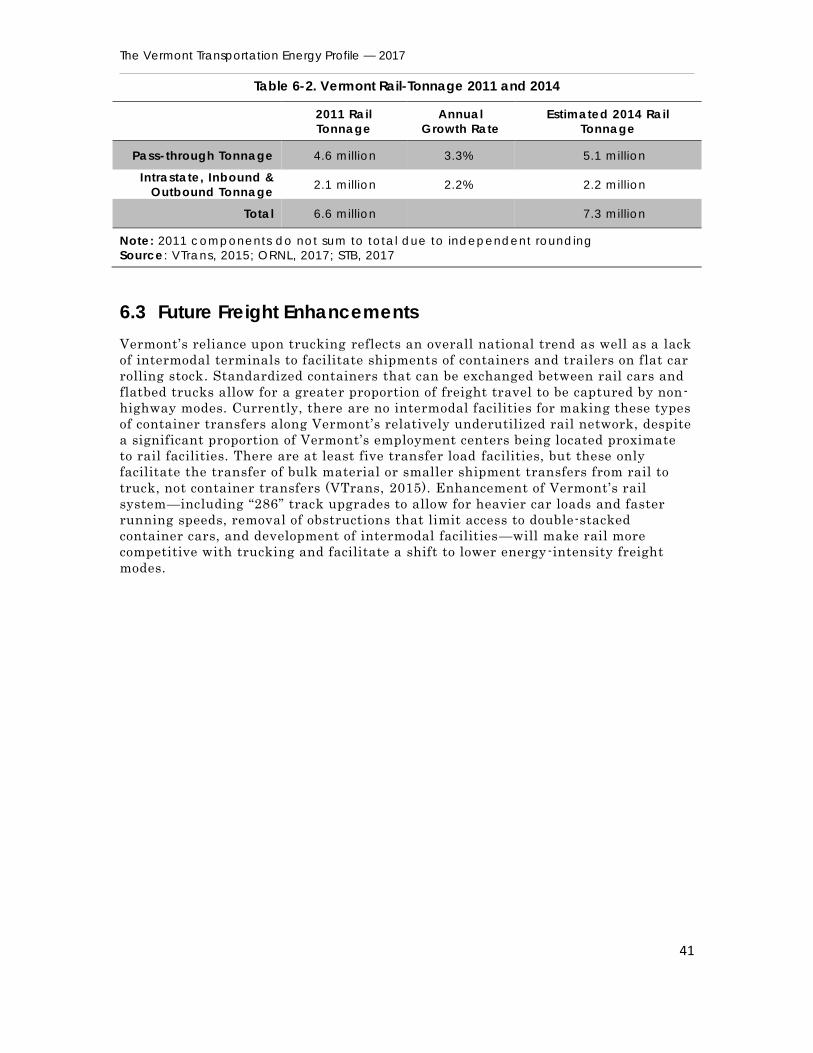
The Vermont Transportation Energy Profile — 2017
41
Table 6-2. Vermont Rail-Tonnage 2011 and 2014
2011 Rail
Tonnage
Annual
Growth Rate
Estimated 2014 Rail
Tonnage
Pass-through Tonnage 4.6 million 3.3% 5.1 million
Intrastate, Inbound &
Outbound Tonnage 2.1 million 2.2% 2.2 million
Total 6.6 million 7.3 million
Note: 2011 components do not sum to total due to independent rounding
Source: VTrans, 2015; ORNL, 2017; STB, 2017
6.3 Future Freight Enhancements
Vermont’s reliance upon trucking reflects an overall national trend as well as a lack
of intermodal terminals to facilitate shipments of containers and trailers on flat car
rolling stock. Standardized containers that can be exchanged between rail cars and
flatbed trucks allow for a greater proportion of freight travel to be captured by non-
highway modes. Currently, there are no intermodal facilities for making these types
of container transfers along Vermont’s relatively underutilized rail network, despite
a significant proportion of Vermont’s employment centers being located proximate
to rail facilities. There are at least five transfer load facilities, but these only
facilitate the transfer of bulk material or smaller shipment transfers from rail to
truck, not container transfers (VTrans, 2015). Enhancement of Vermont’s rail
system—including “286” track upgrades to allow for heavier car loads and faster
running speeds, removal of obstructions that limit access to double-stacked
container cars, and development of intermodal facilities—will make rail more
competitive with trucking and facilitate a shift to lower energy-intensity freight
modes.
The Vermont Transportation Energy Profile — 2017
42
7 Progress toward 2016 CEP Transportation Targets
The 2016 CEP sets out three short-term transportation goals and nine supporting
objectives with target dates in 2025 and 2030. The State’s progress toward reaching
each of these targets is assessed here. Since the three overarching goals were
established in 2016 and most of the data used in this Profile are only available
through 2015 (see Section 1.3), the State’s progress toward these goals since their
implementation cannot be measured in this Profile. Discussions of the trends
leading up to 2016 are therefore provided for these three goals. The State’s initial
progress towards achieving these goals will be quantified in the next edition of the
Profile.
In order to conduct this assessment, the change in each metric is compared to the
average annual rate of change required to hit the CEP target. For example, the CEP
calls for the state to add 2,284 park-and-ride parking spaces by 2030. In order to
achieve this objective, the state must add an average of 120 spaces per year from
2011 through 2030. When the average number of new parking spaces is at or above
120 spaces per year, the state is on pace to meet the CEP target. When the average
number of new parking spaces falls below this rate, the state is lagging behind the
CEP target.
For many of these metrics, progress toward achieving the CEP objective is likely to
lag in the early years due to the need for upfront investments and the slow pace of
behavioral change. Metrics related to the vehicle fleet may be particularly slow to
make progress given the long active life of cars and trucks. Thus cases where the
state is currently lagging in achieving a particular objective should not be taken to
mean that the objective cannot be achieved.
7.1 Goal 1: Reduce Total Transportation Energy Use
Goal: Reduce total transportation energy use by 20% from 2015 levels by 2025 .
Goal Set: 2016 CEP
Period of Implementation: 2016 - 2025
Current Status: Data from 2016 and 2017 required for initial assessment.
Transportation energy consumption totaled 49.1 trillion Btus in 2015 (the
most recent year for which data are available) and will have to be reduced to
39.1 trillion Btus by 2025 to achieve this goal.
Achieving this goal will require an average annual reduction in energy use of
1.09 trillion Btus from 2016 to 2025, assuming that 2016 energy use was
equal to that in 2015.
Recent Trends: Since 1990, the State has not experienced more than three
consecutive years with declining transportation energy use. Annual transportation
energy use in Vermont peaked in 2007 and reached its lowest level in the 2000s in
2012 but has increased slightly since then.
Outlook: Realizing sustained reductions in energy use of close to one trillion Btus
per year will require a combination of reducing VMT and reducing the energy used
The Vermont Transportation Energy Profile — 2017
43
per mile traveled by switching to more efficient vehicles such as HEVs and PEVs. If
VMT is held constant, fuel efficiency per mile traveled will have to increase by 25%
to achieve this goal.
Data Sources: Sectoral energy consumption is tracked at the state level by the U.S.
EIA as part of the State Energy Data System (SEDS).
7.2 Goal 2: Increase Renewable Energy Use in Transportation
Goal: Increase the share of renewable energy in all transportation to 10% by 2025.
Goal Set: 2016 CEP
Period of Implementation: 2016 - 2025
Current Status: Data from 2016 and 2017 required for initial assessment.
Renewable energy in the form of ethanol and biodiesel account for 5.5% of
the total transportation energy use in Vermont in 2015 (the most recent year
for which data are available). Renewable electricity also contributes to the
renewable energy used in the transportation sector but its contribution is
currently less than 0.1%.
Achieving this goal will require an average annual increase in renewable
energy use of 0.5% of total transportation energy use from 2016 to 2025
assuming that renewable energy use in 2016 was equal to that in 2015.
Recent Trends: Consumption of blended ethanol has been essential ly stable since
2011. Consumption of blended biodiesel has increased slightly in that time frame.
Use of renewable electricity has also increased but remains a very small part of the
transportation fuel portfolio.
Outlook: There is relatively little potential for growth in blended ethanol sales in
the near future. Ethanol currently constitutes close to 10% of the at-the-pump
gasoline sales in Vermont and the CEP does not support the promotion of E-85
infrastructure because of environmental concerns about ethanol production.
Therefore, significant growth in biodiesel and especially renewable electricity use
will be needed to achieve this goal.
Data Sources: Ethanol use is tracked at the state level by the U.S. EIA as part of
the State Energy Data System (SEDS). Biodiesel use is tracked at the national level
by the U.S. EIA as part of the Monthly Energy Review series. Electricity for vehicle
charging is not tracked directly but can be estimated based on PEV registration
data from the Vermont DMV.
7.3 Goal 3: Reduce Transportation GHG Emissions
Goal: Reduce transportation-emitted GHGs by 30% from 1990 levels by 2025.
Goal Set: 2016 CEP
Period of Implementation: 2016 - 2025
Current Status: Data from 2016 and 2017 required for initial assessment.
The Vermont Transportation Energy Profile — 2017
44
As of 2013, transportation GHG emissions equaled 3.67 million metric tons
CO2e, 14% higher than baseline 1990 levels. Annual GHG emissions will have
to be reduced to 2.58 million metric tons CO2e by 2025 to achieve this goal.
Achieving this goal will require an average annual decrease in GHG
emissions of 0.16 million metric tons CO2e per year from 2016 to 2025
(assuming that 2015 GHG emissions equal those in 2013).
Recent Trends: From 2011 through 2013 (the most recent years for which data are
available) GHG emissions have varied by less than 0.05 million metric tons CO 2e.
GHG emissions are closely tied to VMT, which has increased since 2013.
Outlook: Reducing GHG emission will require a combination of reducing VMT and
reducing the GHG intensity per mile traveled by switching to vehicles with lower
LCA GHG profiles such as HEVs and PEVs.
Data Sources: The Vermont Greenhouse Gas Inventory produced by the Agency of
Natural Resources.
7.4 Objective 1: Per Capita VMT
Objective: Hold VMT per capita to 2011 base year value of 11,402.
Objective Set: 2011 CEP
Period of Implementation: 2011 - 2030
Current Status: Progress lagging target.
2011 Baseline: 11,402 VMT per capita
2015 Value: 11,680 VMT per capita
Achieving the CEP target will require stable per capita VMT from 2011 through
2030. Per capita VMT increased modestly from 2011 to 2015.
Data Sources: VMT collected by VTrans as part of the Highway Performance
Monitoring System; USCB population estimates.
7.5 Objective 2: Reduce SOV Commute Trips
Objective: Reduce share of SOV commute trips by 20% by 2030.
Objective Set: 2011 CEP
Period of Implementation: 2011 - 2030
Current Status: Progress lagging target.
2011 Baseline: 79.2%
2015 Value: 80.7%
Achieving the CEP target will require an average decrease in SOV commute share
of 1.1% per year from 2011 through 2030. SOV commute share increased from 2011
through 2015.
Data Sources: American Community Survey.

The Vermont Transportation Energy Profile — 2017
45
7.6 Objective 3: Increase Bike/Ped Commute Trips
Objective: Double the share of bicycle/pedestrian commute trips to 15.6% by 2030.
Objective Set: 2011 CEP
Period of Implementation: 2011 - 2030
Current Status: Progress lagging target.
2011 Baseline: 7.6%
2015 Value: 7.1%
Achieving the CEP target will require an average increase in bicycle/pedestrian
commute share of 0.4% per year from 2011 through 2030. Bicycle/pedestrian
commute share fell by 0.5% between 2011 and 2015.
Data Sources: American Community Survey.
7.7 Objective 4: Increase State Park-and-Ride Spaces
Objective: Triple the number of state park-and-ride spaces to 3,426 by 2030.
Objective Set: 2011 CEP
Period of Implementation: 2011 - 2030
Current Status: Progress lagging target.
2011 Baseline: 1,142 spaces
2017 Value: 1,525 spaces
Achieving this target will require an average annual increase of 120 spaces per
year. From 2011 to 2017 state park-and-ride space increased by an average of 64
spaces per year.
Data Source: VTrans Municipal Assistance Bureau.
7.8 Objective 5: Increase Transit Trips
Objective: Increase public transit ridership by 110%, to 8.7 million annual trips by
2030.
Objective Set: 2011 CEP
Period of Implementation: 2011 - 2030
Current Status: Progress lagging target.
2011 Baseline: 4.58 million rides
2016 Value: 4.71 million rides
Achieving the CEP target will require an average annual increase of 238,500 riders
per year. From FY 2011 to FY 2016, transit ridership increased by an average of
approximately 26,000 riders per year.
The Vermont Transportation Energy Profile — 2017
46
Data Source: VTrans Public Transit Route Performance Reviews.
7.9 Objective 6: Increase Passenger Rail Trips
Objective: Quadruple passenger rail trips to 400,000 Vermont-based trips by 2030.
Objective Set: 2011 CEP
Period of Implementation: 2011 - 2030
Current Status: Progress lagging target.
2011 Baseline: 91,942 boardings and alightments.
2016 Value: 92,422 boardings and alightments.
Achieving the CEP target will require an average annual increase of 6,000
boardings and alightments per year. In FY 2016, 92,422 boardings and alightments
took place at Vermont rail stations, representing an average increase of only 96 per
year since FY 2011.
Note: Passenger rail ridership is measured as the combined boardings and
alightments at Vermont Amtrak stations. This is consistent with the CEP objective
but counts trips that begin and end at Vermont stations twice, so should not be
equated with the number of rail trips in Vermont.
Data Source: VTrans.
7.10 Objective 7: Increase Rail-Based Freight
Objective: Double the amount of rail freight tonnage in the state from 2011 levels by
2030.
Objective Set: 2011 CEP
Period of Implementation: 2011 - 2030
Current Status: Progress lagging target.
2011 Baseline: 6.6 million tons.
2014 Value: 7.3 million tons.
Achieving the CEP target will require an average annual increase of 0.35 million
tons per year from 2011 through 2030. Between 2011 and 2014 rail freight tonnage
is estimated to have increased by 0.23 million tons per year.
Data Source: ORNL, 2017; STB, 2017.
7.11 Objective 8: Increase Registration of Electric Vehicles
Objective: Increase the number of electric vehicles registered in Vermont to 10% of
the fleet by 2025.
Objective Set: 2011 CEP
Period of Implementation: 2011 - 2025
The Vermont Transportation Energy Profile — 2017
47
Status: Progress lagging target
2011 Baseline: PEVs constituted 0.0% of Vermont vehicle fleet
2016 Value: PEVs constituted 0.3% of Vermont vehicle fleet
Achieving the CEP target will require an average annual increase average annual
increase in PEV registrations of 0.7% of the vehicle fleet from 2011 through 2025.
Between December 2011 and December 2016, PEVs registrations increased by an
average of 0.05% of the Vermont vehicle fleet per year.
7.12 Objective 9: Increase Renewable Fuel Use in Heavy-Duty
Fleets
Objective: Increase the number of heavy duty vehicles that are renewably powered
to 10% by 2025.
Objective Set: 2011 CEP
Period of Implementation: 2011 - 2030
Status: Additional data required to evaluate this objective.
This objective is challenging to measure since a diesel vehicle can drive on 100%
biodiesel, 100% conventional diesel, or a mixture of the two. Therefore, it is
infeasible to track this metric without tracking biodiesel sales. Electrification of the
bus and truck fleet may also help achieve this goal and could be tracked in f uture
Profiles.
The Vermont Transportation Energy Profile — 2017
48
8 Recommendations for Metrics, Data, and Modeling
This section contains a set of recommendations for the State that will improve its
ability to track progress toward the CEP targets. These recommendations have been
compiled according to the following categories:
Expanding/improving data collection for existing metrics.
Recommended additional metrics.
New data needed.
Improved and new modeling needed.
In addition, future editions of the CEP may benefit from revisions to some
transportation targets. For the renewable energy objective, the desired role of
ethanol should be clarified. Ethanol is the largest single source of renewable energy
in the transportation sector in Vermont but there are numerous concerns about the
environmental impact of ethanol produced using corn. Ethanol made from cellulose
(e.g. corn stover, wood chips, and miscanthus) and algae may have a better
environmental profile but production of these fuels has not yet been widely
commercialized. Switching to a single target dates for both the transportation goals
and all of the transportation objectives would also improve the clarity of these
targets.
8.1 Expanding/Improving Data Collection for Existing Metrics
Expanding objectives 3–5 to consider mode share for all trip types, as opposed to
the mode share for commute trips only, would increase the impact of shifting
from SOV to carpool or active transportation trips. Tracking mode share across
all trips would require regular collection of state-level mode data from a
comprehensive travel survey.
Improvements in the acquisition and quality control of the vehicle-registration
data from the DMV are needed to improve the fidelity of several metrics used in
this study. Current reporting from DMV includes the class of each vehicle that is
registered, but the coding of this class parameter and other variables has been
inconsistent. Improved coding of the vehicle class to more accurately identify
diesel, CNG, and electric vehicles would result in more accurate data for the
Profile.
8.2 Additional Metrics Recommended
In-Use MPG: Tracking In-Use MPG, as opposed to EPA sticker MPG, would
provide a more accurate measure of fleet-wide fuel economy. The Energy
Information Administration (EIA) has developed and implemented an In-Use
MPG estimate for vehicle fleets in the NHTS (U.S. EIA, 2011). In-Use MPG is
imputed in two steps. First, the commonly reported EPA Composite MPG of each
vehicle is adjusted based upon on-road testing to yield an On-Road MPG. The
On-Road MPG is further adjusted to reflect differences in vehicle performance
based upon seasonal differences and annual miles driven, to yield the In-Use
MPG.

The Vermont Transportation Energy Profile — 2017
49
The adjustment process assumes that vehicles with a higher annual VMT are
used for a higher proportion of longer trips, with fewer stops and higher speeds,
than lower-annual-VMT vehicles. It is recommended here that In-Use MPG be
used in computing the fleet-wide fuel economy, as it more accurately reflects the
fuel economy experienced by Vermont drivers.
Transit Energy-Intensity: Tracking the energy intensity of transit services on a
Btu-per-passenger-mile basis using actual use data from Vermont’s transit
authorities is recommended to provide a clearer picture of transit ’s contribution
to reducing transportation energy use.
Park-and-Ride Space Utilization: Measuring and tracking the occupancy of
spaces at each park-and-ride is recommended to provide a better measure of the
utility of park-and-ride facilities.
New Development Density: Tracking the density of new development will be
necessary to track progress against the strategy related to transit -supportive
development in the CEP. Measuring the total area of transit-supportive zones
(see Belz et. al., 2010) that fall within Census urban areas would be one method
of tracking the impact of new development of density.
8.3 New Data Needed
In order to measure the energy intensity of a transit bus, the length of the
transit trip, and the average occupancy of the vehicle are needed, along with the
vehicle make, model, and year. Some of these data could come through a
coordinated rider survey administered to all of the transit providers in the state,
connecting specific riders with routes, origins, and destinations.
An improved understanding of bicycle and pedestrian miles traveled (BPMT) in
Vermont would require a formalized, structured program of cyclist and
pedestrian counts throughout the state.
A better understanding of the displacement effects of passenger rail travel in
Vermont can be gained through a rider survey of passengers on the Ethan Allen
and the Vermonter lines. The focus of the survey would be the relationship
between Amtrak use and private passenger vehicle use by riders of Amtrak,
including the factors that influence their decisions to use passenger rail.
In order to effectively track progress on park-and-ride utilization, it is necessary
to improve the tracking of the specific number of parking spaces available at
each lot. Tracking use of park-and-ride lots statewide would involve week-long
observations focused on the peak periods of use but including all seven days of
the week, repeated three to four times per year. These observation periods can
be supplemented with user intercept surveys that are focused on connecting the
use of facility with specific origins, destinations, and modes.
8.4 Improved Modeling Needed
A model that connects the actual make and model of each vehicle in Vermont
from the DMV registration data with its use (in miles) in the current year will
improve upon the current estimate of statewide fleet fuel efficiency that does not
The Vermont Transportation Energy Profile — 2017
50
account for the annual mileage of each vehicle . Current use of the vehicle may
be obtainable through vehicle inspection records, which commonly note the
odometer reading on the inspected vehicle.
A modified annual estimate of VMT per driver can be made, which excludes a
representative portion (about 2%) of the FHWA-based value to account for pass-
through travel, based on the results of the 2009 NHTS.
Incorporating a bus-transit sub-module into the Vermont Travel Model would
allow quantification of average occupancies and trip lengths for specific fixed
routes, which could then be linked to specific vehicles from the providers,
leading to new metrics of average energy intensity for transit buses in Vermont
and total transit-passenger miles of travel in Vermont.
An effective statewide program and bike and pedestrian counts could be used to
develop a model of total biking and walking miles traveled in Vermont.
The displacement of privately owned vehicle miles of travel by Amtrak rail
ridership can be identified and tracked with a corridor-based analysis
implemented with the Vermont Travel Model.
Commercial truck freight can be tracked in the Vermont Travel Model if an
augmented freight sub-module is incorporated into the Model. The augmented
freight sub-module would allow freight movements by truck to be tracked along
specific corridors also served by freight rail, so the corridor-specific mode shares
can be assessed and tracked.
The Vermont Transportation Energy Profile — 2017
51
9 Conclusions
The 2016 CEP sets forth an energy vision that requires rapid changes in
transportation energy use patterns relative to trends in the recent past. This
includes reducing total transportation energy use by 20% from 2015 levels and
reducing GHG emissions by 30% from 1990 levels by 2025. Achieving this ambitious
vision will require a combination of reducing VMT and reducing the energy used –
and GHGs emitted – per mile traveled. Reducing VMT can be achieved by increasing
vehicle occupancy and by shifting passenger vehicle trips to rail, transit, walking,
and biking trips. Reducing energy use per mile traveled can be achieved by
increasing the fuel economy of the vehicle fleet. Increasing vehicle electrification is
one important avenue for improving fuel economy and reducing GHG intensity per
mile traveled. PEVs offer significant energy and GHG savings relative to ICEV
vehicles and are available in an increasing range of vehicle body types, electric
ranges, and price points. The CEP provides targets related to many of these
strategies. To date, however, the State is lagging behind the rate of change required
to achieve each of the targets evaluated in this Profile.
Current progress toward the CEP targets suggests that additional policy initiatives
may be needed. As laid out in the CEP, a variety of policy tools are available to
accelerate progress toward these targets. These tools include strategic investments
in needed infrastructure (e.g. supporting the deployment of PEV charging facilities
and road infrastructure that supports safe walking and biking), public
outreach/information sharing (e.g. the GoVermont program, partnerships with Drive Electric Vermont, the Vermont Clean Cities Coalition, and other groups), regulatory
mechanisms (e.g. development standards that support smart growth) , and market
mechanisms (e.g. PEV purchase rebates). Given the rapid changes envisioned in the
CEP, policy changes that would promote behavior change in the near-term may be
highly desirable.
Two areas of additional research may be helpful in this process. The first area of
research is to evaluate the efficacy of each of the nine supporting objectives toward
achieving the three overarching transportation goals (e.g. what are the relative
impacts of increasing transit ridership and increasing PEV registration on total
energy use?). The second area of research is to determine what policy levers can be
used to achieve these objectives most effectively (e.g. are vehicle pricing incentives
or improved charging infrastructure more effective at increasing PEV sales?).
Greater understanding of these issues can support more effective strategies for
achieving CEP targets.

The Vermont Transportation Energy Profile — 2017
52
10 References
ACS. 2010–2017. 2009–2015 Data Release of the American Community Survey.
Annual national survey conducted by the U.S. Census Bureau.
AFDC 2017. Hybrid and Plug-in Electric Vehicle Emissions Data Sources and
Assumptions. U.S. Department of Energy. Accessed at
https://www.afdc.energy.gov/vehicles/electric_emissions_sources.html August 2017.
Aultman-Hall, Lisa, and Jonathan Dowds. 2017. “Designing the All -in-One Vermont
Transportation Survey.” TRC Report #17-004. UVM Transportation Research
Center. http://www.uvm.edu/trc/research-reports/.
Belz, Nathan P., Gopal R. Patil, and Lisa Aultman-Hall. 2010. Spatial Models for
the Statewide Evaluation of Transit-Supportive Zones. Compendium of Papers for
the Transportation Research Board’s 89th Annual Meeting, Paper No. 10 -2118
Bhat, C. R., S. Sen, and N. Eluru. The impact of demographics, built environment
attributes, vehicle characteristics, and gasoline prices on household vehicle holdings
and use. Transportation Research Part B: Methodological , Vol. 43, No. 1, Jan. 2009,
pp. 1–18.
Blumenberg, Evelyn, Brian D. Taylor, Michael Smart, Kelcie Ralph, Madeline
Wander, and Stephen Brumbaugh. 2013. The Next Generation of Travel: Statistical
Analysis. Office of Transportation Policy Studies, FHWA. Accessed at
https://www.fhwa.dot.gov/policy/otps/nextgen_stats/nextgen.pdf on 9/17/2015.
Busse, M. R., D. G. Pope, J. C. Pope, and J. Silva-Risso. The Psychological Effect of
Weather on Car Purchases. The Quarterly Journal of Economics, Vol. 130, No. 1,
Feb. 2015, pp. 371–414.
ChargePoint, 2017. Electricity demand at ChargePoint stations in Vermont.
Provided by ChargePoint, September 2017.
Clewlow, Regina R. 2016. “Carsharing and Sustainable Travel Behavior: Results from the
San Francisco Bay Area.” Transportation Policy 51 (October):158–64.
https://doi.org/10.1016/j.tranpol.2016.01.013.
Davis, Stacy C., Susan E Williams, and Robert G. Boundy. 2016. Transportation
Energy Data Book: Edition 35 Prepared for the Vehicle Technologies Program,
Office of Energy Efficiency and Renewable Energy, U.S. Department of Energy by
the Oak Ridge National Laboratory. October 2016.
Davis, Wayne, 2017. Park-and-Ride Summary data transfer from Wayne Davis,
Project Supervisor, Vermont Agency of Transportation, September 2017.
Drive Electric Vermont, 2017. Electric Vehicles Registered in Vermont.
FHWA, 2008–2016. Highway Statistics 2007–2015. Published by the Office of
Highway Policy Information, Highway Statistics Series of the Federal Highway
Administration.

The Vermont Transportation Energy Profile — 2017
53
FHWA, 2015. Average Annual Miles per Driver by Age Group. Published by the
Office of Highway Policy Information of the Federal Highway Administration.
Accessed at https://www.fhwa.dot.gov/ohim/onh00/bar8.htm on September 17, 2015.
GMP, 2017. Sample electricity demand at GMP stations. Provided by Green
Mountain Power, August 2017.
Grenzeback, L.R., A. Brown, M.J. Fischer, N. Hutson, C.R. Lamm, Y.L. Pei, L.
Vimmerstedt, A.D. Vyas, and J.J. Winebrake. 2013. Freight Transportation
Demand: Energy-Efficient Scenarios for a Low-Carbon Future. Transportation
Energy Futures Series. Prepared by Cambridge Systematics, Inc., and the National
Renewable Energy Laboratory (Golden, CO) for the U.S. Department of Energy,
Washington, DC. DOE/GO-102013-3711. 82 pp.
KFH Group, 2017. Public Transit Route Performance Reviews: Annual Report for
State Fiscal Year 2016. Vermont Agency of Transportation.
Lovejoy, Kristin, Susan Handy, and Marlon G. Boarnet. 2013. Impacts of
Carsharing on Passenger Vehicle Use and Greenhouse Gas Emissions. California
Air Resource Board.
Martin, Elliot, Susan Shaheen, and Jeffrey Lidicker. 2010. “Impact of Carsharing on
Household Vehicle Holdings.” Transportation Research Record: Journal of the Transportation Research Board 2143 (October):150–58. https://doi.org/10.3141/2143-19.
McCahill, Chris. “VMT Growth Continued, Slowed in 2016.” State Smart
Transportation Initiative. Accessed at http://www.ssti.us/2017/05/vmt-growth-
continued-slowed-in-2016/ Aug. 2017.
McDonald, Ross, 2017. Personal Communication with Ross McDonald, Go! Vermont
Program Manager, Vermont Agency of Transportation, August 2017.
Onat, Nuri Cihat, Murat Kucukvar, and Omer Tatari. 2015. “Conventional, Hybrid, Plug-in
Hybrid or Electric Vehicles? State-Based Comparative Carbon and Energy Footprint
Analysis in the United States.” Applied Energy 150 (Supplement C):36–49.
https://doi.org/10.1016/j.apenergy.2015.04.001.
ORNL, 2017. Freight Analysis Framework Version 4. Developed by the Center for
Transportation Analysis in the Oak Ridge National Laboratory. Accessed at
http://faf.ornl.gov/fafweb/Extraction0.aspx in August 2017.
Pappis, Costa, 2015. Amtrak Vermont Station Ridership FY 2003–2014. Provided by
Costa Pappis, Modal Planner, Vermont Agency of Transportation, July 2015.
Pelletier, Dave, 2017. Public Transit Route Performance Report source data.
Provided by Dave Pelletier, Vermont Agency of Transportation, September 2017.
RSG, 2016. “LRTP Public Opinion Survey.” Vermont Agency of Transportation.
Accessed at
http://vtrans.vermont.gov/sites/aot/files/planning/documents/planning/VTrans%20L
RTP%20Survey%20Report%20Final%202016.pdf in August 2017.
Shaheen, Susan A., and Adam P. Cohen. 2013. “Carsharing and Personal Vehicle Services:
Worldwide Market Developments and Emerging Trends.” International Journal of Sustainable Transportation 7 (1):5–34. https://doi.org/10.1080/15568318.2012.660103.
The Vermont Transportation Energy Profile — 2017
54
STB, 2017. Revised 2014 Public Use Waybill Sample. Industry Data of the Surface
Transportation Board. Accessed at
https://www.stb.gov/stb/industry/econ_waybill.html in August 2017.
USCB, 2009. Annual Estimates of the Resident Population for the United States,
Regions, States, and Puerto Rico: April 1, 2000 to July 1, 2009 (NST-EST2009-01).
Created by the US Census Bureau, Population Division. Accessed at
http://www.census.gov/popest/data/historical/2000s/vintage_2009/index.html in May
2015.
USCB, 2014. Annual Estimates of the Resident Population: April 1, 2010 to July 1,
2013. Created by the U.S. Census Bureau, Population Division. Accessed at
http://factfinder.census.gov/faces/tableservices/jsf/pages/productview.xhtml?pid=PE
P_2013_PEPANNRES&prodType=table in May 2015.
USCB, 2016. Annual Estimates of the Resident Population: April 1, 2010 to July 1,
2016. Created by the U.S. Census Bureau, Population Division. Accessed at
https://factfinder.census.gov/faces/tableservices/jsf/pages/productview.xhtml?pid=PE
P_2016_PEPAGESEX&prodType=table in July 2017.
U.S. DOE & U.S. EPA. 2017. “Fuel Economy Guide: Datasets and Guides for Individual
Model Years.” http://www.fueleconomy.gov/feg/download.shtml.
USDOT, 2010. The 2009 National Household Travel Survey. Accessed at
http://nhts.ornl.gov/.
U.S. EPA, 2016a. State Level CO2 Emissions from Fossil Fuel Combustion. U.S.
Environmental Protection Agency. Accessed at
https://www.epa.gov/statelocalenergy/state-co2-emissions-fossil-fuel-combustion.
U.S. EPA 2016b. Using MOVES for Estimating State and Local Inventories of
Onroad Greenhouse Gas Emissions and Energy Consumption. U.S. Environmental
Protection Agency.
U.S. EPA 2016c. Greenhouse Gas Inventory Guidance Direct Emissio ns from Mobile
Combustion Sources. U.S. Environmental Protection Agency.
U.S. EIA, 2017. State Energy Data System (SEDS): 1960–2015 (Complete). Profile
data from the U.S. Energy Information Administration. Accessed at
http://www.eia.gov/state/seds/seds-data-complete.cfm in August 2017.
U.S. EIA, 2017b. Monthly Energy Review. Accessed at
http://www.eia.gov/state/seds/seds-data-complete.cfm in August 2017.
VDMV, 2015. Vermont Motor Vehicle Registration Database 2011 through 2015.
Provided by the Vermont Department of Motor Vehicles of the Agency of
Transportation.
VDMV, 2017. Vermont Motor Vehicle Registration Database 2015 through 2017.
Provided by the Vermont Department of Motor Vehicles of the Agency of
Transportation.
VDPS, 2016. Comprehensive Energy Plan 2016. Prepared by the Vermont
Department of Public Service, January 2016.

The Vermont Transportation Energy Profile — 2017
55
Vermont Gas, 2017. Natural-Gas Vehicle Market Information through May 2017.
Data received from Vermont Gas Systems, Inc. in August 2017.
VT ANR, 2017. Vermont Greenhouse Gas Emissions Inventory Update 1990-2013.
Vermont Agency of Natural Resources. Accessed at
http://dec.vermont.gov/sites/dec/files/aqc/climate-
change/documents/_Vermont_Greenhouse_Gas_Emissions_Inventory_Update_1990-
2013.pdf.
VT JFO, 2017. Transportation Revenue Monthly Collections, Vermont Legislative
Joint Fiscal Office. Accessed at http://www.leg.state.vt.us/jfo/revenue_tax.aspx, on
August, 2017.
VTrans, 2015. Vermont State Rail Plan—2015: DRAFT: June 19, 2015. Vermont
Agency of Transportation.
VTrans, 2017a. Vermont Park and Rides. Created by VTrans Park-and-Ride
Program. Accessed at http://parkandrides.vermont.gov/ on August 31, 2017.


![of Vermont Agency ojTransportation AOT -Traffic …54.172.27.91/transportation/speed/Request_ORWL_VT22A_2012.pdf · [phone1 Ifax] [ttd] RE: Speed Limit Request, VT 22A, Orwell](https://img.pdfslide.net/doc/110x75/5adf23107f8b9afd1a8c4bd7/of-vermont-agency-ojtransportation-aot-traffic-541722791transportationspeedrequestorwlvt22a2012pdfphone1.jpg)