Embed Size (px)
Citation preview
THE 2018 ANNUAL REPORT OF THE BOARD OF TRUSTEES OF THE FEDERAL OLD-AGE AND SURVIVORS
INSURANCE AND FEDERAL DISABILITY INSURANCE TRUST FUNDS
COMMUNICATION
FROM
THE BOARD OF TRUSTEES, FEDERAL OLD-AGE AND SURVIVORS INSURANCE AND FEDERAL DISABILITY
INSURANCE TRUST FUNDS
TRANSMITTING
THE 2018 ANNUAL REPORT OF THE BOARD OF TRUSTEES OF THE FEDERAL OLD-AGE AND SURVIVORS INSURANCE AND FEDERAL
DISABILITY INSURANCE TRUST FUNDS

.


CONTENTS
(V)
I. INTRODUCTION . . . . . . . . . . . . . . . . . . . . . . . . . . . . . . . . . . . 1
II. OVERVIEW . . . . . . . . . . . . . . . . . . . . . . . . . . . . . . . . . . . . . . . 2A. HIGHLIGHTS . . . . . . . . . . . . . . . . . . . . . . . . . . . . . . . . . . . . 2B. TRUST FUND FINANCIAL OPERATIONS IN 2017 . . . . . . . 7C. ASSUMPTIONS ABOUT THE FUTURE . . . . . . . . . . . . . . . . 9D. PROJECTIONS OF FUTURE FINANCIAL STATUS . . . . . . . 10E. CONCLUSION. . . . . . . . . . . . . . . . . . . . . . . . . . . . . . . . . . . . 23
III. FINANCIAL OPERATIONS OF THE TRUST FUNDS ANDLEGISLATIVE CHANGES IN THE LAST YEAR . . . . . . . . . . 25A. OPERATIONS OF THE OLD-AGE AND SURVIVORS
INSURANCE (OASI) AND DISABILITY INSURANCE (DI) TRUST FUNDS, IN CALENDAR YEAR 2017 . . . . . . . . . . . . 251. OASI Trust Fund . . . . . . . . . . . . . . . . . . . . . . . . . . . . . . . . . 252. DI Trust Fund . . . . . . . . . . . . . . . . . . . . . . . . . . . . . . . . . . . 303. OASI and DI Trust Funds, Combined . . . . . . . . . . . . . . . . . . 32
B. SOCIAL SECURITY AMENDMENTS SINCE THE 2017 REPORT . . . . . . . . . . . . . . . . . . . . . . . . . . . . . . . . . . . . 37
IV. ACTUARIAL ESTIMATES . . . . . . . . . . . . . . . . . . . . . . . . . . . . 38A. SHORT-RANGE ESTIMATES . . . . . . . . . . . . . . . . . . . . . . . . 40
1. Operations of the OASI Trust Fund. . . . . . . . . . . . . . . . . . . . 412. Operations of the DI Trust Fund . . . . . . . . . . . . . . . . . . . . . . 443. Operations of the Combined OASI and DI Trust Funds . . . . . 474. Factors Underlying Changes in 10-Year Trust Fund Ratio
Estimates From Last Year’s Report . . . . . . . . . . . . . . . . . . . 49B. LONG-RANGE ESTIMATES . . . . . . . . . . . . . . . . . . . . . . . . . 51
1. Annual Income Rates, Cost Rates, and Balances . . . . . . . . . . 522. Comparison of Workers to Beneficiaries . . . . . . . . . . . . . . . . 613. Trust Fund Ratios and Test of Long-Range
Close Actuarial Balance . . . . . . . . . . . . . . . . . . . . . . . . . . . . 644. Summarized Income Rates, Summarized Cost Rates,
and Actuarial Balances . . . . . . . . . . . . . . . . . . . . . . . . . . . . 675. Open Group Unfunded Obligation . . . . . . . . . . . . . . . . . . . . 716. Reasons for Change in Actuarial Balance From Last Report . . 73
(VI)
V. ASSUMPTIONS AND METHODS UNDERLYINGACTUARIAL ESTIMATES . . . . . . . . . . . . . . . . . . . . . . . . . . . . 80A. DEMOGRAPHIC ASSUMPTIONS AND METHODS . . . . . . . 81
1. Fertility Assumptions. . . . . . . . . . . . . . . . . . . . . . . . . . . . . . 812. Mortality Assumptions. . . . . . . . . . . . . . . . . . . . . . . . . . . . . 823. Immigration Assumptions . . . . . . . . . . . . . . . . . . . . . . . . . . 864. Total Population Estimates . . . . . . . . . . . . . . . . . . . . . . . . . . 925. Life Expectancy Estimates . . . . . . . . . . . . . . . . . . . . . . . . . . 94
B. ECONOMIC ASSUMPTIONS AND METHODS . . . . . . . . . . . 981. Productivity Assumptions . . . . . . . . . . . . . . . . . . . . . . . . . . 992. Price Inflation Assumptions . . . . . . . . . . . . . . . . . . . . . . . . . 993. Average Earnings Assumptions . . . . . . . . . . . . . . . . . . . . . . 1014. Assumed Real-Wage Differential . . . . . . . . . . . . . . . . . . . . . 1045. Labor Force and Unemployment Projections . . . . . . . . . . . . . 1066. Gross Domestic Product Projections . . . . . . . . . . . . . . . . . . . 1097. Interest Rates . . . . . . . . . . . . . . . . . . . . . . . . . . . . . . . . . . . 110
C. PROGRAM-SPECIFIC ASSUMPTIONS AND METHODS . . . 1141. Automatically Adjusted Program Parameters. . . . . . . . . . . . . 1142. Covered Employment . . . . . . . . . . . . . . . . . . . . . . . . . . . . . 1223. Insured Population. . . . . . . . . . . . . . . . . . . . . . . . . . . . . . . . 1234. Old-Age and Survivors Insurance Beneficiaries . . . . . . . . . . . 1255. Disability Insurance Beneficiaries. . . . . . . . . . . . . . . . . . . . . 1326. Covered and Taxable Earnings, Taxable Payroll, and
Payroll Tax Contributions . . . . . . . . . . . . . . . . . . . . . . . . . . 1427. Income From Taxation of Benefits . . . . . . . . . . . . . . . . . . . . 1478. Average Benefits . . . . . . . . . . . . . . . . . . . . . . . . . . . . . . . . . 1489. Scheduled Benefits . . . . . . . . . . . . . . . . . . . . . . . . . . . . . . . 148
10. Illustrative Scheduled Benefit Amounts . . . . . . . . . . . . . . . . 14911. Administrative Expenses . . . . . . . . . . . . . . . . . . . . . . . . . . . 15112. Railroad Retirement Financial Interchange . . . . . . . . . . . . . . 151
VI. APPENDICES . . . . . . . . . . . . . . . . . . . . . . . . . . . . . . . . . . . . . . 153A. HISTORY OF OASI AND DI TRUST FUND OPERATIONS. . 153B. HISTORY OF ACTUARIAL STATUS ESTIMATES . . . . . . . . 164C. FISCAL YEAR HISTORICAL AND PROJECTED
TRUST FUND OPERATIONS THROUGH 2027 . . . . . . . . . . . 170D. LONG-RANGE SENSITIVITY ANALYSIS . . . . . . . . . . . . . . 177
1. Total Fertility Rate . . . . . . . . . . . . . . . . . . . . . . . . . . . . . . . 1772. Death Rates. . . . . . . . . . . . . . . . . . . . . . . . . . . . . . . . . . . . . 1783. Immigration . . . . . . . . . . . . . . . . . . . . . . . . . . . . . . . . . . . . 1804. Real-Wage Differential . . . . . . . . . . . . . . . . . . . . . . . . . . . . 1815. Consumer Price Index . . . . . . . . . . . . . . . . . . . . . . . . . . . . . 1826. Real Interest Rate . . . . . . . . . . . . . . . . . . . . . . . . . . . . . . . . 184
(VII)
7. Taxable Ratio . . . . . . . . . . . . . . . . . . . . . . . . . . . . . . . . . . . 1858. Disability Incidence Rates . . . . . . . . . . . . . . . . . . . . . . . . . . 1869. Disability Termination Rates . . . . . . . . . . . . . . . . . . . . . . . . 187
E. STOCHASTIC PROJECTIONS AND UNCERTAINTY . . . . . . 1891. Background. . . . . . . . . . . . . . . . . . . . . . . . . . . . . . . . . . . . . 1892. Stochastic Methodology . . . . . . . . . . . . . . . . . . . . . . . . . . . . 1893. Stochastic Results . . . . . . . . . . . . . . . . . . . . . . . . . . . . . . . . 1914. Comparison of Results: Stochastic to Low-Cost,
Intermediate, and High-Cost Alternatives . . . . . . . . . . . . . . . 193F. INFINITE HORIZON PROJECTIONS . . . . . . . . . . . . . . . . . . 199G. ESTIMATES FOR OASDI AND HI, SEPARATE AND
COMBINED. . . . . . . . . . . . . . . . . . . . . . . . . . . . . . . . . . . . . . 2031. Estimates as a Percentage of Taxable Payroll. . . . . . . . . . . . . 2032. Estimates as a Percentage of Gross Domestic Product . . . . . . 2093. Estimates in Dollars . . . . . . . . . . . . . . . . . . . . . . . . . . . . . . . 214
H. ANALYSIS OF BENEFIT DISBURSEMENTS FROM THE OASI TRUST FUND WITH RESPECT TO DISABLED BENEFICIARIES . . . . . . . . . . . . . . . . . . . . . . . . . . . . . . . . . . 226
I. GLOSSARY . . . . . . . . . . . . . . . . . . . . . . . . . . . . . . . . . . . . . . 230
LIST OF TABLES . . . . . . . . . . . . . . . . . . . . . . . . . . . . . . . . . . . . 248
LIST OF FIGURES . . . . . . . . . . . . . . . . . . . . . . . . . . . . . . . . . . . 253
INDEX. . . . . . . . . . . . . . . . . . . . . . . . . . . . . . . . . . . . . . . . . . . . . . 255
STATEMENT OF ACTUARIAL OPINION . . . . . . . . . . . . . . . 260

THE 2018 ANNUAL REPORT OF THE BOARD OFTRUSTEES OF THE FEDERAL OLD-AGE AND
SURVIVORS INSURANCE AND FEDERAL DISABILITYINSURANCE TRUST FUNDS
I. INTRODUCTIONThe Old-Age, Survivors, and Disability Insurance (OASDI) program makesmonthly income available to insured workers and their families at retirement,death, or disability. The OASDI program consists of two parts. Retired work-ers, their families, and survivors of deceased workers receive monthly bene-fits under the Old-Age and Survivors Insurance (OASI) program. Disabledworkers and their families receive monthly benefits under the DisabilityInsurance (DI) program.The Social Security Act established the Board of Trustees to oversee thefinancial operations of the OASI and DI Trust Funds. The Board is com-posed of six members. Four members serve by virtue of their positions in theFederal Government: the Secretary of the Treasury, who is the ManagingTrustee; the Secretary of Labor; the Secretary of Health and Human Ser-vices; and the Commissioner of Social Security. The President appoints andthe Senate confirms the other two members to serve as public representa-tives. These two positions are currently vacant. The Deputy Commissionerof the Social Security Administration serves as Secretary of the Board.The Social Security Act requires that the Board, among other duties, reportannually to the Congress on the actuarial status and financial operations ofthe OASI and DI Trust Funds. The 2018 report is the 78th such report.

Overview
2
II. OVERVIEW
A. HIGHLIGHTS
This section summarizes the report’s major findings.
In 2017
At the end of 2017, the OASDI program was providing benefit payments1 toabout 62 million people: 45 million retired workers and dependents of retiredworkers, 6 million survivors of deceased workers, and 10 million disabledworkers and dependents of disabled workers. During the year, an estimated174 million people had earnings covered by Social Security and paid payrolltaxes on those earnings. Total expenditures in 2017 were $952 billion. Totalincome was $997 billion, which consisted of $911 billion in non-interestincome and $85 billion in interest earnings. Asset reserves held in specialissue U.S. Treasury securities grew from $2,848 billion at the beginning ofthe year to $2,892 billion at the end of the year.
Short-Range Results
Under the Trustees’ intermediate assumptions, Social Security’s total cost isprojected to exceed its total income in 2018 for the first time since 1982, andremain higher throughout the projection period. Social Security’s cost hasexceeded its non-interest income since 2010. For 2018, cost for the programis projected to exceed total income by $2 billion and non-interest income by$85 billion. As a result, asset reserves will decline during 2018. Reserves arealso projected to decline throughout the remainder of the short-range period.
To illustrate the actuarial status of the Social Security program as a whole,the operations of the OASI and DI funds are often shown on a combinedbasis as OASDI. However, by law, the two funds are separate entities andtherefore the combined fund operations and reserves are hypothetical.
The reserves of the combined OASI and DI Trust Funds along with projectedprogram income are adequate to cover projected program cost over the next10 years under the intermediate assumptions. The ratio of reserves to annualcost declines from 288 percent at the beginning of 2018 to 137 percent at thebeginning of 2027. By remaining at or above 100 percent, the combinedOASI and DI Trust Funds therefore satisfy the short-range test of financialadequacy.2 Considered separately, the OASI Trust Fund also satisfies the
1 The definitions of “benefit payments” and other terms appear in the Glossary. 2 The test of short-range financial adequacy for a trust fund is met if (1) the estimated trust fund ratio is atleast 100 percent at the beginning of the period and remains at or above 100 percent throughout the 10-yearshort-range period or (2) the ratio is initially less than 100 percent, reaches at least 100 percent within5 years (without reserve depletion at any time during this period) and remains at or above 100 percentthroughout the remainder of the 10-year short-range period.

3
Highlights
test, but the DI Trust Fund does not. For last year’s report, the Trustees pro-jected that combined reserves would be 287 percent of annual cost at thebeginning of 2018 and 148 percent at the beginning of 2027. The combinedreserves are projected to decrease from $2,892 billion at the beginning of2018 to $2,189 billion at the end of 2027.
Long-Range Results
Under the Trustees’ intermediate assumptions, OASDI cost is projected toexceed total income throughout the projection period, and the dollar level ofthe hypothetical combined trust fund reserves declines until reserves becomedepleted in 2034.1 Figure II.D2 shows the implications of reserve depletionfor the combined OASI and DI Trust Funds. Considered separately, the DITrust Fund reserves become depleted in 2032 and the OASI Trust Fundreserves become depleted in 2034. In last year’s report, the projected reservedepletion years were 2034 for OASDI, 2028 for DI, and 2035 for OASI.
The change in the reserve depletion date for DI is largely due to continuingfavorable experience for DI applications and benefit awards. Disabilityapplications have been declining steadily since 2010, and the total number ofdisabled-worker beneficiaries in current payment status has been fallingsince 2014. For this report, ultimate disability incidence rate assumptions areunchanged from the last report. However, this year’s report has lower inci-dence rates over the first few years of the projection period, and a gradualrise from recent low levels, reaching the ultimate DI incidence rates by theend of the short-range period. In addition, average benefit levels for dis-abled-worker beneficiaries were lower than expected in 2017, and areexpected to be lower in the future. Disabled-worker average benefit levelswere somewhat elevated in 2011 through 2016 due to reduced numbers ofhearings decisions (where monthly benefit levels tend to be relatively low),as the number of applicants awaiting a hearing increased. In 2017, hearingsdecisions increased, thus restoring a more normal, and somewhat lower,average benefit level for disabled workers newly awarded benefits in 2017.See page 38 for more details on these changes in DI projections. Thesechanges, which are partially offset by lower payroll tax revenue in the nearterm, are primarily responsible for the change in the DI reserve depletion
1 Combined trust fund reserves are clearly hypothetical after one fund becomes depleted, because under cur-rent law the funds cannot borrow from each other. For example, if the DI Trust Fund reserves were tobecome depleted in 2032 as is currently projected, the operations of the OASI and DI Trust Funds, shown inthis report on a hypothetical combined basis, would not reflect the aggregated operation of the OASI TrustFund and the DI Trust Fund because part of the DI benefits could not be paid without a change in the law.Implicitly, the values shown for the hypothetical combined trust funds assume the law will have beenchanged to permit the transfer of resources between funds as needed.

Overview
4
date from early in 2028 in last year’s report to late in 2032 in this year’sreport.
Projected OASDI cost increases more rapidly than projected non-interestincome through 2039 primarily because the retirement of the baby-boomgeneration will increase the number of beneficiaries much faster than thenumber of covered workers increases, as subsequent lower-birth-rate genera-tions replace the baby-boom generation at working ages. From 2040 to 2052,the cost rate (the ratio of program cost to taxable payroll) generally declinesbecause the aging baby-boom generation is gradually replaced at retirementages by subsequent lower-birth-rate generations. Thereafter, increases in lifeexpectancy cause OASDI cost to increase generally relative to non-interestincome, but more slowly than between 2010 and 2039.
The projected OASDI annual cost rate increases from 13.81 percent of tax-able payroll for 2018 to 16.83 percent for 2039 and to 17.68 percent for2092, a level that is 4.32 percent of taxable payroll more than the projectedincome rate (the ratio of non-interest income to taxable payroll) for 2092.For last year’s report, the Trustees estimated the OASDI cost for 2092 at17.84 percent, or 4.53 percent of payroll more than the annual income ratefor that year. Expressed in relation to the projected gross domestic product(GDP), OASDI cost generally rises from 4.9 percent of GDP for 2018 toabout 6.1 percent by 2038, then declines to 5.9 percent by 2052, and thengenerally increases to 6.1 percent by 2092.
For the 75-year projection period, the actuarial deficit is 2.84 percent of tax-able payroll, increased from 2.83 percent of taxable payroll in last year’sreport. The closely-related open group unfunded obligation for OASDI overthe 75-year period is 2.68 percent of taxable payroll, increased from2.66 percent of payroll in last year’s report. The open group unfunded obli-gation for OASDI over the 75-year period is $13.2 trillion in present valueand is $0.7 trillion more than the measured level of $12.5 trillion a year ago.If the assumptions, methods, starting values, and the law had all remainedunchanged, the actuarial deficit would have increased to 2.88 percent of tax-able payroll, and the unfunded obligation would have risen to about2.72 percent of taxable payroll and $13.1 trillion in present value due to thechange in the valuation date. The remaining changes in the actuarial deficitand the unfunded obligation are due to the combined effects of changes inthe law, methods, starting values, and assumptions.
To illustrate the magnitude of the 75-year actuarial deficit, consider that forthe combined OASI and DI Trust Funds to remain fully solvent throughoutthe 75-year projection period: (1) revenues would have to increase by anamount equivalent to an immediate and permanent payroll tax rate increase
5
Highlights
of 2.78 percentage points1 to 15.18 percent, (2) scheduled benefits wouldhave to be reduced by an amount equivalent to an immediate and permanentreduction of about 17 percent applied to all current and future beneficiaries,or about 21 percent if the reductions were applied only to those who becomeinitially eligible for benefits in 2018 or later; or (3) some combination ofthese approaches would have to be adopted.
If substantial actions are deferred for several years, the changes necessary tomaintain Social Security solvency would be concentrated on fewer years andfewer generations. Much larger changes would be necessary if action isdeferred until the combined trust fund reserves become depleted in 2034. Forexample, maintaining 75-year solvency with changes that begin in 2034would require: (1) an increase in revenues by an amount equivalent to a per-manent 3.87 percentage point payroll tax rate increase to 16.27 percent start-ing in 2034, (2) a reduction in scheduled benefits by an amount equivalent toa permanent 23 percent reduction in all benefits starting in 2034, or (3) somecombination of these approaches would have to be adopted.
Conclusion
Under the intermediate assumptions, DI Trust Fund asset reserves are pro-jected to become depleted in 2032, at which time continuing income to theDI Trust Fund would be sufficient to pay 96 percent of DI scheduled bene-fits. The OASI Trust Fund reserves are projected to become depleted in2034, at which time OASI income would be sufficient to pay 77 percent ofOASI scheduled benefits.
The Trustees also project that annual cost for the OASDI program willexceed total income (including interest) throughout the projection periodunder the intermediate assumptions. The projected hypothetical combinedOASI and DI Trust Fund asset reserves become depleted and unable to payscheduled benefits in full on a timely basis in 2034. At the time of depletionof these combined reserves, continuing income to the combined trust fundswould be sufficient to pay 79 percent of scheduled benefits. Lawmakers havea broad continuum of policy options that would close or reduce Social Secu-rity's long-term financing shortfall. Cost estimates for many such policyoptions are available at www.ssa.gov/OACT/solvency/provisions/.
1 The necessary tax rate of 2.78 percent differs from the 2.84 percent actuarial deficit for two reasons. First,the necessary tax rate is the rate required to maintain solvency throughout the period that does not result inany trust fund reserve at the end of the period, whereas the actuarial deficit incorporates an ending trust fundreserve equal to 1 year’s cost. Second, the necessary tax rate reflects a behavioral response to tax ratechanges, whereas the actuarial deficit does not. In particular, the calculation of the necessary tax rateassumes that an increase in payroll taxes results in a small shift of wages and salaries to forms of employeecompensation that are not subject to the payroll tax.

Overview
6
The Trustees recommend that lawmakers address the projected trust fundshortfalls in a timely way in order to phase in necessary changes graduallyand give workers and beneficiaries time to adjust to them. Implementingchanges sooner rather than later would allow more generations to share in theneeded revenue increases or reductions in scheduled benefits and could pre-serve more trust fund reserves to help finance future benefits. Social Securitywill play a critical role in the lives of 63 million beneficiaries and175 million covered workers and their families during 2018. With informeddiscussion, creative thinking, and timely legislative action, Social Securitycan continue to protect future generations.

7
Calendar Year 2017 Operations
B. TRUST FUND FINANCIAL OPERATIONS IN 2017
Table II.B1 shows the income, expenditures, and asset reserves for the OASI,the DI, and the combined OASI and DI Trust Funds in calendar year 2017.
Note: Totals do not necessarily equal the sums of rounded components.
In 2017, net payroll tax contributions accounted for 88 percent of total trustfund income. Net payroll tax contributions consist of taxes paid by employ-ees, employers, and the self-employed on earnings covered by Social Secu-rity. These taxes are paid on covered earnings up to a specified maximumannual amount, which was $127,200 in 2017. Table II.B2 shows the payrolltax rates for 2017.
Four percent of OASI and DI combined Trust Fund income in 2017 camefrom subjecting up to 50 percent of Social Security benefits to Federal per-sonal income taxation for beneficiaries with income (including half of bene-fits and all non-taxable interest received) exceeding specified levels. Interestearned on invested trust fund asset reserves accounted for 9 percent ofOASDI income. The remaining income to the combined OASI and DI TrustFunds, less than 0.01 percent, came from reimbursements from the GeneralFund of the Treasury.1
Table II.B1.—Summary of 2017 Trust Fund Financial Operations[In billions]
OASI DI OASDI
Asset reserves at the end of 2016. . . . . . . . . . . . . . . . . . . . $2,801.3 $46.3 $2,847.7
Total income in 2017 . . . . . . . . . . . . . . . . . . . . . . . . . . . . . 825.6 171.0 996.6Net payroll tax contributions . . . . . . . . . . . . . . . . . . . . . 706.5 167.1 873.6Reimbursement from General Fund of the Treasury . . . a
a Less than $50 million.
a a
Taxation of benefits . . . . . . . . . . . . . . . . . . . . . . . . . . . . 35.9 2.0 37.9Interest . . . . . . . . . . . . . . . . . . . . . . . . . . . . . . . . . . . . . . 83.2 1.9 85.1
Total expenditures in 2017 . . . . . . . . . . . . . . . . . . . . . . . . . 806.7 145.8 952.5
Benefit payments . . . . . . . . . . . . . . . . . . . . . . . . . . . . . . 798.7 142.8 941.5Railroad Retirement financial interchange . . . . . . . . . . 4.3 .2 4.5Administrative expenses . . . . . . . . . . . . . . . . . . . . . . . . 3.7 2.8 6.5
Net increase in asset reserves in 2017 . . . . . . . . . . . . . . . . 19.0 25.1 44.1
Asset reserves at the end of 2017. . . . . . . . . . . . . . . . . . . . 2,820.3 71.5 2,891.8
1 Public Laws 111-312, 112-78, and 112-96 account for most of the reimbursement for the year. These actsspecified General Fund reimbursement for temporary reductions in revenue due to reduced payroll tax ratesfor employees and for self-employed workers for 2011 and 2012.
Overview
8
The Department of the Treasury invests trust fund reserves in interest-bear-ing securities issued by the U.S. Government. In 2017, the combined trustfund reserves earned interest at an effective annual rate of 3.0 percent.
Almost 99 percent of expenditures from the combined OASI and DI TrustFunds in 2017 were retirement, survivor, and disability benefits totaling$941.5 billion. A net payment of $4.5 billion was made to the RailroadRetirement Social Security Equivalent Benefit Account from the combinedOASI and DI Trust Funds, which was about 0.5 percent of total OASDIexpenditures. The administrative expenses of the Social Security programwere $6.5 billion, which was about 0.7 percent of total expenditures.
The trust fund investments provide the basis for paying benefits. Combinedtrust fund reserves increased by $44.1 billion for 2017 because income toeach fund, including interest earned on trust fund reserves, exceeded totalexpenditures. At the end of 2017, the combined reserves of the OASI and theDI Trust Funds were $2,892 billion, or 288 percent of estimated expendi-tures1 for 2018. In comparison, the combined reserves at the end of 2016were 299 percent of actual expenditures for 2017.
Note: Section 833 of Public Law 114-74, the Bipartisan Budget Act of 2015, requires a temporary realloca-tion of the payroll tax rates between the OASI and DI Trust Funds. For earnings in calendar years 2016through 2018, this section increases from 1.80 percent to 2.37 percent the portion of the total 12.40 percentOASDI payroll tax that is directed to the DI Trust Fund. There is a corresponding decrease in the portion ofthe tax rates directed to the OASI Trust Fund for these years.
1 Estimated expenditures are based on the intermediate set of assumptions.
Table II.B2.—Payroll Tax Contribution Rates for 2017[In percent]
OASI DI OASDI
Payroll tax contribution rate for employees. . . . . . . . . . . . . . . . . . . . . . . 5.015 1.185 6.20
Payroll tax contribution rate for employers . . . . . . . . . . . . . . . . . . . . . . . 5.015 1.185 6.20
Payroll tax contribution rate for self-employed persons . . . . . . . . . . . . . 10.030 2.370 12.40

9
Future Assumptions
C. ASSUMPTIONS ABOUT THE FUTUREThe future income and expenditures of the OASI and DI Trust Funds willdepend on many factors, including the size and characteristics of the popula-tion receiving benefits, the level of monthly benefit amounts, the size of theworkforce, and the level of covered workers’ earnings. These factors willdepend in turn on future birth rates, death rates, immigration, marriage anddivorce rates, retirement-age patterns, disability incidence and terminationrates, employment rates, productivity gains, wage increases, inflation, inter-est rates, and many other demographic, economic, and program-specific fac-tors.Table II.C1 presents key demographic, economic, and programmaticassumptions for three alternative scenarios. The intermediate assumptionsreflect the Trustees’ best estimates of future experience. Therefore, most ofthe figures in this overview present outcomes under the intermediateassumptions only. Any projection of the future is, of course, uncertain. Forthis reason, the Trustees also present results under low-cost and high-costalternatives to provide a range of possible future experience. The actualfuture costs are unlikely to be as extreme as those portrayed by the low-costor high-cost projections. A separate section on the uncertainty of the projec-tions, beginning on page 18, highlights the implications of these alternativescenarios.The Trustees reexamine the assumptions each year in light of recent experi-ence and new information. This annual review helps to ensure that the Trust-ees’ assumptions provide the best estimate of future possibilities.
Table II.C1.—Long-Range Valuesa of Key Assumptions for the 75-year Projection Period
a See chapter V for details, including historical and projected values.
Long-range assumptions Intermediate Low-cost High-costDemographic:Total fertility rate (children per woman), for 2027 and later . . . . 2.0 2.2 1.8Average annual percentage reduction in total age-sex-adjusted
death rates from 2017 to 2092. . . . . . . . . . . . . . . . . . . . . . . . . . .77 .41 1.15Average annual net immigration (in thousands) for 2018
to 2092. . . . . . . . . . . . . . . . . . . . . . . . . . . . . . . . . . . . . . . . . . . . 1,272 1,607 952Economic:Average annual percentage change in:
Productivity (total U.S. economy), for 2028 and later . . . . . . . 1.68 1.98 1.38
Average wage in covered employment from 2028 to 2092 . . . 3.80 5.02 2.58Consumer Price Index (CPI-W), for 2021 and later. . . . . . . . . 2.60 3.20 2.00
Average annual real-wage differential (percent) for 2028 to 2092. . . . . . . . . . . . . . . . . . . . . . . . . . . . . . . . . . . . . . . . . . . . 1.20 1.82 .58
Unemployment rate (percent, age-sex-adjusted), for 2027 and later . . . . . . . . . . . . . . . . . . . . . . . . . . . . . . . . . . . . . . . . . . . . . . 5.5 4.5 6.5
Annual trust fund real interest rate (percent), for 2028 and later. 2.7 3.2 2.2Programmatic:Disability incidence rate (per 1,000 exposed, age-sex-adjusted)
in 2092. . . . . . . . . . . . . . . . . . . . . . . . . . . . . . . . . . . . . . . . . . . . 5.4 4.3 6.4Disability recovery rate (per 1,000 beneficiaries, age-sex-
adjusted) in 2092 . . . . . . . . . . . . . . . . . . . . . . . . . . . . . . . . . . . . 10.3 12.5 8.2

Overview
10
D. PROJECTIONS OF FUTURE FINANCIAL STATUS
Short-Range Actuarial Estimates
For the short-range period (2018 through 2027), the Trustees measure finan-cial adequacy by comparing projected asset reserves at the beginning of eachyear to projected program cost for that year under the intermediate set ofassumptions. Maintaining a trust fund ratio of 100 percent or more—that is,reserves at the beginning of each year at least equal to projected cost for theyear—is a good indication that the trust fund can cover most short-term con-tingencies. The projected trust fund ratios under the intermediate assump-tions for the OASI Trust Fund exceed 100 percent throughout the short-rangeperiod. Therefore, OASI satisfies the Trustees’ short-term test of financialadequacy. The DI Trust Fund fails the Trustees’ short-term test of financialadequacy. The Trustees estimate that the DI trust fund ratio was at 48 percentat the beginning of 2018. The projected DI trust fund ratio increases to62 percent at the beginning of 2019, largely due to the temporary payroll taxrate reallocation for 2016 through 2018 from OASI to DI enacted in theBipartisan Budget Act of 2015, and then declines through the end of theshort-range period. On a combined basis, OASDI also satisfies the Trustees’short-term test of financial adequacy. Figure II.D1 shows that the trust fundratio for the combined OASI and DI Trust Funds declines consistently after2010, but remains above 100 percent throughout the short-range period.
Projected OASDI cost exceeds total income (including interest) in 2018 andthroughout the short-range period. In addition, the combined OASI and DITrust Fund reserves will decline in 2018 and throughout the short-rangeperiod. The trust fund ratio also declines throughout the short-range period,as shown in figure II.D1.

11
Future Financial Status
Long-Range Actuarial Estimates
The Trustees use three types of measures to assess the actuarial status of theprogram over the next 75 years: (1) annual cash-flow measures, includingincome rates, cost rates, and balances; (2) trust fund ratios; and (3) summarymeasures such as actuarial balances and open group unfunded obligations.The Trustees express these measures as percentages of taxable payroll, aspercentages of gross domestic product (GDP), or in dollars. The Trusteesalso present summary measures over the infinite horizon in appendix F. Theinfinite horizon values, which are subject to much greater uncertainty, pro-vide an additional indication of Social Security’s very-long-run financialcondition.
The Trustees also apply a test of long-range close actuarial balance eachyear. To satisfy the test, a trust fund must meet two conditions: (1) the trustfund satisfies the test of short-range financial adequacy, and (2) the trust fundratio stays above zero throughout the 75-year projection period, such thatbenefits would be payable in a timely manner throughout the period. The
Figure II.D1.—Short-Range OASI and DI Combined Trust Fund Ratio[Asset reserves as a percentage of annual cost, under Intermediate Assumptions]
0%
50%
100%
150%
200%
250%
300%
350%
400%
450%
500%
2007 2009 2011 2013 2015 2017 2019 2021 2023 2025 2027
Calendar year
Historical Estimated
Minimum level for "short-term financial adequacy"
Overview
12
OASI, DI, and combined OASI and DI Trust Funds all fail the test of long-range close actuarial balance under the intermediate assumptions.
Annual Income Rates, Cost Rates, and Balances
Figure II.D2 illustrates the year-by-year relationship among OASDI income(excluding interest), cost (including scheduled benefits), and expenditures(including payable benefits) for the full 75-year period (2018 through 2092).The figure shows all values as percentages of taxable payroll. Under theintermediate assumptions, demographic factors would by themselves causethe projected cost rate to rise rapidly for the next two decades before levelingoff in about 2035. However, the recent recession temporarily depressed tax-able earnings and increased the number of beneficiaries, which in turnsharply, but temporarily, increased the cost rate starting in 2009. From a peakin 2013, the cost rate declines through 2017 under the economic recoveryand thereafter returns to a gradually rising trend. The projected income rateis stable at about 13 percent throughout the 75-year period.
Annual OASDI cost exceeded non-interest income in 2010 for the first timesince 1983. The Trustees project that cost will continue to exceed non-inter-est income throughout the 75-year valuation period. Beginning in 2018, costexceeds total income, and combined OASI and DI Trust Fund reservesdiminish until they become depleted in 2034. After trust fund reserve deple-tion, continuing income is sufficient to support expenditures at a level of79 percent of program cost for the rest of 2034, declining to 74 percent for2092. Figure II.D2 depicts OASDI operations as a combined whole. How-ever, under current law, the differences between scheduled and payable bene-fits would begin at different times for the program’s two trust funds: in 2032for DI and in 2034 for OASI.
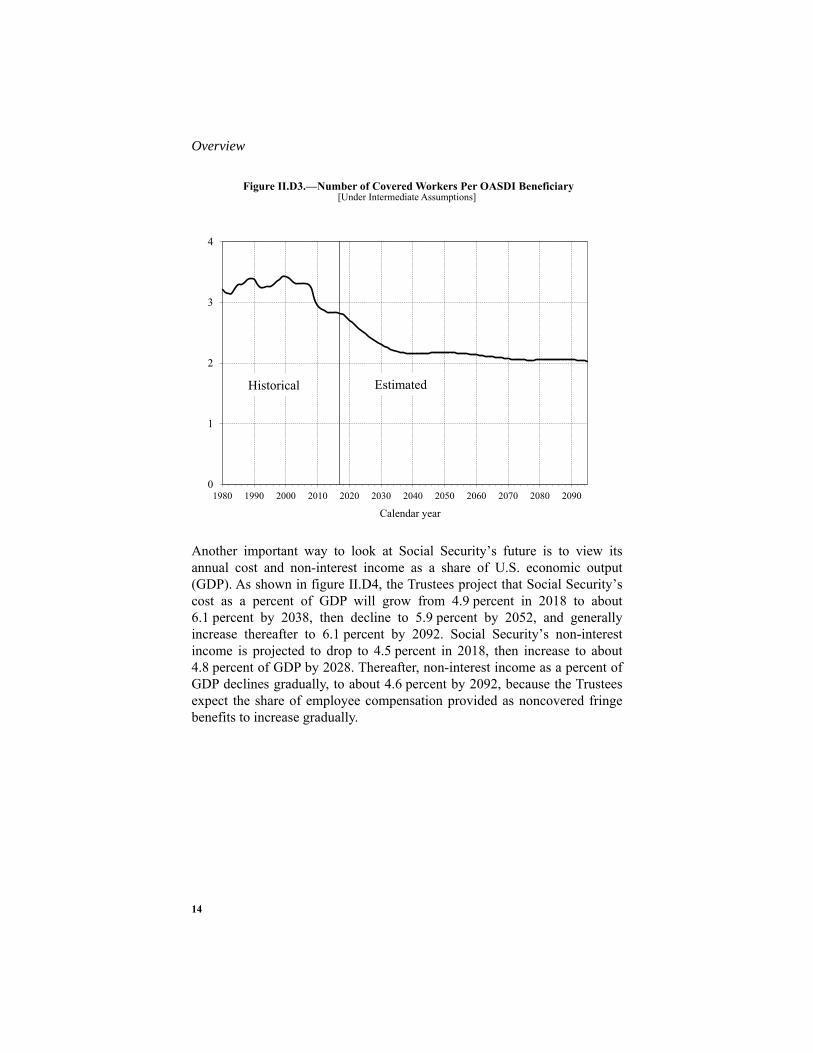
13
Future Financial Status
Figure II.D3 shows the estimated number of covered workers per OASDIbeneficiary. Figures II.D2 and II.D3 illustrate the inverse relationshipbetween cost rates and the number of workers per beneficiary. In particular,the projected future increase in the cost rate reflects a projected decline in thenumber of covered workers per beneficiary. There were about 2.8 workersfor every OASDI beneficiary in 2017. This ratio had been stable, remainingbetween 3.2 and 3.4 from 1974 through 2008, and has declined since thendue to the economic recession and the beginning of the demographic shiftthat will continue to drive this ratio down over the next 20 years. The Trust-ees project that the ratio of workers to beneficiaries will continue to declinedue to this demographic shift , as workers of lower-birth-rate generationsreplace workers of the baby-boom generation. The ratio of workers to benefi-ciaries reaches 2.2 by 2035 when the baby-boom generation will have largelyretired, and will generally decline very gradually thereafter due to increasinglongevity.
Figure II.D2.—OASDI Income, Cost, and Expenditures as Percentages of Taxable Payroll[Under Intermediate Assumptions]
0%
5%
10%
15%
20%
25%
2000 2010 2020 2030 2040 2050 2060 2070 2080 2090
Calendar year
Cost: Scheduled and payable benefits
Non-interest Income
Payable benefits as percentof scheduled benefits:2017-33: 100%2034: 79%2092: 74%
Cost: Scheduled but not fully payable benefits
Expenditures: Payable benefits = income after trust fund depletion in 2034
Overview
14
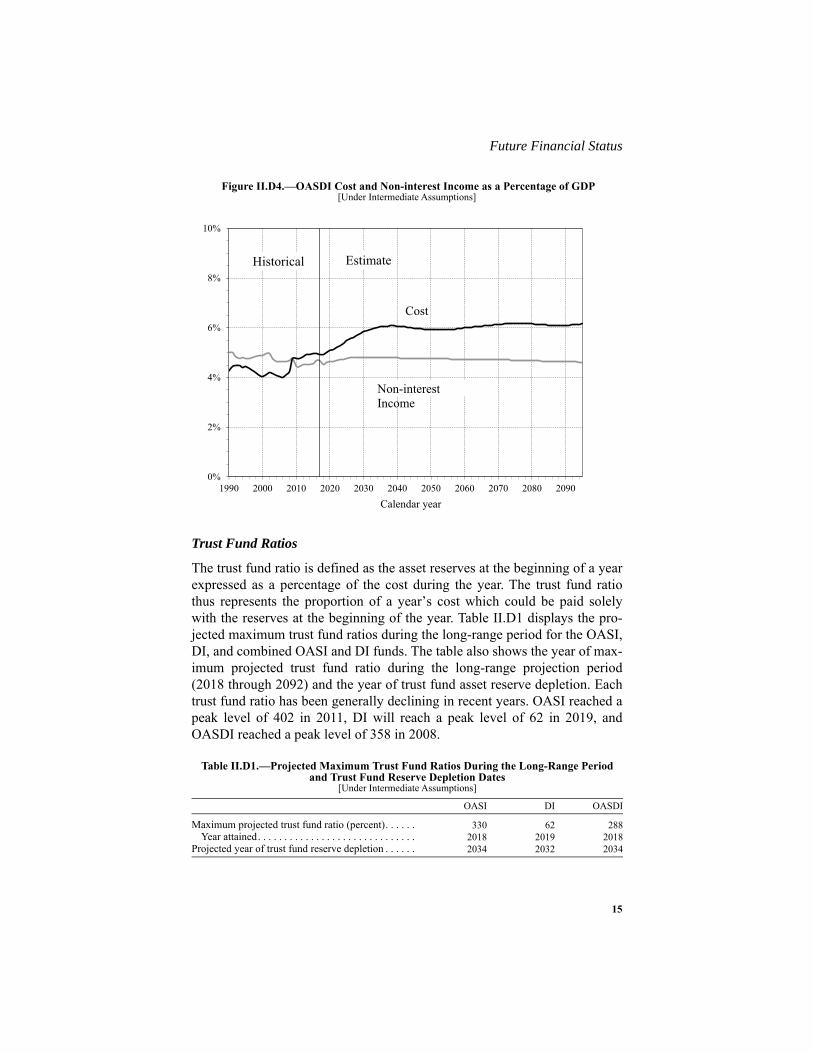
Another important way to look at Social Security’s future is to view itsannual cost and non-interest income as a share of U.S. economic output(GDP). As shown in figure II.D4, the Trustees project that Social Security’scost as a percent of GDP will grow from 4.9 percent in 2018 to about6.1 percent by 2038, then decline to 5.9 percent by 2052, and generallyincrease thereafter to 6.1 percent by 2092. Social Security’s non-interestincome is projected to drop to 4.5 percent in 2018, then increase to about4.8 percent of GDP by 2028. Thereafter, non-interest income as a percent ofGDP declines gradually, to about 4.6 percent by 2092, because the Trusteesexpect the share of employee compensation provided as noncovered fringebenefits to increase gradually.
Figure II.D3.—Number of Covered Workers Per OASDI Beneficiary[Under Intermediate Assumptions]
0
1
2
3
4
1980 1990 2000 2010 2020 2030 2040 2050 2060 2070 2080 2090
Calendar year
EstimatedHistorical
15
Future Financial Status
Trust Fund Ratios
The trust fund ratio is defined as the asset reserves at the beginning of a yearexpressed as a percentage of the cost during the year. The trust fund ratiothus represents the proportion of a year’s cost which could be paid solelywith the reserves at the beginning of the year. Table II.D1 displays the pro-jected maximum trust fund ratios during the long-range period for the OASI,DI, and combined OASI and DI funds. The table also shows the year of max-imum projected trust fund ratio during the long-range projection period(2018 through 2092) and the year of trust fund asset reserve depletion. Eachtrust fund ratio has been generally declining in recent years. OASI reached apeak level of 402 in 2011, DI will reach a peak level of 62 in 2019, andOASDI reached a peak level of 358 in 2008.
Figure II.D4.—OASDI Cost and Non-interest Income as a Percentage of GDP[Under Intermediate Assumptions]
Table II.D1.—Projected Maximum Trust Fund Ratios During the Long-Range Periodand Trust Fund Reserve Depletion Dates
[Under Intermediate Assumptions]
OASI DI OASDI
Maximum projected trust fund ratio (percent). . . . . . 330 62 288Year attained. . . . . . . . . . . . . . . . . . . . . . . . . . . . . . 2018 2019 2018
Projected year of trust fund reserve depletion . . . . . . 2034 2032 2034
0%
2%
4%
6%
8%
10%
1990 2000 2010 2020 2030 2040 2050 2060 2070 2080 2090
Calendar year
Non-interest Income
Historical Estimate
Cost

Overview
16
Summary Measures
The actuarial balance is a summary measure of the program’s financial statusthrough the end of the 75-year valuation period. The actuarial balance mea-sure includes the trust fund asset reserves at the beginning of the period, allcost and income during the valuation period, and the cost of reaching a targettrust fund reserve of one year’s cost by the end of the period. Therefore, theactuarial balance is essentially the difference between the present values ofincome and cost from 1937 through the end of the valuation period. Actuar-ial balance is expressed as a percentage of the taxable payroll for the 75-yearvaluation period. A negative actuarial balance is called an actuarial deficit.The actuarial deficit represents the average amount of change in income orcost that is needed throughout the valuation period in order to achieve actuar-ial balance.
In this report, the actuarial deficit for the combined OASI and DI TrustFunds under the intermediate assumptions is 2.84 percent of taxable payroll.The actuarial deficit was 2.83 percent in the 2017 report. If the assumptions,methods, starting values, and the law had all remained unchanged from lastyear, the actuarial deficit would have increased to 2.88 percent of payrollsolely due to advancing the valuation period by 1 year.
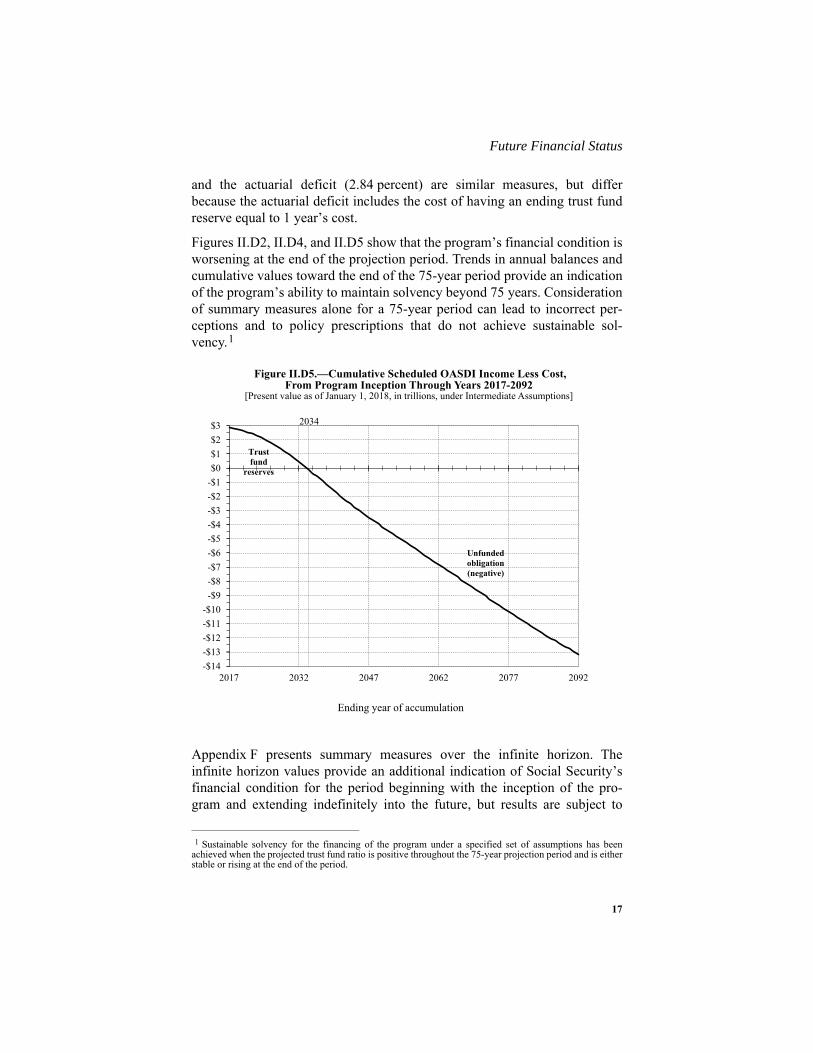
Another way to illustrate the projected financial shortfall of the OASDI pro-gram is to examine the cumulative present value of scheduled income lesscost. Figure II.D5 shows the present value of cumulative OASDI income lesscost from the inception of the program through each of the years from 2017to 2092. A positive value represents the present value of trust fund reservesat the end of the selected year. A negative value is the unfunded obligationthrough the selected year. The asset reserves of the combined trust fundswere $2.9 trillion at the end of 2017. The trust fund reserves decline on apresent value basis after 2017, but remain positive through 2033. However,after 2033 this cumulative amount becomes negative, which means that thecombined OASI and DI Trust Funds have a net unfunded obligation througheach year after 2033. Through the end of 2092, the combined funds have apresent-value unfunded obligation of $13.2 trillion. If the assumptions, meth-ods, starting values, and the law had all remained unchanged from last year,the unfunded obligation would have risen to about $13.1 trillion due to thechange in the valuation date.
This unfunded obligation represents 2.68 percent of taxable payroll(increased from 2.66 percent in last year’s report) and 1.0 percent of GDP(increased from 0.9 percent in last year’s report) for the 75-year valuationperiod. The unfunded obligation as a share of taxable payroll (2.68 percent)
17
Future Financial Status
and the actuarial deficit (2.84 percent) are similar measures, but differbecause the actuarial deficit includes the cost of having an ending trust fundreserve equal to 1 year’s cost.
Figures II.D2, II.D4, and II.D5 show that the program’s financial condition isworsening at the end of the projection period. Trends in annual balances andcumulative values toward the end of the 75-year period provide an indicationof the program’s ability to maintain solvency beyond 75 years. Considerationof summary measures alone for a 75-year period can lead to incorrect per-ceptions and to policy prescriptions that do not achieve sustainable sol-vency.1
Appendix F presents summary measures over the infinite horizon. Theinfinite horizon values provide an additional indication of Social Security’sfinancial condition for the period beginning with the inception of the pro-gram and extending indefinitely into the future, but results are subject to
1 Sustainable solvency for the financing of the program under a specified set of assumptions has beenachieved when the projected trust fund ratio is positive throughout the 75-year projection period and is eitherstable or rising at the end of the period.
Figure II.D5.—Cumulative Scheduled OASDI Income Less Cost,From Program Inception Through Years 2017-2092
[Present value as of January 1, 2018, in trillions, under Intermediate Assumptions]
-$14
-$13
-$12
-$11
-$10
-$9
-$8
-$7
-$6
-$5
-$4
-$3
-$2
-$1
$0
$1
$2
$3
2017 2032 2047 2062 2077 2092
Ending year of accumulation
Unfunded obligation(negative)
Trust fund
reserves
2034

Overview
18
much greater uncertainty. Extending the horizon beyond 75 years increasesthe measured unfunded obligation. Through the infinite horizon, theunfunded obligation, or shortfall, is equivalent to 4.0 percent of future tax-able payroll or 1.3 percent of future GDP.
Uncertainty of the Projections
Significant uncertainty surrounds the intermediate assumptions. The Trusteesuse several methods to help illustrate that uncertainty.
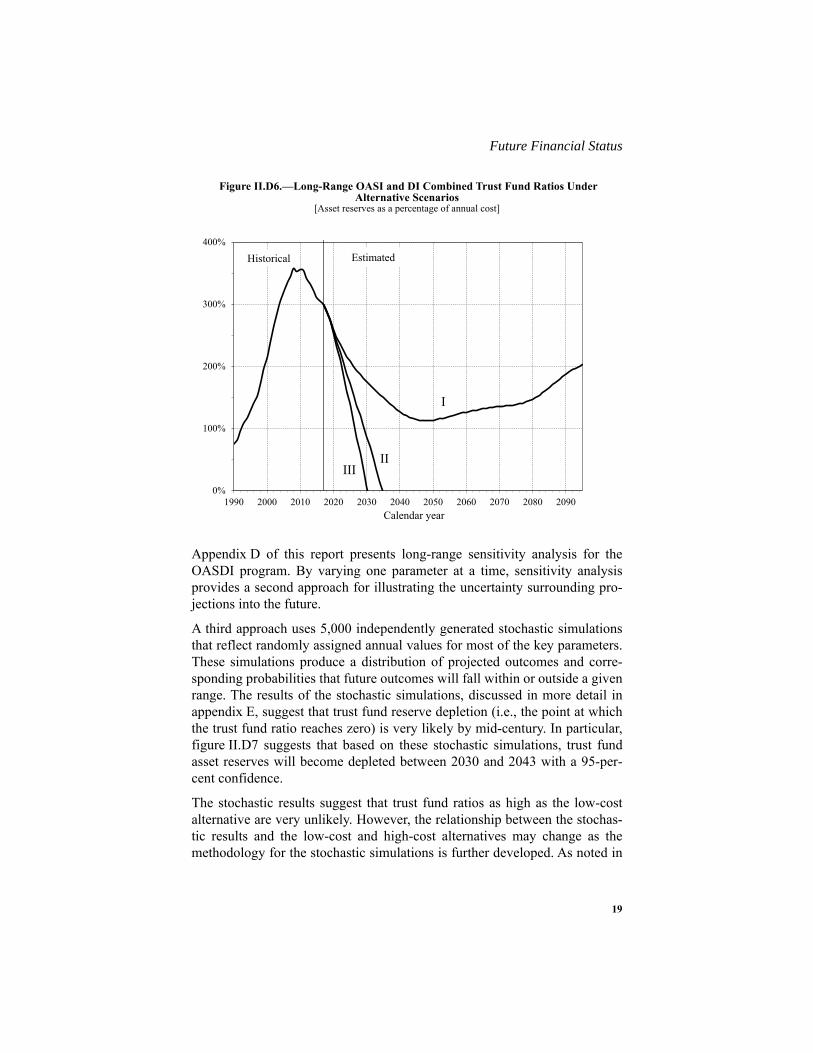
A first approach uses alternative scenarios reflecting low-cost (alternative I)and high-cost (alternative III) sets of assumptions. Figure II.D6 shows theprojected trust fund ratios for the combined OASI and DI Trust Funds underthe intermediate, low-cost, and high-cost assumptions. The figure indicatesthat the combined trust funds are projected to become depleted in 2034 underthe intermediate alternative, remain above 100 percent of annual costthroughout the projection period under the low-cost alternative, and becomedepleted in 2030 under the high-cost alternative. The low-cost alternativeincludes a higher ultimate total fertility rate, slower improvement in mortal-ity, a higher real-wage differential, a higher ultimate real interest rate, ahigher ultimate annual change in the CPI, and a lower unemployment rate.The high-cost alternative, in contrast, includes a lower ultimate total fertilityrate, more rapid improvement in mortality, a lower real-wage differential, alower ultimate real interest rate, a lower ultimate annual change in the CPI,and a higher unemployment rate. These alternatives are not intended to sug-gest that all parameters would be likely to differ from the intermediate valuesin the specified directions, but are intended to illustrate the effect of clearlydefined scenarios that are, on balance, very favorable or unfavorable for theprogram’s financial status. Actual future costs are unlikely to be as extremeas those portrayed by the low-cost or high-cost projections. The method forconstructing the low-cost and high-cost projections does not lend itself toestimating the probability that actual experience will lie within or outside therange they define.
19
Future Financial Status
Appendix D of this report presents long-range sensitivity analysis for theOASDI program. By varying one parameter at a time, sensitivity analysisprovides a second approach for illustrating the uncertainty surrounding pro-jections into the future.
A third approach uses 5,000 independently generated stochastic simulationsthat reflect randomly assigned annual values for most of the key parameters.These simulations produce a distribution of projected outcomes and corre-sponding probabilities that future outcomes will fall within or outside a givenrange. The results of the stochastic simulations, discussed in more detail inappendix E, suggest that trust fund reserve depletion (i.e., the point at whichthe trust fund ratio reaches zero) is very likely by mid-century. In particular,figure II.D7 suggests that based on these stochastic simulations, trust fundasset reserves will become depleted between 2030 and 2043 with a 95-per-cent confidence.
The stochastic results suggest that trust fund ratios as high as the low-costalternative are very unlikely. However, the relationship between the stochas-tic results and the low-cost and high-cost alternatives may change as themethodology for the stochastic simulations is further developed. As noted in
Figure II.D6.—Long-Range OASI and DI Combined Trust Fund Ratios Under Alternative Scenarios
[Asset reserves as a percentage of annual cost]
0%
100%
200%
300%
400%
1990 2000 2010 2020 2030 2040 2050 2060 2070 2080 2090
Calendar year
Historical Estimated
IIIII
I

Overview
20
appendix E, future improvements and refinements are expected to be morelikely to expand than to reduce the indicated range of uncertainty.
Changes From Last Year’s Report
The projected long-range OASDI actuarial deficit increased from2.83 percent of taxable payroll for last year’s report to 2.84 percent of tax-able payroll for this year’s report. The change in the 75-year projectionperiod alone would have increased the actuarial deficit to 2.88 percent.Changes in law, methods, starting values, and assumptions combined todecrease the actuarial deficit by 0.04 percent of taxable payroll. For adetailed description of the specific changes identified in table II.D2, seesection IV.B.6.
Figure II.D7.—Long-Range OASI and DI Combined Trust Fund Ratios From Stochastic Modeling
0%
100%
200%
300%
400%
2018 2033 2048 2063 2078 2093
Projection year
50%
97.5%
2.5%
90%
10%
21
Future Financial Status
Note: Totals do not necessarily equal the sums of rounded components.
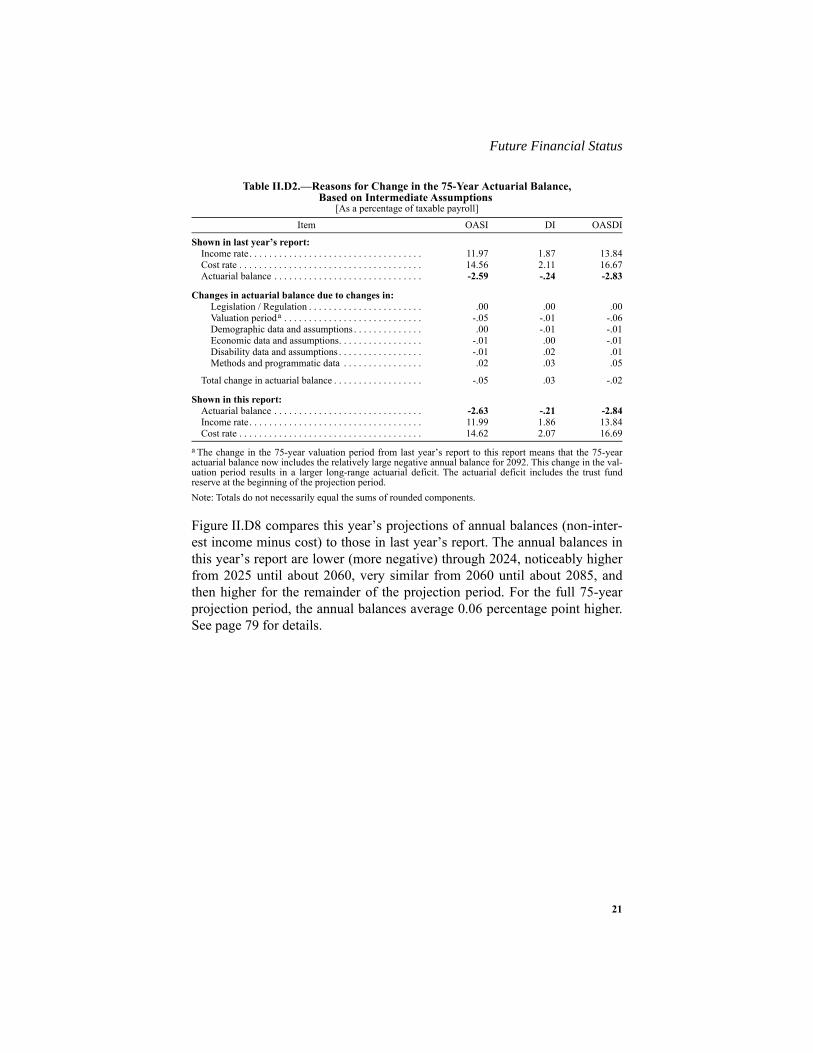
Figure II.D8 compares this year’s projections of annual balances (non-inter-est income minus cost) to those in last year’s report. The annual balances inthis year’s report are lower (more negative) through 2024, noticeably higherfrom 2025 until about 2060, very similar from 2060 until about 2085, andthen higher for the remainder of the projection period. For the full 75-yearprojection period, the annual balances average 0.06 percentage point higher.See page 79 for details.
Table II.D2.—Reasons for Change in the 75-Year Actuarial Balance,Based on Intermediate Assumptions
[As a percentage of taxable payroll]Item OASI DI OASDI
Shown in last year’s report:Income rate. . . . . . . . . . . . . . . . . . . . . . . . . . . . . . . . . . . 11.97 1.87 13.84Cost rate . . . . . . . . . . . . . . . . . . . . . . . . . . . . . . . . . . . . . 14.56 2.11 16.67Actuarial balance . . . . . . . . . . . . . . . . . . . . . . . . . . . . . . -2.59 -.24 -2.83
Changes in actuarial balance due to changes in:Legislation / Regulation . . . . . . . . . . . . . . . . . . . . . . . .00 .00 .00Valuation perioda . . . . . . . . . . . . . . . . . . . . . . . . . . . .
a The change in the 75-year valuation period from last year’s report to this report means that the 75-yearactuarial balance now includes the relatively large negative annual balance for 2092. This change in the val-uation period results in a larger long-range actuarial deficit. The actuarial deficit includes the trust fundreserve at the beginning of the projection period.
-.05 -.01 -.06Demographic data and assumptions . . . . . . . . . . . . . . .00 -.01 -.01Economic data and assumptions. . . . . . . . . . . . . . . . . -.01 .00 -.01Disability data and assumptions . . . . . . . . . . . . . . . . . -.01 .02 .01Methods and programmatic data . . . . . . . . . . . . . . . . .02 .03 .05
Total change in actuarial balance . . . . . . . . . . . . . . . . . . -.05 .03 -.02
Shown in this report:Actuarial balance . . . . . . . . . . . . . . . . . . . . . . . . . . . . . . -2.63 -.21 -2.84Income rate. . . . . . . . . . . . . . . . . . . . . . . . . . . . . . . . . . . 11.99 1.86 13.84Cost rate . . . . . . . . . . . . . . . . . . . . . . . . . . . . . . . . . . . . . 14.62 2.07 16.69

Overview
22
Figure II.D8.—OASDI Annual Balances: 2017 and 2018 Trustees Reports[As a percentage of taxable payroll, under the intermediate assumptions]
-6%
-4%
-2%
0%
2%
2015 2025 2035 2045 2055 2065 2075 2085 2095
Calendar year
2017 Report
2018 Report

23
Conclusion
E. CONCLUSION
Under current law, the projected cost of Social Security increases faster thanprojected income through 2039 primarily because the ratio of workers pay-ing taxes to beneficiaries receiving benefits will decline as the baby-boomgeneration ages and is replaced at working ages with subsequent lower birth-rate generations. While the effects of the aging baby boom and subsequentlower birth rates will have stabilized after 2039, annual cost will continue togrow faster than income, but to a lesser degree, reflecting continuingincreases in life expectancy. Based on the Trustees’ intermediate assump-tions, Social Security’s cost exceeds total income throughout the 75-yearprojection period.
The OASI Trust Fund and the DI Trust Fund are projected to have sufficientreserves to pay full benefits on time until 2034 and 2032, respectively. Legis-lative action will be needed to prevent reserve depletion in those years. In theabsence of such legislation, continuing income to the trust funds at the timeof reserve depletion would be sufficient to pay 77 percent of OASI benefitsand 96 percent of DI benefits.
Social Security’s combined trust funds would cover full payment of sched-uled benefits on a timely basis until the trust fund reserves become depletedin 2034. (Full payment of benefits until combined reserve depletion in 2034implicitly assumes that the law will have been changed to permit the transferof funds between OASI and DI as needed.) At that time, projected continuingincome to the combined trust funds equals about 79 percent of the programcost. By 2092, continuing income equals about 74 percent of the programcost.
The 75-year actuarial deficit for the combined trust funds under the interme-diate assumptions is 2.84 percent of taxable payroll , increased from the2.83 percent deficit in last year’s report. To illustrate the magnitude of thedeficit, consider that for the combined OASI and DI Trust Funds to remainfully solvent throughout the 75-year projection period: (1) revenues wouldhave to be increased by an amount equivalent to an immediate and perma-nent payroll tax rate increase of 2.78 percentage points to 15.18 percent;(2) scheduled benefits would have to be reduced by an amount equivalent toan immediate and permanent reduction of about 17 percent applied to all cur-rent and future beneficiaries, or about 21 percent if the reductions wereapplied only to those who become initially eligible for benefits in 2018 orlater; or (3) some combination of these approaches would have to beadopted. If actions are deferred for several years, the changes necessary to
Overview
24
maintain Social Security solvency become concentrated on fewer years andfewer generations.
If lawmakers design legislative solutions only to eliminate the overall actuar-ial deficit without consideration of year-by-year financing, then a substantialfinancial imbalance could remain at the end of the period, and the long-rangesustainability of program financing could still be in doubt. Sustainable sol-vency for the financing of the program under a specified set of assumptionsis achieved when the projected trust fund ratio is positive throughout thelong-range period and is either stable or rising at the end of the period. Mak-ing changes now that achieve sustainable solvency could avoid the need forlater legislative changes.
Lawmakers have a broad continuum of policy options that would close orreduce Social Security's long-term financing shortfall. Cost estimates formany such policy options are available at www.ssa.gov/OACT/solvency/provisions/. Broadly speaking, the approaches that lawmakers can takeinclude increasing revenues from workers and employers by raising the taxrate or the maximum level of taxable earnings, or by dedicating revenuesfrom other sources; lowering benefits for some or all beneficiaries by chang-ing certain program parameters; or a combination of these approaches. Thereare countless variations on these options, including those that vary the tim-ing, magnitude, and other specifics of the changes under consideration.
The Trustees recommend that lawmakers address the projected trust fundshortfalls in a timely way in order to phase in necessary changes graduallyand give workers and beneficiaries time to adjust to them. Implementingchanges sooner rather than later would allow more generations to share in theneeded revenue increases or reductions in scheduled benefits and could pre-serve more trust fund reserves to help finance future benefits. Social Securitywill play a critical role in the lives of 63 million beneficiaries and175 million covered workers and their families during 2018. With informeddiscussion, creative thinking, and timely legislative action, Social Securitycan continue to protect future generations.
For further information related to the contents of this report, see the follow-ing websites:
• www.ssa.gov/OACT/tr/2018/
• www.ssa.gov/OACT/solvency/provisions/
• www.cms.gov/Research-Statistics-Data-and-Systems/Statistics-Trends-and-Reports/ReportsTrustFunds/
• www.treasury.gov/resource-center/economic-policy/ss-medicare/Pages/Soc-Sec-and-Medicare.aspx
25
Calendar Year 2017 Operations
III. FINANCIAL OPERATIONS OF THE TRUST FUNDS ANDLEGISLATIVE CHANGES IN THE LAST YEAR
A. OPERATIONS OF THE OLD-AGE AND SURVIVORS INSURANCE (OASI) AND DISABILITY INSURANCE (DI) TRUST
FUNDS, IN CALENDAR YEAR 2017
This section presents detailed information on the operations of the OASI andDI Trust Funds1 during calendar year 2017. Chapter IV provides projectionsfor calendar years 2018 through 2095.
1. OASI Trust Fund
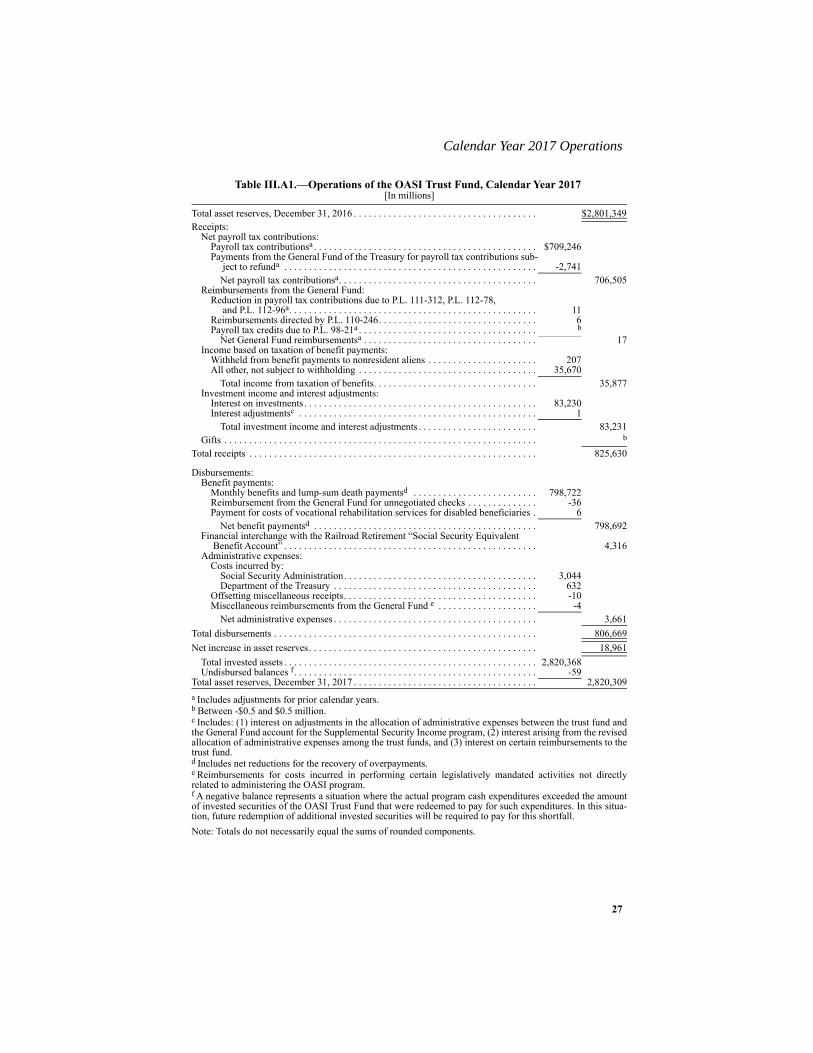
Table III.A1 presents a statement of the income and disbursements of theFederal Old-Age and Survivors Insurance Trust Fund in calendar year 2017,and of the asset reserves in the fund at the beginning and end of the calendaryear. As shown in this table, total trust fund receipts in 2017 amounted to$825.6 billion, while disbursements totaled $806.7 billion, an increase intrust fund reserves during 2017 of $19.0 billion.
Total receipts during calendar year 2017 included $709.2 billion in payrolltax contributions. These contributions include initial appropriations of pay-roll taxes, made on an estimated basis, and adjustments to appropriations forprior years to reflect actual tax receipts. The OASI fund paid the GeneralFund $2.7 billion for the estimated amount of employee payroll-tax refunds,partially offsetting these gross contributions. Employees who work for morethan one employer during a year and pay contributions on total earnings inexcess of the contribution and benefit base are eligible for such refunds. Netpayroll tax contributions were therefore $706.5 billion in 2017.
Net reimbursements from the General Fund of the Treasury amounted to$17 million in 2017. As shown in the table, adjustments to prior year receiptsbased on Public Law 111-312, the Tax Relief, Unemployment InsuranceReauthorization, and Job Creation Act of 2010, Public Law 112-78, theTemporary Payroll Tax Cut Continuation Act of 2011, and PublicLaw 112-96, the Middle Class Tax Relief and Job Creation Act of 2012,account for most of the reimbursement for the year, or about $11 million.These acts specified General Fund reimbursement for temporary reductionsin employee and self-employment payroll taxes for earnings in 2011and 2012.
1 See www.ssa.gov/oact/ProgData/fundsQuery.html.

Financial Operations and Legislative Changes
26
The remaining $6 million of the reimbursements from the General Fund in2017 was almost entirely due to the provisions of Public Law 110-246, theFood, Conservation, and Energy Act of 2008. This act specified GeneralFund reimbursement for reductions in self-employment payroll taxes.
Income to the OASI Trust Fund based on the taxation of OASI benefitsamounted to $35.9 billion in 2017. As first required by the 1983 Social Secu-rity Amendments, this income comes from two separate sources: (1) Federalincome taxation on up to 50 percent of an individual’s or couple’s OASI ben-efits under certain circumstances, and (2) a tax withheld from the benefitspaid to certain nonresident alien beneficiaries. For the direct Federal incometax portion, Treasury transfers estimated amounts to the OASI Trust Fund inadvance at the beginning of each calendar quarter. Treasury makes subse-quent adjustments based on the actual amounts shown on annual income taxrecords. There were no such adjustments made in 2017. The amount ofincome from direct Federal income taxation on OASI benefits constitutedapproximately 99 percent of income from benefit taxation. The remainingone percent of the income from benefit taxation is the amounts withheldfrom the benefits paid to nonresident aliens.
In 2017, the OASI Trust Fund earned $83.2 billion in net interest, which con-sisted of: (1) interest earned on the investments held by the trust fund,(2) interest on adjustments in the allocation of administrative expensesbetween the trust fund and the General Fund account for the SupplementalSecurity Income program, (3) interest arising from the revised allocation ofadministrative expenses among the trust funds, and (4) interest on certainreimbursements to the trust fund.
The remaining receipts, about $374 thousand, consisted of gifts receivedunder the provisions authorizing the deposit of monetary gifts or bequests inthe trust funds.
27
Calendar Year 2017 Operations
Note: Totals do not necessarily equal the sums of rounded components.
Table III.A1.—Operations of the OASI Trust Fund, Calendar Year 2017[In millions]
Total asset reserves, December 31, 2016 . . . . . . . . . . . . . . . . . . . . . . . . . . . . . . . . . . . . . $2,801,349Receipts:
Net payroll tax contributions:Payroll tax contributionsa . . . . . . . . . . . . . . . . . . . . . . . . . . . . . . . . . . . . . . . . . . . . .
a Includes adjustments for prior calendar years.
$709,246Payments from the General Fund of the Treasury for payroll tax contributions sub-
ject to refunda . . . . . . . . . . . . . . . . . . . . . . . . . . . . . . . . . . . . . . . . . . . . . . . . . . . -2,741Net payroll tax contributionsa. . . . . . . . . . . . . . . . . . . . . . . . . . . . . . . . . . . . . . . . 706,505
Reimbursements from the General Fund:Reduction in payroll tax contributions due to P.L. 111-312, P.L. 112-78,
and P.L. 112-96a. . . . . . . . . . . . . . . . . . . . . . . . . . . . . . . . . . . . . . . . . . . . . . . . . . 11Reimbursements directed by P.L. 110-246. . . . . . . . . . . . . . . . . . . . . . . . . . . . . . . . 6Payroll tax credits due to P.L. 98-21a . . . . . . . . . . . . . . . . . . . . . . . . . . . . . . . . . . . . b
b Between -$0.5 and $0.5 million.
Net General Fund reimbursementsa . . . . . . . . . . . . . . . . . . . . . . . . . . . . . . . . . . . 17Income based on taxation of benefit payments:
Withheld from benefit payments to nonresident aliens . . . . . . . . . . . . . . . . . . . . . . 207All other, not subject to withholding . . . . . . . . . . . . . . . . . . . . . . . . . . . . . . . . . . . . 35,670
Total income from taxation of benefits. . . . . . . . . . . . . . . . . . . . . . . . . . . . . . . . . 35,877Investment income and interest adjustments:
Interest on investments. . . . . . . . . . . . . . . . . . . . . . . . . . . . . . . . . . . . . . . . . . . . . . . 83,230Interest adjustmentsc . . . . . . . . . . . . . . . . . . . . . . . . . . . . . . . . . . . . . . . . . . . . . . . .
c Includes: (1) interest on adjustments in the allocation of administrative expenses between the trust fund andthe General Fund account for the Supplemental Security Income program, (2) interest arising from the revisedallocation of administrative expenses among the trust funds, and (3) interest on certain reimbursements to thetrust fund.
1Total investment income and interest adjustments . . . . . . . . . . . . . . . . . . . . . . . . 83,231
Gifts . . . . . . . . . . . . . . . . . . . . . . . . . . . . . . . . . . . . . . . . . . . . . . . . . . . . . . . . . . . . . . . b
Total receipts . . . . . . . . . . . . . . . . . . . . . . . . . . . . . . . . . . . . . . . . . . . . . . . . . . . . . . . . . . 825,630
Disbursements:Benefit payments:
Monthly benefits and lump-sum death paymentsd . . . . . . . . . . . . . . . . . . . . . . . . .
d Includes net reductions for the recovery of overpayments.
798,722Reimbursement from the General Fund for unnegotiated checks . . . . . . . . . . . . . . -36Payment for costs of vocational rehabilitation services for disabled beneficiaries . 6
Net benefit paymentsd . . . . . . . . . . . . . . . . . . . . . . . . . . . . . . . . . . . . . . . . . . . . . 798,692Financial interchange with the Railroad Retirement “Social Security Equivalent
Benefit Account” . . . . . . . . . . . . . . . . . . . . . . . . . . . . . . . . . . . . . . . . . . . . . . . . . . . 4,316Administrative expenses:
Costs incurred by:Social Security Administration. . . . . . . . . . . . . . . . . . . . . . . . . . . . . . . . . . . . . . . 3,044Department of the Treasury . . . . . . . . . . . . . . . . . . . . . . . . . . . . . . . . . . . . . . . . . 632
Offsetting miscellaneous receipts. . . . . . . . . . . . . . . . . . . . . . . . . . . . . . . . . . . . . . . -10Miscellaneous reimbursements from the General Fund e . . . . . . . . . . . . . . . . . . . .
e Reimbursements for costs incurred in performing certain legislatively mandated activities not directlyrelated to administering the OASI program.
-4Net administrative expenses . . . . . . . . . . . . . . . . . . . . . . . . . . . . . . . . . . . . . . . . . 3,661
Total disbursements . . . . . . . . . . . . . . . . . . . . . . . . . . . . . . . . . . . . . . . . . . . . . . . . . . . . . 806,669Net increase in asset reserves. . . . . . . . . . . . . . . . . . . . . . . . . . . . . . . . . . . . . . . . . . . . . . 18,961
Total invested assets . . . . . . . . . . . . . . . . . . . . . . . . . . . . . . . . . . . . . . . . . . . . . . . . . . . 2,820,368Undisbursed balances f. . . . . . . . . . . . . . . . . . . . . . . . . . . . . . . . . . . . . . . . . . . . . . . . .
f A negative balance represents a situation where the actual program cash expenditures exceeded the amountof invested securities of the OASI Trust Fund that were redeemed to pay for such expenditures. In this situa-tion, future redemption of additional invested securities will be required to pay for this shortfall.
-59Total asset reserves, December 31, 2017 . . . . . . . . . . . . . . . . . . . . . . . . . . . . . . . . . . . . . 2,820,309
Financial Operations and Legislative Changes
28
Of the $806.7 billion in total OASI disbursements in 2017, $798.7 billionwere for net benefit payments, including recovered overpayments, reim-bursements from the General Fund for unnegotiated checks, and the reim-bursable costs of vocational rehabilitation services.1 Net benefit paymentsincreased by 3.9 percent from calendar year 2016 to calendar year 2017. Thisincrease is due primarily to: (1) an increase in the average number of benefi-ciaries during the year and (2) an increase in the average monthly benefitamount. The increase in the average benefit amount in 2017 was due in partto the automatic cost-of-living benefit increase of 0.3 percent which becameeffective for December 2016 under the automatic-adjustment provisions insection 215(i) of the Social Security Act. In addition, new beneficiaries tendto have higher monthly benefit amounts than previous beneficiary cohorts.
The Railroad Retirement Act requires an annual financial interchangebetween the Railroad Retirement program and the OASDI program. The pur-pose of the interchange is to put the OASI and DI Trust Funds in the samefinancial position in which they would have been had railroad employmentalways been covered directly by Social Security. The Railroad RetirementBoard and the Social Security Administration calculated an interchange of$4.3 billion from the OASI Trust Fund to the Social Security EquivalentBenefit Account for June 2017.
The remaining $3.7 billion of disbursements from the OASI Trust Fund werefor net administrative expenses. The Social Security Administration chargesadministrative expenses incurred to administer the OASI program directly tothe trust fund on an estimated basis. Periodically, as actual expenses arerecorded, adjustments are made to the allocations of administrative expensesfor prior periods. These adjustments affect the OASI Trust Fund, theDI Trust Fund, the Hospital Insurance (HI) Trust Fund, the SupplementaryMedical Insurance (SMI) Trust Fund, and the General Fund account for theSupplemental Security Income program, and include appropriate interestadjustments. As described earlier, the trust fund accounting records suchinterest adjustments under investment income.
For 2017, the cost incurred by the Social Security Administration to adminis-ter the OASI program was 83 percent of OASI net administrative expenses.The Social Security Administration charged such costs to the trust fund inthe amount of $3.0 billion in 2017. In addition, the Department of the Trea-sury charged the trust fund $0.6 billion in 2017 for services provided in
1 Vocational rehabilitation services under the OASI program are furnished to disabled widow(er) beneficia-ries and to those children of retired or deceased workers who receive benefits based on disabilities thatbegan before age 22. The trust funds reimburse the providers of such services only in those cases where theservices contributed to the successful rehabilitation of the beneficiary.
29
Calendar Year 2017 Operations
administering the OASI program. A relatively small offset to administrativeexpenses of $10 million in 2017 represents income from miscellaneousreceipts due to the trust fund, which may include refunds, penalties, fees, andother receipts.
Finally, the General Fund of the Treasury makes net reimbursements foradministrative costs incurred by the Social Security Administration in per-forming legislatively mandated activities that are not directly related to theOASI program. These reimbursements include $3 million in costs associatedwith union activities related to administering the OASI program and$2 million in costs of providing information to participants in certain pensionplans in 2017. These miscellaneous reimbursements round to $4 million in2017.
The asset reserves shown for the OASI Trust Fund at the end of calendaryear 2017 totaled $2,820.3 billion, consisting of $2,820.4 billion in U.S.Government obligations and, as an offset, an extension of credit of$59 million against securities to be redeemed within the first few days of thefollowing year. The effective annual rate of interest earned by the reserves inthe OASI Trust Fund during calendar year 2017 was 3.0 percent, slightlylower than the 3.1 percent earned during calendar year 2016. Table VI.A4,presented in appendix A, shows a detailed listing of OASI Trust Fund hold-ings by type of security, interest rate, and year of maturity at the end of cal-endar years 2016 and 2017.
By law, the Department of the Treasury must invest trust fund reserves ininterest-bearing securities backed by the full faith and credit of the UnitedStates Government. The securities currently held by the OASI Trust Fund areentirely special issue securities sold by the Treasury only to the trust funds.These special issues are of two types: short-term certificates of indebtednessand longer-term bonds. Daily trust fund receipts are invested in the short-term certificates of indebtedness which mature on the next June 30 followingthe date of issue. The trust fund normally acquires long-term special-issuebonds when special issue securities of either type mature on June 30 andmust be reinvested. The amount of long-term bonds acquired on June 30 isequal to the amount of special issue securities maturing (including accruedinterest earnings), plus tax receipts for that day, less amounts required tomeet expenditures on that day.
Section 201(d) of the Social Security Act provides that the obligations issuedfor purchase by the OASI and DI Trust Funds shall have maturities fixedwith due regard for the needs of the funds. The usual practice has been toreinvest the maturing special issue securities, as of each June 30, so that the

Financial Operations and Legislative Changes
30
value of the securities maturing in each of the next 15 years are approxi-mately equal. Accordingly, the Department of the Treasury, in consultationwith the Chief Actuary of the Social Security Administration, selected theamounts and maturity dates of the special-issue bonds purchased onJune 30, 2017, so that the maturity dates of the total portfolio of special issuesecurities were spread evenly over the 15-year period 2018 through 2032.The bonds purchased on that date have an interest rate of 2.250 percent,reflecting the average market yield, as of the last business day of the priormonth, on all of the outstanding marketable U.S. obligations that are due orcallable more than 4 years in the future. Table III.A7 shows additional detailson the investment transactions during 2017, including the amounts of bondspurchased on June 30, 2017.
2. DI Trust Fund
Table III.A2 presents a statement of the income and disbursements of theFederal Disability Insurance Trust Fund in calendar year 2017, and of theasset reserves in the fund at the beginning and end of the calendar year.
Line entries in the DI statement are similar to those in the OASI statement.The explanations of the OASI entries generally apply to DI as well.
Of the $171.0 billion in total receipts, $167.1 billion was net payroll tax con-tributions.
Of the $145.8 billion of total disbursements, $142.8 billion was net benefitpayments. The total level of net benefit payments in 2017 was essentiallyunchanged from total net benefit payments paid in 2016, largely due to adecrease in the number of beneficiaries, and an offsetting increase in averagebenefit amounts. Non-interest income, and total income, exceeded total dis-bursements in 2017 due primarily to the temporary reallocation of the payrolltax rate from OASI to DI for years 2016 through 2018. DI total disburse-ments exceeded non-interest income from 2005 to 2015, and exceeded totalincome to the trust fund from 2009 to 2015.

31
Calendar Year 2017 Operations
Note: Totals do not necessarily equal the sums of rounded components.
Table III.A2.—Operations of the DI Trust Fund, Calendar Year 2017[In millions]
Total asset reserves, December 31, 2016 . . . . . . . . . . . . . . . . . . . . . . . . . . . . . . . . . . . . . $46,338Receipts:
Net payroll tax contributions:Payroll tax contributionsa . . . . . . . . . . . . . . . . . . . . . . . . . . . . . . . . . . . . . . . . . . . . .
a Includes adjustments for prior calendar years.
$167,730Payments from the General Fund of the Treasury for payroll tax contributions
subject to refunda. . . . . . . . . . . . . . . . . . . . . . . . . . . . . . . . . . . . . . . . . . . . . . . . . -642Net payroll tax contributionsa. . . . . . . . . . . . . . . . . . . . . . . . . . . . . . . . . . . . . . . . 167,087
Reimbursements from the General Fund:Reduction in payroll tax contributions due to P.L. 111-312, P.L. 112-78,
and P.L. 112-96a. . . . . . . . . . . . . . . . . . . . . . . . . . . . . . . . . . . . . . . . . . . . . . . . . . 2Reimbursements directed by P.L. 110-246. . . . . . . . . . . . . . . . . . . . . . . . . . . . . . . . 1Payroll tax credits due to P.L. 98-21a . . . . . . . . . . . . . . . . . . . . . . . . . . . . . . . . . . . . b
b Between -$0.5 and $0.5 million.
Net General Fund reimbursementsa . . . . . . . . . . . . . . . . . . . . . . . . . . . . . . . . . . . 3Income based on taxation of benefit payments:
Withheld from benefit payments to nonresident aliens . . . . . . . . . . . . . . . . . . . . . . 4All other, not subject to withholding . . . . . . . . . . . . . . . . . . . . . . . . . . . . . . . . . . . . 1,969
Total income from taxation of benefits. . . . . . . . . . . . . . . . . . . . . . . . . . . . . . . . . 1,973Investment income and interest adjustments:
Interest on investments. . . . . . . . . . . . . . . . . . . . . . . . . . . . . . . . . . . . . . . . . . . . . . . 1,886Interest adjustmentsc . . . . . . . . . . . . . . . . . . . . . . . . . . . . . . . . . . . . . . . . . . . . . . . .
c Includes: (1) interest on adjustments in the allocation of administrative expenses between the trust fund andthe General Fund account for the Supplemental Security Income program, (2) interest arising from therevised allocation of administrative expenses among the trust funds, and (3) interest on certain reimburse-ments to the trust fund.
2Total investment income and interest adjustments . . . . . . . . . . . . . . . . . . . . . . . . 1,888
Gifts . . . . . . . . . . . . . . . . . . . . . . . . . . . . . . . . . . . . . . . . . . . . . . . . . . . . . . . . . . . . . . . —Total receipts . . . . . . . . . . . . . . . . . . . . . . . . . . . . . . . . . . . . . . . . . . . . . . . . . . . . . . . . . . 170,951
Disbursements:Benefit payments:
Monthly benefitsd . . . . . . . . . . . . . . . . . . . . . . . . . . . . . . . . . . . . . . . . . . . . . . . . . .
d Includes net reductions for the recovery of overpayments.
142,740Reimbursement from the General Fund for unnegotiated checks . . . . . . . . . . . . . . -19Payment for costs of vocational rehabilitation services for disabled beneficiaries . 86
Net benefit paymentsd . . . . . . . . . . . . . . . . . . . . . . . . . . . . . . . . . . . . . . . . . . . . . 142,806Financial interchange with the Railroad Retirement “Social Security Equivalent
Benefit Account” . . . . . . . . . . . . . . . . . . . . . . . . . . . . . . . . . . . . . . . . . . . . . . . . . . . 207Administrative expenses:
Costs incurred by:Social Security Administration. . . . . . . . . . . . . . . . . . . . . . . . . . . . . . . . . . . . . . . 2,668Department of the Treasury . . . . . . . . . . . . . . . . . . . . . . . . . . . . . . . . . . . . . . . . . 119
Offsetting miscellaneous receipts. . . . . . . . . . . . . . . . . . . . . . . . . . . . . . . . . . . . . . . bDemonstration projects. . . . . . . . . . . . . . . . . . . . . . . . . . . . . . . . . . . . . . . . . . . . . . . 12Miscellaneous reimbursements from the General Funde . . . . . . . . . . . . . . . . . . . . .
e Reimbursements for costs incurred in performing legislatively mandated activities not directly related toadministering the DI program.
-3Net administrative expenses . . . . . . . . . . . . . . . . . . . . . . . . . . . . . . . . . . . . . . . . . 2,796
Total disbursements . . . . . . . . . . . . . . . . . . . . . . . . . . . . . . . . . . . . . . . . . . . . . . . . . . . . . 145,809Net increase in asset reserves. . . . . . . . . . . . . . . . . . . . . . . . . . . . . . . . . . . . . . . . . . . . . . 25,142
Total invested assets . . . . . . . . . . . . . . . . . . . . . . . . . . . . . . . . . . . . . . . . . . . . . . . . . . . 71,624Undisbursed balancesf . . . . . . . . . . . . . . . . . . . . . . . . . . . . . . . . . . . . . . . . . . . . . . . . .
f A negative balance represents a situation where the actual program cash expenditures exceeded the amountof invested securities of the DI Trust Fund that were redeemed to pay for such expenditures. In this situation,future redemption of additional invested securities will be required to pay for this shortfall.
-144Total asset reserves, December 31, 2017 . . . . . . . . . . . . . . . . . . . . . . . . . . . . . . . . . . . . . 71,480

Financial Operations and Legislative Changes
32
During 2017, the reserves in the DI Trust Fund increased by $25.1 billion,from $46.3 billion at the end of 2016 to $71.5 billion at the end of 2017. This$71.5 billion consisted of $71.6 billion in U.S. Government obligations and,as an offset, an extension of credit of $144 million against securities to beredeemed within the first few days of the following year. The effectiveannual rate of interest earned by the asset reserves in the DI Trust Fundduring calendar year 2017 was 3.2 percent, somewhat lower than the3.6 percent earned during calendar year 2016. Table VI.A5 shows a detailedlisting of DI Trust Fund holdings by type of security, interest rate, and yearof maturity at the end of calendar years 2016 and 2017.
Section 201(d) of the Social Security Act provides that the Treasury securi-ties issued for purchase by the OASI and DI Trust Funds shall have matur-ities fixed with due regard for the needs of the funds. Each year, bondpurchases for each trust fund are made on June 30, taking into account theprojected reserve depletion date in the most recently issued Trustees Report.The usual practice has been to reinvest the maturing special issue securities,as of each June 30, so that the values of the securities maturing in each of thenext 15 years are approximately equal. However, as of June 2017, the Trust-ees projected that the reserves in the DI Trust Fund would be depleted within15 years. Therefore, the Department of the Treasury, in consultation with theChief Actuary of the Social Security Administration, selected the amountsand maturity dates of the DI special-issue bonds purchased on June 30, 2017,so that the bonds would mature over the 6-year period 2018-23. The bondspurchased have an interest rate of 2.250 percent, reflecting the average mar-ket yield, as of the last business day of the prior month, on the outstandingmarketable U.S. obligations that are due or callable more than 4 years in thefuture. As of June 30, 2017, most of the invested asset reserves of the DITrust Fund had maturity dates of June 30 in 2022 and 2023, so this invest-ment approach required that all bond purchases on June 30, 2017 be splitover the maturity dates of June 30, 2018 through June 30, 2021. Table III.A7shows details on investment transactions during 2017.
3. OASI and DI Trust Funds, Combined
Table III.A3 presents a statement of the operations of the OASI and DI TrustFunds on a hypothetical combined basis.1 The entries in this table representthe sums of the corresponding values from tables III.A1 and III.A2. The twopreceding subsections that cover OASI and DI provide a description of thenature of these income and expenditure transactions.
1 The OASI and DI Trust Funds are distinct legal entities which operate independently. To illustrate theactuarial status of the program as a whole, the fund operations are often combined on a hypothetical basis.
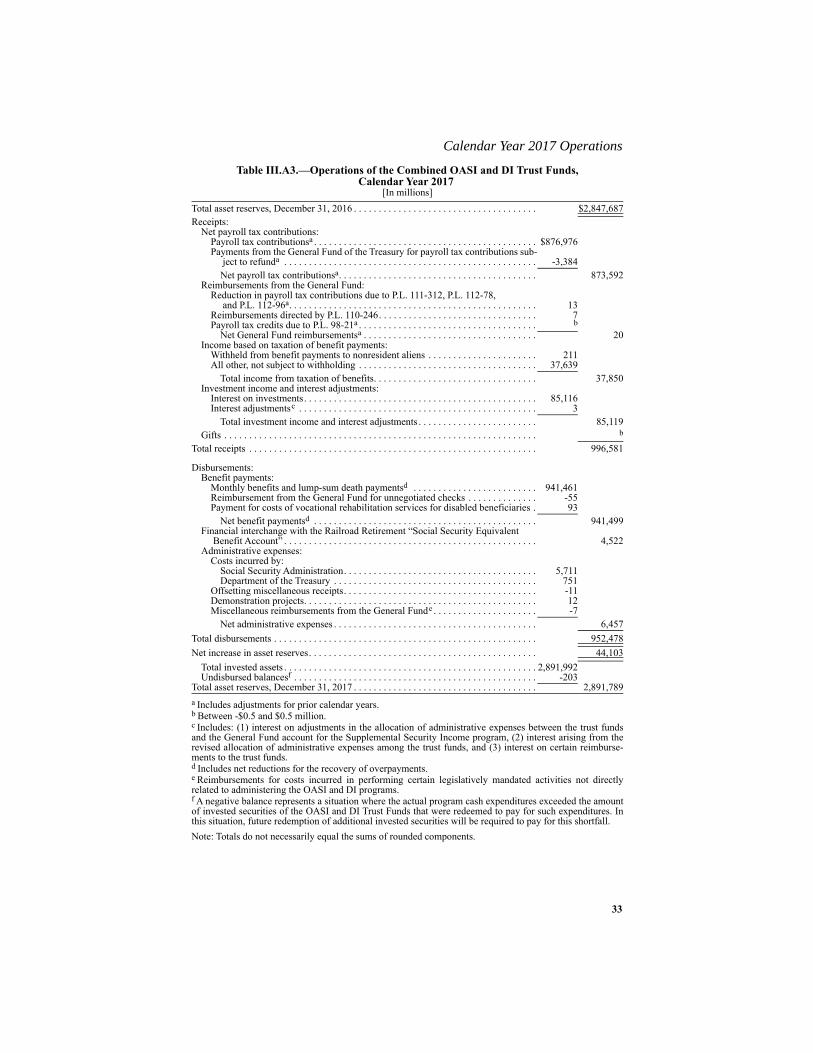
33
Calendar Year 2017 Operations
Note: Totals do not necessarily equal the sums of rounded components.
Table III.A3.—Operations of the Combined OASI and DI Trust Funds, Calendar Year 2017
[In millions]Total asset reserves, December 31, 2016 . . . . . . . . . . . . . . . . . . . . . . . . . . . . . . . . . . . . . $2,847,687Receipts:
Net payroll tax contributions:Payroll tax contributionsa . . . . . . . . . . . . . . . . . . . . . . . . . . . . . . . . . . . . . . . . . . . . .
a Includes adjustments for prior calendar years.
$876,976Payments from the General Fund of the Treasury for payroll tax contributions sub-
ject to refunda . . . . . . . . . . . . . . . . . . . . . . . . . . . . . . . . . . . . . . . . . . . . . . . . . . . -3,384Net payroll tax contributionsa. . . . . . . . . . . . . . . . . . . . . . . . . . . . . . . . . . . . . . . . 873,592
Reimbursements from the General Fund:Reduction in payroll tax contributions due to P.L. 111-312, P.L. 112-78,
and P.L. 112-96a. . . . . . . . . . . . . . . . . . . . . . . . . . . . . . . . . . . . . . . . . . . . . . . . . . 13Reimbursements directed by P.L. 110-246. . . . . . . . . . . . . . . . . . . . . . . . . . . . . . . . 7Payroll tax credits due to P.L. 98-21a . . . . . . . . . . . . . . . . . . . . . . . . . . . . . . . . . . . . b
b Between -$0.5 and $0.5 million.
Net General Fund reimbursementsa . . . . . . . . . . . . . . . . . . . . . . . . . . . . . . . . . . . 20Income based on taxation of benefit payments:
Withheld from benefit payments to nonresident aliens . . . . . . . . . . . . . . . . . . . . . . 211All other, not subject to withholding . . . . . . . . . . . . . . . . . . . . . . . . . . . . . . . . . . . . 37,639
Total income from taxation of benefits. . . . . . . . . . . . . . . . . . . . . . . . . . . . . . . . . 37,850Investment income and interest adjustments:
Interest on investments. . . . . . . . . . . . . . . . . . . . . . . . . . . . . . . . . . . . . . . . . . . . . . . 85,116Interest adjustmentsc . . . . . . . . . . . . . . . . . . . . . . . . . . . . . . . . . . . . . . . . . . . . . . . .
c Includes: (1) interest on adjustments in the allocation of administrative expenses between the trust fundsand the General Fund account for the Supplemental Security Income program, (2) interest arising from therevised allocation of administrative expenses among the trust funds, and (3) interest on certain reimburse-ments to the trust funds.
3Total investment income and interest adjustments . . . . . . . . . . . . . . . . . . . . . . . . 85,119
Gifts . . . . . . . . . . . . . . . . . . . . . . . . . . . . . . . . . . . . . . . . . . . . . . . . . . . . . . . . . . . . . . . b
Total receipts . . . . . . . . . . . . . . . . . . . . . . . . . . . . . . . . . . . . . . . . . . . . . . . . . . . . . . . . . . 996,581
Disbursements:Benefit payments:
Monthly benefits and lump-sum death paymentsd . . . . . . . . . . . . . . . . . . . . . . . . .
d Includes net reductions for the recovery of overpayments.
941,461Reimbursement from the General Fund for unnegotiated checks . . . . . . . . . . . . . . -55Payment for costs of vocational rehabilitation services for disabled beneficiaries . 93
Net benefit paymentsd . . . . . . . . . . . . . . . . . . . . . . . . . . . . . . . . . . . . . . . . . . . . . 941,499Financial interchange with the Railroad Retirement “Social Security Equivalent
Benefit Account” . . . . . . . . . . . . . . . . . . . . . . . . . . . . . . . . . . . . . . . . . . . . . . . . . . . 4,522Administrative expenses:
Costs incurred by:Social Security Administration. . . . . . . . . . . . . . . . . . . . . . . . . . . . . . . . . . . . . . . 5,711Department of the Treasury . . . . . . . . . . . . . . . . . . . . . . . . . . . . . . . . . . . . . . . . . 751
Offsetting miscellaneous receipts. . . . . . . . . . . . . . . . . . . . . . . . . . . . . . . . . . . . . . . -11Demonstration projects. . . . . . . . . . . . . . . . . . . . . . . . . . . . . . . . . . . . . . . . . . . . . . . 12Miscellaneous reimbursements from the General Funde . . . . . . . . . . . . . . . . . . . . .
e Reimbursements for costs incurred in performing certain legislatively mandated activities not directlyrelated to administering the OASI and DI programs.
-7Net administrative expenses . . . . . . . . . . . . . . . . . . . . . . . . . . . . . . . . . . . . . . . . . 6,457
Total disbursements . . . . . . . . . . . . . . . . . . . . . . . . . . . . . . . . . . . . . . . . . . . . . . . . . . . . . 952,478Net increase in asset reserves. . . . . . . . . . . . . . . . . . . . . . . . . . . . . . . . . . . . . . . . . . . . . . 44,103
Total invested assets . . . . . . . . . . . . . . . . . . . . . . . . . . . . . . . . . . . . . . . . . . . . . . . . . . . 2,891,992Undisbursed balancesf . . . . . . . . . . . . . . . . . . . . . . . . . . . . . . . . . . . . . . . . . . . . . . . . .
f A negative balance represents a situation where the actual program cash expenditures exceeded the amountof invested securities of the OASI and DI Trust Funds that were redeemed to pay for such expenditures. Inthis situation, future redemption of additional invested securities will be required to pay for this shortfall.
-203Total asset reserves, December 31, 2017 . . . . . . . . . . . . . . . . . . . . . . . . . . . . . . . . . . . . . 2,891,789
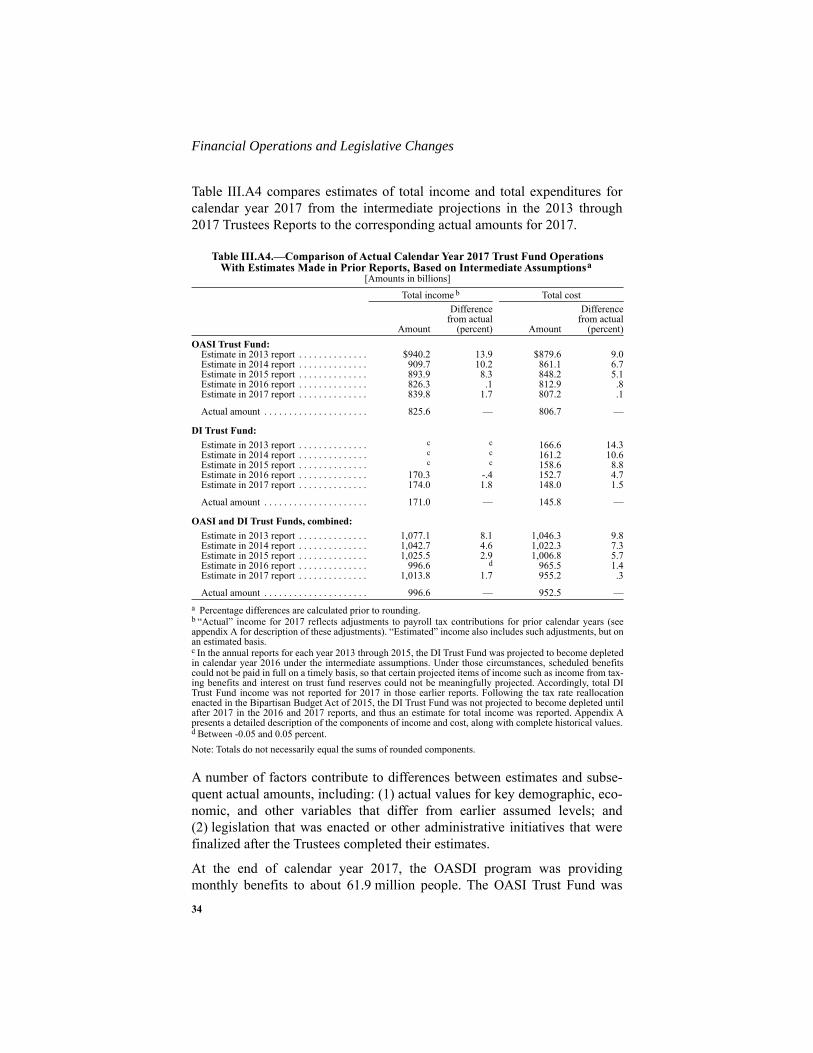
Financial Operations and Legislative Changes
34
Table III.A4 compares estimates of total income and total expenditures forcalendar year 2017 from the intermediate projections in the 2013 through2017 Trustees Reports to the corresponding actual amounts for 2017.
Note: Totals do not necessarily equal the sums of rounded components.
A number of factors contribute to differences between estimates and subse-quent actual amounts, including: (1) actual values for key demographic, eco-nomic, and other variables that differ from earlier assumed levels; and(2) legislation that was enacted or other administrative initiatives that werefinalized after the Trustees completed their estimates.
At the end of calendar year 2017, the OASDI program was providingmonthly benefits to about 61.9 million people. The OASI Trust Fund was
Table III.A4.—Comparison of Actual Calendar Year 2017 Trust Fund OperationsWith Estimates Made in Prior Reports, Based on Intermediate Assumptionsa
[Amounts in billions]
a Percentage differences are calculated prior to rounding.
Total income b
b “Actual” income for 2017 reflects adjustments to payroll tax contributions for prior calendar years (seeappendix A for description of these adjustments). “Estimated” income also includes such adjustments, but onan estimated basis.
Total cost
Amount
Differencefrom actual
(percent) Amount
Differencefrom actual
(percent)OASI Trust Fund:
Estimate in 2013 report . . . . . . . . . . . . . . $940.2 13.9 $879.6 9.0Estimate in 2014 report . . . . . . . . . . . . . . 909.7 10.2 861.1 6.7Estimate in 2015 report . . . . . . . . . . . . . . 893.9 8.3 848.2 5.1Estimate in 2016 report . . . . . . . . . . . . . . 826.3 .1 812.9 .8Estimate in 2017 report . . . . . . . . . . . . . . 839.8 1.7 807.2 .1
Actual amount . . . . . . . . . . . . . . . . . . . . . 825.6 — 806.7 —
DI Trust Fund:Estimate in 2013 report . . . . . . . . . . . . . . c
c In the annual reports for each year 2013 through 2015, the DI Trust Fund was projected to become depletedin calendar year 2016 under the intermediate assumptions. Under those circumstances, scheduled benefitscould not be paid in full on a timely basis, so that certain projected items of income such as income from tax-ing benefits and interest on trust fund reserves could not be meaningfully projected. Accordingly, total DITrust Fund income was not reported for 2017 in those earlier reports. Following the tax rate reallocationenacted in the Bipartisan Budget Act of 2015, the DI Trust Fund was not projected to become depleted untilafter 2017 in the 2016 and 2017 reports, and thus an estimate for total income was reported. Appendix Apresents a detailed description of the components of income and cost, along with complete historical values.
c 166.6 14.3Estimate in 2014 report . . . . . . . . . . . . . . c c 161.2 10.6Estimate in 2015 report . . . . . . . . . . . . . . c c 158.6 8.8Estimate in 2016 report . . . . . . . . . . . . . . 170.3 -.4 152.7 4.7Estimate in 2017 report . . . . . . . . . . . . . . 174.0 1.8 148.0 1.5
Actual amount . . . . . . . . . . . . . . . . . . . . . 171.0 — 145.8 —
OASI and DI Trust Funds, combined:Estimate in 2013 report . . . . . . . . . . . . . . 1,077.1 8.1 1,046.3 9.8Estimate in 2014 report . . . . . . . . . . . . . . 1,042.7 4.6 1,022.3 7.3Estimate in 2015 report . . . . . . . . . . . . . . 1,025.5 2.9 1,006.8 5.7Estimate in 2016 report . . . . . . . . . . . . . . 996.6 d
d Between -0.05 and 0.05 percent.
965.5 1.4Estimate in 2017 report . . . . . . . . . . . . . . 1,013.8 1.7 955.2 .3
Actual amount . . . . . . . . . . . . . . . . . . . . . 996.6 — 952.5 —
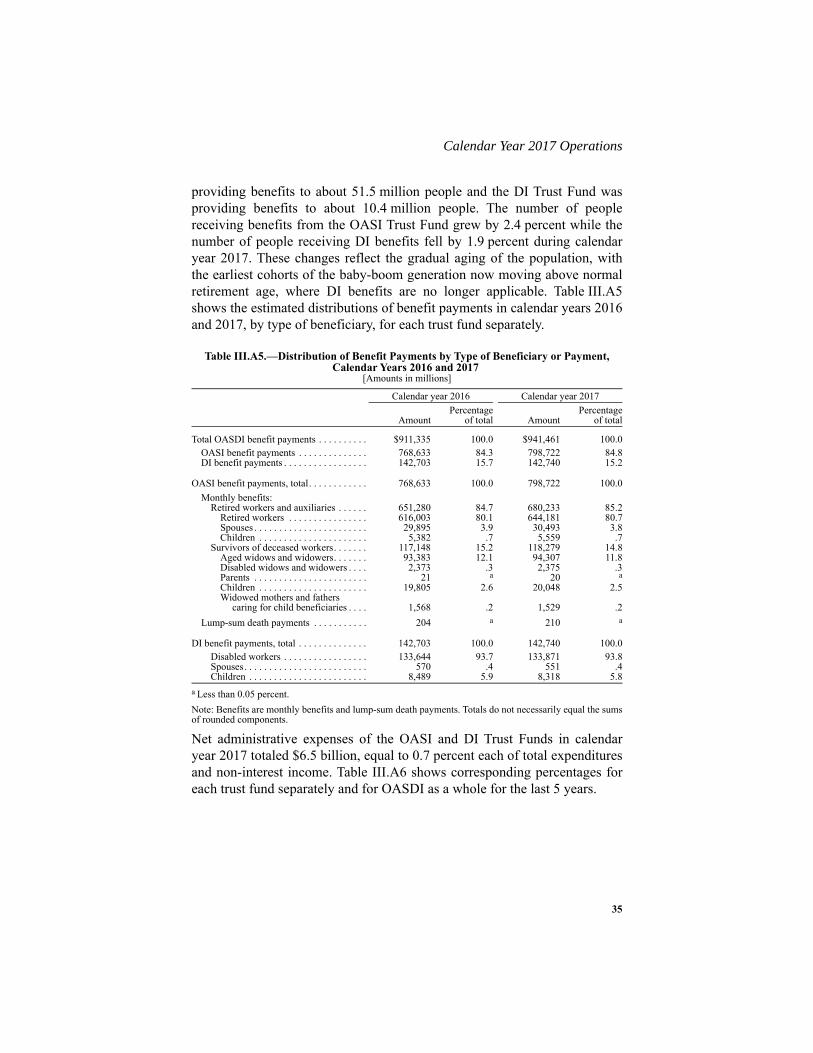
35
Calendar Year 2017 Operations
providing benefits to about 51.5 million people and the DI Trust Fund wasproviding benefits to about 10.4 million people. The number of peoplereceiving benefits from the OASI Trust Fund grew by 2.4 percent while thenumber of people receiving DI benefits fell by 1.9 percent during calendaryear 2017. These changes reflect the gradual aging of the population, withthe earliest cohorts of the baby-boom generation now moving above normalretirement age, where DI benefits are no longer applicable. Table III.A5shows the estimated distributions of benefit payments in calendar years 2016and 2017, by type of beneficiary, for each trust fund separately.
Note: Benefits are monthly benefits and lump-sum death payments. Totals do not necessarily equal the sumsof rounded components.
Net administrative expenses of the OASI and DI Trust Funds in calendaryear 2017 totaled $6.5 billion, equal to 0.7 percent each of total expendituresand non-interest income. Table III.A6 shows corresponding percentages foreach trust fund separately and for OASDI as a whole for the last 5 years.
Table III.A5.—Distribution of Benefit Payments by Type of Beneficiary or Payment, Calendar Years 2016 and 2017
[Amounts in millions]
Calendar year 2016 Calendar year 2017
AmountPercentage
of total AmountPercentage
of total
Total OASDI benefit payments . . . . . . . . . . $911,335 100.0 $941,461 100.0OASI benefit payments . . . . . . . . . . . . . . 768,633 84.3 798,722 84.8DI benefit payments . . . . . . . . . . . . . . . . . 142,703 15.7 142,740 15.2
OASI benefit payments, total. . . . . . . . . . . . 768,633 100.0 798,722 100.0Monthly benefits:
Retired workers and auxiliaries . . . . . . 651,280 84.7 680,233 85.2Retired workers . . . . . . . . . . . . . . . . 616,003 80.1 644,181 80.7Spouses . . . . . . . . . . . . . . . . . . . . . . . 29,895 3.9 30,493 3.8Children . . . . . . . . . . . . . . . . . . . . . . 5,382 .7 5,559 .7
Survivors of deceased workers. . . . . . . 117,148 15.2 118,279 14.8Aged widows and widowers. . . . . . . 93,383 12.1 94,307 11.8Disabled widows and widowers . . . . 2,373 .3 2,375 .3Parents . . . . . . . . . . . . . . . . . . . . . . . 21 a 20 aChildren . . . . . . . . . . . . . . . . . . . . . . 19,805 2.6 20,048 2.5Widowed mothers and fathers
caring for child beneficiaries . . . . 1,568 .2 1,529 .2Lump-sum death payments . . . . . . . . . . . 204 a
a Less than 0.05 percent.
210 a
DI benefit payments, total . . . . . . . . . . . . . . 142,703 100.0 142,740 100.0Disabled workers . . . . . . . . . . . . . . . . . 133,644 93.7 133,871 93.8Spouses. . . . . . . . . . . . . . . . . . . . . . . . . 570 .4 551 .4Children . . . . . . . . . . . . . . . . . . . . . . . . 8,489 5.9 8,318 5.8
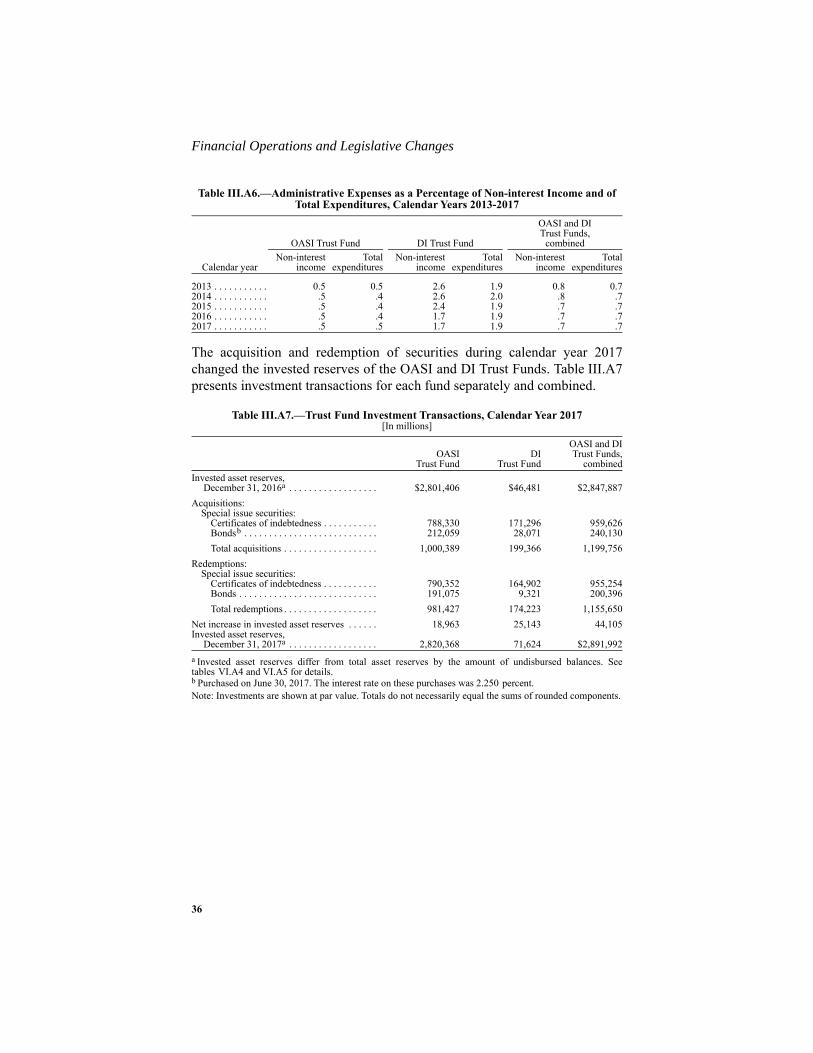
Financial Operations and Legislative Changes
36
The acquisition and redemption of securities during calendar year 2017changed the invested reserves of the OASI and DI Trust Funds. Table III.A7presents investment transactions for each fund separately and combined.
Note: Investments are shown at par value. Totals do not necessarily equal the sums of rounded components.
Table III.A6.—Administrative Expenses as a Percentage of Non-interest Income and of Total Expenditures, Calendar Years 2013-2017
Calendar year
OASI Trust Fund DI Trust Fund
OASI and DITrust Funds,
combinedNon-interest
incomeTotal
expendituresNon-interest
incomeTotal
expendituresNon-interest
incomeTotal
expenditures
2013 . . . . . . . . . . . 0.5 0.5 2.6 1.9 0.8 0.72014 . . . . . . . . . . . .5 .4 2.6 2.0 .8 .72015 . . . . . . . . . . . .5 .4 2.4 1.9 .7 .72016 . . . . . . . . . . . .5 .4 1.7 1.9 .7 .72017 . . . . . . . . . . . .5 .5 1.7 1.9 .7 .7
Table III.A7.—Trust Fund Investment Transactions, Calendar Year 2017[In millions]
OASITrust Fund
DITrust Fund
OASI and DITrust Funds,
combinedInvested asset reserves,
December 31, 2016a . . . . . . . . . . . . . . . . . .
a Invested asset reserves differ from total asset reserves by the amount of undisbursed balances. Seetables VI.A4 and VI.A5 for details.
$2,801,406 $46,481 $2,847,887Acquisitions:
Special issue securities:Certificates of indebtedness . . . . . . . . . . . 788,330 171,296 959,626Bondsb . . . . . . . . . . . . . . . . . . . . . . . . . . .
b Purchased on June 30, 2017. The interest rate on these purchases was 2.250 percent.
212,059 28,071 240,130Total acquisitions . . . . . . . . . . . . . . . . . . . 1,000,389 199,366 1,199,756
Redemptions:Special issue securities:
Certificates of indebtedness . . . . . . . . . . . 790,352 164,902 955,254Bonds . . . . . . . . . . . . . . . . . . . . . . . . . . . . 191,075 9,321 200,396Total redemptions . . . . . . . . . . . . . . . . . . . 981,427 174,223 1,155,650
Net increase in invested asset reserves . . . . . . 18,963 25,143 44,105Invested asset reserves,
December 31, 2017a . . . . . . . . . . . . . . . . . . 2,820,368 71,624 $2,891,992

37
Social Security Amendments in 2017
B. SOCIAL SECURITY AMENDMENTS SINCE THE 2017 REPORT
Since the Trustees submitted the 2017 report to Congress, the rescission ofone policy and the enactment of one law are expected to have notable effectson the financial status of the OASDI program.
The Deferred Action for Childhood Arrivals, or DACA, policy was imple-mented on June 15, 2012 and rescinded by the Administration onSeptember 5, 2017. The original policy enabled certain other-than-lawful-permanent-resident immigrants who entered the United States as children toreceive employment authorization. Rescission of DACA will reduce thenumber of authorized workers and projected payroll tax income slightly;however, fewer of these individuals will receive benefits in the longer term.As a result, the elimination of DACA has a small but significant net negativefinancial impact over the short-range projection period and a negligible netnegative effect over the long-range projection period.
The Tax Cuts and Jobs Act, Public Law 115-97, was enacted onDecember 22, 2017. This law will have several effects on the actuarial statusof the OASDI program. The law reduces tax rates for individuals, alters thetax brackets and their indexing, and repeals the individual mandate of thePatient Protection and Affordable Care Act. The repeal of the individualmandate is expected to cause some individuals to drop their employer spon-sored health insurance, which is estimated to increase OASDI covered wagesand taxable payroll slightly. The tax rate and tax bracket changes will affectincome to the trust funds from taxation of Social Security benefits. Becausethe law reduces tax rates through 2025, and the tax bracket thresholds willgrow more slowly in the future due to the change in indexing, income fromtaxation of benefits relative to last year’s report is decreased through 2025and increased thereafter. In addition, temporary changes for certain smallbusinesses will have effects on reported self-employment income. As awhole, the law has a significant net negative effect on the financial status ofthe OASDI program over the short-range projection period and a negligiblenet positive effect over the long-range projection period.
Sections IV.A.4 and IV.B.6 of this report provide further description of themagnitude of effects on the financial status of the OASDI program.

Actuarial Estimates
38
IV. ACTUARIAL ESTIMATES
This chapter presents actuarial estimates of the future financial condition ofthe Social Security program. These estimates show the income, cost, andasset reserves or unfunded obligation of the OASI and DI Trust Funds: (1) indollars over the 10-year short-range period; and (2) as a percentage of tax-able payroll, as a percentage of gross domestic product, and in present-valuedollars over the 75-year long-range period. In addition, the chapter discussesa variety of measures of the adequacy of current program financing. Thisreport distinguishes between: (1) the cost (obligations) of the program, whichincludes all future benefits scheduled under current law; and (2) expenditures(disbursements), which include actual payments for the past plus only theportion of projected program cost that would be payable with the financingprovisions in current law.
This chapter presents the estimates and measures of trust fund financial ade-quacy for the short-range period (2018 through 2027) first, followed by esti-mates and measures of actuarial status for the long-range period(2018 through 2092). Summary measures are also provided for trust fundstatus over the infinite horizon. As described in chapter II of this report, theseestimates depend upon a broad set of demographic, economic, and program-matic factors. This chapter presents estimates under three sets of assumptionsto show a wide range of possible outcomes, because assumptions related tothese factors are subject to uncertainty. The intermediate set of assumptions,designated as alternative II, reflects the Trustees’ best estimate of futureexperience; the low-cost alternative I is significantly more optimistic and thehigh-cost alternative III is significantly more pessimistic for the trust funds’future financial outlook. The tables of this report show the intermediate esti-mates first, followed by the low-cost and high-cost estimates. Chapter Vdescribes these three sets of assumptions, along with the actuarial methodsused to produce the estimates. Appendix D and appendix E present two addi-tional methods to illustrate the uncertainty of the projections. Appendix Dpresents sensitivity analyses of the effects of variation in individual factorsand appendix E presents probability distributions generated by a stochasticmodel.
In this report, the DI Trust Fund reserve depletion date is again extended, asit was for the last two reports. The experience for disability beneficiaries andbenefit levels following the last economic recession has not followed expec-tations, so substantial revisions have been required in the reports of 2016,2017, and 2018.
In 2014, initial disability applications to the states’ Disability DeterminationServices (DDS) dropped by 4.2 percent. For the 2015 report, the Trusteesassumed that applications would drop by another 1.0 percent in 2015, but the

39
Short-Range Estimates
decline was actually 4.7 percent. This larger-than-anticipated decline inapplications extended reserve depletion by about one year, in addition to thesix-year extension due to the reallocation of tax rates included in the Biparti-san Budget Act of 2015. Together, these changes extended the DI Trust Fundreserve depletion year from 2016 for the 2015 report to 2023 for the 2016report. The change in the reserve depletion date due to DI application experi-ence in the 2016 report was relatively modest, because the Trustees hadassumed a 9.1 percent rebound in applications for 2016. However, applica-tions instead dropped again in 2016, by 7.2 percent. Largely on this basis, the2017 report assumed a more gradual rise in applications after the very lowlevel in 2016, with an increase of only 2.6 percent for 2017. This more grad-ual path resulted in an additional five-year extension of the projected DIreserve depletion date, to 2028 for the 2017 report.
However, applications once again dropped in 2017, by 4.2 percent, a yetlower starting point. For this report, the Trustees have assumed a steeper risein applications and incidence rates in order to reach the unchanged ultimatelevels of incidence rates by 2027. Even with this steep rise, applications andincidence rates are lower in this year’s report than in last year’s report formuch of the first ten years of the projection period. The extension of thereserve depletion date from 2028 to 2032 for this report owes largely to thisfurther drop in applications in 2017, partially mitigated by the more rapidrebound to the ultimate assumed level.
A further mitigating factor is that SSA expects to reduce the number of dis-ability claims that are pending an Administrative Law Judge hearing over thenext several years. The reduction has already begun, with the number of dis-ability claims pending a hearing dropping somewhat in 2017. This effort toreduce the number of cases pending a hearing halted a steady rise in pendingcases that started in 2011 in the wake of the recession. SSA projects that thenumber of cases pending a hearing will be reduced to the minimum level forcases in process, thus eliminating the “backlog” by the end of 2021. Whilethis increase in hearings decisions through 2021 will tend to elevate benefitawards and incidence rates temporarily, it will also change the balancebetween benefit awards made at the DDS and at the hearings. This is signifi-cant, because the average monthly benefit level for claims awarded at hear-ings tends to be lower than for claims awarded earlier at the DDS. While thenumber of pending hearings was increasing between 2011 and 2016, and rel-atively few hearings decisions were made, benefit awards were made dispro-portionately from the earlier adjudicative DDS stages, so the average benefitlevel was relatively high. With the number of pending hearings dropping in2017, at about the pace of declining initial disability applications, a morenormal balance between hearing and earlier DDS awards has been restored.For 2017 and later, average awarded monthly benefit levels have been

Actuarial Estimates
40
reduced somewhat below the levels anticipated in the 2017 report, becausethat report did not fully take into account the temporarily elevated level ofrecent average awarded monthly benefit amounts.
The effects of these factors related to disabled-worker beneficiaries and ben-efit levels, which are partially offset by lower payroll tax revenue in the nearterm, extended the projected year of DI Trust Fund reserve depletion anotherfour years, to 2032.
A. SHORT-RANGE ESTIMATES
The Trustees consider the trust funds to be solvent at any point in time if thefunds can pay scheduled benefits in full on a timely basis. A standard mea-sure for assessing solvency is the “trust fund ratio,” which is the reserves in afund at the beginning of a year (not including advance tax transfers)expressed as a percentage of the cost during the year. A positive trust fundratio indicates that the trust fund was solvent at the end of the prior year. Thetrust fund ratio represents the proportion of a year’s cost which the reservesavailable at the beginning of that year can cover. The Trustees assume that atrust fund ratio of 100 percent of annual program cost provides a reasonable“contingency reserve.” Maintaining a reasonable contingency reserve isimportant because the trust funds do not have borrowing authority. Afterreserves are depleted, the trust funds would be unable to pay benefits in fullon a timely basis if annual revenue were less than annual cost. Unexpectedevents, such as severe economic recessions, can quickly diminish reserves.In such cases, a reasonable contingency reserve can maintain the ability topay scheduled benefits while giving lawmakers time to address possiblechanges to the program.
The test of short-range financial adequacy applies to the OASI and DI TrustFunds individually and combined on a hypothetical basis.1 If the estimatedtrust fund ratio is at least 100 percent at the beginning of the projectionperiod, the test requires that it remain at or above 100 percent throughout the10-year period. If the ratio is initially less than 100 percent, then it mustreach at least 100 percent within 5 years (without reserve depletion at anytime during this period) and then remain at or above 100 percent throughoutthe remainder of the 10-year period. This test is applied using the estimatesbased on the intermediate assumptions. If either trust fund fails this test, thenprogram solvency in the next 10 years is in question, and lawmakers shouldtake prompt action to improve short-range financial adequacy.
1 The OASI and DI Trust Funds are distinct legal entities which operate independently. To illustrate theactuarial status of the program as a whole, the fund operations are often combined on a hypothetical basis.

41
Short-Range Estimates
1. Operations of the OASI Trust Fund
This subsection presents estimates, based on the assumptions described inchapter V, of the operations and financial status of the OASI Trust Fund forthe period 2018 through 2027. These estimates assume that there are no fur-ther changes in the statutory provisions and regulations under which theOASDI program currently operates beyond the changes since last year’sreport indicated in section III.B.1
Estimates of the OASI Trust Fund operations presented in Table IV.A1 indi-cate that the asset reserves of the OASI Trust Fund are projected to decreasein all years after 2019 under the intermediate assumptions, increase in allyears after 2018 under the low-cost assumptions, and decrease in all yearsthrough 2027 under the high-cost assumptions. Trust fund ratios declinethroughout the 10-year projection period under all three sets of assumptions.Based on the intermediate assumptions, the reserves of the OASI Trust Fundcontinue to exceed 100 percent of annual cost through 2027. Consequently,the OASI Trust Fund satisfies the test of short-range financial adequacy. Seefigure IV.A1 for an illustration of these results.
1 The estimates shown in this subsection reflect 12 months of scheduled benefits in each year of the short-range projection period. In practice, the actual payment dates have at times shifted over calendar yearboundaries as a result of the statutory requirement for early delivery of benefit payments when the normalcheck delivery date is a Saturday, Sunday, or legal public holiday.
Table IV.A1.—Operations of the OASI Trust Fund, Calendar Years 2013-2027a[Dollar amounts in billions]
Calendaryear
Income Costb Asset Reservesb
Total
Net pay-roll taxcontri-
butions
GFreim-
burse-mentsc
Taxa-tion ofbene-
fitsdNet
interest Total
Sched-uled
benefits
Admin-istra-
tivecosts
RRBinter-
change
Netincrease
duringyear
Amountat end
of year
Trustfund
ratioe
Historical data:2013 . . $743.8 $620.8 $4.2 $20.7 $98.1 $679.5 $672.1 $3.4 $3.9 $64.3 $2,674.0 3842014 . . 769.4 646.2 .4 28.0 94.8 714.2 706.8 3.1 4.3 55.2 2,729.2 3742015 . . 801.6 679.5 .3 30.6 91.2 750.5 742.9 3.4 4.3 51.0 2,780.3 3642016 . . 797.5 678.8 .1 31.6 87.0 776.4 768.6 3.5 4.3 21.1 2,801.3 3582017 . . 825.6 706.5 f 35.9 83.2 806.7 798.7 3.7 4.3 19.0 2,820.3 347
Intermediate:2018 . . 828.2 714.5 f 33.1 80.6 853.6 845.5 3.3 4.7 -25.4 2,794.9 3302019 . . 918.1 802.4 f 36.5 79.2 908.5 900.3 3.3 4.8 9.7 2,804.6 3082020 . . 964.4 845.0 f 40.4 79.0 971.9 963.8 3.2 4.9 -7.6 2,797.0 2892021 . . 1,011.6 888.8 f 44.5 78.3 1,036.9 1,028.6 3.4 4.9 -25.3 2,771.7 2702022 . . 1,060.7 934.6 f 48.5 77.6 1,106.5 1,097.8 3.6 5.2 -45.9 2,725.8 250
2023 . . 1,111.7 981.3 f 52.8 77.7 1,180.1 1,171.1 3.8 5.2 -68.4 2,657.5 2312024 . . 1,166.0 1,030.7 f 57.4 78.0 1,257.4 1,248.2 3.9 5.3 -91.4 2,566.1 2112025 . . 1,220.0 1,080.1 f 62.3 77.6 1,337.1 1,327.7 4.1 5.3 -117.1 2,449.0 1922026 . . 1,287.4 1,132.0 f 78.0 77.5 1,419.6 1,410.0 4.2 5.5 -132.3 2,316.7 1732027 . . 1,343.7 1,182.4 f 84.5 76.8 1,506.4 1,496.6 4.3 5.5 -162.7 2,154.0 154
Low-cost:2018 . . 835.3 720.8 f 33.0 81.4 852.9 844.9 3.3 4.7 -17.7 2,802.7 3312019 . . 951.9 831.3 f 36.6 83.9 912.0 903.9 3.3 4.8 39.9 2,842.6 3072020 . . 1,023.1 893.9 f 40.8 88.4 981.8 973.7 3.3 4.9 41.3 2,883.9 2902021 . . 1,095.0 957.2 f 45.1 92.8 1,051.9 1,043.5 3.5 4.9 43.1 2,927.0 2742022 . . 1,170.0 1,022.2 f 49.4 98.4 1,127.4 1,118.5 3.7 5.1 42.6 2,969.6 260
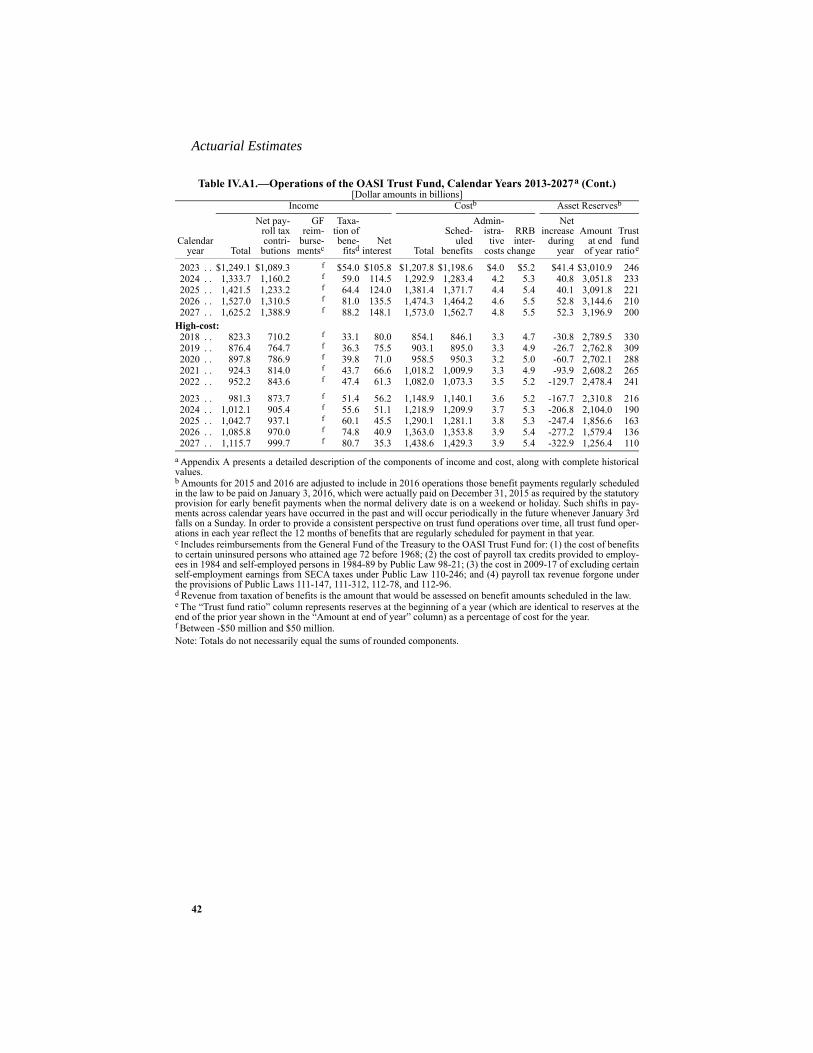
Actuarial Estimates
42
2023 . . $1,249.1 $1,089.3 f $54.0 $105.8 $1,207.8 $1,198.6 $4.0 $5.2 $41.4 $3,010.9 2462024 . . 1,333.7 1,160.2 f 59.0 114.5 1,292.9 1,283.4 4.2 5.3 40.8 3,051.8 2332025 . . 1,421.5 1,233.2 f 64.4 124.0 1,381.4 1,371.7 4.4 5.4 40.1 3,091.8 2212026 . . 1,527.0 1,310.5 f 81.0 135.5 1,474.3 1,464.2 4.6 5.5 52.8 3,144.6 2102027 . . 1,625.2 1,388.9 f 88.2 148.1 1,573.0 1,562.7 4.8 5.5 52.3 3,196.9 200
High-cost:2018 . . 823.3 710.2 f 33.1 80.0 854.1 846.1 3.3 4.7 -30.8 2,789.5 3302019 . . 876.4 764.7 f 36.3 75.5 903.1 895.0 3.3 4.9 -26.7 2,762.8 3092020 . . 897.8 786.9 f 39.8 71.0 958.5 950.3 3.2 5.0 -60.7 2,702.1 2882021 . . 924.3 814.0 f 43.7 66.6 1,018.2 1,009.9 3.3 4.9 -93.9 2,608.2 2652022 . . 952.2 843.6 f 47.4 61.3 1,082.0 1,073.3 3.5 5.2 -129.7 2,478.4 241
2023 . . 981.3 873.7 f 51.4 56.2 1,148.9 1,140.1 3.6 5.2 -167.7 2,310.8 2162024 . . 1,012.1 905.4 f 55.6 51.1 1,218.9 1,209.9 3.7 5.3 -206.8 2,104.0 1902025 . . 1,042.7 937.1 f 60.1 45.5 1,290.1 1,281.1 3.8 5.3 -247.4 1,856.6 1632026 . . 1,085.8 970.0 f 74.8 40.9 1,363.0 1,353.8 3.9 5.4 -277.2 1,579.4 1362027 . . 1,115.7 999.7 f 80.7 35.3 1,438.6 1,429.3 3.9 5.4 -322.9 1,256.4 110
a Appendix A presents a detailed description of the components of income and cost, along with complete historicalvalues.b Amounts for 2015 and 2016 are adjusted to include in 2016 operations those benefit payments regularly scheduledin the law to be paid on January 3, 2016, which were actually paid on December 31, 2015 as required by the statutoryprovision for early benefit payments when the normal delivery date is on a weekend or holiday. Such shifts in pay-ments across calendar years have occurred in the past and will occur periodically in the future whenever January 3rdfalls on a Sunday. In order to provide a consistent perspective on trust fund operations over time, all trust fund oper-ations in each year reflect the 12 months of benefits that are regularly scheduled for payment in that year. c Includes reimbursements from the General Fund of the Treasury to the OASI Trust Fund for: (1) the cost of benefitsto certain uninsured persons who attained age 72 before 1968; (2) the cost of payroll tax credits provided to employ-ees in 1984 and self-employed persons in 1984-89 by Public Law 98-21; (3) the cost in 2009-17 of excluding certainself-employment earnings from SECA taxes under Public Law 110-246; and (4) payroll tax revenue forgone underthe provisions of Public Laws 111-147, 111-312, 112-78, and 112-96.d Revenue from taxation of benefits is the amount that would be assessed on benefit amounts scheduled in the law.e The “Trust fund ratio” column represents reserves at the beginning of a year (which are identical to reserves at theend of the prior year shown in the “Amount at end of year” column) as a percentage of cost for the year.f Between -$50 million and $50 million.Note: Totals do not necessarily equal the sums of rounded components.
Table IV.A1.—Operations of the OASI Trust Fund, Calendar Years 2013-2027a (Cont.)[Dollar amounts in billions]
Calendaryear
Income Costb Asset Reservesb
Total
Net pay-roll taxcontri-
butions
GFreim-
burse-mentsc
Taxa-tion ofbene-
fitsdNet
interest Total
Sched-uled
benefits
Admin-istra-
tivecosts
RRBinter-
change
Netincrease
duringyear
Amountat end
of year
Trustfund
ratioe

43
Short-Range Estimates
The estimated income shown in table IV.A1 increases annually under eachset of assumptions throughout the short-range projection period, with theexception of a small decrease in 2018 for the high-cost alternative. The esti-mated increases in income result primarily from the projected increases inOASDI taxable earnings. Employment increases in every year through 2027for all three alternatives, with the exception of small decreases in coveredemployment in 2019 and 2020 for the high-cost alternative: the number ofpersons with taxable earnings increases under alternatives I, II, and III from173 million during calendar year 2017 to about 189 million, 185 million, and181 million, respectively, in 2027. The total annual amount of taxable earn-ings increases in every year through 2027 for each alternative. Total earningsincrease from $6,983 billion in 2017 to $13,196 billion, $11,229 billion, and$9,491 billion in 2027, on the basis of alternatives I, II, and III, respectively.These increases in taxable earnings are due primarily to: (1) projectedincreases in employment levels as the working age population increases;(2) trend increases in average earnings in covered employment (reflectingboth real growth and price inflation); (3) increases in the contribution andbenefit base under the automatic-adjustment provisions; and (4) growth inemployment and average earnings, temporarily higher than trend, as theeconomy continues to recover from the severe economic downturn thatbegan in late 2007.
Figure IV.A1.—Short-Range OASI and DI Trust Fund Ratios[Asset reserves as a percentage of annual cost]
0%
50%
100%
150%
200%
250%
300%
350%
400%
450%
500%
2007 2009 2011 2013 2015 2017 2019 2021 2023 2025 2027
Calendar year
DI
OASI
Historical Estimated
Minimumlevel for "short-term financial adequacy"
I
IIIII
I
IIIII
Actuarial Estimates
44
Interest earnings contribute to the overall projected level of trust fundincome during this period. Interest income declines generally at a slow rateunder the intermediate assumptions and much faster under the high-costassumptions, and increases generally under the low-cost assumptions, due tothe net effects of changes in reserve levels and the patterns of projected inter-est rates. Under the intermediate assumptions, interest also declines as ashare of total OASI Trust Fund income reaching 6 percent of total trust fundincome for 2027, as compared to 10 percent for 2017.
Rising OASI cost from 2017 through 2027 reflects automatic benefitincreases as well as the upward trend in the number of beneficiaries and inthe average monthly earnings underlying benefits. The steady growth in thenumber of OASI beneficiaries since 2009 and the expected future growthresult both from the increase in the aged population and from the increase inthe proportion of the population that is eligible for benefits.
The Treasury invests OASI income in financial securities, generally specialpublic-debt obligations of the U.S. Government. The revenue used to makethese purchases flows to the General Fund of the Treasury. The trust fundearns interest on these securities, and the Treasury invests the proceeds frommaturing securities in new securities if not immediately needed to pay pro-gram costs. Program expenditures require the redemption of trust fund secu-rities, generally prior to maturity, to cover the payments made by the GeneralFund of the Treasury on behalf of the trust fund.1
2. Operations of the DI Trust Fund
Table IV.A2 shows the estimated operations and financial status of the DITrust Fund during calendar years 2018 through 2027 under the three sets ofassumptions, together with values for actual experience during 2013 through2017. Non-interest income for DI is much higher in 2016 through 2018 thanin 2015, due to the temporary payroll tax rate reallocation from OASI to DI.As a result, DI Trust Fund reserves increase in 2018 under each alternative.After returning to the ultimate allocation of tax rates in 2019, non-interestincome is again less than DI cost except under the low-cost alternative. Non-interest income increases steadily thereafter under each alternative, due tomost of the same factors described previously for the OASI Trust Fund. DIcost grows steadily throughout the period under each alternative. Under theintermediate assumptions, reserves decline after 2018, but remain positivethrough 2027. Under the high-cost assumptions, DI reserves decline after2018 until depletion in the fourth quarter of 2022. Under the low-costassumptions, reserves increase throughout the short-range projection periodexcept for a small decrease in 2019.
1 For an explanation of the interrelationship between the Medicare and Social Security trust funds and theoverall Federal budget, see appendix F of the 2018 Medicare Trustees Report.
45
Short-Range Estimates
Table IV.A2.—Operations of the DI Trust Fund, Calendar Years 2013-2027a[Dollar amounts in billions]
Calendaryear
Income Costb Asset Reservesb
Total
Net pay-roll taxcontri-
butions
GFreim-
burse-mentsc
Taxa-tion ofbene-
fitsdNet
interest Total
Sched-uled
benefits
Admin-istra-
tivecosts
RRBinter-
change
Netincrease
duringyear
Amountat end
of year
Trustfund
ratioe
Historical data:2013 . . . $111.2 $105.4 $0.7 $0.4 $4.7 $143.4 $140.1 $2.8 $0.6 -$32.2 $90.4 862014 . . . 114.9 109.7 .1 1.7 3.4 145.1 141.7 2.9 .4 -30.2 60.2 622015 . . . 118.6 115.4 f 1.1 2.1 146.6 143.4 2.8 .4 -28.0 32.3 412016 . . . 160.0 157.4 f 1.2 1.4 145.9 142.8 2.8 .4 14.1 46.3 222017 . . . 171.0 167.1 f 2.0 1.9 145.8 142.8 2.8 .2 25.1 71.5 32
Intermediate:2018 . . . 172.9 168.8 f 1.5 2.6 149.3 146.3 2.8 .2 23.7 95.2 482019 . . . 143.2 138.6 f 1.7 3.0 153.0 150.1 2.8 .1 -9.8 85.3 622020 . . . 148.1 143.5 f 1.8 2.8 157.2 154.2 2.8 .2 -9.1 76.2 542021 . . . 155.4 150.9 f 2.0 2.5 163.0 159.7 3.1 .2 -7.6 68.7 472022 . . . 163.1 158.7 f 2.1 2.3 169.2 165.6 3.4 .1 -6.1 62.6 412023 . . . 171.0 166.6 f 2.3 2.1 176.5 172.7 3.7 .1 -5.4 57.2 352024 . . . 179.5 175.0 f 2.5 2.0 184.3 180.3 3.9 .1 -4.9 52.3 312025 . . . 187.9 183.4 f 2.7 1.8 193.2 188.9 4.2 .1 -5.3 47.0 272026 . . . 197.2 192.2 f 3.3 1.7 202.5 197.9 4.5 .1 -5.3 41.7 232027 . . . 205.9 200.8 f 3.6 1.5 212.1 207.3 4.7 .1 -6.2 35.5 20
Low-cost:2018 . . . 174.7 170.3 f 1.5 2.8 147.1 144.1 2.8 .2 27.5 99.0 492019 . . . 149.0 143.5 f 1.7 3.8 149.9 147.0 2.8 .1 -.9 98.1 662020 . . . 157.8 151.8 f 1.8 4.2 153.2 150.3 2.8 .2 4.5 102.6 642021 . . . 169.3 162.5 f 1.9 4.8 158.0 154.7 3.1 .1 11.3 113.9 652022 . . . 181.5 173.6 f 2.0 5.9 163.2 159.6 3.4 .1 18.3 132.2 702023 . . . 194.5 185.0 f 2.2 7.3 169.5 165.6 3.8 .1 25.0 157.3 782024 . . . 208.5 197.0 f 2.3 9.2 176.4 172.3 4.1 .1 32.1 189.3 892025 . . . 223.4 209.4 f 2.5 11.5 184.5 180.1 4.4 .1 38.9 228.2 1032026 . . . 240.0 222.5 f 3.2 14.3 193.2 188.4 4.7 .1 46.8 275.0 1182027 . . . 257.0 235.9 f 3.4 17.7 202.3 197.2 5.1 .1 54.6 329.7 136

Actuarial Estimates
46
For the future, DI cost is projected to increase in part due to increases inaverage benefit levels resulting from: (1) automatic benefit increases and(2) projected increases in the amounts of average monthly earnings on whichbenefits are based. Future changes in DI cost also reflect changes in the num-ber of DI beneficiaries in current-payment status. In 2017, the number of DIbeneficiaries in current-payment status continued the declining trend of theprior three years. Under the intermediate assumptions, that number of DIbeneficiaries is projected to drop further through the end of 2018, remainaround the same level through 2020, then increase through the remainder ofthe short-range projection period. The increases after 2020 are at a muchslower rate than was experienced on average from 1990 to 2010, due in largepart to long-anticipated demographic trends and expected economic condi-
High-cost:2018 . . .$171.8 $167.8 f $1.6 $2.4 $151.5 $148.5 $2.8 $0.2 $20.3 $91.8 472019 . . . 136.2 132.1 f 1.7 2.3 156.0 153.1 2.8 .1 -19.8 72.0 592020 . . . 137.4 133.6 f 1.9 1.9 160.6 157.6 2.8 .2 -23.3 48.7 452021 . . . 141.5 138.2 f 2.0 1.3 167.3 164.1 3.1 .2 -25.8 22.9 292022 . . . g 143.2 f 2.2 g 174.1 170.7 3.3 .2 g g 132023 . . . g 148.4 f 2.3 g 182.0 178.3 3.5 .1 g g g2024 . . . g 153.8 f 2.5 g 190.2 186.3 3.8 .1 g g g2025 . . . g 159.1 f 2.8 g 199.3 195.2 4.0 .1 g g g2026 . . . g 164.7 f 3.4 g 208.7 204.4 4.2 .1 g g g2027 . . . g 169.8 f 3.7 g 218.2 213.7 4.4 .1 g g g
a The DI Trust Fund reserves become depleted in the fourth quarter of 2022 under the high-cost assumptions.For any period during which reserves would be depleted, scheduled benefits could not be paid in full on a timelybasis, income from taxing benefits would be less than would apply to scheduled benefits, and interest on trustfund reserves would be negligible. Appendix A presents a detailed description of the components of income andcost, along with complete historical values.b Amounts for 2015 and 2016 are adjusted to include in 2016 operations those benefit payments regularly sched-uled in the law to be paid on January 3, 2016, which were actually paid on December 31, 2015 as required bythe statutory provision for early benefit payments when the normal delivery date is on a weekend or holiday.Such shifts in payments across calendar years have occurred in the past and will occur periodically in the futurewhenever January 3rd falls on a Sunday. In order to provide a consistent perspective on trust fund operationsover time, all trust fund operations in each year reflect the 12 months of benefits that are regularly scheduled forpayment in that year. c Includes reimbursements from the General Fund of the Treasury to the DI Trust Fund for: (1) the cost of pay-roll tax credits provided to employees in 1984 and self-employed persons in 1984-89 by Public Law 98-21; (2)the cost in 2009-17 of excluding certain self-employment earnings from SECA taxes under PublicLaw 110-246; and (3) payroll tax revenue forgone under the provisions of Public Laws 111-147, 111-312, 112-78, and 112-96.d Revenue from taxation of benefits is the amount that would be assessed on benefit amounts scheduled in thelaw.e The “Trust fund ratio” column represents reserves at the beginning of a year (which are identical to reserves atthe end of the prior year shown in the “Amount at end of year” column) as a percentage of cost for the year.f Between -$50 million and $50 million.g While the fund is depleted, values under current law would reflect permissible expenditures only, which wouldbe less than the cost of scheduled benefits shown in this table.Note: Totals do not necessarily equal the sums of rounded components.
Table IV.A2.—Operations of the DI Trust Fund, Calendar Years 2013-2027a (Cont.)[Dollar amounts in billions]
Calendaryear
Income Costb Asset Reservesb
Total
Net pay-roll taxcontri-
butions
GFreim-
burse-mentsc
Taxa-tion ofbene-
fitsdNet
interest Total
Sched-uled
benefits
Admin-istra-
tivecosts
RRBinter-
change
Netincrease
duringyear
Amountat end
of year
Trustfund
ratioe

47
Short-Range Estimates
tions, and in part to an expected continuation of recent low incidence ratesthrough the first few years of the short-range period as discussed insection V.C.5.
At the beginning of calendar year 2017, the reserves of the DI Trust Fundrepresented 32 percent of annual cost. During 2017, DI income substantiallyexceeded cost, and the estimated trust fund ratio for the beginning of 2018increased to about 48 percent. Under the intermediate assumptions, the tem-porary reallocation of the payroll tax rate from OASI to DI causes DI totalincome to exceed cost in 2018, and reserves to increase to a level of62 percent of annual cost at the beginning of 2019. Thereafter, cost exceedstotal income throughout the short-range projection period and trust fundreserves steadily decline.
Because the reserves of the DI Trust Fund at the beginning of 2018 were lessthan the estimated annual cost for 2018, and are projected to remain belowannual cost throughout the short-range period under the intermediateassumptions, the DI Trust Fund fails the Trustees’ test of short-range finan-cial adequacy.
3. Operations of the Combined OASI and DI Trust Funds
Table IV.A3 shows the estimated operations and status of the combinedOASI and DI Trust Funds for calendar years 2018 through 2027 under thethree alternatives, together with actual experience in 2013 through 2017.Income and cost for the OASI Trust Fund represent over 80 percent of thecorresponding amounts for the combined OASI and DI Trust Funds. There-fore, based on the relative strength of the OASI Trust Fund over the next10 years, the combined OASI and DI Trust Funds would have sufficientfinancial resources to pay all scheduled benefits through the end of the short-range period, although it is important to note that under current law, one trustfund cannot share financial resources with another trust fund. In addition, thecombined OASI and DI Trust Funds would satisfy the test of short-rangefinancial adequacy.
Table IV.A3.—Operations of the Combined OASI and DI Trust Funds,Calendar Years 2013-2027a
[Dollar amounts in billions]
Calendaryear
Income Costb Asset Reservesb
Total
Net pay-roll taxcontri-
butions
GFreim-
burse-mentsc
Taxa-tion
of bene-fitsd
Netinterest Total
Sched-uled
benefits
Admin-istra-
tivecosts
RRBinter-
change
Netincrease
duringyear
Amountat end
of year
Trustfund
ratioe
Historical data:2013 . . $855.0 $726.2 $4.9 $21.1 $102.8 $822.9 $812.3 $6.2 $4.5 $32.1 $2,764.4 3322014 . . 884.3 756.0 .5 29.6 98.2 859.2 848.5 6.1 4.7 25.0 2,789.5 3222015 . . 920.2 794.9 .3 31.6 93.3 897.1 886.3 6.2 4.7 23.0 2,812.5 3112016 . . 957.5 836.2 .1 32.8 88.4 922.3 911.4 6.2 4.7 35.2 2,847.7 3052017 . . 996.6 873.6 f 37.9 85.1 952.5 941.5 6.5 4.5 44.1 2,891.8 299
Actuarial Estimates
48
Intermediate:2018 . . $1,001.1 $883.4 f $34.6 $83.1 $1,002.8 $991.8 $6.2 $4.9 -$1.7 $2,890.1 2882019 . . 1,061.4 941.0 f 38.2 82.2 1,061.5 1,050.5 6.1 5.0 -.2 2,889.9 2722020 . . 1,112.5 988.5 f 42.2 81.8 1,129.2 1,118.0 6.1 5.1 -16.7 2,873.2 2562021 . . 1,167.0 1,039.7 f 46.4 80.9 1,199.9 1,188.3 6.5 5.1 -32.9 2,840.3 2392022 . . 1,223.7 1,093.3 f 50.6 79.8 1,275.7 1,263.4 7.0 5.3 -51.9 2,788.4 223
2023 . . 1,282.8 1,147.9 f 55.0 79.8 1,356.5 1,343.8 7.4 5.4 -73.8 2,714.6 2062024 . . 1,345.5 1,205.7 f 59.8 80.0 1,441.8 1,428.5 7.8 5.4 -96.3 2,618.4 1882025 . . 1,407.9 1,263.5 f 65.0 79.4 1,530.2 1,516.6 8.2 5.4 -122.4 2,496.0 1712026 . . 1,484.6 1,324.2 f 81.3 79.1 1,622.1 1,607.9 8.7 5.6 -137.5 2,358.5 1542027 . . 1,549.6 1,383.2 f 88.1 78.3 1,718.5 1,703.9 9.1 5.6 -169.0 2,189.5 137
Low-cost:2018 . . 1,010.0 891.1 f 34.6 84.3 1,000.1 989.0 6.2 4.9 9.9 2,901.7 2892019 . . 1,100.9 974.9 f 38.3 87.7 1,061.9 1,050.9 6.1 4.9 39.0 2,940.7 2732020 . . 1,180.9 1,045.7 f 42.6 92.6 1,135.0 1,123.9 6.1 5.0 45.8 2,986.5 2592021 . . 1,264.3 1,119.7 f 47.0 97.6 1,209.9 1,198.2 6.7 5.0 54.4 3,040.9 2472022 . . 1,351.4 1,195.7 f 51.4 104.3 1,290.5 1,278.1 7.2 5.3 60.9 3,101.8 236
2023 . . 1,443.6 1,274.3 f 56.2 113.1 1,377.2 1,364.2 7.7 5.3 66.4 3,168.2 2252024 . . 1,542.2 1,357.2 f 61.3 123.7 1,469.3 1,455.7 8.2 5.4 72.9 3,241.1 2162025 . . 1,644.9 1,442.6 f 66.9 135.4 1,566.0 1,551.8 8.8 5.5 78.9 3,320.1 2072026 . . 1,767.1 1,533.1 f 84.1 149.9 1,667.5 1,652.6 9.3 5.6 99.6 3,419.6 1992027 . . 1,882.2 1,624.8 f 91.6 165.8 1,775.3 1,759.8 9.8 5.6 106.9 3,526.5 193
High-cost:2018 . . 995.1 878.1 f 34.7 82.4 1,005.6 994.6 6.2 4.9 -10.5 2,881.3 2882019 . . 1,012.6 896.8 f 38.0 77.8 1,059.1 1,048.1 6.1 5.0 -46.5 2,834.8 2722020 . . 1,035.1 920.5 f 41.7 72.9 1,119.1 1,107.9 6.1 5.1 -84.0 2,750.8 2532021 . . 1,065.8 952.3 f 45.7 67.9 1,185.5 1,174.0 6.4 5.1 -119.7 2,631.1 2322022 . . 1,098.0 986.8 f 49.6 61.6 1,256.1 1,244.0 6.8 5.3 -158.1 2,473.0 209
2023 . . 1,131.2 1,022.1 f 53.7 55.4 1,330.9 1,318.4 7.1 5.4 -199.7 2,273.3 1862024 . . 1,166.2 1,059.2 f 58.1 48.9 1,409.1 1,396.2 7.4 5.4 -242.8 2,030.4 1612025 . . 1,200.8 1,096.2 f 62.9 41.7 1,489.4 1,476.2 7.7 5.4 -288.6 1,741.9 1362026 . . 1,248.4 1,134.7 f 78.3 35.3 1,571.7 1,558.2 8.0 5.5 -323.4 1,418.5 1112027 . . 1,281.5 1,169.5 f 84.4 27.6 1,656.8 1,643.0 8.3 5.5 -375.3 1,043.2 86
a Appendix A presents a detailed description of the components of income and cost, along with complete histori-cal values.b Amounts for 2015 and 2016 are adjusted to include in 2016 operations those benefit payments regularly sched-uled in the law to be paid on January 3, 2016, which were actually paid on December 31, 2015 as required by thestatutory provision for early benefit payments when the normal delivery date is on a weekend or holiday. Suchshifts in payments across calendar years have occurred in the past and will occur periodically in the future when-ever January 3rd falls on a Sunday. In order to provide a consistent perspective on trust fund operations over time,all trust fund operations in each year reflect the 12 months of benefits that are regularly scheduled for payment inthat year. c Includes reimbursements from the General Fund of the Treasury to the OASI and DI Trust Funds for: (1) thecost of benefits to certain uninsured persons who attained age 72 before 1968; (2) the cost of payroll tax creditsprovided to employees in 1984 and self-employed persons in 1984-89 by Public Law 98-21; (3) the cost in2009-17 of excluding certain self-employment earnings from SECA taxes under Public Law 110-246; and (4)payroll tax revenue forgone under the provisions of Public Laws 111-147, 111-312, 112-78, and 112-96.d Revenue from taxation of benefits is the amount that would be assessed on benefit amounts scheduled in thelaw.e The “Trust fund ratio” column represents reserves at the beginning of a year (which are identical to reserves atthe end of the prior year shown in the “Amount at end of year” column) as a percentage of cost for the year.f Between -$50 million and $50 million.Note: Totals do not necessarily equal the sums of rounded components.
Table IV.A3.—Operations of the Combined OASI and DI Trust Funds,Calendar Years 2013-2027a (Cont.)
[Dollar amounts in billions]
Calendaryear
Income Costb Asset Reservesb
Total
Net pay-roll taxcontri-
butions
GFreim-
burse-mentsc
Taxa-tion
of bene-fitsd
Netinterest Total
Sched-uled
benefits
Admin-istra-
tivecosts
RRBinter-
change
Netincrease
duringyear
Amountat end
of year
Trustfund
ratioe

49
Short-Range Estimates
4. Factors Underlying Changes in 10-Year Trust Fund Ratio EstimatesFrom Last Year’s Report
Table IV.A4 presents an analysis of the factors underlying the changes in theintermediate estimates over the short-range projection period for the OASI,DI, and the combined funds from last year’s report to this report.
In the 2017 report under intermediate assumptions, the trust fund ratio forOASI reached 187 percent at the beginning of 2026—the tenth projectionyear for that report. The change in the short-range valuation period alone,from 2017 through 2026 to 2018 through 2027, lowered the estimated trustfund ratio for the tenth year by 19 percentage points, to 168 percent. Allother changes to reflect modifications in law and regulations since last year’sreport, the most recent data, adjustments to the assumptions for future years,and changes in projection methods combined for a net decrease in the ratiofor the tenth projection year of 14 percentage points. Therefore, the totalchange in the 10th-year projected trust fund ratio from last year’s report tothis year’s report is a reduction of 33 percentage points to 154 percent.
The Tax Cuts and Jobs Act of 2017 (P.L. 115-97) and the assumed discontin-uation of the DACA program together reduced the projected tenth year OASItrust fund ratio by 6 percentage points, primarily due to lower projected taxincome. Changes in demographic assumptions over the short-range periodincreased the projected tenth-year trust fund ratio for OASI by 3 percentagepoints. Changes in economic data and assumptions, primarily the effect ofdecreases in estimated payroll tax revenue, along with effects from lowerprojected interest rates and lower cost-of-living adjustments that largely off-set each other, caused a net reduction in the OASI trust fund ratio of16 percentage points by the beginning of 2027. Incorporating recent pro-grammatic data resulted in an increase of 5 percentage points in the tenthyear OASI trust fund ratio. This increase was primarily due to recent datashowing that retired workers have been starting benefits at later ages, whichin turn led to lower beneficiary counts throughout the short-range period,with only partially offsetting increases in average monthly benefit levels.Finally, the tenth year trust fund ratio was not affected significantly bychanges in the short-range methodology for this report.
Table IV.A4 also shows corresponding estimates of the factors underlyingthe changes in the financial projections for the DI Trust Fund and for thecombined OASI and DI Trust Funds.
The 4-percentage-point increase in the DI trust fund ratio from the beginningof 2026 in last year’s report to the beginning of 2027 in this year’s report isthe net effect of increases and decreases from the factors described above forthe OASI Trust Fund, combined with a large increase of 31 points due to pro-

Actuarial Estimates
50
grammatic data and assumptions, predominantly the lower estimated dis-abled-worker incidence rates early in the short-range projection period.Disability applications have been declining steadily since 2010, and the totalnumber of disabled-worker beneficiaries in current payment status has beenfalling since 2014. In last year’s report, the number of disabled-worker bene-ficiaries was projected to remain essentially the same at 8.8 million from theend of 2016 to the end of 2017. In fact, the number dropped below8.7 million by the end of 2017. For this report, ultimate disability incidencerate assumptions are unchanged from the last report. However, this year’sreport has lower incidence rates over the first few years of the short-rangeperiod, and a gradual rise from recent low levels, reaching the ultimate DIincidence rates by the end of the short-range period. In addition, averageawarded monthly benefit levels for disabled-worker beneficiaries were lowerthan expected in 2017, and are expected to be lower in the future. Disabled-worker average awarded monthly benefit levels were somewhat elevated in2011 through 2016 due to reduced numbers of hearings decisions (wheremonthly benefit levels tend to be relatively low), as the number of applicantsawaiting a hearing increased. In 2017, hearings decisions increased, thusrestoring a more normal, and somewhat lower, average benefit level for dis-abled workers newly awarded benefits in 2017. See page 38 for more detailson these changes in DI projections.
Note: Totals do not necessarily equal the sums of rounded components.
Table IV.A4.—Reasons for Change in Trust Fund (Unfunded Obligation) Ratios at the Beginning of the Tenth Year of Projection Under Intermediate Assumptions
[In percent]
ItemOASI
Trust FundDI
Trust Fund
OASI and DITrust Funds,
combined
Trust fund ratio shown in last year’s report for calendar year 2026 . 187 16 165
Change in trust fund ratio due to changes in: Legislation and regulations . . . . . . . . . . . . . . . . . . . . . . . . . . . . . -6 -3 -5Valuation period . . . . . . . . . . . . . . . . . . . . . . . . . . . . . . . . . . . . . . -19 -7 -18Demographic data and assumptions. . . . . . . . . . . . . . . . . . . . . . . 3 a
a Between -0.5 and 0.5 percent.
2Economic data and assumptions . . . . . . . . . . . . . . . . . . . . . . . . . -16 -17 -16Programmatic data and assumptions . . . . . . . . . . . . . . . . . . . . . . 5 31 9Projection methods and data . . . . . . . . . . . . . . . . . . . . . . . . . . . . a a a
Total change in trust fund ratio . . . . . . . . . . . . . . . . . . . . . . . . . . . . -33 4 -28
Trust fund ratio shown in this report for calendar year 2027. . . . . . . 154 20 137
51
Long-Range Estimates
B. LONG-RANGE ESTIMATES
The Trustees use three types of financial measures to assess the actuarial sta-tus of the Social Security trust funds under the financing approach specifiedin current law: (1) annual cash-flow measures, including income rates, costrates, and balances; (2) trust fund ratios; and (3) summary measures such asactuarial balances and unfunded obligations.
The difference between the annual income rate and annual cost rate, bothexpressed as percentages of taxable payroll, is the annual balance. The leveland trend of the annual balances at the end of the 75-year projection periodare factors that the Trustees use to assess the financial condition of the pro-gram.
The trust fund ratio for a year is the proportion of the year’s projected costthat could be paid with funds available at the beginning of the year. Criticalfactors considered by the Trustees in assessing actuarial status include:(1) the level and year of maximum trust fund ratio, (2) the year of depletionof the fund reserves and the percent of scheduled benefits that is still payableafter reserves are depleted, and (3) the stability of the trust fund ratio at theend of the long-range period.
Solvency at any point in time requires that sufficient financial resources areavailable to pay all scheduled benefits at that time. Solvency is generallyindicated by a positive trust fund ratio. “Sustainable solvency” for the financ-ing of the program under a specified set of assumptions has been achievedwhen the projected trust fund ratio is positive throughout the 75-year projec-tion period and is either stable or rising at the end of the period.
Summarized measures for any period indicate whether projected income issufficient, on average, for the whole period. Summarized measures can onlyindicate the solvency status of a fund for the end of the period. The Trusteessummarize the total income and cost over valuation periods that extendthrough 75 years and over the infinite horizon.1 This section presents twosummarized measures: the actuarial balance and the open group unfundedobligation. The actuarial balance indicates the size of any surplus or shortfallas a percentage of the taxable payroll over the period. The open groupunfunded obligation indicates the size of any shortfall in present-value dol-lars.
This section also includes additional information that the Trustees use toassess the financial status of the Social Security program, including: (1) acomparison of the number of beneficiaries to the number of covered workers,
1 See appendix F.

Actuarial Estimates
52
(2) the test of long-range close actuarial balance, and (3) the reasons for thechange in the actuarial balance from the last report.
1. Annual Income Rates, Cost Rates, and Balances
The concepts of income rate and cost rate, expressed as percentages of tax-able payroll, are important in the consideration of the long-range actuarialstatus of the trust funds. The annual income rate is the ratio of all non-inter-est income to the OASDI taxable payroll for the year. Non-interest incomeincludes payroll taxes, taxes on scheduled benefits, and any General Fundtransfers or reimbursements. The OASDI taxable payroll consists of the totalearnings subject to OASDI taxes with some relatively small adjustments.1
The annual cost rate is the ratio of the cost of the program to the taxable pay-roll for the year. The cost includes scheduled benefits, administrativeexpenses, net interchange with the Railroad Retirement program, and pay-ments for vocational rehabilitation services for disabled beneficiaries. Forany year, the income rate minus the cost rate is the “balance” for the year.
Table IV.B1 presents a comparison of the estimated annual income rates andcost rates by trust fund and alternative. Table IV.B2 shows the separate com-ponents of the annual income rates.
Under the intermediate assumptions, the Trustees project that the OASIincome rate will increase from 10.30 percent of payroll for 2018 to11.03 percent of payroll for 2019. The projected OASI income rate is low for2018 because of the payroll tax rate reallocation of 0.57 percentage pointfrom OASI to DI for 2016 through 2018, as enacted in the Bipartisan BudgetAct of 2015. After returning to the pre-reallocation level for 2019, theincome rate generally rises at a very gradual rate to 11.52 percent of taxablepayroll for 2092. Income from taxation of benefits causes a gradual increasein the OASI income rate for two main reasons: (1) total scheduled benefitsare rising faster than payroll; and (2) the benefit-taxation threshold amountsare fixed (not indexed), and therefore an increasing share of total benefitswill be subject to tax as incomes and benefits rise. There is also a one-timeupward shift in the income rate, from 11.19 percent of payroll for 2025 to11.31 percent of payroll for 2026, because of increased taxation of benefitsdue to expiration of the personal income tax provisions in Public Law 115-97, the Tax Cuts and Jobs Act.
1 Adjustments include adding deemed wage credits based on military service for 1983-2001 and reflectingthe lower effective tax rates (as compared to the combined employee-employer rate) that apply to multiple-employer “excess wages.” Lower rates also applied to net earnings from self-employment before 1984 andto income from tips before 1988.

53
Long-Range Estimates
From 2018 to 2037, the OASI cost rate rises rapidly because the retirementof the baby-boom generation will continue to increase the number of benefi-ciaries much faster than the number of workers increases, as subsequentlower-birth-rate generations replace the baby-boom generation at workingages. From 2038 to 2052, the cost rate declines because the aging baby-boomgeneration is gradually replaced at retirement ages by the subsequentlylower-birth-rate generation born between 1966 and 1989. After 2052, theprojected OASI cost rate rises through 2078 and then fluctuates, reaching15.48 percent of taxable payroll for 2092, with the increase primarilybecause of projected reductions in death rates at older ages.
Projections of income rates under the low-cost and high-cost sets of assump-tions are similar to those projected for the intermediate assumptions, becauseincome rates are largely a reflection of the payroll tax rates specified in thelaw, with the changes from taxation of benefits noted above. In contrast,OASI cost rates for the low-cost and high-cost assumptions are significantlydifferent from those projected for the intermediate assumptions. For the low-cost assumptions, the OASI cost rate decreases through 2019, and then risesuntil it peaks in 2036 at 12.60 percent of payroll. The cost rate then declinesto 11.56 percent for 2055, rises to 11.74 percent for 2071, and declines againto 11.18 percent for 2088 before rising to 11.30 percent for 2092, at whichpoint the income rate reaches 11.26 percent. For the high-cost assumptions,the OASI cost rate rises throughout the 75-year period. It rises relatively rap-idly through about 2039 because of the aging of the baby-boom generation.Thereafter, the cost rate continues to rise and reaches 21.97 percent of pay-roll for 2092, at which point the income rate reaches 11.92 percent.
The pattern of the projected OASI annual balance is important in the analysisof the financial condition of the program. Under the intermediate assump-tions, the annual balance is negative throughout the projection period. Thisannual deficit is temporarily higher for years 2016 through 2018 because ofthe 0.57-percentage-point payroll tax rate reallocation from OASI to DI.After returning to the pre-reallocation tax rates in 2019, the annual deficitthen rises relatively rapidly from 0.91 percent for 2019 to 3.41 percent for2038. It then declines to 2.99 percent of payroll for 2052, and generally risesthereafter, reaching 3.96 percent of taxable payroll for 2092.
Under the low-cost assumptions, after the 2016-2018 payroll tax rate reallo-cation period, the OASI annual deficit generally rises from 0.56 percent ofpayroll for 2019 to 1.30 percent of payroll for 2035. Then the annual deficitgenerally declines until it becomes a positive annual balance for 2085. Theannual balance turns negative again for 2092, at which point the deficit is0.04 percent of payroll. Under the high-cost assumptions, the OASI balancegenerally worsens throughout the projection period. Annual deficits rise to
Actuarial Estimates
54
1.77 percent for 2020, 6.48 percent for 2050, and 10.05 percent of payroll for2092.
Table IV.B1.—Annual Income Rates, Cost Rates, and Balances,Calendar Years 1990-2095
[As a percentage of taxable payroll]
Calendar year
OASI DI OASDIIncome
rateaCostrateb Balanceb
Incomeratea
Costrateb Balanceb
Incomeratea
Costrateb Balanceb
Historical data:1990 . . . . . 11.47 9.65 1.82 1.18 1.09 0.10 12.65 10.74 1.911995 . . . . . 10.65 10.23 .42 1.87 1.44 .43 12.52 11.67 .852000 . . . . . 10.85 8.98 1.87 1.78 1.42 .36 12.62 10.40 2.23
2005 . . . . . 10.96 9.31 1.65 1.84 1.85 -.02 12.80 11.16 1.632006 . . . . . 10.96 9.18 1.78 1.83 1.88 -.05 12.79 11.06 1.732007 . . . . . 11.01 9.44 1.57 1.84 1.88 -.04 12.85 11.32 1.532008 . . . . . 10.90 9.54 1.37 1.83 2.01 -.19 12.73 11.55 1.182009 . . . . . 11.23 10.74 .50 1.88 2.31 -.43 13.11 13.05 .062010 . . . . . 10.75 11.06 -.30 1.79 2.41 -.62 12.54 13.47 -.922011 . . . . . 10.84 11.04 -.21 1.80 2.42 -.62 12.64 13.47 -.832012 . . . . . 11.05 11.35 -.30 1.81 2.47 -.66 12.86 13.82 -.962013 . . . . . 10.97 11.54 -.57 1.81 2.44 -.63 12.78 13.98 -1.202014 . . . . . 10.96 11.60 -.64 1.81 2.36 -.55 12.77 13.96 -1.192015 . . . . . 11.00 11.62 -.62 1.80 2.27 -.47 12.80 13.89 -1.092016 . . . . . 10.71 11.70 -.99 2.39 2.20 .19 13.10 13.90 -.802017 . . . . . 10.67 11.60 -.92 2.43 2.10 .33 13.10 13.69 -.59
Intermediate:2018 . . . . . 10.30 11.75 -1.46 2.35 2.06 .29 12.64 13.81 -1.172019 . . . . . 11.03 11.94 -.91 1.84 2.01 -.17 12.87 13.95 -1.082020 . . . . . 11.08 12.16 -1.08 1.82 1.97 -.15 12.89 14.12 -1.232021 . . . . . 11.10 12.33 -1.23 1.82 1.94 -.12 12.92 14.27 -1.352022 . . . . . 11.13 12.52 -1.40 1.82 1.91 -.09 12.95 14.44 -1.492023 . . . . . 11.14 12.72 -1.57 1.82 1.90 -.08 12.97 14.62 -1.662024 . . . . . 11.17 12.91 -1.74 1.82 1.89 -.07 12.99 14.80 -1.812025 . . . . . 11.19 13.09 -1.91 1.82 1.89 -.07 13.01 14.98 -1.982026 . . . . . 11.31 13.27 -1.96 1.83 1.89 -.06 13.13 15.16 -2.022027 . . . . . 11.33 13.47 -2.14 1.83 1.90 -.07 13.15 15.36 -2.21
2030 . . . . . 11.37 14.09 -2.72 1.83 1.89 -.07 13.20 15.98 -2.782035 . . . . . 11.42 14.71 -3.28 1.83 1.95 -.12 13.25 16.65 -3.402040 . . . . . 11.44 14.83 -3.39 1.83 2.00 -.17 13.27 16.83 -3.562045 . . . . . 11.43 14.59 -3.15 1.83 2.07 -.24 13.27 16.66 -3.392050 . . . . . 11.43 14.44 -3.01 1.84 2.10 -.27 13.27 16.54 -3.272055 . . . . . 11.44 14.46 -3.02 1.84 2.13 -.29 13.28 16.59 -3.312060 . . . . . 11.46 14.70 -3.24 1.84 2.11 -.27 13.29 16.81 -3.512065 . . . . . 11.48 14.95 -3.47 1.84 2.12 -.28 13.31 17.07 -3.752070 . . . . . 11.50 15.23 -3.74 1.84 2.13 -.29 13.34 17.36 -4.032075 . . . . . 11.51 15.48 -3.96 1.84 2.11 -.27 13.35 17.59 -4.232080 . . . . . 11.52 15.49 -3.97 1.84 2.11 -.28 13.36 17.61 -4.252085 . . . . . 11.51 15.37 -3.86 1.84 2.16 -.32 13.35 17.53 -4.182090 . . . . . 11.52 15.40 -3.89 1.84 2.20 -.36 13.35 17.60 -4.242095 . . . . . 11.53 15.63 -4.10 1.84 2.20 -.36 13.37 17.82 -4.45
First year balance becomesnegative and remains negativethroughout the 75-yearprojection period . . . . . . . . . . . 2010 . . . . . . . . . . . . . . . . 2019 . . . . . . . . . . . . . . . . 2010
55
Long-Range Estimates
Low-cost:2018 . . . . . 10.24 11.59 -1.35 2.34 2.00 0.34 12.58 13.59 -1.012019 . . . . . 11.01 11.56 -.56 1.84 1.90 -.06 12.85 13.46 -.622020 . . . . . 11.04 11.60 -.56 1.81 1.81 c 12.86 13.41 -.552021 . . . . . 11.06 11.61 -.55 1.81 1.74 .07 12.88 13.35 -.482022 . . . . . 11.08 11.66 -.58 1.82 1.69 .13 12.90 13.35 -.452023 . . . . . 11.09 11.72 -.63 1.82 1.64 .17 12.91 13.36 -.452024 . . . . . 11.11 11.79 -.67 1.82 1.61 .21 12.93 13.39 -.462025 . . . . . 11.12 11.84 -.72 1.82 1.58 .24 12.94 13.42 -.482026 . . . . . 11.22 11.89 -.67 1.82 1.56 .26 13.04 13.45 -.412027 . . . . . 11.23 11.96 -.73 1.82 1.54 .28 13.06 13.50 -.45
2030 . . . . . 11.27 12.33 -1.06 1.82 1.49 .34 13.09 13.81 -.722035 . . . . . 11.30 12.60 -1.30 1.82 1.46 .36 13.12 14.06 -.942040 . . . . . 11.30 12.44 -1.14 1.82 1.45 .37 13.12 13.89 -.762045 . . . . . 11.28 11.98 -.70 1.82 1.47 .35 13.10 13.45 -.352050 . . . . . 11.27 11.67 -.41 1.82 1.46 .36 13.09 13.13 -.052055 . . . . . 11.26 11.56 -.29 1.82 1.46 .36 13.09 13.02 .072060 . . . . . 11.27 11.63 -.36 1.82 1.44 .38 13.09 13.07 .032065 . . . . . 11.28 11.69 -.41 1.82 1.44 .39 13.10 13.12 -.022070 . . . . . 11.28 11.74 -.46 1.82 1.44 .39 13.11 13.17 -.072075 . . . . . 11.28 11.72 -.43 1.82 1.42 .40 13.10 13.14 -.032080 . . . . . 11.27 11.50 -.23 1.82 1.43 .39 13.09 12.92 .172085 . . . . . 11.25 11.23 .02 1.82 1.47 .35 13.08 12.70 .382090 . . . . . 11.25 11.22 .04 1.82 1.50 .32 13.08 12.72 .362095 . . . . . 11.27 11.45 -.18 1.82 1.50 .32 13.09 12.95 .14
First year balance becomesnegative and remains negativethroughout the 75-year projection period . . . . . . . . . . . 2092 . . . . . . . . . . . . . . . . d . . . . . . . . . . . . . . . . d
High-cost:2018 . . . . . 10.33 11.87 -1.54 2.35 2.11 .25 12.69 13.98 -1.292019 . . . . . 11.06 12.47 -1.41 1.85 2.15 -.31 12.91 14.63 -1.722020 . . . . . 11.11 12.88 -1.77 1.82 2.16 -.34 12.93 15.04 -2.112021 . . . . . 11.15 13.24 -2.09 1.82 2.18 -.35 12.97 15.41 -2.442022 . . . . . 11.18 13.58 -2.40 1.82 2.19 -.36 13.01 15.76 -2.762023 . . . . . 11.21 13.92 -2.71 1.83 2.20 -.38 13.03 16.12 -3.092024 . . . . . 11.24 14.25 -3.02 1.83 2.22 -.40 13.07 16.48 -3.412025 . . . . . 11.26 14.57 -3.31 1.83 2.25 -.42 13.09 16.82 -3.732026 . . . . . 11.40 14.87 -3.47 1.83 2.28 -.44 13.24 17.15 -3.912027 . . . . . 11.43 15.22 -3.79 1.84 2.31 -.47 13.27 17.53 -4.26
Table IV.B1.—Annual Income Rates, Cost Rates, and Balances,Calendar Years 1990-2095 (Cont.)
[As a percentage of taxable payroll]
Calendar year
OASI DI OASDIIncome
rateaCostrateb Balanceb
Incomeratea
Costrateb Balanceb
Incomeratea
Costrateb Balanceb
Actuarial Estimates
56
Notes:1. The income rate excludes interest income.2. Revisions of taxable payroll may change some historical values.3. Totals do not necessarily equal the sums of rounded components.
Under the intermediate assumptions, the projected DI cost rate declines from2.06 percent for 2018 to 1.89 percent for 2025, and remains relatively stablethrough 2032. After 2032, the DI cost rate increases gradually to2.13 percent for 2055. From 2055 to 2077, the DI cost rate stays relativelystable before increasing slowly to 2.20 percent of payroll for 2092. The pro-jected DI income rate decreases from 2.35 percent of payroll for 2018 to 1.84for 2019. Between 2016 and 2018, the income rate is higher due to the tem-porary payroll tax rate reallocation. Thereafter, the income rate remains rela-tively stable, reaching 1.84 percent for 2092. The annual balance is positivefor years 2016 through 2018, reflecting the reallocation. Thereafter, theannual deficit reappears, generally declines from 0.17 percent for 2019 to alow of 0.06 percent for 2029, and then generally increases to 0.36 percent for2092.
Under the low-cost assumptions, the projected DI cost rate declines from2.00 percent of payroll for 2018 to 1.45 percent for 2039, and remains rela-
High-cost (Cont.):2030 . . . . . 11.49 16.16 -4.66 1.84 2.37 -0.53 13.33 18.53 -5.202035 . . . . . 11.57 17.23 -5.66 1.84 2.52 -.68 13.41 19.75 -6.342040 . . . . . 11.61 17.79 -6.18 1.84 2.66 -.82 13.46 20.45 -6.992045 . . . . . 11.63 17.94 -6.31 1.85 2.83 -.98 13.48 20.77 -7.292050 . . . . . 11.65 18.13 -6.48 1.85 2.92 -1.07 13.50 21.05 -7.552055 . . . . . 11.67 18.45 -6.77 1.85 2.99 -1.14 13.53 21.44 -7.912060 . . . . . 11.71 18.99 -7.28 1.85 3.00 -1.14 13.57 21.99 -8.422065 . . . . . 11.75 19.58 -7.82 1.86 3.02 -1.17 13.61 22.60 -8.992070 . . . . . 11.80 20.28 -8.48 1.86 3.05 -1.19 13.66 23.33 -9.672075 . . . . . 11.85 21.01 -9.16 1.86 3.02 -1.16 13.70 24.03 -10.332080 . . . . . 11.88 21.50 -9.62 1.86 3.01 -1.15 13.74 24.50 -10.772085 . . . . . 11.90 21.73 -9.83 1.86 3.03 -1.17 13.76 24.75 -11.002090 . . . . . 11.91 21.89 -9.98 1.86 3.06 -1.20 13.77 24.95 -11.182095 . . . . . 11.93 22.10 -10.18 1.86 3.07 -1.21 13.78 25.17 -11.38
First year balance becomesnegative and remains negativethroughout the 75-yearprojection period . . . . . . . . . . . 2010 . . . . . . . . . . . . . . . . 2019 . . . . . . . . . . . . . . . . 2010
a Income rates include certain reimbursements from the General Fund of the Treasury.b Benefit payments scheduled to be paid on January 3 are actually paid on December 31 as required by thestatutory provision for early delivery of benefit payments when the normal payment delivery date is a Satur-day, Sunday, or legal public holiday. For comparability with the values for historical years and the projec-tions in this report, all trust fund operations and asset reserves reflect the 12 months of benefits scheduled forpayment each year.c Between 0 and 0.005 percent of taxable payroll.d The annual balance is projected to be negative for a temporary period and return to positive levels beforethe end of the projection period.
Table IV.B1.—Annual Income Rates, Cost Rates, and Balances,Calendar Years 1990-2095 (Cont.)
[As a percentage of taxable payroll]
Calendar year
OASI DI OASDIIncome
rateaCostrateb Balanceb
Incomeratea
Costrateb Balanceb
Incomeratea
Costrateb Balanceb

57
Long-Range Estimates
tively stable thereafter, reaching 1.51 percent for 2092. The annual balance ispositive for 2018, negative for 2019, and positive throughout the remainderof the long-range period. Under the high-cost assumptions, the DI cost rategenerally rises throughout the projection period, reaching 3.06 percent for2092. The annual deficit is negative from 2019 through the remainder of theprojection period, reaching 0.31 percent for 2019, 1.07 percent for 2050, and1.20 percent for 2092.
Figure IV.B1 shows the patterns of the historical and projected OASI and DIannual cost rates. Annual DI cost rates rose substantially between 1990 and2010 in large part due to: (1) aging of the working population as the baby-boom generation moved from ages 25-44 in 1990, where disability preva-lence is low, to ages 45-64 in 2010, where disability prevalence is muchhigher; (2) a substantial increase in the percentage of women insured for DIbenefits as a result of increased and more consistent rates of employment;and (3) increased disability incidence rates for women to a level similar tothose for men by 2010. After 2010, all of these factors stabilize, and there-fore the DI cost rate stabilizes also. Annual OASI cost rates follow a similarpattern to that for DI, but displaced 20 to 25 years later, because the baby-boom generation enters retirement ages 20 to 25 years after entering primedisability ages. Figure IV.B1 shows only the income rates for alternative IIbecause the variation in income rates by alternative is very small. Incomerates generally increase slowly for each of the alternatives over the long-range period. Taxation of benefits, which is a relatively small portion ofincome, is the main source of both the increases in the income rate and thevariation among the alternatives. Increases in income from taxation of bene-fits reflect: (1) increases in the total amount of benefits scheduled to be paidand (2) the increasing share of individual benefits that will be subject to taxa-tion because benefit taxation threshold amounts are not indexed.
Table IV.B1 shows the annual balances for OASI, DI, and OASDI. The pat-tern of the annual balances is important to the analysis of the financial condi-tion of the Social Security program as a whole. As seen in figure IV.B1, themagnitude of each of the positive balances is the distance between the appro-priate cost-rate curve and the income-rate curve above it. The magnitude ofeach of the deficits is the distance between the appropriate cost-rate curveand the income-rate curve below it. Annual balances follow closely the pat-tern of annual cost rates after 1990 because the payroll tax rate does notchange for the OASDI program, with only small variations in the allocationbetween DI and OASI except for the 2016-2018 payroll tax rate reallocation.
In the future, the costs of OASI, DI, and the combined OASDI programs as apercentage of taxable payroll are unlikely to fall outside the range encom-

Actuarial Estimates
58
passed by alternatives I and III because alternatives I and III define a widerange of demographic and economic conditions.
Long-range OASDI cost and income are most often expressed as percentagesof taxable payroll. However, the Trustees also present cost and income asshares of gross domestic product (GDP), the value of goods and services pro-duced during the year in the United States. Under alternative II, the Trusteesproject OASDI cost to increase from about 4.9 percent of GDP for 2018 to apeak of about 6.1 percent for 2038. After 2038, OASDI cost as a percentageof GDP declines to a low of about 5.9 percent for 2052 and thereafter gener-ally increases slowly, reaching about 6.1 percent by 2092. Appendix G pres-ents full estimates of income and cost relative to GDP.
Table IV.B2 contains historical and projected annual income rates and theircomponents by trust fund and alternative. The annual income rates consist ofthe scheduled payroll tax rates, the rates of income from taxation of sched-uled benefits, and the rates of income from General Fund reimbursements.Projected income from taxation of benefits increases over time for reasonsdiscussed on page 52. Historical General Fund reimbursements include tem-porary reductions in revenue due to reduced payroll tax rates and certainother miscellaneous items.
Figure IV.B1.—Long-Range OASI and DI Annual Income Rates and Cost Rates[As a percentage of taxable payroll]
0%
5%
10%
15%
20%
25%
1990 2000 2010 2020 2030 2040 2050 2060 2070 2080 2090
Calendar year
Alternative II Income rates
OASI cost rates
DI cost rates
Historical Estimated
OASI
DI IIIIII
II
I
III

59
Long-Range Estimates
Table IV.B2.—Components of Annual Income Rates, Calendar Years 1990-2095[As a percentage of taxable payroll]
Calendaryear
OASI DI OASDI
Payrolltax
Tax-ation
ofbene-
fitsa
GeneralFund
Reim-burse-
mentsb TotalcPayroll
tax
Tax-ation
ofbene-
fitsa
GeneralFund
Reim-burse-
mentsb TotalcPayroll
tax
Tax-ation
ofbene-
fitsa
GeneralFund
Reim-burse-
mentsb Totalc
Historical data:1990 . . 11.29 0.21 -0.03 11.47 1.21 0.01 -0.03 1.18 12.50 0.21 -0.06 12.651995 . . 10.46 .19 -.01 10.65 1.87 .01 -.01 1.87 12.33 .20 -.01 12.522000 . . 10.56 .29 d 10.85 1.78 .02 -.02 1.78 12.34 .31 -.02 12.62
2005 . . 10.68 .29 -.01 10.96 1.81 .02 d 1.84 12.49 .31 -.01 12.802006 . . 10.65 .31 d 10.96 1.81 .02 d 1.83 12.46 .34 d 12.792007 . . 10.68 .33 d 11.01 1.81 .03 d 1.84 12.50 .35 d 12.852008 . . 10.61 .29 d 10.90 1.80 .02 d 1.83 12.42 .31 d 12.732009 . . 10.85 .38 d 11.23 1.84 .04 d 1.88 12.70 .42 d 13.112010 . . 10.30 .42 .04 10.75 1.75 .04 .01 1.79 12.05 .45 .05 12.542011 . . 8.82 .41 1.61 10.84 1.50 .03 .27 1.80 10.32 .44 1.88 12.642012 . . 8.86 .47 1.72 11.05 1.51 .01 .29 1.81 10.37 .48 2.01 12.862013 . . 10.54 .35 .07 10.97 1.79 .01 .01 1.81 12.33 .36 .08 12.782014 . . 10.50 .45 .01 10.96 1.78 .03 d 1.81 12.28 .48 .01 12.772015 . . 10.52 .47 d 11.00 1.79 .02 d 1.80 12.31 .49 .01 12.802016 . . 10.23 .48 d 10.71 2.37 .02 d 2.39 12.60 .49 d 13.102017 . . 10.16 .52 d 10.67 2.40 .03 d 2.43 12.56 .54 d 13.10
Intermediate:2018 . . 9.84 .46 d 10.30 2.33 .02 d 2.35 12.17 .48 d 12.642019 . . 10.55 .48 d 11.03 1.82 .02 d 1.84 12.37 .50 d 12.872020 . . 10.57 .51 d 11.08 1.79 .02 d 1.82 12.37 .53 d 12.892021 . . 10.57 .53 d 11.10 1.80 .02 d 1.82 12.37 .55 d 12.922022 . . 10.58 .55 d 11.13 1.80 .02 d 1.82 12.37 .57 d 12.952023 . . 10.58 .57 d 11.14 1.80 .02 d 1.82 12.37 .59 d 12.972024 . . 10.58 .59 d 11.17 1.80 .03 d 1.82 12.38 .61 d 12.992025 . . 10.58 .61 d 11.19 1.80 .03 d 1.82 12.37 .64 d 13.012026 . . 10.58 .73 d 11.31 1.80 .03 d 1.83 12.37 .76 d 13.132027 . . 10.57 .76 d 11.33 1.80 .03 d 1.83 12.37 .79 d 13.15
2030 . . 10.57 .80 d 11.37 1.80 .03 d 1.83 12.37 .83 d 13.202035 . . 10.57 .85 d 11.42 1.80 .04 d 1.83 12.37 .89 d 13.252040 . . 10.57 .87 d 11.44 1.80 .04 d 1.83 12.37 .91 d 13.272045 . . 10.57 .86 d 11.43 1.80 .04 d 1.83 12.37 .90 d 13.272050 . . 10.57 .86 d 11.43 1.80 .04 d 1.84 12.37 .90 d 13.272055 . . 10.57 .87 d 11.44 1.80 .04 d 1.84 12.37 .91 d 13.282060 . . 10.57 .89 d 11.46 1.80 .04 d 1.84 12.37 .93 d 13.292065 . . 10.57 .90 d 11.48 1.80 .04 d 1.84 12.37 .95 d 13.312070 . . 10.57 .93 d 11.50 1.80 .04 d 1.84 12.37 .97 d 13.342075 . . 10.57 .94 d 11.51 1.80 .04 d 1.84 12.37 .98 d 13.352080 . . 10.57 .95 d 11.52 1.80 .04 d 1.84 12.37 .99 d 13.362085 . . 10.57 .94 d 11.51 1.80 .04 d 1.84 12.37 .98 d 13.352090 . . 10.57 .94 d 11.52 1.80 .04 d 1.84 12.37 .99 d 13.352095 . . 10.57 .96 d 11.53 1.80 .04 d 1.84 12.37 1.00 d 13.37
Low-cost:2018 . . 9.80 .45 d 10.24 2.31 .02 d 2.34 12.11 .47 d 12.582019 . . 10.54 .46 d 11.01 1.82 .02 d 1.84 12.36 .49 d 12.852020 . . 10.56 .48 d 11.04 1.79 .02 d 1.81 12.36 .50 d 12.862021 . . 10.56 .50 d 11.06 1.79 .02 d 1.81 12.36 .52 d 12.882022 . . 10.57 .51 d 11.08 1.79 .02 d 1.82 12.36 .53 d 12.902023 . . 10.57 .52 d 11.09 1.79 .02 d 1.82 12.36 .54 d 12.912024 . . 10.58 .54 d 11.11 1.80 .02 d 1.82 12.37 .56 d 12.932025 . . 10.57 .55 d 11.12 1.79 .02 d 1.82 12.36 .57 d 12.942026 . . 10.57 .65 d 11.22 1.80 .03 d 1.82 12.37 .68 d 13.042027 . . 10.56 .67 d 11.23 1.79 .03 d 1.82 12.36 .70 d 13.06
Actuarial Estimates
60
Note: Totals do not necessarily equal the sums of rounded components.
Low-cost (Cont.):2030 . . 10.57 0.70 d 11.27 1.79 0.03 d 1.82 12.36 0.73 d 13.092035 . . 10.57 .73 d 11.30 1.79 .03 d 1.82 12.36 .76 d 13.122040 . . 10.57 .73 d 11.30 1.79 .03 d 1.82 12.36 .76 d 13.122045 . . 10.57 .71 d 11.28 1.79 .03 d 1.82 12.36 .74 d 13.102050 . . 10.57 .70 d 11.27 1.79 .03 d 1.82 12.36 .73 d 13.092055 . . 10.57 .70 d 11.26 1.79 .03 d 1.82 12.36 .73 d 13.092060 . . 10.57 .71 d 11.27 1.79 .03 d 1.82 12.36 .73 d 13.092065 . . 10.57 .71 d 11.28 1.79 .03 d 1.82 12.36 .74 d 13.102070 . . 10.57 .72 d 11.28 1.79 .03 d 1.82 12.36 .75 d 13.112075 . . 10.57 .72 d 11.28 1.79 .03 d 1.82 12.36 .75 d 13.102080 . . 10.57 .70 d 11.27 1.79 .03 d 1.82 12.36 .73 d 13.092085 . . 10.57 .69 d 11.25 1.79 .03 d 1.82 12.36 .72 d 13.082090 . . 10.57 .69 d 11.25 1.79 .03 d 1.82 12.36 .72 d 13.082095 . . 10.57 .70 d 11.27 1.79 .03 d 1.82 12.36 .73 d 13.09
High-cost:2018 . . 9.87 .46 d 10.33 2.33 .02 d 2.35 12.21 .48 d 12.692019 . . 10.56 .50 d 11.06 1.83 .02 d 1.85 12.39 .52 d 12.912020 . . 10.58 .54 d 11.11 1.80 .03 d 1.82 12.37 .56 d 12.932021 . . 10.58 .57 d 11.15 1.80 .03 d 1.82 12.38 .59 d 12.972022 . . 10.59 .59 d 11.18 1.80 .03 d 1.82 12.38 .62 d 13.012023 . . 10.58 .62 d 11.21 1.80 .03 d 1.83 12.38 .65 d 13.032024 . . 10.59 .65 d 11.24 1.80 .03 d 1.83 12.39 .68 d 13.072025 . . 10.58 .68 d 11.26 1.80 .03 d 1.83 12.38 .71 d 13.092026 . . 10.58 .82 d 11.40 1.80 .04 d 1.83 12.38 .85 d 13.242027 . . 10.58 .85 d 11.43 1.80 .04 d 1.84 12.37 .89 d 13.27
2030 . . 10.58 .92 d 11.49 1.80 .04 d 1.84 12.38 .96 d 13.332035 . . 10.58 .99 d 11.57 1.80 .04 d 1.84 12.38 1.03 d 13.412040 . . 10.58 1.03 d 11.61 1.80 .05 d 1.84 12.38 1.08 d 13.462045 . . 10.58 1.05 d 11.63 1.80 .05 d 1.85 12.38 1.10 d 13.482050 . . 10.58 1.07 d 11.65 1.80 .05 d 1.85 12.38 1.12 d 13.502055 . . 10.58 1.09 d 11.67 1.80 .06 d 1.85 12.38 1.15 d 13.532060 . . 10.58 1.13 d 11.71 1.80 .06 d 1.85 12.38 1.19 d 13.572065 . . 10.58 1.17 d 11.75 1.80 .06 d 1.86 12.38 1.23 d 13.612070 . . 10.58 1.22 d 11.80 1.80 .06 d 1.86 12.38 1.28 d 13.662075 . . 10.58 1.27 d 11.85 1.80 .06 d 1.86 12.38 1.33 d 13.702080 . . 10.58 1.30 d 11.88 1.80 .06 d 1.86 12.38 1.36 d 13.742085 . . 10.58 1.32 d 11.90 1.80 .06 d 1.86 12.38 1.38 d 13.762090 . . 10.58 1.33 d 11.91 1.80 .06 d 1.86 12.38 1.39 d 13.772095 . . 10.58 1.35 d 11.93 1.80 .06 d 1.86 12.38 1.41 d 13.78
a Revenue from taxation of benefits is the amount that would be assessed on benefit amounts scheduled in thelaw.b Includes payroll tax revenue forgone under the provisions of Public Laws 111-147, 111-312, 112-78, and112-96, and other miscellaneous reimbursements.c Values exclude interest income.d Between -0.005 and 0.005 percent of taxable payroll.
Table IV.B2.—Components of Annual Income Rates, Calendar Years 1990-2095 (Cont.)[As a percentage of taxable payroll]
Calendaryear
OASI DI OASDI
Payrolltax
Tax-ation
ofbene-
fitsa
GeneralFund
Reim-burse-
mentsb TotalcPayroll
tax
Tax-ation
ofbene-
fitsa
GeneralFund
Reim-burse-
mentsb TotalcPayroll
tax
Tax-ation
ofbene-
fitsa
GeneralFund
Reim-burse-
mentsb Totalc
61
Long-Range Estimates
2. Comparison of Workers to Beneficiaries
Under the intermediate assumptions, the Trustees project the OASDI costrate will rise rapidly between 2018 and 2035, primarily because the numberof beneficiaries rises much more rapidly than the number of covered workersas the baby-boom generation retires. The ratio of OASDI beneficiaries toworkers is dominated by the OASI program because all workers eventuallydie or retire, but only a relatively small minority become disabled. The trendsdescribed below are primarily due to demographic changes and thus affectthe DI program roughly 20 years earlier than the OASI and OASDI pro-grams. The baby-boom generation had lower fertility rates than their parents,and the Trustees expect that lower fertility rates will persist for all futuregenerations; therefore, the ratio of OASDI beneficiaries to workers will riserapidly and reach a permanently higher level after the baby-boom generationretires. Due to increasing longevity, the ratio of beneficiaries to workers willgenerally rise slowly thereafter. Table IV.B3 provides a comparison of thenumbers of covered workers and beneficiaries.
Table IV.B3.—Covered Workers and Beneficiaries, Calendar Years 1945-2095
Calendar year
Coveredworkersa
(in thousands)
Beneficiariesb (in thousands) Coveredworkers per
OASDIbeneficiary
OASDIbeneficiaries
per 100coveredworkersOASI DI OASDIc
Historical data:1945 . . . . . . . . . 46,390 1,106 - 1,106 41.9 21950 . . . . . . . . . 48,280 2,930 - 2,930 16.5 61955 . . . . . . . . . 65,066 7,564 - 7,564 8.6 121960 . . . . . . . . . 72,371 13,740 522 14,262 5.1 201965 . . . . . . . . . 80,539 18,509 1,648 20,157 4.0 251970 . . . . . . . . . 92,963 22,618 2,568 25,186 3.7 271975 . . . . . . . . . 100,193 26,998 4,125 31,123 3.2 311980 . . . . . . . . . 112,651 30,384 4,734 35,117 3.2 311985 . . . . . . . . . 120,442 32,763 3,874 36,636 3.3 301990 . . . . . . . . . 133,013 35,255 4,204 39,459 3.4 301995 . . . . . . . . . 140,819 37,364 5,731 43,096 3.3 312000 . . . . . . . . . 154,756 38,556 6,606 45,162 3.4 29
2005 . . . . . . . . . 159,169 39,961 8,172 48,133 3.3 302006 . . . . . . . . . 161,736 40,435 8,428 48,863 3.3 302007 . . . . . . . . . 163,500 40,863 8,739 49,603 3.3 302008 . . . . . . . . . 162,868 41,355 9,065 50,420 3.2 312009 . . . . . . . . . 157,852 42,385 9,475 51,860 3.0 332010 . . . . . . . . . 157,218 43,440 9,958 53,398 2.9 342011 . . . . . . . . . 158,763 44,388 10,428 54,816 2.9 352012 . . . . . . . . . 160,920 45,377 10,799 56,176 2.9 352013 . . . . . . . . . 163,236 46,517 10,954 57,471 2.8 352014 . . . . . . . . . 165,541 47,603 10,971 58,574 2.8 352015 . . . . . . . . . 168,399 48,663 10,881 59,543 2.8 352016 . . . . . . . . . 171,287 49,811 10,728 60,539 2.8 352017 . . . . . . . . . 173,568 50,962 10,517 61,480 2.8 35
Intermediate:2018 . . . . . . . . . 175,271 52,271 10,379 62,651 2.8 362020 . . . . . . . . . 177,759 55,305 10,358 65,662 2.7 372025 . . . . . . . . . 183,205 63,004 10,779 73,783 2.5 402030 . . . . . . . . . 186,845 69,865 11,208 81,073 2.3 432035 . . . . . . . . . 189,588 74,745 11,763 86,507 2.2 46

Actuarial Estimates
62
Notes: 1. The number of beneficiaries does not include uninsured individuals who received benefits underSection 228 of the Social Security Act. The General Fund of the Treasury reimbursed the trust funds for thecosts of most of these individuals.2. Historical covered worker and beneficiary data are subject to revision.3. Totals do not necessarily equal the sums of rounded components.
2040 . . . . . . . . . 192,984 77,164 12,420 89,584 2.2 462045 . . . . . . . . . 197,749 78,151 13,234 91,385 2.2 462050 . . . . . . . . . 202,747 79,599 13,793 93,393 2.2 462055 . . . . . . . . . 207,617 81,787 14,299 96,086 2.2 462060 . . . . . . . . . 212,005 84,838 14,537 99,375 2.1 47
Intermediate (Cont.):2065 . . . . . . . . . 216,214 87,904 14,905 102,809 2.1 482070 . . . . . . . . . 220,775 91,292 15,299 106,591 2.1 482075 . . . . . . . . . 225,927 94,659 15,543 110,202 2.1 492080 . . . . . . . . . 231,541 96,822 15,958 112,780 2.1 492085 . . . . . . . . . 237,387 98,392 16,637 115,028 2.1 482090 . . . . . . . . . 243,033 100,911 17,306 118,218 2.1 492095 . . . . . . . . . 248,351 104,546 17,708 122,254 2.0 49
Low-cost:2018 . . . . . . . . . 175,775 52,257 10,334 62,590 2.8 362020 . . . . . . . . . 179,916 55,231 10,095 65,326 2.8 362025 . . . . . . . . . 186,769 62,714 9,936 72,650 2.6 392030 . . . . . . . . . 191,039 69,187 9,849 79,036 2.4 412035 . . . . . . . . . 194,666 73,577 9,970 83,547 2.3 432040 . . . . . . . . . 199,745 75,462 10,236 85,697 2.3 432045 . . . . . . . . . 207,156 75,937 10,709 86,646 2.4 422050 . . . . . . . . . 215,162 76,949 11,054 88,004 2.4 412055 . . . . . . . . . 223,043 78,846 11,421 90,268 2.5 402060 . . . . . . . . . 230,486 81,672 11,644 93,315 2.5 402065 . . . . . . . . . 238,073 84,522 12,023 96,545 2.5 412070 . . . . . . . . . 246,626 87,644 12,480 100,124 2.5 412075 . . . . . . . . . 256,510 90,638 12,881 103,519 2.5 402080 . . . . . . . . . 267,374 92,409 13,477 105,886 2.5 402085 . . . . . . . . . 278,549 93,944 14,360 108,304 2.6 392090 . . . . . . . . . 289,356 97,316 15,215 112,531 2.6 392095 . . . . . . . . . 299,775 102,580 15,780 118,360 2.5 39
High-cost:2018 . . . . . . . . . 175,364 52,284 10,424 62,708 2.8 362020 . . . . . . . . . 174,673 55,367 10,615 65,982 2.6 382025 . . . . . . . . . 179,634 63,299 11,600 74,898 2.4 422030 . . . . . . . . . 182,805 70,617 12,580 83,197 2.2 462035 . . . . . . . . . 184,821 76,084 13,549 89,633 2.1 482040 . . . . . . . . . 186,633 79,150 14,575 93,725 2.0 502045 . . . . . . . . . 188,731 80,781 15,734 96,515 2.0 512050 . . . . . . . . . 190,796 82,783 16,505 99,288 1.9 522055 . . . . . . . . . 192,731 85,351 17,124 102,475 1.9 532060 . . . . . . . . . 194,199 88,680 17,335 106,014 1.8 552065 . . . . . . . . . 195,261 91,961 17,613 109,574 1.8 562070 . . . . . . . . . 196,160 95,626 17,834 113,460 1.7 582075 . . . . . . . . . 197,070 99,368 17,770 117,138 1.7 592080 . . . . . . . . . 198,056 101,911 17,799 119,710 1.7 602085 . . . . . . . . . 199,240 103,463 18,008 121,471 1.6 612090 . . . . . . . . . 200,435 104,868 18,286 123,154 1.6 612095 . . . . . . . . . 201,510 106,487 18,438 124,925 1.6 62
a Workers who are paid at some time during the year for employment on which OASDI taxes are due.b Beneficiaries with monthly benefits in current-payment status as of June 30.c This column is the sum of OASI and DI beneficiaries. A small number of beneficiaries receive benefitsfrom both funds.
Table IV.B3.—Covered Workers and Beneficiaries, Calendar Years 1945-2095 (Cont.)
Calendar year
Coveredworkersa
(in thousands)
Beneficiariesb (in thousands) Coveredworkers per
OASDIbeneficiary
OASDIbeneficiaries
per 100coveredworkersOASI DI OASDIc
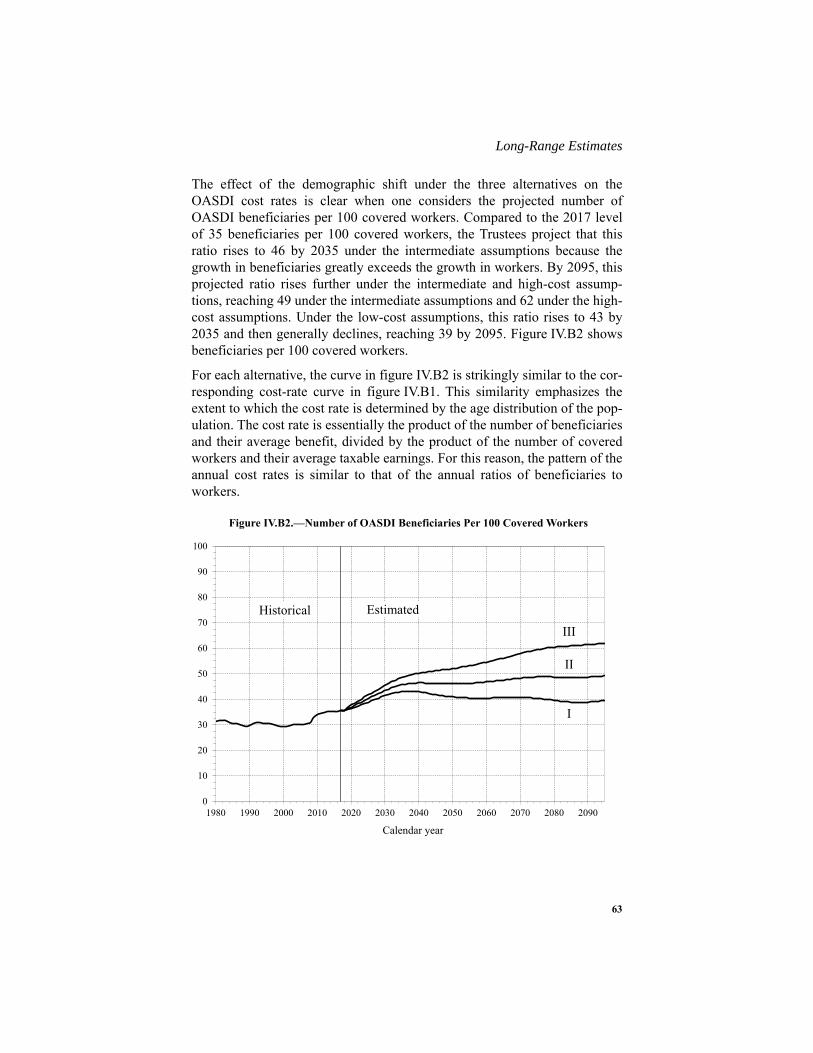
63
Long-Range Estimates
The effect of the demographic shift under the three alternatives on theOASDI cost rates is clear when one considers the projected number ofOASDI beneficiaries per 100 covered workers. Compared to the 2017 levelof 35 beneficiaries per 100 covered workers, the Trustees project that thisratio rises to 46 by 2035 under the intermediate assumptions because thegrowth in beneficiaries greatly exceeds the growth in workers. By 2095, thisprojected ratio rises further under the intermediate and high-cost assump-tions, reaching 49 under the intermediate assumptions and 62 under the high-cost assumptions. Under the low-cost assumptions, this ratio rises to 43 by2035 and then generally declines, reaching 39 by 2095. Figure IV.B2 showsbeneficiaries per 100 covered workers.
For each alternative, the curve in figure IV.B2 is strikingly similar to the cor-responding cost-rate curve in figure IV.B1. This similarity emphasizes theextent to which the cost rate is determined by the age distribution of the pop-ulation. The cost rate is essentially the product of the number of beneficiariesand their average benefit, divided by the product of the number of coveredworkers and their average taxable earnings. For this reason, the pattern of theannual cost rates is similar to that of the annual ratios of beneficiaries toworkers.
Figure IV.B2.—Number of OASDI Beneficiaries Per 100 Covered Workers
0
10
20
30
40
50
60
70
80
90
100
1980 1990 2000 2010 2020 2030 2040 2050 2060 2070 2080 2090
Calendar year
Historical Estimated
III
II
I
Actuarial Estimates
64
Table IV.B3 also shows the number of covered workers per OASDI benefi-ciary, which was about 2.8 for 2017. Under the intermediate assumptions,this ratio declines generally throughout the long-range period, reaching 2.2for 2035 and 2.0 by 2095. Under the low-cost assumptions, this ratiodeclines to 2.3 for 2035, generally rises from 2035 through 2055, andremains relatively stable at 2.5 through 2095. Under the high-cost assump-tions, this ratio decreases steadily to 1.6 by 2095.
3. Trust Fund Ratios and Test of Long-Range Close Actuarial Balance
Trust fund ratios are critical indicators of the adequacy of the financialresources of the Social Security program. The trust fund ratio for a year is theamount of asset reserves in a fund at the beginning of a year expressed as apercentage of the cost for the year. Under present law, the OASI and DI TrustFunds do not have the authority to borrow other than in the form of advancetax transfers, which are limited to expected taxes for the current calendarmonth. If reserves held in either trust fund become depleted during a year,and continuing tax revenues fall short of the cost of scheduled benefits, thenfull scheduled benefits would not be payable on a timely basis. For this rea-son, the trust fund ratio is a very critical financial measure.
The trust fund ratio serves an additional important purpose in assessing theactuarial status of the program. If the projected trust fund ratio is positivethroughout the period and is either level or increasing at the end of theperiod, then projected adequacy for the long-range period is likely to con-tinue for subsequent reports. Under these conditions, the program hasachieved sustainable solvency.
Table IV.B4 shows the Trustees’ projections of trust fund ratios by alterna-tive, without regard to advance tax transfers that would be effected, for theseparate and combined OASI and DI Trust Funds. The table also shows theyears of trust fund reserve depletion and the percentage of scheduled benefitsthat would be payable thereafter, by alternative.
Under the intermediate assumptions, the OASI trust fund ratio is projected todecline from 330 percent at the beginning of 2018 until the trust fundreserves become depleted late in 2034 (as compared to early 2035 for lastyear’s report), at which time 77 percent of scheduled benefits would be pay-able. The DI trust fund ratio is 48 percent at the beginning of 2018. The0.57-percentage-point reallocation of payroll tax rate (for2016 through 2018) from OASI to DI increases the trust fund ratio to62 percent at the beginning of 2019. After 2019, the trust fund ratio declinesuntil the trust fund reserves become depleted in 2032 (4 years later than pro-jected in last year’s report), at which time 96 percent of scheduled benefitswould be payable.
65
Long-Range Estimates
Under the intermediate assumptions, the trust fund ratio for the combinedOASI and DI Trust Funds declines from 288 percent at the beginning of2018 until the combined fund reserves become depleted in 2034 (the sameyear as projected in last year’s report), at which time 79 percent of scheduledbenefits would be payable.
Under the low-cost assumptions, the trust fund ratio for the DI programincreases from 49 percent at the beginning of 2018 to 66 percent at thebeginning of 2019, again reflecting the temporary payroll tax rate realloca-tion. The DI trust fund ratio is then stable through 2021 and thereafterincreases through the end of the long-range projection period, reaching theextremely high level of 2,194 percent for 2093. For the OASI program, thetrust fund ratio declines steadily, from 331 percent for 2018 until the reservesbecome depleted in 2062, at which time 97 percent of scheduled benefitswould be payable. For the combined OASDI program, the trust fund ratiodeclines from 289 percent for 2018 to a low of 112 percent in 2048, thenrises thereafter, reaching 197 percent by 2093. Because the trust fund ratio ispositive throughout the projection period and increasing at the end of theperiod, under the low-cost assumptions, the DI program and the combinedOASDI program achieve sustainable solvency.
Under the high-cost assumptions, the OASI trust fund ratio declines continu-ally until reserves become depleted in 2030, at which time 69 percent ofscheduled benefits would still be payable. The DI trust fund ratio increasesfrom 47 percent for 2018 to 59 percent for 2019 because of the payroll taxrate reallocation, but reserves decline quickly after that and become depletedin 2022. At that time, 83 percent of scheduled benefits would still be pay-able. The combined OASI and DI trust fund ratio declines from 288 percentfor 2018 until reserves become depleted in 2030, at which time 70 percent ofscheduled benefits would still be payable.
The Trustees project trust fund reserve depletion within the 75-year projec-tion period with the exceptions of the combined OASI and DI Trust Fundsand the DI Trust Fund under the low-cost assumptions. It is therefore verylikely that lawmakers will need to increase income, reduce program costs, orboth, in order to maintain solvency for the trust funds. The stochastic projec-tions discussed in appendix E suggest that trust fund reserve depletion ishighly probable by mid-century.
Even under the high-cost assumptions, however, the combined OASI and DITrust Fund reserves on hand plus their estimated future income are sufficientto fully cover their combined cost until 2030. Under the intermediateassumptions, the combined starting fund reserves plus estimated futureincome are sufficient to fully cover cost until 2034. In the 2017 report, theTrustees projected that the combined trust fund reserves would become
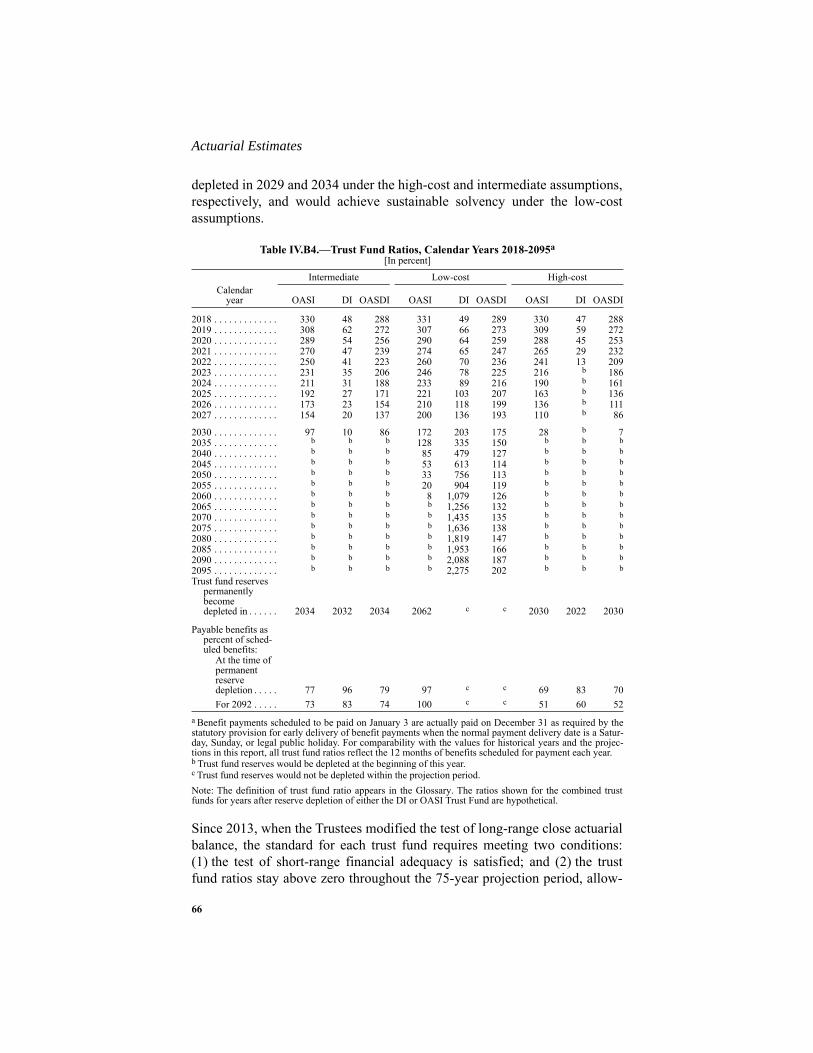
Actuarial Estimates
66
depleted in 2029 and 2034 under the high-cost and intermediate assumptions,respectively, and would achieve sustainable solvency under the low-costassumptions.
Note: The definition of trust fund ratio appears in the Glossary. The ratios shown for the combined trustfunds for years after reserve depletion of either the DI or OASI Trust Fund are hypothetical.
Since 2013, when the Trustees modified the test of long-range close actuarialbalance, the standard for each trust fund requires meeting two conditions:(1) the test of short-range financial adequacy is satisfied; and (2) the trustfund ratios stay above zero throughout the 75-year projection period, allow-
Table IV.B4.—Trust Fund Ratios, Calendar Years 2018-2095a[In percent]
a Benefit payments scheduled to be paid on January 3 are actually paid on December 31 as required by thestatutory provision for early delivery of benefit payments when the normal payment delivery date is a Satur-day, Sunday, or legal public holiday. For comparability with the values for historical years and the projec-tions in this report, all trust fund ratios reflect the 12 months of benefits scheduled for payment each year.
Calendaryear
Intermediate Low-cost High-cost
OASI DI OASDI OASI DI OASDI OASI DI OASDI
2018 . . . . . . . . . . . . . 330 48 288 331 49 289 330 47 2882019 . . . . . . . . . . . . . 308 62 272 307 66 273 309 59 2722020 . . . . . . . . . . . . . 289 54 256 290 64 259 288 45 2532021 . . . . . . . . . . . . . 270 47 239 274 65 247 265 29 2322022 . . . . . . . . . . . . . 250 41 223 260 70 236 241 13 2092023 . . . . . . . . . . . . . 231 35 206 246 78 225 216 b
b Trust fund reserves would be depleted at the beginning of this year.
1862024 . . . . . . . . . . . . . 211 31 188 233 89 216 190 b 1612025 . . . . . . . . . . . . . 192 27 171 221 103 207 163 b 1362026 . . . . . . . . . . . . . 173 23 154 210 118 199 136 b 1112027 . . . . . . . . . . . . . 154 20 137 200 136 193 110 b 86
2030 . . . . . . . . . . . . . 97 10 86 172 203 175 28 b 72035 . . . . . . . . . . . . . b b b 128 335 150 b b b
2040 . . . . . . . . . . . . . b b b 85 479 127 b b b
2045 . . . . . . . . . . . . . b b b 53 613 114 b b b
2050 . . . . . . . . . . . . . b b b 33 756 113 b b b
2055 . . . . . . . . . . . . . b b b 20 904 119 b b b
2060 . . . . . . . . . . . . . b b b 8 1,079 126 b b b
2065 . . . . . . . . . . . . . b b b b 1,256 132 b b b
2070 . . . . . . . . . . . . . b b b b 1,435 135 b b b
2075 . . . . . . . . . . . . . b b b b 1,636 138 b b b
2080 . . . . . . . . . . . . . b b b b 1,819 147 b b b
2085 . . . . . . . . . . . . . b b b b 1,953 166 b b b
2090 . . . . . . . . . . . . . b b b b 2,088 187 b b b
2095 . . . . . . . . . . . . . b b b b 2,275 202 b b b
Trust fund reserves permanently become depleted in . . . . . . 2034 2032 2034 2062 c
c Trust fund reserves would not be depleted within the projection period.
c 2030 2022 2030
Payable benefits as percent of sched-uled benefits:
At the time of permanent reservedepletion . . . . . 77 96 79 97 c c 69 83 70For 2092 . . . . . 73 83 74 100 c c 51 60 52
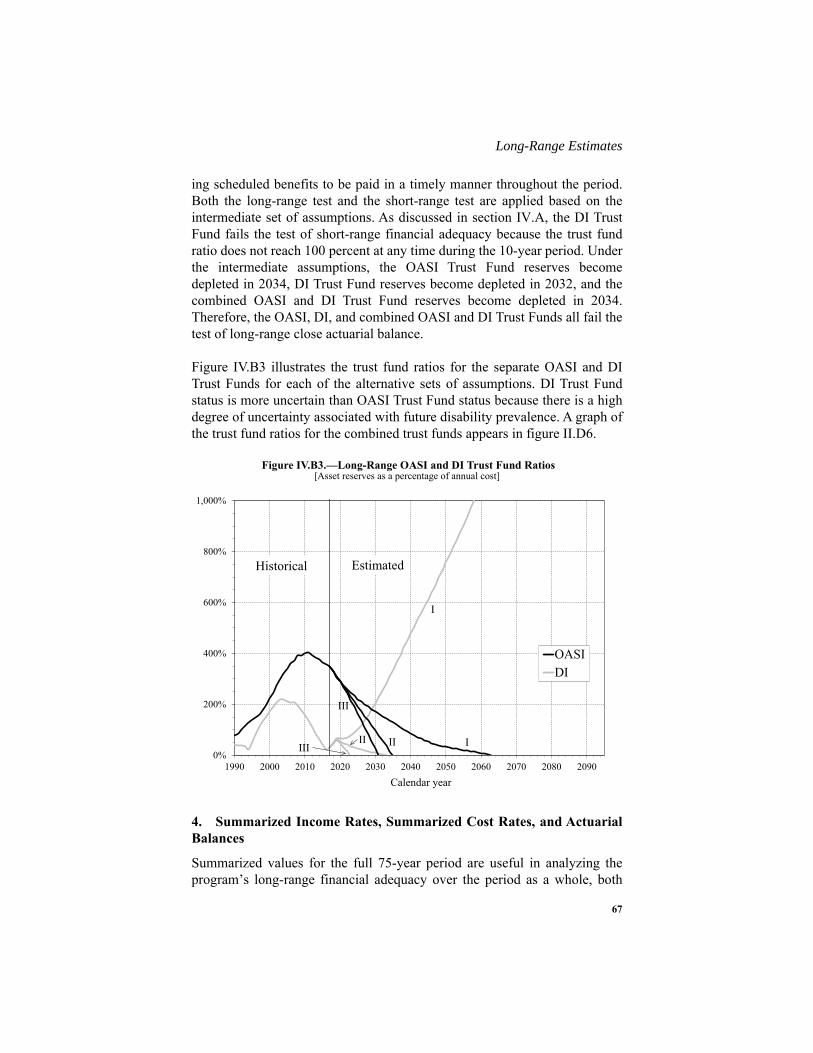
67
Long-Range Estimates
ing scheduled benefits to be paid in a timely manner throughout the period.Both the long-range test and the short-range test are applied based on theintermediate set of assumptions. As discussed in section IV.A, the DI TrustFund fails the test of short-range financial adequacy because the trust fundratio does not reach 100 percent at any time during the 10-year period. Underthe intermediate assumptions, the OASI Trust Fund reserves becomedepleted in 2034, DI Trust Fund reserves become depleted in 2032, and thecombined OASI and DI Trust Fund reserves become depleted in 2034.Therefore, the OASI, DI, and combined OASI and DI Trust Funds all fail thetest of long-range close actuarial balance.
Figure IV.B3 illustrates the trust fund ratios for the separate OASI and DITrust Funds for each of the alternative sets of assumptions. DI Trust Fundstatus is more uncertain than OASI Trust Fund status because there is a highdegree of uncertainty associated with future disability prevalence. A graph ofthe trust fund ratios for the combined trust funds appears in figure II.D6.
4. Summarized Income Rates, Summarized Cost Rates, and ActuarialBalances
Summarized values for the full 75-year period are useful in analyzing theprogram’s long-range financial adequacy over the period as a whole, both
Figure IV.B3.—Long-Range OASI and DI Trust Fund Ratios[Asset reserves as a percentage of annual cost]
0%
200%
400%
600%
800%
1,000%
1990 2000 2010 2020 2030 2040 2050 2060 2070 2080 2090
Calendar year
OASI
DI
Historical Estimated
III
II I
I
IIIII
Actuarial Estimates
68
under present law and under proposed modifications to the law. All annualamounts included in a summarized value are present-value discounted to thevaluation date. It is important to note that the actuarial balance indicates thesolvency status of the fund only for the very end of the period.
Table IV.B5 presents summarized income rates, summarized cost rates, andactuarial balances for 25-year, 50-year, and 75-year valuation periods. Sum-marized income rates are the sum of the present value of non-interest incomefor a period (which includes scheduled payroll taxes, the projected incomefrom the taxation of scheduled benefits, and reimbursements from the Gen-eral Fund of the Treasury) and the starting trust fund asset reserves,expressed as a percentage of the present value of taxable payroll over theperiod. Under current law, the total OASDI payroll tax rate will remain at12.4 percent in the future. In contrast, the Trustees expect income from taxa-tion of benefits, expressed as a percentage of taxable payroll, to increase inmost years of the long-range period for the reasons discussed earlier on page52. Summarized cost rates are the sum of the present value of cost for aperiod (which includes scheduled benefits, administrative expenses, netinterchange with the Railroad Retirement program, and payments for voca-tional rehabilitation services for disabled beneficiaries) and the present valueof the cost of reaching a target trust fund of 100 percent of annual cost at theend of the period, expressed as a percentage of the present value of taxablepayroll over the period.
The actuarial balance for a valuation period is equal to the differencebetween the summarized income rate and the summarized cost rate for theperiod. An actuarial balance of zero for any period indicates that cost for theperiod could be met for the period as a whole (but not necessarily at allpoints within the period), with a remaining trust fund reserve at the end ofthe period equal to 100 percent of the following year’s cost. A negative actu-arial balance for a period indicates that the present value of income to theprogram plus the existing trust fund is less than the present value of the costof the program plus the cost of reaching a target trust fund reserve of 1 year’scost by the end of the period. Generally, a trust fund is deemed to be ade-quately financed for a period if the actuarial balance is zero or positive,meaning that the reserves at the end of the period are at least equal to annualcost. Note that solvency is possible with a small negative actuarial balancewhere reserves are still positive.1
1 A program is solvent over any period for which the trust fund maintains a positive level of asset reserves.In contrast, the actuarial balance for a period includes the cost of having a target fund equal to 100 percent ofthe following year’s cost at the end of the period. Therefore, if a program ends the period with reserves thatare positive but not sufficient to cover the following year’s costs, it will be solvent at the end of the periodand yet still have a small negative actuarial balance for that period.

69
Long-Range Estimates
Table IV.B5 contains summarized rates for the intermediate, low-cost, andhigh-cost assumptions. The low-cost and high-cost assumptions define awide range of possibilities. Financial outcomes as good as the low-cost sce-nario or as bad as the high-cost scenario are unlikely to occur.
For the 25-year valuation period, the OASDI program has an actuarial bal-ance of 0.09 percent of taxable payroll under the low-cost assumptions,-1.77 percent under the intermediate assumptions, and -3.90 percent underthe high-cost assumptions. These balances indicate that the program is ade-quately financed for the 25-year valuation period under only the low-costassumptions.
For the 50-year valuation period, the OASDI program has actuarial balancesof 0.08 percent under the low-cost assumptions, -2.45 percent under theintermediate assumptions, and -5.55 percent under the high-cost assump-tions. These actuarial balances mean that the OASDI program is adequatelyfinanced for the 50-year valuation period under only the low-cost assump-tions.
For the entire 75-year valuation period, the combined OASDI program hasactuarial balances of 0.13 percent of taxable payroll under the low-costassumptions, -2.84 percent under the intermediate assumptions, and-6.62 percent under the high-cost assumptions. These balances indicate thatthe combined OASDI program is adequately financed for the 75-year valua-tion period under only the low-cost assumptions.
Assuming the intermediate assumptions accurately capture future demo-graphic and economic trends, solvency for the program over the next75 years could be restored using a variety of approaches. For example, reve-nues could be increased in a manner equivalent to an immediate and perma-nent increase in the combined Social Security payroll tax rate from12.40 percent to 15.18 percent (a relative increase of 22.4 percent), costcould be reduced in a manner equivalent to an immediate and permanentreduction in scheduled benefits of about 17 percent, or some combination ofapproaches could be used.
However, eliminating the actuarial deficit for the next 75-year valuationperiod requires raising payroll taxes or lowering benefits by more than isrequired just to achieve solvency, because the actuarial deficit includes thecost of attaining a target trust fund equal to 100 percent of annual programcost by the end of the period. The actuarial deficit could be eliminated for the75-year period by increasing revenues in a manner equivalent to an immedi-ate and permanent increase in the combined payroll tax from 12.40 percent

Actuarial Estimates
70
to 15.35 percent (a relative increase of 23.8 percent),1 reducing cost in amanner equivalent to an immediate reduction in scheduled benefits of about18 percent, or some combination of approaches could be used.
Under the intermediate assumptions, the OASDI program has large annualdeficits toward the end of the long-range period that are increasing and reach4.32 percent of payroll for 2092 (see table IV.B1). These large deficits indi-cate that annual cost continues to exceed non-interest income after 2092, socontinued adequate financing would require larger changes than thoseneeded to maintain solvency for the 75-year period. Over the period extend-ing through the infinite horizon, the actuarial deficit is 4.0 percent of payrollunder the intermediate assumptions.
1 The indicated increase in the payroll tax rate of 2.95 percent is somewhat larger than the 2.84 percent75-year actuarial deficit because the indicated increase reflects a behavioral response to tax rate changes. Inparticular, the calculation assumes that an increase in payroll taxes results in a small shift of wages and sala-ries to forms of employee compensation that are not subject to the payroll tax.
Table IV.B5.—Components of Summarized Income Rates and Cost Rates, Calendar Years 2018-2092
[As a percentage of taxable payroll]
Valuation period
Summarized income rate Summarized cost rate
Actuarialbalance
Non-interestincome
Beginningasset
reservesa Total Costa
Endingtargetfunda Total
OASI:Intermediate:
2018-42. . . . . 11.30 1.41 12.71 13.78 0.56 14.34 -1.632018-67. . . . . 11.37 .77 12.14 14.16 .24 14.40 -2.262018-92. . . . . 11.41 .57 11.99 14.48 .14 14.62 -2.63
Low-cost:2018-42. . . . . 11.21 1.28 12.49 12.17 .48 12.65 -.162018-67. . . . . 11.25 .68 11.92 11.95 .21 12.16 -.242018-92. . . . . 11.26 .48 11.74 11.82 .12 11.94 -.20
High-cost:2018-42. . . . . 11.40 1.60 13.00 15.66 .65 16.31 -3.312018-67. . . . . 11.52 .91 12.43 16.91 .29 17.20 -4.762018-92. . . . . 11.60 .70 12.31 17.89 .17 18.06 -5.75
DI:Intermediate:
2018-42. . . . . 1.85 .04 1.88 1.94 .08 2.02 -.142018-67. . . . . 1.84 .02 1.86 2.02 .03 2.05 -.192018-92. . . . . 1.84 .01 1.86 2.05 .02 2.07 -.21
Low-cost:2018-42. . . . . 1.84 .03 1.87 1.56 .06 1.61 .262018-67. . . . . 1.83 .02 1.85 1.51 .03 1.53 .322018-92. . . . . 1.83 .01 1.84 1.49 .02 1.51 .33
High-cost:2018-42. . . . . 1.86 .04 1.90 2.39 .10 2.49 -.592018-67. . . . . 1.86 .02 1.88 2.63 .04 2.67 -.792018-92. . . . . 1.86 .02 1.87 2.72 .02 2.74 -.87
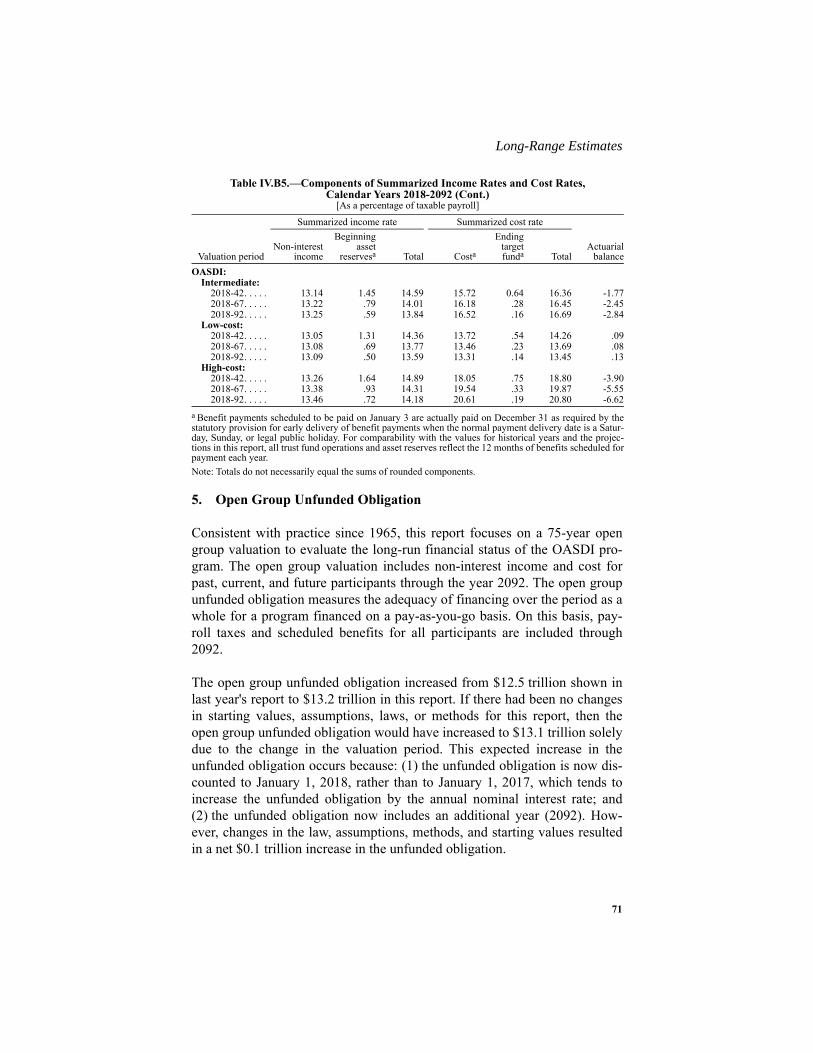
71
Long-Range Estimates
Note: Totals do not necessarily equal the sums of rounded components.
5. Open Group Unfunded Obligation
Consistent with practice since 1965, this report focuses on a 75-year opengroup valuation to evaluate the long-run financial status of the OASDI pro-gram. The open group valuation includes non-interest income and cost forpast, current, and future participants through the year 2092. The open groupunfunded obligation measures the adequacy of financing over the period as awhole for a program financed on a pay-as-you-go basis. On this basis, pay-roll taxes and scheduled benefits for all participants are included through2092.
The open group unfunded obligation increased from $12.5 trillion shown inlast year's report to $13.2 trillion in this report. If there had been no changesin starting values, assumptions, laws, or methods for this report, then theopen group unfunded obligation would have increased to $13.1 trillion solelydue to the change in the valuation period. This expected increase in theunfunded obligation occurs because: (1) the unfunded obligation is now dis-counted to January 1, 2018, rather than to January 1, 2017, which tends toincrease the unfunded obligation by the annual nominal interest rate; and(2) the unfunded obligation now includes an additional year (2092). How-ever, changes in the law, assumptions, methods, and starting values resultedin a net $0.1 trillion increase in the unfunded obligation.
OASDI:Intermediate:
2018-42. . . . . 13.14 1.45 14.59 15.72 0.64 16.36 -1.772018-67. . . . . 13.22 .79 14.01 16.18 .28 16.45 -2.452018-92. . . . . 13.25 .59 13.84 16.52 .16 16.69 -2.84
Low-cost:2018-42. . . . . 13.05 1.31 14.36 13.72 .54 14.26 .092018-67. . . . . 13.08 .69 13.77 13.46 .23 13.69 .082018-92. . . . . 13.09 .50 13.59 13.31 .14 13.45 .13
High-cost:2018-42. . . . . 13.26 1.64 14.89 18.05 .75 18.80 -3.902018-67. . . . . 13.38 .93 14.31 19.54 .33 19.87 -5.552018-92. . . . . 13.46 .72 14.18 20.61 .19 20.80 -6.62
a Benefit payments scheduled to be paid on January 3 are actually paid on December 31 as required by thestatutory provision for early delivery of benefit payments when the normal payment delivery date is a Satur-day, Sunday, or legal public holiday. For comparability with the values for historical years and the projec-tions in this report, all trust fund operations and asset reserves reflect the 12 months of benefits scheduled forpayment each year.
Table IV.B5.—Components of Summarized Income Rates and Cost Rates, Calendar Years 2018-2092 (Cont.)
[As a percentage of taxable payroll]
Valuation period
Summarized income rate Summarized cost rate
Actuarialbalance
Non-interestincome
Beginningasset
reservesa Total Costa
Endingtargetfunda Total
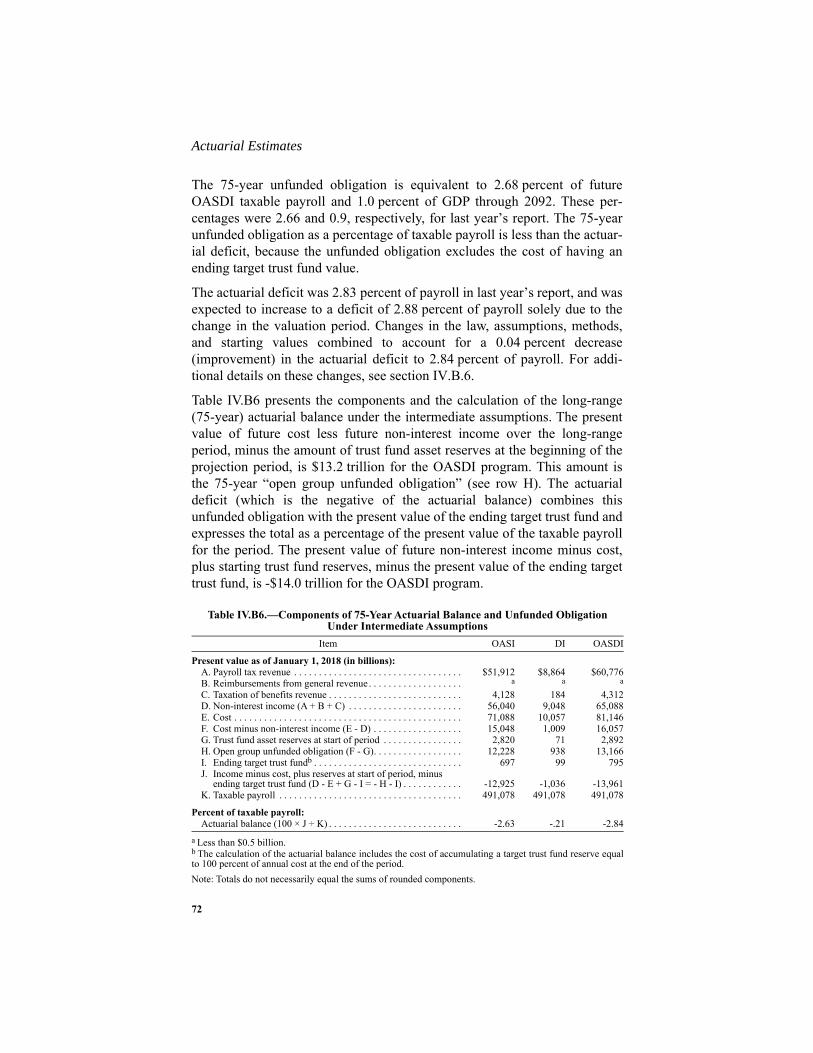
Actuarial Estimates
72
The 75-year unfunded obligation is equivalent to 2.68 percent of futureOASDI taxable payroll and 1.0 percent of GDP through 2092. These per-centages were 2.66 and 0.9, respectively, for last year’s report. The 75-yearunfunded obligation as a percentage of taxable payroll is less than the actuar-ial deficit, because the unfunded obligation excludes the cost of having anending target trust fund value.
The actuarial deficit was 2.83 percent of payroll in last year’s report, and wasexpected to increase to a deficit of 2.88 percent of payroll solely due to thechange in the valuation period. Changes in the law, assumptions, methods,and starting values combined to account for a 0.04 percent decrease(improvement) in the actuarial deficit to 2.84 percent of payroll. For addi-tional details on these changes, see section IV.B.6.
Table IV.B6 presents the components and the calculation of the long-range(75-year) actuarial balance under the intermediate assumptions. The presentvalue of future cost less future non-interest income over the long-rangeperiod, minus the amount of trust fund asset reserves at the beginning of theprojection period, is $13.2 trillion for the OASDI program. This amount isthe 75-year “open group unfunded obligation” (see row H). The actuarialdeficit (which is the negative of the actuarial balance) combines thisunfunded obligation with the present value of the ending target trust fund andexpresses the total as a percentage of the present value of the taxable payrollfor the period. The present value of future non-interest income minus cost,plus starting trust fund reserves, minus the present value of the ending targettrust fund, is -$14.0 trillion for the OASDI program.
Note: Totals do not necessarily equal the sums of rounded components.
Table IV.B6.—Components of 75-Year Actuarial Balance and Unfunded ObligationUnder Intermediate Assumptions
Item OASI DI OASDI
Present value as of January 1, 2018 (in billions):A. Payroll tax revenue . . . . . . . . . . . . . . . . . . . . . . . . . . . . . . . . . . $51,912 $8,864 $60,776B. Reimbursements from general revenue . . . . . . . . . . . . . . . . . . . a
a Less than $0.5 billion.
a a
C. Taxation of benefits revenue . . . . . . . . . . . . . . . . . . . . . . . . . . . 4,128 184 4,312D. Non-interest income (A + B + C) . . . . . . . . . . . . . . . . . . . . . . . 56,040 9,048 65,088E. Cost . . . . . . . . . . . . . . . . . . . . . . . . . . . . . . . . . . . . . . . . . . . . . . 71,088 10,057 81,146F. Cost minus non-interest income (E - D) . . . . . . . . . . . . . . . . . . 15,048 1,009 16,057G. Trust fund asset reserves at start of period . . . . . . . . . . . . . . . . 2,820 71 2,892H. Open group unfunded obligation (F - G). . . . . . . . . . . . . . . . . . 12,228 938 13,166I. Ending target trust fundb . . . . . . . . . . . . . . . . . . . . . . . . . . . . . .
b The calculation of the actuarial balance includes the cost of accumulating a target trust fund reserve equalto 100 percent of annual cost at the end of the period.
697 99 795J. Income minus cost, plus reserves at start of period, minus
ending target trust fund (D - E + G - I = - H - I) . . . . . . . . . . . . -12,925 -1,036 -13,961K. Taxable payroll . . . . . . . . . . . . . . . . . . . . . . . . . . . . . . . . . . . . . 491,078 491,078 491,078
Percent of taxable payroll:Actuarial balance (100 × J ÷ K) . . . . . . . . . . . . . . . . . . . . . . . . . . . -2.63 -.21 -2.84
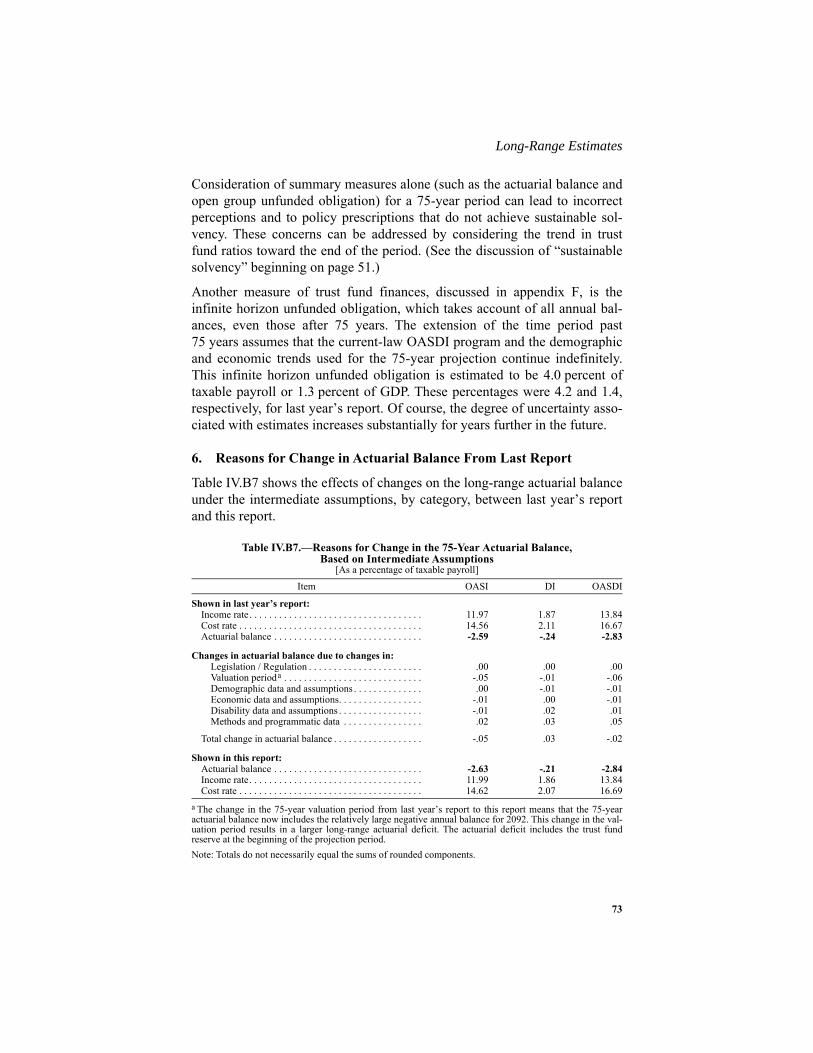
73
Long-Range Estimates
Consideration of summary measures alone (such as the actuarial balance andopen group unfunded obligation) for a 75-year period can lead to incorrectperceptions and to policy prescriptions that do not achieve sustainable sol-vency. These concerns can be addressed by considering the trend in trustfund ratios toward the end of the period. (See the discussion of “sustainablesolvency” beginning on page 51.)
Another measure of trust fund finances, discussed in appendix F, is theinfinite horizon unfunded obligation, which takes account of all annual bal-ances, even those after 75 years. The extension of the time period past75 years assumes that the current-law OASDI program and the demographicand economic trends used for the 75-year projection continue indefinitely.This infinite horizon unfunded obligation is estimated to be 4.0 percent oftaxable payroll or 1.3 percent of GDP. These percentages were 4.2 and 1.4,respectively, for last year’s report. Of course, the degree of uncertainty asso-ciated with estimates increases substantially for years further in the future.
6. Reasons for Change in Actuarial Balance From Last Report
Table IV.B7 shows the effects of changes on the long-range actuarial balanceunder the intermediate assumptions, by category, between last year’s reportand this report.
Note: Totals do not necessarily equal the sums of rounded components.
Table IV.B7.—Reasons for Change in the 75-Year Actuarial Balance,Based on Intermediate Assumptions
[As a percentage of taxable payroll]Item OASI DI OASDI
Shown in last year’s report:Income rate. . . . . . . . . . . . . . . . . . . . . . . . . . . . . . . . . . . 11.97 1.87 13.84Cost rate . . . . . . . . . . . . . . . . . . . . . . . . . . . . . . . . . . . . . 14.56 2.11 16.67Actuarial balance . . . . . . . . . . . . . . . . . . . . . . . . . . . . . . -2.59 -.24 -2.83
Changes in actuarial balance due to changes in:Legislation / Regulation . . . . . . . . . . . . . . . . . . . . . . . .00 .00 .00Valuation perioda . . . . . . . . . . . . . . . . . . . . . . . . . . . .
a The change in the 75-year valuation period from last year’s report to this report means that the 75-yearactuarial balance now includes the relatively large negative annual balance for 2092. This change in the val-uation period results in a larger long-range actuarial deficit. The actuarial deficit includes the trust fundreserve at the beginning of the projection period.
-.05 -.01 -.06Demographic data and assumptions . . . . . . . . . . . . . . .00 -.01 -.01Economic data and assumptions. . . . . . . . . . . . . . . . . -.01 .00 -.01Disability data and assumptions . . . . . . . . . . . . . . . . . -.01 .02 .01Methods and programmatic data . . . . . . . . . . . . . . . . .02 .03 .05
Total change in actuarial balance . . . . . . . . . . . . . . . . . . -.05 .03 -.02
Shown in this report:Actuarial balance . . . . . . . . . . . . . . . . . . . . . . . . . . . . . . -2.63 -.21 -2.84Income rate. . . . . . . . . . . . . . . . . . . . . . . . . . . . . . . . . . . 11.99 1.86 13.84Cost rate . . . . . . . . . . . . . . . . . . . . . . . . . . . . . . . . . . . . . 14.62 2.07 16.69

Actuarial Estimates
74
If the law, data, assumptions, and methods had all remained unchanged fromlast year’s Trustees Report, the long-range OASDI actuarial balance wouldhave decreased (become more negative) by 0.06 percent of taxable payrollsolely due to the change in the valuation period. However, as describedbelow, projections in this report also reflect changes in law, data, assump-tions, and methods. These changes, including the change in the valuationperiod, combine to decrease the long-range OASDI actuarial balance from-2.83 percent of taxable payroll in last year’s report to -2.84 percent in thisreport.
Since the last report, there have been no new laws, regulations, or policychanges that are expected to have significant long-range financial effects onthe OASDI program. However, this year’s report does incorporate two nota-ble changes with negligible effects on the actuarial balance. First, estimatesin this report reflect the assumption that the 2012 Deferred Action for Child-hood Arrivals (DACA) program will be phased out over the next 2 yearsafter having been rescinded by the Administration on September 5, 2017.Last year's report assumed that the 2012 DACA program would continueindefinitely. Incorporating the phase-out of DACA has a negligible negativeeffect on the long-range actuarial balance for this year’s report. Second, Pub-lic Law 115-97, the Tax Cuts and Jobs Act, was enacted onDecember 22, 2017. There are two aspects of this law with notable effects onthe OASDI program. The repeal of the individual mandate of the Patient Pro-tection and Affordable Care Act is expected to cause some individuals todrop their employer sponsored health insurance, which is estimated toincrease OASDI covered wages and taxable payroll slightly. The changes toincome tax rates and brackets are expected to have small effects, reducingincome from taxation of benefits through 2025 and increasing it thereafter.The combined effects of the Tax Cuts and Jobs Act increase the long-rangeactuarial balance for this report by a negligible positive amount.
As mentioned above, changing the 75-year valuation period from 2017through 2091 for last year’s report to 2018 through 2092 for this reportdecreases the projected long-range OASDI actuarial balance by 0.06 percentof taxable payroll. This decrease is mainly the result of including the rela-tively large negative annual balance for 2092 in this year’s 75-year projec-tion period. Note that the actuarial balance calculation includes trust fundasset reserves at the beginning of the projection period. These reserves at thestart of the period reflect the program’s net financial flows for all past yearsup to the start of the projection period, including 2017.
All changes in demographic data and assumptions combine to decrease thelong-range OASDI actuarial balance by 0.01 percent of taxable payroll. Ulti-mate demographic assumptions are unchanged from those in last year’s

75
Long-Range Estimates
report, with the exception of one minor change to the ultimate immigrationassumptions. In particular, the ultimate number of assumed lawful-perma-nent-resident (LPR) immigrants has been decreased by 10,000 per year in thefuture due to clarification from the Department of Homeland Security (DHS)regarding the implementation of the 2014 executive actions on immigration.One of these executive actions was intended to increase the number of entre-preneur green cards issued. Therefore, beginning with the 2015 report, theTrustees assumed an increase of 10,000 LPR immigrants per year. DHSrecently clarified that this executive action was never implemented, and theTrustees assume it will not be implemented. Therefore, the earlier assump-tion is being reversed for this report. This change is expected to have a negli-gible effect on the actuarial balance.
This year’s report also includes one change to the near-term demographicassumption for the total fertility rate. Last year’s report included a rise in theprojected total fertility rate to a level of 2.05 for 2023. This rise reflected theassumption that the drop in the total fertility rate below 2.0 during the recenteconomic downturn was, in part, a deferral in childbearing that would be par-tially offset during the latter stages of the economic recovery. However, asthe economic recovery has continued to near completion, and more recentdata have not shown a recovery in fertility rates, it seems more likely thatthis persistent drop in the total fertility rate represents a loss of potentialbirths rather than just a deferral for this period. Therefore, this year’s reporteliminates the temporary rise in the total fertility rate above the ultimateassumed level. This change decreases the actuarial balance by 0.05 percentof taxable payroll.
Four demographic data updates had significant effects on the long-rangeOASDI actuarial balance. First, final fertility (birth) data for 2016 indicatesomewhat lower birth rates than were assumed in last year’s report for 2016.These updated data result in slightly lower birth rates during the transitionperiod to the ultimate levels, decreasing the actuarial balance by 0.03 percentof taxable payroll. Second, incorporating 2015 mortality data for ages under65 from the National Center for Health Statistics (NCHS) and preliminary2015 mortality data for ages 65 and older from Medicare experience resultedin higher death rates for all future years than were projected in last year’sreport. These higher death rates increase (improve) the actuarial balance by0.05 percent of taxable payroll. Third, this year’s estimates incorporateupdated LPR immigration data from DHS, which decreases the actuarial bal-ance by 0.01 percent of taxable payroll. Fourth, updates to historical popula-tion data and other minor data updates combine to increase the actuarialbalance by 0.04 percent of taxable payroll. The majority of this change is dueto updated historical estimates of the other-than-LPR population for 2014
Actuarial Estimates
76
and 2015, and the resulting effects on the projection of labor force, employ-ment, covered workers, and beneficiaries.
Changes in economic data and assumptions combine to decrease the long-range OASDI actuarial balance by 0.01 percent of payroll. Ultimate eco-nomic assumptions are unchanged from those in last year’s report. However,primarily due to slow growth in labor productivity for 2010 through 2017and low unemployment rates in 2017, the estimated level of potential GDP isreduced for this report by about 1 percent in 2017 and throughout the projec-tion period. This lower estimated level of potential GDP means that cumula-tive growth in actual GDP is 1 percent less over the remainder of theprojected recovery, and thus decreases the actuarial balance by 0.02 percentof taxable payroll. In addition, near-term interest rates were decreased forthis report, reflecting a more gradual path for the rise to the ultimate realinterest rate. These lower near-term interest rates decrease the actuarial bal-ance by 0.02 percent of payroll. Other changes to data and near-term eco-nomic assumptions, including an extended recovery from lower-than-expected ratios for 2016 and 2017 of labor compensation to GDP and taxablepayroll to GDP to the unchanged ultimate ratios, combine for a net increasein the actuarial balance of 0.03 percent of taxable payroll.
Although ultimate disability assumptions are unchanged from those in lastyear’s report, changes in recent disability data and near-term assumptionsincrease the long-range OASDI actuarial balance by 0.01 percent of taxablepayroll. Recent data have shown lower levels of disability applications andawards than expected in last year’s report. Based on this experience, esti-mated disabled-worker incidence rates are reduced for this report over thefirst few years of the short-range period. This year’s report also incorporateslower average benefit levels for disabled workers newly awarded benefits in2017 and in the future. These changes are primarily responsible for thechange in the DI reserve depletion date from 2028 in last year’s report to2032 in this year’s report. The short-range effects are noted insection IV.A.4.
The projections in this report also reflect several methodological improve-ments and updates of program-specific data. These methodological changes,programmatic data updates, and interactions combine to increase the long-range OASDI actuarial balance by 0.05 percent of taxable payroll. Descrip-tions of six significant methodological changes and programmatic dataupdates follow.
First, this year’s report includes an improvement to the method for projectingmortality rates by marital status. The new method smooths the rates at olderages, utilizing recent data from NCHS and the American Community Survey,rather than older data from the Census Bureau and NCHS. This methodologi-

77
Long-Range Estimates
cal improvement increases the actuarial balance by 0.01 percent of taxablepayroll.
Second, the labor force participation rate model has been updated to improvethe method for projecting educational attainment among women in agegroups 45-49 and 50-54. This change better reflects recent increases in edu-cational attainment among women entering these two age groups and resultsin an increase in their labor force participation. In turn, this leads to anincrease in covered workers and taxable payroll over the projection period,which increases the actuarial balance by 0.02 percent of taxable payroll.
The third significant change is an increase in the assumed ultimate retired-worker prevalence rate for women at age 70. This year’s report increases thepercentage of fully insured women (excluding those who are receiving a dis-ability or widow benefit) who are assumed to be in receipt of a retired-worker benefit at age 70 from 99.0 percent in last year’s report to99.5 percent in this year’s report, to be the same as the percentage assumedfor men. This change increases the number of female retired workers, thusdecreasing the actuarial balance by 0.02 percent of payroll.
The fourth significant change is in the long-range model for projecting aver-age benefit levels of retired-worker and disabled-worker beneficiaries newlyentitled for benefits. This model uses a large sample of 10 percent of allnewly entitled retired-worker beneficiaries in a recent year. The sample usedin the 2017 report was for worker beneficiaries newly entitled in 2013. Thisyear’s report uses the results from worker beneficiaries newly entitled in2015. In addition, the method used to estimate earnings histories for retired-worker beneficiaries becoming newly entitled in each year after 2017 hasbeen expanded to better match targeted average taxable earnings levels foreach of nine birth cohorts (those becoming entitled at ages 62 through 70 in ayear). Together, the changes in the sample data and the model for projectingaverage benefits for newly-entitled worker beneficiaries increase the actuar-ial balance by 0.05 percent of payroll.
Fifth, recent data and estimates provided by the Office of Tax Analysis(OTA) at the Department of the Treasury indicate higher ultimate levels ofrevenue from taxation of OASDI benefits than projected in last year’s report,independent of the changes due to the recently-enacted Tax Cuts and JobsAct. These higher levels are primarily due to changes OTA made in theirmodeling, resulting in a larger share of benefits being subject to income tax.The increase in ultimate projected ratios of income tax on benefits to benefitamounts results in an increase in the actuarial balance of 0.03 percent of tax-able payroll.
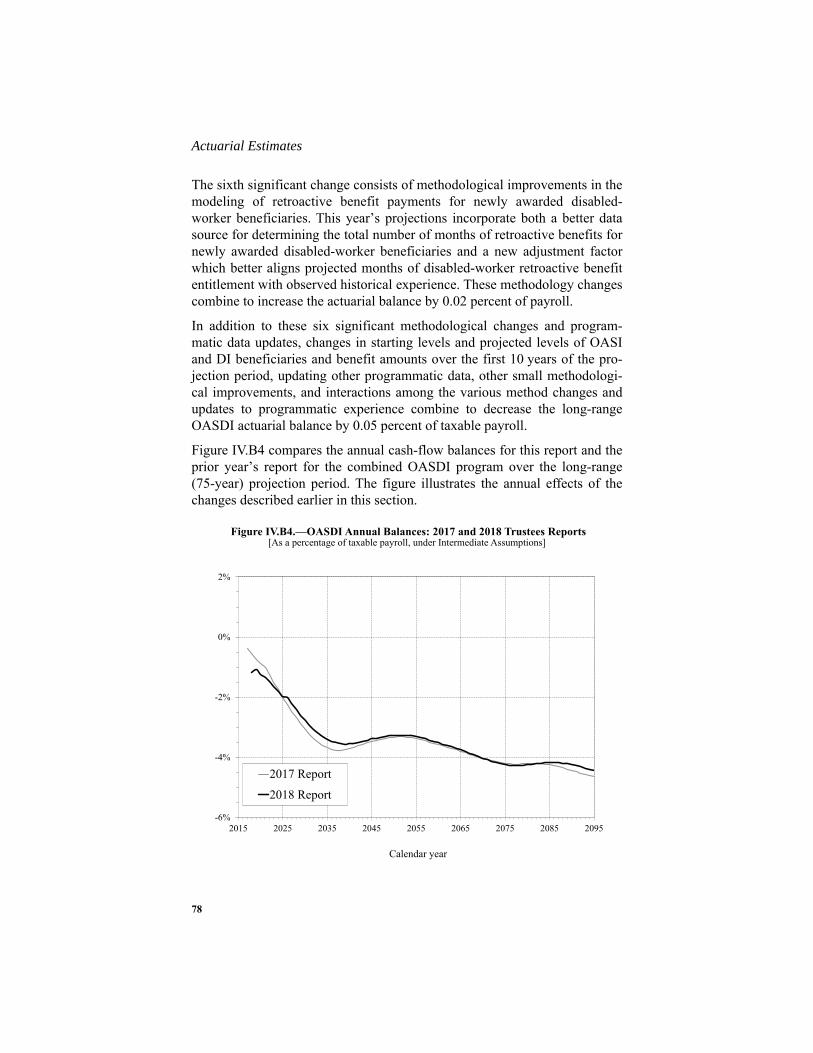
Actuarial Estimates
78
The sixth significant change consists of methodological improvements in themodeling of retroactive benefit payments for newly awarded disabled-worker beneficiaries. This year’s projections incorporate both a better datasource for determining the total number of months of retroactive benefits fornewly awarded disabled-worker beneficiaries and a new adjustment factorwhich better aligns projected months of disabled-worker retroactive benefitentitlement with observed historical experience. These methodology changescombine to increase the actuarial balance by 0.02 percent of payroll.
In addition to these six significant methodological changes and program-matic data updates, changes in starting levels and projected levels of OASIand DI beneficiaries and benefit amounts over the first 10 years of the pro-jection period, updating other programmatic data, other small methodologi-cal improvements, and interactions among the various method changes andupdates to programmatic experience combine to decrease the long-rangeOASDI actuarial balance by 0.05 percent of taxable payroll.
Figure IV.B4 compares the annual cash-flow balances for this report and theprior year’s report for the combined OASDI program over the long-range(75-year) projection period. The figure illustrates the annual effects of thechanges described earlier in this section.
Figure IV.B4.—OASDI Annual Balances: 2017 and 2018 Trustees Reports[As a percentage of taxable payroll, under Intermediate Assumptions]
-6%
-4%
-2%
0%
2%
2015 2025 2035 2045 2055 2065 2075 2085 2095
Calendar year
2017 Report
2018 Report
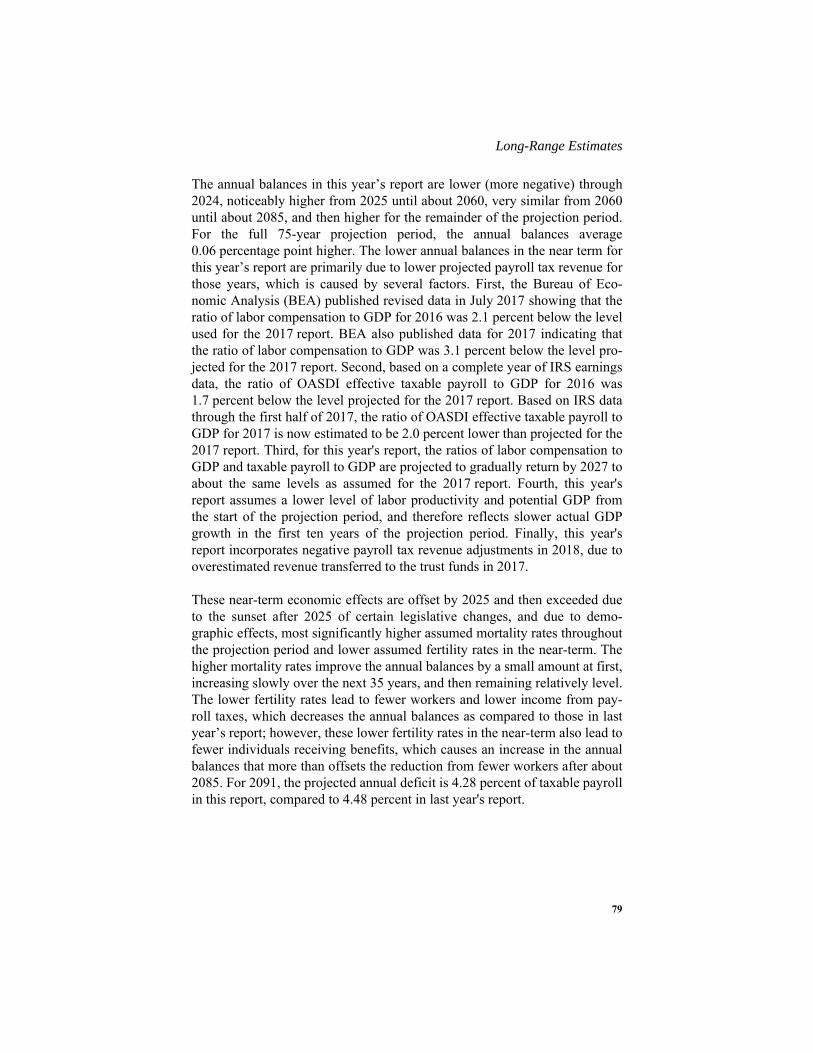
79
Long-Range Estimates
The annual balances in this year’s report are lower (more negative) through2024, noticeably higher from 2025 until about 2060, very similar from 2060until about 2085, and then higher for the remainder of the projection period.For the full 75-year projection period, the annual balances average0.06 percentage point higher. The lower annual balances in the near term forthis year’s report are primarily due to lower projected payroll tax revenue forthose years, which is caused by several factors. First, the Bureau of Eco-nomic Analysis (BEA) published revised data in July 2017 showing that theratio of labor compensation to GDP for 2016 was 2.1 percent below the levelused for the 2017 report. BEA also published data for 2017 indicating thatthe ratio of labor compensation to GDP was 3.1 percent below the level pro-jected for the 2017 report. Second, based on a complete year of IRS earningsdata, the ratio of OASDI effective taxable payroll to GDP for 2016 was1.7 percent below the level projected for the 2017 report. Based on IRS datathrough the first half of 2017, the ratio of OASDI effective taxable payroll toGDP for 2017 is now estimated to be 2.0 percent lower than projected for the2017 report. Third, for this year's report, the ratios of labor compensation toGDP and taxable payroll to GDP are projected to gradually return by 2027 toabout the same levels as assumed for the 2017 report. Fourth, this year'sreport assumes a lower level of labor productivity and potential GDP fromthe start of the projection period, and therefore reflects slower actual GDPgrowth in the first ten years of the projection period. Finally, this year'sreport incorporates negative payroll tax revenue adjustments in 2018, due tooverestimated revenue transferred to the trust funds in 2017.
These near-term economic effects are offset by 2025 and then exceeded dueto the sunset after 2025 of certain legislative changes, and due to demo-graphic effects, most significantly higher assumed mortality rates throughoutthe projection period and lower assumed fertility rates in the near-term. Thehigher mortality rates improve the annual balances by a small amount at first,increasing slowly over the next 35 years, and then remaining relatively level.The lower fertility rates lead to fewer workers and lower income from pay-roll taxes, which decreases the annual balances as compared to those in lastyear’s report; however, these lower fertility rates in the near-term also lead tofewer individuals receiving benefits, which causes an increase in the annualbalances that more than offsets the reduction from fewer workers after about2085. For 2091, the projected annual deficit is 4.28 percent of taxable payrollin this report, compared to 4.48 percent in last year's report.

Assumptions and Methods
80
V. ASSUMPTIONS AND METHODS UNDERLYINGACTUARIAL ESTIMATES
The future income and cost of the OASDI program will depend on manydemographic, economic, and program-specific factors. Trust fund incomewill depend on how these factors affect the size and composition of theworking population as well as the level and distribution of earnings. Simi-larly, program cost will depend on how these factors affect the size and com-position of the beneficiary population as well as the general level of benefits.
The Trustees make basic assumptions for several of these factors based onanalysis of historical trends, historical conditions, and expected future condi-tions. These factors include fertility, mortality, immigration, marriage,divorce, productivity, inflation, average earnings, unemployment, real inter-est rates, and disability incidence and termination. Other factors depend onthese basic assumptions. These other, often interdependent, factors includetotal population, life expectancy, labor force participation, gross domesticproduct, and program-specific factors. Each year the Trustees reexaminethese assumptions and methods in light of new information and make appro-priate revisions. The assumptions for this report were selected by the begin-ning of February 2018.
Future levels of these factors and their interrelationships are inherentlyuncertain. To address these uncertainties, this report uses three sets ofassumptions, designated as intermediate (alternative II), low-cost(alternative I), and high-cost (alternative III). The intermediate set representsthe Trustees’ best estimate of the future course of the population and theeconomy. With regard to the net effect on the actuarial status of the OASDIprogram, the low-cost set is more optimistic and the high-cost set is morepessimistic. The low-cost and high-cost sets of assumptions reflect signifi-cant potential changes in the interrelationships among factors, as well aschanges in the values for individual factors.
While it is unlikely that all of the factors and interactions will differ in thespecified directions from the intermediate values, many combinations ofindividual differences in the factors could have a similar overall effect. Out-comes with overall long-range cost as low as the low-cost scenario or as highas the high-cost scenario are very unlikely. This report also includes a sectionon sensitivity analysis, where factors are changed one at a time (seeappendix D), and a section on stochastic projections, which provides a prob-ability distribution of possible future outcomes, with all factors being variedaround the intermediate alternative (see appendix E).
81
Demographic Assumptions and Methods
Readers should interpret with care the estimates based on the three sets ofalternative assumptions. These estimates are not specific predictions of thefuture financial status of the OASDI program. Rather, they provide a reason-able range of future income and cost bounded by two plausible, albeit veryunlikely, demographic and economic scenarios.
All of the key demographic, economic, and program-specific assumptionsreach their long-range ultimate values within the next 25 years. For extrapo-lations beyond the 75-year long-range period, the ultimate levels or trendsreached by the end of the 75-year period remain unchanged. The assumedultimate values represent average annual experience or growth rates. Actualfuture values will exhibit fluctuations or cyclical patterns, as in the past.
The following sections briefly discuss the various assumptions and methodsused in making the estimates of trust fund actuarial status, which are thefocus of this report.1 There are, of course, many interrelationships amongthese factors that are important but are beyond the scope of this discussion.
A. DEMOGRAPHIC ASSUMPTIONS AND METHODS
This section of the report provides a brief overview of the demographic his-torical data and the assumptions used for the projections.
1. Fertility AssumptionsBirth rates by single year of age, for women aged 14 to 49,2 are the basis forthe fertility assumptions. These rates apply to the total number of women,across all marital statuses, in the midyear population at each age. Table V.A1displays the historical and projected total fertility rates.3
Historically, birth rates in the United States have fluctuated widely. The totalfertility rate decreased from 3.31 children per woman at the end of WorldWar I (1918) to 2.15 during the Great Depression (1936). After 1936, thetotal fertility rate rose to 3.68 in 1957 and then fell to 1.74 by 1976. After
1 Actuarial Studies published by the Office of the Chief Actuary, Social Security Administration, containfurther details about the assumptions, methods, and actuarial estimates. A complete list of available studiesmay be found at www.ssa.gov/OACT/NOTES/actstud.html. To obtain copies of such studies or of thisreport, please submit a request at www.ssa.gov/OACT/request.html. This entire report, along with supple-mental year-by-year tables and additional documentation on assumptions and methods, may be found atwww.ssa.gov/OACT/TR/2018/. 2 Birth rates at age 14 include births to women aged 14 and under, and birth rates at age 49 include births towomen aged 49 and over. 3 The total fertility rate may be interpreted as the average number of children that would be born to a womanin her lifetime if she were to experience, at each age of her life, the birth rate observed in, or assumed for, aspecified year, and if she were to survive the entire childbearing period. A rate of about 2.1 would ultimatelyresult in a nearly constant population if immigration and emigration were both zero, and if death rates wereto remain at current levels.
Assumptions and Methods
82
1976, the total fertility rate rose above 2.00 by 1990, where it generallyremained through 2009, but dropped below 1.90 for 2011 through 2016 andis estimated to be 1.80 in 2017. The recession and slow recovery in employ-ment opportunity are likely contributing reasons for this recent low level.
These variations in the total fertility rate resulted from changes in many fac-tors, including social attitudes, economic conditions, birth-control practices,and the racial/ethnic composition of the population. The Trustees expectfuture total fertility rates to remain relatively close to recent levels. Certainpopulation characteristics, such as the higher percentages of women whohave never married, of women who are divorced, and of young women whoare in the labor force, are consistent with continued lower total fertility ratesthan those experienced during the baby-boom era (1946-65). Based on con-sideration of these factors, the Trustees assume ultimate total fertility rates of2.20, 2.00, and 1.80 children per woman for the low-cost, intermediate, andhigh-cost assumptions, respectively. These ultimate rates are unchangedfrom last year’s report.
For the intermediate assumptions, the projected total fertility rate graduallyincreases from 2017 through 2027, with somewhat more rapid increases inthe middle of the 2017-2027 period. Last year’s report included a rise in theprojected total fertility rate for the intermediate assumptions to a level of2.05 in 2023. This rise reflected the assumption that the drop in the total fer-tility rate below 2.0 during the recent economic downturn was, in part, adeferral in childbearing that would be partially offset during the latter stagesof the economic recovery. However, as the economic recovery has continuedto near completion, and more recent data have not shown a recovery in fertil-ity rates, it seems more likely that this persistent drop in the total fertility raterepresents a loss of potential births rather than just a deferral. Therefore, thisyear’s report eliminates the temporary rise in the total fertility rate above theultimate assumed level. The assumed low-cost and high-cost total fertilityrates trend away from the intermediate path and reach the ultimate values in2027 and 2023, respectively.
2. Mortality AssumptionsFor the projections in this year’s report, ultimate average annual percentagereductions in future mortality rates were assumed by age group and cause ofdeath. These assumptions were then used to estimate future central deathrates by age group, sex, and cause of death. From these estimated centraldeath rates, probabilities of death by single year of age and sex were calcu-lated.

83
Demographic Assumptions and Methods
Historical death rates are calculated for years 1900 through 2015 for agesbelow 65 (and for all ages for years prior to 1968) using data from theNational Center for Health Statistics (NCHS).1 For ages 65 and over, finalMedicare data on deaths for years 1968 through 2014 and preliminary datafor 2015 are used.2 Death rates by cause of death are produced for all agesfor years 1979-2015 using data from the NCHS.
The total age-sex-adjusted death rate3 declined at an average annual rate of1.03 percent between 1900 and 2015. Between 1979 and 2015, the period forwhich death rates were analyzed by cause, the total age-sex-adjusted deathrate, for all causes combined, declined at an average rate of 0.87 percent peryear.
Death rates have declined substantially in the U.S. since 1900, with rapiddeclines over some periods and slow or no improvement over the other peri-ods. Many factors are responsible for historical reductions in death rates,including medical advances, increased availability of health-care services,and improvements in sanitation and nutrition. Historical death rates generallydeclined more slowly for older ages and more rapidly for children andinfants than for the rest of the population. Between 1900 and 2015, the age-sex-adjusted death rate declined at an average rate of 0.77 percent per yearfor ages 65 and over, and 3.03 percent per year for ages under 15.
Mortality assumptions differ for the low-cost, intermediate, and high-costscenarios. Throughout the projection, the low-cost scenario contains annualpercentage reductions that are smaller than those in the intermediate sce-nario, while those in the high-cost scenario are larger. The ultimate annualpercentage reductions for each of the three alternatives are the same as thosein last year’s report.
The trends in the annual reductions in central death rates are calculated forthe period from 2005 to 2015 by age group, sex, and cause of death. Thesetrends are the starting reductions for alternative II. For alternatives I and III,50 and 150 percent of the starting reductions are used, respectively. Theseannual reductions, by alternative, are assumed to transition rapidly from thestarting reductions until they reach the ultimate annual percentage reductionsassumed for 2042 and later.
1 These rates reflect NCHS data on deaths and Census estimates of population. 2 These rates reflect Medicare data on deaths and enrollments. 3 Based on the enumerated total population as of April 1, 2010, if that population were to experience thedeath rates by age and sex for the selected year.

Assumptions and Methods
84
Table V.A1 contains historical and projected age-sex-adjusted death rates forthe total population (all ages), for ages under 65, and for ages 65 and over.Age-sex adjustment eliminates the effect of a changing distribution of popu-lation by age and sex, allowing the pure effects of changes in death rates tobe observed. Under the intermediate assumptions, projected age-sex-adjusteddeath rates are, in general, slightly higher than the death rates in last year’sreport for both the age group under 65 and the age group 65 and over. Thesechanges primarily result from incorporating more recent historical data,which continue to show low rates of improvement.
The projected average annual rate of decline for the total age-sex-adjusteddeath rate is about 0.41 percent, 0.77 percent, and 1.15 percent between 2017and 2092 for alternatives I, II, and III, respectively. In keeping with the pat-terns observed in the historical data, the assumed future rates of decline aregreater for younger ages than for older ages, but to a substantially lesserdegree than in the past. Accordingly, the projected age-sex-adjusted deathrates for ages 65 and over decline at average annual rates of about0.37 percent, 0.68 percent, and 1.01 percent between 2017 and 2092 foralternatives I, II, and III, respectively. The projected age-sex-adjusted deathrates for ages under 15 decline at average annual rates of about 0.80 percent,1.59 percent, and 2.59 percent between 2017 and 2092 for alternatives I, II,and III, respectively.
Demographers express a wide range of views on the likely rate of futuredecline in death rates. For example, some believe that the long-standing his-torical tendency for mortality to decline more slowly at the oldest ages willcease in the future. Others believe that biological factors, social factors, andlimitations on health care spending may slow future rates of decline in mor-tality.
The Trustees periodically revise the assumed ultimate rates of decline inmortality based on experience, new conditions, and expert opinion. Evolvingtrends in health care and lifestyle will determine what modifications to theassumed ultimate rates of decline in mortality will be warranted for futurereports.

85
Demographic Assumptions and Methods
.
Table V.A1.—Fertility and Mortality Assumptions,a Calendar Years 1940-2095
Calendar year
Totalfertility
rateb
Age-sex-adjusted death ratec per 100,000, by age
Total Under 65 65 and over
Historical data:1940 . . . . . . . . . 2.23 1,919.8 750.1 9,718.81945 . . . . . . . . . 2.42 1,716.6 674.8 8,662.91950 . . . . . . . . . 3.03 1,561.9 570.2 8,173.71955 . . . . . . . . . 3.50 1,453.8 508.2 7,758.41960 . . . . . . . . . 3.61 1,454.3 503.2 7,795.41965 . . . . . . . . . 2.88 1,428.8 495.2 7,653.31970 . . . . . . . . . 2.43 1,340.0 485.7 7,036.31975 . . . . . . . . . 1.77 1,204.8 426.6 6,393.61980 . . . . . . . . . 1.82 1,136.9 384.3 6,154.31985 . . . . . . . . . 1.83 1,081.0 353.3 5,932.91990 . . . . . . . . . 2.07 1,021.3 333.6 5,606.31995 . . . . . . . . . 1.98 1,001.5 317.9 5,559.52000 . . . . . . . . . 2.05 960.7 281.0 5,492.3
2005 . . . . . . . . . 2.06 901.3 270.7 5,105.42006 . . . . . . . . . 2.11 876.1 267.6 4,933.52007 . . . . . . . . . 2.12 856.8 261.6 4,825.22008 . . . . . . . . . 2.07 857.0 258.8 4,845.52009 . . . . . . . . . 2.00 827.1 255.3 4,639.72010 . . . . . . . . . 1.93 821.3 248.5 4,640.12011 . . . . . . . . . 1.89 819.4 249.1 4,621.42012 . . . . . . . . . 1.87 812.0 248.6 4,568.22013 . . . . . . . . . 1.85 812.1 249.4 4,563.62014 . . . . . . . . . 1.86 805.3 251.5 4,497.82015 . . . . . . . . . 1.85 d815.8 255.0 d4,555.02016 . . . . . . . . . 1.82 e791.0 e245.8 e4,425.82017 . . . . . . . . . e1.80 e783.6 e243.7 e4,383.6
Intermediate: 2020 . . . . . . . . . 1.84 762.4 236.7 4,267.42025 . . . . . . . . . 1.99 728.9 224.2 4,094.12030 . . . . . . . . . 2.00 697.7 211.9 3,936.22035 . . . . . . . . . 2.00 668.4 200.3 3,789.52040 . . . . . . . . . 2.00 641.1 189.4 3,652.52045 . . . . . . . . . 2.00 615.5 179.2 3,524.22050 . . . . . . . . . 2.00 591.5 169.7 3,403.72055 . . . . . . . . . 2.00 569.0 160.8 3,290.52060 . . . . . . . . . 2.00 547.9 152.5 3,184.02065 . . . . . . . . . 2.00 528.1 144.8 3,083.52070 . . . . . . . . . 2.00 509.4 137.5 2,988.72075 . . . . . . . . . 2.00 491.8 130.7 2,899.22080 . . . . . . . . . 2.00 475.2 124.4 2,814.42085 . . . . . . . . . 2.00 459.5 118.4 2,734.12090 . . . . . . . . . 2.00 444.7 112.8 2,657.92095 . . . . . . . . . 2.00 430.7 107.5 2,585.6

Assumptions and Methods
86
3. Immigration AssumptionsProjections of the total Social Security area population reflect assumptionsfor annual immigration flows. For this report, four categories of immigrationflows are used:
Low-cost: 2020 . . . . . . . . . 1.91 785.3 243.9 4,395.22025 . . . . . . . . . 2.15 769.3 237.9 4,312.32030 . . . . . . . . . 2.20 752.7 231.4 4,228.22035 . . . . . . . . . 2.20 736.2 224.9 4,145.52040 . . . . . . . . . 2.20 720.2 218.5 4,065.22045 . . . . . . . . . 2.20 704.7 212.3 3,987.22050 . . . . . . . . . 2.20 689.7 206.4 3,911.82055 . . . . . . . . . 2.20 675.2 200.6 3,838.92060 . . . . . . . . . 2.20 661.1 195.1 3,768.42065 . . . . . . . . . 2.20 647.6 189.7 3,700.12070 . . . . . . . . . 2.20 634.5 184.6 3,634.02075 . . . . . . . . . 2.20 621.8 179.6 3,569.92080 . . . . . . . . . 2.20 609.5 174.8 3,507.92085 . . . . . . . . . 2.20 597.6 170.1 3,447.72090 . . . . . . . . . 2.20 586.1 165.6 3,389.42095 . . . . . . . . . 2.20 574.9 161.3 3,332.8
High-cost:2020 . . . . . . . . . 1.76 737.6 228.6 4,130.92025 . . . . . . . . . 1.80 684.8 208.8 3,858.92030 . . . . . . . . . 1.80 638.0 190.3 3,623.42035 . . . . . . . . . 1.80 596.2 173.6 3,414.22040 . . . . . . . . . 1.80 558.7 158.6 3,226.42045 . . . . . . . . . 1.80 525.0 145.2 3,056.82050 . . . . . . . . . 1.80 494.5 133.3 2,902.82055 . . . . . . . . . 1.80 466.9 122.6 2,762.72060 . . . . . . . . . 1.80 441.8 112.9 2,634.52065 . . . . . . . . . 1.80 418.9 104.3 2,516.92070 . . . . . . . . . 1.80 398.0 96.4 2,408.72075 . . . . . . . . . 1.80 378.8 89.3 2,308.72080 . . . . . . . . . 1.80 361.1 82.9 2,216.12085 . . . . . . . . . 1.80 344.8 77.0 2,130.12090 . . . . . . . . . 1.80 329.7 71.7 2,049.92095 . . . . . . . . . 1.80 315.6 66.8 1,974.9
a This table contains basic assumptions along with key summary values that are derived from basic assump-tions.b The total fertility rate for any year is the average number of children that would be born to a woman in herlifetime if she were to experience, at each age of her life, the birth rate observed in, or assumed for, theselected year, and if she were to survive the entire childbearing period.c Based on the enumerated total population as of April 1, 2010, if that population were to experience thedeath rates by age and sex observed in, or assumed for, the selected year.d Estimated.e Estimated, intermediate alternative.
Table V.A1.—Fertility and Mortality Assumptions,a Calendar Years 1940-2095 (Cont.)
Calendar year
Totalfertility
rateb
Age-sex-adjusted death ratec per 100,000, by age
Total Under 65 65 and over

87
Demographic Assumptions and Methods
• Lawful permanent resident (LPR) immigration: Persons who enter theSocial Security area and are granted LPR status, or who are already inthe Social Security area and adjust their status to become LPRs.1
• Legal emigration: LPRs and citizens who leave the Social Security areapopulation.
• Other-than-LPR immigration: Persons who enter the Social Securityarea and stay to the end of the year without being granted LPR status,such as undocumented immigrants, and foreign workers and studentsentering with temporary visas.
• Other-than-LPR emigration: Other-than-LPR immigrants who leave theSocial Security area population or who adjust their status to becomeLPRs.
Net LPR immigration is the difference between LPR immigration and legalemigration. Net other-than-LPR immigration is the difference between other-than-LPR immigration and other-than-LPR emigration. Total net immigra-tion refers to the sum of net LPR immigration and net other-than-LPR immi-gration.
Immigration assumptions differ for the low-cost, intermediate, and high-costscenarios. The low-cost scenario includes higher annual net immigration andthe high-cost scenario includes lower annual net immigration. Table V.A2contains historical and projected levels of various immigration flows.
LPR immigration has increased significantly since World War II, due to vari-ous factors and legislative changes, including the Immigration Act of 1965and the Immigration Act of 1990.
The intermediate alternative assumes that ultimate annual LPR immigration,which includes residents who adjust their status to become LPRs, will be1,050,000 persons for 2019 and later. Alternative I assumes that ultimateannual LPR immigration will be 1,250,000 persons for 2018 and later, whilealternative III assumes that ultimate annual LPR immigration will be850,000 persons for 2019 and later. For all three alternatives, the ultimatelevel of LPR immigration is reduced by 10,000 persons from last year’sreport. This reduction is due to clarification from the Department of Home-
1 Persons who enter the country with legal visas but without LPR status, such as temporary foreign workersand students, are not included in the “LPR immigration” category.

Assumptions and Methods
88
land Security (DHS) regarding implementation of the 2014 executive actionson immigration.1
The assumed ratios of annual legal emigration to LPR immigration are 20,25, and 30 percent for alternatives I, II, and III, respectively. This range isconsistent with the limited historical data for legal emigration from theSocial Security area. These ratios are unchanged from last year’s report.Under the intermediate alternative, by combining the ultimate annual LPRimmigration and legal emigration assumptions, ultimate annual net LPRimmigration is about 788,000 persons. For the low-cost and high-cost sce-narios, ultimate annual net LPR immigration is 1,000,000 persons and595,000 persons, respectively.
The estimated number of other-than-LPR immigrants residing in the SocialSecurity area and the annual level of other-than-LPR immigration have beenaffected significantly by the most recent recession. Although net other-than-LPR immigration was greatly reduced during the economic downturn, it hasbegun to rise since then. Under the intermediate assumptions, annual other-than-LPR immigration is expected to continue increasing, reflecting a con-tinued recovery from levels experienced during the recession. The ultimatelevels of other-than-LPR immigration are unchanged from last year’s report:1,350,000 persons for alternative II, 1,650,000 persons for alternative I, and1,050,000 persons for alternative III.
Emigration from the other-than-LPR immigrant population includes thosewho leave the Social Security area and those who adjust their status tobecome LPRs. This other-than-LPR immigrant population is highly mobileand far more likely to leave the Social Security area than is the citizen orLPR population. However, as other-than-LPR immigrants stay in the countryfor longer periods of time, they generally become less likely to leave thecountry.
Under the intermediate assumptions, the total annual number of other-than-LPR immigrants who leave the Social Security area averages about 424,000through the 75-year projection period. In addition, the ultimate annual num-ber of other-than-LPR immigrants who adjust status to become LPRs isassumed to be 450,000 for the intermediate assumptions. For the low-costand high-cost scenarios, the total annual number of other-than-LPR emi-
1 Prior to this year, the Trustees assumed that there would be an additional 10,000 LPRs annually due toincreased usage of the “national interest waiver.” This waiver permits certain non-citizens with advanceddegrees or exceptional abilities to seek green cards without employer sponsorship if their admission is in thenational interest. However, DHS has clarified that this provision has not been implemented, and the Trusteesassume it will not be implemented.

89
Demographic Assumptions and Methods
grants averages about 501,000 and 332,000, respectively, through the75-year projection period. The ultimate annual number of people adjustingstatus to LPR status is assumed to be 550,000 persons and 350,000 persons,for the low-cost and high-cost scenarios, respectively. The ultimate annualnumber of people adjusting status to become LPRs is one-third as large asthe assumed ultimate annual number of the other-than-LPR immigrantsentering the Social Security area, and is unchanged from last year’s report forall three sets of assumptions.
Under the assumptions described above, the projected size of the other-than-LPR immigrant population grows substantially. This growth reflects theexcess of annual immigration over the combined annual numbers of emi-grants (including adjustments of status) and deaths that occur within theother-than-LPR immigrant population.
Under the intermediate assumptions, projected net other-than-LPR immigra-tion reaches a peak in 2018, reflecting the recovering economy, then sharplydecreases over the next few years, primarily due to the decline in the annualnumber of other-than-LPR immigrants entering the country, to a stable long-term level. This is followed by a gradual decrease in annual net other-than-LPR immigration starting in 2022, due to the increasing number of other-than-LPR immigrants residing in the Social Security area. Because the num-ber of other-than-LPR immigrants leaving the Social Security area is basedon rates of departure, an increase in the number of other-than-LPR immi-grants residing in the Social Security area results in an increase in the num-ber who emigrate out of the area. All other components of other-than-LPRimmigration and emigration are assumed to be stable after 2022, and thus donot contribute toward any change in annual net other-than-LPR immigration.Under the intermediate assumptions, the projected average annual level ofnet other-than-LPR immigration over the 75-year projection period is about484,000 persons. For the low-cost and high-cost assumptions, projectedaverage annual net other-than-LPR immigration is about 607,000 personsand 356,000 persons, respectively.
The projected average annual level of total net immigration (LPR and other-than-LPR, combined) is about 1,272,000 persons per year during the 75-yearprojection period under the intermediate assumptions. For the low-cost andhigh-cost assumptions, projected average annual total net immigration isabout 1,607,000 persons and 952,000 persons, respectively.
Demographers express a wide range of views about the future course ofimmigration for the United States. Some believe that net immigration willincrease substantially in the future. Others believe that potential immigrants

Assumptions and Methods
90
may be increasingly attracted to other countries, that the number of potentialimmigrants may be lower due to lower birth rates in many countries, or thatchanges in the law or enforcement of the law will reduce immigration.
Table V.A2.—Immigration Assumptions,a Calendar Years 1940-2095[in thousands]
Calendar year
LPR immigration Other-than-LPR immigrationb
Total netimmigration
LPRin
Legalout
Adjustmentsof statusc d
NetLPR
Other-than-LPR
in
Other-than-LPR
outAdjustments
of statusc d
Netother-than-LPR
Historical data:1940 . . . . 61 15 - 46 - - - - -1945 . . . . 73 18 - 55 - - - - -1950 . . . . 227 57 - 171 - - - - -1955 . . . . 280 70 - 210 - - - - -1960 . . . . 268 67 - 201 - - - - -1965 . . . . 261 77 49 232 - - 49 - -1970 . . . . 307 93 65 279 - - 65 - -1975 . . . . 340 98 53 294 - - 53 - -1980 . . . . 431 136 112 407 - - 112 208 6141985 . . . . 458 144 119 432 - - 119 264 6961990 . . . . 548 166 114 497 - - 114 620 1,1161995 . . . . 511 192 255 575 - - 255 557 1,1322000 . . . . 482 224 413 672 1,409 294 413 703 1,374
2005 . . . . 561 290 597 869 1,822 84 597 1,141 2,0102006 . . . . 639 303 573 909 1,426 53 573 800 1,7092007 . . . . 584 267 482 800 926 373 482 71 8712008 . . . . 635 278 478 835 708 985 478 -755 792009 . . . . 633 277 475 832 802 222 475 104 9352010 . . . . 622 262 426 786 678 203 426 50 8352011 . . . . 647 264 408 791 594 254 408 -69 7222012 . . . . 621 255 401 766 687 694 401 -407 3592013 . . . . 589 249 409 748 815 494 409 -88 6602014 . . . . 627 256 398 769 1,073 364 398 311 1,0802015 . . . . 689 271 395 813 1,082 324 395 364 1,1772016 . . . . e776 e296 e408 e888 f1,450 e192 e408 f849 f1,7372017 . . . . f700 f288 f450 f863 f1,450 f231 f450 f769 f1,632
Intermediate: 2020 . . . . 600 263 450 788 1,450 290 450 710 1,4982025 . . . . 600 263 450 788 1,350 338 450 562 1,3492030 . . . . 600 263 450 788 1,350 367 450 533 1,3212035 . . . . 600 263 450 788 1,350 393 450 507 1,2952040 . . . . 600 263 450 788 1,350 415 450 485 1,2722045 . . . . 600 263 450 788 1,350 430 450 470 1,2572050 . . . . 600 263 450 788 1,350 441 450 459 1,2472055 . . . . 600 263 450 788 1,350 448 450 452 1,2392060 . . . . 600 263 450 788 1,350 454 450 446 1,2332065 . . . . 600 263 450 788 1,350 459 450 441 1,2292070 . . . . 600 263 450 788 1,350 462 450 438 1,2252075 . . . . 600 263 450 788 1,350 465 450 435 1,2222080 . . . . 600 263 450 788 1,350 467 450 433 1,2212085 . . . . 600 263 450 788 1,350 468 450 432 1,2192090 . . . . 600 263 450 788 1,350 469 450 431 1,2182095 . . . . 600 263 450 788 1,350 470 450 430 1,218

91
Demographic Assumptions and Methods
Low-cost: 2020 . . . . 700 250 550 1,000 1,750 308 550 892 1,8922025 . . . . 700 250 550 1,000 1,650 373 550 727 1,7272030 . . . . 700 250 550 1,000 1,650 415 550 685 1,6852035 . . . . 700 250 550 1,000 1,650 452 550 648 1,6482040 . . . . 700 250 550 1,000 1,650 485 550 615 1,6152045 . . . . 700 250 550 1,000 1,650 507 550 593 1,5932050 . . . . 700 250 550 1,000 1,650 524 550 576 1,5762055 . . . . 700 250 550 1,000 1,650 537 550 563 1,5632060 . . . . 700 250 550 1,000 1,650 546 550 554 1,5542065 . . . . 700 250 550 1,000 1,650 553 550 547 1,5472070 . . . . 700 250 550 1,000 1,650 559 550 541 1,5412075 . . . . 700 250 550 1,000 1,650 563 550 537 1,5372080 . . . . 700 250 550 1,000 1,650 565 550 535 1,5352085 . . . . 700 250 550 1,000 1,650 567 550 533 1,5332090 . . . . 700 250 550 1,000 1,650 568 550 532 1,5322095 . . . . 700 250 550 1,000 1,650 569 550 531 1,531
High-cost:2020 . . . . 500 255 350 595 850 236 350 264 8592025 . . . . 500 255 350 595 1,050 266 350 434 1,0292030 . . . . 500 255 350 595 1,050 287 350 413 1,0082035 . . . . 500 255 350 595 1,050 306 350 394 9892040 . . . . 500 255 350 595 1,050 322 350 378 9732045 . . . . 500 255 350 595 1,050 335 350 365 9602050 . . . . 500 255 350 595 1,050 343 350 357 9522055 . . . . 500 255 350 595 1,050 349 350 351 9462060 . . . . 500 255 350 595 1,050 354 350 346 9412065 . . . . 500 255 350 595 1,050 358 350 342 9372070 . . . . 500 255 350 595 1,050 361 350 339 9342075 . . . . 500 255 350 595 1,050 363 350 337 9322080 . . . . 500 255 350 595 1,050 365 350 335 9302085 . . . . 500 255 350 595 1,050 367 350 333 9282090 . . . . 500 255 350 595 1,050 368 350 332 9272095 . . . . 500 255 350 595 1,050 369 350 331 926
a This table contains basic assumptions along with key summary values that are derived from basic assump-tions.b Historical other-than-LPR immigration and emigration estimates depend on a residual method. The Officeof the Chief Actuary developed these estimates, as well as the resulting other-than-LPR January 1 stockestimates, for years through 2000. For years 2001 and later, the residual method uses stock estimates. For2001 through 2004, the stock is set to values that linearly grade from the 2000 stock estimate to the DHS2005 stock estimate. For 2005 through 2012, DHS provided the stock estimates. Because DHS no longerprovides stock estimates after 2012, the 2013 through 2015 stock estimates are developed by the Office ofthe Chief Actuary, based on the same methods used by DHS.c Estimates do not include persons who attained LPR status under the special one-time provisions of theImmigration Reform and Control Act of 1986.d Adjustments of status are a positive for net LPR immigration and a negative for net other-than-LPR immi-gration.e Estimated.f Estimated, intermediate alternative.Note: Totals do not necessarily equal the sums of rounded components.
Table V.A2.—Immigration Assumptions,a Calendar Years 1940-2095 (Cont.)[in thousands]
Calendar year
LPR immigration Other-than-LPR immigrationb
Total netimmigration
LPRin
Legalout
Adjustmentsof statusc d
NetLPR
Other-than-LPR
in
Other-than-LPR
outAdjustments
of statusc d
Netother-than-LPR

Assumptions and Methods
92
4. Total Population EstimatesThe starting Social Security area population for December 31, 2015, isderived from the Census Bureau’s estimate of the residents of the 50 Statesand D.C. and U.S. Armed Forces overseas. Adjustments are made to reflectmortality assumptions for the aged population since 2010 that are consistentwith Medicare and Social Security data, net immigration assumptions for theaged population since 2010, estimates of the net undercount in the 2010 cen-sus, inclusion of U.S. citizens living abroad (including residents of U.S. terri-tories), and inclusion of non-citizens living abroad who are insured for SocialSecurity benefits. The Office of the Chief Actuary projects the population inthe Social Security area by age, sex, and marital status for December 31 ofeach year from 2016 through 2095 by combining the assumptions for futurefertility, mortality, and immigration with assumptions for marriage anddivorce. Previous sections of this chapter present the assumptions for futurefertility, mortality, and immigration. Assumptions for future rates of mar-riage and divorce reflect historical data from the National Center for HealthStatistics, the Census Bureau, and selected individual States.
This report presents a July 1 (i.e., midyear) population for each year, whichis derived from surrounding December populations. Table V.A3 shows thehistorical and projected population for July 1 by broad age group, for thethree alternatives. It also shows the aged and total dependency ratios (seetable footnotes for definitions).

93
Demographic Assumptions and Methods
Table V.A3.—Social Security Area Population on July 1 and Dependency Ratios,Calendar Years 1945-2095
Calendar year
Population (in thousands) Dependency ratio
Under 20 20-6465 and
over Total Ageda Totalb
Historical data:1945 . . . . . . . . . . . . . . 49,121 88,109 10,900 148,130 0.124 0.6811950 . . . . . . . . . . . . . . 53,903 92,382 12,769 159,053 .138 .7221955 . . . . . . . . . . . . . . 63,293 96,207 15,075 174,576 .157 .8151960 . . . . . . . . . . . . . . 73,074 99,802 17,277 190,153 .173 .9051965 . . . . . . . . . . . . . . 80,020 104,885 19,071 203,975 .182 .9451970 . . . . . . . . . . . . . . 81,020 112,991 20,895 214,906 .185 .9021975 . . . . . . . . . . . . . . 78,629 122,642 23,307 224,578 .190 .8311980 . . . . . . . . . . . . . . 74,835 134,106 26,309 235,250 .196 .7541985 . . . . . . . . . . . . . . 72,948 144,577 29,151 246,676 .202 .7061990 . . . . . . . . . . . . . . 74,797 152,768 31,925 259,491 .209 .6991995 . . . . . . . . . . . . . . 79,278 160,729 34,318 274,325 .214 .7072000 . . . . . . . . . . . . . . 82,003 170,181 35,503 287,687 .209 .690
2005 . . . . . . . . . . . . . . 83,982 181,066 37,156 302,204 .205 .6692006 . . . . . . . . . . . . . . 84,572 183,341 37,722 305,635 .206 .6672007 . . . . . . . . . . . . . . 85,152 184,971 38,477 308,600 .208 .6682008 . . . . . . . . . . . . . . 85,548 185,798 39,363 310,709 .212 .6722009 . . . . . . . . . . . . . . 85,775 186,734 40,243 312,752 .216 .6752010 . . . . . . . . . . . . . . 85,717 188,355 41,050 315,122 .218 .6732011 . . . . . . . . . . . . . . 85,417 189,850 42,041 317,308 .221 .6712012 . . . . . . . . . . . . . . 85,100 190,655 43,446 319,200 .228 .6742013 . . . . . . . . . . . . . . 84,826 191,268 44,926 321,020 .235 .6782014 . . . . . . . . . . . . . . 84,717 192,142 46,335 323,194 .241 .6822015 . . . . . . . . . . . . . . 84,714 193,126 47,773 325,613 .247 .6862016 c . . . . . . . . . . . . . 84,826 194,181 49,273 328,279 .254 .6912017 c . . . . . . . . . . . . . 85,040 195,210 50,867 331,117 .261 .696
Intermediate:2020 . . . . . . . . . . . . . . 85,645 197,892 55,961 339,497 .283 .7162025 . . . . . . . . . . . . . . 87,466 200,771 65,052 353,288 .324 .7602030 . . . . . . . . . . . . . . 89,727 204,114 73,039 366,880 .358 .7972035 . . . . . . . . . . . . . . 93,414 207,761 77,950 379,125 .375 .8252040 . . . . . . . . . . . . . . 97,077 212,111 80,654 389,841 .380 .8382045 . . . . . . . . . . . . . . 98,995 217,721 82,565 399,282 .379 .8342050 . . . . . . . . . . . . . . 99,955 223,258 85,043 408,256 .381 .8292055 . . . . . . . . . . . . . . 101,479 227,993 88,261 417,733 .387 .8322060 . . . . . . . . . . . . . . 103,819 231,979 92,313 428,111 .398 .8452065 . . . . . . . . . . . . . . 106,687 236,306 96,061 439,053 .407 .8582070 . . . . . . . . . . . . . . 109,457 240,455 100,056 449,968 .416 .8712075 . . . . . . . . . . . . . . 111,654 244,664 104,246 460,565 .426 .8822080 . . . . . . . . . . . . . . 113,364 250,886 106,663 470,913 .425 .8772085 . . . . . . . . . . . . . . 115,124 257,567 108,651 481,342 .422 .8692090 . . . . . . . . . . . . . . 117,293 262,799 111,975 492,066 .426 .8722095 . . . . . . . . . . . . . . 119,775 267,020 116,234 503,029 .435 .884
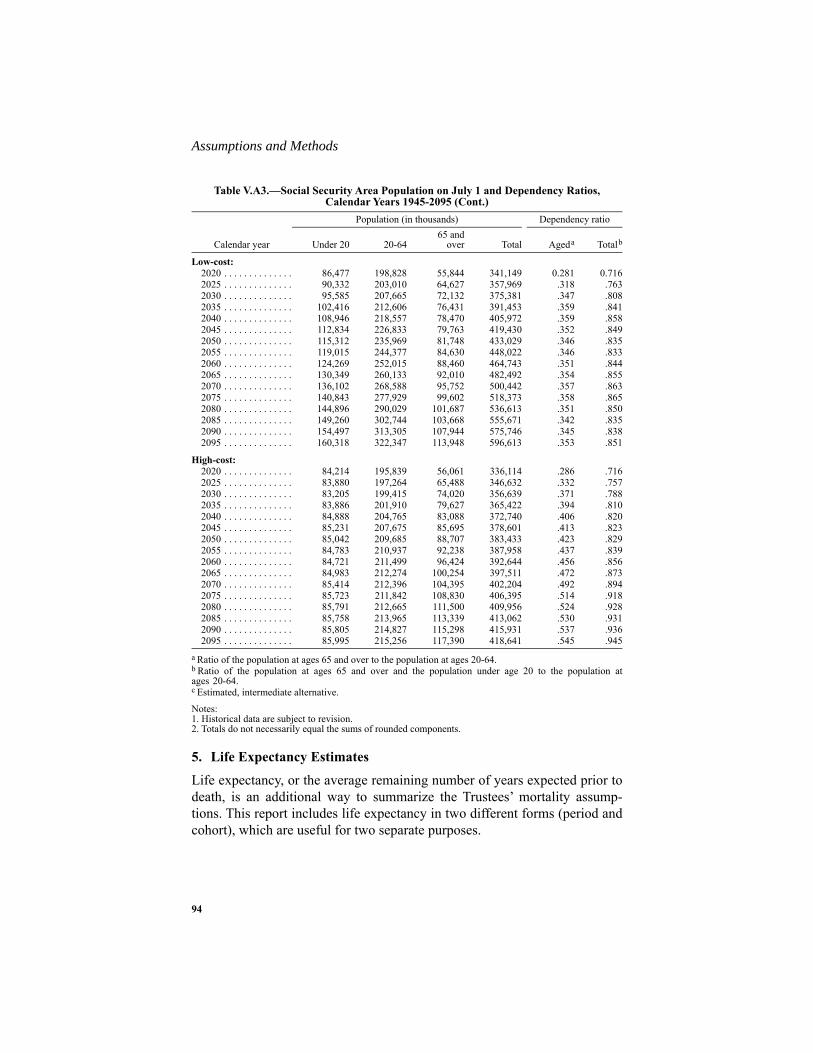
Assumptions and Methods
94
Notes:1. Historical data are subject to revision.2. Totals do not necessarily equal the sums of rounded components.
5. Life Expectancy EstimatesLife expectancy, or the average remaining number of years expected prior todeath, is an additional way to summarize the Trustees’ mortality assump-tions. This report includes life expectancy in two different forms (period andcohort), which are useful for two separate purposes.
Low-cost:2020 . . . . . . . . . . . . . . 86,477 198,828 55,844 341,149 0.281 0.7162025 . . . . . . . . . . . . . . 90,332 203,010 64,627 357,969 .318 .7632030 . . . . . . . . . . . . . . 95,585 207,665 72,132 375,381 .347 .8082035 . . . . . . . . . . . . . . 102,416 212,606 76,431 391,453 .359 .8412040 . . . . . . . . . . . . . . 108,946 218,557 78,470 405,972 .359 .8582045 . . . . . . . . . . . . . . 112,834 226,833 79,763 419,430 .352 .8492050 . . . . . . . . . . . . . . 115,312 235,969 81,748 433,029 .346 .8352055 . . . . . . . . . . . . . . 119,015 244,377 84,630 448,022 .346 .8332060 . . . . . . . . . . . . . . 124,269 252,015 88,460 464,743 .351 .8442065 . . . . . . . . . . . . . . 130,349 260,133 92,010 482,492 .354 .8552070 . . . . . . . . . . . . . . 136,102 268,588 95,752 500,442 .357 .8632075 . . . . . . . . . . . . . . 140,843 277,929 99,602 518,373 .358 .8652080 . . . . . . . . . . . . . . 144,896 290,029 101,687 536,613 .351 .8502085 . . . . . . . . . . . . . . 149,260 302,744 103,668 555,671 .342 .8352090 . . . . . . . . . . . . . . 154,497 313,305 107,944 575,746 .345 .8382095 . . . . . . . . . . . . . . 160,318 322,347 113,948 596,613 .353 .851
High-cost:2020 . . . . . . . . . . . . . . 84,214 195,839 56,061 336,114 .286 .7162025 . . . . . . . . . . . . . . 83,880 197,264 65,488 346,632 .332 .7572030 . . . . . . . . . . . . . . 83,205 199,415 74,020 356,639 .371 .7882035 . . . . . . . . . . . . . . 83,886 201,910 79,627 365,422 .394 .8102040 . . . . . . . . . . . . . . 84,888 204,765 83,088 372,740 .406 .8202045 . . . . . . . . . . . . . . 85,231 207,675 85,695 378,601 .413 .8232050 . . . . . . . . . . . . . . 85,042 209,685 88,707 383,433 .423 .8292055 . . . . . . . . . . . . . . 84,783 210,937 92,238 387,958 .437 .8392060 . . . . . . . . . . . . . . 84,721 211,499 96,424 392,644 .456 .8562065 . . . . . . . . . . . . . . 84,983 212,274 100,254 397,511 .472 .8732070 . . . . . . . . . . . . . . 85,414 212,396 104,395 402,204 .492 .8942075 . . . . . . . . . . . . . . 85,723 211,842 108,830 406,395 .514 .9182080 . . . . . . . . . . . . . . 85,791 212,665 111,500 409,956 .524 .9282085 . . . . . . . . . . . . . . 85,758 213,965 113,339 413,062 .530 .9312090 . . . . . . . . . . . . . . 85,805 214,827 115,298 415,931 .537 .9362095 . . . . . . . . . . . . . . 85,995 215,256 117,390 418,641 .545 .945
a Ratio of the population at ages 65 and over to the population at ages 20-64.b Ratio of the population at ages 65 and over and the population under age 20 to the population atages 20-64.c Estimated, intermediate alternative.
Table V.A3.—Social Security Area Population on July 1 and Dependency Ratios,Calendar Years 1945-2095 (Cont.)
Calendar year
Population (in thousands) Dependency ratio
Under 20 20-6465 and
over Total Ageda Totalb

95
Demographic Assumptions and Methods
• Period life expectancy for a given year uses the actual or expected deathrates at each age for that year. It is a useful summary statistic for illus-trating the overall level of the death rates experienced in a single year.Period life expectancy for a particular year provides an individual’sexpected average remaining lifetime at a selected age, assuming nochange in death rates after that year. Table V.A4 presents historical andprojected life expectancy calculated on a period basis.
• Cohort life expectancy does not use death rates for a single year, but forthe series of years in which the individual will actually reach each suc-ceeding age if he or she survives. Cohort life expectancy provides anindividual’s expected average remaining lifetime at a selected age in agiven year, using actual or expected future death rates. Table V.A5 pres-ents historical and projected life expectancy calculated on a cohortbasis. Cohort life expectancy is somewhat greater than period lifeexpectancy for a given year because: (1) death rates at any age tend todecline over time; and (2) cohort life expectancy uses death rates fromfuture years, while period life expectancy uses death rates only from thegiven year.
Life expectancy at a given age reflects death rates at that and all older ages.Period life expectancy is somewhat related to the age-sex-adjusted death ratediscussed in section V.A.2. However, life expectancy places far greaterweight on death rates at relatively younger ages than those at relatively olderages. Therefore, changes in death rates at younger ages have far greatereffects in changing life expectancy over time. It is important to keep thisconcept in mind when considering trends in life expectancy.

Assumptions and Methods
96
Table V.A4.—Period Life Expectancya
a The period life expectancy at a given age for a given year is the average remaining number of yearsexpected prior to death for a person at that exact age, born on January 1, using the mortality rates for thatyear over the course of his or her remaining life.
Historical data
Calendaryear
At birth At age 65Male Female Male Female
1940 . . . . 61.4 65.7 11.9 13.41945 . . . . 62.9 68.4 12.6 14.41950 . . . . 65.6 71.1 12.8 15.11955 . . . . 66.7 72.8 13.1 15.61960 . . . . 66.7 73.2 12.9 15.91965 . . . . 66.8 73.8 12.9 16.31970 . . . . 67.2 74.9 13.1 17.11975 . . . . 68.7 76.6 13.7 18.01980 . . . . 69.9 77.5 14.0 18.41985 . . . . 71.1 78.2 14.4 18.61990 . . . . 71.8 78.9 15.1 19.11995 . . . . 72.5 79.1 15.4 19.12000 . . . . 74.0 79.4 15.9 19.0
2005 . . . . 74.8 80.0 16.7 19.52006 . . . . 75.1 80.2 17.0 19.72007 . . . . 75.4 80.5 17.2 19.92008 . . . . 75.5 80.5 17.2 19.92009 . . . . 75.9 80.8 17.5 20.22010 . . . . 76.1 80.9 17.6 20.22011 . . . . 76.2 81.0 17.7 20.22012 . . . . 76.3 81.0 17.8 20.32013 . . . . 76.3 81.1 17.8 20.32014 . . . . 76.3 81.1 17.9 20.42015b . . .
b Estimated.
76.2 81.0 17.8 20.42016c . . .
c Estimated, intermediate alternative.
76.7 81.3 18.1 20.62017 c . . . 76.8 81.4 18.2 20.7
Intermediate Low-cost High-cost
Calendaryear
At birth At age 65 At birth At age 65 At birth At age 65Male Female Male Female Male Female Male Female Male Female Male Female
2020 . . . . 77.2 81.7 18.4 20.9 76.8 81.4 18.2 20.6 77.6 82.1 18.7 21.12025 . . . . 77.8 82.2 18.8 21.2 77.1 81.6 18.4 20.8 78.6 82.9 19.3 21.62030 . . . . 78.4 82.7 19.1 21.5 77.4 81.9 18.5 21.0 79.5 83.6 19.8 22.12035 . . . . 79.0 83.2 19.5 21.8 77.7 82.1 18.7 21.1 80.4 84.4 20.4 22.62040 . . . . 79.5 83.6 19.8 22.1 78.0 82.4 18.9 21.3 81.2 85.0 20.8 23.02045 . . . . 80.0 84.1 20.1 22.3 78.3 82.6 19.0 21.4 82.0 85.7 21.3 23.42050 . . . . 80.5 84.5 20.4 22.6 78.6 82.9 19.2 21.6 82.7 86.3 21.7 23.82055 . . . . 81.0 84.9 20.7 22.9 78.8 83.1 19.4 21.7 83.4 86.8 22.1 24.22060 . . . . 81.5 85.3 20.9 23.1 79.1 83.3 19.5 21.8 84.0 87.3 22.5 24.52065 . . . . 81.9 85.6 21.2 23.4 79.4 83.5 19.7 22.0 84.6 87.8 22.9 24.92070 . . . . 82.4 86.0 21.5 23.6 79.6 83.8 19.8 22.1 85.2 88.3 23.3 25.22075 . . . . 82.8 86.3 21.7 23.8 79.9 84.0 20.0 22.3 85.8 88.8 23.6 25.52080 . . . . 83.2 86.7 22.0 24.0 80.2 84.2 20.1 22.4 86.3 89.2 24.0 25.92085 . . . . 83.6 87.0 22.2 24.3 80.4 84.4 20.3 22.5 86.8 89.6 24.3 26.22090 . . . . 84.0 87.3 22.5 24.5 80.7 84.6 20.4 22.6 87.3 90.0 24.6 26.52095 . . . . 84.3 87.6 22.7 24.7 80.9 84.8 20.6 22.8 87.7 90.4 25.0 26.7

97
Demographic Assumptions and Methods
Table V.A5.—Cohort Life Expectancya
a The cohort life expectancy at a given age for a given year is the average remaining number of yearsexpected prior to death for a person at that exact age, born on January 1, using the mortality rates for theseries of years in which the individual will actually reach each succeeding age if he or she survives.
Calendaryear
Intermediate Low-cost High-costAt birth b At age 65 c At birth b
b Cohort life expectancy at birth for those born in the calendar year is based on a combination of actual, esti-mated, and projected death rates for birth years 1940 through 2015. For birth years after 2015, these valuesdepend on estimated and projected death rates.
At age 65 c
c Age 65 cohort life expectancy for those attaining age 65 in calendar years 1940 though 2014 depends onactual death rates or on a combination of actual, estimated, and projected death rates. After 2014, these val-ues depend on estimated and projected death rates.
At birth b At age 65 c
Male Female Male Female Male Female Male Female Male Female Male Female
1940 . . . . 70.4 76.6 12.7 14.7 70.2 76.4 12.7 14.7 70.6 76.8 12.7 14.71945 . . . . 72.2 78.3 13.0 15.4 72.0 78.0 13.0 15.4 72.5 78.6 13.0 15.41950 . . . . 73.4 79.6 13.1 16.2 73.0 79.1 13.1 16.2 73.9 80.1 13.1 16.21955 . . . . 74.0 80.2 13.1 16.7 73.4 79.6 13.1 16.7 74.6 80.9 13.1 16.71960 . . . . 74.7 80.6 13.2 17.4 74.0 79.8 13.2 17.4 75.6 81.5 13.2 17.41965 . . . . 75.6 81.1 13.5 18.0 74.7 80.2 13.5 18.0 76.8 82.2 13.5 18.01970 . . . . 76.9 82.0 13.8 18.5 75.7 80.9 13.8 18.5 78.2 83.3 13.8 18.51975 . . . . 77.8 82.7 14.2 18.7 76.4 81.5 14.2 18.7 79.4 84.2 14.2 18.71980 . . . . 78.6 83.4 14.7 18.8 77.1 81.9 14.7 18.8 80.5 85.1 14.7 18.81985 . . . . 79.3 83.9 15.4 19.1 77.5 82.3 15.4 19.1 81.4 85.8 15.4 19.11990 . . . . 80.0 84.5 16.1 19.4 78.0 82.7 16.0 19.4 82.3 86.5 16.1 19.41995 . . . . 80.8 85.0 16.7 19.8 78.6 83.1 16.7 19.7 83.3 87.2 16.8 19.82000 . . . . 81.3 85.4 17.5 20.2 78.9 83.3 17.4 20.1 84.0 87.8 17.6 20.3
2005 . . . . 81.8 85.8 18.1 20.7 79.2 83.6 17.9 20.4 84.7 88.3 18.3 20.92006 . . . . 81.9 85.9 18.2 20.7 79.3 83.6 18.0 20.5 84.8 88.4 18.5 21.12007 . . . . 82.0 86.0 18.3 20.8 79.3 83.7 18.0 20.5 84.9 88.5 18.6 21.22008 . . . . 82.1 86.1 18.4 20.9 79.4 83.7 18.1 20.6 85.1 88.6 18.7 21.32009 . . . . 82.2 86.1 18.5 21.0 79.5 83.8 18.2 20.6 85.2 88.8 18.8 21.42010 . . . . 82.3 86.2 18.5 21.1 79.5 83.8 18.2 20.7 85.4 88.9 19.0 21.52011 . . . . 82.4 86.3 18.6 21.1 79.6 83.9 18.3 20.7 85.5 89.0 19.1 21.62012 . . . . 82.5 86.4 18.7 21.2 79.7 83.9 18.3 20.8 85.6 89.1 19.2 21.72013 . . . . 82.6 86.5 18.8 21.3 79.7 84.0 18.3 20.8 85.7 89.2 19.3 21.82014 . . . . 82.7 86.5 18.9 21.3 79.8 84.0 18.4 20.9 85.9 89.3 19.4 21.92015 . . . . 82.8 86.6 18.9 21.4 79.8 84.1 18.4 20.9 86.0 89.3 19.6 22.02016 . . . . 82.9 86.7 19.0 21.5 79.9 84.1 18.5 20.9 86.1 89.5 19.7 22.22017 . . . . 83.0 86.8 19.1 21.6 79.9 84.2 18.5 21.0 86.2 89.6 19.8 22.3
2020 . . . . 83.2 87.0 19.3 21.7 80.1 84.3 18.6 21.1 86.6 89.9 20.1 22.62025 . . . . 83.7 87.3 19.6 22.0 80.4 84.5 18.8 21.2 87.2 90.3 20.7 23.02030 . . . . 84.1 87.7 20.0 22.3 80.6 84.7 18.9 21.4 87.7 90.8 21.2 23.52035 . . . . 84.5 88.0 20.3 22.6 80.9 84.9 19.1 21.5 88.2 91.2 21.7 23.92040 . . . . 84.9 88.3 20.6 22.9 81.1 85.1 19.3 21.7 88.7 91.6 22.1 24.32045 . . . . 85.2 88.6 20.9 23.1 81.4 85.3 19.4 21.8 89.2 92.0 22.6 24.72050 . . . . 85.6 88.9 21.2 23.4 81.6 85.5 19.6 22.0 89.7 92.4 23.0 25.12055 . . . . 85.9 89.2 21.4 23.6 81.8 85.7 19.8 22.1 90.1 92.7 23.4 25.42060 . . . . 86.3 89.5 21.7 23.9 82.1 85.9 19.9 22.3 90.5 93.1 23.7 25.82065 . . . . 86.6 89.7 22.0 24.1 82.3 86.1 20.1 22.4 90.9 93.4 24.1 26.12070 . . . . 86.9 90.0 22.2 24.4 82.5 86.3 20.2 22.5 91.3 93.7 24.5 26.42075 . . . . 87.2 90.2 22.5 24.6 82.7 86.4 20.4 22.7 91.7 94.0 24.8 26.72080 . . . . 87.5 90.5 22.7 24.8 82.9 86.6 20.5 22.8 92.0 94.3 25.1 27.02085 . . . . 87.8 90.7 22.9 25.0 83.1 86.8 20.7 22.9 92.4 94.6 25.5 27.32090 . . . . 88.1 91.0 23.2 25.2 83.4 87.0 20.8 23.0 92.7 94.9 25.8 27.62095 . . . . 88.4 91.2 23.4 25.4 83.6 87.1 20.9 23.2 93.0 95.2 26.1 27.9

Assumptions and Methods
98
B. ECONOMIC ASSUMPTIONS AND METHODS
The three alternative sets of economic assumptions provide a reasonablerange for estimating the financial status of the trust funds. The intermediateassumptions reflect the Trustees’ consensus expectation of sustained moder-ate economic growth and their best estimate for other economic parameters.The low-cost assumptions represent a more optimistic outlook: a fasterrecovery, stronger long-term economic growth, and relatively optimistic lev-els for other parameters. The high-cost assumptions represent a more pessi-mistic scenario: weaker economic growth in the near term, interrupted by arecession, slower long-term economic growth, and relatively pessimistic lev-els for other parameters.
Actual economic data were available through the third quarter of 2017 at thetime the assumptions for this report were set. The data indicated that eco-nomic activity peaked in the fourth quarter of 20071 with the level of grossdomestic product (GDP) about 1 percent above the estimated long-term sus-tainable trend level. A severe recession followed, with a low point in the eco-nomic cycle reached in the second quarter of 2009 with GDP about 7 percentbelow the estimated sustainable trend level. The annual growth rate in realGDP has been positive in all years since then, but not as strong as in mostpast recoveries. The Trustees project that the economy will return to its sus-tainable trend level of output within the first 10 years of the projection periodand remain on that trend thereafter. However, the speed of the return variesby alternative. The economy is projected to fully return to its sustainabletrend level of output in 2025 under the intermediate assumptions, three yearslater than in last year’s report, although it is projected to be within 1 percentof the sustainable trend level by 2019. Under the low-cost assumptions, theeconomy is projected to return to its sustainable trend level of output by2022, a year later than in last year’s report. Under the high-cost assumptions,the estimated sustainable trend is lower, and the economy has alreadyreturned to the sustainable trend. However, due to the assumed recession,GDP is projected to drop to 2.5 percent below the trend level in the secondhalf of 2019, and the subsequent recovery is assumed to return GDP to thesustainable trend in 2027. Complete economic cycles have little effect on thelong-range estimates of financial status, so the assumptions do not includecycles beyond the short-range period (2018 through 2027).
The key economic assumptions underlying the three sets of projections of thefuture financial status of the OASI and DI Trust Funds are discussed in theremainder of this section.
1 See www.nber.org/cycles/cyclesmain.html.
99
Economic Assumptions and Methods
1. Productivity AssumptionsTotal U.S. economy productivity is defined as the ratio of real GDP to hoursworked by all workers.1 The rate of change in total-economy productivity isa major determinant of the growth of average earnings. Over the last fivecomplete economic cycles (1966-73, 1973-79, 1979-89, 1989-2000, and2000-07, measured peak to peak), the annual increases in total-economy pro-ductivity averaged 2.28, 1.08, 1.41, 1.79 and 2.12 percent, respectively. Forthe period from 1966 to 2007, covering those last five complete economiccycles, the annual increase in total-economy productivity averaged1.73 percent.
The assumed ultimate annual increases in total-economy productivity are1.98, 1.68, and 1.38 percent for the low-cost, intermediate, and high-costassumptions, respectively.2 These rates of increase are unchanged from the2017 report.
The average annual rate of change in total-economy productivity from 2007(the end of the last complete economic cycle) to 2017 is estimated to be1.00 percent. For the intermediate assumptions, the annual change in produc-tivity is 1.72 percent for 2018, 1.71 percent for 2019, and rises to1.73 percent for 2021, before declining to its ultimate value of 1.68 percentby 2025. For the low-cost assumptions, the annual change in productivity is2.27 percent for 2018, then increases to 2.50 percent for 2019, and graduallyapproaches its ultimate value of 1.98 percent for 2024 and thereafter. For thehigh-cost assumptions, the annual change in productivity is 1.29 percent for2018, 0.19 percent for 2019 due to the assumed recession, rebounds to1.65 percent for 2020, declines to 1.26 percent for 2021, and then averages1.44 for 2022 through 2027, before reaching its ultimate value of1.38 percent after 2027.
2. Price Inflation AssumptionsChanges in the Consumer Price Index for Urban Wage Earners and ClericalWorkers (CPI) directly affect the OASDI program through the automaticcost-of-living benefit increases. Changes in the GDP price index (GDP defla-
1 Historical levels of real GDP are from the Bureau of Economic Analysis’ National Income and ProductAccounts. Historical total hours worked are provided by the Bureau of Labor Statistics and cover all U.S.Armed Forces and civilian employment. 2 These assumptions are consistent with ultimate annual increases in private non-farm business productivityof 2.42, 2.06, and 1.69 percent. Compared to total-economy productivity, private non-farm business produc-tivity is a more widely known concept that excludes the farm, government, non-profit institution, and privatehousehold sectors.

Assumptions and Methods
100
tor) affect the nominal levels of GDP, wages, self-employment income, aver-age earnings, and taxable payroll.
The annual increases in the CPI averaged 4.61, 8.54, 5.31, 2.96, and2.65 percent over the economic cycles 1966-73, 1973-79, 1979-89,1989-2000, and 2000-07, respectively. The annual increases in the GDPdeflator averaged 4.60, 7.52, 4.68, 2.20, and 2.50 percent for the respectiveeconomic cycles. For the period from 1966 to 2007, covering the last fivecomplete economic cycles, the annual increases in the CPI and GDP deflatoraveraged 4.56 and 4.03 percent, respectively. The estimated average annualchange from 2007 (the end of the last complete economic cycle) to 2017 is1.66 percent for the CPI and 1.54 percent for the GDP deflator.
The assumed ultimate annual increases in the CPI are 3.2, 2.6, and2.0 percent for the low-cost, intermediate, and high-cost assumptions,respectively.1 These assumptions are unchanged from the 2017 report. For agiven rate of growth in average real earnings, a higher price inflation rateresults in faster nominal earnings and revenue growth immediately, while theresulting added growth in benefit levels occurs with a delay, causing an over-all improvement in the actuarial balance. Similarly, a lower price inflationrate causes an overall decline in the actuarial balance.
The Federal Reserve Board’s monetary policy changed in the 1980s towardmore vigilance in preventing high inflation. Consistent with the Board’s con-tinued emphasis on containing inflation, as indicated by their current targetfor the Personal Consumption Expenditures (PCE) price index,2 the Trusteeslowered the assumed ultimate annual rate of increase in the CPI for the inter-mediate assumptions from 4.0 percent for the 1996 report to 2.8 percent forthe 2004 through 2013 reports, to 2.7 percent for the 2014 and 2015 reports,and to 2.6 percent for the 2016 through 2018 reports.
For the intermediate assumptions, the annual change in the CPI is2.23 percent for 2018, 2.50 percent for 2019, and reaches the ultimategrowth rate of 2.60 percent for 2020 and later. For the low-cost assumptions,the annual change in the CPI is 2.72 percent for 2018, increases to
1 The Bureau of Labor Statistics (BLS) produces a series called the Consumer Price Index Research SeriesUsing Current Methods (CPI-U-RS) that approximates the measured rate of inflation over the 1978-2017period had the method currently used been in effect since 1978. BLS does not revise the CPI values pub-lished in earlier years, for which different methods were used. These CPI published values are shown intable V.B1. The Trustees use an adjusted CPI series based on the CPI-U-RS when setting the ultimate priceinflation assumption because it provides a time series that is consistent with the current method for comput-ing the CPI. 2 The Trustees’ assumed ultimate annual growth rate for the GDP deflator of 2.2 percent is based on anassumed 2.3 percent annual growth rate for the PCE price index. The Trustees’ assumption takes intoaccount the Federal Open Market Committee (FOMC) target, as well as the potential for inflationary shocksduring the 2027-2092 projection period.

101
Economic Assumptions and Methods
3.26 percent for 2019, declines to 3.22 percent in 2020, and reaches its ulti-mate annual growth rate of 3.20 percent for 2021 and later. For the high-costassumptions, the annual rate of change in the CPI is 1.64 percent for 2018,decreases to 1.49 percent for 2019, rises to 1.92 percent in 2020, and reachesits ultimate annual change of 2.00 percent for 2021 and later.
The annual increase in the GDP deflator differs from the annual increase inthe CPI because the two indices are constructed using different computa-tional methods and coverage. The difference between the rate of change inthe CPI and the rate of change in the GDP deflator is called the price differ-ential in this report. For the period including 1966 through 2007, coveringthe last five complete economic cycles, the average annual price differentialwas 0.54 percentage point. From 2007 (the end of the last complete eco-nomic cycle) to 2017, the average annual price differential is estimated to be0.13 percentage point.
The assumed ultimate price differentials are 0.3, 0.4, and 0.5 percentagepoint for the low-cost, intermediate, and high-cost alternatives, respectively.Varying the ultimate projected price differential across alternatives recog-nizes the historical variation in this measure. Accordingly, the assumed ulti-mate annual increases in the GDP deflator are 2.9 (3.2 less 0.3), 2.2 (2.6 less0.4), and 1.5 (2.0 less 0.5) percent for the low-cost, intermediate, and high-cost alternatives, respectively. The ultimate price differentials for the threealternatives are unchanged from the 2017 report.
The price differential was -0.24 percentage point for 2013, -0.29 for 2014,-1.49 for 2015, -0.30 in 2016, is estimated to be 0.32 in 2017, and is assumedto be 0.26 for 2018. The negative price differential for 2013 through 2016primarily reflects a general decline in oil prices. Changes in oil prices affectthe CPI much more than the GDP deflator because oil represents a muchlarger share of U.S. consumption than of U.S. production. For 2018 and later,oil prices are assumed to grow at a relatively stable rate. For the intermediateassumptions, the price differential is 0.44 percentage point for 2019 and0.40 percentage point for 2020 and later.
3. Average Earnings AssumptionsThe average level of nominal earnings in OASDI covered employment foreach year has a direct effect on the size of the taxable payroll and on thefuture level of average benefits. In addition, under the automatic adjustmentprovisions in the law, growth in the average wage in the U.S. economydirectly affects certain parameters used in the OASDI benefit formulas aswell as the contribution and benefit base, the exempt amounts under the

Assumptions and Methods
102
retirement earnings test, the amount of earnings required for a quarter of cov-erage, and in certain circumstances, the automatic cost-of-living benefitincreases.
Projected growth rates in average covered earnings are derived from projec-tions of the most inclusive measure, average U.S. earnings. Average U.S.earnings is defined as the ratio of the sum of total U.S. wages and net propri-etors’ income to the sum of total U.S. civilian employment and ArmedForces. The growth rate in average U.S. earnings for any period is equal tothe combined growth rates for total U.S. economy productivity, averagehours worked, the ratio of earnings to total compensation (which includesfringe benefits), the ratio of total compensation to GDP, and the GDP defla-tor.
The average annual change in average hours worked was -0.28 percent overthe last five complete economic cycles covering the period from 1966 to2007. The annual change in average hours worked averaged -0.72, -0.54,-0.03, 0.14, and -0.60 percent over the economic cycles 1966-73, 1973-79,1979-89, 1989-2000, and 2000-07, respectively. From 2007 (the end of thelast complete economic cycle) to 2017, the average annual change in averagehours worked is estimated to be -0.07 percent.
The assumed ultimate annual rates of change for average hours worked are0.05, -0.05, and -0.15 percent for the low-cost, intermediate, and high-costassumptions, respectively. These values are unchanged from the 2017 report.
The average annual change in the ratio of earnings to total compensation was-0.20 percent from 1966 to 2007. Most of this decrease was due to the rela-tive increase in the cost of employer-sponsored group health insurance forwage workers. Assuming that the level of total employee compensation isnot affected by the amount of employer-sponsored group health insurance,any increase or decrease in the cost of employer-sponsored group healthinsurance leads to a commensurate decrease or increase in other componentsof employee compensation, including wages. Projections of future ratios ofearnings to total compensation follow this principle. The Trustees assumethat the total amount of future employer-sponsored group health insurancepremiums will increase more slowly than in the past due to provisions of theAffordable Care Act of 2010, as described in the 2010 report. Data from theBureau of Economic Analysis (BEA) indicate that the other significant com-ponent of non-wage employee compensation is employer contributions toretirement plans. This component is assumed to grow faster than employeecompensation in the future as life expectancy and potential time in retirementincrease.
103
Economic Assumptions and Methods
The average annual rates of change in the ratio of wages to employee com-pensation from 2027 to 2092 are about 0.02, -0.08, and -0.18 percent for thelow-cost, intermediate, and high-cost assumptions, respectively. Theseassumed rates are the same as those assumed for the 2017 report. Under theintermediate assumptions, the ratio of wages to employee compensationdeclines from 0.810 for 2017 to 0.767 for 2092. The assumed ultimateannual rate of this decline is 0.08 percent, the same as assumed for last year’sreport, compared with 0.07 percent for the 2016 report, 0.09 percent for the2015 report, 0.13 percent for the 2014 report, and 0.20 percent for the2009 report, prior to enactment of the Affordable Care Act of 2010. The ratioof earnings to compensation includes self-employment income both in thenumerator and in the denominator. As a result, the rate of decline in earningsto compensation (which, under the intermediate assumptions, averages0.06 percent from 2027 to 2092) is less than the rate of decline in wages toemployee compensation.
The ratio of total compensation (i.e., employee compensation and net propri-etors’ income) to GDP varies over the economic cycle and with changes inthe relative sizes of different sectors of the economy. Over the last five eco-nomic cycles from 1966 to 2007, this ratio has averaged 0.627. The ratiodeclined from 0.648 for 2001 to 0.601 in 2010, increased to 0.610 in 2012,and is 0.608 in 2016. This ratio is assumed to rise as the economy recovers,reaching a level of 0.631 for 2027. For years after 2027, relative sizes of dif-ferent sectors of the economy are assumed to remain about constant,1 andtherefore the ratio of total compensation to GDP remains at about the2027 level for each set of assumptions.
The projected average annual growth rate in average nominal U.S. earningsfrom 2027 to 2092 is about 3.80 percent for the intermediate assumptions.This growth rate reflects the average annual growth rate of approximately-0.06 percent for the ratio of earnings to total compensation, and also reflectsthe assumed ultimate annual growth rates of 1.68 percent for productivity,-0.05 percent for average hours worked, and 2.20 percent for the GDP defla-tor. Similarly, the projected average annual growth rates in average nominalU.S. earnings are 5.01 percent for the low-cost assumptions and 2.59 percentfor the high-cost assumptions.
Over long periods, the average annual growth rate in the average wage inOASDI covered employment (henceforth the “average covered wage”) isexpected to be very close to the average annual growth rate in average U.S.
1 However, employment in the uniformed military sector has declined in size over the last 40 years, and isassumed to remain at its 2017 level throughout the 75-year projection period.
Assumptions and Methods
104
earnings. The projected average annual growth rates in the average coveredwage from 2027 to 2092 are 5.02, 3.80, and 2.58 percent for the low-cost,intermediate, and high-cost assumptions, respectively. The estimated annualrate of change in the average covered wage is 2.88 percent for 2017. For theintermediate assumptions, as the economy continues to recover, the annualrate of change in the average covered wage averages 4.27 percent from 2017to 2027. Thereafter, the average annual rate of change in the average coveredwage is 3.80 percent.
4. Assumed Real-Wage DifferentialThe real increase in the average covered wage has traditionally beenexpressed in the form of a real-wage differential—the annual percentagechange in the average covered wage minus the annual percentage change inthe CPI. For the period from 1966 to 2007, covering the last five completeeconomic cycles, the real-wage differential averaged 0.88 percentage point,the result of averages of 1.43, 0.04, 0.48, 1.55, and 0.58 percentage pointsover the economic cycles 1966-73, 1973-79, 1979-89, 1989-2000, and2000-07, respectively.
For the years 2028-92, the projected average annual real-wage differentialsfor OASDI covered employment are 1.82, 1.20, and 0.58 percentage pointsfor the low-cost, intermediate, and high-cost assumptions, respectively. Therounded average annual real-wage differentials are unchanged from the 2017report.
The estimated real-wage differential averaged 0.54 percentage point for 2008through 2017 (the years since the peak of the last complete economic cycle).The real-wage differential decreased from 3.88 percentage points in 2015 to0.00 percentage points in 2016, a decline that reflects higher inflation andslower growth in GDP and productivity. For the intermediate assumptions,the wage differential is projected to rise from 0.75 in 2017 to 1.95 in 2020before gradually declining to its long-run average of 1.20 percentage pointsfor 2028 through 2092. For the low-cost assumptions, the real-wage differen-tial is 2.14 percentage points for 2018, increases to 3.08 percentage points in2020, and gradually declines to its long-run average of 1.82 percentagepoints for 2028 through 2092. For the high-cost assumptions, the real-wagedifferential is 1.36 percentage points for 2018, drops to -1.14 percentagepoints in 2019 due to the assumed recession, and rises to 1.51 percentagepoints in 2022 before gradually declining to its long-run average of0.58 percentage point for 2028 through 2092.

105
Economic Assumptions and Methods
Table V.B1.—Principal Economic Assumptions
Calendar year
Annual percentage changea in—Real-wage
differ-entialb
Productivity(Total U.S.economy)
Earnings asa percent of
compensation
Averagehours
worked
GDPpriceindex
Averageannual wage
in coveredemployment
ConsumerPriceIndex
Historical data:5-year periods:
1960 to 1965 . . . 3.28 -0.18 0.15 1.36 3.22 1.24 1.981965 to 1970 . . . 2.07 -.31 -.68 4.03 5.84 4.23 1.611970 to 1975 . . . 2.08 -.50 -.88 6.60 6.58 6.76 -.221975 to 1980 . . . .95 -.32 -.17 7.19 8.89 8.91 -.041980 to 1985 . . . 1.75 -.33 .01 5.21 6.52 5.22 1.291985 to 1990 . . . 1.36 -.19 -.06 3.11 4.79 3.83 .961990 to 1995 . . . 1.33 -.11 .33 2.44 3.54 3.03 .511995 to 2000 . . . 2.31 .28 .14 1.67 5.30 2.43 2.882000 to 2005 . . . 2.62 -.41 -.79 2.35 2.68 2.49 .192005 to 2010 . . . 1.61 -.08 -.47 1.93 2.50 2.30 .222010 to 2015 . . . .48 .20 .37 1.68 2.96 1.61 1.34
Economic cycles:c
1966 to 1973 . . . 2.28 -.29 -.72 4.60 6.05 4.61 1.431973 to 1979 . . . 1.08 -.43 -.54 7.52 8.58 8.54 .041979 to 1989 . . . 1.41 -.28 -.03 4.68 5.83 5.31 .481989 to 2000 . . . 1.79 .05 .14 2.20 4.50 2.96 1.552000 to 2007 . . . 2.12 -.23 -.60 2.50 3.22 2.65 .582007 to 2017 . . . 1.00 .03 -.07 1.54 2.20 1.66 .54
Single years:2007 . . . . . . . . . . .96 -.05 -.29 2.67 4.50 2.88 1.622008 . . . . . . . . . . .91 -.06 -.75 1.93 2.42 4.09 -1.672009 . . . . . . . . . . 2.88 -.66 -1.86 .79 -1.56 -.67 -.892010 . . . . . . . . . . 2.55 -.10 .56 1.23 2.59 2.07 .532011 . . . . . . . . . . .10 .28 .93 2.06 3.14 3.56 -.422012 . . . . . . . . . . .46 .40 -.04 1.84 3.32 2.10 1.222013 . . . . . . . . . . .43 .01 .25 1.61 1.20 1.37 -.172014 . . . . . . . . . . .68 .25 .26 1.80 3.70 1.50 2.202015 . . . . . . . . . . .74 .07 .43 1.08 3.46 -.41 3.882016 . . . . . . . . . . .18 .06 -.40 1.28 .97 .98 d
2017e . . . . . . . . . 1.10 .02 -.07 1.81 2.88 2.13 .75
Intermediate: 2018 . . . . . . . . . . 1.72 .03 -.06 1.97 3.82 2.23 1.592019 . . . . . . . . . . 1.71 -.03 .01 2.06 4.23 2.50 1.732020 . . . . . . . . . . 1.72 .04 .01 2.20 4.55 2.60 1.952021 . . . . . . . . . . 1.73 .03 d 2.20 4.52 2.60 1.922022 . . . . . . . . . . 1.72 -.06 d 2.20 4.43 2.60 1.832023 . . . . . . . . . . 1.72 -.07 d 2.20 4.38 2.60 1.782024 . . . . . . . . . . 1.71 -.11 -.01 2.20 4.33 2.60 1.732025 . . . . . . . . . . 1.68 -.09 -.03 2.20 4.26 2.60 1.662026 . . . . . . . . . . 1.68 -.08 -.05 2.20 4.20 2.60 1.602027 . . . . . . . . . . 1.68 -.06 -.05 2.20 3.97 2.60 1.37
2027 to 2092 . . . 1.68 -.06 -.05 2.20 3.80 2.60 1.20
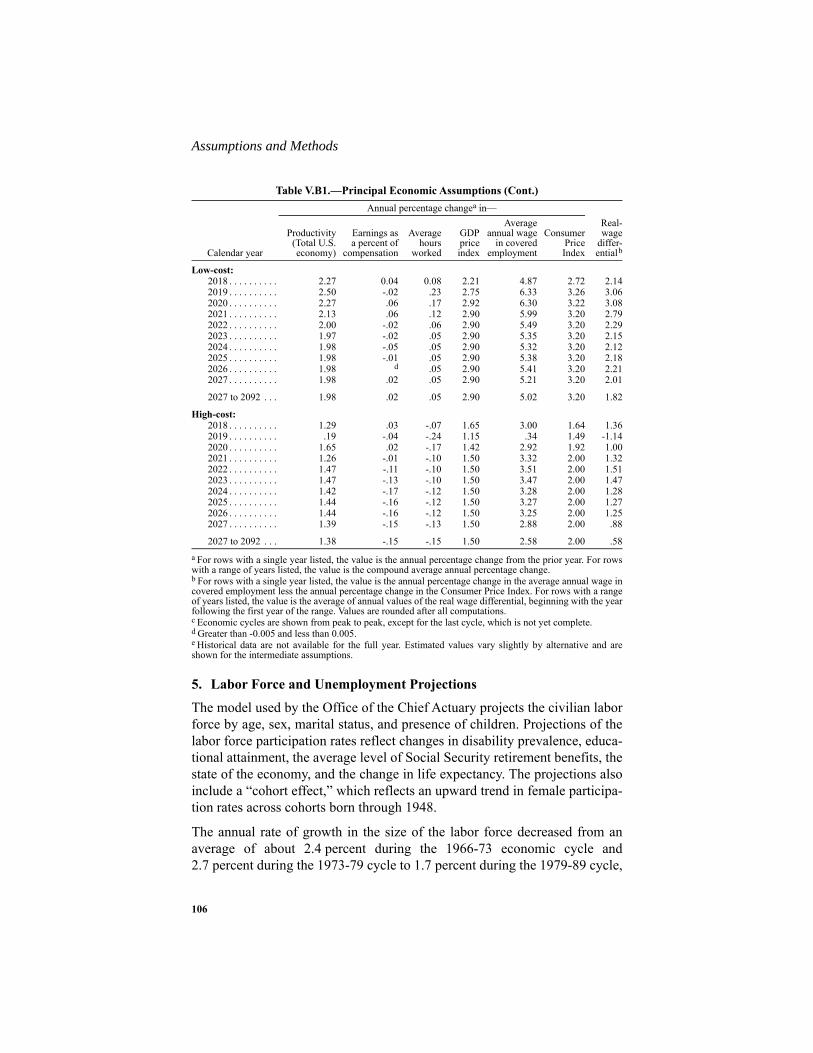
Assumptions and Methods
106
5. Labor Force and Unemployment ProjectionsThe model used by the Office of the Chief Actuary projects the civilian laborforce by age, sex, marital status, and presence of children. Projections of thelabor force participation rates reflect changes in disability prevalence, educa-tional attainment, the average level of Social Security retirement benefits, thestate of the economy, and the change in life expectancy. The projections alsoinclude a “cohort effect,” which reflects an upward trend in female participa-tion rates across cohorts born through 1948.
The annual rate of growth in the size of the labor force decreased from anaverage of about 2.4 percent during the 1966-73 economic cycle and2.7 percent during the 1973-79 cycle to 1.7 percent during the 1979-89 cycle,
Low-cost: 2018 . . . . . . . . . . 2.27 0.04 0.08 2.21 4.87 2.72 2.142019 . . . . . . . . . . 2.50 -.02 .23 2.75 6.33 3.26 3.062020 . . . . . . . . . . 2.27 .06 .17 2.92 6.30 3.22 3.082021 . . . . . . . . . . 2.13 .06 .12 2.90 5.99 3.20 2.792022 . . . . . . . . . . 2.00 -.02 .06 2.90 5.49 3.20 2.292023 . . . . . . . . . . 1.97 -.02 .05 2.90 5.35 3.20 2.152024 . . . . . . . . . . 1.98 -.05 .05 2.90 5.32 3.20 2.122025 . . . . . . . . . . 1.98 -.01 .05 2.90 5.38 3.20 2.182026 . . . . . . . . . . 1.98 d .05 2.90 5.41 3.20 2.212027 . . . . . . . . . . 1.98 .02 .05 2.90 5.21 3.20 2.01
2027 to 2092 . . . 1.98 .02 .05 2.90 5.02 3.20 1.82
High-cost: 2018 . . . . . . . . . . 1.29 .03 -.07 1.65 3.00 1.64 1.362019 . . . . . . . . . . .19 -.04 -.24 1.15 .34 1.49 -1.142020 . . . . . . . . . . 1.65 .02 -.17 1.42 2.92 1.92 1.002021 . . . . . . . . . . 1.26 -.01 -.10 1.50 3.32 2.00 1.322022 . . . . . . . . . . 1.47 -.11 -.10 1.50 3.51 2.00 1.512023 . . . . . . . . . . 1.47 -.13 -.10 1.50 3.47 2.00 1.472024 . . . . . . . . . . 1.42 -.17 -.12 1.50 3.28 2.00 1.282025 . . . . . . . . . . 1.44 -.16 -.12 1.50 3.27 2.00 1.272026 . . . . . . . . . . 1.44 -.16 -.12 1.50 3.25 2.00 1.252027 . . . . . . . . . . 1.39 -.15 -.13 1.50 2.88 2.00 .88
2027 to 2092 . . . 1.38 -.15 -.15 1.50 2.58 2.00 .58a For rows with a single year listed, the value is the annual percentage change from the prior year. For rowswith a range of years listed, the value is the compound average annual percentage change.b For rows with a single year listed, the value is the annual percentage change in the average annual wage incovered employment less the annual percentage change in the Consumer Price Index. For rows with a rangeof years listed, the value is the average of annual values of the real wage differential, beginning with the yearfollowing the first year of the range. Values are rounded after all computations.c Economic cycles are shown from peak to peak, except for the last cycle, which is not yet complete.d Greater than -0.005 and less than 0.005.e Historical data are not available for the full year. Estimated values vary slightly by alternative and areshown for the intermediate assumptions.
Table V.B1.—Principal Economic Assumptions (Cont.)
Calendar year
Annual percentage changea in—Real-wage
differ-entialb
Productivity(Total U.S.economy)
Earnings asa percent of
compensation
Averagehours
worked
GDPpriceindex
Averageannual wage
in coveredemployment
ConsumerPriceIndex
107
Economic Assumptions and Methods
1.3 percent during the 1989-2000 cycle, and 1.0 percent during the2000-07 cycle. Further slowing of labor force growth is expected to followfrom a substantial slowing of growth in the working age population in thefuture—a consequence of the baby-boom generation reaching retirementages and succeeding lower-birth-rate cohorts reaching working ages. Underthe intermediate assumptions, the labor force is projected to increase by anaverage of 0.9 percent per year from 2017 to 2027 and 0.5 percent per yearover the remainder of the 75-year projection period.
Labor force participation rates are projected with a model that uses demo-graphic and economic assumptions specific to each alternative. More opti-mistic economic assumptions in the low-cost alternative are consistent withhigher labor force participation rates, while demographic assumptions in thelow-cost alternative (such as slower improvement in longevity) are consis-tent with lower labor force participation rates. These economic and demo-graphic influences have largely offsetting effects. Therefore, the projectedlabor force participation rates do not vary substantially across alternatives.
Historically, labor force participation rates reflect trends in demographicsand pensions. Between the mid-1960s and the mid-1980s, labor force partici-pation rates at ages 50 and over declined for males but were fairly stable forfemales. During this period, the baby-boom generation reached working ageand more women entered the labor force. This increasing supply of laborallowed employers to offer attractive early retirement options. Between themid-1980s and the mid-1990s, participation rates at ages 55 and olderroughly stabilized for males and increased for females. Since the mid-1990s,however, participation rates for both sexes at ages 50 and over have gener-ally risen.
Many economic and demographic factors, including longevity, health, dis-ability prevalence, the business cycle, incentives for retirement in SocialSecurity and private pensions, education, and marriage patterns, will influ-ence future labor force participation rates. The Office of the Chief Actuarymodels some of these factors explicitly. To model the effects of other factorsrelated to increases in life expectancy, projected participation rates areadjusted upward for mid-career and older ages to reflect projected increasesin life expectancy. For the intermediate projections, this adjustment increasesthe total labor force by 2.8 percent for 2092.
For men age 16 and over, the projected age-adjusted labor force participationrates1 for 2092 are 73.1, 73.2, and 73.1 percent for the low-cost, intermedi-
1 The Office of the Chief Actuary adjusts the labor force participation rates to the 2011 age distribution ofthe civilian noninstitutional U.S. population.

Assumptions and Methods
108
ate, and high-cost assumptions, respectively. The low-cost assumptions resultin a larger working-age population and a larger labor force when comparedto the intermediate assumptions, but a slightly lower labor force participationrate for men. This occurs because the low-cost assumptions include shorterlife expectancies and relatively higher numbers of never-married individualsin the population. Shorter life expectancies tend to reduce work at older ages,while labor force participation rates tend to be lower for never-married menand higher for never-married women compared to their married counter-parts.1 For women age 16 and over, the projected age-adjusted labor forceparticipation rates for 2092 are 62.0, 61.4, and 60.5 percent for the low-cost,intermediate, and high-cost assumptions, respectively.
The age-adjusted rates for 2092 are higher under all three alternatives thanthe age-adjusted rates for 2016 of 70.5 percent for men and 58.0 percent forwomen (based on actual age-specific rates published by the Bureau of LaborStatistics), primarily due to the Trustees’ projected increases in life expec-tancy. In the first ten years of the projection period, the assumed labor forceparticipation rates increase as the economic recovery draws more people intothe labor force. Increasing disability prevalence rates offset these increasessomewhat in the intermediate and high-cost assumptions, but a decrease indisability prevalence further contributes to increases in labor force participa-tion in the low-cost assumptions.
The total civilian unemployment rates are presented in table V.B2. For yearsthrough 2027, the table presents total civilian rates without adjustment forthe changing age-sex distribution of the population. For years after 2027, thetable presents age-sex-adjusted rates, using the age-sex distribution of the2011 civilian labor force. Age-sex-adjusted rates allow for more meaningfulcomparisons across longer time periods.
The total civilian unemployment rate reflects the projected levels of unem-ployment for various age-sex groups of the population. Each group’s unem-ployment rate is projected in relation to changes in the economic cycle, asmeasured by the ratio of actual to potential GDP.2 For each alternative, thetotal civilian unemployment rate moves toward the ultimate assumed rate asthe economy moves toward the long-range sustainable growth path.
The assumed ultimate age-sex-adjusted unemployment rates are 4.5, 5.5, and6.5 percent for the low-cost, intermediate, and high-cost assumptions,
1 The high-cost labor force participation rate is also lower than the intermediate because life expectancy hasa non-linear effect on labor force participation rates in the Office of the Chief Actuary’s model. 2 Potential GDP is the level of GDP assuming the economy is operating at the underlying sustainable trendrate of growth.
109
Economic Assumptions and Methods
respectively. These values are unchanged from the 2017 report. Improve-ments in labor market conditions will eventually draw more nonparticipantsback into the labor force and unemployment rate will increase from an esti-mated 4.4 percent for 2017 to the assumed 5.5 percent for 2021 under theintermediate assumptions. Under the low-cost assumptions, the ultimateunemployment rate is reached in 2020.1 Under the high-cost assumptions,the ultimate unemployment rate is reached in 2026.
6. Gross Domestic Product ProjectionsThe value of real GDP equals the product of three components: (1) averageweekly total employment,2 (2) productivity, and (3) average hours workedper week. Consequently, the growth rate in real GDP is approximately equalto the sum of the growth rates for total employment, productivity, and aver-age hours worked. For the period from 1966 to 2007, which covers the lastfive complete economic cycles, the average growth rate in real GDP was3.1 percent. This average growth rate approximately equals the sum of theaverage growth rates of 1.6 percent for total employment, 1.7 percent forproductivity, and -0.3 percent for average hours worked. The real GDP for2016 was 12.4 percent above the 2007 level. The estimated real GDP growthfrom 2016 to 2017 is 2.2 percent.
For the intermediate assumptions, the average annual growth in real GDP is2.4 percent from 2017 to 2027, the approximate sum of component growthrates of 0.7 percent for total employment, 1.7 percent for productivity, and-0.02 percent for average hours worked. The projected average annualgrowth in real GDP of 2.4 percent for this period is approximately0.2 percentage point higher than the underlying sustainable trend rate. Thisgrowth of 0.2 percentage point above trend reflects a relatively rapidincrease in employment and total economy productivity, and a relativelyslow decline in average hours worked, as the economy recovers. After 2027,the assumptions do not explicitly reflect economic cycles. The projectedannual growth rate in real GDP combines the projected growth rates for totalemployment, total U.S. economy productivity, and average hours worked.After 2027, the annual growth in real GDP averages 2.1 percent, based onthe projected average annual growth rate of 0.5 percent for total employmentand the assumed ultimate growth rates of 1.7 percent for productivity and-0.05 percent for average hours worked. The projected growth rate of real
1 The assumed ultimate unemployment rate is an age-sex-adjusted rate. 2 Total employment is the sum of the U.S. Armed Forces and total civilian employment, which depends onthe total civilian labor force and unemployment rate.
Assumptions and Methods
110
GDP is slower than the past average growth rate mainly because the work-ing-age population is expected to grow more slowly than in the past.
For the low-cost assumptions, the annual growth in real GDP averages3.2 percent over the decade ending in 2027. The relatively fast growth is duemostly to high assumed rates of growth for employment and worker produc-tivity. For the high-cost assumptions, the annual growth in real GDP aver-ages 1.6 percent for the decade ending in 2027.
7. Interest RatesTable V.B2 presents average annual nominal and real interest rates for newlyissued trust fund securities. The nominal rate is the average of the nominalinterest rates for special U.S. Government obligations issuable to the trustfunds in each of the 12 months of the year. Interest for these securities is gen-erally compounded semiannually. The real interest rate is defined as theannual yield rate for investments in these securities divided by the annualrate of growth in the CPI for the first year after issuance. The real rate shownfor each year reflects the actual realized (historical) or expected (future) realyield on securities issuable in the prior year.
To develop a reasonable range of assumed ultimate future real interest ratesfor the three alternatives, the Office of the Chief Actuary examined historicalexperience for the last five complete economic cycles. For the period from1966 to 2007, the real interest rate averaged 2.8 percent per year. The realinterest rates averaged 1.3, -1.0, 5.2, 4.0, and 2.2 percent per year over theeconomic cycles 1966-73, 1973-79, 1979-89, 1989-2000, and 2000-07,respectively. The assumed ultimate real interest rates are 3.2 percent,2.7 percent, and 2.2 percent for the low-cost, intermediate, and high-costassumptions, respectively. These rates are the same as in the 2017 report.
The actual average annual nominal interest rate was approximately1.8 percent for 2016, which means that securities newly issued in 2016would yield 1.8 percent if held one year. Estimated average prices rose from2016 to 2017 by approximately 2.1 percent. The annual real interest rate for2017 is -0.3 percent, the approximate difference between the nominal interestrate and the rate of price increase. For the 10-year short-range projectionperiod, projected nominal interest rates depend on changes in the economiccycle and in the CPI. When combined with the ultimate CPI assumptions of3.2, 2.6, and 2.0 percent, the assumed ultimate real interest rates produceultimate nominal interest rates of 6.4 percent for the low-cost assumptions,5.3 percent for the intermediate assumptions, and 4.2 percent for the high-cost assumptions. These nominal rates for newly issued trust fund securitiesreach their ultimate levels by 2027, the end of the short-range period.

111
Economic Assumptions and Methods
Table V.B2.—Additional Economic Factors
Calendar year
Average annualunemployment
ratea
Annual percentage changeb in— Average annual interest rateLaborforcec
Totalemploymentd
RealGDPe Nominalf Realg
Historical data:5-year periods:1960 to 1965. . . . . 5.5 1.3 1.6 5.0 4.0 2.51965 to 1970. . . . . 3.9 2.2 2.1 3.5 5.9 1.01970 to 1975. . . . . 6.1 2.5 1.5 2.7 6.7 h
1975 to 1980. . . . . 6.8 2.7 2.9 3.7 8.5 -.91980 to 1985. . . . . 8.3 1.5 1.5 3.3 12.1 6.91985 to 1990. . . . . 5.9 1.7 2.0 3.4 8.5 5.11990 to 1995. . . . . 6.6 1.0 .9 2.6 7.0 4.31995 to 2000. . . . . 4.6 1.5 1.8 4.3 6.2 3.92000 to 2005. . . . . 5.4 .9 .7 2.5 4.6 2.42005 to 2010. . . . . 6.8 .6 -.4 .8 3.8 1.82010 to 2015. . . . . 7.2 .4 1.3 2.2 2.0 .5
Economic cycles: i
1966 to 1973. . . . . 4.6 2.4 2.0 3.6 6.1 1.31973 to 1979. . . . . 6.8 2.7 2.4 3.0 7.7 -1.01979 to 1989. . . . . 7.3 1.7 1.7 3.1 10.5 5.21989 to 2000. . . . . 5.6 1.3 1.3 3.3 6.8 4.02000 to 2007. . . . . 5.2 1.0 .9 2.4 4.6 2.22007 to 2017. . . . . 7.0 .5 .5 1.4 2.3 .9
Single years:2007 . . . . . . . . . . . 4.6 1.1 1.1 1.8 4.7 1.92008 . . . . . . . . . . . 5.8 .8 -.4 -.3 3.6 .62009 . . . . . . . . . . . 9.3 -.1 -3.7 -2.8 2.9 4.42010 . . . . . . . . . . . 9.6 -.2 -.6 2.5 2.8 .92011 . . . . . . . . . . . 8.9 -.2 .6 1.6 2.4 -.72012 . . . . . . . . . . . 8.1 .9 1.8 2.2 1.5 .32013 . . . . . . . . . . . 7.4 .3 1.0 1.7 1.9 .12014 . . . . . . . . . . . 6.2 .3 1.6 2.6 2.3 .42015 . . . . . . . . . . . 5.3 .8 1.7 2.9 2.0 2.72016 . . . . . . . . . . . 4.9 1.3 1.7 1.5 1.8 1.02017j. . . . . . . . . . . 4.4 .7 1.2 2.2 2.3 -.3
Assumptions and Methods
112
Intermediate:2018 . . . . . . . . . . . 4.4 1.1 1.1 2.7 2.7 0.12019 . . . . . . . . . . . 4.9 1.3 .9 2.6 3.4 .22020 . . . . . . . . . . . 5.3 1.3 .8 2.6 3.9 .82021 . . . . . . . . . . . 5.5 1.0 .7 2.5 4.3 1.32022 . . . . . . . . . . . 5.5 .7 .7 2.4 4.6 1.72023 . . . . . . . . . . . 5.5 .7 .7 2.4 4.9 2.02024 . . . . . . . . . . . 5.5 .7 .7 2.4 5.1 2.32025 . . . . . . . . . . . 5.5 .6 .6 2.3 5.2 2.52026 . . . . . . . . . . . 5.5 .6 .6 2.2 5.3 2.62027 . . . . . . . . . . . 5.5 .6 .6 2.2 5.3 2.72030 . . . . . . . . . . . 5.5 .5 .5 2.1 5.3 2.72035 . . . . . . . . . . . 5.5 .4 .4 2.1 5.3 2.72040 . . . . . . . . . . . 5.5 .5 .5 2.1 5.3 2.72045 . . . . . . . . . . . 5.5 .5 .5 2.2 5.3 2.72050 . . . . . . . . . . . 5.5 .5 .5 2.1 5.3 2.72055 . . . . . . . . . . . 5.5 .5 .5 2.1 5.3 2.72060 . . . . . . . . . . . 5.5 .4 .4 2.1 5.3 2.72065 . . . . . . . . . . . 5.5 .4 .4 2.0 5.3 2.72070 . . . . . . . . . . . 5.5 .4 .4 2.1 5.3 2.72075 . . . . . . . . . . . 5.5 .5 .5 2.1 5.3 2.72080 . . . . . . . . . . . 5.5 .5 .5 2.1 5.3 2.72085 . . . . . . . . . . . 5.5 .5 .5 2.1 5.3 2.72090 . . . . . . . . . . . 5.5 .4 .4 2.1 5.3 2.72095 . . . . . . . . . . . 5.5 .4 .4 2.0 5.3 2.7
Low-cost:2018 . . . . . . . . . . . 4.1 1.1 1.5 3.9 3.5 -.42019 . . . . . . . . . . . 4.2 1.7 1.5 4.3 4.8 .32020 . . . . . . . . . . . 4.5 1.5 1.3 3.8 5.1 1.62021 . . . . . . . . . . . 4.6 1.0 .9 3.2 5.4 1.92022 . . . . . . . . . . . 4.6 .9 .9 3.0 5.6 2.22023 . . . . . . . . . . . 4.6 .8 .8 2.9 5.8 2.42024 . . . . . . . . . . . 4.6 .9 .9 2.9 6.1 2.62025 . . . . . . . . . . . 4.6 .8 .8 2.8 6.2 2.92026 . . . . . . . . . . . 4.6 .7 .7 2.7 6.4 3.02027 . . . . . . . . . . . 4.6 .7 .7 2.7 6.4 3.22030 . . . . . . . . . . . 4.5 .6 .6 2.6 6.4 3.22035 . . . . . . . . . . . 4.5 .6 .6 2.6 6.4 3.22040 . . . . . . . . . . . 4.5 .6 .6 2.7 6.4 3.22045 . . . . . . . . . . . 4.5 .8 .8 2.8 6.4 3.22050 . . . . . . . . . . . 4.5 .8 .8 2.8 6.4 3.22055 . . . . . . . . . . . 4.5 .7 .7 2.7 6.4 3.22060 . . . . . . . . . . . 4.5 .7 .7 2.7 6.4 3.22065 . . . . . . . . . . . 4.5 .7 .7 2.7 6.4 3.22070 . . . . . . . . . . . 4.5 .7 .7 2.7 6.4 3.22075 . . . . . . . . . . . 4.5 .8 .8 2.8 6.4 3.22080 . . . . . . . . . . . 4.5 .8 .8 2.8 6.4 3.22085 . . . . . . . . . . . 4.5 .8 .8 2.8 6.4 3.22090 . . . . . . . . . . . 4.5 .7 .7 2.7 6.4 3.22095 . . . . . . . . . . . 4.5 .7 .7 2.7 6.4 3.2
Table V.B2.—Additional Economic Factors (Cont.)
Calendar year
Average annualunemployment
ratea
Annual percentage changeb in— Average annual interest rateLaborforcec
Totalemploymentd
RealGDPe Nominalf Realg
113
Economic Assumptions and Methods
High-cost:2018 . . . . . . . . . . . 4.5 1.0 0.9 2.2 2.1 0.72019 . . . . . . . . . . . 6.4 1.1 -.8 -.9 1.6 .72020 . . . . . . . . . . . 7.0 .6 h 1.5 2.7 -.32021 . . . . . . . . . . . 6.9 .8 .9 2.0 3.4 .72022 . . . . . . . . . . . 6.8 .5 .6 2.0 3.7 1.42023 . . . . . . . . . . . 6.8 .5 .6 1.9 3.9 1.72024 . . . . . . . . . . . 6.7 .5 .6 1.9 4.0 1.92025 . . . . . . . . . . . 6.6 .5 .6 1.9 4.1 2.02026 . . . . . . . . . . . 6.5 .5 .6 1.9 4.3 2.12027 . . . . . . . . . . . 6.5 .5 .5 1.8 4.2 2.32030 . . . . . . . . . . . 6.5 .4 .4 1.6 4.2 2.22035 . . . . . . . . . . . 6.5 .3 .3 1.6 4.2 2.22040 . . . . . . . . . . . 6.5 .3 .3 1.5 4.2 2.22045 . . . . . . . . . . . 6.5 .3 .3 1.5 4.2 2.22050 . . . . . . . . . . . 6.5 .2 .2 1.5 4.2 2.22055 . . . . . . . . . . . 6.5 .2 .2 1.4 4.2 2.22060 . . . . . . . . . . . 6.5 .2 .2 1.4 4.2 2.22065 . . . . . . . . . . . 6.5 .1 .1 1.3 4.2 2.22070 . . . . . . . . . . . 6.5 .1 .1 1.3 4.2 2.22075 . . . . . . . . . . . 6.5 .1 .1 1.3 4.2 2.22080 . . . . . . . . . . . 6.5 .1 .1 1.3 4.2 2.22085 . . . . . . . . . . . 6.5 .1 .1 1.4 4.2 2.22090 . . . . . . . . . . . 6.5 .1 .1 1.3 4.2 2.22095 . . . . . . . . . . . 6.5 .1 .1 1.3 4.2 2.2
a The Office of the Chief Actuary adjusts the civilian unemployment rates for 2028 and later to the age-sexdistribution of the civilian labor force in 2011. For years through 2027, the values are the total rates withoutadjustment for the changing age-sex distribution.b For rows with a single year listed, the value is the annual percentage change from the prior year. For rowswith a range of years listed, the value is the compounded average annual percentage change.c The U.S. civilian labor force.d Total U.S. military and civilian employment.e The value of the total output of goods and services in 2009 dollars.f The average of the nominal interest rates, compounded semiannually, for special public-debt obligationsissuable to the trust funds in each of the 12 months of the year.g The realized or expected annual real yield for each year on securities issuable in the prior year.h Greater than -0.05 and less than 0.05 percent.i Economic cycles are shown from peak to peak, except for the last cycle, which is not yet complete.j Historical data are not available for the full year. Estimated values vary slightly by alternative and are shownfor the intermediate assumptions.
Table V.B2.—Additional Economic Factors (Cont.)
Calendar year
Average annualunemployment
ratea
Annual percentage changeb in— Average annual interest rateLaborforcec
Totalemploymentd
RealGDPe Nominalf Realg
Assumptions and Methods
114
C. PROGRAM-SPECIFIC ASSUMPTIONS AND METHODS
The Office of the Chief Actuary at the Social Security Administration uses aset of models to project future income and cost under the OASDI program.These models rely not only on the demographic and economic assumptionsdescribed in the previous sections, but also on a number of program-specificassumptions and methods. Values of many program parameters change fromyear to year as prescribed by formulas set out in the Social Security Act.These program parameters affect the level of payroll taxes collected and thelevel of benefits paid. The office uses more complex models to project thenumbers of future workers covered under OASDI and the levels of their cov-ered earnings, as well as the numbers of future beneficiaries and the expectedlevels of their benefits. The following subsections provide descriptions ofthese program-specific assumptions and methods.
1. Automatically Adjusted Program ParametersThe Social Security Act requires that certain parameters affecting the deter-mination of OASDI benefits and taxes be adjusted annually to reflectchanges in particular economic measures. Formulas prescribed in the law,applied to reported statistics, change these program parameters annually. Thelaw bases these automatic adjustments on measured changes in the nationalaverage wage index (AWI) and the Consumer Price Index for Urban WageEarners and Clerical Workers (CPI).1 This section shows values for programparameters adjusted using these indices from the time that these adjustmentsbecame effective through 2027. Projected values for future years depend onthe economic assumptions described in the preceding section of this report.
Tables V.C1 and V.C2 present the historical and projected values of the CPI-based benefit increases, the AWI series, and the values of many of the wage-indexed program parameters. Each table shows projections under the threealternative sets of economic assumptions. Table V.C1 includes:
• The annual cost-of-living benefit increase percentages. The automaticcost-of-living adjustment provisions in the Social Security Act specifyincreases in OASDI benefits based on increases in the CPI. Volatility inoil prices has resulted in substantial volatility in recent cost-of-livingadjustments. A large cost-of-living adjustment for December 2008 wasfollowed by no cost-of-living adjustments for December 2009 andDecember 2010. More recent volatility in oil prices again affected the
1 The Federal Register publishes details of these indexation procedures annually. Also seewww.ssa.gov/OACT/COLA/.
115
Program Assumptions and Methods
CPI, resulting in no cost-of-living adjustment for December 2015. Cost-of-living adjustments resumed in December 2016. All three sets ofassumptions include annual cost-of-living adjustments for all futureyears.
• The annual levels of and percentage increases in the AWI. Under sec-tion 215(b)(3) of the Social Security Act, Social Security benefit com-putations index taxable earnings (for most workers first becomingeligible for benefits in 1979 or later) using the AWI for each year after1950. This procedure converts a worker’s past earnings to approxi-mately average-wage-indexed equivalent values near the time of his orher benefit eligibility. Other program parameters presented in this sec-tion that are subject to the automatic-adjustment provisions also rely onthe AWI.
• The wage-indexed contribution and benefit base. For any year, the con-tribution and benefit base is the maximum amount of earnings subject tothe OASDI payroll tax and creditable toward benefit computation. TheSocial Security Act defers any increase in the contribution and benefitbase if there is no cost-of-living adjustment effective for December ofthe preceding year. There was no increase in the contribution and bene-fit base for 2010, 2011, or 2016 because there was no cost-of-livingadjustment for the immediate prior December in each case. Under allthree sets of assumptions, the contribution and benefit base is projectedto increase for all future years.
• The wage-indexed retirement earnings test exempt amounts. Theexempt amounts are the annual amount of earnings below which benefi-ciaries do not have benefits withheld. A lower exempt amount appliesfor years prior to the year of attaining normal retirement age. A higherexempt amount applies beginning with the year in which a beneficiaryattains normal retirement age. Starting in 2000, the retirement earningstest no longer applies beginning with the month of attaining normalretirement age. The Social Security Act defers any increase in theseexempt amounts if there is no cost-of-living adjustment effective forDecember of the preceding year. There was no increase in these exemptamounts for 2010, 2011, or 2016 because there was no cost-of-livingadjustment for the immediate prior December. Under all three sets ofassumptions, the exempt amounts increase for all future years.
Assumptions and Methods
116
Table V.C1.—Cost-of-Living Benefit Increases, Average Wage Index, Contribution and Benefit Bases, and Retirement Earnings Test Exempt Amounts, 1975-2027
Calendar year
Cost-of-livingbenefit
increasea(percent)
Averagewage index (AWI) b Contribution
and benefitbase c
Retirement earningstest exempt amount
AmountIncrease
(percent)UnderNRAd At NRAe
Historical data:1975 . . . . . . . . . . . 8.0 $8,630.92 7.5 $14,100 $2,520 $2,5201976 . . . . . . . . . . . 6.4 9,226.48 6.9 15,300 2,760 2,7601977 . . . . . . . . . . . 5.9 9,779.44 6.0 16,500 3,000 3,0001978 . . . . . . . . . . . 6.5 10,556.03 7.9 17,700 3,240 4,0001979 . . . . . . . . . . . 9.9 11,479.46 8.7 22,900 3,480 4,5001980 . . . . . . . . . . . 14.3 12,513.46 9.0 25,900 3,720 5,0001981 . . . . . . . . . . . 11.2 13,773.10 10.1 29,700 4,080 5,5001982 . . . . . . . . . . . 7.4 14,531.34 5.5 32,400 4,440 6,0001983 . . . . . . . . . . . 3.5 15,239.24 4.9 35,700 4,920 6,6001984 . . . . . . . . . . . 3.5 16,135.07 5.9 37,800 5,160 6,9601985 . . . . . . . . . . . 3.1 16,822.51 4.3 39,600 5,400 7,3201986 . . . . . . . . . . . 1.3 17,321.82 3.0 42,000 5,760 7,8001987 . . . . . . . . . . . 4.2 18,426.51 6.4 43,800 6,000 8,1601988 . . . . . . . . . . . 4.0 19,334.04 4.9 45,000 6,120 8,4001989 . . . . . . . . . . . 4.7 20,099.55 4.0 48,000 6,480 8,8801990 . . . . . . . . . . . 5.4 21,027.98 4.6 51,300 6,840 9,3601991 . . . . . . . . . . . 3.7 21,811.60 3.7 53,400 7,080 9,7201992 . . . . . . . . . . . 3.0 22,935.42 5.2 55,500 7,440 10,2001993 . . . . . . . . . . . 2.6 23,132.67 .9 57,600 7,680 10,5601994 . . . . . . . . . . . 2.8 23,753.53 2.7 60,600 8,040 11,1601995 . . . . . . . . . . . 2.6 24,705.66 4.0 61,200 8,160 11,2801996 . . . . . . . . . . . 2.9 25,913.90 4.9 62,700 8,280 12,5001997 . . . . . . . . . . . 2.1 27,426.00 5.8 65,400 8,640 13,5001998 . . . . . . . . . . . 1.3 28,861.44 5.2 68,400 9,120 14,5001999 . . . . . . . . . . . f2.5 30,469.84 5.6 72,600 9,600 15,5002000 . . . . . . . . . . . 3.5 32,154.82 5.5 76,200 10,080 17,0002001 . . . . . . . . . . . 2.6 32,921.92 2.4 80,400 10,680 25,0002002 . . . . . . . . . . . 1.4 33,252.09 1.0 84,900 11,280 30,0002003 . . . . . . . . . . . 2.1 34,064.95 2.4 87,000 11,520 30,7202004 . . . . . . . . . . . 2.7 35,648.55 4.6 87,900 11,640 31,0802005 . . . . . . . . . . . 4.1 36,952.94 3.7 90,000 12,000 31,8002006 . . . . . . . . . . . 3.3 38,651.41 4.6 94,200 12,480 33,2402007 . . . . . . . . . . . 2.3 40,405.48 4.5 97,500 12,960 34,4402008 . . . . . . . . . . . 5.8 41,334.97 2.3 102,000 13,560 36,1202009 . . . . . . . . . . . .0 40,711.61 -1.5 106,800 14,160 37,6802010 . . . . . . . . . . . .0 41,673.83 2.4 106,800 14,160 37,6802011 . . . . . . . . . . . 3.6 42,979.61 3.1 106,800 14,160 37,6802012 . . . . . . . . . . . 1.7 44,321.67 3.1 110,100 14,640 38,8802013 . . . . . . . . . . . 1.5 44,888.16 1.3 113,700 15,120 40,0802014 . . . . . . . . . . . 1.7 46,481.52 3.5 117,000 15,480 41,4002015 . . . . . . . . . . . .0 48,098.63 3.5 118,500 15,720 41,8802016 . . . . . . . . . . . .3 48,642.15 1.1 118,500 15,720 41,880
Intermediate:2017 . . . . . . . . . . . g2.0 50,020.69 2.8 g127,200 g16,920 g44,8802018 . . . . . . . . . . . 2.4 51,894.47 3.7 g128,400 g17,040 g45,3602019 . . . . . . . . . . . 2.7 54,076.92 4.2 132,300 17,520 46,6802020 . . . . . . . . . . . 2.6 56,534.16 4.5 137,100 18,240 48,3602021 . . . . . . . . . . . 2.6 59,089.48 4.5 142,800 18,960 50,4002022 . . . . . . . . . . . 2.6 61,705.86 4.4 149,400 19,800 52,8002023 . . . . . . . . . . . 2.6 64,405.95 4.4 156,000 20,760 55,0802024 . . . . . . . . . . . 2.6 67,191.23 4.3 162,900 21,600 57,6002025 . . . . . . . . . . . 2.6 70,057.16 4.3 170,100 22,560 60,1202026 . . . . . . . . . . . 2.6 73,003.92 4.2 177,600 23,520 62,6402027 . . . . . . . . . . . 2.6 75,908.24 4.0 185,100 24,600 65,400
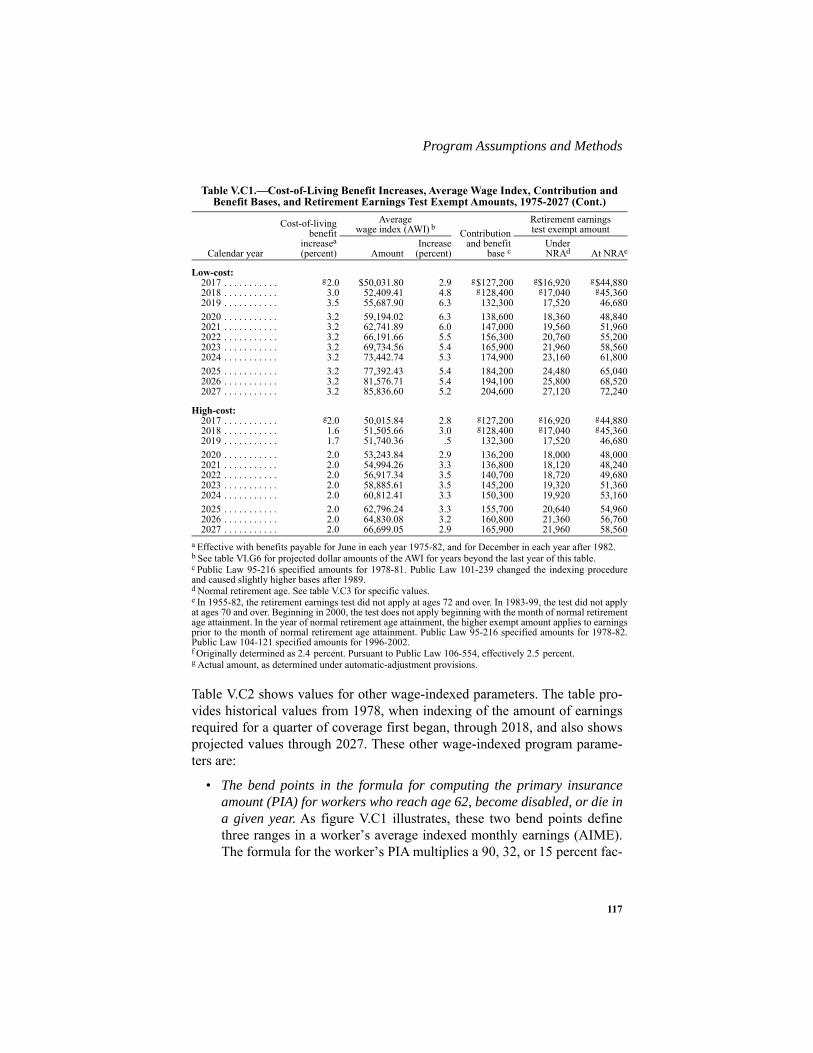
117
Program Assumptions and Methods
Table V.C2 shows values for other wage-indexed parameters. The table pro-vides historical values from 1978, when indexing of the amount of earningsrequired for a quarter of coverage first began, through 2018, and also showsprojected values through 2027. These other wage-indexed program parame-ters are:
• The bend points in the formula for computing the primary insuranceamount (PIA) for workers who reach age 62, become disabled, or die ina given year. As figure V.C1 illustrates, these two bend points definethree ranges in a worker’s average indexed monthly earnings (AIME).The formula for the worker’s PIA multiplies a 90, 32, or 15 percent fac-
Low-cost:2017 . . . . . . . . . . . g2.0 $50,031.80 2.9 g$127,200 g$16,920 g$44,8802018 . . . . . . . . . . . 3.0 52,409.41 4.8 g128,400 g17,040 g45,3602019 . . . . . . . . . . . 3.5 55,687.90 6.3 132,300 17,520 46,6802020 . . . . . . . . . . . 3.2 59,194.02 6.3 138,600 18,360 48,8402021 . . . . . . . . . . . 3.2 62,741.89 6.0 147,000 19,560 51,9602022 . . . . . . . . . . . 3.2 66,191.66 5.5 156,300 20,760 55,2002023 . . . . . . . . . . . 3.2 69,734.56 5.4 165,900 21,960 58,5602024 . . . . . . . . . . . 3.2 73,442.74 5.3 174,900 23,160 61,8002025 . . . . . . . . . . . 3.2 77,392.43 5.4 184,200 24,480 65,0402026 . . . . . . . . . . . 3.2 81,576.71 5.4 194,100 25,800 68,5202027 . . . . . . . . . . . 3.2 85,836.60 5.2 204,600 27,120 72,240
High-cost:2017 . . . . . . . . . . . g2.0 50,015.84 2.8 g127,200 g16,920 g44,8802018 . . . . . . . . . . . 1.6 51,505.66 3.0 g128,400 g17,040 g45,3602019 . . . . . . . . . . . 1.7 51,740.36 .5 132,300 17,520 46,6802020 . . . . . . . . . . . 2.0 53,243.84 2.9 136,200 18,000 48,0002021 . . . . . . . . . . . 2.0 54,994.26 3.3 136,800 18,120 48,2402022 . . . . . . . . . . . 2.0 56,917.34 3.5 140,700 18,720 49,6802023 . . . . . . . . . . . 2.0 58,885.61 3.5 145,200 19,320 51,3602024 . . . . . . . . . . . 2.0 60,812.41 3.3 150,300 19,920 53,1602025 . . . . . . . . . . . 2.0 62,796.24 3.3 155,700 20,640 54,9602026 . . . . . . . . . . . 2.0 64,830.08 3.2 160,800 21,360 56,7602027 . . . . . . . . . . . 2.0 66,699.05 2.9 165,900 21,960 58,560
a Effective with benefits payable for June in each year 1975-82, and for December in each year after 1982.b See table VI.G6 for projected dollar amounts of the AWI for years beyond the last year of this table.c Public Law 95-216 specified amounts for 1978-81. Public Law 101-239 changed the indexing procedureand caused slightly higher bases after 1989.d Normal retirement age. See table V.C3 for specific values.e In 1955-82, the retirement earnings test did not apply at ages 72 and over. In 1983-99, the test did not applyat ages 70 and over. Beginning in 2000, the test does not apply beginning with the month of normal retirementage attainment. In the year of normal retirement age attainment, the higher exempt amount applies to earningsprior to the month of normal retirement age attainment. Public Law 95-216 specified amounts for 1978-82.Public Law 104-121 specified amounts for 1996-2002.f Originally determined as 2.4 percent. Pursuant to Public Law 106-554, effectively 2.5 percent.g Actual amount, as determined under automatic-adjustment provisions.
Table V.C1.—Cost-of-Living Benefit Increases, Average Wage Index, Contribution and Benefit Bases, and Retirement Earnings Test Exempt Amounts, 1975-2027 (Cont.)
Calendar year
Cost-of-livingbenefit
increasea(percent)
Averagewage index (AWI) b Contribution
and benefitbase c
Retirement earningstest exempt amount
AmountIncrease
(percent)UnderNRAd At NRAe
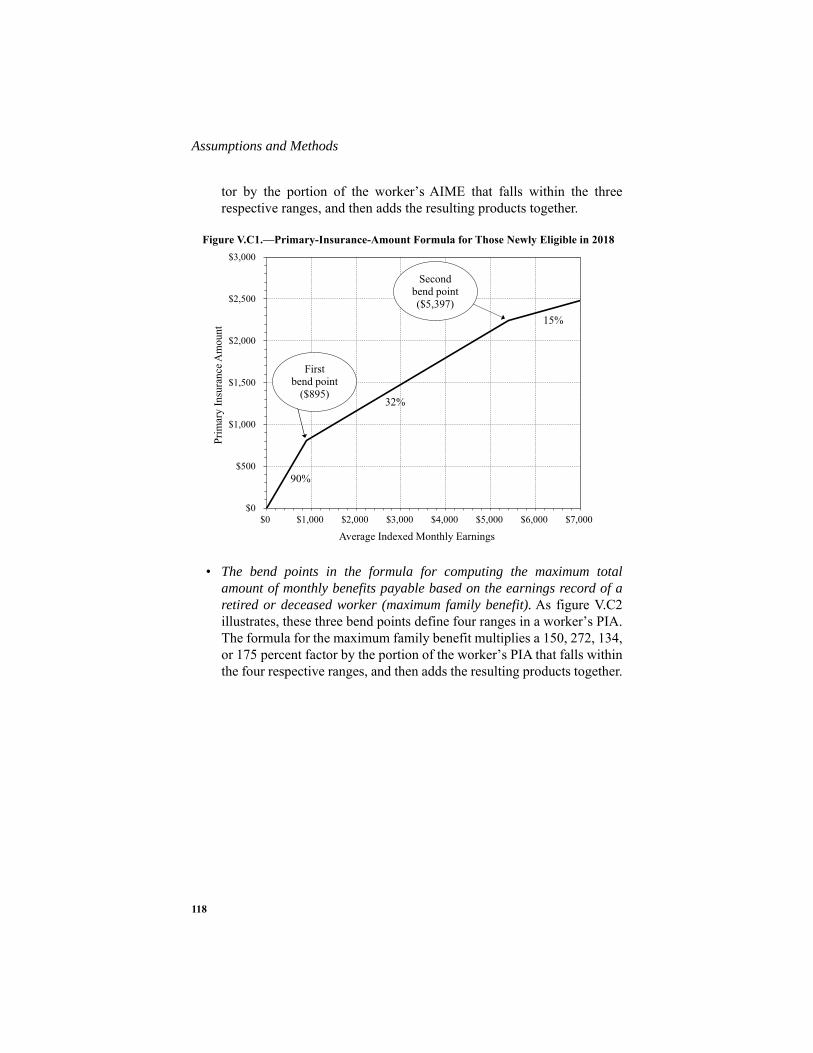
Assumptions and Methods
118
tor by the portion of the worker’s AIME that falls within the threerespective ranges, and then adds the resulting products together.
• The bend points in the formula for computing the maximum totalamount of monthly benefits payable based on the earnings record of aretired or deceased worker (maximum family benefit). As figure V.C2illustrates, these three bend points define four ranges in a worker’s PIA.The formula for the maximum family benefit multiplies a 150, 272, 134,or 175 percent factor by the portion of the worker’s PIA that falls withinthe four respective ranges, and then adds the resulting products together.
Figure V.C1.—Primary-Insurance-Amount Formula for Those Newly Eligible in 2018
90%
32%
15%
$0
$500
$1,000
$1,500
$2,000
$2,500
$3,000
$0 $1,000 $2,000 $3,000 $4,000 $5,000 $6,000 $7,000
Pri
mar
y I
nsu
ran
ce A
mo
un
t
Average Indexed Monthly Earnings
Firstbend point
($895)
Secondbend point($5,397)
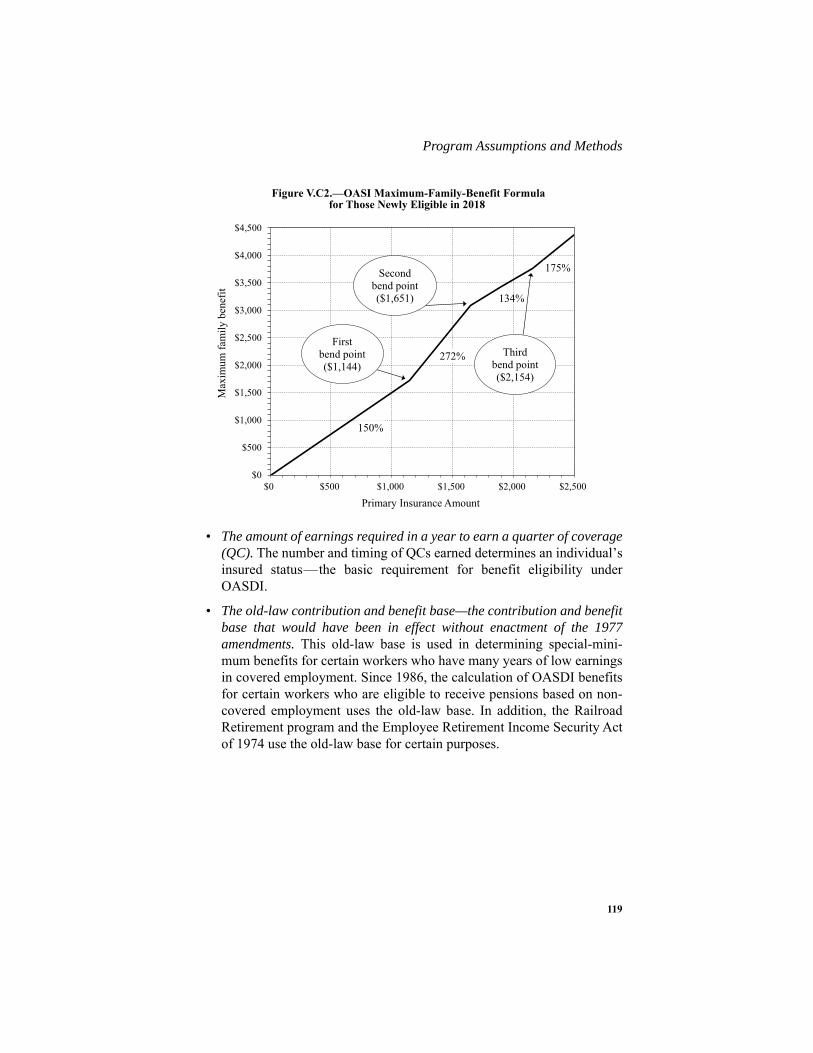
119
Program Assumptions and Methods
• The amount of earnings required in a year to earn a quarter of coverage(QC). The number and timing of QCs earned determines an individual’sinsured status—the basic requirement for benefit eligibility underOASDI.
• The old-law contribution and benefit base—the contribution and benefitbase that would have been in effect without enactment of the 1977amendments. This old-law base is used in determining special-mini-mum benefits for certain workers who have many years of low earningsin covered employment. Since 1986, the calculation of OASDI benefitsfor certain workers who are eligible to receive pensions based on non-covered employment uses the old-law base. In addition, the RailroadRetirement program and the Employee Retirement Income Security Actof 1974 use the old-law base for certain purposes.
Figure V.C2.—OASI Maximum-Family-Benefit Formula for Those Newly Eligible in 2018
150%
272%
134%
175%
$0
$500
$1,000
$1,500
$2,000
$2,500
$3,000
$3,500
$4,000
$4,500
$0 $500 $1,000 $1,500 $2,000 $2,500
Max
imu
m f
amil
y b
enef
it
Primary Insurance Amount
Thirdbend point($2,154)
Secondbend point($1,651)
Firstbend point($1,144)

Assumptions and Methods
120
Table V.C2.—Values for Selected Wage-Indexed Program Parameters, Calendar Years 1978-2027
Calendar year
AIME bendpoints in PIA
formulaa
PIA bend pointsin OASI maximum-
family-benefit formulabEarnings
required fora quarter of
coverage
Old-lawcontributionand benefit
basecFirst Second First Second Third
Historical data:1978 . . . . . . . . . d d d d d e $250 e $17,7001979 . . . . . . . . . e $180 e $1,085 e $230 e $332 e $433 260 18,900
1980 . . . . . . . . . 194 1,171 248 358 467 290 20,4001981 . . . . . . . . . 211 1,274 270 390 508 310 22,2001982 . . . . . . . . . 230 1,388 294 425 554 340 24,3001983 . . . . . . . . . 254 1,528 324 468 610 370 26,7001984 . . . . . . . . . 267 1,612 342 493 643 390 28,200
1985 . . . . . . . . . 280 1,691 358 517 675 410 29,7001986 . . . . . . . . . 297 1,790 379 548 714 440 31,5001987 . . . . . . . . . 310 1,866 396 571 745 460 32,7001988 . . . . . . . . . 319 1,922 407 588 767 470 33,6001989 . . . . . . . . . 339 2,044 433 626 816 500 35,700
1990 . . . . . . . . . 356 2,145 455 656 856 520 38,1001991 . . . . . . . . . 370 2,230 473 682 890 540 39,6001992 . . . . . . . . . 387 2,333 495 714 931 570 41,4001993 . . . . . . . . . 401 2,420 513 740 966 590 42,9001994 . . . . . . . . . 422 2,545 539 779 1,016 620 45,000
1995 . . . . . . . . . 426 2,567 544 785 1,024 630 45,3001996 . . . . . . . . . 437 2,635 559 806 1,052 640 46,5001997 . . . . . . . . . 455 2,741 581 839 1,094 670 48,6001998 . . . . . . . . . 477 2,875 609 880 1,147 700 50,7001999 . . . . . . . . . 505 3,043 645 931 1,214 740 53,700
2000 . . . . . . . . . 531 3,202 679 980 1,278 780 56,7002001 . . . . . . . . . 561 3,381 717 1,034 1,349 830 59,7002002 . . . . . . . . . 592 3,567 756 1,092 1,424 870 63,0002003 . . . . . . . . . 606 3,653 774 1,118 1,458 890 64,5002004 . . . . . . . . . 612 3,689 782 1,129 1,472 900 65,100
2005 . . . . . . . . . 627 3,779 801 1,156 1,508 920 66,9002006 . . . . . . . . . 656 3,955 838 1,210 1,578 970 69,9002007 . . . . . . . . . 680 4,100 869 1,255 1,636 1,000 72,6002008 . . . . . . . . . 711 4,288 909 1,312 1,711 1,050 75,9002009 . . . . . . . . . 744 4,483 950 1,372 1,789 1,090 79,200
2010 . . . . . . . . . 761 4,586 972 1,403 1,830 1,120 79,2002011 . . . . . . . . . 749 4,517 957 1,382 1,803 1,120 79,2002012 . . . . . . . . . 767 4,624 980 1,415 1,845 1,130 81,9002013 . . . . . . . . . 791 4,768 1,011 1,459 1,903 1,160 84,3002014 . . . . . . . . . 816 4,917 1,042 1,505 1,962 1,200 87,000
2015 . . . . . . . . . 826 4,980 1,056 1,524 1,987 1,220 88,2002016 . . . . . . . . . 856 5,157 1,093 1,578 2,058 1,260 88,2002017 . . . . . . . . . 885 5,336 1,131 1,633 2,130 1,300 94,5002018 . . . . . . . . . 895 5,397 1,144 1,651 2,154 1,320 95,400
Intermediate:2019 . . . . . . . . . 921 5,550 1,176 1,698 2,215 1,360 98,100
2020 . . . . . . . . . 955 5,758 1,220 1,762 2,298 1,410 101,7002021 . . . . . . . . . 995 6,000 1,272 1,836 2,394 1,470 106,2002022 . . . . . . . . . 1,041 6,272 1,330 1,919 2,503 1,530 111,0002023 . . . . . . . . . 1,088 6,556 1,390 2,006 2,616 1,600 115,8002024 . . . . . . . . . 1,136 6,846 1,451 2,095 2,732 1,670 121,200
2025 . . . . . . . . . 1,185 7,146 1,515 2,187 2,852 1,750 126,3002026 . . . . . . . . . 1,237 7,455 1,580 2,281 2,975 1,820 131,7002027 . . . . . . . . . 1,289 7,773 1,648 2,378 3,102 1,900 137,400
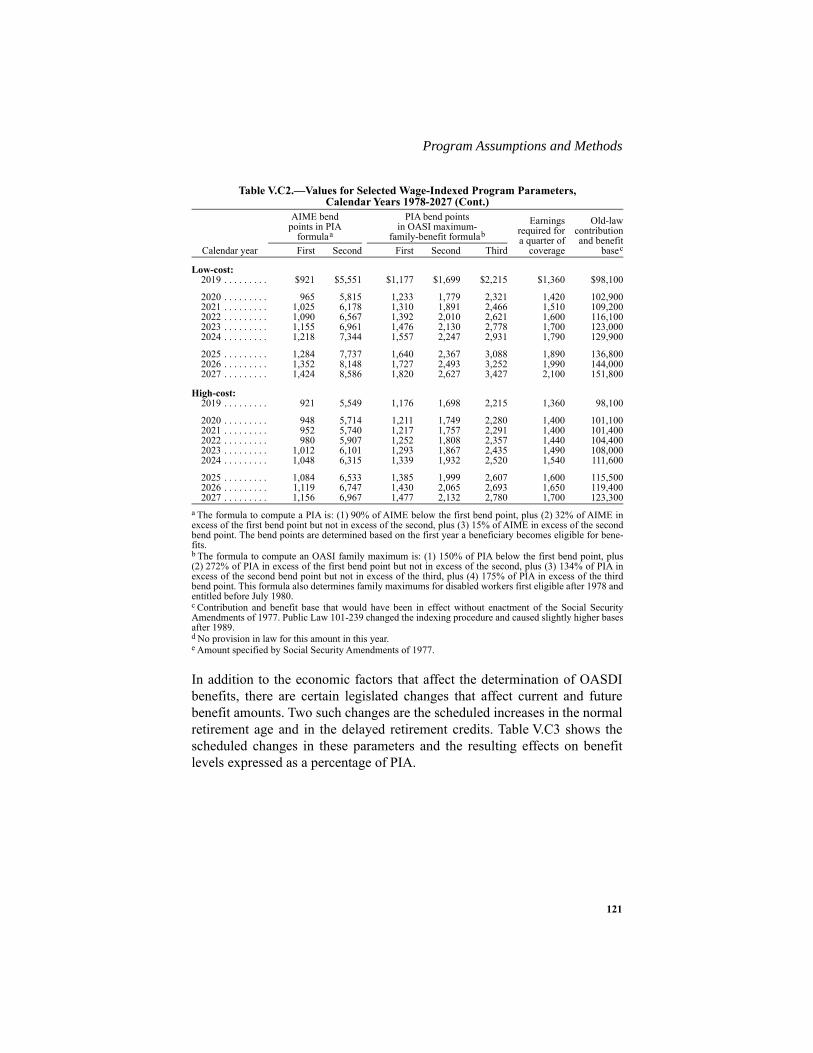
121
Program Assumptions and Methods
In addition to the economic factors that affect the determination of OASDIbenefits, there are certain legislated changes that affect current and futurebenefit amounts. Two such changes are the scheduled increases in the normalretirement age and in the delayed retirement credits. Table V.C3 shows thescheduled changes in these parameters and the resulting effects on benefitlevels expressed as a percentage of PIA.
Low-cost:2019 . . . . . . . . . $921 $5,551 $1,177 $1,699 $2,215 $1,360 $98,100
2020 . . . . . . . . . 965 5,815 1,233 1,779 2,321 1,420 102,9002021 . . . . . . . . . 1,025 6,178 1,310 1,891 2,466 1,510 109,2002022 . . . . . . . . . 1,090 6,567 1,392 2,010 2,621 1,600 116,1002023 . . . . . . . . . 1,155 6,961 1,476 2,130 2,778 1,700 123,0002024 . . . . . . . . . 1,218 7,344 1,557 2,247 2,931 1,790 129,900
2025 . . . . . . . . . 1,284 7,737 1,640 2,367 3,088 1,890 136,8002026 . . . . . . . . . 1,352 8,148 1,727 2,493 3,252 1,990 144,0002027 . . . . . . . . . 1,424 8,586 1,820 2,627 3,427 2,100 151,800
High-cost:2019 . . . . . . . . . 921 5,549 1,176 1,698 2,215 1,360 98,100
2020 . . . . . . . . . 948 5,714 1,211 1,749 2,280 1,400 101,1002021 . . . . . . . . . 952 5,740 1,217 1,757 2,291 1,400 101,4002022 . . . . . . . . . 980 5,907 1,252 1,808 2,357 1,440 104,4002023 . . . . . . . . . 1,012 6,101 1,293 1,867 2,435 1,490 108,0002024 . . . . . . . . . 1,048 6,315 1,339 1,932 2,520 1,540 111,600
2025 . . . . . . . . . 1,084 6,533 1,385 1,999 2,607 1,600 115,5002026 . . . . . . . . . 1,119 6,747 1,430 2,065 2,693 1,650 119,4002027 . . . . . . . . . 1,156 6,967 1,477 2,132 2,780 1,700 123,300
a The formula to compute a PIA is: (1) 90% of AIME below the first bend point, plus (2) 32% of AIME inexcess of the first bend point but not in excess of the second, plus (3) 15% of AIME in excess of the secondbend point. The bend points are determined based on the first year a beneficiary becomes eligible for bene-fits.b The formula to compute an OASI family maximum is: (1) 150% of PIA below the first bend point, plus(2) 272% of PIA in excess of the first bend point but not in excess of the second, plus (3) 134% of PIA inexcess of the second bend point but not in excess of the third, plus (4) 175% of PIA in excess of the thirdbend point. This formula also determines family maximums for disabled workers first eligible after 1978 andentitled before July 1980.c Contribution and benefit base that would have been in effect without enactment of the Social SecurityAmendments of 1977. Public Law 101-239 changed the indexing procedure and caused slightly higher basesafter 1989.d No provision in law for this amount in this year.e Amount specified by Social Security Amendments of 1977.
Table V.C2.—Values for Selected Wage-Indexed Program Parameters, Calendar Years 1978-2027 (Cont.)
Calendar year
AIME bendpoints in PIA
formulaa
PIA bend pointsin OASI maximum-
family-benefit formulabEarnings
required fora quarter of
coverage
Old-lawcontributionand benefit
basecFirst Second First Second Third

Assumptions and Methods
122
2. Covered EmploymentProjections of the total U.S. labor force and unemployment rate (seetable V.B2) are based on Bureau of Labor Statistics definitions from the Cur-rent Population Survey (CPS). These projections represent the averageweekly number of employed and unemployed persons, age 16 and over, inthe U.S. in a calendar year. Covered employment for a calendar year isdefined as the total number of persons who have any OASDI covered earn-ings (that is, earnings subject to the OASDI payroll tax) at any time duringthat year. For those age 16 and over, projected covered employment is thesum of age-sex groups, each reflecting the growth projected for the group’stotal U.S employment and average weeks worked per year.1 For the short-range period, the age-sex-adjusted average weeks worked declines slightly asthe age-sex-adjusted unemployment rate rises to its ultimate assumed valueof 5.5 percent. After 2027, the average weeks worked for each age-sex group
Table V.C3.—Legislated Changes in Normal Retirement Age and Delayed RetirementCredits for Persons Reaching Age 62 in Each Year 1986 and Later
Year of birth
Year ofattainment of
age 62
Normalretirementage (NRA)
Credit for each year of delayed retirement afterNRA (percent)
Benefit, as a percentage of PIA, beginning at age —
62 65 66 67 70
1924 . . . . . . . . 1986. . . . . . . . 65 . . . . . . . . 3 80 100 103 106 1151925 . . . . . . . . 1987. . . . . . . . 65 . . . . . . . . 3 1/2 80 100 103 1/2 107 117 1/21926 . . . . . . . . 1988. . . . . . . . 65 . . . . . . . . 3 1/2 80 100 103 1/2 107 117 1/21927 . . . . . . . . 1989. . . . . . . . 65 . . . . . . . . 4 80 100 104 108 1201928 . . . . . . . . 1990. . . . . . . . 65 . . . . . . . . 4 80 100 104 108 1201929 . . . . . . . . 1991. . . . . . . . 65 . . . . . . . . 4 1/2 80 100 104 1/2 109 122 1/21930 . . . . . . . . 1992. . . . . . . . 65 . . . . . . . . 4 1/2 80 100 104 1/2 109 122 1/21931 . . . . . . . . 1993. . . . . . . . 65 . . . . . . . . 5 80 100 105 110 1251932 . . . . . . . . 1994. . . . . . . . 65 . . . . . . . . 5 80 100 105 110 1251933 . . . . . . . . 1995. . . . . . . . 65 . . . . . . . . 5 1/2 80 100 105 1/2 111 127 1/21934 . . . . . . . . 1996. . . . . . . . 65 . . . . . . . . 5 1/2 80 100 105 1/2 111 127 1/21935 . . . . . . . . 1997. . . . . . . . 65 . . . . . . . . 6 80 100 106 112 1301936 . . . . . . . . 1998. . . . . . . . 65 . . . . . . . . 6 80 100 106 112 1301937 . . . . . . . . 1999. . . . . . . . 65 . . . . . . . . 6 1/2 80 100 106 1/2 113 132 1/21938 . . . . . . . . 2000. . . . . . . . 65, 2 mo . . . 6 1/2 79 1/6 98 8/9 105 5/12 111 11/12 131 5/121939 . . . . . . . . 2001. . . . . . . . 65, 4 mo . . . 7 78 1/3 97 7/9 104 2/3 111 2/3 132 2/31940 . . . . . . . . 2002. . . . . . . . 65, 6 mo . . . 7 77 1/2 96 2/3 103 1/2 110 1/2 131 1/21941 . . . . . . . . 2003. . . . . . . . 65, 8 mo . . . 7 1/2 76 2/3 95 5/9 102 1/2 110 132 1/21942 . . . . . . . . 2004. . . . . . . . 65, 10 mo . . 7 1/2 75 5/6 94 4/9 101 1/4 108 3/4 131 1/41943-54 . . . . . 2005-16 . . . . . 66 . . . . . . . . 8 75 93 1/3 100 108 1321955 . . . . . . . . 2017. . . . . . . . 66, 2 mo . . . 8 74 1/6 92 2/9 98 8/9 106 2/3 130 2/31956 . . . . . . . . 2018. . . . . . . . 66, 4 mo . . . 8 73 1/3 91 1/9 97 7/9 105 1/3 129 1/31957 . . . . . . . . 2019. . . . . . . . 66, 6 mo . . . 8 72 1/2 90 96 2/3 104 1281958 . . . . . . . . 2020. . . . . . . . 66, 8 mo . . . 8 71 2/3 88 8/9 95 5/9 102 2/3 126 2/31959 . . . . . . . . 2021. . . . . . . . 66, 10 mo . . 8 70 5/6 87 7/9 94 4/9 101 1/3 125 1/31960 & later . . 2022 & later . 67 . . . . . . . . 8 70 86 2/3 93 1/3 100 124
1 For those under age 16, projected covered employment is the sum of age-sex components, each of which isprojected as a ratio to the Social Security area population.

123
Program Assumptions and Methods
is assumed to remain constant. The projection method also accounts forchanges in non-OASDI-covered employment and the increase in coverage ofFederal civilian employment as a result of the 1983 Social Security Amend-ments. It also reflects changes in the number and employment status of other-than-LPR immigrants residing within the Social Security coverage area, suchas undocumented immigrants and foreign workers and students with tempo-rary visas.
The covered-worker rate is the ratio of OASDI covered workers to the SocialSecurity area population. For men age 16 and over, the projected age-adjusted covered-worker rates1 for 2092 are 69.3, 68.9, and 68.6 percent forthe low-cost, intermediate, and high-cost assumptions, respectively. Forwomen age 16 and over, the projected age-adjusted covered-worker rates for2092 are 66.4, 65.1, and 63.8 percent for the low-cost, intermediate, andhigh-cost assumptions, respectively. For men, the intermediate projected ratefor 2092 is slightly lower than the 2016 age-adjusted rate of 69.7 percent pri-marily due to the projected increase in the portion of the Social Security areapopulation that consists of other-than-LPR immigrants. For women, theintermediate projected rate for 2092 is higher than the 2016 age-adjusted rateof 63.6 percent because the projected increase in the age-adjusted labor forceparticipation rate more than offsets the projected increase in the portion ofthe population that will be other-than-LPR immigrants.
3. Insured PopulationEligibility for worker benefits under the OASDI program requires somethreshold level of work in covered employment. A worker satisfies thisrequirement by his or her accumulation of quarters of coverage (QCs). Priorto 1978, a worker earned one QC for each calendar quarter in which he orshe earned at least $50. In 1978, when annual earnings reporting replacedquarterly reporting, the amount required to earn a QC (up to a maximum offour per year) was set at $250. As specified in the law, the Social SecurityAdministration has adjusted this amount each year since then according tochanges in the AWI. Its value in 2018 is $1,320.
There are three types of insured status that a worker can acquire under theOASDI program. The number and recency of QCs earned determine eachstatus. A worker is fully insured when his or her total number of QCs isgreater than or equal to the number of years elapsed after the year of attain-ment of age 21 (but not less than six). Once a worker has accumulated
1 Age-adjusted covered-worker rates are adjusted to the 2011 age distribution of the Social Security areapopulation.

Assumptions and Methods
124
40 QCs, he or she remains permanently fully insured. A worker is disabilityinsured if he or she is: (1) a fully insured worker who has accumulated 20QCs during the 40-quarter period ending with the current quarter, (2) a fullyinsured worker aged 24-30 who has accumulated QCs during one-half of thequarters elapsed after the quarter of attainment of age 21 and up to andincluding the current quarter, or (3) a fully insured worker under age 24 whohas accumulated six QCs during the 12-quarter period ending with the cur-rent quarter. A worker is currently insured when he or she has accumulatedsix QCs during the 13-quarter period ending with the current quarter. Periodsof disability reduce the number of quarters required for insured status, butnot below the minimum of six QCs.
There are many types of benefits payable to workers and their family mem-bers under the OASDI program. A worker must be fully insured to be eligi-ble for a primary retirement benefit and for his or her spouse or children tobe eligible for auxiliary retirement benefits. A deceased worker must havebeen either currently insured or fully insured at the time of death for his orher children (and their mother or father) to be eligible for benefits. If thereare no eligible surviving children, the deceased worker must have been fullyinsured at the time of death for his or her surviving spouse to be eligible. Aworker must be disability insured to be eligible for a primary disability bene-fit and for his or her spouse or children to be eligible for auxiliary disabilitybenefits.
The Office of the Chief Actuary estimates the fully insured population, as apercentage of the Social Security area population, by single year of age andsex starting in 1969. The short-range model extrapolates the historical trendin these rates from data in the Continuous Work History Sample (CWHS).The model uses information on quarters of coverage earned due to employ-ment covered by Social Security derived from tabulations of the CWHS. Themodel also uses historical administrative data on beneficiaries in force andestimated historical mortality rates. The model combines this information toestimate the proportion of individuals who were alive and fully insured as ofthe end of each historical year. Using projected mortality rates and coveredworkers, the model extrapolates these rates into the future and applies themto the historical and projected population to arrive at the fully insured popu-lation by age and sex through the end of the short-range period.
The long-range fully insured model uses 30,000 simulated work histories foreach sex and birth cohort, representing everyone except the other-than-LPRimmigrant population. For the other-than-LPR immigrant population, themodel generates substantially lower percentages attaining fully insured sta-tus. The model constructs simulated work histories using past coverage rates,
125
Program Assumptions and Methods
earnings distributions, and amounts required for crediting QCs, and developsthem in a manner that replicates historical individual variations in work pat-terns. The probability of covered employment in any year is assumed to behigher for those who have worked more consistently in the recent past.Model parameters are selected so that simulated fully insured percentagesare consistent with the fully insured percentages estimated by the short-rangemodel for the recent historical period.
The Office of the Chief Actuary estimates the disability insured population,as a percentage of the fully insured population, by age and sex starting in1970. The office bases historical values on a tabulation of the disabilityinsured population from the CWHS and estimates of the fully insured popu-lation. The short-range model projects these percentages by using the rela-tionship between the historical percentages and covered-worker rates. Thelong-range model projects these percentages by using the same simulatedwork histories used to project the fully insured percentages. The long-rangemodel makes additional adjustments to the model simulations in order tobring the disability insured percentages in the historical and short-range peri-ods into close agreement with those estimated from the CWHS and the short-range model.
The office does not project the currently insured population because thenumber of beneficiaries who are entitled to benefits based solely on currentlyinsured status has been very small and is likely to remain small in the future.
Using these insured models, the percentage of the Social Security area popu-lation aged 62 and over that is fully insured is projected to increase from itsestimated level of 86.4 for December 31, 2015, to 86.8, 87.6, and 88.6 forDecember 31, 2095, under the low-cost, intermediate, and high-cost alterna-tives, respectively. Over the projection period, the percentages for both malesand females change significantly. The percentage for males declines, reflect-ing, in part, increases in the percent of the population that is classified asother-than-LPR immigrants and is thus less likely to have earnings reportedand credited to them. The percentage for females increases, reflecting thepast substantial growth in the employment of younger cohorts of women.Under the intermediate assumptions, for example, the percentage for malesdecreases from 93.4 to 86.8, and the percentage for females increases from80.6 to 88.3.
4. Old-Age and Survivors Insurance BeneficiariesThe Office of the Chief Actuary projects the number of OASI beneficiariesfor each type of benefit separately by the sex of the worker on whose earn-
Assumptions and Methods
126
ings the benefits are based and by the age of the beneficiary. For the long-range period, the office also projects the number of beneficiaries by maritalstatus for several types of benefits. The office uses two separate models inmaking these projections. The short-range model makes projections duringthe first 10 years of the projection period and the long-range model makesprojections thereafter.
The short-range model develops the number of retired-worker beneficiariesby applying award rates to the aged fully insured population, excluding thosealready receiving retired-worker, disabled-worker, aged-widow(er), or aged-spouse benefits, and by applying termination rates to the number of retired-worker beneficiaries.
The long-range model projects the number of retired-worker beneficiarieswho were not previously converted from disabled-worker beneficiary statusas a percentage of the exposed population.1 For age 62, the model projectsthis percentage by using a linear regression based on the historical relation-ship between this percentage, the labor force participation rate at age 62, andthe number of months from age 62 to normal retirement age. The percentagefor ages 70 and over is nearly 100 because delayed retirement credits cannotbe earned after age 70. The long-range model projects the percentage foreach age 63 through 69 based on historical experience with an adjustment forchanges in the portion of the primary insurance amount that is payable ateach age of entitlement. The model adjusts these percentages for ages 62through 69 to reflect changes in the normal retirement age.
The long-range model calculates the number of retired-worker beneficiariespreviously converted from disabled-worker beneficiary status using anextension of disabled-worker death rates by age, sex, and duration.
The Office of the Chief Actuary estimates the number of aged-spouse benefi-ciaries, excluding those who are also receiving a retired-worker benefit, fromthe population projected by age and sex. Benefits of aged-spouse beneficia-ries depend on the earnings records of their husbands or wives, who arereferred to as “earners.” The short-range model projects insured aged-spousebeneficiaries in conjunction with the retired-worker beneficiaries. Thismodel projects uninsured aged-spouse beneficiaries by applying award ratesto the aged uninsured male or female population and by applying terminationrates to the population already receiving such benefits.
1 The exposed population is the fully insured population age 62 and over, excluding persons entitled to orconverted from disabled-worker benefits and fully insured persons entitled only to widow(er) benefits.

127
Program Assumptions and Methods
The long-range model estimates aged-spouse beneficiaries separately forthose married and divorced. The model projects the number of married aged-spouse beneficiaries, by age and sex, by applying a series of factors to thenumber of spouses, aged 62 and over, in the population. These factors are theprobabilities that the spouse and the earner meet all of the conditions ofeligibility—that is, the probabilities that: (1) the earner is 62 or over, (2) theearner is insured, (3) the earner is either receiving benefits or has suspendedbenefits, (4) the spouse is not receiving a benefit for the care of an entitledchild, (5) the spouse is either not insured or is insured but not receiving bene-fits, and (6) the spouse is not eligible to receive a significant governmentpension based on earnings in noncovered employment. To calculate the esti-mated number of aged-spouse beneficiaries, the model applies a projectedprevalence rate to the resulting number of spouses. Due to the BipartisanBudget Act of 2015, aged spouses are no longer eligible to receive an aged-spouse benefit if the earner suspends their benefit after April 29, 2016. Addi-tionally, for those turning age 62 in 2016 and later, deemed filing nowapplies to all retired workers and spouses even after initial entitlement,regardless of age. Thus, spouses who are insured are no longer eligible todelay their retired-worker benefit while receiving an aged-spouse benefit.
The long-range model estimates the number of divorced aged-spouse benefi-ciaries, by age and sex, by applying the same factors to the number ofdivorced persons aged 62 and over in the population, with three differences.First, the model applies a factor to reflect the probability that the earner (for-mer spouse) is still alive. If the former spouse is not alive, the person may beentitled to a divorced widow(er) benefit. Second, the model applies a factorto reflect the probability that the marriage to the former spouse lasted at least10 years. Third, the model does not apply factor (3) in the previous para-graph because, effective January 1985, a divorced person is generally no lon-ger required to wait for the former spouse to receive benefits.
The Office of the Chief Actuary bases the projected numbers of childrenunder age 18, and students aged 18 and 19, who are eligible for benefits aschildren of retired-worker beneficiaries, on the projected number of childrenin the population. The short-range model develops the number of entitledchildren by applying award rates to the number of children in the populationwho have two living parents and by applying termination rates to the numberof children already receiving benefits.
The long-range model projects separately the number of entitled children bysex of the earner parent. For each age under 18, the model multiplies the pro-jected number of children with a parent aged 62 and over by the ratio of thenumber of retired workers aged 62 to 71 to the number of members of the
Assumptions and Methods
128
population aged 62 to 71. For student beneficiaries, the model multiplies thenumber of children aged 18 and 19 in the population by the probabilities that:(1) the parent is alive, aged 62 or over, insured, and receiving a retired-worker benefit; and (2) the child is attending high school.
The Office of the Chief Actuary projects the number of disabled children,aged 18 and over, of retired-worker beneficiaries from the adult population.The short-range model applies award rates to the population and applies ter-mination rates to the number of disabled children already receiving benefits.The long-range model projects the number of disabled children in a mannersimilar to that used for student children except for a factor that reflects theprobability of being disabled before age 22.
The short-range model develops the number of spouses of retired workers,who are entitled to spouse benefits because they are caring for a child who isunder age 16 or disabled, by applying award rates to the number of awards tochildren of retired workers and by applying termination rates to the numberof young spouses with a child in their care who are already receiving bene-fits. The long-range model projects the number of young-spouse beneficia-ries with a child in their care as a proportion of the number of childbeneficiaries of retired workers, including projected changes in average fam-ily size.
The Office of the Chief Actuary projects the number of aged-widow(er) ben-eficiaries, excluding those who are also receiving a retired-worker benefit,from the population by age and sex. The short-range model projects fullyinsured aged-widow(er) beneficiaries in conjunction with the retired-workerbeneficiaries. The model projects the number of uninsured aged-widow(er)beneficiaries by applying award rates to the aged uninsured male or femalepopulation and by applying termination rates to the population alreadyreceiving such benefits. The long-range model projects uninsured aged-widow(er) beneficiaries by marital status. The model multiplies the numberof widow(er)s in the population aged 60 and over by the probabilities that:(1) the deceased earner is fully insured at death, (2) the widow(er) is notreceiving a benefit for the care of an entitled child, (3) the widow(er) is notfully insured, and (4) the widow(er) benefits are not withheld because ofreceipt of a significant government pension based on earnings in noncoveredemployment. In addition, the model applies the same factors to the numberof divorced persons aged 60 and over in the population and includes addi-tional factors representing the probability that the person’s former earnerspouse has died and that the marriage lasted at least 10 years. The modelprojects the number of insured aged-widow(er) beneficiaries who are ages60 through 70 in a manner similar to that for uninsured aged-widow(er) ben-
129
Program Assumptions and Methods
eficiaries. In addition, the model assumes that some insured widow(er)s whohad not applied for their retired-worker benefits will receive widow(er) bene-fits. The model projects insured aged-widow(er) beneficiaries over age 70 byapplying termination rates to the population that started receiving such bene-fits prior to age 70.
The short-range model develops the number of disabled-widow(er) benefi-ciaries by applying award rates to the uninsured male or female populationand by applying termination rates to the population already receiving a dis-abled-widow(er) benefit. The long-range model projects the number for eachcohort by age from 50 to normal retirement age as percentages of the wid-owed and divorced populations, adjusted for the insured status of thedeceased spouse, the prevalence of disability, and the probability that the dis-abled spouse is not receiving another type of benefit.
The Office of the Chief Actuary bases the projected number of childrenunder age 18, and students aged 18 and 19, who are entitled to benefits assurvivors of deceased workers, on the number of children in the populationwhose mothers or fathers are deceased. The short-range model develops thenumber of entitled children by applying award rates to the number oforphaned children and by applying termination rates to the number of chil-dren already receiving benefits.
The long-range model projects the number of child-survivor beneficiaries ina manner similar to that for student beneficiaries of retired workers, exceptthat the model replaces the probability that the parent is aged 62 or over withthe probability that the parent is deceased.
The Office of the Chief Actuary projects the number of disabled-child-survi-vor beneficiaries, aged 18 and over, from the adult population. The short-range model applies award rates to the population and applies terminationrates to the number of disabled-child-survivor beneficiaries already receivingbenefits. The long-range model projects the number of disabled-child-survi-vor beneficiaries in a manner similar to that for student-child-survivor bene-ficiaries, except for including an additional factor to reflect the probability ofbeing disabled before age 22.
The short-range model develops the numbers of entitled mother-survivor andfather-survivor beneficiaries by applying award rates to the number ofawards to child-survivor beneficiaries, in cases where the children are eitherunder age 16 or disabled, and by applying termination rates to the number ofmother-survivors and father-survivors already receiving benefits. The long-range model estimates the numbers of mother-survivor and father-survivor

Assumptions and Methods
130
beneficiaries, assuming they are not remarried, from the number of child-sur-vivor beneficiaries.
The Office of the Chief Actuary projects the number of parent-survivor ben-eficiaries based on the historical pattern of the number of such beneficiaries.
Table V.C4 shows the projected number of beneficiaries under the OASI pro-gram by type of benefit. The retired-worker beneficiary counts include thosepersons who receive a residual auxiliary benefit in addition to their retired-worker benefit. The office makes estimates of the number and amount ofresidual payments separately for spouses and widow(er)s.
Table V.C4.—OASI Beneficiaries With Benefits in Current-Payment Statusat the End of Calendar Years 1945-2095
[In thousands]
Calendar year
Retired workers and auxiliaries Survivors
TotalWorkera Spouse ChildWidow-
widowerMother-
father Child Parent
Historical data:1945 . . . . . . . . . . 518 159 13 94 121 377 6 1,2881950 . . . . . . . . . . 1,771 508 46 314 169 653 15 3,4771955 . . . . . . . . . . 4,474 1,192 122 701 292 1,154 25 7,9611960 . . . . . . . . . . 8,061 2,269 268 1,544 401 1,577 36 14,1571965 . . . . . . . . . . 11,101 2,614 461 2,371 472 2,074 35 19,1281970 . . . . . . . . . . 13,349 2,668 546 3,227 523 2,688 29 23,0301975 . . . . . . . . . . 16,589 2,867 643 3,888 582 2,919 21 27,5091980 . . . . . . . . . . 19,564 3,018 639 4,415 563 2,610 15 30,8231985 . . . . . . . . . . 22,435 3,069 456 4,862 372 1,918 10 33,1221990 . . . . . . . . . . 24,841 3,104 421 5,098 304 1,777 6 35,5511995 . . . . . . . . . . 26,679 3,027 441 5,213 275 1,884 4 37,5222000 . . . . . . . . . . 28,505 2,798 459 4,901 203 1,878 3 38,747
2005 . . . . . . . . . . 30,461 2,524 488 4,569 178 1,903 2 40,1262006 . . . . . . . . . . 30,976 2,476 490 4,494 171 1,899 2 40,5082007 . . . . . . . . . . 31,528 2,431 494 4,436 165 1,892 2 40,9472008 . . . . . . . . . . 32,274 2,370 525 4,380 160 1,915 2 41,6252009 . . . . . . . . . . 33,514 2,343 561 4,327 160 1,921 2 42,8282010 . . . . . . . . . . 34,593 2,316 580 4,285 159 1,913 2 43,8472011 . . . . . . . . . . 35,600 2,291 594 4,239 158 1,907 2 44,7912012 . . . . . . . . . . 36,720 2,280 612 4,193 154 1,907 1 45,8682013 . . . . . . . . . . 37,893 2,285 625 4,139 150 1,899 1 46,9922014 . . . . . . . . . . 39,009 2,303 635 4,092 143 1,892 1 48,0752015 . . . . . . . . . . 40,089 2,335 648 4,050 140 1,893 1 49,1552016 . . . . . . . . . . 41,233 2,370 661 4,004 133 1,893 1 50,2962017 . . . . . . . . . . 42,447 2,375 675 3,961 128 1,904 1 51,491
Intermediate:2018 . . . . . . . . . . 43,859 2,371 692 3,928 125 1,915 1 52,8912020 . . . . . . . . . . 47,090 2,263 736 3,866 120 1,940 1 56,0152025 . . . . . . . . . . 54,932 1,919 857 3,752 113 1,980 1 63,5532030 . . . . . . . . . . 61,907 1,946 983 3,522 119 2,010 1 70,4882035 . . . . . . . . . . 66,610 1,923 1,088 3,292 131 2,039 1 75,0842040 . . . . . . . . . . 69,007 1,818 1,146 3,105 134 2,066 1 77,277
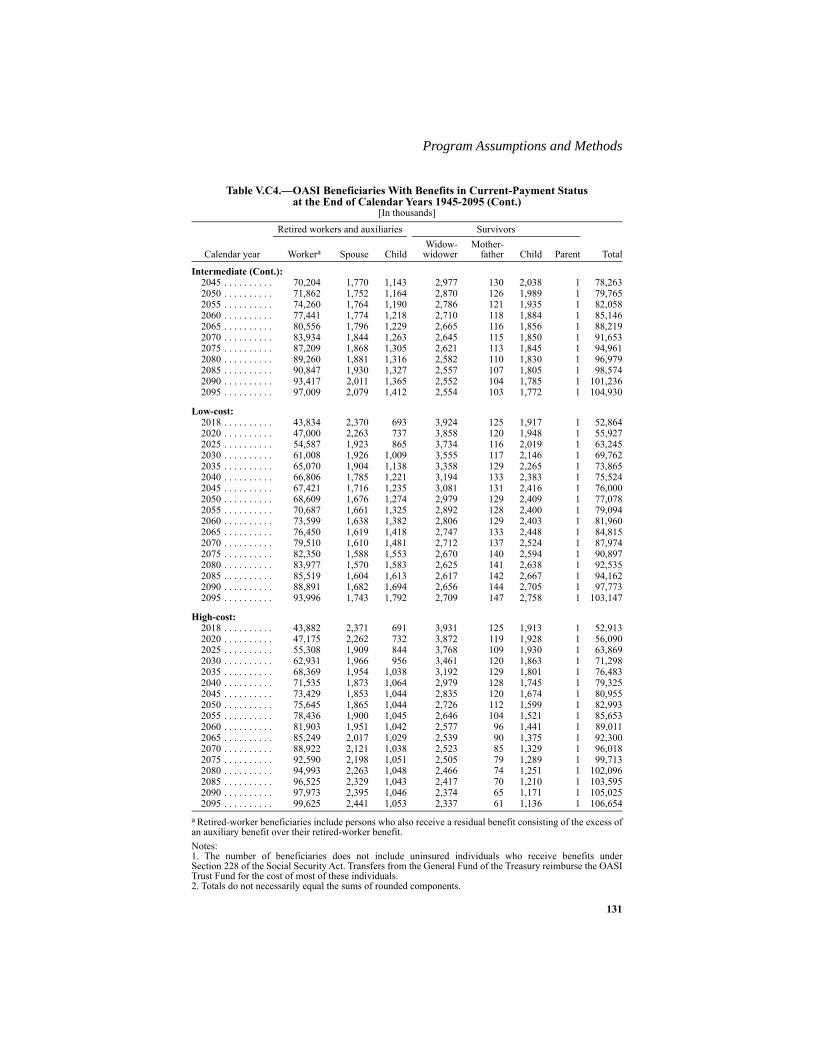
131
Program Assumptions and Methods
Notes: 1. The number of beneficiaries does not include uninsured individuals who receive benefits underSection 228 of the Social Security Act. Transfers from the General Fund of the Treasury reimburse the OASITrust Fund for the cost of most of these individuals.2. Totals do not necessarily equal the sums of rounded components.
Intermediate (Cont.):2045 . . . . . . . . . . 70,204 1,770 1,143 2,977 130 2,038 1 78,2632050 . . . . . . . . . . 71,862 1,752 1,164 2,870 126 1,989 1 79,7652055 . . . . . . . . . . 74,260 1,764 1,190 2,786 121 1,935 1 82,0582060 . . . . . . . . . . 77,441 1,774 1,218 2,710 118 1,884 1 85,1462065 . . . . . . . . . . 80,556 1,796 1,229 2,665 116 1,856 1 88,2192070 . . . . . . . . . . 83,934 1,844 1,263 2,645 115 1,850 1 91,6532075 . . . . . . . . . . 87,209 1,868 1,305 2,621 113 1,845 1 94,9612080 . . . . . . . . . . 89,260 1,881 1,316 2,582 110 1,830 1 96,9792085 . . . . . . . . . . 90,847 1,930 1,327 2,557 107 1,805 1 98,5742090 . . . . . . . . . . 93,417 2,011 1,365 2,552 104 1,785 1 101,2362095 . . . . . . . . . . 97,009 2,079 1,412 2,554 103 1,772 1 104,930
Low-cost:2018 . . . . . . . . . . 43,834 2,370 693 3,924 125 1,917 1 52,8642020 . . . . . . . . . . 47,000 2,263 737 3,858 120 1,948 1 55,9272025 . . . . . . . . . . 54,587 1,923 865 3,734 116 2,019 1 63,2452030 . . . . . . . . . . 61,008 1,926 1,009 3,555 117 2,146 1 69,7622035 . . . . . . . . . . 65,070 1,904 1,138 3,358 129 2,265 1 73,8652040 . . . . . . . . . . 66,806 1,785 1,221 3,194 133 2,383 1 75,5242045 . . . . . . . . . . 67,421 1,716 1,235 3,081 131 2,416 1 76,0002050 . . . . . . . . . . 68,609 1,676 1,274 2,979 129 2,409 1 77,0782055 . . . . . . . . . . 70,687 1,661 1,325 2,892 128 2,400 1 79,0942060 . . . . . . . . . . 73,599 1,638 1,382 2,806 129 2,403 1 81,9602065 . . . . . . . . . . 76,450 1,619 1,418 2,747 133 2,448 1 84,8152070 . . . . . . . . . . 79,510 1,610 1,481 2,712 137 2,524 1 87,9742075 . . . . . . . . . . 82,350 1,588 1,553 2,670 140 2,594 1 90,8972080 . . . . . . . . . . 83,977 1,570 1,583 2,625 141 2,638 1 92,5352085 . . . . . . . . . . 85,519 1,604 1,613 2,617 142 2,667 1 94,1622090 . . . . . . . . . . 88,891 1,682 1,694 2,656 144 2,705 1 97,7732095 . . . . . . . . . . 93,996 1,743 1,792 2,709 147 2,758 1 103,147
High-cost:2018 . . . . . . . . . . 43,882 2,371 691 3,931 125 1,913 1 52,9132020 . . . . . . . . . . 47,175 2,262 732 3,872 119 1,928 1 56,0902025 . . . . . . . . . . 55,308 1,909 844 3,768 109 1,930 1 63,8692030 . . . . . . . . . . 62,931 1,966 956 3,461 120 1,863 1 71,2982035 . . . . . . . . . . 68,369 1,954 1,038 3,192 129 1,801 1 76,4832040 . . . . . . . . . . 71,535 1,873 1,064 2,979 128 1,745 1 79,3252045 . . . . . . . . . . 73,429 1,853 1,044 2,835 120 1,674 1 80,9552050 . . . . . . . . . . 75,645 1,865 1,044 2,726 112 1,599 1 82,9932055 . . . . . . . . . . 78,436 1,900 1,045 2,646 104 1,521 1 85,6532060 . . . . . . . . . . 81,903 1,951 1,042 2,577 96 1,441 1 89,0112065 . . . . . . . . . . 85,249 2,017 1,029 2,539 90 1,375 1 92,3002070 . . . . . . . . . . 88,922 2,121 1,038 2,523 85 1,329 1 96,0182075 . . . . . . . . . . 92,590 2,198 1,051 2,505 79 1,289 1 99,7132080 . . . . . . . . . . 94,993 2,263 1,048 2,466 74 1,251 1 102,0962085 . . . . . . . . . . 96,525 2,329 1,043 2,417 70 1,210 1 103,5952090 . . . . . . . . . . 97,973 2,395 1,046 2,374 65 1,171 1 105,0252095 . . . . . . . . . . 99,625 2,441 1,053 2,337 61 1,136 1 106,654
a Retired-worker beneficiaries include persons who also receive a residual benefit consisting of the excess ofan auxiliary benefit over their retired-worker benefit.
Table V.C4.—OASI Beneficiaries With Benefits in Current-Payment Statusat the End of Calendar Years 1945-2095 (Cont.)
[In thousands]
Calendar year
Retired workers and auxiliaries Survivors
TotalWorkera Spouse ChildWidow-
widowerMother-
father Child Parent

Assumptions and Methods
132
5. Disability Insurance BeneficiariesThe DI Trust Fund pays for benefits to disabled workers who: (1) satisfy thedisability insured requirements, (2) are unable to engage in any substantialgainful activity due to a medically determinable physical or mental impair-ment severe enough to satisfy the requirements of the program, and (3) havenot yet attained normal retirement age. Spouses and children of such disabledworkers may also receive DI benefits provided they satisfy certain criteria,primarily age and earnings requirements.
The Office of the Chief Actuary projects the number of disabled-worker ben-eficiaries in current-payment status (disability prevalence) for each futureyear. The projections start with the number in current-payment status as ofDecember 2017. Projections of the number of new beneficiaries awardedbenefits each year (disability incidence) and the number of beneficiariesleaving the disability rolls each year then determine the number in current-payment status in later years. Beneficiaries leave the rolls due to death andrecovery (disability terminations) and due to conversion from disabled-worker to retired-worker beneficiary status at normal retirement age, afterwhich the OASI Trust Fund pays for benefits. The remainder of this sectiondescribes the concepts of disability incidence, termination, and prevalence.
a. Disability Incidence
The disability incidence rate is the ratio of the number of new beneficiariesawarded benefits each year to the number of individuals who meet insuredrequirements but are not yet receiving benefits (the disability-exposed popu-lation1). The Office of the Chief Actuary projects the number of newlyawarded beneficiaries for each future year by multiplying assumed age-sex-specific disability incidence rates and the projected disability-exposed popu-lation by age and sex.
Figure V.C3 illustrates the historical and estimated incidence rates under thethree alternatives. Incidence rates have varied substantially during the histor-ical period since 1970 due to a variety of demographic and economic factors,along with changes in legislation and program administration. The solid linesin figure V.C3 show the incidence rate adjusted to the age-sex distribution ofthe disability-exposed population for 2000. This adjustment allows a com-parison of incidence rates over time by focusing on the likelihood of becom-
1 The disability-exposed population excludes those receiving benefits, while the disability insured popula-tion includes them. Section V.C.3 of this report describes the projection of the disability insured population.

133
Program Assumptions and Methods
ing disabled, and by excluding the effects of a changing distribution of thepopulation toward ages where disability is more or less likely.
The dashed lines in figure V.C3 represent the gross (unadjusted) incidencerates. The changing age-sex distribution of the exposed population over timeinfluences these unadjusted rates. The gross incidence rate fell substantiallybelow the age-sex-adjusted rate between 1975 and 1995 as the baby-boomgeneration swelled the size of the younger working-age population, wheredisability incidence is lower than in older populations. After 1995, the grossrate generally increased relative to the age-sex-adjusted rate as the baby-boom generation moved into an age range where disability incidence peaks.After 2023, the projected gross incidence rate generally declines relative tothe age-sex-adjusted rate as the baby-boom generation moves above the nor-mal retirement age and the lower-birth-rate cohorts of the 1970s enter primedisability ages (50 to normal retirement age). As these smaller cohorts agebeyond normal retirement age, by about 2050, the gross incidence ratereturns to a higher relative level under the intermediate assumptions. There-after, the gross rate remains higher than the age-sex-adjusted rate, andreflects the persistently higher average age of the working-age population,which is largely due to lower birth rates since 1965, and to the increase in thenormal retirement age.
For the first 10 years of the projection period (through 2027), incidence ratesreflect several factors including: (1) aspects of program administration, suchas efforts to reduce the disability determination backlogs and recent changesin procedures for adjudicating claims; (2) assumed future unemploymentrates; and (3) recent trends in incidence. At the beginning of the recentperiod of high unemployment, disability incidence rates were well above thegeneral trend level, with rates reaching a peak in 2010. Over the last fewyears, incidence rates have subsided as the economy has recovered, and havepersisted at levels well below those expected over the long-term. Some of theelevation of disability incidence rates experienced during the recession andthe lowering of incidence rates experienced during the recovery are likelydue to many individuals applying for disability benefits earlier than theywould have otherwise. For 2017, the actual incidence rate (4.3 per thousand)was below the level projected in last year’s report (4.7 per thousand). In thisyear’s report, incidence rates are assumed to rise more gradually early in theshort-range period than in last year’s report, but are slightly higher late in theperiod. Incidence rates are assumed to be somewhat elevated during theperiod 2018 through 2022, when the Social Security Administration isexpected to eliminate a backlog of individuals who have appealed for a hear-ing on a prior disability claim denial. In 2027, at the end of the short-range
Assumptions and Methods
134
period, age-sex-specific incidence rates reach the ultimate rates assumed forthe long-range projections. These ultimate age-sex-specific disability inci-dence rates were selected based on careful analysis of historical levels andpatterns and expected future conditions, including the impact of scheduledincreases in the normal retirement age.1 The ultimate incidence rates repre-sent the expected average rates of incidence for the future.
For the intermediate alternative, the Trustees assume that the ultimate age-sex-adjusted incidence rate (adjusted to the disability-exposed population forthe year 2000) will be 5.4 awards per thousand exposed, which is the same asin last year’s report. Figure V.C3 illustrates that the estimated ultimate age-sex-adjusted incidence rate of 5.4 is slightly higher than the average rate forthe historical period 1970 through 2017, reflecting the increase in femaleincidence rates over this period. However, a similar comparison using grossincidence rates gives a very different result. The estimated ultimate grossincidence rate is substantially greater than the average gross rate over the his-torical period due to the large changes in the age-sex distribution of the dis-ability-exposed population between 1970 and 2010.
The Trustees assume that the ultimate age-sex-adjusted incidence rates forthe low-cost and high-cost alternatives will be 4.3 and 6.4 awards per thou-sand exposed, or about 17 percent lower and 23 percent higher than the aver-age for the historical period, respectively. These ultimate age-sex-adjustedincidence rates are similar to those in last year’s report.
1 Projected incidence rates are adjusted upward to account for additional workers who are expected to filefor disability benefits (rather than retirement benefits) in response to reductions in retirement benefits as thenormal retirement age rises.

135
Program Assumptions and Methods
b. Disability Termination
Beneficiaries stop receiving disability benefits when they die, recover fromtheir medically-determinable disabling condition, or return to work. Dis-abled-worker beneficiaries who return to substantial work for an extendedperiod are deemed to have recovered, and their benefits are then terminated.The termination rate is the ratio of the number of terminations for these rea-sons to the average number of disabled-worker beneficiaries during the year.
The Office of the Chief Actuary projects termination rates by age, sex, andreason for termination. In addition, the office projects termination rates byduration of entitlement to disabled-worker benefits in the long-range period(post-2027).
In the short-range period (through 2027), the projected age-sex-adjusteddeath rate (adjusted to the 2000 disabled-worker population) under the inter-mediate assumptions gradually declines from 25.4 deaths per thousand bene-ficiaries for 2017 to about 23.7 per thousand for 2027. The projected age-sex-adjusted recovery rate (medical improvement and return to work) underthe intermediate assumptions decreases from the relatively high level of18.2 per thousand beneficiaries for 2017 to 11.0 per thousand beneficiaries
Figure V.C3.—DI Disability Incidence Rates, 1970-2095[Awards per thousand disability-exposed]
0
1
2
3
4
5
6
7
8
9
1970 1980 1990 2000 2010 2020 2030 2040 2050 2060 2070 2080 2090
Calendar year
Gross incidence rates
Age-sex-adjustedincidence rates
I
II
III
Historical Estimated

Assumptions and Methods
136
for 2027. The recovery rate has been high due to an ongoing administrativeeffort to work down a backlog of continuing disability reviews. The rate isexpected to decrease as the backlog is reduced. Under the low-cost and high-cost assumptions, total age-sex-adjusted termination rates due to death andrecovery are roughly 10-15 percent higher or lower, respectively, than underthe intermediate assumptions.
For the long-range period (post-2027), the Office of the Chief Actuary proj-ects death and recovery rates by age, sex, and duration of entitlement relativeto the average level of rates experienced over the base period 2006 through2010. The assumed ultimate age-sex-adjusted recovery rate for disabledworkers is about 10.3 per thousand beneficiaries. The assumed ultimate age-sex-adjusted recovery rates for the low-cost and high-cost alternatives areabout 12.5 and 8.2 recoveries per thousand beneficiaries, respectively.Recovery rates by age, sex, and duration of entitlement reach ultimate levelsin the twentieth year of the projection period (2037) for all three sets ofassumptions. In contrast, death rates by age and sex change throughout thelong-range period at the same rate as death rates in the general population.From the age-sex-adjusted death rate of 25.4 per thousand beneficiaries in2017, this rate decreases to 18.1, 11.3, and 6.6 per thousand disabled-workerbeneficiaries for 2095 under the low-cost, intermediate, and high-costassumptions, respectively.
Figure V.C4 illustrates gross and age-sex-adjusted total termination rates(including both recoveries and deaths) for disabled-worker beneficiaries forthe historical period since 1970, and for the projection period through 2095.In the near term, through 2018, recovery terminations are projected to remainat relatively high levels, consistent with the assumption that the Social Secu-rity Administration will receive sufficient budget appropriations to reducethe pending backlog of continuing disability reviews. As with incidencerates, the age-sex-adjusted termination rate illustrates the real change in thetendency to terminate benefits. Changes in the age-sex distribution of thebeneficiary population influence the gross termination rate. A shift in the dis-abled-worker beneficiary population to older ages, as occurred over the past20 years when the baby-boom generation moved into pre-retirement ages,increases gross death termination rates relative to the age-sex-adjusted rates.

137
Program Assumptions and Methods
c. Comparison of Incidence, Termination, and Conversion
Incidence and termination rates are the foundation for projecting the numberof disabled-worker beneficiaries in current-payment status. At normal retire-ment age, disabled-worker beneficiaries convert to retired-worker status andleave the DI rolls.
Figure V.C5 compares the historical and projected (intermediate) levels ofincidence, termination, and conversion on both a gross basis and an age-sex-adjusted basis. Incidence rates have varied widely, and the Trustees expectthe age-sex adjusted rates under the intermediate assumptions to remain nearthe middle of the high and low extremes experienced since 1970. Termina-tion rates have declined and the Trustees expect them to continue to decline,largely because of declining death rates.
Conversions are simply a transfer of beneficiaries at normal retirement agefrom the DI program to the OASI program. Therefore, the disability “conver-sion” rate is 100 percent for disabled-worker beneficiaries reaching normalretirement age in a given year and zero at all other ages. After conversion,recovery from the disabling condition is no longer relevant for benefit eligi-bility. The conversion ratio is the number of conversions in a given year (that
Figure V.C4.—DI Disability Termination Rates, 1970-2095[Terminations per thousand disabled-worker beneficiaries]
0
20
40
60
80
100
120
140
1970 1980 1990 2000 2010 2020 2030 2040 2050 2060 2070 2080 2090
Calendar year
Gross termination rates
Age-sex-adjustedtermination rates
II
III
I
Historical Estimated

Assumptions and Methods
138
is, beneficiaries who reach normal retirement age) divided by the averagenumber of disabled-worker beneficiaries at all ages in that year. The ratio isconstant on an age-sex-adjusted basis, except for the two periods duringwhich normal retirement age increases under current law. On a gross basis,however, the conversion ratio rises and falls with the changing proportion ofall disabled-worker beneficiaries who attain normal retirement age in a givenyear. The gross conversion ratio generally increases from 2002 to 2030 dueto aging of the beneficiary population.
d. DI Beneficiaries and Disability Prevalence Rates
The Office of the Chief Actuary makes detailed projections of disabled-worker awards, terminations, and conversions and combines these to projectthe number of disabled workers receiving benefits over the next 75 years.Table V.C5 presents the projected numbers of disabled workers in current-payment status. The number of disabled workers in current-payment statusgrows from 8.7 million at the end of 2017, to 12.7 million, 14.5 million, and15.4 million at the end of 2095, under the low-cost, intermediate, and high-cost assumptions, respectively. Of course, much of this growth results from
Figure V.C5.—Comparison of DI Disability Incidence Rates, Termination Rates and Conversion Ratios Under Intermediate Assumptions, 1970-2095
[Awards per thousand disability-exposed;terminations and conversions per thousand disabled-worker beneficiaries]
0
20
40
60
80
100
120
140
160
0
1
2
3
4
5
6
7
8
1970 1980 1990 2000 2010 2020 2030 2040 2050 2060 2070 2080 2090
Ter
min
atio
n r
ates
&C
on
ver
sio
n r
atio
s
Inci
den
ce r
ates
Calendar year
Gross incidence rates
Age-sex-adjusted incidence rates
Gross conversion ratios
Age-sex-adjusted conversion ratios
Gross termination rates
Historical Estimated
Age-sex-adjusted termination rates
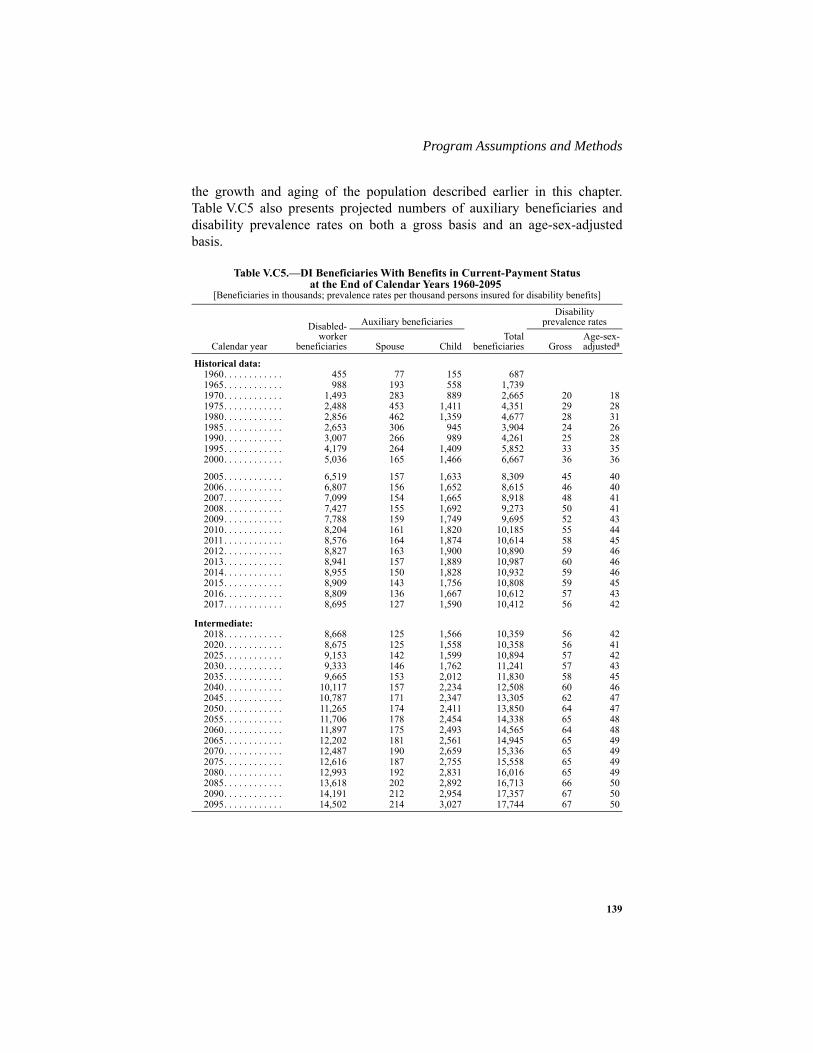
139
Program Assumptions and Methods
the growth and aging of the population described earlier in this chapter.Table V.C5 also presents projected numbers of auxiliary beneficiaries anddisability prevalence rates on both a gross basis and an age-sex-adjustedbasis.
Table V.C5.—DI Beneficiaries With Benefits in Current-Payment Statusat the End of Calendar Years 1960-2095
[Beneficiaries in thousands; prevalence rates per thousand persons insured for disability benefits]
Calendar year
Disabled-worker
beneficiaries
Auxiliary beneficiariesTotal
beneficiaries
Disabilityprevalence rates
Spouse Child GrossAge-sex-adjusteda
Historical data:1960. . . . . . . . . . . . 455 77 155 6871965. . . . . . . . . . . . 988 193 558 1,7391970. . . . . . . . . . . . 1,493 283 889 2,665 20 181975. . . . . . . . . . . . 2,488 453 1,411 4,351 29 281980. . . . . . . . . . . . 2,856 462 1,359 4,677 28 311985. . . . . . . . . . . . 2,653 306 945 3,904 24 261990. . . . . . . . . . . . 3,007 266 989 4,261 25 281995. . . . . . . . . . . . 4,179 264 1,409 5,852 33 352000. . . . . . . . . . . . 5,036 165 1,466 6,667 36 36
2005. . . . . . . . . . . . 6,519 157 1,633 8,309 45 402006. . . . . . . . . . . . 6,807 156 1,652 8,615 46 402007. . . . . . . . . . . . 7,099 154 1,665 8,918 48 412008. . . . . . . . . . . . 7,427 155 1,692 9,273 50 412009. . . . . . . . . . . . 7,788 159 1,749 9,695 52 432010. . . . . . . . . . . . 8,204 161 1,820 10,185 55 442011. . . . . . . . . . . . 8,576 164 1,874 10,614 58 452012. . . . . . . . . . . . 8,827 163 1,900 10,890 59 462013. . . . . . . . . . . . 8,941 157 1,889 10,987 60 462014. . . . . . . . . . . . 8,955 150 1,828 10,932 59 462015. . . . . . . . . . . . 8,909 143 1,756 10,808 59 452016. . . . . . . . . . . . 8,809 136 1,667 10,612 57 432017. . . . . . . . . . . . 8,695 127 1,590 10,412 56 42
Intermediate:2018. . . . . . . . . . . . 8,668 125 1,566 10,359 56 422020. . . . . . . . . . . . 8,675 125 1,558 10,358 56 412025. . . . . . . . . . . . 9,153 142 1,599 10,894 57 422030. . . . . . . . . . . . 9,333 146 1,762 11,241 57 432035. . . . . . . . . . . . 9,665 153 2,012 11,830 58 452040. . . . . . . . . . . . 10,117 157 2,234 12,508 60 462045. . . . . . . . . . . . 10,787 171 2,347 13,305 62 472050. . . . . . . . . . . . 11,265 174 2,411 13,850 64 472055. . . . . . . . . . . . 11,706 178 2,454 14,338 65 482060. . . . . . . . . . . . 11,897 175 2,493 14,565 64 482065. . . . . . . . . . . . 12,202 181 2,561 14,945 65 492070. . . . . . . . . . . . 12,487 190 2,659 15,336 65 492075. . . . . . . . . . . . 12,616 187 2,755 15,558 65 492080. . . . . . . . . . . . 12,993 192 2,831 16,016 65 492085. . . . . . . . . . . . 13,618 202 2,892 16,713 66 502090. . . . . . . . . . . . 14,191 212 2,954 17,357 67 502095. . . . . . . . . . . . 14,502 214 3,027 17,744 67 50

Assumptions and Methods
140
Note: Totals do not necessarily equal the sums of rounded components.
The disability prevalence rate is the ratio of the number of disabled-workerbeneficiaries in current-payment status to the number of persons insured fordisability benefits. Figure V.C6 illustrates the historical and projected dis-ability prevalence rates on both a gross basis and on an age-sex-adjustedbasis (adjusted to the age-sex distribution of the disability insured populationfor the year 2000).
Changes in prevalence rates are a direct result of changes in incidence ratesand termination rates. Figure V.C5 depicts patterns for incidence and termi-
Low-cost:2018. . . . . . . . . . . . 8,594 125 1,548 10,267 55 412020. . . . . . . . . . . . 8,414 123 1,499 10,036 54 402025. . . . . . . . . . . . 8,390 140 1,466 9,996 52 382030. . . . . . . . . . . . 8,140 124 1,573 9,837 49 372035. . . . . . . . . . . . 8,099 121 1,776 9,997 48 372040. . . . . . . . . . . . 8,211 117 1,956 10,284 48 372045. . . . . . . . . . . . 8,591 122 2,038 10,752 48 372050. . . . . . . . . . . . 8,890 121 2,082 11,093 48 372055. . . . . . . . . . . . 9,207 122 2,123 11,452 48 372060. . . . . . . . . . . . 9,371 118 2,182 11,672 47 372065. . . . . . . . . . . . 9,659 120 2,287 12,065 47 372070. . . . . . . . . . . . 9,972 125 2,429 12,526 47 382075. . . . . . . . . . . . 10,227 124 2,567 12,918 46 382080. . . . . . . . . . . . 10,747 129 2,678 13,554 47 382085. . . . . . . . . . . . 11,542 140 2,774 14,456 48 382090. . . . . . . . . . . . 12,259 149 2,876 15,284 49 382095. . . . . . . . . . . . 12,682 150 2,998 15,830 49 38
High-cost:2018. . . . . . . . . . . . 8,741 126 1,583 10,450 57 422020. . . . . . . . . . . . 8,935 126 1,612 10,673 58 432025. . . . . . . . . . . . 9,915 144 1,711 11,770 63 462030. . . . . . . . . . . . 10,553 172 1,932 12,658 66 502035. . . . . . . . . . . . 11,273 191 2,191 13,655 69 532040. . . . . . . . . . . . 12,085 206 2,410 14,701 73 552045. . . . . . . . . . . . 13,063 231 2,541 15,835 78 572050. . . . . . . . . . . . 13,721 239 2,619 16,578 81 592055. . . . . . . . . . . . 14,269 246 2,652 17,168 83 602060. . . . . . . . . . . . 14,456 246 2,654 17,357 84 602065. . . . . . . . . . . . 14,726 253 2,660 17,639 86 612070. . . . . . . . . . . . 14,900 266 2,683 17,849 87 612075. . . . . . . . . . . . 14,773 261 2,712 17,746 86 612080. . . . . . . . . . . . 14,815 264 2,737 17,815 86 612085. . . . . . . . . . . . 15,020 267 2,752 18,039 87 622090. . . . . . . . . . . . 15,270 273 2,762 18,305 88 622095. . . . . . . . . . . . 15,401 275 2,773 18,450 88 62
a Adjusted to the age-sex distribution of the disability insured population for the year 2000.
Table V.C5.—DI Beneficiaries With Benefits in Current-Payment Statusat the End of Calendar Years 1960-2095 (Cont.)
[Beneficiaries in thousands; prevalence rates per thousand persons insured for disability benefits]
Calendar year
Disabled-worker
beneficiaries
Auxiliary beneficiariesTotal
beneficiaries
Disabilityprevalence rates
Spouse Child GrossAge-sex-adjusteda

141
Program Assumptions and Methods
nation rates, which are helpful for understanding the trend in prevalencerates. Annual incidence and termination rates are not directly comparable orcombinable because their denominators differ.
Age-sex-adjusted prevalence rates have increased primarily because: (1) ter-mination rates, in particular death termination rates, have declined,(2) incidence rates at younger ages have increased relative to rates at olderages (new beneficiaries at younger ages have more potential years on the dis-ability rolls), and (3) incidence rates have increased substantially for womento parity with men. Gross prevalence rates have increased more than age-sex-adjusted prevalence rates since the baby-boom generation began to reachages 45 through normal retirement age, a time of life when disability inci-dence rates are relatively high. The Office of the Chief Actuary projects bothgross and age-sex adjusted prevalence rates to grow at a slower pace basedon assumed stabilization in three factors: (1) the age distribution of the gen-eral population, (2) the age distribution of the disability insured population,and (3) incidence rates by age and gender. As these factors gradually stabi-lize, the declining death termination rate continues to have a small influencetoward higher disability prevalence rates.
Figure V.C6.—DI Disability Prevalence Rates, 1970-2095[Rate per thousand persons insured for disability benefits]
0
10
20
30
40
50
60
70
80
90
100
1970 1980 1990 2000 2010 2020 2030 2040 2050 2060 2070 2080 2090
Calendar year
Gross prevalence rates
Age-sex-adjustedprevalence rates
III
II
II
I
I
Historical Estimated
III
Assumptions and Methods
142
As mentioned above in the discussion of incidence and termination rates, theage-sex-adjusted prevalence rate isolates the changing trend in the underly-ing likelihood of receiving benefits for the insured population, withoutreflecting changes in the age distribution of the population. As with inci-dence rates, gross disability prevalence rates declined relative to the age-sex-adjusted rate when the baby-boom generation reached working age between1970 and 1990; this trend reflects the lower disability prevalence rates asso-ciated with younger ages. Conversely, the gross rate of disability prevalencehas increased relative to the age-sex-adjusted rate after 1990 due to the agingof the baby-boom generation into ages with higher disability prevalencerates.
Under the intermediate assumptions, the projected age-sex-adjusted disabil-ity prevalence rate grows from 42.2 per thousand disability insured at the endof 2017 to 49.9 per thousand at the end of 2095. As mentioned above, theOffice of the Chief Actuary projects that the growth in prevalence will slowrelative to the historical period.
Under the low-cost and high-cost assumptions, the age-sex-adjusted disabil-ity prevalence rate decreases to 38.3 per thousand and increases to 62.0 perthousand insured workers at the end of 2095, respectively.
Table V.C5 presents projections of the numbers of auxiliary beneficiariespaid from the DI Trust Fund. As indicated at the beginning of this subsec-tion, auxiliary beneficiaries are qualifying spouses and children of disabledworkers. A spouse must either be at least age 62 or have an eligible childbeneficiary in his or her care who is either under age 16 or disabled prior toage 22. A child must be: (1) under age 18, (2) age 18 or 19 and still a studentin high school, or (3) age 18 or older and disabled prior to age 22.
The projection of the number of auxiliary beneficiaries relies on the pro-jected number of disabled-worker beneficiaries. In the short-range period(2018 through 2027), the Office of the Chief Actuary projects incidence andtermination rates for each category of auxiliary beneficiary. After 2027, theoffice projects child beneficiaries at ages 18 and under in relation to the pro-jected number of children in the population using the probability that eitherof their parents is a disabled-worker beneficiary. The office projects theremaining categories of children and spouses in a similar manner.
6. Covered and Taxable Earnings, Taxable Payroll, and Payroll TaxContributionsCovered earnings are the sum of covered wages and covered self-employ-ment net earnings. The Office of the Chief Actuary projects covered wages

143
Program Assumptions and Methods
for component sectors of the economy (i.e., private, State and local, Federalcivilian, and military) based on the projected overall growth of sectoral andtotal wages in the U.S. economy. The projections of covered wages alsoreflect changes in covered employment due to a relative increase in non-cov-ered undocumented immigrants and to the mandatory coverage of new hiresin the Federal civilian sector. The office projects covered self-employmentnet earnings based on the growth in net proprietors’ income in the U.S. econ-omy.
Taxable earnings are the amount of covered earnings subject to the SocialSecurity payroll tax. Taxable wages for an employee are total covered wagesfrom all wage employment up to the contribution and benefit base. Taxablewages for an employer are the sum of all covered wages paid to eachemployee up to the base. Employees with multiple jobs whose total wagesexceed the base are eligible for a refund of excess employee taxes withheld;employers are not eligible for a refund on this basis. For self-employedworkers with no taxable wages, taxable earnings are the amount of coveredself-employment net earnings up to the base. For self-employed workerswith taxable wages less than the base, covered self-employment net earningsare taxable up to the difference between the base and their taxable wages.For projection purposes, the Office of the Chief Actuary computes taxableearnings based on a proportion of covered earnings that is at or below thebase.
The OASDI taxable payroll (see table VI.G6) for a year is the amount ofearnings which, when multiplied by the combined OASDI employee-employer payroll tax rate for that year, yields the total amount of payrolltaxes due from wages paid and self-employment net earnings for the year.The Trustees use taxable payroll to determine income rates, cost rates, andactuarial balances. Taxable payroll is derived by adjusting total taxable earn-ings to account for categories of earnings that are taxed at rates other than thecombined employee-employer rate and to take into account amounts creditedas wages that were not included in normally reported wages. For 1951 andlater, taxable earnings are reduced by one-half of the amount of wages paidto employees with multiple jobs that exceed the contribution and benefitbase. For 1983 through 2001, deemed wage credits for military service after1956 are added to taxable earnings. The self-employment tax rates for1951 through 1983 were less than the combined employee-employer rates;therefore, the self-employment component of taxable payroll for those yearsis reduced by multiplying the ratio of the self-employment rate to the com-bined employee-employer rate times the taxable self-employment net earn-ings. Finally, for 1966 through 1979, employers were exempt from paying
Assumptions and Methods
144
their share of payroll tax on their employees’ tips and, for 1980 through1987, employers paid tax on only part of their employees’ tips. For thoseyears, the taxable payroll is reduced by half of the amount of tips for whichthe employer owed no payroll tax.
The ratio of taxable payroll to covered earnings (the taxable ratio) fell from88.6 percent for 1984 to 82.6 percent for 2000, mostly due to much higherincreases in wage levels for very high earners than for all other earners. From2000 to 2010, the taxable ratio varied with the business cycle, rising duringeconomic downturns and falling during recoveries. Specifically, the taxableratio rose to 85.7 percent for 2002, declined to 82.4 percent for 2007, rose to85.2 percent for 2009, and was 82.7 percent for 2016.
For this report, the Trustees assume a level for the taxable ratio at the end ofthe short-range period (2027) of 82.5 percent for the intermediate assump-tions, 81.0 percent for the high-cost assumptions, and 84.0 percent for thelow-cost assumptions. These are the same assumptions that the Trusteesmade for the end of the short-range period (2026) for the 2017 report.
The Office of the Chief Actuary projects payroll tax contributions using thepatterns of tax collection required by Federal laws and regulations. Theoffice determines payroll tax liabilities by multiplying the scheduled tax ratesfor each year by the amount of taxable wages and self-employment net earn-ings for that year. The office then splits these liabilities into amounts by col-lection period. For wages, Federal law requires that employers withholdOASDI and HI payroll taxes and Federal individual income taxes fromemployees’ pay. As an employer’s accumulation of such taxes (including theemployer share of payroll taxes) meets certain thresholds, which the Depart-ment of the Treasury determines, the employer must deposit these taxes withthe U.S. Treasury by a specific day, depending on the amount of moneyinvolved.1 For projection purposes, the office splits the payroll tax contribu-tions related to wages into amounts paid in the same quarter as incurred andin the following quarter. Self-employed workers must make estimated taxpayments on their earnings four times during the year and make up anyunderestimate on their individual income tax returns. The projection splitsthe self-employed tax liabilities by collection quarter to reflect this pattern ofreceipts.
1 Generally, the higher the amount of liability, the sooner the taxes must be paid. For smaller employers,payment is due by the middle of the month following when the liability was incurred. Medium-size employ-ers have three banking days in which to make their deposits. Larger employers must make payment on thenext business day after paying their employees.

145
Program Assumptions and Methods
The projected tax contributions also reflect the method used to ensure thatmoney transferred to the trust funds is adjusted, over time, to equal the actualliability owed. Because payers generally make tax payments without identi-fying the separate OASDI contribution amounts, Treasury makes daily trans-fers of money from the General Fund to the trust funds on an initialestimated basis. The Social Security Administration periodically certifies theamounts of wages and self-employment net earnings on which tax contribu-tions are owed for each year, at which time Treasury determines adjustmentsto appropriations to reconcile tax liabilities with deposits in the trust funds.This process also includes periodic transfers from the trust funds to the Gen-eral Fund for contributions on wages in excess of the contribution and bene-fit base.
Table V.C6 shows the payroll tax contribution rates applicable under currentlaw in each calendar year and the allocation of these rates between the OASIand DI Trust Funds.1 It also shows the contribution and benefit base for eachyear through 2018.
1 Table VI.G1 shows the payroll tax contribution rates for the Hospital Insurance (HI) program.

Assumptions and Methods
146
Table V.C6.—Contribution and Benefit Base and Payroll Tax Contribution Rates
Calendar years
Contributionand benefit
base
Payroll tax contribution rates (percent)Employees and employers,
combineda Self-employedb
OASDI OASI DI OASDI OASI DI
1937-49 . . . . . . . . . $3,000 2.00 2.00 — — — —1950. . . . . . . . . . . . 3,000 3.00 3.00 — — — —1951-53 . . . . . . . . . 3,600 3.00 3.00 — 2.2500 2.2500 —1954. . . . . . . . . . . . 3,600 4.00 4.00 — 3.0000 3.0000 —1955-56 . . . . . . . . . 4,200 4.00 4.00 — 3.0000 3.0000 —
1957-58 . . . . . . . . . 4,200 4.50 4.00 0.50 3.3750 3.0000 0.37501959. . . . . . . . . . . . 4,800 5.00 4.50 .50 3.7500 3.3750 .37501960-61 . . . . . . . . . 4,800 6.00 5.50 .50 4.5000 4.1250 .37501962. . . . . . . . . . . . 4,800 6.25 5.75 .50 4.7000 4.3250 .37501963-65 . . . . . . . . . 4,800 7.25 6.75 .50 5.4000 5.0250 .3750
1966. . . . . . . . . . . . 6,600 7.70 7.00 .70 5.8000 5.2750 .52501967. . . . . . . . . . . . 6,600 7.80 7.10 .70 5.9000 5.3750 .52501968. . . . . . . . . . . . 7,800 7.60 6.65 .95 5.8000 5.0875 .71251969. . . . . . . . . . . . 7,800 8.40 7.45 .95 6.3000 5.5875 .71251970. . . . . . . . . . . . 7,800 8.40 7.30 1.10 6.3000 5.4750 .8250
1971. . . . . . . . . . . . 7,800 9.20 8.10 1.10 6.9000 6.0750 .82501972. . . . . . . . . . . . 9,000 9.20 8.10 1.10 6.9000 6.0750 .82501973. . . . . . . . . . . . 10,800 9.70 8.60 1.10 7.0000 6.2050 .79501974. . . . . . . . . . . . 13,200 9.90 8.75 1.15 7.0000 6.1850 .81501975. . . . . . . . . . . . 14,100 9.90 8.75 1.15 7.0000 6.1850 .8150
1976. . . . . . . . . . . . 15,300 9.90 8.75 1.15 7.0000 6.1850 .81501977. . . . . . . . . . . . 16,500 9.90 8.75 1.15 7.0000 6.1850 .81501978. . . . . . . . . . . . 17,700 10.10 8.55 1.55 7.1000 6.0100 1.09001979. . . . . . . . . . . . 22,900 10.16 8.66 1.50 7.0500 6.0100 1.04001980. . . . . . . . . . . . 25,900 10.16 9.04 1.12 7.0500 6.2725 .7775
1981. . . . . . . . . . . . 29,700 10.70 9.40 1.30 8.0000 7.0250 .97501982. . . . . . . . . . . . 32,400 10.80 9.15 1.65 8.0500 6.8125 1.23751983. . . . . . . . . . . . 35,700 10.80 9.55 1.25 8.0500 7.1125 .93751984c. . . . . . . . . . . 37,800 11.40 10.40 1.00 11.4000 10.4000 1.00001985c. . . . . . . . . . . 39,600 11.40 10.40 1.00 11.4000 10.4000 1.0000
1986c. . . . . . . . . . . 42,000 11.40 10.40 1.00 11.4000 10.4000 1.00001987c. . . . . . . . . . . 43,800 11.40 10.40 1.00 11.4000 10.4000 1.00001988c. . . . . . . . . . . 45,000 12.12 11.06 1.06 12.1200 11.0600 1.06001989c. . . . . . . . . . . 48,000 12.12 11.06 1.06 12.1200 11.0600 1.06001990 . . . . . . . . . . . 51,300 12.40 11.20 1.20 12.4000 11.2000 1.2000
1991. . . . . . . . . . . . 53,400 12.40 11.20 1.20 12.4000 11.2000 1.20001992. . . . . . . . . . . . 55,500 12.40 11.20 1.20 12.4000 11.2000 1.20001993. . . . . . . . . . . . 57,600 12.40 11.20 1.20 12.4000 11.2000 1.20001994. . . . . . . . . . . . 60,600 12.40 10.52 1.88 12.4000 10.5200 1.88001995. . . . . . . . . . . . 61,200 12.40 10.52 1.88 12.4000 10.5200 1.8800
1996. . . . . . . . . . . . 62,700 12.40 10.52 1.88 12.4000 10.5200 1.88001997. . . . . . . . . . . . 65,400 12.40 10.70 1.70 12.4000 10.7000 1.70001998. . . . . . . . . . . . 68,400 12.40 10.70 1.70 12.4000 10.7000 1.70001999. . . . . . . . . . . . 72,600 12.40 10.70 1.70 12.4000 10.7000 1.70002000. . . . . . . . . . . . 76,200 12.40 10.60 1.80 12.4000 10.6000 1.8000
2001. . . . . . . . . . . . 80,400 12.40 10.60 1.80 12.4000 10.6000 1.80002002. . . . . . . . . . . . 84,900 12.40 10.60 1.80 12.4000 10.6000 1.80002003. . . . . . . . . . . . 87,000 12.40 10.60 1.80 12.4000 10.6000 1.80002004. . . . . . . . . . . . 87,900 12.40 10.60 1.80 12.4000 10.6000 1.80002005. . . . . . . . . . . . 90,000 12.40 10.60 1.80 12.4000 10.6000 1.8000

147
Program Assumptions and Methods
7. Income From Taxation of BenefitsUnder current law, the OASI and DI Trust Funds are credited with incometax revenue from the taxation of up to the first 50 percent of OASI and DIbenefit payments. (The HI Trust Fund receives the remainder of the incometax revenue from the taxation of up to 85 percent of OASI and DI benefitpayments.) Benefits are taxed for beneficiaries with adjusted income (includ-ing half of benefits and all non-taxable interest) exceeding specified thresh-old amounts. The threshold amounts are $25,000 for single filers, $32,000for joint filers, and $0 for those married but filing separately.
For the short-range period, the Office of the Chief Actuary estimates theincome to the trust funds from taxation of benefits by applying the following
2006. . . . . . . . . . . . $94,200 12.40 10.60 1.80 12.4000 10.6000 1.80002007. . . . . . . . . . . . 97,500 12.40 10.60 1.80 12.4000 10.6000 1.80002008. . . . . . . . . . . . 102,000 12.40 10.60 1.80 12.4000 10.6000 1.80002009. . . . . . . . . . . . 106,800 12.40 10.60 1.80 12.4000 10.6000 1.80002010d . . . . . . . . . . . 106,800 12.40 10.60 1.80 12.4000 10.6000 1.8000
2011d . . . . . . . . . . . 106,800 10.40 8.89 1.51 10.4000 8.8900 1.51002012d . . . . . . . . . . . 110,100 10.40 8.89 1.51 10.4000 8.8900 1.51002013. . . . . . . . . . . . 113,700 12.40 10.60 1.80 12.4000 10.6000 1.80002014. . . . . . . . . . . . 117,000 12.40 10.60 1.80 12.4000 10.6000 1.80002015. . . . . . . . . . . . 118,500 12.40 10.60 1.80 12.4000 10.6000 1.8000
2016e . . . . . . . . . . . 118,500 12.40 10.03 2.37 12.4000 10.0300 2.37002017e . . . . . . . . . . . 127,200 12.40 10.03 2.37 12.4000 10.0300 2.37002018e . . . . . . . . . . . 128,400 12.40 10.03 2.37 12.4000 10.0300 2.37002019 and later . . . . f 12.40 10.60 1.80 12.4000 10.6000 1.8000
a Except as noted below, the combined employee/employer rate is divided equally between employees andemployers.b Beginning in 1990, self-employed persons receive a deduction, for purposes of computing their net earn-ings, equal to half of the combined OASDI and HI contributions that would be payable without regard to thecontribution and benefit base. The OASDI contribution rate then applies to net earnings after this deduction,but subject to the OASDI base.c In 1984 only, employees received an immediate credit of 0.3 percent of taxable wages against their OASDIpayroll tax contributions. The self-employed received similar credits of 2.7 percent, 2.3 percent, and2.0 percent against their combined OASDI and Hospital Insurance (HI) contributions on net earnings fromself-employment in 1984, 1985, and 1986-89, respectively. The General Fund of the Treasury reimbursed thetrust funds for these credits.d Public Law 111-147 exempted most employers from paying the employer share of OASDI payroll tax onwages paid during the period March 19, 2010 through December 31, 2010 to certain qualified individualshired after February 3, 2010. Public Law 111-312 reduced the OASDI payroll tax rate for 2011 by2 percentage points for employees and for self-employed workers. Public Law 112-96 extended the 2011rate reduction through 2012. These laws require that the General Fund of the Treasury reimburse the OASIand DI Trust Funds for these temporary reductions in 2010 through 2012 payroll tax revenue, in order to“replicate to the extent possible” revenue that would have been received if the combined employee/employerpayroll tax rates had remained at 12.4 percent for OASDI (10.6 percent for OASI and 1.8 percent for DI).e Section 833 of the Bipartisan Budget Act of 2015 reallocated payroll tax rates on a temporary basis. Forearnings in calendar years 2016 through 2018, 0.57 percentage point of the 12.40 percent OASDI payroll taxrate is reallocated from OASI to DI.f Subject to automatic adjustment based on increases in average wages.
Table V.C6.—Contribution and Benefit Base and Payroll Tax Contribution Rates (Cont.)
Calendar years
Contributionand benefit
base
Payroll tax contribution rates (percent)Employees and employers,
combineda Self-employedb
OASDI OASI DI OASDI OASI DI
Assumptions and Methods
148
two factors (projected by the Office of Tax Analysis, Department of the Trea-sury) to total OASI and DI scheduled benefits: (1) the percentage of sched-uled benefits (limited to 50 percent) that is taxable and (2) the averagemarginal tax rate applicable to those benefits.
For the long-range period, the office estimates the income to the trust fundsfrom taxation of benefits by applying projected ratios of taxation of OASIand DI benefits to total OASI and DI scheduled benefits. The income thresh-olds used for benefit taxation are, by law, constant in the future, whileincome and benefit levels continue to rise. Accordingly, projected ratios ofincome from taxation of benefits to the amount of benefits increase gradu-ally. Ultimate tax ratios for OASI and DI benefits used in the projection relyon estimates from the Office of Tax Analysis in the Department of the Trea-sury.
8. Average BenefitsProjections of average benefits for each benefit type reflect recent historicalaverages, projected average primary insurance amounts (PIAs), and pro-jected ratios of average benefits to average PIAs. Calculations of averagePIAs are based on projected distributions of beneficiaries by duration fromyear of initial entitlement, average PIAs at initial entitlement, and increasesin PIAs after initial entitlement. Projected increases in average PIAs after ini-tial entitlement depend on automatic benefit increases, recomputations toreflect additional covered earnings, and differences in mortality by level oflifetime earnings. Calculations of future average PIAs at initial entitlementare based on projected earnings histories, which in turn reflect a combinationof the actual earnings histories associated with a sample of 2015 initial enti-tlements and more recent actual earnings levels by age and sex for coveredworkers.
For retired-worker, aged-spouse, and aged-widow(er) benefits, the percent-age of the PIA that is payable depends on the age at initial entitlement tobenefits. Projected ratios of average benefits to average PIAs for these typesof benefits are based on projections of age distributions at initial entitlement.
9. Scheduled BenefitsFor each type of benefit, scheduled benefits are the product of the number ofbeneficiaries and the corresponding average monthly benefit. The short-range model calculates scheduled benefits on a quarterly basis. The long-range model calculates all scheduled benefits on an annual basis, using thenumber of beneficiaries at the beginning and end of the year. Adjustments to

149
Program Assumptions and Methods
these annual scheduled benefits include retroactive payments to newlyawarded beneficiaries and other amounts not reflected in the regular monthlyscheduled benefits.
Scheduled lump-sum death benefits are estimated as the product of: (1) thenumber of lump-sum death payments projected on the basis of the assumeddeath rates, the projected fully insured population, and the estimated percent-age of the fully insured population that will qualify for lump-sum death pay-ments; and (2) the amount of the lump-sum death payment, which is $255(unindexed since 1973).
10. Illustrative Scheduled Benefit AmountsTable V.C7 shows, under the intermediate assumptions, future benefitamounts payable upon retirement at the normal retirement age and at age 65,for various hypothetical workers attaining age 65 in 2018 and subsequentyears. The illustrative benefit amounts in table V.C7 are presented in CPI-indexed 2018 dollars—that is, adjusted to 2018 levels by the CPI indexingseries shown in table VI.G6. As a point of comparison, table V.C7 alsoshows the national average wage index (AWI) for 2018 and subsequent yearsin CPI-indexed 2018 dollars.
The normal retirement age was 65 for individuals who reached age 62 before2000. It increased to age 66 during the period 2000 through 2005, at a rate of2 months per year as workers attained age 62. Under current law, the normalretirement age increases to age 67 during the period 2017 through 2022, alsoby 2 months per year as workers attain age 62. The illustrative benefitamounts shown in table V.C7 for retirees at age 65 are lower than theamounts shown for retirees at normal retirement age because the statuterequires an actuarial reduction for monthly benefits taken before normalretirement age to reflect the expected additional years benefits will be col-lected. For example, those who collect benefits starting in 2027 at age 65 willreceive benefits for two more years than if they instead claim benefits at thenormal retirement age (age 67) unless they die between the ages of65 and 67.
Table V.C7 shows five different pre-retirement earnings patterns. Four ofthese patterns assume the earnings history of workers with scaled-earningspatterns1 and reflect very low, low, medium, and high career-average levelsof pre-retirement earnings starting at age 21. The fifth pattern assumes the
1 Actuarial Note 2018.3 has more details on scaled-earnings patterns.See www.ssa.gov/OACT/NOTES/ran3/.

Assumptions and Methods
150
earnings history of a steady maximum earner starting at age 22. The fourscaled-earnings patterns derive from earnings experienced by insured work-ers during 1995-2014. These earnings levels differ by age. The career-aver-age level of earnings for each scaled case targets a percent of the AWI.
For the scaled medium earner, the career-average earnings level is aboutequal to the AWI (or $51,894 for 2018). For the scaled very low, low, andhigh earners, the career-average earnings level is about 25 percent,45 percent, and 160 percent of the AWI, respectively (or $12,974, $23,353,and $83,031, respectively, for 2018). The steady maximum earner has earn-ings at or above the contribution and benefit base for each year starting atage 22 through the year prior to retirement (or $128,400 for 2018).
Table V.C7.—Annual Scheduled Benefit Amounts for Retired Workers With Various Pre-Retirement Earnings Patterns
Based on Intermediate Assumptions, Calendar Years 2018-2095Benefits in 2018 dollarsa with retirement at normal retirement age
Year attain age 65b
Age atretirement
Scaled verylow
earningscScaled low
earningsd
Scaledmedium
earningseScaled high
earningsf
Steadymaximumearningsg
NationalAverage WageIndex in 2018
dollarsh
2018 . . . . 66:0 $9,574 $12,531 $20,662 $27,374 $33,428 $51,8942020 . . . . 66:2 10,232 13,385 22,078 29,256 35,775 53,7552025 . . . . 67:0 10,682 13,987 23,082 30,526 37,605 58,5902030 . . . . 67:0 11,630 15,227 25,118 33,244 40,975 62,6092035 . . . . 67:0 12,432 16,275 26,838 35,523 43,793 66,6422040 . . . . 67:0 13,230 17,319 28,559 37,810 46,580 70,7772045 . . . . 67:0 14,049 18,389 30,329 40,152 49,484 75,0262050 . . . . 67:0 14,897 19,499 32,152 42,568 52,401 79,6222055 . . . . 67:0 15,810 20,694 34,124 45,178 55,507 84,5162060 . . . . 67:0 16,781 21,967 36,219 47,950 58,852 89,6922065 . . . . 67:0 17,812 23,309 38,438 50,887 62,417 95,0512070 . . . . 67:0 18,873 24,703 40,728 53,924 66,147 100,5252075 . . . . 67:0 19,962 26,125 43,074 57,031 69,967 106,2662080 . . . . 67:0 21,101 27,617 45,533 60,287 73,969 112,2492085 . . . . 67:0 22,290 29,171 48,098 63,682 78,145 118,5932090 . . . . 67:0 23,552 30,822 50,818 67,283 82,574 125,3732095 . . . . 67:0 24,897 32,584 53,724 71,129 87,303 132,573
Benefits in 2018 dollarsa with retirement at age 652018 . . . . 65:0 $8,946 $11,699 $19,298 $25,563 $31,130 $51,8942020 . . . . 65:0 9,434 12,349 20,354 26,974 32,886 53,7552025 . . . . 65:0 9,253 12,110 19,984 26,441 32,325 58,5902030 . . . . 65:0 10,076 13,190 21,761 28,811 35,252 62,6092035 . . . . 65:0 10,768 14,098 23,249 30,780 37,689 66,6422040 . . . . 65:0 11,463 15,008 24,746 32,766 40,089 70,7772045 . . . . 65:0 12,177 15,939 26,280 34,797 42,598 75,0262050 . . . . 65:0 12,908 16,894 27,863 36,890 45,112 79,6222055 . . . . 65:0 13,700 17,932 29,569 39,148 47,786 84,5162060 . . . . 65:0 14,544 19,033 31,385 41,555 50,664 89,6922065 . . . . 65:0 15,433 20,202 33,308 44,101 53,737 95,0512070 . . . . 65:0 16,356 21,407 35,297 46,733 56,951 100,525
151
Program Assumptions and Methods
11. Administrative ExpensesThe projection of administrative expenses through the short-range period isbased on historical experience and the projected growth in average wages.The Office of Budget of the Social Security Administration provides esti-mates for the first several years of the projection. For years after the short-range period, projected administrative expenses reflect increases in the num-ber of beneficiaries in current-payment status, and increases in the averagewage. However, the increases in average wage are partially offset byassumed administrative productivity gains.
12.Railroad Retirement Financial InterchangeRailroad workers are covered under a separate multi-tiered benefit plan, witha first tier of coverage similar to OASDI coverage. An annual financial inter-change between the Railroad Retirement fund and the OASI and DI TrustFunds is made to resolve the difference between: (1) the amount of OASDIbenefits that would be paid to railroad workers and their families if railroademployment had been covered under the OASDI program, plus administra-tive expenses associated with these benefits; and (2) the amount of OASDIpayroll tax and income tax that would be received with allowances for inter-est from railroad workers.
2075 . . . . 65:0 $17,301 $22,641 $37,330 $49,426 $60,242 $106,2662080 . . . . 65:0 18,289 23,934 39,460 52,245 63,690 112,2492085 . . . . 65:0 19,318 25,281 41,682 55,189 67,286 118,5932090 . . . . 65:0 20,410 26,711 44,040 58,310 71,099 125,3732095 . . . . 65:0 21,576 28,238 46,557 61,643 75,171 132,573
a Annual amounts are the total for the 12-month period starting with the month of retirement, adjusted to bein 2018 dollars by using the CPI indexing series from table VI.G6.b Attains age 65 on January 1 of the year.c Career-average earnings at about 25 percent of the AWI.d Career-average earnings at about 45 percent of the AWI.e Career-average earnings at about 100 percent of the AWI. Such a worker would have career-average earn-ings at approximately the 56th percentile of all new retired-worker beneficiaries.f Career-average earnings at about 160 percent of the AWI.g Earnings for each year at or above the contribution and benefit base.h Average Wage Index from table VI.G6, adjusted to be in 2018 dollars by using the CPI indexing seriesfrom table VI.G6.Note: Benefits shown at age 65 reflect adjustments for early retirement. For early retirement as early asage 62, the benefit amount is reduced 5/9 of one percent for each month before normal retirement age, up to36 months. If the number of months exceeds 36, then the benefit is further reduced 5/12 of one percent permonth. For example, if the number of reduction months is 60 (the maximum number for retirement at 62when normal retirement age is 67), then the benefit is reduced by 30 percent. Delayed retirement credit isgenerally given for retirement after the normal retirement age. The delayed retirement credit is 2/3 of onepercent per month for persons born in 1943 and later. No credit is given for delaying benefits after attainingage 70. See table V.C3 for additional details, including adjustments applying to other birth years.
Table V.C7.—Annual Scheduled Benefit Amounts for Retired Workers With Various Pre-Retirement Earnings Patterns
Based on Intermediate Assumptions, Calendar Years 2018-2095 (Cont.)
Assumptions and Methods
152
Calculation of the financial interchange with the Railroad Retirement reflectstrends similar to those used in estimating the cost of OASDI benefits. Theannual short-range net cost for the OASI and DI Trust Funds is about$5-$6 billion and the long-range summarized net cost for the OASI and DITrust Funds is 0.04 percent of taxable payroll.

153
History of Trust Fund Operations
VI. APPENDICES
A. HISTORY OF OASI AND DI TRUST FUND OPERATIONS
The Federal Old-Age and Survivors Insurance (OASI) Trust Fund was estab-lished on January 1, 1940 as a separate account in the United States Treasury.The Federal Disability Insurance (DI) Trust Fund, another separate accountin the United States Treasury, was established on August 1, 1956. Thesefunds conduct the financial operations of the OASI and DI programs. TheBoard of Trustees is responsible for overseeing the financial operations ofthese funds. The following paragraphs describe the various components oftrust fund income and outgo. Following this description, tables VI.A1 andVI.A2 present the historical operations of the separate trust funds since theirinception, and table VI.A3 presents the operations of the hypothetical com-bined trust funds1 during the period when they have co-existed.
The primary receipts of these two funds are amounts appropriated under per-manent authority on the basis of payroll tax contributions. Federal lawrequires that all employees who work in OASDI covered employment, andtheir employers, make payroll tax contributions on their wages. Employeesand their employers must also make payroll tax contributions on monthlycash tips if such tips are at least $20. Self-employed persons must make pay-roll tax contributions on their covered net earnings from self-employment.The Federal Government pays amounts equivalent to the combined employerand employee contributions that would be paid on deemed wage creditsattributable to military service performed between 1957 and 2001, if suchwage credits were covered wages. Treasury initially deposits payroll tax con-tributions to the trust funds each day on an estimated basis. Subsequently,Treasury makes adjustments based on the certified amount of wages and self-employment earnings in the records of the Social Security Administration.
Income also includes various reimbursements from the General Fund of theTreasury, such as: (1) the cost of noncontributory wage credits for militaryservice before 1957, and periodic adjustments to previous determinations ofthis cost; (2) the cost in 1971 through 1982 of deemed wage credits for mili-tary service performed after 1956; (3) the cost of benefits to certain unin-sured persons who attained age 72 before 1968; (4) the cost of payroll taxcredits provided to employees in 1984 and self-employed persons in 1984through 1989 by Public Law 98-21; (5) the cost in 2009 through 2017 ofexcluding certain self-employment earnings from SECA taxes under PublicLaw 110-246; and (6) payroll tax revenue forgone under the provisions ofPublic Laws 111-147, 111-312, 112-78, and 112-96.
1 The OASI and DI Trust Funds are distinct legal entities which operate independently. To illustrate theactuarial status of the program as a whole, the fund operations are often combined on a hypothetical basis.

Appendices
154
Beginning in 1984, Federal law subjected up to 50 percent of an individual’sor couple’s OASDI benefits to Federal income taxation under certain circum-stances. Effective for taxable years beginning after 1993, the law increasedthe maximum percentage from 50 percent to 85 percent. Treasury credits theproceeds from this taxation of up to 50 percent of benefits to the OASI andDI Trust Funds in advance, on an estimated basis, at the beginning of eachcalendar quarter, with no reimbursement to the General Fund for interestcosts attributable to the advance transfers.1 Treasury makes subsequentadjustments based on the actual amounts shown on annual income taxrecords. Each of the OASI and DI Trust Funds receives the income taxespaid on the benefits from that trust fund.2
Another source of income to the trust funds is interest received on invest-ments held by the trust funds. On a daily basis, Treasury invests trust fundincome not required to meet current operating expenses, primarily in inter-est-bearing obligations of the U.S. Government. These investments includethe special public-debt obligations described in the next paragraph. TheSocial Security Act also authorizes the trust funds to hold obligations guar-anteed as to both principal and interest by the United States. The act there-fore permits the trust funds to hold certain Federally sponsored agencyobligations and marketable obligations.3 The trust funds may acquire any ofthese obligations on original issue at the issue price or by purchase of out-standing obligations at their market price.
The Social Security Act authorizes the issuance of special public-debt obli-gations for purchase exclusively by the trust funds. The act provides that theinterest rate for special obligations newly issued in any month is the averagemarket yield, as of the last business day of the prior month, on all of the out-standing marketable U.S. obligations that are due or callable more than4 years in the future. This rate is rounded to the nearest one-eighth of onepercent. Beginning January 1999, in calculating the average market yieldrate for this purpose, the Treasury incorporates the yield to the call date whena callable bond’s market price is above par.
Although the Social Security Act does not authorize the purchase or sale ofspecial issue securities in the open market, Treasury redeems special issue
1 The HI Trust Fund receives the additional tax revenue resulting from the increase to 85 percent. 2 A special provision applies to benefits paid to nonresident aliens. Effective for taxable years beginningafter 1994, Public Law 103-465 subjects benefits to a flat-rate tax, usually 25.5 percent, before they arepaid. Therefore, this tax remains in the trust funds. From 1984 to 1994, the flat-rate tax was usually15 percent. 3 The Social Security Act requires the trust funds to acquire special-issue obligations unless the ManagingTrustee determines that the purchase of marketable obligations is in the public interest. The purchase of mar-ketable obligations has been quite limited and has not occurred since 1980.

155
History of Trust Fund Operations
securities prior to maturity at par value when needed to meet current operat-ing expenses. Given this separation from market-based valuations, changesin market yield rates do not cause fluctuations in principal value. As is truefor marketable Treasury securities held by the public, the full faith and creditof the U.S. Government backs all of the investments held by the trust funds.
The primary annual expenditures of the OASI and DI Trust Funds are:(1) OASDI benefit payments1, net of any reimbursements from the GeneralFund of the Treasury for unnegotiated benefit checks; and (2) expensesincurred by the Social Security Administration and the Department of theTreasury in administering the OASDI program and the provisions of theInternal Revenue Code relating to the collection of contributions. Suchadministrative expenses include, among other items, expenditures for(1) payroll, (2) construction, rental, lease, or purchase of office buildings andrelated facilities for the Social Security Administration, and (3) informationtechnology systems. The Social Security Act prohibits expenditures from theOASI and DI Trust Funds for any purpose not related to the payment of ben-efits or administrative costs for the OASDI program.
The expenditures from the trust funds also include: (1) the costs of voca-tional rehabilitation services furnished to disabled persons receiving cashbenefits because of their disabilities, where such services contributed to theirsuccessful rehabilitation; and (2) net costs of the provisions of the RailroadRetirement Act that provide for a system of coordination and financial inter-change between the Railroad Retirement program and the Social Securityprogram. Under the financial interchange provisions, the Railroad Retire-ment program’s Social Security Equivalent Benefit Account and the trustfunds interchange amounts on an annual basis so that each trust fund is in thesame position it would have been had railroad employment always been cov-ered under Social Security.
The statements of the operations of the trust funds in this report do notinclude the net worth of facilities and other fixed capital assets because thevalue of fixed capital assets is not available in the form of a financial assetredeemable for the payment of benefits or administrative expenditures. As aresult of this unavailability, the actuarial status of the trust funds does nottake these assets into account.
1 Periodically, benefit payments which were scheduled to be paid on January 3 were actually paid onDecember 31 of the preceding year as required by the statutory provision included in the 1977 Social Secu-rity Amendments for early delivery of benefit payments when the normal payment delivery date is a Satur-day, Sunday, or legal public holiday. Such advance payments have occurred about every 7 years, first forbenefits scheduled for January 3, 1982. The most recent such accelerated payment affected benefits sched-uled to be paid on January 3, 2016. For comparability with the values for historical years and the projectionsin this report, all trust fund operations and asset reserves reflect the 12 months of benefits scheduled for pay-ment each year without regard to the accelerated payments described above.
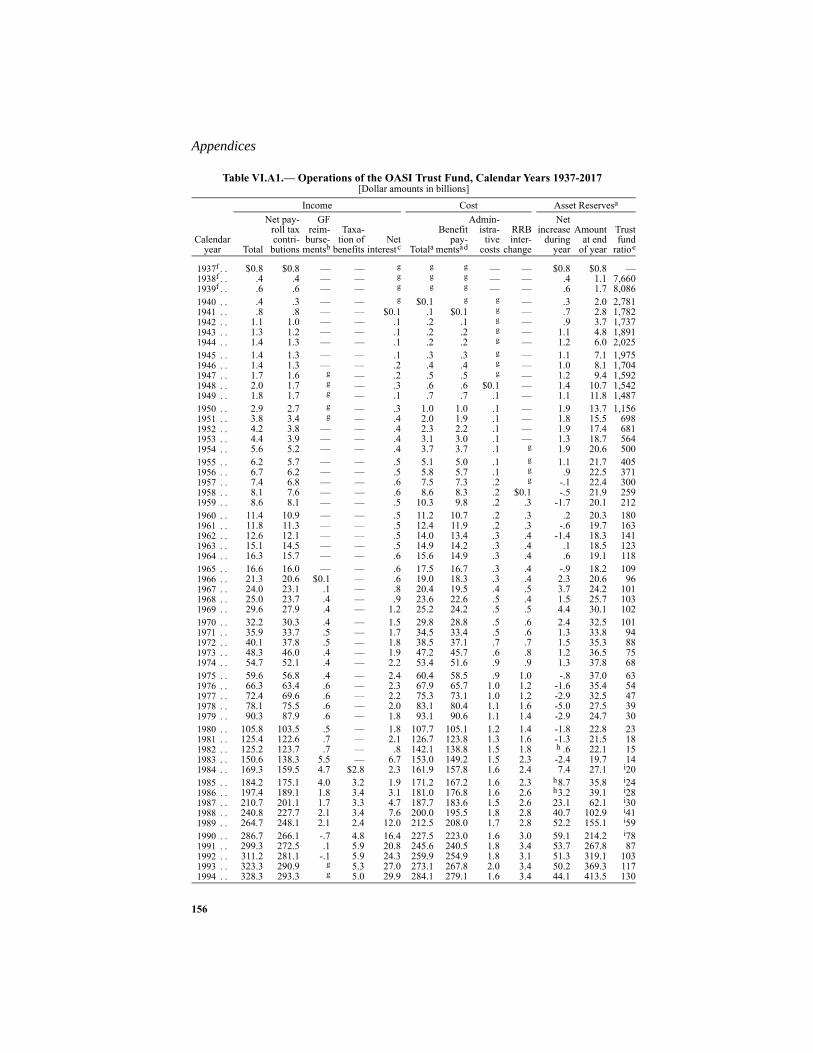
Appendices
156
Table VI.A1.— Operations of the OASI Trust Fund, Calendar Years 1937-2017[Dollar amounts in billions]
Calendaryear
Income Cost Asset Reservesa
Total
Net pay-roll taxcontri-
butions
GFreim-
burse-mentsb
Taxa-tion of
benefitsNet
interestc Totala
Benefitpay-
mentsad
Admin-istra-
tivecosts
RRBinter-
change
Netincrease
duringyear
Amountat end
of year
Trustfund
ratioe
1937f . . $0.8 $0.8 — — g g g — — $0.8 $0.8 —1938f . . .4 .4 — — g g g — — .4 1.1 7,6601939f . . .6 .6 — — g g g — — .6 1.7 8,0861940 . . .4 .3 — — g $0.1 g g — .3 2.0 2,7811941 . . .8 .8 — — $0.1 .1 $0.1 g — .7 2.8 1,7821942 . . 1.1 1.0 — — .1 .2 .1 g — .9 3.7 1,7371943 . . 1.3 1.2 — — .1 .2 .2 g — 1.1 4.8 1,8911944 . . 1.4 1.3 — — .1 .2 .2 g — 1.2 6.0 2,0251945 . . 1.4 1.3 — — .1 .3 .3 g — 1.1 7.1 1,9751946 . . 1.4 1.3 — — .2 .4 .4 g — 1.0 8.1 1,7041947 . . 1.7 1.6 g — .2 .5 .5 g — 1.2 9.4 1,5921948 . . 2.0 1.7 g — .3 .6 .6 $0.1 — 1.4 10.7 1,5421949 . . 1.8 1.7 g — .1 .7 .7 .1 — 1.1 11.8 1,4871950 . . 2.9 2.7 g — .3 1.0 1.0 .1 — 1.9 13.7 1,1561951 . . 3.8 3.4 g — .4 2.0 1.9 .1 — 1.8 15.5 6981952 . . 4.2 3.8 — — .4 2.3 2.2 .1 — 1.9 17.4 6811953 . . 4.4 3.9 — — .4 3.1 3.0 .1 — 1.3 18.7 5641954 . . 5.6 5.2 — — .4 3.7 3.7 .1 g 1.9 20.6 5001955 . . 6.2 5.7 — — .5 5.1 5.0 .1 g 1.1 21.7 4051956 . . 6.7 6.2 — — .5 5.8 5.7 .1 g .9 22.5 3711957 . . 7.4 6.8 — — .6 7.5 7.3 .2 g -.1 22.4 3001958 . . 8.1 7.6 — — .6 8.6 8.3 .2 $0.1 -.5 21.9 2591959 . . 8.6 8.1 — — .5 10.3 9.8 .2 .3 -1.7 20.1 2121960 . . 11.4 10.9 — — .5 11.2 10.7 .2 .3 .2 20.3 1801961 . . 11.8 11.3 — — .5 12.4 11.9 .2 .3 -.6 19.7 1631962 . . 12.6 12.1 — — .5 14.0 13.4 .3 .4 -1.4 18.3 1411963 . . 15.1 14.5 — — .5 14.9 14.2 .3 .4 .1 18.5 1231964 . . 16.3 15.7 — — .6 15.6 14.9 .3 .4 .6 19.1 1181965 . . 16.6 16.0 — — .6 17.5 16.7 .3 .4 -.9 18.2 1091966 . . 21.3 20.6 $0.1 — .6 19.0 18.3 .3 .4 2.3 20.6 961967 . . 24.0 23.1 .1 — .8 20.4 19.5 .4 .5 3.7 24.2 1011968 . . 25.0 23.7 .4 — .9 23.6 22.6 .5 .4 1.5 25.7 1031969 . . 29.6 27.9 .4 — 1.2 25.2 24.2 .5 .5 4.4 30.1 1021970 . . 32.2 30.3 .4 — 1.5 29.8 28.8 .5 .6 2.4 32.5 1011971 . . 35.9 33.7 .5 — 1.7 34.5 33.4 .5 .6 1.3 33.8 941972 . . 40.1 37.8 .5 — 1.8 38.5 37.1 .7 .7 1.5 35.3 881973 . . 48.3 46.0 .4 — 1.9 47.2 45.7 .6 .8 1.2 36.5 751974 . . 54.7 52.1 .4 — 2.2 53.4 51.6 .9 .9 1.3 37.8 681975 . . 59.6 56.8 .4 — 2.4 60.4 58.5 .9 1.0 -.8 37.0 631976 . . 66.3 63.4 .6 — 2.3 67.9 65.7 1.0 1.2 -1.6 35.4 541977 . . 72.4 69.6 .6 — 2.2 75.3 73.1 1.0 1.2 -2.9 32.5 471978 . . 78.1 75.5 .6 — 2.0 83.1 80.4 1.1 1.6 -5.0 27.5 391979 . . 90.3 87.9 .6 — 1.8 93.1 90.6 1.1 1.4 -2.9 24.7 301980 . . 105.8 103.5 .5 — 1.8 107.7 105.1 1.2 1.4 -1.8 22.8 231981 . . 125.4 122.6 .7 — 2.1 126.7 123.8 1.3 1.6 -1.3 21.5 181982 . . 125.2 123.7 .7 — .8 142.1 138.8 1.5 1.8 h .6 22.1 151983 . . 150.6 138.3 5.5 — 6.7 153.0 149.2 1.5 2.3 -2.4 19.7 141984 . . 169.3 159.5 4.7 $2.8 2.3 161.9 157.8 1.6 2.4 7.4 27.1 i201985 . . 184.2 175.1 4.0 3.2 1.9 171.2 167.2 1.6 2.3 h8.7 35.8 i241986 . . 197.4 189.1 1.8 3.4 3.1 181.0 176.8 1.6 2.6 h3.2 39.1 i281987 . . 210.7 201.1 1.7 3.3 4.7 187.7 183.6 1.5 2.6 23.1 62.1 i301988 . . 240.8 227.7 2.1 3.4 7.6 200.0 195.5 1.8 2.8 40.7 102.9 i411989 . . 264.7 248.1 2.1 2.4 12.0 212.5 208.0 1.7 2.8 52.2 155.1 i591990 . . 286.7 266.1 -.7 4.8 16.4 227.5 223.0 1.6 3.0 59.1 214.2 i781991 . . 299.3 272.5 .1 5.9 20.8 245.6 240.5 1.8 3.4 53.7 267.8 871992 . . 311.2 281.1 -.1 5.9 24.3 259.9 254.9 1.8 3.1 51.3 319.1 1031993 . . 323.3 290.9 g 5.3 27.0 273.1 267.8 2.0 3.4 50.2 369.3 1171994 . . 328.3 293.3 g 5.0 29.9 284.1 279.1 1.6 3.4 44.1 413.5 130
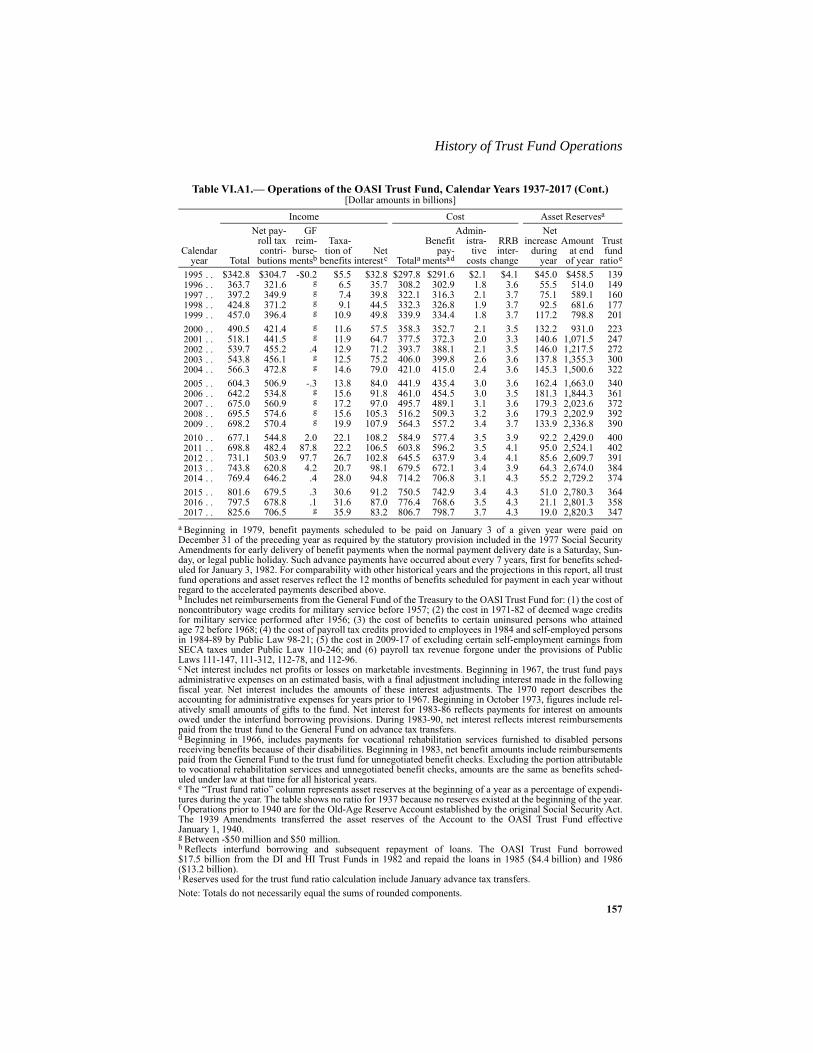
157
History of Trust Fund Operations
1995 . . $342.8 $304.7 -$0.2 $5.5 $32.8 $297.8 $291.6 $2.1 $4.1 $45.0 $458.5 1391996 . . 363.7 321.6 g 6.5 35.7 308.2 302.9 1.8 3.6 55.5 514.0 1491997 . . 397.2 349.9 g 7.4 39.8 322.1 316.3 2.1 3.7 75.1 589.1 1601998 . . 424.8 371.2 g 9.1 44.5 332.3 326.8 1.9 3.7 92.5 681.6 1771999 . . 457.0 396.4 g 10.9 49.8 339.9 334.4 1.8 3.7 117.2 798.8 2012000 . . 490.5 421.4 g 11.6 57.5 358.3 352.7 2.1 3.5 132.2 931.0 2232001 . . 518.1 441.5 g 11.9 64.7 377.5 372.3 2.0 3.3 140.6 1,071.5 2472002 . . 539.7 455.2 .4 12.9 71.2 393.7 388.1 2.1 3.5 146.0 1,217.5 2722003 . . 543.8 456.1 g 12.5 75.2 406.0 399.8 2.6 3.6 137.8 1,355.3 3002004 . . 566.3 472.8 g 14.6 79.0 421.0 415.0 2.4 3.6 145.3 1,500.6 3222005 . . 604.3 506.9 -.3 13.8 84.0 441.9 435.4 3.0 3.6 162.4 1,663.0 3402006 . . 642.2 534.8 g 15.6 91.8 461.0 454.5 3.0 3.5 181.3 1,844.3 3612007 . . 675.0 560.9 g 17.2 97.0 495.7 489.1 3.1 3.6 179.3 2,023.6 3722008 . . 695.5 574.6 g 15.6 105.3 516.2 509.3 3.2 3.6 179.3 2,202.9 3922009 . . 698.2 570.4 g 19.9 107.9 564.3 557.2 3.4 3.7 133.9 2,336.8 3902010 . . 677.1 544.8 2.0 22.1 108.2 584.9 577.4 3.5 3.9 92.2 2,429.0 4002011 . . 698.8 482.4 87.8 22.2 106.5 603.8 596.2 3.5 4.1 95.0 2,524.1 4022012 . . 731.1 503.9 97.7 26.7 102.8 645.5 637.9 3.4 4.1 85.6 2,609.7 3912013 . . 743.8 620.8 4.2 20.7 98.1 679.5 672.1 3.4 3.9 64.3 2,674.0 3842014 . . 769.4 646.2 .4 28.0 94.8 714.2 706.8 3.1 4.3 55.2 2,729.2 3742015 . . 801.6 679.5 .3 30.6 91.2 750.5 742.9 3.4 4.3 51.0 2,780.3 3642016 . . 797.5 678.8 .1 31.6 87.0 776.4 768.6 3.5 4.3 21.1 2,801.3 3582017 . . 825.6 706.5 g 35.9 83.2 806.7 798.7 3.7 4.3 19.0 2,820.3 347
a Beginning in 1979, benefit payments scheduled to be paid on January 3 of a given year were paid onDecember 31 of the preceding year as required by the statutory provision included in the 1977 Social SecurityAmendments for early delivery of benefit payments when the normal payment delivery date is a Saturday, Sun-day, or legal public holiday. Such advance payments have occurred about every 7 years, first for benefits sched-uled for January 3, 1982. For comparability with other historical years and the projections in this report, all trustfund operations and asset reserves reflect the 12 months of benefits scheduled for payment in each year withoutregard to the accelerated payments described above.b Includes net reimbursements from the General Fund of the Treasury to the OASI Trust Fund for: (1) the cost ofnoncontributory wage credits for military service before 1957; (2) the cost in 1971-82 of deemed wage creditsfor military service performed after 1956; (3) the cost of benefits to certain uninsured persons who attainedage 72 before 1968; (4) the cost of payroll tax credits provided to employees in 1984 and self-employed personsin 1984-89 by Public Law 98-21; (5) the cost in 2009-17 of excluding certain self-employment earnings fromSECA taxes under Public Law 110-246; and (6) payroll tax revenue forgone under the provisions of PublicLaws 111-147, 111-312, 112-78, and 112-96.c Net interest includes net profits or losses on marketable investments. Beginning in 1967, the trust fund paysadministrative expenses on an estimated basis, with a final adjustment including interest made in the followingfiscal year. Net interest includes the amounts of these interest adjustments. The 1970 report describes theaccounting for administrative expenses for years prior to 1967. Beginning in October 1973, figures include rel-atively small amounts of gifts to the fund. Net interest for 1983-86 reflects payments for interest on amountsowed under the interfund borrowing provisions. During 1983-90, net interest reflects interest reimbursementspaid from the trust fund to the General Fund on advance tax transfers.d Beginning in 1966, includes payments for vocational rehabilitation services furnished to disabled personsreceiving benefits because of their disabilities. Beginning in 1983, net benefit amounts include reimbursementspaid from the General Fund to the trust fund for unnegotiated benefit checks. Excluding the portion attributableto vocational rehabilitation services and unnegotiated benefit checks, amounts are the same as benefits sched-uled under law at that time for all historical years.e The “Trust fund ratio” column represents asset reserves at the beginning of a year as a percentage of expendi-tures during the year. The table shows no ratio for 1937 because no reserves existed at the beginning of the year.f Operations prior to 1940 are for the Old-Age Reserve Account established by the original Social Security Act.The 1939 Amendments transferred the asset reserves of the Account to the OASI Trust Fund effectiveJanuary 1, 1940.g Between -$50 million and $50 million.h Reflects interfund borrowing and subsequent repayment of loans. The OASI Trust Fund borrowed$17.5 billion from the DI and HI Trust Funds in 1982 and repaid the loans in 1985 ($4.4 billion) and 1986($13.2 billion).i Reserves used for the trust fund ratio calculation include January advance tax transfers.Note: Totals do not necessarily equal the sums of rounded components.
Table VI.A1.— Operations of the OASI Trust Fund, Calendar Years 1937-2017 (Cont.)[Dollar amounts in billions]
Calendaryear
Income Cost Asset Reservesa
Total
Net pay-roll taxcontri-
butions
GFreim-
burse-mentsb
Taxa-tion of
benefitsNet
interestc Totala
Benefitpay-
mentsad
Admin-istra-
tivecosts
RRBinter-
change
Netincrease
duringyear
Amountat end
of year
Trustfund
ratioe
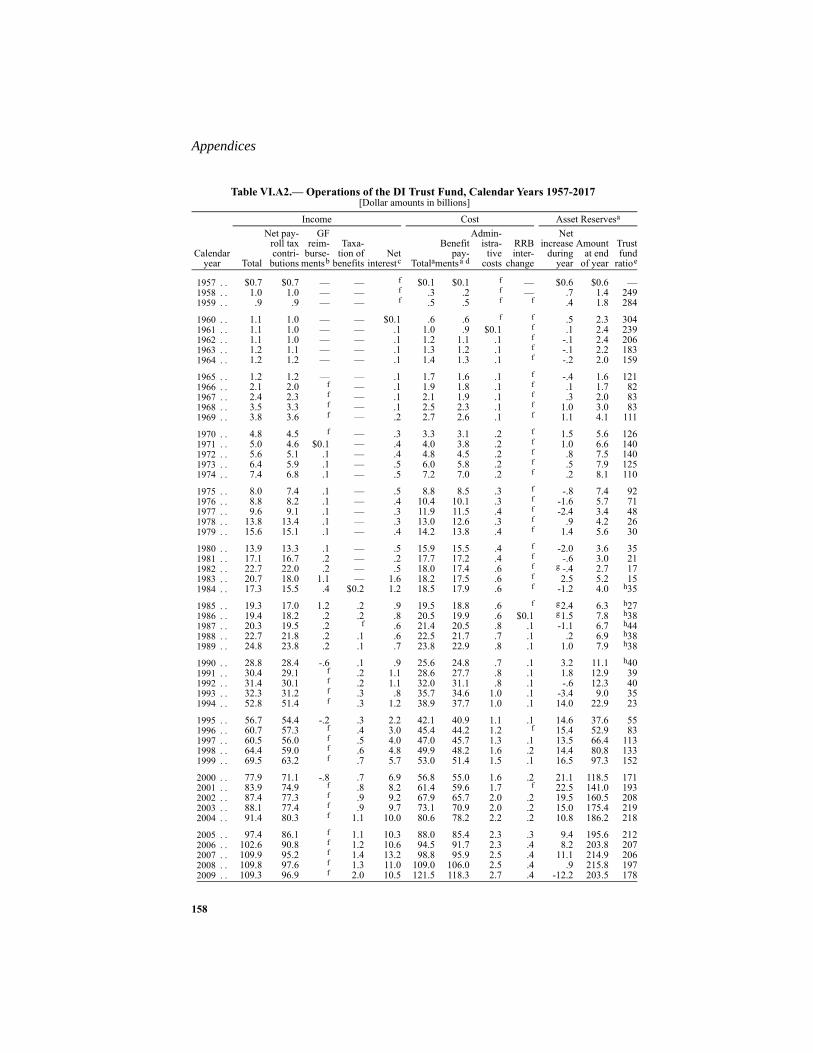
Appendices
158
Table VI.A2.— Operations of the DI Trust Fund, Calendar Years 1957-2017[Dollar amounts in billions]
Calendaryear
Income Cost Asset Reservesa
Total
Net pay-roll taxcontri-
butions
GFreim-
burse-mentsb
Taxa-tion of
benefitsNet
interestc Totala
Benefitpay-
mentsa d
Admin-istra-
tivecosts
RRBinter-
change
Netincrease
duringyear
Amountat end
of year
Trustfund
ratioe
1957 . . $0.7 $0.7 — — f $0.1 $0.1 f — $0.6 $0.6 —1958 . . 1.0 1.0 — — f .3 .2 f — .7 1.4 2491959 . . .9 .9 — — f .5 .5 f f .4 1.8 284
1960 . . 1.1 1.0 — — $0.1 .6 .6 f f .5 2.3 3041961 . . 1.1 1.0 — — .1 1.0 .9 $0.1 f .1 2.4 2391962 . . 1.1 1.0 — — .1 1.2 1.1 .1 f -.1 2.4 2061963 . . 1.2 1.1 — — .1 1.3 1.2 .1 f -.1 2.2 1831964 . . 1.2 1.2 — — .1 1.4 1.3 .1 f -.2 2.0 159
1965 . . 1.2 1.2 — — .1 1.7 1.6 .1 f -.4 1.6 1211966 . . 2.1 2.0 f — .1 1.9 1.8 .1 f .1 1.7 821967 . . 2.4 2.3 f — .1 2.1 1.9 .1 f .3 2.0 831968 . . 3.5 3.3 f — .1 2.5 2.3 .1 f 1.0 3.0 831969 . . 3.8 3.6 f — .2 2.7 2.6 .1 f 1.1 4.1 111
1970 . . 4.8 4.5 f — .3 3.3 3.1 .2 f 1.5 5.6 1261971 . . 5.0 4.6 $0.1 — .4 4.0 3.8 .2 f 1.0 6.6 1401972 . . 5.6 5.1 .1 — .4 4.8 4.5 .2 f .8 7.5 1401973 . . 6.4 5.9 .1 — .5 6.0 5.8 .2 f .5 7.9 1251974 . . 7.4 6.8 .1 — .5 7.2 7.0 .2 f .2 8.1 110
1975 . . 8.0 7.4 .1 — .5 8.8 8.5 .3 f -.8 7.4 921976 . . 8.8 8.2 .1 — .4 10.4 10.1 .3 f -1.6 5.7 711977 . . 9.6 9.1 .1 — .3 11.9 11.5 .4 f -2.4 3.4 481978 . . 13.8 13.4 .1 — .3 13.0 12.6 .3 f .9 4.2 261979 . . 15.6 15.1 .1 — .4 14.2 13.8 .4 f 1.4 5.6 30
1980 . . 13.9 13.3 .1 — .5 15.9 15.5 .4 f -2.0 3.6 351981 . . 17.1 16.7 .2 — .2 17.7 17.2 .4 f -.6 3.0 211982 . . 22.7 22.0 .2 — .5 18.0 17.4 .6 f g -.4 2.7 171983 . . 20.7 18.0 1.1 — 1.6 18.2 17.5 .6 f 2.5 5.2 151984 . . 17.3 15.5 .4 $0.2 1.2 18.5 17.9 .6 f -1.2 4.0 h35
1985 . . 19.3 17.0 1.2 .2 .9 19.5 18.8 .6 f g2.4 6.3 h271986 . . 19.4 18.2 .2 .2 .8 20.5 19.9 .6 $0.1 g1.5 7.8 h381987 . . 20.3 19.5 .2 f .6 21.4 20.5 .8 .1 -1.1 6.7 h441988 . . 22.7 21.8 .2 .1 .6 22.5 21.7 .7 .1 .2 6.9 h381989 . . 24.8 23.8 .2 .1 .7 23.8 22.9 .8 .1 1.0 7.9 h38
1990 . . 28.8 28.4 -.6 .1 .9 25.6 24.8 .7 .1 3.2 11.1 h401991 . . 30.4 29.1 f .2 1.1 28.6 27.7 .8 .1 1.8 12.9 391992 . . 31.4 30.1 f .2 1.1 32.0 31.1 .8 .1 -.6 12.3 401993 . . 32.3 31.2 f .3 .8 35.7 34.6 1.0 .1 -3.4 9.0 351994 . . 52.8 51.4 f .3 1.2 38.9 37.7 1.0 .1 14.0 22.9 23
1995 . . 56.7 54.4 -.2 .3 2.2 42.1 40.9 1.1 .1 14.6 37.6 551996 . . 60.7 57.3 f .4 3.0 45.4 44.2 1.2 f 15.4 52.9 831997 . . 60.5 56.0 f .5 4.0 47.0 45.7 1.3 .1 13.5 66.4 1131998 . . 64.4 59.0 f .6 4.8 49.9 48.2 1.6 .2 14.4 80.8 1331999 . . 69.5 63.2 f .7 5.7 53.0 51.4 1.5 .1 16.5 97.3 152
2000 . . 77.9 71.1 -.8 .7 6.9 56.8 55.0 1.6 .2 21.1 118.5 1712001 . . 83.9 74.9 f .8 8.2 61.4 59.6 1.7 f 22.5 141.0 1932002 . . 87.4 77.3 f .9 9.2 67.9 65.7 2.0 .2 19.5 160.5 2082003 . . 88.1 77.4 f .9 9.7 73.1 70.9 2.0 .2 15.0 175.4 2192004 . . 91.4 80.3 f 1.1 10.0 80.6 78.2 2.2 .2 10.8 186.2 218
2005 . . 97.4 86.1 f 1.1 10.3 88.0 85.4 2.3 .3 9.4 195.6 2122006 . . 102.6 90.8 f 1.2 10.6 94.5 91.7 2.3 .4 8.2 203.8 2072007 . . 109.9 95.2 f 1.4 13.2 98.8 95.9 2.5 .4 11.1 214.9 2062008 . . 109.8 97.6 f 1.3 11.0 109.0 106.0 2.5 .4 .9 215.8 1972009 . . 109.3 96.9 f 2.0 10.5 121.5 118.3 2.7 .4 -12.2 203.5 178

159
History of Trust Fund Operations
2010. . . $104.0 $92.5 $0.4 $1.9 $9.3 $127.7 $124.2 $3.0 $0.5 -$23.6 $179.9 1592011. . . 106.3 81.9 14.9 1.6 7.9 132.3 128.9 2.9 .5 -26.1 153.9 1362012. . . 109.1 85.6 16.5 .6 6.4 140.3 136.9 2.9 .5 -31.2 122.7 1102013. . . 111.2 105.4 .7 .4 4.7 143.4 140.1 2.8 .6 -32.2 90.4 862014. . . 114.9 109.7 .1 1.7 3.4 145.1 141.7 2.9 .4 -30.2 60.2 62
2015. . . 118.6 115.4 f 1.1 2.1 146.6 143.4 2.8 .4 -28.0 32.3 412016. . . 160.0 157.4 f 1.2 1.4 145.9 142.8 2.8 .4 14.1 46.3 222017. . . 171.0 167.1 f 2.0 1.9 145.8 142.8 2.8 .2 25.1 71.5 32
a Beginning in 1979, benefit payments scheduled to be paid on January 3 of a given year were paid onDecember 31 of the preceding year as required by the statutory provision included in the 1977 Social SecurityAmendments for early delivery of benefit payments when the normal payment delivery date is a Saturday, Sun-day, or legal public holiday. Such advance payments have occurred about every 7 years, first for benefits sched-uled for January 3, 1982. For comparability with other historical years and the projections in this report, all trustfund operations and asset reserves reflect the 12 months of benefits scheduled for payment in each year withoutregard to the accelerated payments described above.b Includes net reimbursements from the General Fund of the Treasury to the DI Trust Fund for: (1) the cost ofnoncontributory wage credits for military service before 1957; (2) the cost in 1971-82 of deemed wage creditsfor military service performed after 1956; (3) the cost of payroll tax credits provided to employees in 1984 andself-employed persons in 1984-89 by Public Law 98-21; (4) the cost in 2009-17 of excluding certain self-employment earnings from SECA taxes under Public Law 110-246; and (5) payroll tax revenue forgone underthe provisions of Public Laws 111-147, 111-312, 112-78, and 112-96.c Net interest includes net profits or losses on marketable investments. Beginning in 1967, the trust fund paysadministrative expenses on an estimated basis, with a final adjustment including interest made in the followingfiscal year. Net interest includes the amounts of these interest adjustments. The 1970 report describes theaccounting for administrative expenses for years prior to 1967. Beginning in July 1974, figures include rela-tively small amounts of gifts to the fund. Net interest for 1983-86 reflects payments for interest on amountsowed under the interfund borrowing provisions. During 1983-90, net interest reflects interest reimbursementspaid from the trust fund to the General Fund on advance tax transfers.d Beginning in 1966, includes payments for vocational rehabilitation services furnished to disabled personsreceiving benefits because of their disabilities. Beginning in 1983, net benefit amounts include reimbursementspaid from the General Fund to the trust fund for unnegotiated benefit checks. Excluding the portion attributableto vocational rehabilitation services and unnegotiated benefit checks, amounts are the same as benefits sched-uled under law at that time for all historical years.e The “Trust fund ratio” column represents asset reserves at the beginning of a year as a percentage of expendi-tures during the year. The table shows no ratio for 1957 because no reserves existed at the beginning of the year.f Between -$50 million and $50 million.g Reflects interfund borrowing and subsequent repayment of loans. The DI Trust Fund loaned $5.1 billion to theOASI Trust Fund in 1982. The OASI Trust Fund repaid the loan in 1985 ($2.5 billion) and 1986 ($2.5 billion).h Reserves used for the trust fund ratio calculation include January advance tax transfers.Note: Totals do not necessarily equal the sums of rounded components.
Table VI.A2.— Operations of the DI Trust Fund, Calendar Years 1957-2017 (Cont.)[Dollar amounts in billions]
Calendaryear
Income Cost Asset Reservesa
Total
Net pay-roll taxcontri-
butions
GFreim-
burse-mentsb
Taxa-tion of
benefitsNet
interestc Totala
Benefitpay-
mentsa d
Admin-istra-
tivecosts
RRBinter-
change
Netincrease
duringyear
Amountat end
of year
Trustfund
ratioe

Appendices
160
Table VI.A3.— Operations of the Combined OASI and DI Trust Funds,Calendar Years 1957-2017
[Dollar amounts in billions]
Calendaryear
Income Cost Asset Reservesa
Total
Net pay-roll taxcontri-
butions
GFreim-
burse-mentsb
Taxa-tion of
benefitsNet
interestc Totala
Benefitpay-
mentsad
Admin-istra-
tivecosts
RRBinter-
change
Netincrease
duringyear
Amountat end
of year
Trustfund
ratioe
1957 . . $8.1 $7.5 — — $0.6 $7.6 $7.4 $0.2 f $0.5 $23.0 2981958 9.1 8.5 — — .6 8.9 8.6 .2 $0.1 .2 23.2 2591959 . . 9.5 8.9 — — .6 10.8 10.3 .2 .3 -1.3 22.0 215
1960 . . 12.4 11.9 — — .6 11.8 11.2 .2 .3 .6 22.6 1861961 . . 12.9 12.3 — — .6 13.4 12.7 .3 .3 -.5 22.2 1691962 . . 13.7 13.1 — — .6 15.2 14.5 .3 .4 -1.5 20.7 1461963 . . 16.2 15.6 — — .6 16.2 15.4 .3 .4 f 20.7 1281964 . . 17.5 16.8 — — .6 17.0 16.2 .4 .4 .5 21.2 122
1965 . . 17.9 17.2 — — .7 19.2 18.3 .4 .5 -1.3 19.8 1101966 . . 23.4 22.6 $0.1 — .7 20.9 20.1 .4 .5 2.5 22.3 951967 . . 26.4 25.4 .1 — .9 22.5 21.4 .5 .5 3.9 26.3 991968 . . 28.5 27.0 .4 — 1.0 26.0 25.0 .6 .5 2.5 28.7 1011969 . . 33.3 31.5 .5 — 1.3 27.9 26.8 .6 .5 5.5 34.2 103
1970 . . 37.0 34.7 .5 — 1.8 33.1 31.9 .6 .6 3.9 38.1 1031971 . . 40.9 38.3 .5 — 2.0 38.5 37.2 .7 .6 2.4 40.4 991972 . . 45.6 42.9 .5 — 2.2 43.3 41.6 .9 .7 2.3 42.8 931973 . . 54.8 51.9 .5 — 2.4 53.1 51.5 .8 .8 1.6 44.4 801974 . . 62.1 58.9 .5 — 2.7 60.6 58.6 1.1 .9 1.5 45.9 73
1975 . . 67.6 64.3 .5 — 2.9 69.2 67.0 1.2 1.0 -1.5 44.3 661976 . . 75.0 71.6 .7 — 2.7 78.2 75.8 1.2 1.2 -3.2 41.1 571977 . . 82.0 78.7 .7 — 2.5 87.3 84.7 1.4 1.2 -5.3 35.9 471978 . . 91.9 88.9 .8 — 2.3 96.0 93.0 1.4 1.6 -4.1 31.7 371979 . . 105.9 103.0 .7 — 2.2 107.3 104.4 1.5 1.5 -1.5 30.3 30
1980 . . 119.7 116.7 .7 — 2.3 123.5 120.6 1.5 1.4 -3.8 26.5 251981 . . 142.4 139.4 .8 — 2.2 144.4 141.0 1.7 1.6 -1.9 24.5 181982 . . 147.9 145.7 .9 — 1.4 160.1 156.2 2.1 1.8 g .2 24.8 151983 . . 171.3 156.3 6.7 — 8.3 171.2 166.7 2.2 2.3 .1 24.9 141984 . . 186.6 175.0 5.2 $3.0 3.4 180.4 175.7 2.3 2.4 6.2 31.1 h21
1985 . . 203.5 192.1 5.2 3.4 2.7 190.6 186.1 2.2 2.4 g11.1 42.2 h241986 . . 216.8 207.4 1.9 3.7 3.9 201.5 196.7 2.2 2.7 g 4.7 46.9 h291987 . . 231.0 220.6 1.9 3.2 5.3 209.1 204.1 2.4 2.6 21.9 68.8 h311988 . . 263.5 249.5 2.3 3.4 8.2 222.5 217.1 2.5 2.9 41.0 109.8 h411989 . . 289.4 271.9 2.3 2.5 12.7 236.2 230.9 2.4 2.9 53.2 163.0 h57
1990 . . 315.4 294.5 -1.3 5.0 17.2 253.1 247.8 2.3 3.0 62.3 225.3 h751991 . . 329.7 301.6 .1 6.1 21.9 274.2 268.2 2.6 3.5 55.5 280.7 821992 . . 342.6 311.3 -.1 6.1 25.4 291.9 286.0 2.7 3.2 50.7 331.5 961993 . . 355.6 322.0 .1 5.6 27.9 308.8 302.4 3.0 3.4 46.8 378.3 1071994 . . 381.1 344.7 f 5.3 31.1 323.0 316.8 2.7 3.5 58.1 436.4 117
1995 . . 399.5 359.1 -.4 5.8 35.0 339.8 332.6 3.1 4.1 59.7 496.1 1281996 . . 424.5 378.9 f 6.8 38.7 353.6 347.0 3.0 3.6 70.9 567.0 1401997 . . 457.7 406.0 f 7.9 43.8 369.1 362.0 3.4 3.7 88.6 655.5 1541998 . . 489.2 430.2 f 9.7 49.3 382.3 375.0 3.5 3.8 106.9 762.5 1711999 . . 526.6 459.6 f 11.6 55.5 392.9 385.8 3.3 3.8 133.7 896.1 194
2000 . . 568.4 492.5 -.8 12.3 64.5 415.1 407.6 3.8 3.7 153.3 1,049.4 2162001 . . 602.0 516.4 f 12.7 72.9 438.9 431.9 3.7 3.3 163.1 1,212.5 2392002 . . 627.1 532.5 .4 13.8 80.4 461.7 453.8 4.2 3.6 165.4 1,378.0 2632003 . . 631.9 533.5 f 13.4 84.9 479.1 470.8 4.6 3.7 152.8 1,530.8 2882004 . . 657.7 553.0 f 15.7 89.0 501.6 493.3 4.5 3.8 156.1 1,686.8 305
2005 . . 701.8 592.9 -.3 14.9 94.3 529.9 520.7 5.3 3.9 171.8 1,858.7 3182006 . . 744.9 625.6 f 16.9 102.4 555.4 546.2 5.3 3.8 189.5 2,048.1 3352007 . . 784.9 656.1 f 18.6 110.2 594.5 584.9 5.5 4.0 190.4 2,238.5 3452008 . . 805.3 672.1 f 16.9 116.3 625.1 615.3 5.7 4.0 180.2 2,418.7 3582009 . . 807.5 667.3 f 21.9 118.3 685.8 675.5 6.2 4.1 121.7 2,540.3 353
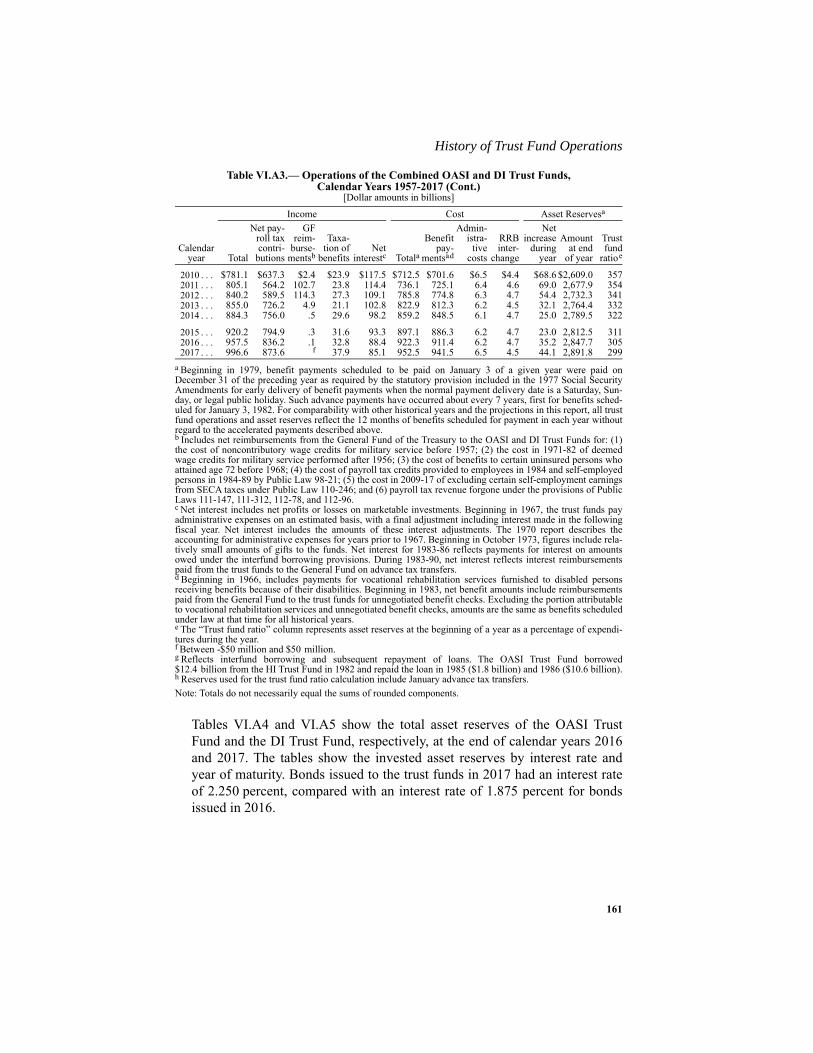
161
History of Trust Fund Operations
Tables VI.A4 and VI.A5 show the total asset reserves of the OASI TrustFund and the DI Trust Fund, respectively, at the end of calendar years 2016and 2017. The tables show the invested asset reserves by interest rate andyear of maturity. Bonds issued to the trust funds in 2017 had an interest rateof 2.250 percent, compared with an interest rate of 1.875 percent for bondsissued in 2016.
2010 . . . $781.1 $637.3 $2.4 $23.9 $117.5 $712.5 $701.6 $6.5 $4.4 $68.6 $2,609.0 3572011 . . . 805.1 564.2 102.7 23.8 114.4 736.1 725.1 6.4 4.6 69.0 2,677.9 3542012 . . . 840.2 589.5 114.3 27.3 109.1 785.8 774.8 6.3 4.7 54.4 2,732.3 3412013 . . . 855.0 726.2 4.9 21.1 102.8 822.9 812.3 6.2 4.5 32.1 2,764.4 3322014 . . . 884.3 756.0 .5 29.6 98.2 859.2 848.5 6.1 4.7 25.0 2,789.5 322
2015 . . . 920.2 794.9 .3 31.6 93.3 897.1 886.3 6.2 4.7 23.0 2,812.5 3112016 . . . 957.5 836.2 .1 32.8 88.4 922.3 911.4 6.2 4.7 35.2 2,847.7 3052017 . . . 996.6 873.6 f 37.9 85.1 952.5 941.5 6.5 4.5 44.1 2,891.8 299
a Beginning in 1979, benefit payments scheduled to be paid on January 3 of a given year were paid onDecember 31 of the preceding year as required by the statutory provision included in the 1977 Social SecurityAmendments for early delivery of benefit payments when the normal payment delivery date is a Saturday, Sun-day, or legal public holiday. Such advance payments have occurred about every 7 years, first for benefits sched-uled for January 3, 1982. For comparability with other historical years and the projections in this report, all trustfund operations and asset reserves reflect the 12 months of benefits scheduled for payment in each year withoutregard to the accelerated payments described above.b Includes net reimbursements from the General Fund of the Treasury to the OASI and DI Trust Funds for: (1)the cost of noncontributory wage credits for military service before 1957; (2) the cost in 1971-82 of deemedwage credits for military service performed after 1956; (3) the cost of benefits to certain uninsured persons whoattained age 72 before 1968; (4) the cost of payroll tax credits provided to employees in 1984 and self-employedpersons in 1984-89 by Public Law 98-21; (5) the cost in 2009-17 of excluding certain self-employment earningsfrom SECA taxes under Public Law 110-246; and (6) payroll tax revenue forgone under the provisions of PublicLaws 111-147, 111-312, 112-78, and 112-96.c Net interest includes net profits or losses on marketable investments. Beginning in 1967, the trust funds payadministrative expenses on an estimated basis, with a final adjustment including interest made in the followingfiscal year. Net interest includes the amounts of these interest adjustments. The 1970 report describes theaccounting for administrative expenses for years prior to 1967. Beginning in October 1973, figures include rela-tively small amounts of gifts to the funds. Net interest for 1983-86 reflects payments for interest on amountsowed under the interfund borrowing provisions. During 1983-90, net interest reflects interest reimbursementspaid from the trust funds to the General Fund on advance tax transfers.d Beginning in 1966, includes payments for vocational rehabilitation services furnished to disabled personsreceiving benefits because of their disabilities. Beginning in 1983, net benefit amounts include reimbursementspaid from the General Fund to the trust funds for unnegotiated benefit checks. Excluding the portion attributableto vocational rehabilitation services and unnegotiated benefit checks, amounts are the same as benefits scheduledunder law at that time for all historical years.e The “Trust fund ratio” column represents asset reserves at the beginning of a year as a percentage of expendi-tures during the year.f Between -$50 million and $50 million.g Reflects interfund borrowing and subsequent repayment of loans. The OASI Trust Fund borrowed$12.4 billion from the HI Trust Fund in 1982 and repaid the loan in 1985 ($1.8 billion) and 1986 ($10.6 billion).h Reserves used for the trust fund ratio calculation include January advance tax transfers.Note: Totals do not necessarily equal the sums of rounded components.
Table VI.A3.— Operations of the Combined OASI and DI Trust Funds,Calendar Years 1957-2017 (Cont.)
[Dollar amounts in billions]
Calendaryear
Income Cost Asset Reservesa
Total
Net pay-roll taxcontri-
butions
GFreim-
burse-mentsb
Taxa-tion of
benefitsNet
interestc Totala
Benefitpay-
mentsad
Admin-istra-
tivecosts
RRBinter-
change
Netincrease
duringyear
Amountat end
of year
Trustfund
ratioe
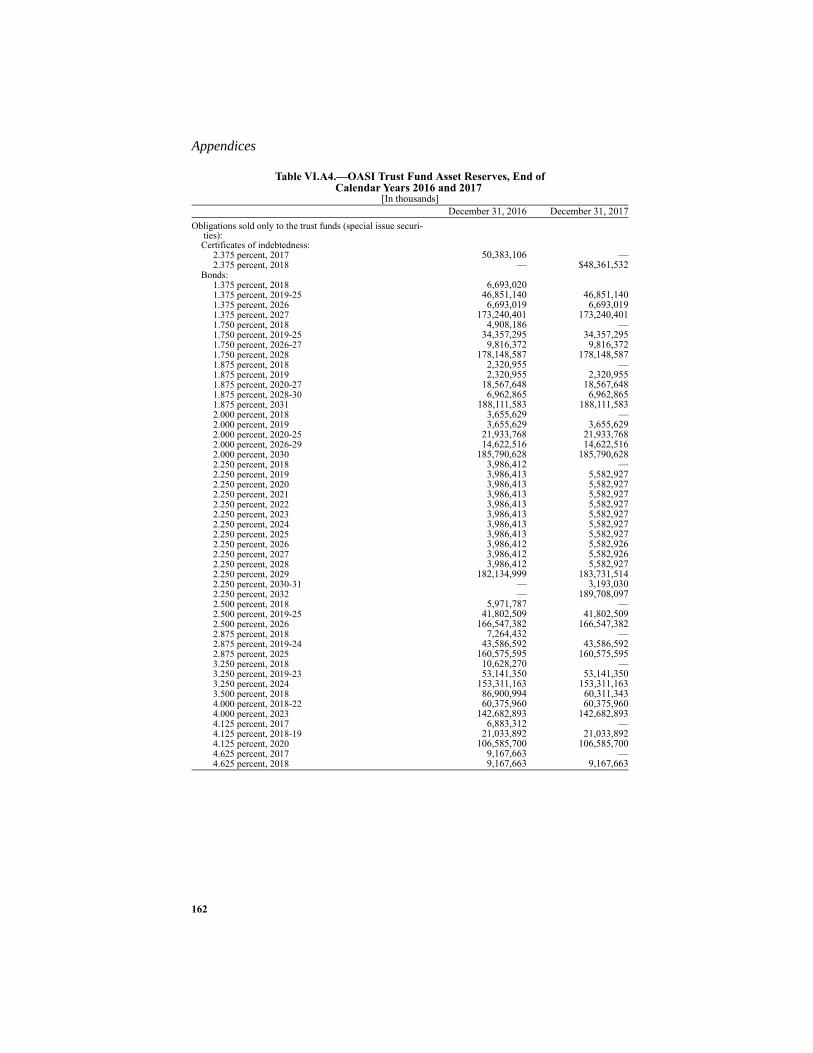
Appendices
162
Table VI.A4.—OASI Trust Fund Asset Reserves, End of Calendar Years 2016 and 2017
[In thousands]December 31, 2016 December 31, 2017
Obligations sold only to the trust funds (special issue securi-ties):
Certificates of indebtedness: 2.375 percent, 2017 50,383,106 — 2.375 percent, 2018 — $48,361,532
Bonds: 1.375 percent, 2018 6,693,020 1.375 percent, 2019-25 46,851,140 46,851,140 1.375 percent, 2026 6,693,019 6,693,019 1.375 percent, 2027 173,240,401 173,240,401 1.750 percent, 2018 4,908,186 — 1.750 percent, 2019-25 34,357,295 34,357,295 1.750 percent, 2026-27 9,816,372 9,816,372 1.750 percent, 2028 178,148,587 178,148,587 1.875 percent, 2018 2,320,955 — 1.875 percent, 2019 2,320,955 2,320,955 1.875 percent, 2020-27 18,567,648 18,567,648 1.875 percent, 2028-30 6,962,865 6,962,865 1.875 percent, 2031 188,111,583 188,111,583 2.000 percent, 2018 3,655,629 — 2.000 percent, 2019 3,655,629 3,655,629 2.000 percent, 2020-25 21,933,768 21,933,768 2.000 percent, 2026-29 14,622,516 14,622,516 2.000 percent, 2030 185,790,628 185,790,628 2.250 percent, 2018 3,986,412 — 2.250 percent, 2019 3,986,413 5,582,927 2.250 percent, 2020 3,986,413 5,582,927 2.250 percent, 2021 3,986,413 5,582,927 2.250 percent, 2022 3,986,413 5,582,927 2.250 percent, 2023 3,986,413 5,582,927 2.250 percent, 2024 3,986,413 5,582,927 2.250 percent, 2025 3,986,413 5,582,927 2.250 percent, 2026 3,986,412 5,582,926 2.250 percent, 2027 3,986,412 5,582,926 2.250 percent, 2028 3,986,412 5,582,927 2.250 percent, 2029 182,134,999 183,731,514 2.250 percent, 2030-31 — 3,193,030 2.250 percent, 2032 — 189,708,097 2.500 percent, 2018 5,971,787 — 2.500 percent, 2019-25 41,802,509 41,802,509 2.500 percent, 2026 166,547,382 166,547,382 2.875 percent, 2018 7,264,432 — 2.875 percent, 2019-24 43,586,592 43,586,592 2.875 percent, 2025 160,575,595 160,575,595 3.250 percent, 2018 10,628,270 — 3.250 percent, 2019-23 53,141,350 53,141,350 3.250 percent, 2024 153,311,163 153,311,163 3.500 percent, 2018 86,900,994 60,311,343 4.000 percent, 2018-22 60,375,960 60,375,960 4.000 percent, 2023 142,682,893 142,682,893 4.125 percent, 2017 6,883,312 — 4.125 percent, 2018-19 21,033,892 21,033,892 4.125 percent, 2020 106,585,700 106,585,700 4.625 percent, 2017 9,167,663 — 4.625 percent, 2018 9,167,663 9,167,663
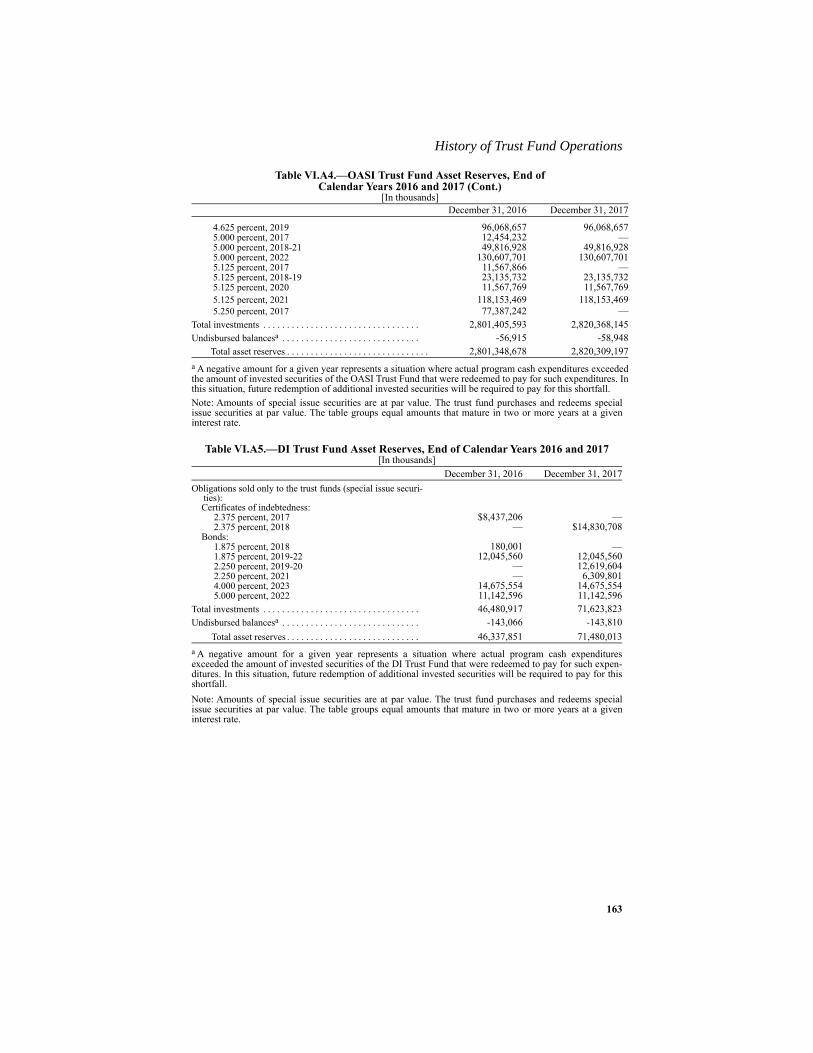
163
History of Trust Fund Operations
Note: Amounts of special issue securities are at par value. The trust fund purchases and redeems specialissue securities at par value. The table groups equal amounts that mature in two or more years at a giveninterest rate.
Note: Amounts of special issue securities are at par value. The trust fund purchases and redeems specialissue securities at par value. The table groups equal amounts that mature in two or more years at a giveninterest rate.
4.625 percent, 2019 96,068,657 96,068,657 5.000 percent, 2017 12,454,232 — 5.000 percent, 2018-21 49,816,928 49,816,928 5.000 percent, 2022 130,607,701 130,607,701 5.125 percent, 2017 11,567,866 — 5.125 percent, 2018-19 23,135,732 23,135,732 5.125 percent, 2020 11,567,769 11,567,769 5.125 percent, 2021 118,153,469 118,153,469 5.250 percent, 2017 77,387,242 —
Total investments . . . . . . . . . . . . . . . . . . . . . . . . . . . . . . . . . 2,801,405,593 2,820,368,145Undisbursed balancesa . . . . . . . . . . . . . . . . . . . . . . . . . . . . . -56,915 -58,948
Total asset reserves . . . . . . . . . . . . . . . . . . . . . . . . . . . . . . 2,801,348,678 2,820,309,197a A negative amount for a given year represents a situation where actual program cash expenditures exceededthe amount of invested securities of the OASI Trust Fund that were redeemed to pay for such expenditures. Inthis situation, future redemption of additional invested securities will be required to pay for this shortfall.
Table VI.A5.—DI Trust Fund Asset Reserves, End of Calendar Years 2016 and 2017[In thousands]
December 31, 2016 December 31, 2017Obligations sold only to the trust funds (special issue securi-
ties):Certificates of indebtedness:
2.375 percent, 2017 $8,437,206 — 2.375 percent, 2018 — $14,830,708
Bonds: 1.875 percent, 2018 180,001 — 1.875 percent, 2019-22 12,045,560 12,045,560 2.250 percent, 2019-20 — 12,619,604 2.250 percent, 2021 — 6,309,801 4.000 percent, 2023 14,675,554 14,675,554 5.000 percent, 2022 11,142,596 11,142,596
Total investments . . . . . . . . . . . . . . . . . . . . . . . . . . . . . . . . . 46,480,917 71,623,823Undisbursed balancesa . . . . . . . . . . . . . . . . . . . . . . . . . . . . .
a A negative amount for a given year represents a situation where actual program cash expendituresexceeded the amount of invested securities of the DI Trust Fund that were redeemed to pay for such expen-ditures. In this situation, future redemption of additional invested securities will be required to pay for thisshortfall.
-143,066 -143,810Total asset reserves . . . . . . . . . . . . . . . . . . . . . . . . . . . . 46,337,851 71,480,013
Table VI.A4.—OASI Trust Fund Asset Reserves, End of Calendar Years 2016 and 2017 (Cont.)
[In thousands]December 31, 2016 December 31, 2017

Appendices
164
B. HISTORY OF ACTUARIAL STATUS ESTIMATES
This appendix chronicles the history of the OASDI actuarial balance and theyear of combined OASI and DI Trust Fund reserve depletion since 1982under the intermediate assumptions. The actuarial balance is the principalsummary measure of actuarial status for the long-range period as a whole.The year of trust fund reserve depletion is also critical, as it indicates the yearby which legislative action would be needed in order to maintain timely pay-ment of scheduled benefits.
The 1983 report was the last report for which the actuarial balance was posi-tive. The two basic components of actuarial balance are the summarizedincome rate and the summarized cost rate, both of which are expressed aspercentages of taxable payroll over the period. Section IV.B.4 defines thesummarized income rate, summarized cost rate, and actuarial balance indetail. For any given period, the actuarial balance includes the differencebetween the present value of non-interest income for the period and the pres-ent value of the cost for the period, each divided by the present value of tax-able payroll for all years in the period. The computation of the actuarialbalance also includes:
• In the reports for 1988 and later, the amount of the trust fund assetreserves on hand at the beginning of the valuation period; and
• In the reports for 1991 and later, the present value of a target trust fundasset reserve equal to 100 percent of the annual cost to be reached andmaintained at the end of the valuation period.
Reports of 1973-87 used the average-cost method, a simpler method whichapproximates the results of the present-value approach for computing theactuarial balance. Under the average-cost method, the sum of the annual costrates over the 75-year projection period was divided by the total number ofyears, 75, to obtain the average cost rate per year. A similar computation pro-duced the average income rate. The actuarial balance was the differencebetween the average income rate and the average cost rate.
When the 1973 report introduced the average-cost method, the financing ofthe program was more nearly on a pay-as-you-go basis over the long-range.Also, the long-range demographic and economic assumptions in that reportproduced an annual rate of growth in total taxable payroll which was aboutthe same as the annual rate at which the trust funds earned interest. In eithercircumstance (i.e., pay-as-you-go financing, where the annual income rate isthe same as the annual cost rate, or an annual rate of growth in total taxablepayroll equal to the annual interest rate), the average-cost method produces

165
History of Actuarial Status
the same result as the present-value method. However, by 1988, neither ofthese circumstances still existed.
After the 1977 and 1983 Social Security Amendments, projections indicatedsubstantial increases in the trust fund reserves continuing well into the 21stcentury. These laws changed the program’s financing from essentially pay-as-you-go to partial advance funding through the 75-year period. Also, forthe reports from 1973 through 1987, long-range fertility rates and averagereal-wage growth assumptions were gradually reduced, resulting in anannual rate of growth in taxable payroll that was significantly lower than theassumed interest rate by 1987. As a result of the difference between this rateof growth and the assumed interest rate, the results of the average-costmethod and the present-value method began to diverge in the reports for1973 through 1987, and by 1988 they were quite different. While the aver-age-cost method reflected most of the effects of assumed interest rates, it nolonger reflected all interest effects. The present-value method, by contrast,accurately reflects the implications of assumed interest rates. As a result, the1988 report reintroduced the present-value method of calculating the actuar-ial balance.
A positive actuarial balance indicates that estimated income (plus startingreserves, beginning with the 1988 report) is more than sufficient to meet esti-mated trust fund obligations (plus the ending target fund, beginning with the1991 report) for the period as a whole. Even with a positive actuarial bal-ance, it is possible for reserves to become temporarily depleted within thelong-range period. An actuarial balance of zero indicates that the estimatedincome (plus starting reserves, beginning with the 1988 report) exactlymatches estimated trust fund obligations (plus the ending target fund, begin-ning with the 1991 report) for the period as a whole. A negative actuarial bal-ance indicates that estimated income (plus starting reserves, beginning withthe 1988 report) is insufficient to meet estimated trust fund obligations (plusthe ending target fund, beginning with the 1991 report) for the entire period.
Table VI.B1 contains the estimated OASDI actuarial balances, summarizedincome rates, and summarized cost rates for the 1982 report through the cur-rent report. The reports presented these values on the basis of the intermedi-ate assumptions, which recent reports refer to as alternative II and reportsfrom 1982 to 1990 referred to as alternative II-B.

Appendices
166
Note: Totals do not necessarily equal the sums of rounded components.
Table VI.B1.—Long-Range OASDI Actuarial Balances and Trust Fund Reserve Depletion Dates as Shown in the Trustees Reports for 1982-2018 under Intermediate
Assumptionsa[As a percentage of taxable payroll]
a This table shows the actuarial balance and year of trust fund reserve depletion based on the intermediateassumptions, which the 1982-90 reports referred to as alternative II-B and the 1991 and later reports refer toas alternative II.
Year of reportSummarizedincome rate
Summarizedcost rate
Actuarialbalanceb
b The definition and method of calculating the actuarial balance were changed in 1988 and 1991. See textfor details.
Change fromprevious yearc
c A detailed year-by-year breakdown of the reasons for the changes in the actuarial balance since the 1983Trustees Report may be found in Actuarial Note 2018.8 at www.ssa.gov/OACT/NOTES/ran8/.
Year ofcombined trust
fund reservedepletion
1982 . . . . . . . . . . . 12.27 14.09 -1.82 d 19831983 . . . . . . . . . . . 12.87 12.84 +.02 +1.84 solvent1984 . . . . . . . . . . . 12.90 12.95 -.06 -.08 solvent1985 . . . . . . . . . . . 12.94 13.35 -.41 -.35 2049
1986 . . . . . . . . . . . 12.96 13.40 -.44 -.03 20511987 . . . . . . . . . . . 12.89 13.51 -.62 -.18 20511988 . . . . . . . . . . . 12.94 13.52 -.58 +.04 20481989 . . . . . . . . . . . 13.02 13.72 -.70 -.13 20461990 . . . . . . . . . . . 13.04 13.95 -.91 -.21 2043
1991 . . . . . . . . . . . 13.11 14.19 -1.08 -.17 20411992 . . . . . . . . . . . 13.16 14.63 -1.46 -.38 20361993 . . . . . . . . . . . 13.21 14.67 -1.46 d
d Between -0.005 and 0.005 percent of taxable payroll.
20361994 . . . . . . . . . . . 13.24 15.37 -2.13 -.66 20291995 . . . . . . . . . . . 13.27 15.44 -2.17 -.04 2030
1996 . . . . . . . . . . . 13.33 15.52 -2.19 -.02 20291997 . . . . . . . . . . . 13.37 15.60 -2.23 -.03 20291998 . . . . . . . . . . . 13.45 15.64 -2.19 +.04 20321999 . . . . . . . . . . . 13.49 15.56 -2.07 +.12 20342000 . . . . . . . . . . . 13.51 15.40 -1.89 +.17 2037
2001 . . . . . . . . . . . 13.58 15.44 -1.86 +.03 20382002 . . . . . . . . . . . 13.72 15.59 -1.87 -.01 20412003 . . . . . . . . . . . 13.78 15.70 -1.92 -.04 20422004 . . . . . . . . . . . 13.84 15.73 -1.89 +.03 20422005 . . . . . . . . . . . 13.87 15.79 -1.92 -.04 2041
2006 . . . . . . . . . . . 13.88 15.90 -2.02 -.09 20402007 . . . . . . . . . . . 13.92 15.87 -1.95 +.06 20412008 . . . . . . . . . . . 13.94 15.63 -1.70 +.26 20412009 . . . . . . . . . . . 14.02 16.02 -2.00 -.30 20372010 . . . . . . . . . . . 14.01 15.93 -1.92 +.08 2037
2011 . . . . . . . . . . . 14.02 16.25 -2.22 -.30 20362012 . . . . . . . . . . . 14.02 16.69 -2.67 -.44 20332013 . . . . . . . . . . . 13.88 16.60 -2.72 -.05 20332014 . . . . . . . . . . . 13.89 16.77 -2.88 -.16 20332015 . . . . . . . . . . . 13.86 16.55 -2.68 +.20 2034
2016 . . . . . . . . . . . 13.84 16.50 -2.66 +.02 20342017 . . . . . . . . . . . 13.84 16.67 -2.83 -.17 20342018 . . . . . . . . . . . 13.84 16.69 -2.84 -.02 2034
167
History of Actuarial Status
For several of the years included in the table, significant legislative changesor definitional changes affected the estimated actuarial balance. The SocialSecurity Amendments of 1983 account for the largest single change shownin the table: the actuarial balance of -1.82 for the 1982 report improved to+0.02 for the 1983 report. In 1985, the estimated actuarial balance changedlargely because of an adjustment made to the method for estimating the agedistribution of immigrants.
Rebenchmarking of the National Income and Product Accounts and changesin demographic assumptions contributed to the change in the actuarial bal-ance for 1987. Various changes in assumptions and methods for the 1988report had roughly offsetting effects on the actuarial balance. In 1989 and1990, changes in economic assumptions accounted for most of the changesin the estimated actuarial balance.
In 1991, the effect of legislation, changes in economic assumptions, and theintroduction of the cost of reaching and maintaining an ending target trustfund level combined to produce the change in the actuarial balance. In 1992,changes in disability assumptions and the method for projecting average ben-efit levels accounted for most of the change in the actuarial balance. In 1993,numerous small changes in assumptions and methods had offsetting effectson the actuarial balance. In 1994, changes in the real-wage assumptions, dis-ability rates, and the earnings sample used for projecting average benefit lev-els accounted for most of the change in the actuarial balance. In 1995,numerous small changes had largely offsetting effects on the actuarial bal-ance, including a substantial reallocation of the payroll tax rate, whichreduced the OASI actuarial balance, but increased the DI actuarial balance.
In 1996, a change in the method of projecting dually-entitled beneficiariesproduced a large increase in the actuarial balance, which almost totally offsetdecreases produced by changes in the valuation period and in the demo-graphic and economic assumptions. Various changes in assumptions andmethods for the 1997 report had roughly offsetting effects on the actuarialbalance. In 1998, increases caused by changes in the economic assumptions,although partially offset by decreases produced by changes in the valuationperiod and in the demographic assumptions, accounted for most of thechanges in the estimated actuarial balance. In 1999, increases caused bychanges in the economic assumptions (related to improvements in the CPI bythe Bureau of Labor Statistics) accounted for most of the changes in the esti-mated actuarial balance. For the 2000 report, changes in economic assump-tions and methodology caused increases in the actuarial balance, althoughreductions in the balance caused by the change in valuation period andchanges in demographic assumptions partially offset these increases.
Appendices
168
For the 2001 report, increases caused by changes in the demographic startingvalues, although partially offset by a decrease produced by the change in thevaluation period, accounted for most of the changes in the estimated actuarialbalance. For the 2002 report, changes in the valuation period and the demo-graphic assumptions—both decreases in the actuarial balance—were offsetby changes in the economic assumptions, while an increase due to disabilityassumptions was slightly more than offset by a decrease due to changes inthe projection methods and data. For the 2003 report, an increase due to thechange in program assumptions was more than offset by decreases due to thechange in valuation period and changes in demographic assumptions. In the2004 report, increases due to changing the method of projecting benefit lev-els for higher earners more than offset decreases in the actuarial balance aris-ing from the change in the valuation period and the net effect of otherchanges in programmatic data and methods. For the 2005 report, an increasedue to changing the method of projecting future average benefit levels wasmore than offset by decreases due to changes in the valuation period, updatedstarting values for the economic assumptions, and other methodologicalchanges.
In 2006, decreases in the actuarial balance due to the change in the valuationperiod, a reduction in the ultimate annual real interest rate, and improve-ments in calculating mortality for disabled workers, were greater in aggre-gate than increases in the actuarial balance due to changes in demographicstarting values and the ultimate total fertility rate, as well as other program-matic data and method changes. For the 2007 report, increases in the actuar-ial balance arising from revised disability incidence rate assumptions,improvements in average benefit level projections, and changes in near-termeconomic projections, more than offset decreases in the balance due to thevaluation period change and updated historical mortality data. For the 2008report, the large increase in the actuarial balance was primarily due tochanges in immigration projection methods and assumptions. These changesmore than offset the decreases in the actuarial balance due to the change inthe valuation period and the lower starting and ultimate mortality rates. In2009, changes in starting values and near-term economic assumptions due tothe economic recession, faster ultimate rates of decline in death rates forages 65-84, and the change in the valuation period accounted for most of thelarge decrease in the actuarial balance. Legislative changes, in particular theestimated effects of the Patient Protection and Affordable Care Act and theHealth Care and Education Reconciliation Act of 2010, were the main reasonfor the increase in the actuarial balance for the 2010 report. The change inthe valuation period partially offset this increase; there were also changes in

169
History of Actuarial Status
several assumptions, methods, and recent data which had largely offsettingeffects.
For the 2011 report, changes in mortality projections, due to new startingvalues and revised methods, were the most significant of several factors con-tributing to the increase in the deficit. In 2012, changes in economic assump-tions and starting values accounted for about half of the decrease in actuarialbalance. Other factors worsening the actuarial balance were the change invaluation period, changes to starting demographic values, changes to ulti-mate disability incidence assumptions, and methodology changes and dataupdates. For the 2013 report, the change in valuation period accounted forthe entire net change in the actuarial balance. The effects of substantiallylower death rates for 2009 than previously projected and the American Tax-payer Relief Act of 2012 (which lowered the Federal marginal income taxrates) were offset by updates of program-specific data and methodologyimprovements. In 2014, changes in economic data and assumptionsaccounted for the majority of the net change in the actuarial balance. Otherfactors worsening the actuarial balance were the change in the valuationperiod and various methodology improvements and data updates. For the2015 report, methodological improvements and updates of programmaticdata accounted for the majority of the net increase in the actuarial balance.Also increasing the actuarial balance were a lower assumed ultimate averagewage differential and changes in near-term economic assumptions. Theseincreases were offset somewhat by the change in the valuation period andupdates to historical and near-term projected birth rates.
For the 2016 report, the actuarial balance increased primarily due to theeffects of the Bipartisan Budget Act of 2015 and improvements made toimmigration methods. The most notable immigration change was a revisionto the method for projecting emigration of the never-authorized population toreflect lower rates of emigration for those who have resided here longer.These increases in the actuarial balance were largely offset by the effects ofchanges in ultimate economic assumptions, including a lower real interestrate and a lower annual increase in the rate of price inflation. In 2017, thechange in the valuation period and various methodology improvementsaccounted for most of the net reduction in the actuarial balance. Other eco-nomic factors also contributed to worsening the actuarial balance, includinga lower real-wage differential assumption and an assumed weaker recoveryfrom the recent recession. These reductions were offset somewhat by lowerestimated disability incidence rates over the short-range period.
Section IV.B.6 describes changes affecting the actuarial balance shown forthe 2018 report.

Appendices
170
C. FISCAL YEAR HISTORICAL AND PROJECTED TRUST FUND OPERATIONS THROUGH 2027
Tables VI.C1, VI.C2, and VI.C3 contain details of the fiscal year 2017 opera-tions of the OASI, DI, and the combined OASI and DI Trust Funds, respec-tively. The fiscal year for the U.S. Government is the 12-month periodending September 30. Fiscal year 2017 is the most recent fiscal year forwhich complete information is available. The descriptions of the values inthese tables are similar to the corresponding descriptions and values in thecalendar year operations tables in section III.A. Please see that section for adescription of the various items of income and outgo.

171
Fiscal Year Operations and Projections
Note: Totals do not necessarily equal the sums of rounded components.
Table VI.C1.—Operations of the OASI Trust Fund, Fiscal Year 2017[In millions]
Total asset reserves, September 30, 2016. . . . . . . . . . . . . . . . . . . . . . . . . . . . . . . . . . . . . $2,796,620Receipts:
Net payroll tax contributions:Payroll tax contributionsa . . . . . . . . . . . . . . . . . . . . . . . . . . . . . . . . . . . . . . . . . . . . .
a Includes adjustments for prior years
$704,865Payments from the General Fund of the Treasury for payroll tax contributions sub-
ject to refunda . . . . . . . . . . . . . . . . . . . . . . . . . . . . . . . . . . . . . . . . . . . . . . . . . . . -2,741Net payroll tax contributionsa. . . . . . . . . . . . . . . . . . . . . . . . . . . . . . . . . . . . . . . . 702,123
Reimbursements from the General Fund:Reduction in payroll tax contributions due to P.L.s 111-312, 112-78, and 112-96a. 9Reimbursements directed by P.L. 110-246. . . . . . . . . . . . . . . . . . . . . . . . . . . . . . . . 6Payroll tax credits due to P.L. 98-21a . . . . . . . . . . . . . . . . . . . . . . . . . . . . . . . . . . . . b
b Between -$0.5 and $0.5 million.
Net General Fund reimbursementsa 15Income based on taxation of benefit payments:
Withheld from benefit payments to nonresident aliens . . . . . . . . . . . . . . . . . . . . . . 206All other, not subject to withholdinga. . . . . . . . . . . . . . . . . . . . . . . . . . . . . . . . . . . . 35,210
Total income from taxation of benefitsa . . . . . . . . . . . . . . . . . . . . . . . . . . . . . . . . 35,416Investment income and interest adjustments:
Interest on investments . . . . . . . . . . . . . . . . . . . . . . . . . . . . . . . . . . . . . . . . . . . . . . . 84,887Interest adjustmentsc . . . . . . . . . . . . . . . . . . . . . . . . . . . . . . . . . . . . . . . . . . . . . . . .
c Includes: (1) interest on adjustments in the allocation of administrative expenses between the trust fund andthe General Fund account for the Supplemental Security Income program, (2) interest arising from therevised allocation of administrative expenses among the trust funds, and (3) interest on certain reimburse-ments to the trust fund.
1Total investment income and interest adjustments . . . . . . . . . . . . . . . . . . . . . . . . 84,888
Gifts . . . . . . . . . . . . . . . . . . . . . . . . . . . . . . . . . . . . . . . . . . . . . . . . . . . . . . . . . . . . . . . b
Total receipts . . . . . . . . . . . . . . . . . . . . . . . . . . . . . . . . . . . . . . . . . . . . . . . . . . . . . . . . . . 822,442Disbursements:
Benefit payments:Monthly benefits and lump-sum death paymentsd . . . . . . . . . . . . . . . . . . . . . . . . . .
d Includes net reductions for the recovery of overpayments.
791,126Reimbursement from the General Fund for unnegotiated checks . . . . . . . . . . . . . . -35Payment for costs of vocational rehabilitation services for disabled beneficiaries 4
Net benefit paymentsd . . . . . . . . . . . . . . . . . . . . . . . . . . . . . . . . . . . . . . . . . . . . . 791,094Financial interchange with the Railroad Retirement “Social Security Equivalent
Benefit Account”. . . . . . . . . . . . . . . . . . . . . . . . . . . . . . . . . . . . . . . . . . . . . . . . . . . . 4,316Administrative expenses:
Costs incurred by:Social Security Administration. . . . . . . . . . . . . . . . . . . . . . . . . . . . . . . . . . . . . . . 3,046Department of the Treasury . . . . . . . . . . . . . . . . . . . . . . . . . . . . . . . . . . . . . . . . . 520
Offsetting miscellaneous receipts. . . . . . . . . . . . . . . . . . . . . . . . . . . . . . . . . . . . . . . -10Miscellaneous reimbursements from the General Fund e . . . . . . . . . . . . . . . . . . . .
e Reimbursements for costs incurred in performing certain legislatively mandated activities not directlyrelated to administering the OASI program.
-5Net administrative expenses 3,551
Total disbursements . . . . . . . . . . . . . . . . . . . . . . . . . . . . . . . . . . . . . . . . . . . . . . . . . . . . . 798,961Net increase in asset reserves. . . . . . . . . . . . . . . . . . . . . . . . . . . . . . . . . . . . . . . . . . . . . . 23,481
Total invested assets . . . . . . . . . . . . . . . . . . . . . . . . . . . . . . . . . . . . . . . . . . . . . . . . . . . 2,820,200Undisbursed balancesf . . . . . . . . . . . . . . . . . . . . . . . . . . . . . . . . . . . . . . . . . . . . . . . . .
f A negative balance represents a situation where the actual program cash expenditures exceeded the amountof invested securities of the OASI Trust Fund that were redeemed to pay for such expenditures. In this situa-tion, future redemption of additional invested securities will be required to pay for this shortfall.
-99Total asset reserves, September 30, 2017. . . . . . . . . . . . . . . . . . . . . . . . . . . . . . . . . . . . . 2,820,101

Appendices
172
Note: Totals do not necessarily equal the sums of rounded components.
Table VI.C2.—Operations of the DI Trust Fund, Fiscal Year 2017[In millions]
Total asset reserves, September 30, 2016. . . . . . . . . . . . . . . . . . . . . . . . . . . . . . . . . . . . . $45,740Receipts:
Net payroll tax contributions:Payroll tax contributionsa . . . . . . . . . . . . . . . . . . . . . . . . . . . . . . . . . . . . . . . . . . . . .
a Includes adjustments for prior years.
$166,543Payments from the General Fund of the Treasury for payroll tax contributions sub-
ject to refunda . . . . . . . . . . . . . . . . . . . . . . . . . . . . . . . . . . . . . . . . . . . . . . . . . . . -642Net payroll tax contributionsa. . . . . . . . . . . . . . . . . . . . . . . . . . . . . . . . . . . . . . . . 165,901
Reimbursements from the General Fund:Reduction in payroll tax contributions due to P.L.s 111-312, 112-78, and 112-96a. 2Reimbursements directed by P.L. 110-246. . . . . . . . . . . . . . . . . . . . . . . . . . . . . . . . 1Payroll tax credits due to P.L. 98-21a . . . . . . . . . . . . . . . . . . . . . . . . . . . . . . . . . . . . b
b Between -$0.5 and $0.5 million.
Net General Fund reimbursementsa . . . . . . . . . . . . . . . . . . . . . . . . . . . . . . . . . . . 3Income based on taxation of benefit payments:
Withheld from benefit payments to nonresident aliens . . . . . . . . . . . . . . . . . . . . . . 4All other, not subject to withholdinga . . . . . . . . . . . . . . . . . . . . . . . . . . . . . . . . . . . 1,947
Total income from taxation of benefitsa . . . . . . . . . . . . . . . . . . . . . . . . . . . . . . . . 1,951Investment income and interest adjustments:
Interest on investments. . . . . . . . . . . . . . . . . . . . . . . . . . . . . . . . . . . . . . . . . . . . . . . 1,624Interest adjustmentsc . . . . . . . . . . . . . . . . . . . . . . . . . . . . . . . . . . . . . . . . . . . . . . . .
c Includes: (1) interest on adjustments in the allocation of administrative expenses between the trust fund andthe General Fund account for the Supplemental Security Income program, (2) interest arising from therevised allocation of administrative expenses among the trust funds, and (3) interest on certain reimburse-ments to the trust fund.
2Total investment income and interest adjustments . . . . . . . . . . . . . . . . . . . . . . . . 1,625
Gifts . . . . . . . . . . . . . . . . . . . . . . . . . . . . . . . . . . . . . . . . . . . . . . . . . . . . . . . . . . . . . . . —Total receipts . . . . . . . . . . . . . . . . . . . . . . . . . . . . . . . . . . . . . . . . . . . . . . . . . . . . . . . . . . 169,480
Disbursements:Benefit payments:
Monthly benefitsd . . . . . . . . . . . . . . . . . . . . . . . . . . . . . . . . . . . . . . . . . . . . . . . . . . .
d Includes net reductions for the recovery of overpayments.
142,823Reimbursement from the General Fund for unnegotiated checks . . . . . . . . . . . . . . -19Payment for costs of vocational rehabilitation services for disabled beneficiaries . 79
Net benefit paymentsd . . . . . . . . . . . . . . . . . . . . . . . . . . . . . . . . . . . . . . . . . . . . . 142,883Financial interchange with the Railroad Retirement “Social Security Equivalent
Benefit Account”. . . . . . . . . . . . . . . . . . . . . . . . . . . . . . . . . . . . . . . . . . . . . . . . . . . . 207Administrative expenses:
Costs incurred by:Social Security Administration. . . . . . . . . . . . . . . . . . . . . . . . . . . . . . . . . . . . . . . 2,580Department of the Treasury . . . . . . . . . . . . . . . . . . . . . . . . . . . . . . . . . . . . . . . . . 100
Offsetting miscellaneous receipts b
Demonstration projects. . . . . . . . . . . . . . . . . . . . . . . . . . . . . . . . . . . . . . . . . . . . . . . 10Miscellaneous reimbursements from the General Funde . . . . . . . . . . . . . . . . . . . . .
e Reimbursements for costs incurred in performing certain legislatively mandated activities not directlyrelated to administering the DI program.
-3Net administrative expenses . . . . . . . . . . . . . . . . . . . . . . . . . . . . . . . . . . . . . . . . . 2,686
Total disbursements . . . . . . . . . . . . . . . . . . . . . . . . . . . . . . . . . . . . . . . . . . . . . . . . . . . . . 145,776Net increase in asset reserves. . . . . . . . . . . . . . . . . . . . . . . . . . . . . . . . . . . . . . . . . . . . . . 23,704
Total invested assets . . . . . . . . . . . . . . . . . . . . . . . . . . . . . . . . . . . . . . . . . . . . . . . . . . . 69,669Undisbursed balancesf . . . . . . . . . . . . . . . . . . . . . . . . . . . . . . . . . . . . . . . . . . . . . . . . .
f A negative balance represents a situation where the actual program cash expenditures exceeded the amountof invested securities of the DI Trust Fund that were redeemed to pay for such expenditures. In this situation,future redemption of additional invested securities will be required to pay for this shortfall.
-225Total asset reserves, September 30, 2017. . . . . . . . . . . . . . . . . . . . . . . . . . . . . . . . . . . . . 69,444
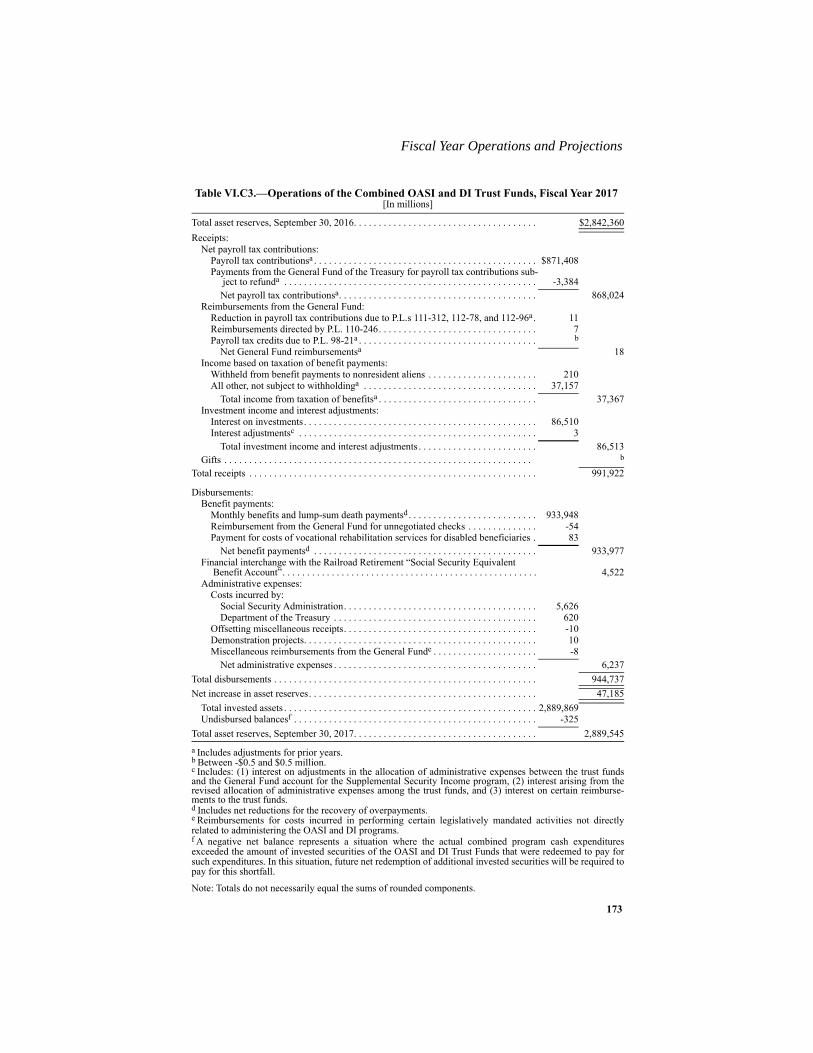
173
Fiscal Year Operations and Projections
Note: Totals do not necessarily equal the sums of rounded components.
Table VI.C3.—Operations of the Combined OASI and DI Trust Funds, Fiscal Year 2017[In millions]
Total asset reserves, September 30, 2016. . . . . . . . . . . . . . . . . . . . . . . . . . . . . . . . . . . . . $2,842,360Receipts:
Net payroll tax contributions:Payroll tax contributionsa . . . . . . . . . . . . . . . . . . . . . . . . . . . . . . . . . . . . . . . . . . . . .
a Includes adjustments for prior years.
$871,408Payments from the General Fund of the Treasury for payroll tax contributions sub-
ject to refunda . . . . . . . . . . . . . . . . . . . . . . . . . . . . . . . . . . . . . . . . . . . . . . . . . . . -3,384Net payroll tax contributionsa. . . . . . . . . . . . . . . . . . . . . . . . . . . . . . . . . . . . . . . . 868,024
Reimbursements from the General Fund:Reduction in payroll tax contributions due to P.L.s 111-312, 112-78, and 112-96a. 11Reimbursements directed by P.L. 110-246. . . . . . . . . . . . . . . . . . . . . . . . . . . . . . . . 7Payroll tax credits due to P.L. 98-21a . . . . . . . . . . . . . . . . . . . . . . . . . . . . . . . . . . . . b
b Between -$0.5 and $0.5 million.
Net General Fund reimbursementsa 18Income based on taxation of benefit payments:
Withheld from benefit payments to nonresident aliens . . . . . . . . . . . . . . . . . . . . . . 210All other, not subject to withholdinga . . . . . . . . . . . . . . . . . . . . . . . . . . . . . . . . . . . 37,157
Total income from taxation of benefitsa . . . . . . . . . . . . . . . . . . . . . . . . . . . . . . . . 37,367Investment income and interest adjustments:
Interest on investments. . . . . . . . . . . . . . . . . . . . . . . . . . . . . . . . . . . . . . . . . . . . . . . 86,510Interest adjustmentsc . . . . . . . . . . . . . . . . . . . . . . . . . . . . . . . . . . . . . . . . . . . . . . . .
c Includes: (1) interest on adjustments in the allocation of administrative expenses between the trust fundsand the General Fund account for the Supplemental Security Income program, (2) interest arising from therevised allocation of administrative expenses among the trust funds, and (3) interest on certain reimburse-ments to the trust funds.
3Total investment income and interest adjustments . . . . . . . . . . . . . . . . . . . . . . . . 86,513
Gifts . . . . . . . . . . . . . . . . . . . . . . . . . . . . . . . . . . . . . . . . . . . . . . . . . . . . . . . . . . . . . . b
Total receipts . . . . . . . . . . . . . . . . . . . . . . . . . . . . . . . . . . . . . . . . . . . . . . . . . . . . . . . . . . 991,922
Disbursements:Benefit payments:
Monthly benefits and lump-sum death paymentsd . . . . . . . . . . . . . . . . . . . . . . . . . .
d Includes net reductions for the recovery of overpayments.
933,948Reimbursement from the General Fund for unnegotiated checks . . . . . . . . . . . . . . -54Payment for costs of vocational rehabilitation services for disabled beneficiaries . 83
Net benefit paymentsd . . . . . . . . . . . . . . . . . . . . . . . . . . . . . . . . . . . . . . . . . . . . . 933,977Financial interchange with the Railroad Retirement “Social Security Equivalent
Benefit Account”. . . . . . . . . . . . . . . . . . . . . . . . . . . . . . . . . . . . . . . . . . . . . . . . . . . . 4,522Administrative expenses:
Costs incurred by:Social Security Administration. . . . . . . . . . . . . . . . . . . . . . . . . . . . . . . . . . . . . . . 5,626Department of the Treasury . . . . . . . . . . . . . . . . . . . . . . . . . . . . . . . . . . . . . . . . . 620
Offsetting miscellaneous receipts. . . . . . . . . . . . . . . . . . . . . . . . . . . . . . . . . . . . . . . -10Demonstration projects. . . . . . . . . . . . . . . . . . . . . . . . . . . . . . . . . . . . . . . . . . . . . . . 10Miscellaneous reimbursements from the General Funde . . . . . . . . . . . . . . . . . . . . .
e Reimbursements for costs incurred in performing certain legislatively mandated activities not directlyrelated to administering the OASI and DI programs.
-8Net administrative expenses . . . . . . . . . . . . . . . . . . . . . . . . . . . . . . . . . . . . . . . . . 6,237
Total disbursements . . . . . . . . . . . . . . . . . . . . . . . . . . . . . . . . . . . . . . . . . . . . . . . . . . . . . 944,737Net increase in asset reserves. . . . . . . . . . . . . . . . . . . . . . . . . . . . . . . . . . . . . . . . . . . . . . 47,185
Total invested assets . . . . . . . . . . . . . . . . . . . . . . . . . . . . . . . . . . . . . . . . . . . . . . . . . . . 2,889,869Undisbursed balancesf . . . . . . . . . . . . . . . . . . . . . . . . . . . . . . . . . . . . . . . . . . . . . . . . .
f A negative net balance represents a situation where the actual combined program cash expendituresexceeded the amount of invested securities of the OASI and DI Trust Funds that were redeemed to pay forsuch expenditures. In this situation, future net redemption of additional invested securities will be required topay for this shortfall.
-325Total asset reserves, September 30, 2017. . . . . . . . . . . . . . . . . . . . . . . . . . . . . . . . . . . . . 2,889,545
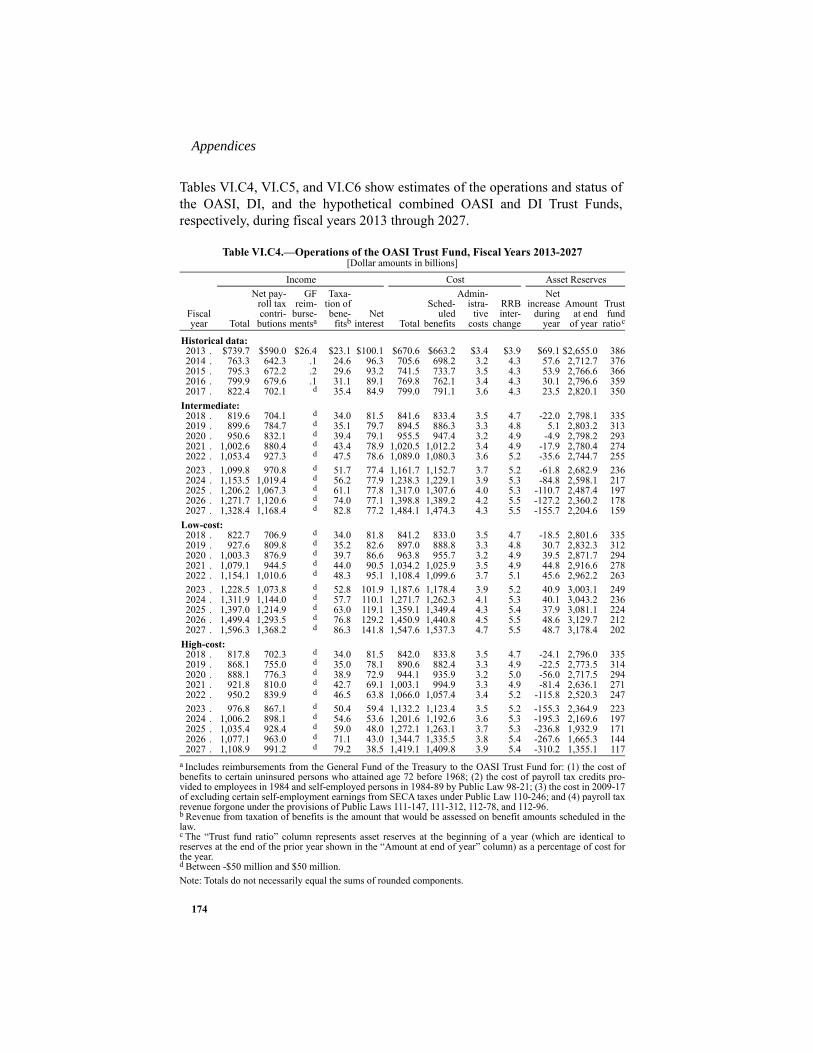
Appendices
174
Tables VI.C4, VI.C5, and VI.C6 show estimates of the operations and status ofthe OASI, DI, and the hypothetical combined OASI and DI Trust Funds,respectively, during fiscal years 2013 through 2027.
Note: Totals do not necessarily equal the sums of rounded components.
Table VI.C4.—Operations of the OASI Trust Fund, Fiscal Years 2013-2027[Dollar amounts in billions]
Fiscal year
Income Cost Asset Reserves
Total
Net pay-roll taxcontri-
butions
GFreim-
burse-mentsa
a Includes reimbursements from the General Fund of the Treasury to the OASI Trust Fund for: (1) the cost ofbenefits to certain uninsured persons who attained age 72 before 1968; (2) the cost of payroll tax credits pro-vided to employees in 1984 and self-employed persons in 1984-89 by Public Law 98-21; (3) the cost in 2009-17of excluding certain self-employment earnings from SECA taxes under Public Law 110-246; and (4) payroll taxrevenue forgone under the provisions of Public Laws 111-147, 111-312, 112-78, and 112-96.
Taxa-tion ofbene-
fitsb
b Revenue from taxation of benefits is the amount that would be assessed on benefit amounts scheduled in thelaw.
Netinterest Total
Sched-uled
benefits
Admin-istra-
tivecosts
RRBinter-
change
Netincrease
duringyear
Amountat end
of year
Trustfund
ratioc
c The “Trust fund ratio” column represents asset reserves at the beginning of a year (which are identical toreserves at the end of the prior year shown in the “Amount at end of year” column) as a percentage of cost forthe year.
Historical data:2013 . $739.7 $590.0 $26.4 $23.1 $100.1 $670.6 $663.2 $3.4 $3.9 $69.1 $2,655.0 3862014 . 763.3 642.3 .1 24.6 96.3 705.6 698.2 3.2 4.3 57.6 2,712.7 3762015 . 795.3 672.2 .2 29.6 93.2 741.5 733.7 3.5 4.3 53.9 2,766.6 3662016 . 799.9 679.6 .1 31.1 89.1 769.8 762.1 3.4 4.3 30.1 2,796.6 3592017 . 822.4 702.1 d
d Between -$50 million and $50 million.
35.4 84.9 799.0 791.1 3.6 4.3 23.5 2,820.1 350Intermediate:2018 . 819.6 704.1 d 34.0 81.5 841.6 833.4 3.5 4.7 -22.0 2,798.1 3352019 . 899.6 784.7 d 35.1 79.7 894.5 886.3 3.3 4.8 5.1 2,803.2 3132020 . 950.6 832.1 d 39.4 79.1 955.5 947.4 3.2 4.9 -4.9 2,798.2 2932021 . 1,002.6 880.4 d 43.4 78.9 1,020.5 1,012.2 3.4 4.9 -17.9 2,780.4 2742022 . 1,053.4 927.3 d 47.5 78.6 1,089.0 1,080.3 3.6 5.2 -35.6 2,744.7 2552023 . 1,099.8 970.8 d 51.7 77.4 1,161.7 1,152.7 3.7 5.2 -61.8 2,682.9 2362024 . 1,153.5 1,019.4 d 56.2 77.9 1,238.3 1,229.1 3.9 5.3 -84.8 2,598.1 2172025 . 1,206.2 1,067.3 d 61.1 77.8 1,317.0 1,307.6 4.0 5.3 -110.7 2,487.4 1972026 . 1,271.7 1,120.6 d 74.0 77.1 1,398.8 1,389.2 4.2 5.5 -127.2 2,360.2 1782027 . 1,328.4 1,168.4 d 82.8 77.2 1,484.1 1,474.3 4.3 5.5 -155.7 2,204.6 159
Low-cost:2018 . 822.7 706.9 d 34.0 81.8 841.2 833.0 3.5 4.7 -18.5 2,801.6 3352019 . 927.6 809.8 d 35.2 82.6 897.0 888.8 3.3 4.8 30.7 2,832.3 3122020 . 1,003.3 876.9 d 39.7 86.6 963.8 955.7 3.2 4.9 39.5 2,871.7 2942021 . 1,079.1 944.5 d 44.0 90.5 1,034.2 1,025.9 3.5 4.9 44.8 2,916.6 2782022 . 1,154.1 1,010.6 d 48.3 95.1 1,108.4 1,099.6 3.7 5.1 45.6 2,962.2 2632023 . 1,228.5 1,073.8 d 52.8 101.9 1,187.6 1,178.4 3.9 5.2 40.9 3,003.1 2492024 . 1,311.9 1,144.0 d 57.7 110.1 1,271.7 1,262.3 4.1 5.3 40.1 3,043.2 2362025 . 1,397.0 1,214.9 d 63.0 119.1 1,359.1 1,349.4 4.3 5.4 37.9 3,081.1 2242026 . 1,499.4 1,293.5 d 76.8 129.2 1,450.9 1,440.8 4.5 5.5 48.6 3,129.7 2122027 . 1,596.3 1,368.2 d 86.3 141.8 1,547.6 1,537.3 4.7 5.5 48.7 3,178.4 202
High-cost:2018 . 817.8 702.3 d 34.0 81.5 842.0 833.8 3.5 4.7 -24.1 2,796.0 3352019 . 868.1 755.0 d 35.0 78.1 890.6 882.4 3.3 4.9 -22.5 2,773.5 3142020 . 888.1 776.3 d 38.9 72.9 944.1 935.9 3.2 5.0 -56.0 2,717.5 2942021 . 921.8 810.0 d 42.7 69.1 1,003.1 994.9 3.3 4.9 -81.4 2,636.1 2712022 . 950.2 839.9 d 46.5 63.8 1,066.0 1,057.4 3.4 5.2 -115.8 2,520.3 2472023 . 976.8 867.1 d 50.4 59.4 1,132.2 1,123.4 3.5 5.2 -155.3 2,364.9 2232024 . 1,006.2 898.1 d 54.6 53.6 1,201.6 1,192.6 3.6 5.3 -195.3 2,169.6 1972025 . 1,035.4 928.4 d 59.0 48.0 1,272.1 1,263.1 3.7 5.3 -236.8 1,932.9 1712026 . 1,077.1 963.0 d 71.1 43.0 1,344.7 1,335.5 3.8 5.4 -267.6 1,665.3 1442027 . 1,108.9 991.2 d 79.2 38.5 1,419.1 1,409.8 3.9 5.4 -310.2 1,355.1 117

175
Fiscal Year Operations and Projections
Note: Totals do not necessarily equal the sums of rounded components.
Table VI.C5.—Operations of the DI Trust Fund, Fiscal Years 2013-2027a[Dollar amounts in billions]
a The DI Trust Fund becomes depleted in fiscal year 2023 under the high-cost assumptions. For any periodduring which reserves would be depleted, scheduled benefits could not be paid in full on a timely basis, incomefrom taxing benefits would be less than would apply to scheduled benefits, and interest on trust fund reserveswould be negligible.
Fiscal year
Income Cost Asset Reserves
Total
Net pay-roll taxcontri-
butions
GFreim-
burse-mentsb
b Includes reimbursements from the General Fund of the Treasury to the DI Trust Fund for: (1) the cost of pay-roll tax credits provided to employees in 1984 and self-employed persons in 1984-89 by Public Law 98-21;(2) the cost in 2009-17 of excluding certain self-employment earnings from SECA taxes under PublicLaw 110-246; and (3) payroll tax revenue forgone under the provisions of Public Laws 111-147, 111-312,112-78, and 112-96.
Taxa-tion ofbene-
fitsc
c Revenue from taxation of benefits is the amount that would be assessed on benefit amounts scheduled in thelaw.
Netinterest Total
Sched-uled
benefits
Admin-istra-
tivecosts
RRBinter-
change
Netincrease
duringyear
Amountat end
of year
Trustfund
ratiod
d The “Trust fund ratio” column represents asset reserves at the beginning of a year (which are identical toreserves at the end of the prior year shown in the “Amount at end of year” column) as a percentage of cost forthe year.
Historical data:2013 . $111.3 $100.2 $4.5 $1.1 $5.5 $142.8 $139.4 $2.8 $0.6 -$31.5 $100.5 922014 . 114.1 109.1 e
e Between -$50 million and $50 million.
1.0 4.0 144.7 141.3 2.9 .4 -30.6 69.9 692015 . 118.0 114.2 e 1.0 2.7 146.2 142.9 2.9 .4 -28.3 41.7 482016 . 150.3 147.6 e 1.2 1.5 146.2 143.1 2.8 .4 4.1 45.7 282017 . 169.5 165.9 e 2.0 1.6 145.8 142.9 2.7 .2 23.7 69.4 31
Intermediate:2018 . 170.4 166.5 e 1.7 2.2 148.0 145.0 2.9 .2 22.4 91.8 472019 . 151.0 146.5 e 1.6 2.9 152.0 149.1 2.8 .1 -1.0 90.8 602020 . 146.0 141.3 e 1.8 2.9 156.1 153.2 2.8 .2 -10.1 80.7 582021 . 154.1 149.5 e 1.9 2.7 161.5 158.3 3.0 .2 -7.4 73.3 502022 . 161.9 157.5 e 2.1 2.4 167.5 164.1 3.3 .1 -5.6 67.7 442023 . 169.3 164.9 e 2.2 2.2 174.6 170.8 3.6 .1 -5.3 62.4 392024 . 177.6 173.1 e 2.4 2.1 182.2 178.2 3.9 .1 -4.6 57.8 342025 . 185.7 181.2 e 2.6 1.9 191.0 186.8 4.1 .1 -5.3 52.5 302026 . 195.2 190.3 e 3.2 1.7 200.3 195.8 4.4 .1 -5.1 47.4 262027 . 203.5 198.4 e 3.5 1.6 209.8 205.1 4.7 .1 -6.3 41.1 23
Low-cost:2018 . 171.1 167.2 e 1.7 2.3 146.5 143.5 2.9 .2 24.6 94.1 472019 . 156.0 151.0 e 1.6 3.4 149.1 146.2 2.8 .1 6.9 100.9 632020 . 154.7 148.9 e 1.8 4.0 152.4 149.5 2.8 .2 2.3 103.2 662021 . 166.8 160.4 e 1.9 4.5 156.8 153.5 3.1 .1 10.0 113.3 662022 . 178.9 171.6 e 2.0 5.3 161.8 158.3 3.4 .1 17.1 130.4 702023 . 191.1 182.3 e 2.1 6.6 167.8 164.0 3.7 .1 23.3 153.6 782024 . 204.8 194.3 e 2.3 8.2 174.5 170.4 4.0 .1 30.3 183.9 882025 . 219.0 206.3 e 2.5 10.3 182.6 178.2 4.3 .1 36.5 220.4 1012026 . 235.5 219.7 e 3.0 12.8 191.1 186.4 4.7 .1 44.4 264.7 1152027 . 251.6 232.3 e 3.4 15.9 200.2 195.1 5.0 .1 51.4 316.2 132
High-cost:2018 . 169.9 166.1 e 1.7 2.1 149.6 146.5 2.9 .2 20.4 89.8 462019 . 145.4 141.3 e 1.7 2.5 154.8 151.8 2.8 .1 -9.3 80.5 582020 . 135.8 131.8 e 1.8 2.1 159.4 156.5 2.8 .2 -23.7 56.8 502021 . 141.1 137.5 e 2.0 1.6 165.6 162.4 3.0 .2 -24.5 32.4 342022 . 145.6 142.6 e 2.1 .8 172.4 169.0 3.3 .2 -26.8 5.6 192023 . f
f While the fund is depleted, values under current law would reflect permissible expenditures only, which areinconsistent with the cost of scheduled benefits shown in this table.
147.2 e 2.3 f 179.9 176.3 3.5 .1 f f 32024 . f 152.5 e 2.5 f 188.0 184.1 3.7 .1 f f f2025 . f 157.6 e 2.7 f 197.1 193.0 3.9 .1 f f f2026 . f 163.5 e 3.3 f 206.5 202.2 4.1 .1 f f f2027 . f 168.3 e 3.7 f 216.0 211.5 4.3 .1 f f f

Appendices
176
Table VI.C6.—Operations of the Combined OASI and DI Trust Funds,Fiscal Years 2013-2027[Dollar amounts in billions]
Fiscalyear
Income Cost Asset Reserves
Total
Net pay-roll taxcontri-
butions
GFreim-
burse-mentsa
a Includes reimbursements from the General Fund of the Treasury to the OASI and DI Trust Funds for: (1) thecost of benefits to certain uninsured persons who attained age 72 before 1968; (2) the cost of payroll tax creditsprovided to employees in 1984 and self-employed persons in 1984-89 by Public Law 98-21; (3) the cost in2009-17 of excluding certain self-employment earnings from SECA taxes under Public Law 110-246; and(4) payroll tax revenue forgone under the provisions of Public Laws 111-147, 111-312, 112-78, and 112-96.
Taxa-tion ofbene-
fitsb
b Revenue from taxation of benefits is the amount that would be assessed on benefit amounts scheduled in thelaw.
Netinterest Total
Sched-uled
benefits
Admin-istra-
tivecosts
RRBinter-
change
Netincrease
duringyear
Amountat end
of year
Trustfund
ratioc
c The “Trust fund ratio” column represents asset reserves at the beginning of a year (which are identical toreserves at the end of the prior year shown in the “Amount at end of year” column) as a percentage of cost forthe year.
Historical data:2013. . $850.9 $690.1 $30.9 $24.2 $105.7 $813.3 $802.6 $6.2 $4.5 $37.6 $2,755.5 3342014. . 877.4 751.3 .2 25.7 100.3 850.3 839.6 6.0 4.7 27.1 2,782.6 3242015. . 913.3 786.4 .3 30.7 96.0 887.7 876.6 6.4 4.7 25.6 2,808.2 3132016. . 950.2 827.1 .2 32.3 90.6 916.0 905.2 6.2 4.7 34.1 2,842.4 3072017. . 991.9 868.0 d
d Between -$50 million and $50 million.
37.4 86.5 944.7 934.0 6.2 4.5 47.2 2,889.5 301Intermediate:2018. . 990.0 870.6 d 35.7 83.7 989.6 978.4 6.4 4.9 .4 2,889.9 2922019. . 1,050.6 931.2 d 36.8 82.6 1,046.5 1,035.4 6.1 5.0 4.1 2,894.0 2762020. . 1,096.6 973.4 d 41.2 82.0 1,111.7 1,100.6 6.0 5.1 -15.1 2,878.9 2602021. . 1,156.8 1,029.8 d 45.4 81.5 1,182.0 1,170.5 6.4 5.1 -25.3 2,853.7 2442022. . 1,215.3 1,084.8 d 49.5 81.0 1,256.6 1,244.4 6.9 5.3 -41.3 2,812.4 2272023. . 1,269.1 1,135.6 d 53.9 79.6 1,336.2 1,323.5 7.3 5.4 -67.1 2,745.3 2102024. . 1,331.0 1,192.5 d 58.6 79.9 1,420.5 1,407.3 7.7 5.4 -89.4 2,655.9 1932025. . 1,392.0 1,248.6 d 63.7 79.7 1,508.0 1,494.4 8.2 5.4 -116.0 2,539.9 1762026. . 1,466.9 1,310.9 d 77.2 78.9 1,599.1 1,585.0 8.6 5.6 -132.2 2,407.7 1592027. . 1,531.9 1,366.8 d 86.4 78.8 1,693.9 1,679.3 9.0 5.6 -162.0 2,245.7 142
Low-cost:2018. . 993.9 874.1 d 35.7 84.1 987.8 976.5 6.4 4.9 6.1 2,895.7 2932019. . 1,083.7 960.8 d 36.8 86.1 1,046.1 1,035.0 6.1 4.9 37.6 2,933.2 2772020. . 1,157.9 1,025.8 d 41.5 90.6 1,116.2 1,105.2 6.0 5.0 41.7 2,975.0 2632021. . 1,245.9 1,104.9 d 45.9 95.0 1,191.0 1,179.4 6.5 5.0 54.9 3,029.8 2502022. . 1,333.0 1,182.2 d 50.3 100.4 1,270.2 1,257.9 7.1 5.3 62.7 3,092.6 2392023. . 1,419.5 1,256.1 d 55.0 108.4 1,355.4 1,342.5 7.6 5.3 64.1 3,156.7 2282024. . 1,516.6 1,338.3 d 60.0 118.3 1,446.3 1,432.7 8.1 5.4 70.4 3,227.1 2182025. . 1,616.0 1,421.2 d 65.5 129.4 1,541.6 1,527.5 8.6 5.5 74.4 3,301.5 2092026. . 1,734.9 1,513.2 d 79.8 142.0 1,642.0 1,627.2 9.2 5.6 93.0 3,394.5 2012027. . 1,847.9 1,600.5 d 89.7 157.7 1,747.8 1,732.4 9.7 5.6 100.1 3,494.6 194
High-cost:2018. . 987.8 868.4 d 35.7 83.6 991.5 980.3 6.4 4.9 -3.8 2,885.8 2912019. . 1,013.5 896.2 d 36.6 80.6 1,045.4 1,034.3 6.1 5.0 -31.8 2,853.9 2762020. . 1,023.9 908.1 d 40.7 75.1 1,103.6 1,092.4 6.0 5.1 -79.7 2,774.3 2592021. . 1,062.9 947.6 d 44.7 70.7 1,168.7 1,157.2 6.3 5.1 -105.8 2,668.5 2372022. . 1,095.8 982.6 d 48.6 64.6 1,238.4 1,226.3 6.7 5.3 -142.6 2,525.9 2152023. . 1,126.1 1,014.4 d 52.7 59.1 1,312.1 1,299.7 7.0 5.4 -186.0 2,339.8 1932024. . 1,159.8 1,050.6 d 57.0 52.1 1,389.6 1,376.8 7.4 5.4 -229.8 2,110.0 1682025. . 1,192.8 1,086.0 d 61.7 45.1 1,469.2 1,456.1 7.7 5.4 -276.4 1,833.6 1442026. . 1,239.3 1,126.5 d 74.4 38.3 1,551.1 1,537.6 8.0 5.5 -311.9 1,521.8 1182027. . 1,274.3 1,159.5 d 82.8 32.0 1,635.1 1,621.3 8.3 5.5 -360.8 1,161.0 93
177
Long-Range Sensitivity Analysis
D. LONG-RANGE SENSITIVITY ANALYSIS
This appendix presents estimates that illustrate the sensitivity of the long-range actuarial status of the OASDI program to changes in selected individ-ual assumptions. The estimates based on the three alternative sets of assump-tions, which were presented earlier in this report, illustrate the effects ofvarying all of the principal assumptions simultaneously, in order to portray asignificantly more optimistic or pessimistic future. For each sensitivity anal-ysis presented in this appendix, the intermediate alternative II projection isthe reference point, and one assumption is varied within that alternative. Thevariation used for each individual assumption is the same as the level usedfor that assumption in the low-cost alternative I and high-cost alternative IIIprojections.
Each table in this section shows the effects of changing a particular assump-tion on the OASDI summarized income rates, summarized cost rates, andactuarial balances for 25-year, 50-year, and 75-year valuation periods. Fol-lowing each table is a discussion of the estimated changes in cost rates. Thechange in each of the actuarial balances is approximately equal to the changein the corresponding cost rate, but in the opposite direction. This appendixdoes not discuss income rates following each table because income ratesvary only slightly with changes in assumptions that affect revenue from taxa-tion of benefits.
1. Total Fertility Rate
Table VI.D1 shows OASDI income rates, cost rates, and actuarial balanceson the basis of alternative II with three different assumptions about the ulti-mate total fertility rate. The Trustees assume that total fertility will ultimatelybe 1.8, 2.0, and 2.2 children per woman under alternatives III, II, and I,respectively. The total fertility rate reaches ultimate values in 2023, 2027,and 2027 under alternatives III, II, and I, respectively.
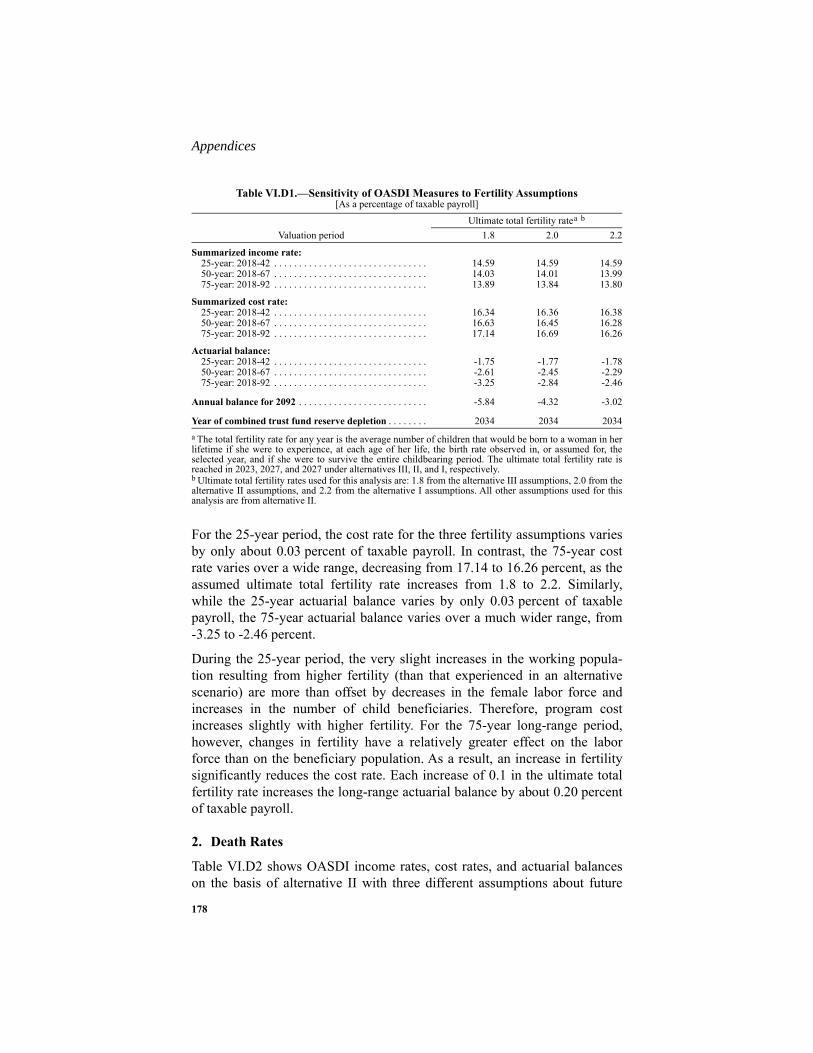
Appendices
178
For the 25-year period, the cost rate for the three fertility assumptions variesby only about 0.03 percent of taxable payroll. In contrast, the 75-year costrate varies over a wide range, decreasing from 17.14 to 16.26 percent, as theassumed ultimate total fertility rate increases from 1.8 to 2.2. Similarly,while the 25-year actuarial balance varies by only 0.03 percent of taxablepayroll, the 75-year actuarial balance varies over a much wider range, from-3.25 to -2.46 percent.
During the 25-year period, the very slight increases in the working popula-tion resulting from higher fertility (than that experienced in an alternativescenario) are more than offset by decreases in the female labor force andincreases in the number of child beneficiaries. Therefore, program costincreases slightly with higher fertility. For the 75-year long-range period,however, changes in fertility have a relatively greater effect on the laborforce than on the beneficiary population. As a result, an increase in fertilitysignificantly reduces the cost rate. Each increase of 0.1 in the ultimate totalfertility rate increases the long-range actuarial balance by about 0.20 percentof taxable payroll.
2. Death Rates
Table VI.D2 shows OASDI income rates, cost rates, and actuarial balanceson the basis of alternative II with three different assumptions about future
Table VI.D1.—Sensitivity of OASDI Measures to Fertility Assumptions[As a percentage of taxable payroll]
Valuation periodUltimate total fertility ratea b
a The total fertility rate for any year is the average number of children that would be born to a woman in herlifetime if she were to experience, at each age of her life, the birth rate observed in, or assumed for, theselected year, and if she were to survive the entire childbearing period. The ultimate total fertility rate isreached in 2023, 2027, and 2027 under alternatives III, II, and I, respectively.b Ultimate total fertility rates used for this analysis are: 1.8 from the alternative III assumptions, 2.0 from thealternative II assumptions, and 2.2 from the alternative I assumptions. All other assumptions used for thisanalysis are from alternative II.
1.8 2.0 2.2
Summarized income rate:25-year: 2018-42 . . . . . . . . . . . . . . . . . . . . . . . . . . . . . . . 14.59 14.59 14.5950-year: 2018-67 . . . . . . . . . . . . . . . . . . . . . . . . . . . . . . . 14.03 14.01 13.9975-year: 2018-92 . . . . . . . . . . . . . . . . . . . . . . . . . . . . . . . 13.89 13.84 13.80
Summarized cost rate:25-year: 2018-42 . . . . . . . . . . . . . . . . . . . . . . . . . . . . . . . 16.34 16.36 16.3850-year: 2018-67 . . . . . . . . . . . . . . . . . . . . . . . . . . . . . . . 16.63 16.45 16.2875-year: 2018-92 . . . . . . . . . . . . . . . . . . . . . . . . . . . . . . . 17.14 16.69 16.26
Actuarial balance:25-year: 2018-42 . . . . . . . . . . . . . . . . . . . . . . . . . . . . . . . -1.75 -1.77 -1.7850-year: 2018-67 . . . . . . . . . . . . . . . . . . . . . . . . . . . . . . . -2.61 -2.45 -2.2975-year: 2018-92 . . . . . . . . . . . . . . . . . . . . . . . . . . . . . . . -3.25 -2.84 -2.46
Annual balance for 2092 . . . . . . . . . . . . . . . . . . . . . . . . . . -5.84 -4.32 -3.02
Year of combined trust fund reserve depletion . . . . . . . . 2034 2034 2034
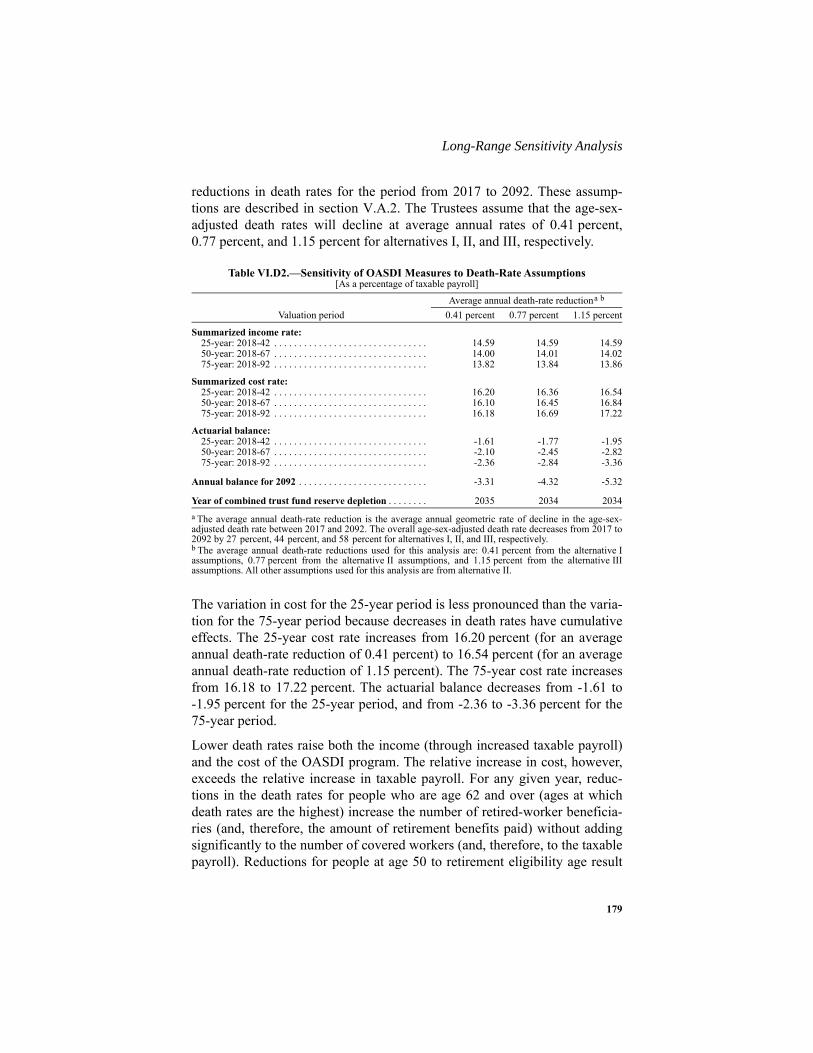
179
Long-Range Sensitivity Analysis
reductions in death rates for the period from 2017 to 2092. These assump-tions are described in section V.A.2. The Trustees assume that the age-sex-adjusted death rates will decline at average annual rates of 0.41 percent,0.77 percent, and 1.15 percent for alternatives I, II, and III, respectively.
The variation in cost for the 25-year period is less pronounced than the varia-tion for the 75-year period because decreases in death rates have cumulativeeffects. The 25-year cost rate increases from 16.20 percent (for an averageannual death-rate reduction of 0.41 percent) to 16.54 percent (for an averageannual death-rate reduction of 1.15 percent). The 75-year cost rate increasesfrom 16.18 to 17.22 percent. The actuarial balance decreases from -1.61 to-1.95 percent for the 25-year period, and from -2.36 to -3.36 percent for the75-year period.
Lower death rates raise both the income (through increased taxable payroll)and the cost of the OASDI program. The relative increase in cost, however,exceeds the relative increase in taxable payroll. For any given year, reduc-tions in the death rates for people who are age 62 and over (ages at whichdeath rates are the highest) increase the number of retired-worker beneficia-ries (and, therefore, the amount of retirement benefits paid) without addingsignificantly to the number of covered workers (and, therefore, to the taxablepayroll). Reductions for people at age 50 to retirement eligibility age result
Table VI.D2.—Sensitivity of OASDI Measures to Death-Rate Assumptions[As a percentage of taxable payroll]
Valuation periodAverage annual death-rate reductiona b
a The average annual death-rate reduction is the average annual geometric rate of decline in the age-sex-adjusted death rate between 2017 and 2092. The overall age-sex-adjusted death rate decreases from 2017 to2092 by 27 percent, 44 percent, and 58 percent for alternatives I, II, and III, respectively.b The average annual death-rate reductions used for this analysis are: 0.41 percent from the alternative Iassumptions, 0.77 percent from the alternative II assumptions, and 1.15 percent from the alternative IIIassumptions. All other assumptions used for this analysis are from alternative II.
0.41 percent 0.77 percent 1.15 percent
Summarized income rate:25-year: 2018-42 . . . . . . . . . . . . . . . . . . . . . . . . . . . . . . . 14.59 14.59 14.5950-year: 2018-67 . . . . . . . . . . . . . . . . . . . . . . . . . . . . . . . 14.00 14.01 14.0275-year: 2018-92 . . . . . . . . . . . . . . . . . . . . . . . . . . . . . . . 13.82 13.84 13.86
Summarized cost rate:25-year: 2018-42 . . . . . . . . . . . . . . . . . . . . . . . . . . . . . . . 16.20 16.36 16.5450-year: 2018-67 . . . . . . . . . . . . . . . . . . . . . . . . . . . . . . . 16.10 16.45 16.8475-year: 2018-92 . . . . . . . . . . . . . . . . . . . . . . . . . . . . . . . 16.18 16.69 17.22
Actuarial balance:25-year: 2018-42 . . . . . . . . . . . . . . . . . . . . . . . . . . . . . . . -1.61 -1.77 -1.9550-year: 2018-67 . . . . . . . . . . . . . . . . . . . . . . . . . . . . . . . -2.10 -2.45 -2.8275-year: 2018-92 . . . . . . . . . . . . . . . . . . . . . . . . . . . . . . . -2.36 -2.84 -3.36
Annual balance for 2092 . . . . . . . . . . . . . . . . . . . . . . . . . . -3.31 -4.32 -5.32
Year of combined trust fund reserve depletion . . . . . . . . 2035 2034 2034

Appendices
180
in significant increases to the taxable payroll. However, those increases arenot large enough to offset the sum of the additional retirement benefits men-tioned above and the disability benefits paid to additional beneficiaries atthese pre-retirement ages, which are ages of high disability incidence. Atages under 50, death rates are so low that even substantial reductions in deathrates do not result in significant increases in the numbers of covered workersor beneficiaries. Consequently, if death rates decline by about the same rela-tive amount for all ages, the cost increases faster than the rate of growth inpayroll, which results in higher cost rates and lower actuarial balances. Eachadditional 0.1-percentage-point increase in the average annual rate of declinein the death rate decreases the long-range actuarial balance by about0.14 percent of taxable payroll.
3. Immigration
Table VI.D3 shows OASDI income rates, cost rates, and actuarial balancesunder alternative II with three different assumptions about the magnitude oftotal net immigration (sum of net lawful permanent resident (LPR) immigra-tion and net other-than-LPR immigration). See section V.A.3 for more infor-mation on immigration assumptions and methods. The Trustees assumeannual levels of immigration and emigration, with total net annual immigra-tion averaging 952,000 persons, 1,272,000 persons, and 1,607,000 personsover the long-range period under alternatives III, II, and I, respectively.
Table VI.D3.—Sensitivity of OASDI Measures to Total Net Immigration Assumptions[As a percentage of taxable payroll]
Valuation periodAverage annual total net immigrationa b
a Average annual total net immigration is the annual total net immigration to the Social Security area, includ-ing both LPR and other-than-LPR immigration, averaged over the 75-year projection period.b The average annual total net immigration assumptions used for this analysis are: 952,000 from the alterna-tive III assumptions, 1,272,000 from the alternative II assumptions, and 1,607,000 from the alternative Iassumptions. All other assumptions used for this analysis are from alternative II.
952,000 1,272,000 1,607,000
Summarized income rate:25-year: 2018-42 . . . . . . . . . . . . . . . . . . . . . . . . . . . . . . . 14.62 14.59 14.5650-year: 2018-67 . . . . . . . . . . . . . . . . . . . . . . . . . . . . . . . 14.04 14.01 13.9875-year: 2018-92 . . . . . . . . . . . . . . . . . . . . . . . . . . . . . . . 13.88 13.84 13.81
Summarized cost rate:25-year: 2018-42 . . . . . . . . . . . . . . . . . . . . . . . . . . . . . . . 16.56 16.36 16.1950-year: 2018-67 . . . . . . . . . . . . . . . . . . . . . . . . . . . . . . . 16.72 16.45 16.2175-year: 2018-92 . . . . . . . . . . . . . . . . . . . . . . . . . . . . . . . 17.00 16.69 16.41
Actuarial balance:25-year: 2018-42 . . . . . . . . . . . . . . . . . . . . . . . . . . . . . . . -1.93 -1.77 -1.6250-year: 2018-67 . . . . . . . . . . . . . . . . . . . . . . . . . . . . . . . -2.68 -2.45 -2.2475-year: 2018-92 . . . . . . . . . . . . . . . . . . . . . . . . . . . . . . . -3.12 -2.84 -2.60
Annual balance for 2092 . . . . . . . . . . . . . . . . . . . . . . . . . . -4.81 -4.32 -3.91
Year of combined trust fund reserve depletion . . . . . . . . 2034 2034 2035
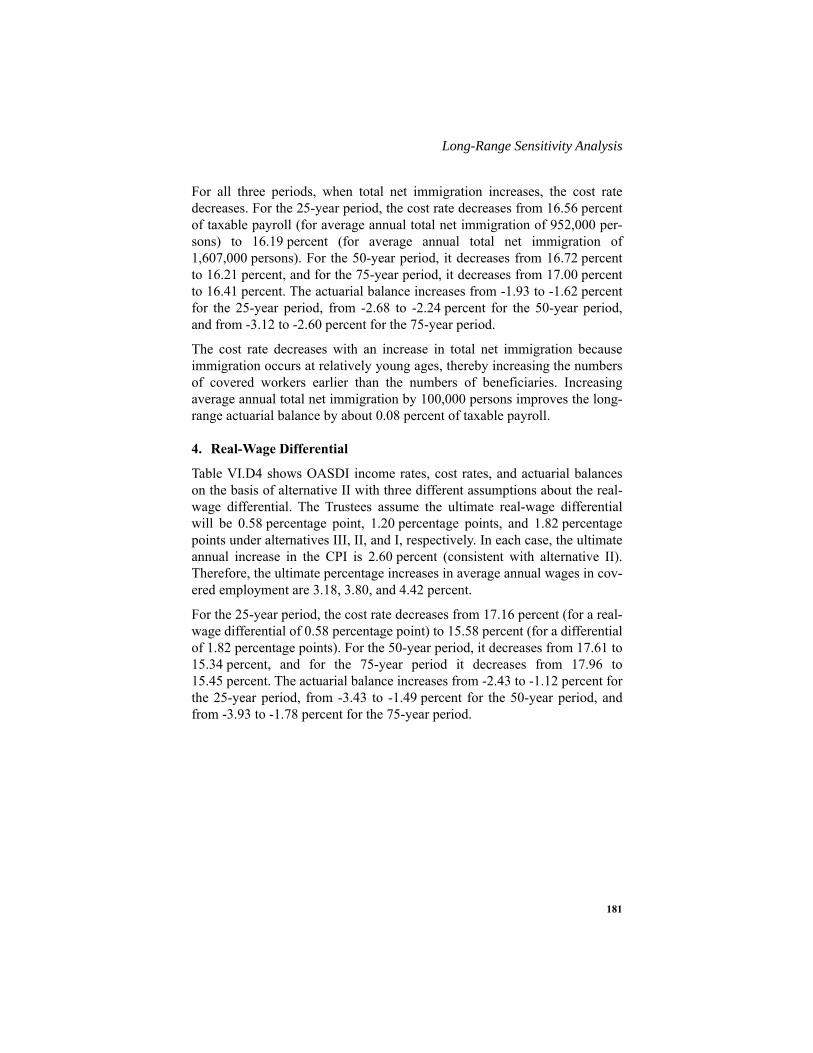
181
Long-Range Sensitivity Analysis
For all three periods, when total net immigration increases, the cost ratedecreases. For the 25-year period, the cost rate decreases from 16.56 percentof taxable payroll (for average annual total net immigration of 952,000 per-sons) to 16.19 percent (for average annual total net immigration of1,607,000 persons). For the 50-year period, it decreases from 16.72 percentto 16.21 percent, and for the 75-year period, it decreases from 17.00 percentto 16.41 percent. The actuarial balance increases from -1.93 to -1.62 percentfor the 25-year period, from -2.68 to -2.24 percent for the 50-year period,and from -3.12 to -2.60 percent for the 75-year period.
The cost rate decreases with an increase in total net immigration becauseimmigration occurs at relatively young ages, thereby increasing the numbersof covered workers earlier than the numbers of beneficiaries. Increasingaverage annual total net immigration by 100,000 persons improves the long-range actuarial balance by about 0.08 percent of taxable payroll.
4. Real-Wage Differential
Table VI.D4 shows OASDI income rates, cost rates, and actuarial balanceson the basis of alternative II with three different assumptions about the real-wage differential. The Trustees assume the ultimate real-wage differentialwill be 0.58 percentage point, 1.20 percentage points, and 1.82 percentagepoints under alternatives III, II, and I, respectively. In each case, the ultimateannual increase in the CPI is 2.60 percent (consistent with alternative II).Therefore, the ultimate percentage increases in average annual wages in cov-ered employment are 3.18, 3.80, and 4.42 percent.
For the 25-year period, the cost rate decreases from 17.16 percent (for a real-wage differential of 0.58 percentage point) to 15.58 percent (for a differentialof 1.82 percentage points). For the 50-year period, it decreases from 17.61 to15.34 percent, and for the 75-year period it decreases from 17.96 to15.45 percent. The actuarial balance increases from -2.43 to -1.12 percent forthe 25-year period, from -3.43 to -1.49 percent for the 50-year period, andfrom -3.93 to -1.78 percent for the 75-year period.
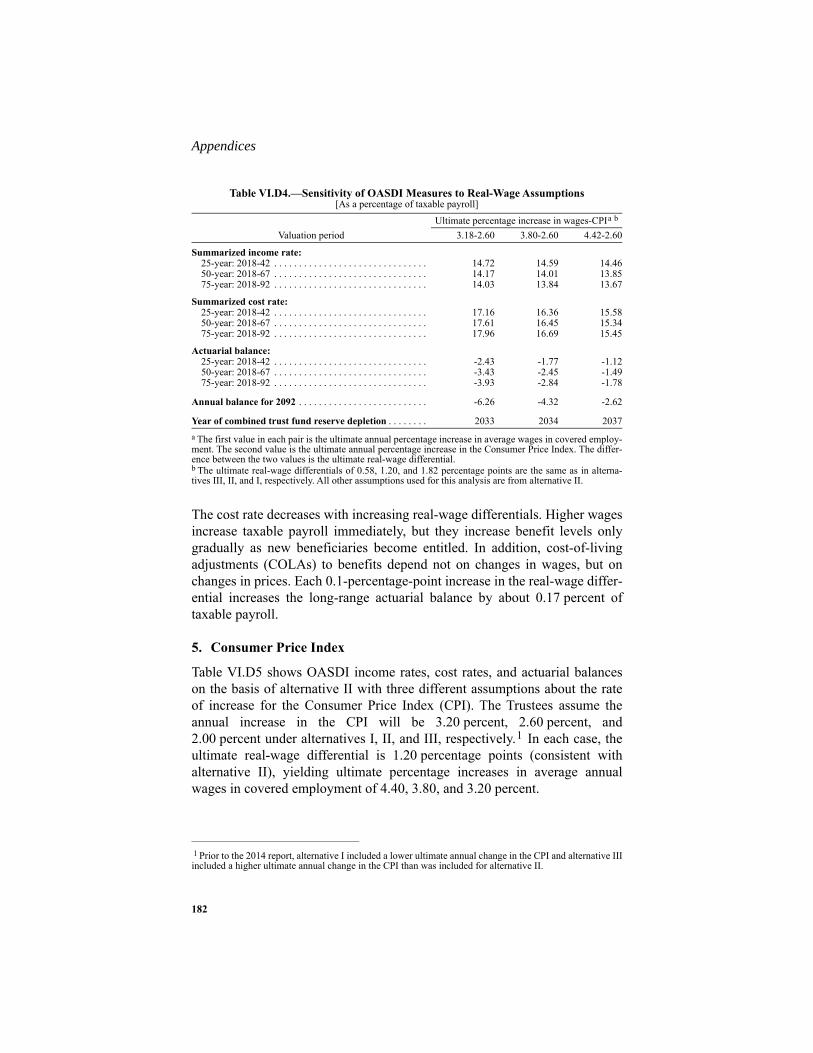
Appendices
182
The cost rate decreases with increasing real-wage differentials. Higher wagesincrease taxable payroll immediately, but they increase benefit levels onlygradually as new beneficiaries become entitled. In addition, cost-of-livingadjustments (COLAs) to benefits depend not on changes in wages, but onchanges in prices. Each 0.1-percentage-point increase in the real-wage differ-ential increases the long-range actuarial balance by about 0.17 percent oftaxable payroll.
5. Consumer Price Index
Table VI.D5 shows OASDI income rates, cost rates, and actuarial balanceson the basis of alternative II with three different assumptions about the rateof increase for the Consumer Price Index (CPI). The Trustees assume theannual increase in the CPI will be 3.20 percent, 2.60 percent, and2.00 percent under alternatives I, II, and III, respectively.1 In each case, theultimate real-wage differential is 1.20 percentage points (consistent withalternative II), yielding ultimate percentage increases in average annualwages in covered employment of 4.40, 3.80, and 3.20 percent.
Table VI.D4.—Sensitivity of OASDI Measures to Real-Wage Assumptions[As a percentage of taxable payroll]
Valuation periodUltimate percentage increase in wages-CPIa b
a The first value in each pair is the ultimate annual percentage increase in average wages in covered employ-ment. The second value is the ultimate annual percentage increase in the Consumer Price Index. The differ-ence between the two values is the ultimate real-wage differential.b The ultimate real-wage differentials of 0.58, 1.20, and 1.82 percentage points are the same as in alterna-tives III, II, and I, respectively. All other assumptions used for this analysis are from alternative II.
3.18-2.60 3.80-2.60 4.42-2.60
Summarized income rate:25-year: 2018-42 . . . . . . . . . . . . . . . . . . . . . . . . . . . . . . . 14.72 14.59 14.4650-year: 2018-67 . . . . . . . . . . . . . . . . . . . . . . . . . . . . . . . 14.17 14.01 13.8575-year: 2018-92 . . . . . . . . . . . . . . . . . . . . . . . . . . . . . . . 14.03 13.84 13.67
Summarized cost rate:25-year: 2018-42 . . . . . . . . . . . . . . . . . . . . . . . . . . . . . . . 17.16 16.36 15.5850-year: 2018-67 . . . . . . . . . . . . . . . . . . . . . . . . . . . . . . . 17.61 16.45 15.3475-year: 2018-92 . . . . . . . . . . . . . . . . . . . . . . . . . . . . . . . 17.96 16.69 15.45
Actuarial balance:25-year: 2018-42 . . . . . . . . . . . . . . . . . . . . . . . . . . . . . . . -2.43 -1.77 -1.1250-year: 2018-67 . . . . . . . . . . . . . . . . . . . . . . . . . . . . . . . -3.43 -2.45 -1.4975-year: 2018-92 . . . . . . . . . . . . . . . . . . . . . . . . . . . . . . . -3.93 -2.84 -1.78
Annual balance for 2092 . . . . . . . . . . . . . . . . . . . . . . . . . . -6.26 -4.32 -2.62
Year of combined trust fund reserve depletion . . . . . . . . 2033 2034 2037
1 Prior to the 2014 report, alternative I included a lower ultimate annual change in the CPI and alternative IIIincluded a higher ultimate annual change in the CPI than was included for alternative II.
183
Long-Range Sensitivity Analysis
For all three periods, the cost rate increases when the assumed rates ofincrease in the CPI are smaller. For the 25-year period, the cost rate increasesfrom 16.26 (for CPI increases of 3.20 percent) to 16.46 percent (for CPIincreases of 2.00 percent). For the 50-year period, it increases from 16.32 to16.58 percent, and for the 75-year period, it increases from 16.54 to16.83 percent. The actuarial balance decreases from -1.69 to -1.84 percentfor the 25-year period, from -2.33 to -2.56 percent for the 50-year period,and from -2.71 to -2.97 percent for the 75-year period.
The time lag between the effects of the CPI changes on taxable payroll andon scheduled benefits explains these patterns. When the rate of increase inthe CPI is greater and the real-wage differential is constant, then: (1) theeffect on taxable payroll due to a greater rate of increase in average wagesoccurs immediately and (2) the effect on benefits due to a larger COLAoccurs with a lag of about 1 year. As a result of these effects, the higher tax-able payrolls have a stronger effect than the higher benefits, which results inlower cost rates. Each 0.1-percentage-point decrease in the rate of the changein the CPI decreases the long-range actuarial balance by about 0.02 percentof taxable payroll.
Table VI.D5.—Sensitivity of OASDI Measures to CPI-Increase Assumptions[As a percentage of taxable payroll]
Valuation periodUltimate percentage increase in wages-CPIa b
a The first value in each pair is the ultimate annual percentage increase in average wages in covered employ-ment. The second value is the ultimate annual percentage increase in the Consumer Price Index. The differ-ence between the two values is the ultimate real-wage differential.b The ultimate CPI increases of 3.20, 2.60, and 2.00 percent are the same as in alternatives I, II, and III,respectively. The ultimate real-wage differential of 1.20 percentage points is the same as in alternative II. Allother assumptions used for this analysis are also from alternative II.
4.40-3.20 3.80-2.60 3.20-2.00
Summarized income rate:25-year: 2018-42 . . . . . . . . . . . . . . . . . . . . . . . . . . . . . . . 14.57 14.59 14.6150-year: 2018-67 . . . . . . . . . . . . . . . . . . . . . . . . . . . . . . . 13.99 14.01 14.0275-year: 2018-92 . . . . . . . . . . . . . . . . . . . . . . . . . . . . . . . 13.83 13.84 13.86
Summarized cost rate:25-year: 2018-42 . . . . . . . . . . . . . . . . . . . . . . . . . . . . . . . 16.26 16.36 16.4650-year: 2018-67 . . . . . . . . . . . . . . . . . . . . . . . . . . . . . . . 16.32 16.45 16.5875-year: 2018-92 . . . . . . . . . . . . . . . . . . . . . . . . . . . . . . . 16.54 16.69 16.83
Actuarial balance:25-year: 2018-42 . . . . . . . . . . . . . . . . . . . . . . . . . . . . . . . -1.69 -1.77 -1.8450-year: 2018-67 . . . . . . . . . . . . . . . . . . . . . . . . . . . . . . . -2.33 -2.45 -2.5675-year: 2018-92 . . . . . . . . . . . . . . . . . . . . . . . . . . . . . . . -2.71 -2.84 -2.97
Annual balance for 2092 . . . . . . . . . . . . . . . . . . . . . . . . . . -4.14 -4.32 -4.48
Year of combined trust fund reserve depletion . . . . . . . . 2035 2034 2034

Appendices
184
6. Real Interest Rate
Table VI.D6 shows OASDI income rates, cost rates, and actuarial balancesunder alternative II with three different assumptions about the annual realinterest rate (compounded semiannually) for special public-debt obligationsissuable to the trust funds. The Trustees assume that the ultimate annual realinterest rate will be 2.2 percent, 2.7 percent, and 3.2 percent under alterna-tives III, II, and I, respectively. In each case, the ultimate annual increase inthe CPI is 2.60 percent, which is consistent with alternative II. Therefore, theultimate annual yields are 4.9, 5.4, and 5.9 percent, respectively.
For the 25-year period, the cost rate decreases with increasing real interestrates from 16.43 percent (for an ultimate real interest rate of 2.2 percent) to16.29 percent (for an ultimate real interest rate of 3.2 percent). For the50-year period, it decreases from 16.54 to 16.37 percent and, for the 75-yearperiod, it decreases from 16.80 to 16.57 percent. The actuarial balanceincreases from -1.89 to -1.65 percent for the 25-year period, from -2.60 to-2.30 percent for the 50-year period, and from -3.03 to -2.65 percent for the75-year period. Each 0.1-percentage-point increase in the real interest rateincreases the long-range actuarial balance by about 0.04 percent of taxablepayroll.
Table VI.D6.—Sensitivity of OASDI Measures to Real-Interest Assumptions[As a percentage of taxable payroll]
Valuation periodUltimate annual real interest ratea b
a The ultimate real interest rate is the effective annual yield on asset reserves held by the trust funds dividedby the annual rate of growth in the CPI.b The ultimate annual real interest rates used for this analysis are: 2.2 percent from the alternative IIIassumptions, 2.7 percent from the alternative II assumptions, and 3.2 percent from the alternative I assump-tions. All other assumptions used for this analysis are from alternative II.
2.2 percent 2.7 percent 3.2 percent
Summarized income rate:25-year: 2018-42 . . . . . . . . . . . . . . . . . . . . . . . . . . . . . . . 14.54 14.59 14.6550-year: 2018-67 . . . . . . . . . . . . . . . . . . . . . . . . . . . . . . . 13.94 14.01 14.0875-year: 2018-92 . . . . . . . . . . . . . . . . . . . . . . . . . . . . . . . 13.77 13.84 13.92
Summarized cost rate:25-year: 2018-42 . . . . . . . . . . . . . . . . . . . . . . . . . . . . . . . 16.43 16.36 16.2950-year: 2018-67 . . . . . . . . . . . . . . . . . . . . . . . . . . . . . . . 16.54 16.45 16.3775-year: 2018-92 . . . . . . . . . . . . . . . . . . . . . . . . . . . . . . . 16.80 16.69 16.57
Actuarial balance:25-year: 2018-42 . . . . . . . . . . . . . . . . . . . . . . . . . . . . . . . -1.89 -1.77 -1.6550-year: 2018-67 . . . . . . . . . . . . . . . . . . . . . . . . . . . . . . . -2.60 -2.45 -2.3075-year: 2018-92 . . . . . . . . . . . . . . . . . . . . . . . . . . . . . . . -3.03 -2.84 -2.65
Annual balance for 2092 . . . . . . . . . . . . . . . . . . . . . . . . . . -4.32 -4.32 -4.32
Year of combined trust fund reserve depletion . . . . . . . . 2034 2034 2035

185
Long-Range Sensitivity Analysis
7. Taxable Ratio
Table VI.D7 shows OASDI income rates, cost rates, and actuarial balancesunder alternative II with three different assumptions about the ratio of tax-able payroll to covered earnings (the taxable ratio). Note that covered earn-ings are the sum of wages and net self-employment earnings covered bySocial Security, and taxable payroll is essentially the amount of coveredearnings subject to the Social Security payroll tax up to the contribution andbenefit base ($128,400 for 2018). The Trustees assume that the ultimate tax-able ratio will be 81.0 percent, 82.5 percent, and 84.0 percent under alterna-tives III, II, and I, respectively.
Because the combined employee-employer tax rate of 12.4 percent isunchanged across all alternatives, the income rate changes a relatively smallamount as the taxable ratio increases, due to changes in taxation of benefitsand the initial fund as a percentage of taxable payroll.
For the 25-year period, the cost rate decreases with increasing taxable ratios,from 16.59 percent (for an ultimate taxable ratio of 81.0 percent) to16.14 percent (for an ultimate taxable ratio of 84.0 percent). For the 50-yearperiod, it decreases from 16.67 to 16.25 percent and, for the 75-year period,it decreases from 16.87 to 16.50 percent. The actuarial balance increasesfrom -1.97 to -1.58 percent for the 25-year period, from -2.63 to
Table VI.D7.—Sensitivity of OASDI Measures to Taxable Ratio Assumptions[As a percentage of taxable payroll]
Valuation periodUltimate taxable ratioa b
a The taxable ratio is the ratio of taxable payroll to covered earnings. These concepts are described in furtherdetail in section V.C.6 of this report.b The ultimate taxable ratios used for this analysis are: 81.0 percent from the alternative III assumptions,82.5 percent from the alternative II assumptions, and 84.0 percent from the alternative I assumptions. Allother assumptions used for this analysis are from alternative II.
81.0 percent 82.5 percent 84.0 percent
Summarized income rate:25-year: 2018-42 . . . . . . . . . . . . . . . . . . . . . . . . . . . . . . . 14.63 14.59 14.5650-year: 2018-67 . . . . . . . . . . . . . . . . . . . . . . . . . . . . . . . 14.03 14.01 13.9875-year: 2018-92 . . . . . . . . . . . . . . . . . . . . . . . . . . . . . . . 13.86 13.84 13.82
Summarized cost rate:25-year: 2018-42 . . . . . . . . . . . . . . . . . . . . . . . . . . . . . . . 16.59 16.36 16.1450-year: 2018-67 . . . . . . . . . . . . . . . . . . . . . . . . . . . . . . . 16.67 16.45 16.2575-year: 2018-92 . . . . . . . . . . . . . . . . . . . . . . . . . . . . . . . 16.87 16.69 16.50
Actuarial balance:25-year: 2018-42 . . . . . . . . . . . . . . . . . . . . . . . . . . . . . . . -1.97 -1.77 -1.5850-year: 2018-67 . . . . . . . . . . . . . . . . . . . . . . . . . . . . . . . -2.63 -2.45 -2.2675-year: 2018-92 . . . . . . . . . . . . . . . . . . . . . . . . . . . . . . . -3.01 -2.84 -2.68
Annual balance for 2092 . . . . . . . . . . . . . . . . . . . . . . . . . . -4.43 -4.32 -4.21
Year of combined trust fund reserve depletion . . . . . . . . 2033 2034 2035
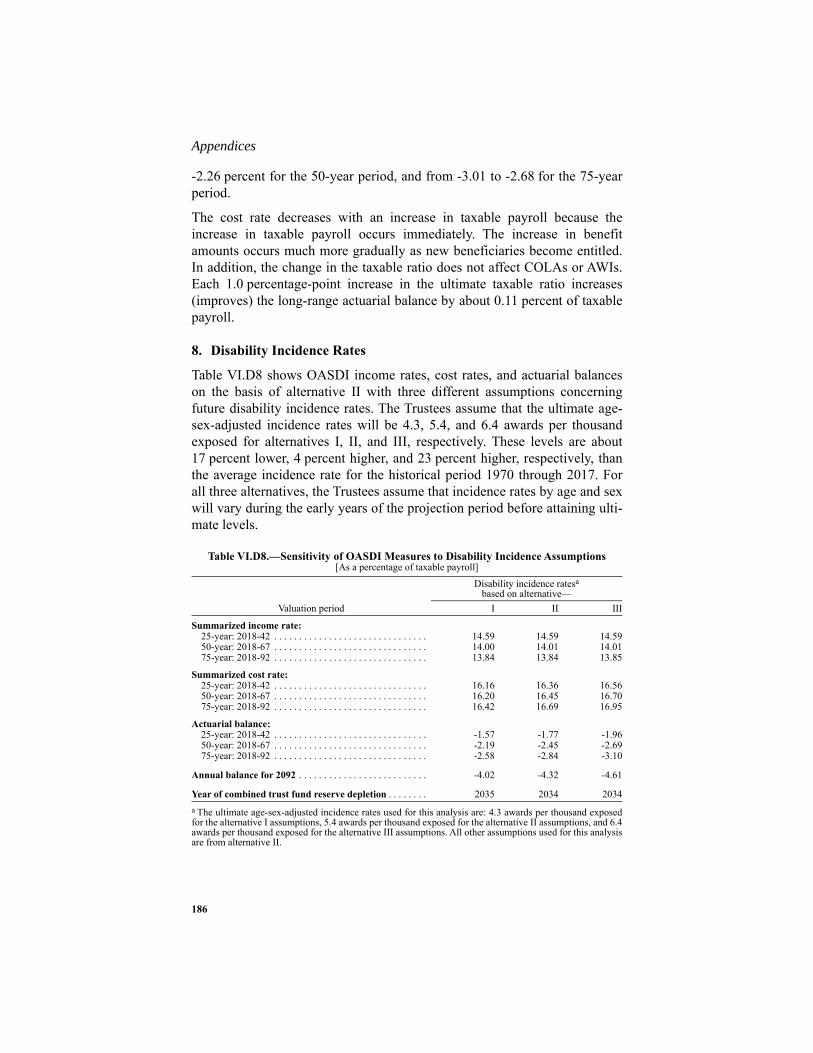
Appendices
186
-2.26 percent for the 50-year period, and from -3.01 to -2.68 for the 75-yearperiod.
The cost rate decreases with an increase in taxable payroll because theincrease in taxable payroll occurs immediately. The increase in benefitamounts occurs much more gradually as new beneficiaries become entitled.In addition, the change in the taxable ratio does not affect COLAs or AWIs.Each 1.0 percentage-point increase in the ultimate taxable ratio increases(improves) the long-range actuarial balance by about 0.11 percent of taxablepayroll.
8. Disability Incidence Rates
Table VI.D8 shows OASDI income rates, cost rates, and actuarial balanceson the basis of alternative II with three different assumptions concerningfuture disability incidence rates. The Trustees assume that the ultimate age-sex-adjusted incidence rates will be 4.3, 5.4, and 6.4 awards per thousandexposed for alternatives I, II, and III, respectively. These levels are about17 percent lower, 4 percent higher, and 23 percent higher, respectively, thanthe average incidence rate for the historical period 1970 through 2017. Forall three alternatives, the Trustees assume that incidence rates by age and sexwill vary during the early years of the projection period before attaining ulti-mate levels.
Table VI.D8.—Sensitivity of OASDI Measures to Disability Incidence Assumptions[As a percentage of taxable payroll]
Valuation period
Disability incidence ratesabased on alternative—
a The ultimate age-sex-adjusted incidence rates used for this analysis are: 4.3 awards per thousand exposedfor the alternative I assumptions, 5.4 awards per thousand exposed for the alternative II assumptions, and 6.4awards per thousand exposed for the alternative III assumptions. All other assumptions used for this analysisare from alternative II.
I II III
Summarized income rate:25-year: 2018-42 . . . . . . . . . . . . . . . . . . . . . . . . . . . . . . . 14.59 14.59 14.5950-year: 2018-67 . . . . . . . . . . . . . . . . . . . . . . . . . . . . . . . 14.00 14.01 14.0175-year: 2018-92 . . . . . . . . . . . . . . . . . . . . . . . . . . . . . . . 13.84 13.84 13.85
Summarized cost rate:25-year: 2018-42 . . . . . . . . . . . . . . . . . . . . . . . . . . . . . . . 16.16 16.36 16.5650-year: 2018-67 . . . . . . . . . . . . . . . . . . . . . . . . . . . . . . . 16.20 16.45 16.7075-year: 2018-92 . . . . . . . . . . . . . . . . . . . . . . . . . . . . . . . 16.42 16.69 16.95
Actuarial balance:25-year: 2018-42 . . . . . . . . . . . . . . . . . . . . . . . . . . . . . . . -1.57 -1.77 -1.9650-year: 2018-67 . . . . . . . . . . . . . . . . . . . . . . . . . . . . . . . -2.19 -2.45 -2.6975-year: 2018-92 . . . . . . . . . . . . . . . . . . . . . . . . . . . . . . . -2.58 -2.84 -3.10
Annual balance for 2092 . . . . . . . . . . . . . . . . . . . . . . . . . . -4.02 -4.32 -4.61
Year of combined trust fund reserve depletion . . . . . . . . 2035 2034 2034

187
Long-Range Sensitivity Analysis
For the 25-year period, the cost rate increases with increasing disability inci-dence rates, from 16.16 percent (for the relatively low rates assumed foralternative I) to 16.56 percent (for the relatively high rates assumed for alter-native III). For the 50-year period, it increases from 16.20 to 16.70 percent,and for the 75-year period, it increases from 16.42 to 16.95 percent. Theactuarial balance decreases from -1.57 to -1.96 percent for the 25-yearperiod, from -2.19 to -2.69 percent for the 50-year period, and from -2.58 to-3.10 percent for the 75-year period.
9. Disability Termination Rates
Table VI.D9 shows OASDI income rates, cost rates, and actuarial balanceson the basis of alternative II with three different assumptions about futuredisability termination rates, including deaths and recoveries up to the age atwhich disabled-worker beneficiaries convert to retired-worker status.
For all three alternatives, the Trustees assume that death rates for disabled-worker beneficiaries will decline throughout the long-range period. TheTrustees assume that the age-sex-adjusted1 death rate of 25.4 deaths perthousand disabled-worker beneficiaries in 2017 will decline to 18.4, 11.6,and 6.9 deaths per thousand in 2092 for alternatives I, II, and III, respec-tively. These levels are about 28 percent, 54 percent, and 73 percent lower,respectively, than the level in 2017.
For all three alternatives, ultimate recovery rates by age, sex, and durationare attained in the twentieth year of the projection period. For alternative I,the age-sex-adjusted1 recovery rate for 2037 is about 13 recoveries per thou-sand disabled-worker beneficiaries. For alternative II, the age-sex-adjustedrecovery rate for 2037 is about 10 recoveries per thousand disabled-workerbeneficiaries. For alternative III, the age-sex-adjusted recovery rate for 2037is about 8 recoveries per thousand disabled-worker beneficiaries.
1 Age adjusted to the total disabled workers in current-payment status as of the year 2000.
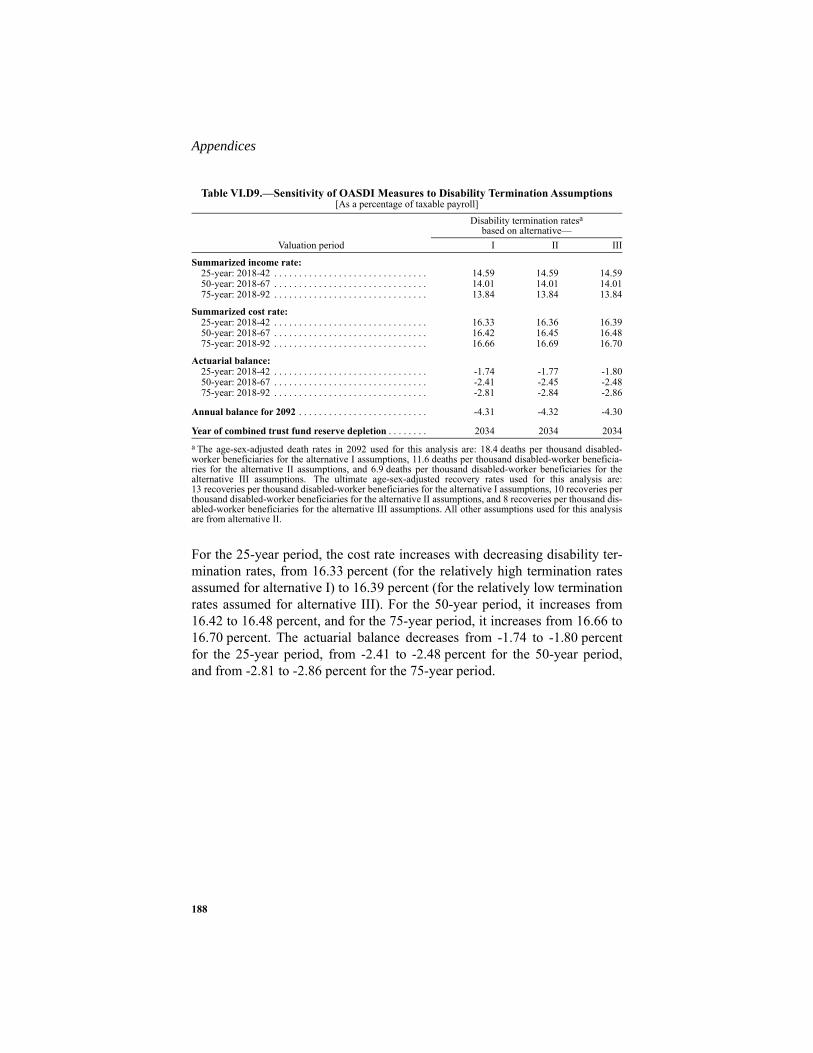
Appendices
188
For the 25-year period, the cost rate increases with decreasing disability ter-mination rates, from 16.33 percent (for the relatively high termination ratesassumed for alternative I) to 16.39 percent (for the relatively low terminationrates assumed for alternative III). For the 50-year period, it increases from16.42 to 16.48 percent, and for the 75-year period, it increases from 16.66 to16.70 percent. The actuarial balance decreases from -1.74 to -1.80 percentfor the 25-year period, from -2.41 to -2.48 percent for the 50-year period,and from -2.81 to -2.86 percent for the 75-year period.
Table VI.D9.—Sensitivity of OASDI Measures to Disability Termination Assumptions[As a percentage of taxable payroll]
Valuation period
Disability termination ratesabased on alternative—
a The age-sex-adjusted death rates in 2092 used for this analysis are: 18.4 deaths per thousand disabled-worker beneficiaries for the alternative I assumptions, 11.6 deaths per thousand disabled-worker beneficia-ries for the alternative II assumptions, and 6.9 deaths per thousand disabled-worker beneficiaries for thealternative III assumptions. The ultimate age-sex-adjusted recovery rates used for this analysis are:13 recoveries per thousand disabled-worker beneficiaries for the alternative I assumptions, 10 recoveries perthousand disabled-worker beneficiaries for the alternative II assumptions, and 8 recoveries per thousand dis-abled-worker beneficiaries for the alternative III assumptions. All other assumptions used for this analysisare from alternative II.
I II III
Summarized income rate:25-year: 2018-42 . . . . . . . . . . . . . . . . . . . . . . . . . . . . . . . 14.59 14.59 14.5950-year: 2018-67 . . . . . . . . . . . . . . . . . . . . . . . . . . . . . . . 14.01 14.01 14.0175-year: 2018-92 . . . . . . . . . . . . . . . . . . . . . . . . . . . . . . . 13.84 13.84 13.84
Summarized cost rate:25-year: 2018-42 . . . . . . . . . . . . . . . . . . . . . . . . . . . . . . . 16.33 16.36 16.3950-year: 2018-67 . . . . . . . . . . . . . . . . . . . . . . . . . . . . . . . 16.42 16.45 16.4875-year: 2018-92 . . . . . . . . . . . . . . . . . . . . . . . . . . . . . . . 16.66 16.69 16.70
Actuarial balance:25-year: 2018-42 . . . . . . . . . . . . . . . . . . . . . . . . . . . . . . . -1.74 -1.77 -1.8050-year: 2018-67 . . . . . . . . . . . . . . . . . . . . . . . . . . . . . . . -2.41 -2.45 -2.4875-year: 2018-92 . . . . . . . . . . . . . . . . . . . . . . . . . . . . . . . -2.81 -2.84 -2.86
Annual balance for 2092 . . . . . . . . . . . . . . . . . . . . . . . . . . -4.31 -4.32 -4.30
Year of combined trust fund reserve depletion . . . . . . . . 2034 2034 2034

189
Stochastic Projections
E. STOCHASTIC PROJECTIONS AND UNCERTAINTY
Significant uncertainty surrounds the estimates under the intermediateassumptions, especially for a period as long as 75 years. This appendix pres-ents stochastic projections, a way to illustrate the uncertainty of these esti-mates. The stochastic projections supplement the traditional methods ofexamining such uncertainty.
1. BackgroundThe Trustees have traditionally shown estimates using the low-cost and high-cost sets of specified assumptions to illustrate the potential implications ofuncertainty. These alternative estimates provide a range of possible outcomesfor the projections. However, they do not provide an indication of the proba-bility that actual future experience will be inside or outside this range. Thisappendix presents the results of a model, based on stochastic modeling tech-niques, that estimates a probability distribution of future outcomes of thefinancial status of the combined OASI and DI Trust Funds. This model,which was first included in the 2003 report, is subject to further developmentin the future, most notably by incorporating parameter uncertainty. This willallow the stochastic model to better reflect the uncertainty in the estimates ofthe underlying factors for these projections.
2. Stochastic MethodologyOther sections of this report provide estimates of the financial status of thecombined OASI and DI Trust Funds using a scenario-based model. For thescenario-based model, the Trustees use three alternative scenarios (low-cost,intermediate, and high-cost) that use specific assumptions about levels of fer-tility, rates of change in mortality, lawful permanent resident (LPR) andother-than-LPR immigration levels, legal and other-than-LPR emigrationlevels, changes in the Consumer Price Index, changes in average real wages,unemployment rates, trust fund real yield rates, and disability incidence andrecovery rates. In general, the Trustees assume that each of these variableswill reach an ultimate value at a specific point during the long-range period,and will maintain that value throughout the remainder of the period. Thethree alternative scenarios assume separate, specified values for each of thesevariables. Chapter V contains more details about each of these assumptions.
This appendix presents estimates of the probability that key measures ofOASDI solvency will fall in certain ranges, based on 5,000 independent sto-chastic simulations. Each simulation allows the above variables to varythroughout the long-range period. The fluctuation of each variable over time

Appendices
190
is simulated using historical data and standard time-series techniques. Gener-ally, each variable is modeled using an equation that: (1) captures a relation-ship between current and prior years’ values of the variable, and(2) introduces year-by-year random variation based on variation observed inthe historical period. For some variables, the equations also reflect relation-ships with other variables. The equations contain parameters that are esti-mated using historical data for periods from 11 years to over 110 years,depending on the nature and quality of the available data. Each time-seriesequation is designed so that, in the absence of random variation over time,the value of the variable for each year equals its value under the intermediateassumptions.1
For each simulation, the stochastic method develops year-by-year randomvariation for each variable using Monte Carlo techniques. Each simulationproduces an estimate of the financial status of the combined OASI and DITrust Funds. This appendix shows the distribution of results from 5,000 sim-ulations of the model.
Readers should interpret the results from this model with caution and with anunderstanding of the model’s limitations. Results are sensitive to equationspecifications, degrees of interdependence among variables, and the histori-cal periods used for estimating model coefficients. For some variables, recenthistorical variation may not provide a realistic representation of the potentialvariation for the future. Also, results would differ if additional variables(such as labor force participation rates, retirement rates, marriage rates, anddivorce rates) were also allowed to vary randomly. Furthermore, more vari-ability would result if statistical approaches were used to model uncertaintyin the central tendencies of the variables. Time-series modeling reflects onlywhat occurred in the historical period. Future uncertainty exists not only forthe underlying central tendency but also for the frequency and size of occa-sional longer-term shifts in the central tendency. Many experts predict, andhistory suggests, that the future will likely bring substantial shifts that are notfully reflected in the historical period used for the current model. As a result,readers should understand that the true range of uncertainty is larger thanindicated in this appendix.
1 More detail on this model, and stochastic modeling in general, is available atwww.ssa.gov/OACT/stochastic/index.html.

191
Stochastic Projections
3. Stochastic Results
This section illustrates the results for the stochastic simulations of two funda-mental measures of actuarial status: the annual cost rates and the trust fundratio. The latter measure is highlighted in the Overview of this report.Section 4 follows with a comparison of stochastic results to results from thealternative scenarios for these and other measures, and an analysis of the dif-ferences.
Figure VI.E1 displays the probability distribution of the year-by-yearOASDI cost rates (that is, cost as a percentage of taxable payroll). The rangeof the annual cost rates widens as the projections move further into thefuture, which reflects increasing uncertainty. Because there is relatively littlevariation in income rates across the 5,000 stochastic simulations, the figureincludes the income rate only under the intermediate assumptions. The twooutermost lines in this figure indicate the range within which future annualcost rates are projected to occur 95 percent of the time (i.e., a 95-percent con-fidence interval). In other words, the current model estimates that there is a2.5 percent probability that the cost rate for a given year will exceed theupper end of this range and a 2.5 percent probability that it will fall belowthe lower end of this range. Other lines in the figure delineate additional con-fidence intervals (80-percent, 60-percent, 40-percent, and 20-percent) aroundfuture annual cost rates. The median (50th percentile) cost rate for each yearis the rate for which half of the simulated outcomes are higher and half arelower for that year. These lines do not represent the results of individual sto-chastic simulations. Instead, for each given year, they represent the percentiledistribution of annual cost rates based on all stochastic simulations for thatyear.

Appendices
192
Figure VI.E2 presents the simulated probability distribution of the annualtrust fund ratios for the combined OASI and DI Trust Funds. The lines in thisfigure display the median set (50th percentile) of estimated annual trust fundratios and delineate the 95-percent, 80-percent, 60-percent, 40-percent, and20-percent confidence intervals estimated for future annual trust fund ratios.Again, none of these lines represent the path of a single simulation. For eachgiven year, they represent the percentile distribution of trust fund ratiosbased on all stochastic simulations for that year.
Figure VI.E2 shows that the 95-percent confidence interval for the trust funddepletion year ranges from 2030 to 2043, and that there is a 50-percent prob-ability of trust fund depletion by the end of 2034 (the median depletion year).The median depletion year is the same as the Trustees project under the inter-mediate assumptions. The figure also shows confidence intervals for the trustfund ratio in each year. For example, the 95-percent confidence interval forthe trust fund ratio at the beginning of 2025 ranges from 216 to 132 percentof annual cost.
Figure VI.E1.—Long-Range OASDI Cost Rates From Stochastic Modeling
5%
10%
15%
20%
25%
30%
2018 2033 2048 2063 2078 2093
Projection year
50%
97.5%
2.5%
90%
10%
Income Rate
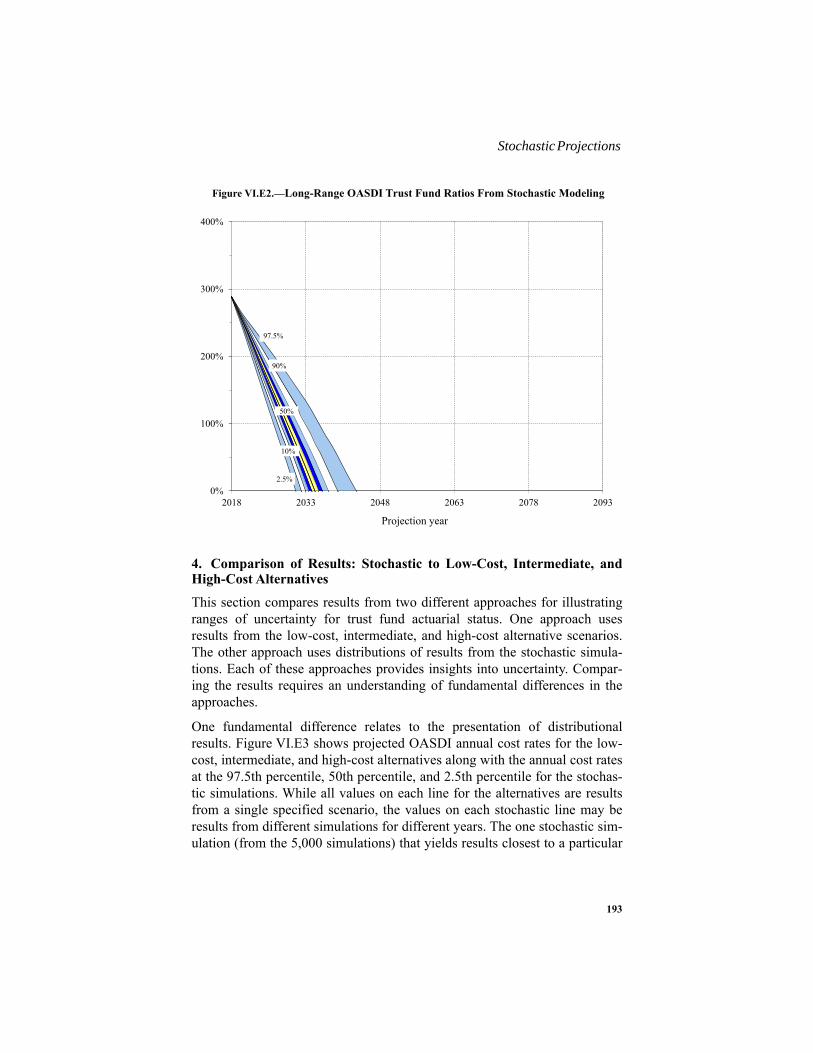
193
Stochastic Projections
4. Comparison of Results: Stochastic to Low-Cost, Intermediate, andHigh-Cost AlternativesThis section compares results from two different approaches for illustratingranges of uncertainty for trust fund actuarial status. One approach usesresults from the low-cost, intermediate, and high-cost alternative scenarios.The other approach uses distributions of results from the stochastic simula-tions. Each of these approaches provides insights into uncertainty. Compar-ing the results requires an understanding of fundamental differences in theapproaches.
One fundamental difference relates to the presentation of distributionalresults. Figure VI.E3 shows projected OASDI annual cost rates for the low-cost, intermediate, and high-cost alternatives along with the annual cost ratesat the 97.5th percentile, 50th percentile, and 2.5th percentile for the stochas-tic simulations. While all values on each line for the alternatives are resultsfrom a single specified scenario, the values on each stochastic line may beresults from different simulations for different years. The one stochastic sim-ulation (from the 5,000 simulations) that yields results closest to a particular
Figure VI.E2.—Long-Range OASDI Trust Fund Ratios From Stochastic Modeling
0%
100%
200%
300%
400%
2018 2033 2048 2063 2078 2093
Projection year
50%
97.5%
2.5%
90%
10%

Appendices
194
percentile for one projected year may yield results that are distant from thatpercentile in another projected year.
Because each stochastic simulation shows substantial variability from year toyear, the range shown between the 97.5th and 2.5th percentiles is broaderthan would be seen if simulations followed a smooth trend like in the alterna-tives. In spite of this effect, the range from high-cost to low-cost annual ratesfor the stochastic distribution is generally contained slightly within the rangefor the high-cost and low-cost alternatives. With introduction of parameteruncertainty for the stochastic simulations expected in future reports, therange for the 95-percent confidence interval is expected to expand.
Both the alternatives and the stochastic results suggest that the range ofpotential cost rates above the central levels (those for the intermediate alter-native and for the median, respectively) is larger than the range below thesecentral results. The difference between the central results and the higher costlevels (the high-cost alternative and the upper end of the 95-percent confi-dence range, respectively) is about 1.5 times as large as the differencebetween the central and lower cost levels for both models by the end of theprojection period.
Figure VI.E3.—OASDI Cost Rates: Comparison of Stochastic to Low-Cost, Intermediate, and High-Cost Alternatives
[As a percentage of taxable payroll]
10%
15%
20%
25%
30%
2018 2033 2048 2063 2078 2093
Projection year
Low-Cost
Intermediate
High-Cost
Stochastic 2.5%
Stochastic 50%
Stochastic 97.5%
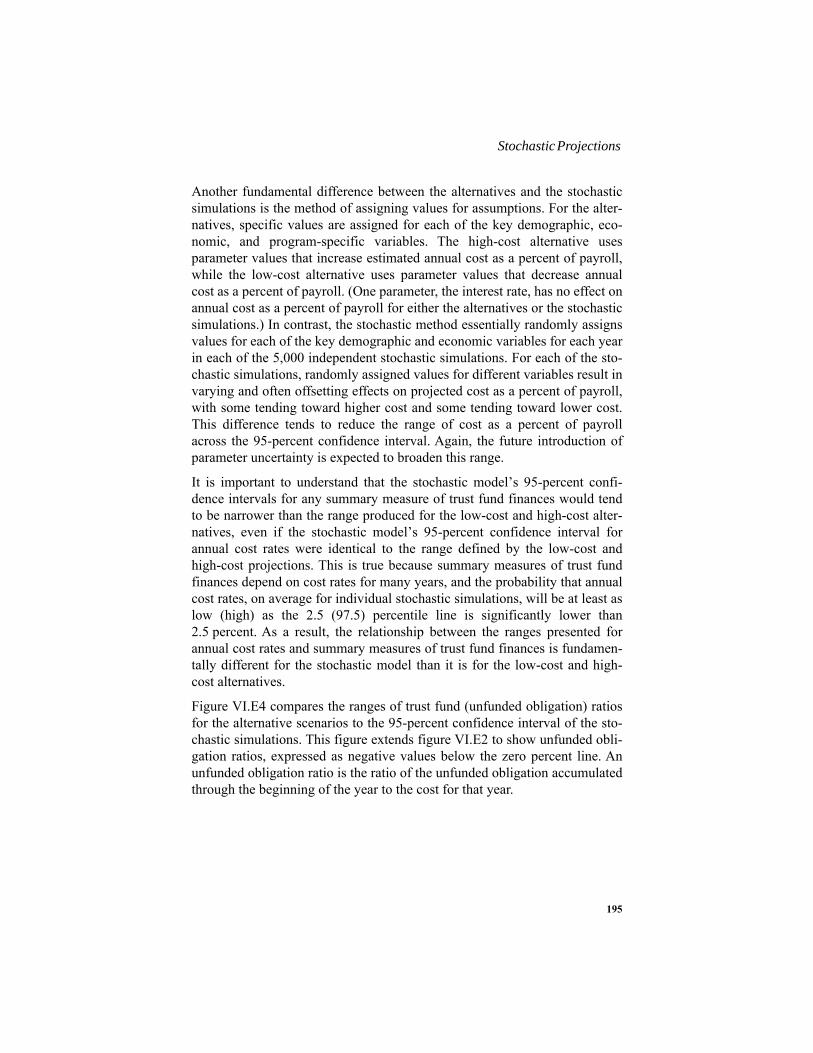
195
Stochastic Projections
Another fundamental difference between the alternatives and the stochasticsimulations is the method of assigning values for assumptions. For the alter-natives, specific values are assigned for each of the key demographic, eco-nomic, and program-specific variables. The high-cost alternative usesparameter values that increase estimated annual cost as a percent of payroll,while the low-cost alternative uses parameter values that decrease annualcost as a percent of payroll. (One parameter, the interest rate, has no effect onannual cost as a percent of payroll for either the alternatives or the stochasticsimulations.) In contrast, the stochastic method essentially randomly assignsvalues for each of the key demographic and economic variables for each yearin each of the 5,000 independent stochastic simulations. For each of the sto-chastic simulations, randomly assigned values for different variables result invarying and often offsetting effects on projected cost as a percent of payroll,with some tending toward higher cost and some tending toward lower cost.This difference tends to reduce the range of cost as a percent of payrollacross the 95-percent confidence interval. Again, the future introduction ofparameter uncertainty is expected to broaden this range.
It is important to understand that the stochastic model’s 95-percent confi-dence intervals for any summary measure of trust fund finances would tendto be narrower than the range produced for the low-cost and high-cost alter-natives, even if the stochastic model’s 95-percent confidence interval forannual cost rates were identical to the range defined by the low-cost andhigh-cost projections. This is true because summary measures of trust fundfinances depend on cost rates for many years, and the probability that annualcost rates, on average for individual stochastic simulations, will be at least aslow (high) as the 2.5 (97.5) percentile line is significantly lower than2.5 percent. As a result, the relationship between the ranges presented forannual cost rates and summary measures of trust fund finances is fundamen-tally different for the stochastic model than it is for the low-cost and high-cost alternatives.
Figure VI.E4 compares the ranges of trust fund (unfunded obligation) ratiosfor the alternative scenarios to the 95-percent confidence interval of the sto-chastic simulations. This figure extends figure VI.E2 to show unfunded obli-gation ratios, expressed as negative values below the zero percent line. Anunfunded obligation ratio is the ratio of the unfunded obligation accumulatedthrough the beginning of the year to the cost for that year.
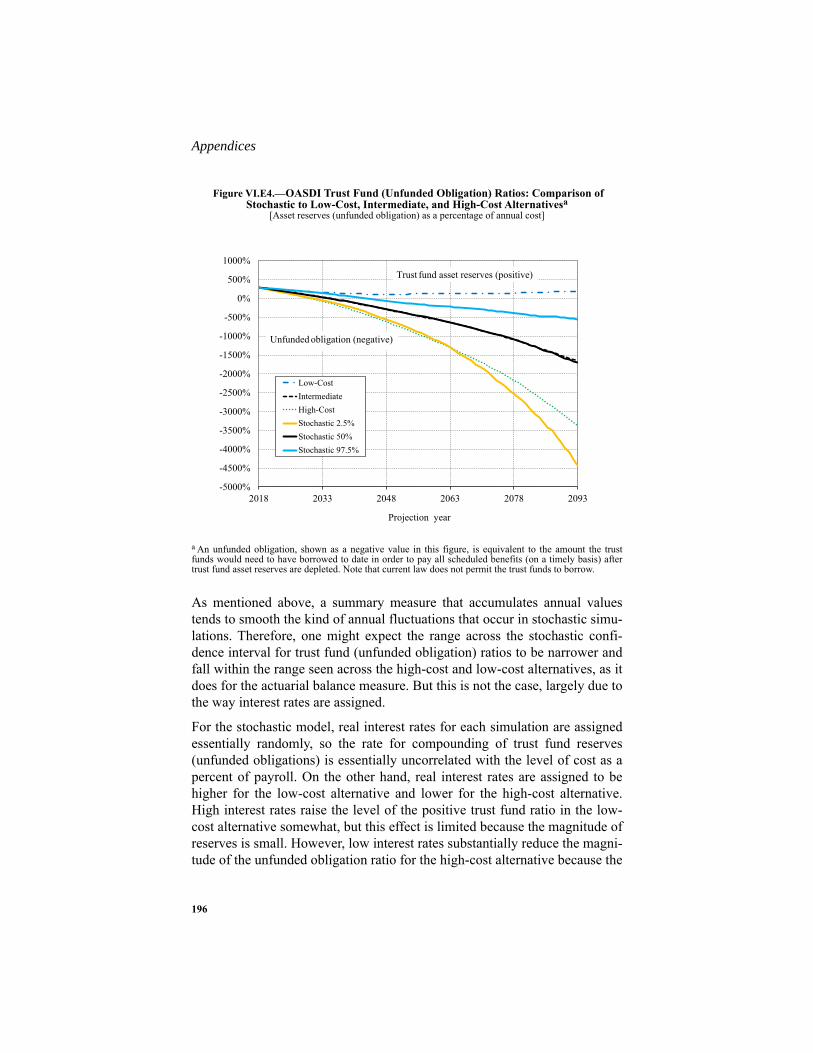
Appendices
196
As mentioned above, a summary measure that accumulates annual valuestends to smooth the kind of annual fluctuations that occur in stochastic simu-lations. Therefore, one might expect the range across the stochastic confi-dence interval for trust fund (unfunded obligation) ratios to be narrower andfall within the range seen across the high-cost and low-cost alternatives, as itdoes for the actuarial balance measure. But this is not the case, largely due tothe way interest rates are assigned.
For the stochastic model, real interest rates for each simulation are assignedessentially randomly, so the rate for compounding of trust fund reserves(unfunded obligations) is essentially uncorrelated with the level of cost as apercent of payroll. On the other hand, real interest rates are assigned to behigher for the low-cost alternative and lower for the high-cost alternative.High interest rates raise the level of the positive trust fund ratio in the low-cost alternative somewhat, but this effect is limited because the magnitude ofreserves is small. However, low interest rates substantially reduce the magni-tude of the unfunded obligation ratio for the high-cost alternative because the
Figure VI.E4.—OASDI Trust Fund (Unfunded Obligation) Ratios: Comparison of Stochastic to Low-Cost, Intermediate, and High-Cost Alternativesa
[Asset reserves (unfunded obligation) as a percentage of annual cost]
a An unfunded obligation, shown as a negative value in this figure, is equivalent to the amount the trustfunds would need to have borrowed to date in order to pay all scheduled benefits (on a timely basis) aftertrust fund asset reserves are depleted. Note that current law does not permit the trust funds to borrow.
-5000%
-4500%
-4000%
-3500%
-3000%
-2500%
-2000%
-1500%
-1000%
-500%
0%
500%
1000%
2018 2033 2048 2063 2078 2093
Projection year
Low-Cost
Intermediate
High-Cost
Stochastic 2.5%
Stochastic 50%
Stochastic 97.5%
Trust fund asset reserves (positive)
Unfunded obligation (negative)

197
Stochastic Projections
magnitude of unfunded obligations is relatively large. As a result, the trustfund (unfunded obligation) ratios are shifted, albeit unevenly, higher (or lessnegative) for both the high-cost and low-cost alternatives.
This interest rate effect on the alternatives is not as evident for some othersummary measures of actuarial status, such as the actuarial balance. Becausethe actuarial balance reflects the cumulative effects of interest in both itsnumerator and denominator, the interest rate effect is much less pronounced.In contrast, cumulative interest affects only the numerator of the trust fund(unfunded obligation) ratio. There is also no significant interest rate effect onthe trust fund depletion date.
Other factors also contribute, to varying degrees, to the difference in rangesbetween the results of the alternative scenarios and the stochastic simula-tions. The contrasts in results and methods do not mean that either approachto illustrating ranges of uncertainty is superior to the other. The ranges aredifferent and explainable.
Table VI.E1 displays long-range actuarial estimates for the combinedOASDI program using the two methods of illustrating uncertainty: alterna-tive scenarios and stochastic simulations. The table shows scenario-basedestimates for the intermediate, low-cost, and high-cost assumptions. It alsoshows stochastic estimates for the median (50th percentile) and for the80-percent and 95-percent confidence intervals. Each individual stochasticestimate in the table is the level at that percentile from the distribution of the5,000 simulations. For each given percentile, the values in the table for eachlong-range actuarial measure are generally from different stochastic simula-tions.
The median stochastic estimates displayed in table VI.E1 are similar to theintermediate scenario-based estimates. The median estimate of the long-range actuarial balance is -2.86 percent of taxable payroll, about0.02 percentage point lower than projected under the intermediate assump-tions. The median estimate for the open group unfunded obligation is$13.3 trillion, slightly higher than the $13.2 trillion estimate under the inter-mediate assumptions. The median first projected year that cost exceeds non-interest income (as it did in 2010 through 2017), and remains in excess ofnon-interest income throughout the remainder of the long-range period, is2018. This is the same year as projected under the intermediate assumptions.The median year that asset reserves first become depleted is 2034, also thesame as projected under the intermediate assumptions. The median estimatesof the annual cost rate for the 75th year of the projection period are18.07 percent of taxable payroll and 6.25 percent of gross domestic product

Appendices
198
(GDP). The comparable estimates under the intermediate assumptions are17.68 percent of payroll and 6.12 percent of GDP.
For three measures in table VI.E1 (the actuarial balance, the first projectedyear cost exceeds non-interest income and remains in excess through 2092,and the first year asset reserves become depleted), the 95-percent stochasticconfidence interval falls within the range defined by the low-cost and high-cost alternatives. For the remaining three measures (the open group unfundedobligation, the annual cost in the 75th year as a percent of taxable payroll,and the annual cost in the 75th year as a percent of GDP), one or both of thebounds of the 95-percent stochastic confidence interval fall outside the rangedefined by the low-cost and high-cost alternatives.
Table VI.E1.—Long-Range Estimates Relating to the Actuarial Status ofthe Combined OASDI Program
[Comparison of scenario-based and stochastic results]Traditional
scenario-based model Stochastic model
Interme-diate
Low-cost
High-cost
Median50th
percentile
80-percentconfidence interval
95-percentconfidence interval
10thpercentile
90thpercentile
2.5thpercentile
97.5thpercentile
Actuarial balance . . . . . . -2.84 0.13 -6.62 -2.86 -4.28 -1.70 -5.10 -1.10Open group unfunded
obligation (in trillions) . . . . . . . . . $13.2 -$1.6 $25.8 $13.3 $6.9 $23.8 $4.3 $31.7
First projected year cost exceeds non-interest income and remainsin excess through 2092a . . . . . . .
a Cost also exceeded non-interest income in 2010 through 2017.
2018 b
b The annual balance is projected to be negative for a temporary period, returning to positive levels before theend of the projection period.
2018 2018 2018 2026 2018 2091First year asset reserves
become depletedc . . . .
c For some stochastic simulations, the first year in which trust fund reserves become depleted does not indi-cate a permanent depletion of reserves.
2034 d
d Trust fund reserves are not estimated to be depleted within the projection period.
2030 2034 2032 2039 2030 2043Annual cost in 75th year
(percent of taxablepayroll) . . . . . . . . . . . . 17.68 12.80 25.03 18.07 14.88 22.44 13.37 25.31
Annual cost in 75th year (percent of GDP). . . . . 6.12 4.83 7.95 6.25 5.18 7.71 4.67 8.64
199
Infinite Horizon Projections
F. INFINITE HORIZON PROJECTIONS
Another measure of trust fund financial status is the infinite horizonunfunded obligation, which takes account of all past and future annual bal-ances, even those after the next 75 years. The extension of the time periodpast 75 years assumes that the current law for the OASDI program and thedemographic and economic trends used for the 75-year projection continueindefinitely.
Table VI.F1 shows that the OASDI open group unfunded obligation over theinfinite horizon is $34.3 trillion in present value, which is $21.2 trillionlarger than for the 75-year period. The $21.2 trillion increment reflects a sig-nificant financing gap projected for OASDI for years after 2092 into perpetu-ity. Of course, the degree of uncertainty associated with estimates increasessubstantially for years further in the future.
The $34.3 trillion infinite horizon open group unfunded obligation is equiva-lent to 4.0 percent of taxable payroll or 1.3 percent of GDP. These relativemeasures of the unfunded obligation over the infinite horizon express itsmagnitude in relation to the resources potentially available to finance theshortfall.
The summarized shortfalls for the 75-year period and through the infinitehorizon both reflect annual cash-flow shortfalls for all years after trust fundreserve depletion. The annual shortfalls after trust fund reserve depletion riseslowly and reflect increases in life expectancy after 2034. The summarizedshortfalls over the infinite horizon, as percentages of taxable payroll andGDP, are larger than the shortfalls for the 75-year period.
To illustrate the magnitude of the projected infinite horizon shortfall, con-sider that it could be eliminated with additional revenue equivalent to animmediate increase in the combined payroll tax rate from 12.4 percent toabout 16.6 percent,1 or with cost reductions equivalent to an immediate andpermanent reduction in benefits for all current and future beneficiaries byabout 24 percent.
1 The indicated increase in the payroll tax rate of 4.2 percent is somewhat larger than the 4.0 percent infinitehorizon actuarial deficit because the indicated increase reflects a behavioral response to tax rate changes. Inparticular, the calculation assumes that an increase in payroll taxes results in a small shift of wages and sala-ries to forms of employee compensation that are not subject to the payroll tax.
Appendices
200
Notes:1. The present values of future taxable payroll for 2018-92 and for 2018 through the infinite horizon are$491.1 trillion and $858.7 trillion, respectively.2. The present values of GDP for 2018-92 and for 2018 through the infinite horizon are $1,373.2 trillion and$2,544.9 trillion, respectively. Present values of GDP shown in the Medicare Trustees Report differ slightlydue to the use of discount rates that are specific to each program’s trust fund holdings.
Last year, the Trustees projected that the infinite horizon unfunded obligationwas $34.2 trillion in present value. If the assumptions, methods, and startingvalues had not changed, moving the valuation date forward by 1 year wouldhave increased the unfunded obligation by about $1.0 trillion, to$35.2 trillion. The net effects of changes in assumptions, methods, law, andstarting values decreased the infinite horizon unfunded obligation by$0.9 trillion.
The infinite horizon unfunded obligation is 0.2 percentage point lower thanin last year’s report when expressed as a share of taxable payroll, and is0.1 percentage point lower than last year when expressed as a share of GDP.See section IV.B.6 for details regarding changes in law, data, methods, andassumptions.
a. Unfunded Obligations for Past, Current, and Future Participants
Table VI.F2 separates the components of the infinite horizon unfunded obli-gation (with the exception of General Fund reimbursements) among past,current, and future participants. The table does not separate past GeneralFund reimbursements among participants because there is no clear basis forattributing the reimbursements across generations.
Past participants are defined as those no longer alive as of the valuation date.Current participants are those age 15 and older as of 2018. Future partici-pants are those under age 15 or not yet born.
Table VI.F1.—Unfunded OASDI Obligations Through the Infinite Horizon,Based on Intermediate Assumptions
[Present values as of January 1, 2018; dollar amounts in trillions]
Presentvalue
Expressed as a percentageof future payroll and GDP
Taxablepayroll GDP
Unfunded obligation through the infinite horizona . . . . . . . . . . . .
a Present value of future cost less future non-interest income, reduced by the amount of trust fund assetreserves at the beginning of 2018. Expressed as a percentage of payroll and GDP for the period 2018 throughthe infinite horizon.
$34.3 4.0 1.3Unfunded obligation through 2092b . . . . . . . . . . . . . . . . . . . . . . .
b Present value of future cost less future non-interest income through 2092, reduced by the amount of trustfund reserves at the beginning of 2018. Expressed as a percentage of payroll and GDP for the period 2018through 2092.
13.2 2.7 1.0
201
Infinite Horizon Projections
The excess of the present value of cost for past and current participants overthe present value of dedicated tax income for past and current participantsproduces an unfunded obligation for past and current participants of$33.0 trillion. Table VI.F2 also shows an unfunded obligation of$32.4 trillion for past and current participants, including past and future Gen-eral Fund reimbursements. Future participants are scheduled to pay dedi-cated taxes of $1.9 trillion less into the system than the cost of theirscheduled benefits ($81.3 trillion of dedicated tax income as compared to$83.2 trillion of cost). The unfunded obligation for all participants throughthe infinite horizon thus equals $34.3 trillion.
Making Social Security solvent over the infinite horizon requires some com-bination of increased revenue or reduced benefits for current and future par-ticipants amounting to $34.3 trillion in present value, 4.0 percent of futuretaxable payroll, or 1.3 percent of future GDP.
Appendices
202
Notes:1. The present value of future taxable payroll for 2018 through the infinite horizon is $858.7 trillion.2. The present value of GDP for 2018 through the infinite horizon is $2,544.9 trillion.3. Totals do not necessarily equal the sums of rounded components.
Table VI.F2.—Present Values of OASDI Cost Less Non-interest Incomeand Unfunded Obligations for Program Participants,
Based on Intermediate Assumptions[Present values as of January 1, 2018; dollar amounts in trillions]
Presentvalue
Expressed as a percentage of future
payroll and GDPTaxablepayroll GDP
Present value of past cost . . . . . . . . . . . . . . . . . . . . . . . . . . . . . . . . . . . $61.9 7.2 2.4Less present value of past dedicated tax income . . . . . . . . . . . . . . . . . . 64.1 7.5 2.5Plus present value of future cost for current participants . . . . . . . . . . . 68.6 8.0 2.7Less present value of future dedicated tax income for current
participants . . . . . . . . . . . . . . . . . . . . . . . . . . . . . . . . . . . . . . . . . . . . 33.3 3.9 1.3Equals unfunded obligation for past and current participants
excluding General Fund reimbursements . . . . . . . . . . . . . . . . . . . . . 33.0 3.8 1.3Less present value of past General Fund reimbursementsa . . . . . . . . . . .6 .1 bLess present value of future General Fund reimbursements over
the infinite horizona . . . . . . . . . . . . . . . . . . . . . . . . . . . . . . . . . . . . . c d bEquals unfunded obligation for past and current participants
including General Fund reimbursements . . . . . . . . . . . . . . . . . . . . . 32.4 3.8 1.3Plus present value of cost for future participants over the infinite
horizon. . . . . . . . . . . . . . . . . . . . . . . . . . . . . . . . . . . . . . . . . . . . . . . . 83.2 9.7 3.3Less present value of dedicated tax income for future participants
over the infinite horizon . . . . . . . . . . . . . . . . . . . . . . . . . . . . . . . . . . 81.3 9.5 3.2Equals unfunded obligation for all participants through the infinite
horizon . . . . . . . . . . . . . . . . . . . . . . . . . . . . . . . . . . . . . . . . . . . . . . . 34.3 4.0 1.3a Distribution of General Fund reimbursements among past, current, and future participants cannot be deter-mined.b Less than 0.05 percent of GDP.c Less than $50 billion.d Less than 0.05 percent of taxable payroll.
203
OASDI and HI: Percent of Payroll
G. ESTIMATES FOR OASDI AND HI, SEPARATE AND COMBINED
In this appendix, the Trustees present long-range actuarial estimates for theOASDI and Hospital Insurance (HI) programs both separately and on a com-bined basis. These estimates facilitate analysis of the adequacy of the incomeand asset reserves of these programs relative to their cost under current law.This appendix does not include estimates for the Supplementary MedicalInsurance (SMI) program because adequate financing is guaranteed in thelaw and because the SMI program is not financed through a payroll tax. Formore information on Medicare estimates, please see the 2018 MedicareTrustees Report.
The information in this appendix on combined operations, while significant,should not obscure the analysis of the financial status of the individual trustfunds, which are legally separate and cannot be commingled. In addition, thefactors which determine the costs of the OASI, DI, and HI programs differsubstantially.
1. Estimates as a Percentage of Taxable PayrollComparing cost and income rates for the OASDI and HI programs as per-centages of taxable payroll requires a note of caution. The taxable payrollsfor the HI program are larger than those estimated for the OASDI programbecause: (1) a larger maximum taxable amount was established for the HIprogram in 1991, with the maximum eliminated altogether for the HI pro-gram in 1994; (2) larger proportions of Federal, State, and local governmentemployees are covered under the HI program; and (3) the earnings of rail-road workers are included directly in the HI taxable payroll but are notincluded in the OASDI taxable payroll. (Railroad worker contributions forthe equivalent of OASDI benefits are accounted for in a net interchange thatoccurs annually between the OASDI and Railroad Retirement programs.) Asa result, the HI taxable payroll is about 25 percent larger than the OASDItaxable payroll throughout the long-range period.
As with the OASI and DI Trust Funds, income to the HI Trust Fund comesprimarily from contributions paid by employees, employers, and self-employed persons. Table VI.G1 shows the OASDI and HI contribution ratesthat are authorized in the Federal Insurance Contributions Act.

Appendices
204
Table VI.G2 shows the Trustees’ estimates of annual income rates and costrates for the OASDI program and the HI program under the low-cost, inter-mediate, and high-cost sets of assumptions described earlier in this report.
Table VI.G1.—Payroll Tax Contribution Rates for the OASDI and HI Programs[In percent]
Calendar years
Employees and employers, combineda
a Except as noted below, the combined employee/employer rate is divided equally between employees andemployers.
Employees only Self employedb
b Beginning in 1990, self-employed persons receive a deduction, for purposes of computing their net earn-ings, equal to half of the combined OASDI and HI contributions that would be payable without regard to thecontribution and benefit base. The OASDI contribution rate then applies to net earnings after this deduction,but subject to the OASDI base.
OASDIup to basec
c The payroll tax on earnings for the OASDI program applies to annual earnings up to a contribution andbenefit base indexed to the average wage level. The base is $128,400 for 2018.
HIall earningsd
d Prior to 1994, the payroll tax on earnings for the HI program applied to annual earnings up to a contribu-tion base. The HI contribution base was eliminated beginning in 1994.
HIover limite
e Starting with Federal personal income tax returns for tax year 2013, earned income exceeding $200,000 forindividual filers and $250,000 for married couples filing jointly is subject to an additional HI tax of0.9 percent. These income limits are not indexed after 2013.
OASDIup to basec
HIall earningsd
HIover limite
1966 . . . . . . . . . . . . . 7.70 0.70 — 5.80 0.35 —1967 . . . . . . . . . . . . . 7.80 1.00 — 5.90 .50 —1968 . . . . . . . . . . . . . 7.60 1.20 — 5.80 .60 —1969-70 . . . . . . . . . . 8.40 1.20 — 6.30 .60 —1971-72 . . . . . . . . . . 9.20 1.20 — 6.90 .60 —
1973 . . . . . . . . . . . . . 9.70 2.00 — 7.00 1.00 —1974-77 . . . . . . . . . . 9.90 1.80 — 7.00 .90 —1978 . . . . . . . . . . . . . 10.10 2.00 — 7.10 1.00 —1979-80 . . . . . . . . . . 10.16 2.10 — 7.05 1.05 —1981 . . . . . . . . . . . . . 10.70 2.60 — 8.00 1.30 —
1982-83 . . . . . . . . . . 10.80 2.60 — 8.05 1.30 —1984f. . . . . . . . . . . . .
f In 1984 only, employees received an immediate credit of 0.3 percent of taxable wages against their OASDIpayroll tax contributions. The self-employed received similar credits of 2.7 percent, 2.3 percent, and2.0 percent against their combined OASDI and Hospital Insurance (HI) contributions on net earnings fromself-employment in 1984, 1985, and 1986-89, respectively. The General Fund of the Treasury reimbursedthe trust funds for these credits.
11.40 2.60 — 11.40 2.60 —1985f . . . . . . . . . . . . 11.40 2.70 — 11.40 2.70 —1986-87f . . . . . . . . . . 11.40 2.90 — 11.40 2.90 —1988-89f . . . . . . . . . . 12.12 2.90 — 12.12 2.90 —
1990-2010g. . . . . . . .
g Public Law 111-147 exempted most employers from paying the employer share of OASDI payroll tax onwages paid during the period March 19, 2010 through December 31, 2010 to certain qualified individualshired after February 3, 2010.
12.40 2.90 — 12.40 2.90 —2011-2012h. . . . . . . .
h Public Law 111-312, Public Law 112-78, and Public Law 112-96 reduced the OASDI payroll tax rate for2011 and 2012 by 2 percentage points for employees and for self-employed workers. These laws require thatthe General Fund of the Treasury reimburse the OASI and DI Trust Funds for these temporary reductions in2010, 2011, and 2012 payroll tax revenue, in order to “replicate to the extent possible” revenue that wouldhave been received if the combined employee/employer payroll tax rates had remained at 12.4 percent forOASDI (10.6 percent for OASI and 1.8 percent for DI).
10.40 2.90 — 10.40 2.90 —2013 and later. . . . . . 12.40 2.90 0.90 12.40 2.90 0.90

205
OASDI and HI: Percent of Payroll
The income rates reflect the payroll tax rates shown in table VI.G1, revenuefrom taxation of scheduled OASDI benefits for both the OASDI and HITrust Funds, and any reimbursements from the General Fund of the Treasury.For the HI program, the income rates also reflect: (1) the additional 0.9-per-cent tax on employees for relatively high earnings and the portion of totalpayroll to which the 0.9-percent rate applies; (2) premium revenues; and(3) monies from fraud and abuse control activities. Annual income and costrates indicate the cash-flow operation of the programs. Therefore, incomerates exclude interest earned on trust fund asset reserves. Table VI.G2 alsoshows annual balances, which are the differences between annual incomerates and cost rates.
The Trustees project that the OASDI and HI cost rates will rise generallyabove current levels under the intermediate and high-cost sets of assump-tions. The greatest increase occurs from 2018 to 2037 under both sets ofassumptions for OASDI and under the intermediate assumptions for HI.Under the intermediate assumptions, the OASDI cost rate increases by28 percent from its current level by 2092, while under the high-cost assump-tions, the cost rate increases by 79 percent by 2092. For HI, cost ratesincrease by 51 percent and 213 percent from 2018 to 2092 under the interme-diate and high-cost assumptions, respectively. Under the low-cost assump-tions, the OASDI and HI cost rates decrease from 2018 to 2092 by 6 percentand 28 percent, respectively.
The Trustees project annual deficits for every year of the projection periodunder the intermediate and high-cost assumptions for both the OASDI andHI programs. Under the low-cost assumptions, OASDI annual balances arenegative through 2051, positive for 2052 through 2062, negative for 2063through 2076, and then positive through the remainder of the 75-year projec-tion period. HI annual balances are positive throughout the projection periodunder the low-cost assumptions.

Appendices
206
Table VI.G2.—OASDI and HI Annual Income Rates, Cost Rates, and Balances,Calendar Years 2018-2095
[As a percentage of taxable payrolla]
Calendar year
OASDI HIIncome
rateCostrateb Balanceb
Incomerate
Costrate Balance
Intermediate:2018 . . . . . . . . . . 12.64 13.81 -1.17 3.34 3.42 -0.082019 . . . . . . . . . . 12.87 13.95 -1.08 3.36 3.45 -.092020 . . . . . . . . . . 12.89 14.12 -1.23 3.38 3.48 -.102021 . . . . . . . . . . 12.92 14.27 -1.35 3.40 3.54 -.142022 . . . . . . . . . . 12.95 14.44 -1.49 3.41 3.62 -.212023 . . . . . . . . . . 12.97 14.62 -1.66 3.43 3.70 -.272024 . . . . . . . . . . 12.99 14.80 -1.81 3.45 3.77 -.322025 . . . . . . . . . . 13.01 14.98 -1.98 3.47 3.84 -.372026 . . . . . . . . . . 13.13 15.16 -2.02 3.55 3.91 -.352027 . . . . . . . . . . 13.15 15.36 -2.21 3.58 3.98 -.40
2030 . . . . . . . . . . 13.20 15.98 -2.78 3.65 4.32 -.682035 . . . . . . . . . . 13.25 16.65 -3.40 3.74 4.66 -.922040 . . . . . . . . . . 13.27 16.83 -3.56 3.81 4.88 -1.072045 . . . . . . . . . . 13.27 16.66 -3.39 3.87 4.98 -1.122050 . . . . . . . . . . 13.27 16.54 -3.27 3.93 5.00 -1.072055 . . . . . . . . . . 13.28 16.59 -3.31 3.99 4.97 -.982060 . . . . . . . . . . 13.29 16.81 -3.51 4.07 4.97 -.912065 . . . . . . . . . . 13.31 17.07 -3.75 4.14 5.02 -.882070 . . . . . . . . . . 13.34 17.36 -4.03 4.21 5.10 -.902075 . . . . . . . . . . 13.35 17.59 -4.23 4.27 5.18 -.912080 . . . . . . . . . . 13.36 17.61 -4.25 4.32 5.21 -.902085 . . . . . . . . . . 13.35 17.53 -4.18 4.35 5.19 -.842090 . . . . . . . . . . 13.35 17.60 -4.24 4.39 5.17 -.772095 . . . . . . . . . . 13.37 17.82 -4.45 4.44 5.15 -.71
Low-cost:2018 . . . . . . . . . . 12.58 13.59 -1.01 3.33 3.33 .012019 . . . . . . . . . . 12.85 13.46 -.62 3.35 3.25 .102020 . . . . . . . . . . 12.86 13.41 -.55 3.36 3.21 .152021 . . . . . . . . . . 12.88 13.35 -.48 3.38 3.21 .172022 . . . . . . . . . . 12.90 13.35 -.45 3.39 3.22 .172023 . . . . . . . . . . 12.91 13.36 -.45 3.41 3.23 .182024 . . . . . . . . . . 12.93 13.39 -.46 3.42 3.23 .202025 . . . . . . . . . . 12.94 13.42 -.48 3.44 3.22 .222026 . . . . . . . . . . 13.04 13.45 -.41 3.51 3.22 .302027 . . . . . . . . . . 13.06 13.50 -.45 3.53 3.21 .32
2030 . . . . . . . . . . 13.09 13.81 -.72 3.60 3.29 .312035 . . . . . . . . . . 13.12 14.06 -.94 3.70 3.22 .482040 . . . . . . . . . . 13.12 13.89 -.76 3.78 3.05 .732045 . . . . . . . . . . 13.10 13.45 -.35 3.84 2.80 1.052050 . . . . . . . . . . 13.09 13.13 -.05 3.91 2.59 1.322055 . . . . . . . . . . 13.09 13.02 .07 3.98 2.43 1.562060 . . . . . . . . . . 13.09 13.07 .03 4.06 2.34 1.722065 . . . . . . . . . . 13.10 13.12 -.02 4.12 2.32 1.802070 . . . . . . . . . . 13.11 13.17 -.07 4.17 2.35 1.822075 . . . . . . . . . . 13.10 13.14 -.03 4.22 2.39 1.832080 . . . . . . . . . . 13.09 12.92 .17 4.25 2.41 1.852085 . . . . . . . . . . 13.08 12.70 .38 4.28 2.40 1.882090 . . . . . . . . . . 13.08 12.72 .36 4.31 2.38 1.932095 . . . . . . . . . . 13.09 12.95 .14 4.36 2.38 1.98
207
OASDI and HI: Percent of Payroll
Notes:1. The income rate excludes interest income.2. The Trustees show income and cost estimates generally on a cash basis for the OASDI program and on anincurred basis for the HI program.3. Totals do not necessarily equal the sums of rounded components.
Table VI.G3 shows summarized values over the 25-year, 50-year, and75-year valuation periods. For each of those periods, the summarized incomerates include beginning trust fund asset reserves, and the summarized costrates include the cost of accumulating an ending fund reserve equal to100 percent of annual cost at the end of the period.
High-cost:2018 . . . . . . . . . . 12.69 13.98 -1.29 3.34 3.49 -0.152019 . . . . . . . . . . 12.91 14.63 -1.72 3.37 3.66 -.302020 . . . . . . . . . . 12.93 15.04 -2.11 3.39 3.76 -.372021 . . . . . . . . . . 12.97 15.41 -2.44 3.42 3.89 -.472022 . . . . . . . . . . 13.01 15.76 -2.76 3.44 4.06 -.622023 . . . . . . . . . . 13.03 16.12 -3.09 3.46 4.23 -.762024 . . . . . . . . . . 13.07 16.48 -3.41 3.49 4.39 -.902025 . . . . . . . . . . 13.09 16.82 -3.73 3.51 4.56 -1.052026 . . . . . . . . . . 13.24 17.15 -3.91 3.60 4.72 -1.122027 . . . . . . . . . . 13.27 17.53 -4.26 3.63 4.90 -1.27
2030 . . . . . . . . . . 13.33 18.53 -5.20 3.71 5.64 -1.942035 . . . . . . . . . . 13.41 19.75 -6.34 3.80 6.70 -2.902040 . . . . . . . . . . 13.46 20.45 -6.99 3.88 7.73 -3.842045 . . . . . . . . . . 13.48 20.77 -7.29 3.95 8.68 -4.732050 . . . . . . . . . . 13.50 21.05 -7.55 4.00 9.43 -5.422055 . . . . . . . . . . 13.53 21.44 -7.91 4.07 9.95 -5.882060 . . . . . . . . . . 13.57 21.99 -8.42 4.13 10.33 -6.202065 . . . . . . . . . . 13.61 22.60 -8.99 4.20 10.61 -6.402070 . . . . . . . . . . 13.66 23.33 -9.67 4.28 10.79 -6.512075 . . . . . . . . . . 13.70 24.03 -10.33 4.35 10.95 -6.602080 . . . . . . . . . . 13.74 24.50 -10.77 4.42 11.03 -6.612085 . . . . . . . . . . 13.76 24.75 -11.00 4.47 10.99 -6.522090 . . . . . . . . . . 13.77 24.95 -11.18 4.52 10.92 -6.412095 . . . . . . . . . . 13.78 25.17 -11.38 4.56 10.89 -6.32
a The taxable payroll for HI is significantly larger than the taxable payroll for OASDI because the HI taxablemaximum amount was eliminated beginning in 1994, and because HI covers all Federal civilian employees,all State and local government employees hired after April 1, 1986, and railroad employees.b OASDI benefit payments which were scheduled to be paid on January 3 for some past and future yearswere actually paid on December 31 as required by the statutory provision for early delivery of benefit pay-ments when the normal payment delivery date is a Saturday, Sunday, or legal public holiday. For compara-bility with the values for historical years and the projections in this report, all trust fund operations and assetreserves reflect the 12 months of benefits scheduled for payment each year.
Table VI.G2.—OASDI and HI Annual Income Rates, Cost Rates, and Balances,Calendar Years 2018-2095 (Cont.)
[As a percentage of taxable payrolla]
Calendar year
OASDI HIIncome
rateCostrateb Balanceb
Incomerate
Costrate Balance
Appendices
208
Note: Totals do not necessarily equal the sums of rounded components.
The Trustees project that the OASDI and HI programs will each experiencelarge actuarial deficits for the 25-year, 50-year, and 75-year valuation periodsunder the high-cost assumptions. Actuarial deficits under the intermediateassumptions are smaller than those for the high-cost assumptions for all threevaluation periods. Under the low-cost assumptions, the OASDI and HI pro-grams have positive actuarial balances for all three valuation periods.
Table VI.G3.—Summarized OASDI and HI Income Rates and Cost Rates for Valuation Periods,a Calendar Years 2018-2092
[As a percentage of taxable payrollb]
Valuationperiod
OASDI HIIncome
rate Costratec
Actuarialbalance
Incomerate
Costrate
Actuarialbalance
Intermediate:25-year:
2018-42 . . . . . . 14.59 16.36 -1.77 3.70 4.41 -0.7150-year:
2018-67 . . . . . . 14.01 16.45 -2.45 3.83 4.65 -.8275-year:
2018-92 . . . . . . 13.84 16.69 -2.84 3.95 4.77 -.82
Low-cost:25-year:
2018-42 . . . . . . 14.36 14.26 .09 3.66 3.31 .3550-year:
2018-67 . . . . . . 13.77 13.69 .08 3.81 2.92 .8975-year:
2018-92 . . . . . . 13.59 13.45 .13 3.93 2.76 1.17
High-cost:25-year:
2018-42 . . . . . . 14.89 18.80 -3.90 3.75 5.88 -2.1350-year:
2018-67 . . . . . . 14.31 19.87 -5.56 3.88 7.50 -3.6275-year:
2018-92 . . . . . . 14.18 20.80 -6.62 4.00 8.25 -4.25a Income rates include beginning trust fund asset reserves and cost rates include the cost of reaching an end-ing target trust fund equal to 100 percent of annual cost at the end of the period.b The taxable payroll for HI is significantly larger than the taxable payroll for OASDI because the HI taxablemaximum amount was eliminated beginning 1994, and because HI covers all Federal civilian employees, allState and local government employees hired after April 1, 1986, and railroad employees.c OASDI benefit payments which were scheduled to be paid on January 3 for some past and future yearswere actually paid on December 31 as required by the statutory provision for early delivery of benefit pay-ments when the normal payment delivery date is a Saturday, Sunday, or legal public holiday. For compara-bility with the values for historical years and the projections in this report, all trust fund operations and assetreserves reflect the 12 months of benefits scheduled for payment each year.

209
OASDI and HI: Percent of GDP
2. Estimates as a Percentage of Gross Domestic ProductThis section presents long-range projections of the operations of the com-bined Old-Age and Survivors Insurance and Disability Insurance (OASI andDI) Trust Funds and of the Hospital Insurance (HI) Trust Fund, expressed asa percentage of gross domestic product (GDP). While expressing fund opera-tions as a percentage of taxable payroll is a very useful approach for assess-ing the financial status of the programs (see section IV.B.1), expressing themas a percentage of the total value of goods and services produced in theUnited States provides an additional perspective.
Table VI.G4 shows non-interest income, total cost, and the resulting balanceof the combined OASI and DI Trust Funds, of the HI Trust Fund, and of thecombined OASI, DI, and HI Trust Funds, expressed as percentages of GDPon the basis of each of the three alternative sets of assumptions. Table VI.G4also contains estimates of GDP. For OASDI, non-interest income consists ofpayroll tax contributions, proceeds from taxation of scheduled OASDI bene-fits, and any reimbursements from the General Fund of the Treasury. Costconsists of scheduled benefits, administrative expenses, financial interchangewith the Railroad Retirement program, and payments for vocational rehabili-tation services for disabled beneficiaries. For HI, non-interest income con-sists of payroll tax contributions (including contributions from railroademployment), up to an additional 0.9 percent tax on earned income for rela-tively high earners, proceeds from taxation of scheduled OASDI benefits,premium revenues, monies from fraud and abuse control activities, and anyreimbursements from the General Fund of the Treasury. Cost consists of out-lays (benefits and administrative expenses) for beneficiaries. The Trusteesshow income and cost estimates generally on a cash basis for the OASDIprogram1 and on an incurred basis for the HI program.
The Trustees project the OASDI annual balance (non-interest income lesscost) as a percentage of GDP to be negative throughout the projection periodunder the intermediate and high-cost assumptions. Under the low-costassumptions, the OASDI annual deficit as a percentage of GDP decreasesthrough 2022. After 2022, deficits generally increase to a peak in 2035 andthen decrease through 2051. The deficit decreases in 2026 in part because ofa one-time upward shift in taxation of benefits income due to the expirationof the personal income tax provisions in Public Law 115-97, the Tax Cuts
1 OASDI benefits paid for entitlement for a particular month are generally paid in the succeeding month.There are two primary exceptions to this general rule. First, payments can occur with a greater delay when abenefit award is made after the month of initial benefit entitlement. At the time of benefit award, benefitsowed for months of prior entitlement are then also paid to the beneficiary. For the projections in this report,such retroactive payments are included in the period where they are paid (at time of award). Second, whenbenefit payments scheduled for January 3 are paid on the prior December 31, because January 3 falls on aSunday, such payments are shown in this report for the period they were scheduled to be paid.
Appendices
210
and Jobs Act. The annual balances are positive for 2052 through 2062, nega-tive for 2063 through 2076, and positive for 2077 through the remainder ofthe 75-year projection period. Under the intermediate assumptions, theannual deficit decreases from 2018 to 2019. Thereafter, annual deficitsincrease through 2039, then decrease through 2052, and generally increasethereafter. Under the high-cost assumptions, annual deficits increasethroughout the projection period.
The Trustees project that the HI annual balance as a percentage of GDP willbe positive throughout the projection period under the low-cost assumptions.Under the intermediate and the high-cost assumptions, the HI annual balanceis negative for all years of the projection period. Under the intermediateassumptions, annual deficits generally increase through 2045, and then gen-erally decline thereafter. Under the high-cost assumptions, annual deficitsreach a peak in 2075 and decline slowly thereafter.
The combined OASDI and HI annual balance as a percentage of GDP is neg-ative throughout the projection period under both the intermediate and high-cost assumptions. Under the low-cost assumptions, the combined OASDIand HI annual balance is negative through 2039, and then positive andmostly rising thereafter. Under the intermediate assumptions, the combinedOASDI and HI annual deficit decreases from 2018 to 2019. Thereafter,annual deficits increase through 2040, decrease through 2054, then increasethrough 2077, and generally decline thereafter, reaching 1.82 percent of GDPby 2092. Under the high-cost assumptions, combined annual deficits rise to apeak of 6.26 percent in 2081 and decrease thereafter.
By 2092, the combined OASDI and HI annual balances as percentages ofGDP range from a positive annual balance of 1.01 percent for the low-costassumptions to an annual deficit of 6.17 percent for the high-cost assump-tions. Annual balances differ by a much smaller amount for the tenth projec-tion year, 2027, ranging from an annual deficit of 0.02 percent for the low-cost assumptions to an annual deficit of 2.11 percent for the high-costassumptions.
The summarized long-range (75-year) actuarial balance as a percentage ofGDP for the combined OASDI and HI programs varies among the threealternatives by a relatively large amount, from a positive actuarial balance of0.59 percent under the low-cost assumptions to an actuarial deficit of4.14 percent under the high-cost assumptions. The 25-year summarized actu-arial balance varies by a smaller amount, from a positive actuarial balance of0.19 percent to an actuarial deficit of 2.35 percent. Summarized rates are cal-culated on a present-value basis. They include the trust fund reserve balanceson January 1, 2018 and the cost of reaching a target trust fund level equal to

211
OASDI and HI: Percent of GDP
100 percent of the following year’s annual cost at the end of the period. (Seesection IV.B.4 for further explanation.)
Table VI.G4.—OASDI and HI Annual and Summarized Income, Cost, and Balanceas a Percentage of GDP, Calendar Years 2018-2095
Calendar year
Percentage of GDPGDP indollars
(billions)OASDI HI Combined
Incomea Costb Balanceb Incomea Cost Balance Incomea Costb Balanceb
Intermediate:2018 . . . . . 4.52 4.94 -0.42 1.49 1.53 -0.04 6.01 6.47 -0.46 $20,3072019 . . . . . 4.61 4.99 -.39 1.51 1.55 -.04 6.11 6.54 -.43 21,2622020 . . . . . 4.62 5.07 -.44 1.52 1.57 -.05 6.15 6.64 -.49 22,2882021 . . . . . 4.65 5.14 -.49 1.54 1.60 -.06 6.19 6.74 -.55 23,3462022 . . . . . 4.68 5.22 -.54 1.55 1.65 -.09 6.23 6.87 -.63 24,4402023 . . . . . 4.70 5.30 -.60 1.57 1.69 -.12 6.27 6.99 -.72 25,5772024 . . . . . 4.73 5.39 -.66 1.58 1.72 -.14 6.31 7.11 -.80 26,7652025 . . . . . 4.75 5.47 -.72 1.59 1.76 -.17 6.34 7.23 -.89 27,9782026 . . . . . 4.81 5.55 -.74 1.63 1.80 -.16 6.44 7.35 -.90 29,2292027 . . . . . 4.82 5.63 -.81 1.64 1.83 -.18 6.46 7.45 -.99 30,535
2030 . . . . . 4.82 5.83 -1.01 1.67 1.98 -.31 6.49 7.81 -1.32 34,7312035 . . . . . 4.80 6.03 -1.23 1.70 2.12 -.42 6.50 8.15 -1.65 42,9302040 . . . . . 4.78 6.07 -1.28 1.72 2.21 -.48 6.51 8.27 -1.76 53,0402045 . . . . . 4.76 5.98 -1.22 1.74 2.24 -.50 6.51 8.23 -1.72 65,7462050 . . . . . 4.75 5.93 -1.17 1.76 2.25 -.48 6.52 8.17 -1.65 81,5362055 . . . . . 4.74 5.93 -1.18 1.79 2.23 -.44 6.53 8.16 -1.62 100,9892060 . . . . . 4.74 5.99 -1.25 1.82 2.22 -.41 6.56 8.21 -1.66 124,7502065 . . . . . 4.73 6.06 -1.33 1.84 2.24 -.39 6.57 8.30 -1.73 153,8672070 . . . . . 4.71 6.14 -1.42 1.87 2.26 -.40 6.58 8.40 -1.82 189,8382075 . . . . . 4.70 6.19 -1.49 1.88 2.29 -.40 6.58 8.47 -1.89 234,6182080 . . . . . 4.67 6.16 -1.49 1.90 2.29 -.39 6.57 8.45 -1.88 290,4202085 . . . . . 4.65 6.10 -1.46 1.90 2.27 -.37 6.55 8.38 -1.82 359,5072090 . . . . . 4.63 6.10 -1.47 1.91 2.25 -.34 6.54 8.35 -1.81 444,2822095 . . . . . 4.62 6.16 -1.54 1.92 2.23 -.31 6.54 8.39 -1.85 548,108
Summarized rates: c25-year:
2018-42 . . 5.29 5.93 -.64 1.68 2.01 -.32 6.97 7.94 -.9650-year:
2018-67 . . 5.05 5.93 -.88 1.73 2.10 -.37 6.78 8.03 -1.2575-year:
2018-92 . . 4.95 5.97 -1.02 1.77 2.14 -.37 6.72 8.11 -1.39
Low-cost:2018 . . . . . 4.50 4.86 -.36 1.49 1.49 d 5.99 6.35 -.36 20,5872019 . . . . . 4.59 4.81 -.22 1.50 1.46 .04 6.10 6.28 -.18 22,0552020 . . . . . 4.62 4.82 -.20 1.52 1.45 .07 6.14 6.27 -.13 23,5582021 . . . . . 4.66 4.84 -.17 1.54 1.46 .08 6.20 6.29 -.09 25,0232022 . . . . . 4.70 4.87 -.16 1.55 1.47 .08 6.25 6.34 -.08 26,5112023 . . . . . 4.74 4.91 -.17 1.56 1.48 .08 6.30 6.38 -.08 28,0642024 . . . . . 4.77 4.94 -.17 1.57 1.48 .09 6.34 6.42 -.08 29,7162025 . . . . . 4.80 4.98 -.18 1.58 1.48 .10 6.38 6.46 -.08 31,4442026 . . . . . 4.87 5.02 -.15 1.62 1.48 .14 6.48 6.50 -.01 33,2382027 . . . . . 4.89 5.05 -.17 1.63 1.48 .15 6.51 6.53 -.02 35,129
2030 . . . . . 4.89 5.16 -.27 1.66 1.51 .14 6.55 6.67 -.13 41,3962035 . . . . . 4.89 5.23 -.35 1.70 1.48 .22 6.58 6.71 -.13 54,3082040 . . . . . 4.88 5.16 -.28 1.73 1.40 .33 6.61 6.56 .05 71,3622045 . . . . . 4.88 5.01 -.13 1.76 1.28 .48 6.64 6.29 .35 94,3602050 . . . . . 4.88 4.90 -.02 1.80 1.19 .61 6.68 6.09 .59 125,0332055 . . . . . 4.89 4.87 .03 1.83 1.12 .72 6.73 5.99 .74 165,4232060 . . . . . 4.91 4.90 .01 1.87 1.08 .79 6.78 5.98 .80 218,2002065 . . . . . 4.92 4.93 -.01 1.90 1.07 .83 6.82 6.00 .82 287,5192070 . . . . . 4.93 4.95 -.03 1.93 1.09 .84 6.85 6.04 .81 379,4572075 . . . . . 4.93 4.94 -.01 1.95 1.11 .85 6.88 6.05 .83 502,4192080 . . . . . 4.93 4.86 .06 1.97 1.11 .85 6.89 5.98 .92 666,7252085 . . . . . 4.93 4.78 .14 1.98 1.11 .87 6.91 5.89 1.01 884,1162090 . . . . . 4.93 4.80 .13 2.00 1.11 .89 6.93 5.90 1.03 1,168,8552095 . . . . . 4.95 4.89 .05 2.02 1.10 .92 6.97 6.00 .97 1,541,437

Appendices
212
Notes:1. The Trustees show income and cost estimates generally on a cash basis for the OASDI program and on anincurred basis for the HI program.2. Totals do not necessarily equal the sums of rounded components.
Low-cost (Cont.):Summarized rates: c25-year:
2018-42 . . 5.32 5.28 0.04 1.68 1.52 0.16 6.99 6.80 0.1950-year:
2018-67 . . 5.12 5.09 .03 1.75 1.34 .41 6.87 6.43 .4475-year:
2018-92 . . 5.07 5.02 .05 1.81 1.27 .54 6.88 6.29 .59
High-cost:2018 . . . . . 4.53 5.00 -.46 1.50 1.56 -.07 6.03 6.56 -.53 $20,1292019 . . . . . 4.63 5.25 -.62 1.51 1.64 -.13 6.14 6.89 -.75 20,1792020 . . . . . 4.63 5.39 -.76 1.52 1.69 -.17 6.15 7.08 -.92 20,7672021 . . . . . 4.64 5.51 -.87 1.54 1.75 -.21 6.18 7.27 -1.09 21,5052022 . . . . . 4.66 5.64 -.99 1.56 1.84 -.28 6.21 7.48 -1.27 22,2612023 . . . . . 4.67 5.78 -1.11 1.57 1.92 -.35 6.25 7.70 -1.45 23,0322024 . . . . . 4.69 5.91 -1.22 1.59 2.00 -.41 6.28 7.92 -1.64 23,8232025 . . . . . 4.70 6.04 -1.34 1.61 2.09 -.48 6.31 8.13 -1.82 24,6412026 . . . . . 4.76 6.17 -1.41 1.65 2.17 -.51 6.41 8.33 -1.92 25,4872027 . . . . . 4.76 6.29 -1.53 1.67 2.25 -.58 6.43 8.54 -2.11 26,335
2030 . . . . . 4.76 6.61 -1.85 1.69 2.57 -.88 6.45 9.18 -2.74 28,9032035 . . . . . 4.73 6.97 -2.24 1.72 3.02 -1.31 6.45 10.00 -3.55 33,6742040 . . . . . 4.71 7.15 -2.45 1.74 3.46 -1.72 6.44 10.61 -4.17 39,1182045 . . . . . 4.68 7.21 -2.53 1.75 3.85 -2.10 6.43 11.06 -4.63 45,4052050 . . . . . 4.65 7.25 -2.60 1.76 4.15 -2.39 6.41 11.40 -4.99 52,6392055 . . . . . 4.62 7.33 -2.71 1.78 4.35 -2.57 6.40 11.68 -5.28 60,9412060 . . . . . 4.60 7.46 -2.86 1.79 4.48 -2.69 6.40 11.94 -5.54 70,3832065 . . . . . 4.57 7.60 -3.02 1.81 4.56 -2.75 6.38 12.16 -5.78 81,1172070 . . . . . 4.54 7.76 -3.22 1.82 4.60 -2.77 6.37 12.36 -5.99 93,3582075 . . . . . 4.51 7.91 -3.40 1.84 4.62 -2.78 6.35 12.53 -6.18 107,4312080 . . . . . 4.47 7.98 -3.50 1.84 4.60 -2.76 6.31 12.58 -6.26 123,6952085 . . . . . 4.43 7.97 -3.54 1.84 4.54 -2.69 6.27 12.51 -6.23 142,5102090 . . . . . 4.39 7.96 -3.57 1.85 4.47 -2.62 6.24 12.42 -6.19 164,1442095 . . . . . 4.35 7.95 -3.60 1.85 4.41 -2.56 6.20 12.36 -6.16 188,939
Summarized rates: c25-year:
2018-42 . . 5.30 6.68 -1.39 1.70 2.66 -.96 6.99 9.34 -2.3550-year:
2018-67 . . 5.00 6.95 -1.94 1.73 3.35 -1.61 6.74 10.29 -3.5675-year:
2018-92 . . 4.88 7.16 -2.28 1.76 3.63 -1.87 6.64 10.78 -4.14a Income for individual years excludes interest on the trust funds. Interest is implicit in all summarized values.b OASDI benefit payments which were scheduled to be paid on January 3 for some past and future years wereactually paid on December 31 as required by the statutory provision for early delivery of benefit payments whenthe normal payment delivery date is a Saturday, Sunday, or legal public holiday. For comparability with the val-ues for historical years and the projections in this report, all trust fund operations and asset reserves reflect the12 months of benefits scheduled for payment each year.c Summarized rates are calculated on a present-value basis. They include the value of the trust funds onJanuary 1, 2018 and the cost of reaching a target trust fund level equal to 100 percent of annual cost at the endof the period.d Between 0 and 0.005 percent of GDP.
Table VI.G4.—OASDI and HI Annual and Summarized Income, Cost, and Balanceas a Percentage of GDP, Calendar Years 2018-2095 (Cont.)
Calendar year
Percentage of GDPGDP indollars
(billions)OASDI HI Combined
Incomea Costb Balanceb Incomea Cost Balance Incomea Costb Balanceb
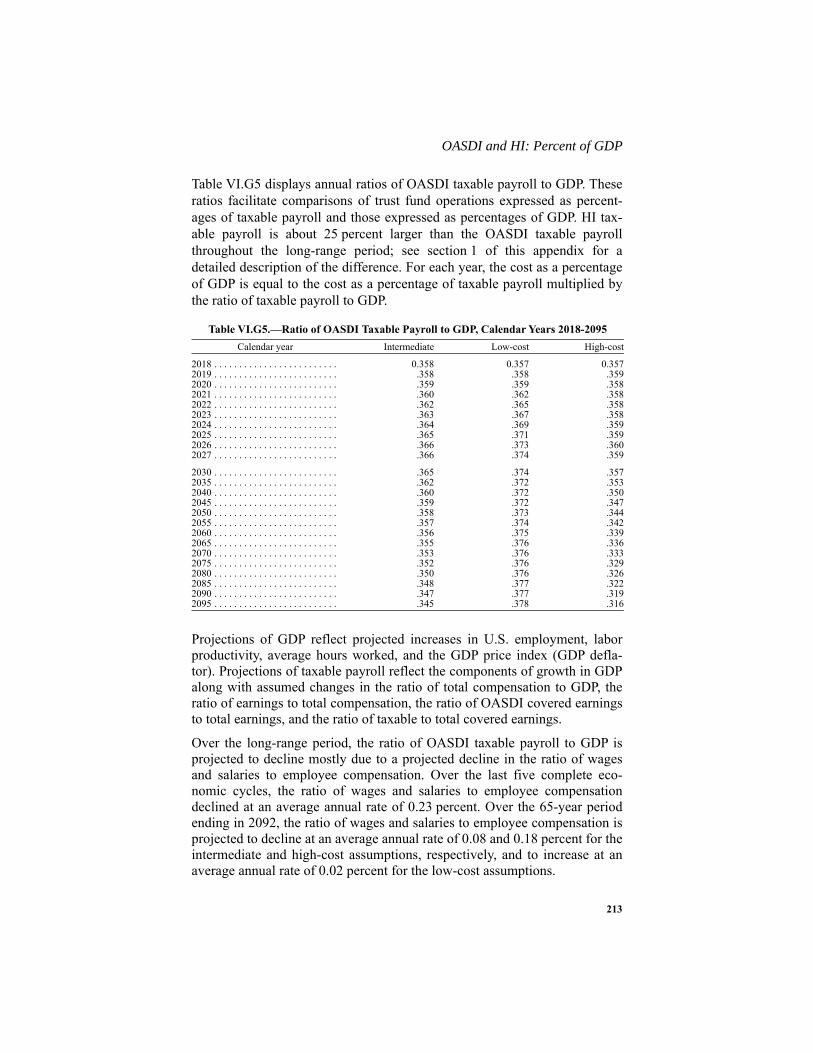
213
OASDI and HI: Percent of GDP
Table VI.G5 displays annual ratios of OASDI taxable payroll to GDP. Theseratios facilitate comparisons of trust fund operations expressed as percent-ages of taxable payroll and those expressed as percentages of GDP. HI tax-able payroll is about 25 percent larger than the OASDI taxable payrollthroughout the long-range period; see section 1 of this appendix for adetailed description of the difference. For each year, the cost as a percentageof GDP is equal to the cost as a percentage of taxable payroll multiplied bythe ratio of taxable payroll to GDP.
Projections of GDP reflect projected increases in U.S. employment, laborproductivity, average hours worked, and the GDP price index (GDP defla-tor). Projections of taxable payroll reflect the components of growth in GDPalong with assumed changes in the ratio of total compensation to GDP, theratio of earnings to total compensation, the ratio of OASDI covered earningsto total earnings, and the ratio of taxable to total covered earnings.
Over the long-range period, the ratio of OASDI taxable payroll to GDP isprojected to decline mostly due to a projected decline in the ratio of wagesand salaries to employee compensation. Over the last five complete eco-nomic cycles, the ratio of wages and salaries to employee compensationdeclined at an average annual rate of 0.23 percent. Over the 65-year periodending in 2092, the ratio of wages and salaries to employee compensation isprojected to decline at an average annual rate of 0.08 and 0.18 percent for theintermediate and high-cost assumptions, respectively, and to increase at anaverage annual rate of 0.02 percent for the low-cost assumptions.
Table VI.G5.—Ratio of OASDI Taxable Payroll to GDP, Calendar Years 2018-2095 Calendar year Intermediate Low-cost High-cost
2018 . . . . . . . . . . . . . . . . . . . . . . . . . 0.358 0.357 0.3572019 . . . . . . . . . . . . . . . . . . . . . . . . . .358 .358 .3592020 . . . . . . . . . . . . . . . . . . . . . . . . . .359 .359 .3582021 . . . . . . . . . . . . . . . . . . . . . . . . . .360 .362 .3582022 . . . . . . . . . . . . . . . . . . . . . . . . . .362 .365 .3582023 . . . . . . . . . . . . . . . . . . . . . . . . . .363 .367 .3582024 . . . . . . . . . . . . . . . . . . . . . . . . . .364 .369 .3592025 . . . . . . . . . . . . . . . . . . . . . . . . . .365 .371 .3592026 . . . . . . . . . . . . . . . . . . . . . . . . . .366 .373 .3602027 . . . . . . . . . . . . . . . . . . . . . . . . . .366 .374 .359
2030 . . . . . . . . . . . . . . . . . . . . . . . . . .365 .374 .3572035 . . . . . . . . . . . . . . . . . . . . . . . . . .362 .372 .3532040 . . . . . . . . . . . . . . . . . . . . . . . . . .360 .372 .3502045 . . . . . . . . . . . . . . . . . . . . . . . . . .359 .372 .3472050 . . . . . . . . . . . . . . . . . . . . . . . . . .358 .373 .3442055 . . . . . . . . . . . . . . . . . . . . . . . . . .357 .374 .3422060 . . . . . . . . . . . . . . . . . . . . . . . . . .356 .375 .3392065 . . . . . . . . . . . . . . . . . . . . . . . . . .355 .376 .3362070 . . . . . . . . . . . . . . . . . . . . . . . . . .353 .376 .3332075 . . . . . . . . . . . . . . . . . . . . . . . . . .352 .376 .3292080 . . . . . . . . . . . . . . . . . . . . . . . . . .350 .376 .3262085 . . . . . . . . . . . . . . . . . . . . . . . . . .348 .377 .3222090 . . . . . . . . . . . . . . . . . . . . . . . . . .347 .377 .3192095 . . . . . . . . . . . . . . . . . . . . . . . . . .345 .378 .316

Appendices
214
3. Estimates in DollarsThis section presents long-range projections, in dollars, of the operations ofthe combined OASI and DI Trust Funds and in some cases the HI TrustFund. Comparing current dollar values over long periods of time is difficultbecause of the effect of inflation. In order to compare dollar values in ameaningful way, table VI.G6 provides several economic series or indiceswhich can be used to adjust current dollars for changes in prices, wages, orother aspects of economic growth during the projection period. Any series ofvalues can be adjusted by dividing the value for each year by the correspond-ing index value for the year.
One of the most common forms of standardization is price indexing, whichuses some measure of change in the prices of consumer goods. The Con-sumer Price Index for Urban Wage Earners and Clerical Workers (CPI-W,hereafter referred to as CPI), published by the Bureau of Labor Statistics,Department of Labor, is one such price index. Consistent with the law, theSocial Security Administration (SSA) uses this index to determine the annualcost-of-living increases for OASDI monthly benefits. The ultimate annualrate of increase in the CPI is assumed to be 3.2, 2.6, and 2.0 percent for thelow-cost, intermediate, and high-cost sets of assumptions, respectively.Table VI.G7 provides CPI-indexed dollar values (those adjusted using theCPI in table VI.G6), which indicate the relative purchasing power of the val-ues over time.
Wage indexing is another type of standardization. It combines the effects ofprice inflation and real-wage growth. The wage index presented here is thenational average wage index, as defined in section 209(k)(1) of the SocialSecurity Act. SSA uses this index to annually adjust the contribution andbenefit base and other earnings-related program amounts. The average wageis assumed to grow by an average rate of 5.0, 3.8, and 2.6 percent under thelow-cost, intermediate, and high-cost assumptions, respectively, between2027 and 2092. Wage-indexed values indicate the level of a series of valuesrelative to the changing standard of living of workers over time.
The taxable payroll series is used as an index to adjust for the effects ofchanges in the number of workers and changes in the proportion of earningsthat are taxable, as well as for the effects of price inflation and real-wagegrowth. The OASDI taxable payroll consists of all earnings subject toOASDI taxation, with an adjustment for the lower effective tax rate on multi-ple-employer excess wages. A series of values, divided by the taxable pay-roll, indicates the percentage of payroll that each value represents, and thus

215
OASDI and HI: Estimates in Dollars
the extent to which the series of values increases or decreases as a percent ofpayroll over time.
The GDP series is used as an index to adjust for the growth in the aggregateamount of goods and services produced in the United States. Values adjustedby GDP (see section 2 of this appendix) indicate their relative share of thetotal output of the economy. No direct assumption is made about growth intaxable payroll or GDP. These series reflect the basic demographic and eco-nomic assumptions, as discussed in sections V.A and V.B, respectively.
Discounting at the rate of interest is another way of standardizing currentdollars. The compound new-issue interest factor shown in table VI.G6increases each year by the assumed effective annual nominal yield for spe-cial public-debt obligations issuable to the trust funds in the 12 months of theprior year. The compound effective trust-fund interest factor shown intable VI.G6 uses the effective annual yield on all currently-held securities inthe combined OASI and DI Trust Funds. The reciprocal of the compoundeffective trust-fund interest factor approximates the cumulative discount fac-tor used to convert nominal dollar values to present values as of the start ofthe valuation period in order to create summarized values for this report.

Appendices
216
Table VI.G6.—Selected Economic Variables, Calendar Years 2017-2095[GDP and taxable payroll in billions]
Calendar yearAdjusted
CPIa Average
wage indexTaxablepayrollb
Grossdomestic
product
Compoundnew-issue
interestfactorc
Compoundeffective
trust-fundinterestfactord
Intermediate:2017 . . . . . . . . 97.82 $50,020.69 $6,956 $19,385 0.9773 0.98532018 . . . . . . . . 100.00 51,894.47 7,261 20,307 1.0000 1.01452019 . . . . . . . . 102.50 54,076.92 7,608 21,262 1.0271 1.04382020 . . . . . . . . 105.17 56,534.16 7,994 22,288 1.0622 1.07362021 . . . . . . . . 107.91 59,089.48 8,407 23,346 1.1045 1.10432022 . . . . . . . . 110.71 61,705.86 8,836 24,440 1.1523 1.13582023 . . . . . . . . 113.59 64,405.95 9,278 25,577 1.2059 1.16852024 . . . . . . . . 116.54 67,191.23 9,739 26,765 1.2652 1.20322025 . . . . . . . . 119.57 70,057.16 10,213 27,978 1.3302 1.24012026 . . . . . . . . 122.68 73,003.92 10,702 29,229 1.3996 1.27972027 . . . . . . . . 125.87 75,908.24 11,185 30,535 1.4741 1.32272030 . . . . . . . . 135.95 85,114.16 12,671 34,731 1.7246 1.48912035 . . . . . . . . 154.56 103,003.87 15,556 42,930 2.2401 1.92032040 . . . . . . . . 175.73 124,375.91 19,117 53,040 2.9098 2.49442045 . . . . . . . . 199.79 149,896.71 23,609 65,746 3.7796 3.24002050 . . . . . . . . 227.15 180,862.31 29,205 81,536 4.9095 4.20862055 . . . . . . . . 258.26 218,269.08 36,090 100,989 6.3772 5.46672060 . . . . . . . . 293.62 263,354.75 44,465 124,750 8.2836 7.10092065 . . . . . . . . 333.83 317,308.93 54,643 153,867 10.7598 9.22372070 . . . . . . . . 379.55 381,537.58 67,102 189,838 13.9764 11.98102075 . . . . . . . . 431.52 458,555.69 82,548 234,618 18.1545 15.56262080 . . . . . . . . 490.61 550,706.66 101,628 290,420 23.5816 20.21492085 . . . . . . . . 557.79 661,504.94 125,189 359,507 30.6311 26.25802090 . . . . . . . . 634.18 795,083.51 154,082 444,282 39.7879 34.10752095 . . . . . . . . 721.02 955,877.40 189,340 548,108 51.6821 44.3036
Low-cost:2017 . . . . . . . . 97.35 50,031.80 6,957 19,393 0.9773 0.98532018 . . . . . . . . 100.00 52,409.41 7,359 20,587 1.0000 1.01472019 . . . . . . . . 103.26 55,687.90 7,887 22,055 1.0355 1.04492020 . . . . . . . . 106.59 59,194.02 8,464 23,558 1.0862 1.07722021 . . . . . . . . 110.01 62,741.89 9,061 25,023 1.1427 1.11182022 . . . . . . . . 113.53 66,191.66 9,671 26,511 1.2052 1.14902023 . . . . . . . . 117.16 69,734.56 10,308 28,064 1.2734 1.18962024 . . . . . . . . 120.91 73,442.74 10,970 29,716 1.3487 1.23452025 . . . . . . . . 124.78 77,392.43 11,668 31,444 1.4318 1.28442026 . . . . . . . . 128.77 81,576.71 12,397 33,238 1.5223 1.34012027 . . . . . . . . 132.89 85,836.60 13,148 35,129 1.6206 1.40262030 . . . . . . . . 146.06 99,756.77 15,464 41,396 1.9584 1.64022035 . . . . . . . . 170.97 128,098.89 20,224 54,308 2.6835 2.23422040 . . . . . . . . 200.14 163,884.74 26,539 71,362 3.6771 3.06132045 . . . . . . . . 234.28 209,144.66 35,118 94,360 5.0385 4.19482050 . . . . . . . . 274.24 267,472.51 46,635 125,033 6.9040 5.74782055 . . . . . . . . 321.02 342,393.10 61,867 165,423 9.4601 7.87592060 . . . . . . . . 375.77 438,260.96 81,810 218,200 12.9626 10.79192065 . . . . . . . . 439.87 560,079.76 107,975 287,519 17.7619 14.78752070 . . . . . . . . 514.90 714,119.46 142,614 379,457 24.3381 20.26252075 . . . . . . . . 602.73 909,999.24 189,018 502,419 33.3491 27.76452080 . . . . . . . . 705.53 1,158,789.71 250,905 666,725 45.6963 38.04402085 . . . . . . . . 825.88 1,476,031.64 332,968 884,116 62.6150 52.12952090 . . . . . . . . 966.75 1,881,273.21 440,861 1,168,855 85.7976 71.42992095 . . . . . . . . 1,131.65 2,398,277.32 582,276 1,541,437 117.5634 97.8762
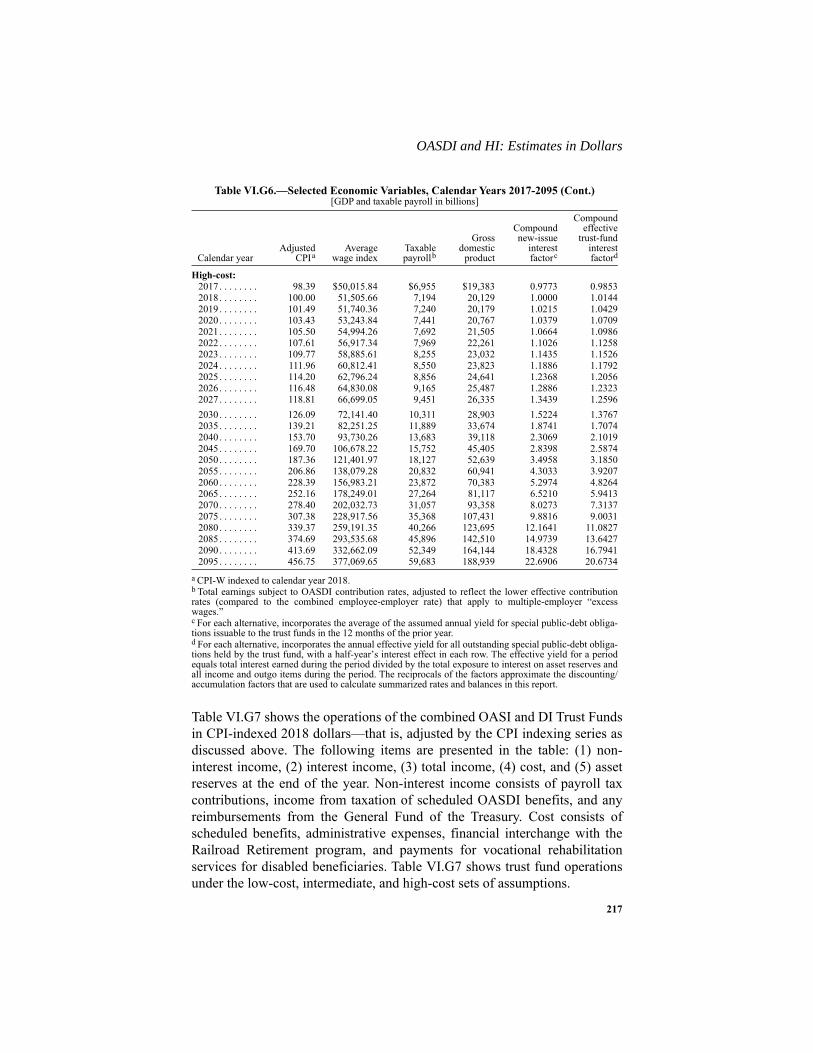
217
OASDI and HI: Estimates in Dollars
Table VI.G7 shows the operations of the combined OASI and DI Trust Fundsin CPI-indexed 2018 dollars—that is, adjusted by the CPI indexing series asdiscussed above. The following items are presented in the table: (1) non-interest income, (2) interest income, (3) total income, (4) cost, and (5) assetreserves at the end of the year. Non-interest income consists of payroll taxcontributions, income from taxation of scheduled OASDI benefits, and anyreimbursements from the General Fund of the Treasury. Cost consists ofscheduled benefits, administrative expenses, financial interchange with theRailroad Retirement program, and payments for vocational rehabilitationservices for disabled beneficiaries. Table VI.G7 shows trust fund operationsunder the low-cost, intermediate, and high-cost sets of assumptions.
High-cost:2017 . . . . . . . . 98.39 $50,015.84 $6,955 $19,383 0.9773 0.98532018 . . . . . . . . 100.00 51,505.66 7,194 20,129 1.0000 1.01442019 . . . . . . . . 101.49 51,740.36 7,240 20,179 1.0215 1.04292020 . . . . . . . . 103.43 53,243.84 7,441 20,767 1.0379 1.07092021 . . . . . . . . 105.50 54,994.26 7,692 21,505 1.0664 1.09862022 . . . . . . . . 107.61 56,917.34 7,969 22,261 1.1026 1.12582023 . . . . . . . . 109.77 58,885.61 8,255 23,032 1.1435 1.15262024 . . . . . . . . 111.96 60,812.41 8,550 23,823 1.1886 1.17922025 . . . . . . . . 114.20 62,796.24 8,856 24,641 1.2368 1.20562026 . . . . . . . . 116.48 64,830.08 9,165 25,487 1.2886 1.23232027 . . . . . . . . 118.81 66,699.05 9,451 26,335 1.3439 1.25962030 . . . . . . . . 126.09 72,141.40 10,311 28,903 1.5224 1.37672035 . . . . . . . . 139.21 82,251.25 11,889 33,674 1.8741 1.70742040 . . . . . . . . 153.70 93,730.26 13,683 39,118 2.3069 2.10192045 . . . . . . . . 169.70 106,678.22 15,752 45,405 2.8398 2.58742050 . . . . . . . . 187.36 121,401.97 18,127 52,639 3.4958 3.18502055 . . . . . . . . 206.86 138,079.28 20,832 60,941 4.3033 3.92072060 . . . . . . . . 228.39 156,983.21 23,872 70,383 5.2974 4.82642065 . . . . . . . . 252.16 178,249.01 27,264 81,117 6.5210 5.94132070 . . . . . . . . 278.40 202,032.73 31,057 93,358 8.0273 7.31372075 . . . . . . . . 307.38 228,917.56 35,368 107,431 9.8816 9.00312080 . . . . . . . . 339.37 259,191.35 40,266 123,695 12.1641 11.08272085 . . . . . . . . 374.69 293,535.68 45,896 142,510 14.9739 13.64272090 . . . . . . . . 413.69 332,662.09 52,349 164,144 18.4328 16.79412095 . . . . . . . . 456.75 377,069.65 59,683 188,939 22.6906 20.6734
a CPI-W indexed to calendar year 2018.b Total earnings subject to OASDI contribution rates, adjusted to reflect the lower effective contributionrates (compared to the combined employee-employer rate) that apply to multiple-employer “excesswages.”c For each alternative, incorporates the average of the assumed annual yield for special public-debt obliga-tions issuable to the trust funds in the 12 months of the prior year.d For each alternative, incorporates the annual effective yield for all outstanding special public-debt obliga-tions held by the trust fund, with a half-year’s interest effect in each row. The effective yield for a periodequals total interest earned during the period divided by the total exposure to interest on asset reserves andall income and outgo items during the period. The reciprocals of the factors approximate the discounting/accumulation factors that are used to calculate summarized rates and balances in this report.
Table VI.G6.—Selected Economic Variables, Calendar Years 2017-2095 (Cont.)[GDP and taxable payroll in billions]
Calendar yearAdjusted
CPIa Average
wage indexTaxablepayrollb
Grossdomestic
product
Compoundnew-issue
interestfactorc
Compoundeffective
trust-fundinterestfactord

Appendices
218
Note: Totals do not necessarily equal the sums of rounded components.
Table VI.G7.—Operations of the Combined OASI and DI Trust Funds,in CPI-indexed 2018 Dollars,a Calendar Years 2018-2095
[In billions]
a CPI-indexed 2018 dollars equal current dollars adjusted by the CPI indexing series in table VI.G6.
Calendar yearNon-interest
incomeInterestincome
Totalincome Costb
b Benefit payments which were scheduled to be paid on January 3 for some past and future years were actu-ally paid on December 31 as required by the statutory provision for early delivery of benefit payments whenthe normal payment delivery date is a Saturday, Sunday, or legal public holiday. For comparability with thevalues for historical years and the projections in this report, all trust fund operations and asset reservesreflect the 12 months of benefits scheduled for payment each year.
Assetreserves at
end of yearb
Intermediate:2018 . . . . . . . . . . . . . $918.0 $83.1 $1,001.1 $1,002.8 $2,890.12019 . . . . . . . . . . . . . 955.3 80.1 1,035.4 1,035.6 2,819.32020 . . . . . . . . . . . . . 980.0 77.8 1,057.8 1,073.6 2,732.02021 . . . . . . . . . . . . . 1,006.6 74.9 1,081.5 1,112.0 2,632.32022 . . . . . . . . . . . . . 1,033.2 72.1 1,105.3 1,152.3 2,518.62023 . . . . . . . . . . . . . 1,059.1 70.2 1,129.3 1,194.3 2,389.92024 . . . . . . . . . . . . . 1,085.9 68.6 1,154.5 1,237.1 2,246.72025 . . . . . . . . . . . . . 1,111.0 66.4 1,177.4 1,279.8 2,087.42026 . . . . . . . . . . . . . 1,145.6 64.5 1,210.1 1,322.2 1,922.42027 . . . . . . . . . . . . . 1,168.9 62.2 1,231.1 1,365.3 1,739.5
2030c . . . . . . . . . . . .
c The combined OASI and DI Trust Funds become depleted in 2034 under the intermediate assumptions andin 2030 under the high-cost assumptions, so estimates for later years are not shown.
1,230.5 54.7 1,285.2 1,489.7 1,083.1
Low-cost: 2018 . . . . . . . . . . . . . 925.7 84.3 1,010.0 1,000.1 2,901.72019 . . . . . . . . . . . . . 981.1 85.0 1,066.1 1,028.3 2,847.72020 . . . . . . . . . . . . . 1,021.0 86.8 1,107.8 1,064.8 2,801.72021 . . . . . . . . . . . . . 1,060.6 88.7 1,149.3 1,099.9 2,764.32022 . . . . . . . . . . . . . 1,098.6 91.8 1,190.4 1,136.8 2,732.22023 . . . . . . . . . . . . . 1,135.6 96.6 1,232.2 1,175.5 2,704.22024 . . . . . . . . . . . . . 1,173.2 102.3 1,275.5 1,215.2 2,680.62025 . . . . . . . . . . . . . 1,209.8 108.5 1,318.3 1,255.0 2,660.82026 . . . . . . . . . . . . . 1,255.9 116.4 1,372.3 1,294.9 2,655.62027 . . . . . . . . . . . . . 1,291.6 124.7 1,416.4 1,335.9 2,653.7
2030 . . . . . . . . . . . . . 1,386.0 149.7 1,535.7 1,462.5 2,634.12035 . . . . . . . . . . . . . 1,552.0 160.7 1,712.7 1,662.8 2,537.92040 . . . . . . . . . . . . . 1,740.0 151.0 1,891.0 1,841.4 2,379.92045 . . . . . . . . . . . . . 1,964.0 150.9 2,114.9 2,016.1 2,397.02050 . . . . . . . . . . . . . 2,225.8 167.6 2,393.4 2,233.5 2,686.52055 . . . . . . . . . . . . . 2,522.1 199.1 2,721.2 2,508.6 3,206.92060 . . . . . . . . . . . . . 2,850.8 238.2 3,089.0 2,844.6 3,834.22065 . . . . . . . . . . . . . 3,215.8 280.4 3,496.2 3,221.1 4,511.12070 . . . . . . . . . . . . . 3,629.9 325.7 3,955.6 3,649.1 5,236.42075 . . . . . . . . . . . . . 4,109.8 376.9 4,486.7 4,120.1 6,067.12080 . . . . . . . . . . . . . 4,656.0 449.5 5,105.5 4,596.3 7,277.92085 . . . . . . . . . . . . . 5,272.8 564.9 5,837.7 5,121.0 9,201.22090 . . . . . . . . . . . . . 5,964.5 720.8 6,685.3 5,802.1 11,742.02095 . . . . . . . . . . . . . 6,737.6 888.9 7,626.5 6,665.2 14,431.2
High-cost:2018 . . . . . . . . . . . . . 912.7 82.4 995.1 1,005.6 2,881.32019 . . . . . . . . . . . . . 921.1 76.7 997.8 1,043.6 2,793.32020 . . . . . . . . . . . . . 930.3 70.5 1,000.8 1,081.9 2,659.42021 . . . . . . . . . . . . . 945.9 64.3 1,010.2 1,123.7 2,493.82022 . . . . . . . . . . . . . 963.1 57.3 1,020.3 1,167.2 2,298.02023 . . . . . . . . . . . . . 980.1 50.5 1,030.5 1,212.5 2,071.02024 . . . . . . . . . . . . . 998.0 43.7 1,041.7 1,258.5 1,813.52025 . . . . . . . . . . . . . 1,015.0 36.6 1,051.5 1,304.2 1,525.32026 . . . . . . . . . . . . . 1,041.4 30.3 1,071.7 1,349.3 1,217.82027c . . . . . . . . . . . . 1,055.3 23.2 1,078.6 1,394.5 878.0
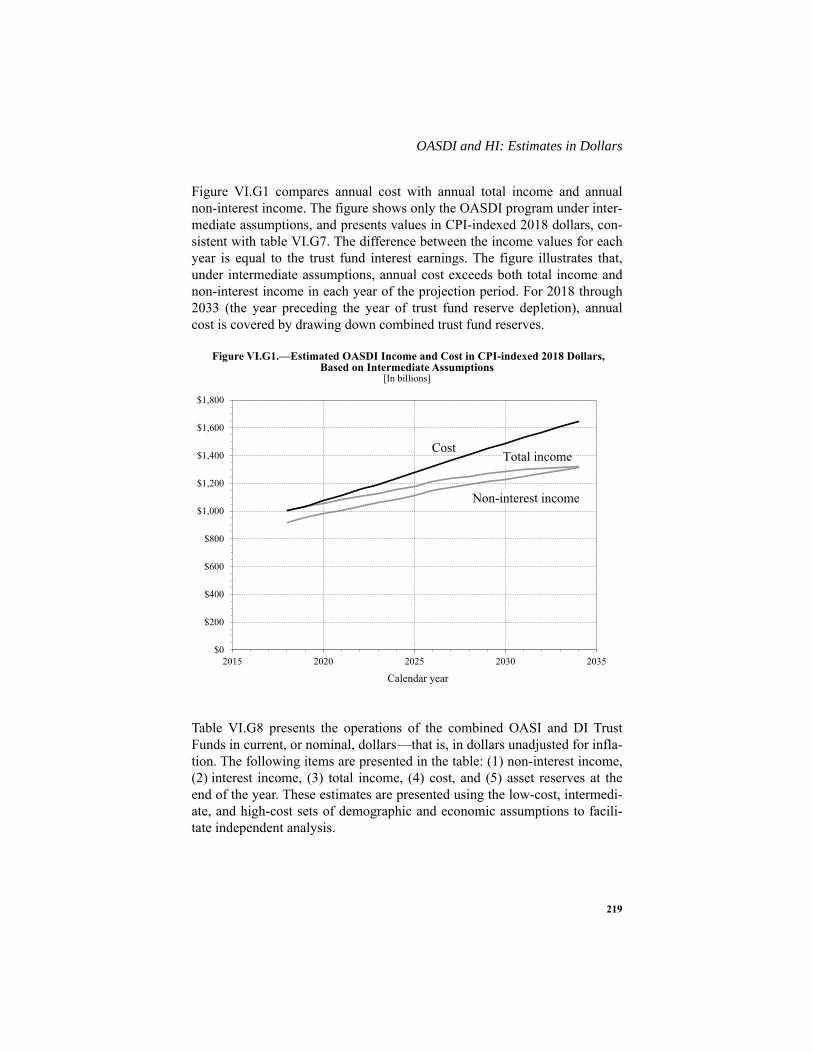
219
OASDI and HI: Estimates in Dollars
Figure VI.G1 compares annual cost with annual total income and annualnon-interest income. The figure shows only the OASDI program under inter-mediate assumptions, and presents values in CPI-indexed 2018 dollars, con-sistent with table VI.G7. The difference between the income values for eachyear is equal to the trust fund interest earnings. The figure illustrates that,under intermediate assumptions, annual cost exceeds both total income andnon-interest income in each year of the projection period. For 2018 through2033 (the year preceding the year of trust fund reserve depletion), annualcost is covered by drawing down combined trust fund reserves.
Table VI.G8 presents the operations of the combined OASI and DI TrustFunds in current, or nominal, dollars—that is, in dollars unadjusted for infla-tion. The following items are presented in the table: (1) non-interest income,(2) interest income, (3) total income, (4) cost, and (5) asset reserves at theend of the year. These estimates are presented using the low-cost, intermedi-ate, and high-cost sets of demographic and economic assumptions to facili-tate independent analysis.
Figure VI.G1.—Estimated OASDI Income and Cost in CPI-indexed 2018 Dollars,Based on Intermediate Assumptions
[In billions]
$0
$200
$400
$600
$800
$1,000
$1,200
$1,400
$1,600
$1,800
2015 2020 2025 2030 2035
Calendar year
CostTotal income
Non-interest income
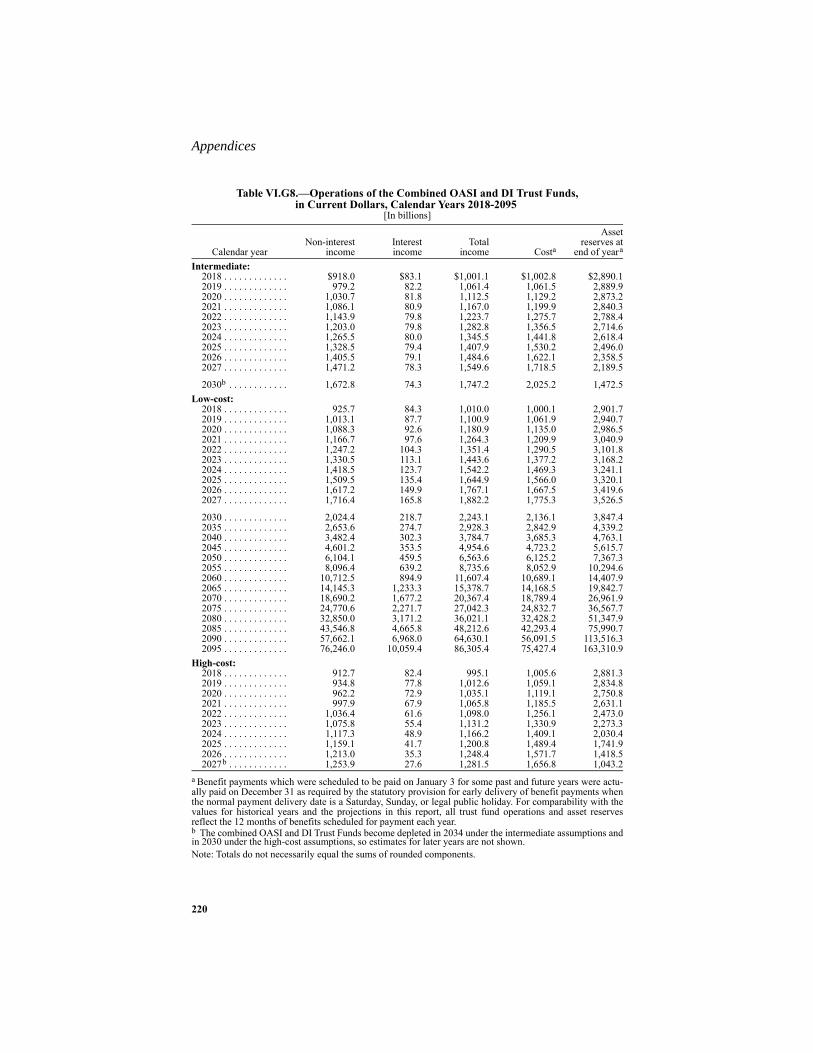
Appendices
220
Note: Totals do not necessarily equal the sums of rounded components.
Table VI.G8.—Operations of the Combined OASI and DI Trust Funds, in Current Dollars, Calendar Years 2018-2095
[In billions]
Calendar yearNon-interest
incomeInterestincome
Totalincome Costa
a Benefit payments which were scheduled to be paid on January 3 for some past and future years were actu-ally paid on December 31 as required by the statutory provision for early delivery of benefit payments whenthe normal payment delivery date is a Saturday, Sunday, or legal public holiday. For comparability with thevalues for historical years and the projections in this report, all trust fund operations and asset reservesreflect the 12 months of benefits scheduled for payment each year.
Assetreserves at
end of yeara
Intermediate:2018 . . . . . . . . . . . . . $918.0 $83.1 $1,001.1 $1,002.8 $2,890.12019 . . . . . . . . . . . . . 979.2 82.2 1,061.4 1,061.5 2,889.92020 . . . . . . . . . . . . . 1,030.7 81.8 1,112.5 1,129.2 2,873.22021 . . . . . . . . . . . . . 1,086.1 80.9 1,167.0 1,199.9 2,840.32022 . . . . . . . . . . . . . 1,143.9 79.8 1,223.7 1,275.7 2,788.42023 . . . . . . . . . . . . . 1,203.0 79.8 1,282.8 1,356.5 2,714.62024 . . . . . . . . . . . . . 1,265.5 80.0 1,345.5 1,441.8 2,618.42025 . . . . . . . . . . . . . 1,328.5 79.4 1,407.9 1,530.2 2,496.02026 . . . . . . . . . . . . . 1,405.5 79.1 1,484.6 1,622.1 2,358.52027 . . . . . . . . . . . . . 1,471.2 78.3 1,549.6 1,718.5 2,189.5
2030b . . . . . . . . . . . .
b The combined OASI and DI Trust Funds become depleted in 2034 under the intermediate assumptions andin 2030 under the high-cost assumptions, so estimates for later years are not shown.
1,672.8 74.3 1,747.2 2,025.2 1,472.5Low-cost:
2018 . . . . . . . . . . . . . 925.7 84.3 1,010.0 1,000.1 2,901.72019 . . . . . . . . . . . . . 1,013.1 87.7 1,100.9 1,061.9 2,940.72020 . . . . . . . . . . . . . 1,088.3 92.6 1,180.9 1,135.0 2,986.52021 . . . . . . . . . . . . . 1,166.7 97.6 1,264.3 1,209.9 3,040.92022 . . . . . . . . . . . . . 1,247.2 104.3 1,351.4 1,290.5 3,101.82023 . . . . . . . . . . . . . 1,330.5 113.1 1,443.6 1,377.2 3,168.22024 . . . . . . . . . . . . . 1,418.5 123.7 1,542.2 1,469.3 3,241.12025 . . . . . . . . . . . . . 1,509.5 135.4 1,644.9 1,566.0 3,320.12026 . . . . . . . . . . . . . 1,617.2 149.9 1,767.1 1,667.5 3,419.62027 . . . . . . . . . . . . . 1,716.4 165.8 1,882.2 1,775.3 3,526.5
2030 . . . . . . . . . . . . . 2,024.4 218.7 2,243.1 2,136.1 3,847.42035 . . . . . . . . . . . . . 2,653.6 274.7 2,928.3 2,842.9 4,339.22040 . . . . . . . . . . . . . 3,482.4 302.3 3,784.7 3,685.3 4,763.12045 . . . . . . . . . . . . . 4,601.2 353.5 4,954.6 4,723.2 5,615.72050 . . . . . . . . . . . . . 6,104.1 459.5 6,563.6 6,125.2 7,367.32055 . . . . . . . . . . . . . 8,096.4 639.2 8,735.6 8,052.9 10,294.62060 . . . . . . . . . . . . . 10,712.5 894.9 11,607.4 10,689.1 14,407.92065 . . . . . . . . . . . . . 14,145.3 1,233.3 15,378.7 14,168.5 19,842.72070 . . . . . . . . . . . . . 18,690.2 1,677.2 20,367.4 18,789.4 26,961.92075 . . . . . . . . . . . . . 24,770.6 2,271.7 27,042.3 24,832.7 36,567.72080 . . . . . . . . . . . . . 32,850.0 3,171.2 36,021.1 32,428.2 51,347.92085 . . . . . . . . . . . . . 43,546.8 4,665.8 48,212.6 42,293.4 75,990.72090 . . . . . . . . . . . . . 57,662.1 6,968.0 64,630.1 56,091.5 113,516.32095 . . . . . . . . . . . . . 76,246.0 10,059.4 86,305.4 75,427.4 163,310.9
High-cost:2018 . . . . . . . . . . . . . 912.7 82.4 995.1 1,005.6 2,881.32019 . . . . . . . . . . . . . 934.8 77.8 1,012.6 1,059.1 2,834.82020 . . . . . . . . . . . . . 962.2 72.9 1,035.1 1,119.1 2,750.82021 . . . . . . . . . . . . . 997.9 67.9 1,065.8 1,185.5 2,631.12022 . . . . . . . . . . . . . 1,036.4 61.6 1,098.0 1,256.1 2,473.02023 . . . . . . . . . . . . . 1,075.8 55.4 1,131.2 1,330.9 2,273.32024 . . . . . . . . . . . . . 1,117.3 48.9 1,166.2 1,409.1 2,030.42025 . . . . . . . . . . . . . 1,159.1 41.7 1,200.8 1,489.4 1,741.92026 . . . . . . . . . . . . . 1,213.0 35.3 1,248.4 1,571.7 1,418.52027b . . . . . . . . . . . . 1,253.9 27.6 1,281.5 1,656.8 1,043.2
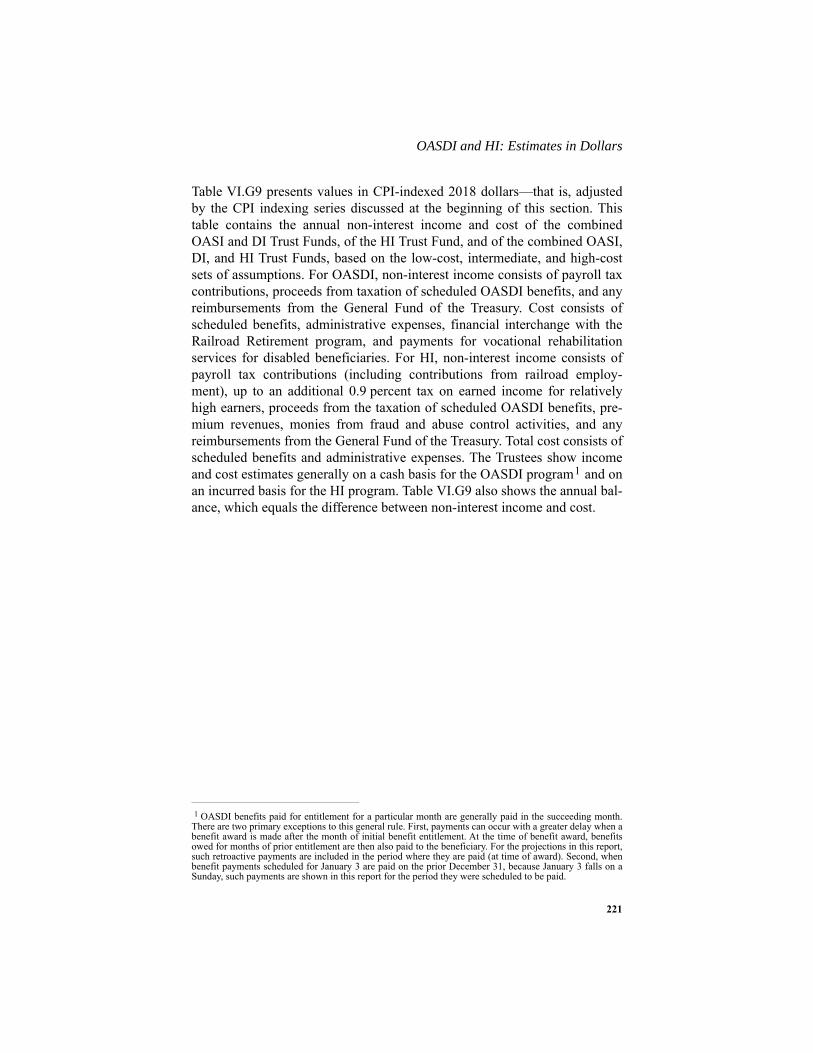
221
OASDI and HI: Estimates in Dollars
Table VI.G9 presents values in CPI-indexed 2018 dollars—that is, adjustedby the CPI indexing series discussed at the beginning of this section. Thistable contains the annual non-interest income and cost of the combinedOASI and DI Trust Funds, of the HI Trust Fund, and of the combined OASI,DI, and HI Trust Funds, based on the low-cost, intermediate, and high-costsets of assumptions. For OASDI, non-interest income consists of payroll taxcontributions, proceeds from taxation of scheduled OASDI benefits, and anyreimbursements from the General Fund of the Treasury. Cost consists ofscheduled benefits, administrative expenses, financial interchange with theRailroad Retirement program, and payments for vocational rehabilitationservices for disabled beneficiaries. For HI, non-interest income consists ofpayroll tax contributions (including contributions from railroad employ-ment), up to an additional 0.9 percent tax on earned income for relativelyhigh earners, proceeds from the taxation of scheduled OASDI benefits, pre-mium revenues, monies from fraud and abuse control activities, and anyreimbursements from the General Fund of the Treasury. Total cost consists ofscheduled benefits and administrative expenses. The Trustees show incomeand cost estimates generally on a cash basis for the OASDI program1 and onan incurred basis for the HI program. Table VI.G9 also shows the annual bal-ance, which equals the difference between non-interest income and cost.
1 OASDI benefits paid for entitlement for a particular month are generally paid in the succeeding month.There are two primary exceptions to this general rule. First, payments can occur with a greater delay when abenefit award is made after the month of initial benefit entitlement. At the time of benefit award, benefitsowed for months of prior entitlement are then also paid to the beneficiary. For the projections in this report,such retroactive payments are included in the period where they are paid (at time of award). Second, whenbenefit payments scheduled for January 3 are paid on the prior December 31, because January 3 falls on aSunday, such payments are shown in this report for the period they were scheduled to be paid.
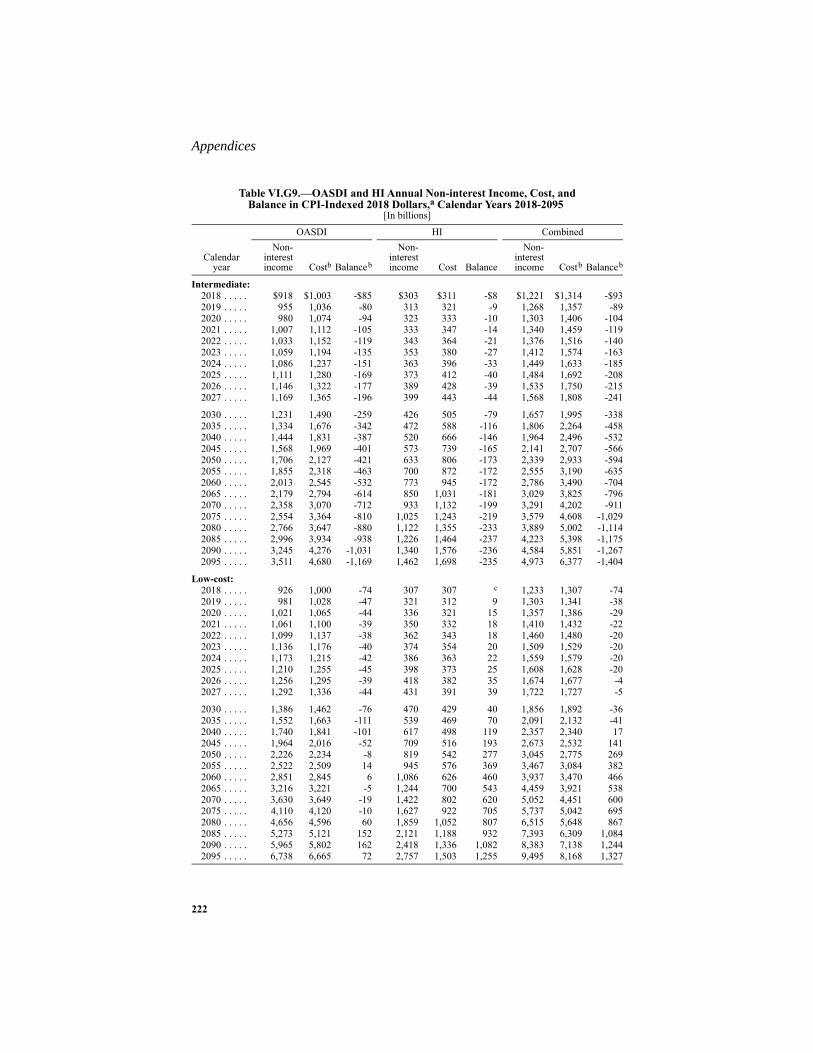
Appendices
222
Table VI.G9.—OASDI and HI Annual Non-interest Income, Cost, andBalance in CPI-Indexed 2018 Dollars,a Calendar Years 2018-2095
[In billions]
Calendaryear
OASDI HI CombinedNon-
interestincome Costb Balanceb
Non-interestincome Cost Balance
Non-interestincome Costb Balanceb
Intermediate:2018 . . . . . $918 $1,003 -$85 $303 $311 -$8 $1,221 $1,314 -$932019 . . . . . 955 1,036 -80 313 321 -9 1,268 1,357 -892020 . . . . . 980 1,074 -94 323 333 -10 1,303 1,406 -1042021 . . . . . 1,007 1,112 -105 333 347 -14 1,340 1,459 -1192022 . . . . . 1,033 1,152 -119 343 364 -21 1,376 1,516 -1402023 . . . . . 1,059 1,194 -135 353 380 -27 1,412 1,574 -1632024 . . . . . 1,086 1,237 -151 363 396 -33 1,449 1,633 -1852025 . . . . . 1,111 1,280 -169 373 412 -40 1,484 1,692 -2082026 . . . . . 1,146 1,322 -177 389 428 -39 1,535 1,750 -2152027 . . . . . 1,169 1,365 -196 399 443 -44 1,568 1,808 -241
2030 . . . . . 1,231 1,490 -259 426 505 -79 1,657 1,995 -3382035 . . . . . 1,334 1,676 -342 472 588 -116 1,806 2,264 -4582040 . . . . . 1,444 1,831 -387 520 666 -146 1,964 2,496 -5322045 . . . . . 1,568 1,969 -401 573 739 -165 2,141 2,707 -5662050 . . . . . 1,706 2,127 -421 633 806 -173 2,339 2,933 -5942055 . . . . . 1,855 2,318 -463 700 872 -172 2,555 3,190 -6352060 . . . . . 2,013 2,545 -532 773 945 -172 2,786 3,490 -7042065 . . . . . 2,179 2,794 -614 850 1,031 -181 3,029 3,825 -7962070 . . . . . 2,358 3,070 -712 933 1,132 -199 3,291 4,202 -9112075 . . . . . 2,554 3,364 -810 1,025 1,243 -219 3,579 4,608 -1,0292080 . . . . . 2,766 3,647 -880 1,122 1,355 -233 3,889 5,002 -1,1142085 . . . . . 2,996 3,934 -938 1,226 1,464 -237 4,223 5,398 -1,1752090 . . . . . 3,245 4,276 -1,031 1,340 1,576 -236 4,584 5,851 -1,2672095 . . . . . 3,511 4,680 -1,169 1,462 1,698 -235 4,973 6,377 -1,404
Low-cost:2018 . . . . . 926 1,000 -74 307 307 c 1,233 1,307 -742019 . . . . . 981 1,028 -47 321 312 9 1,303 1,341 -382020 . . . . . 1,021 1,065 -44 336 321 15 1,357 1,386 -292021 . . . . . 1,061 1,100 -39 350 332 18 1,410 1,432 -222022 . . . . . 1,099 1,137 -38 362 343 18 1,460 1,480 -202023 . . . . . 1,136 1,176 -40 374 354 20 1,509 1,529 -202024 . . . . . 1,173 1,215 -42 386 363 22 1,559 1,579 -202025 . . . . . 1,210 1,255 -45 398 373 25 1,608 1,628 -202026 . . . . . 1,256 1,295 -39 418 382 35 1,674 1,677 -42027 . . . . . 1,292 1,336 -44 431 391 39 1,722 1,727 -5
2030 . . . . . 1,386 1,462 -76 470 429 40 1,856 1,892 -362035 . . . . . 1,552 1,663 -111 539 469 70 2,091 2,132 -412040 . . . . . 1,740 1,841 -101 617 498 119 2,357 2,340 172045 . . . . . 1,964 2,016 -52 709 516 193 2,673 2,532 1412050 . . . . . 2,226 2,234 -8 819 542 277 3,045 2,775 2692055 . . . . . 2,522 2,509 14 945 576 369 3,467 3,084 3822060 . . . . . 2,851 2,845 6 1,086 626 460 3,937 3,470 4662065 . . . . . 3,216 3,221 -5 1,244 700 543 4,459 3,921 5382070 . . . . . 3,630 3,649 -19 1,422 802 620 5,052 4,451 6002075 . . . . . 4,110 4,120 -10 1,627 922 705 5,737 5,042 6952080 . . . . . 4,656 4,596 60 1,859 1,052 807 6,515 5,648 8672085 . . . . . 5,273 5,121 152 2,121 1,188 932 7,393 6,309 1,0842090 . . . . . 5,965 5,802 162 2,418 1,336 1,082 8,383 7,138 1,2442095 . . . . . 6,738 6,665 72 2,757 1,503 1,255 9,495 8,168 1,327
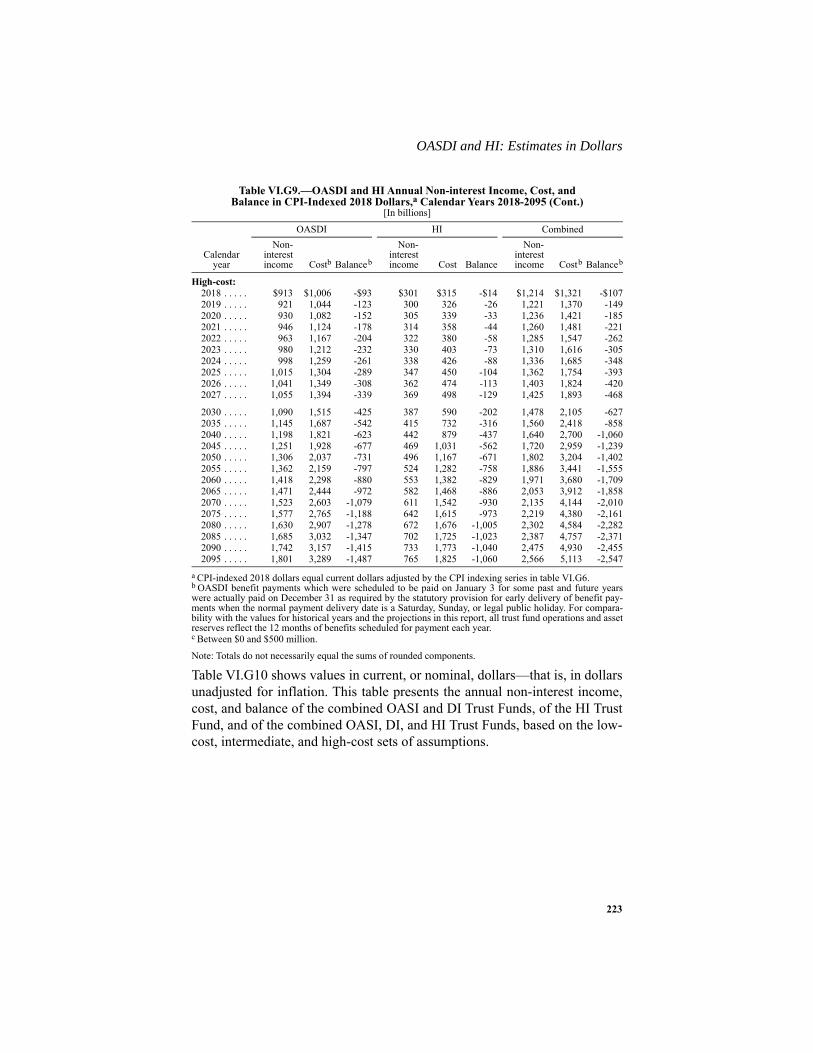
223
OASDI and HI: Estimates in Dollars
Note: Totals do not necessarily equal the sums of rounded components.
Table VI.G10 shows values in current, or nominal, dollars—that is, in dollarsunadjusted for inflation. This table presents the annual non-interest income,cost, and balance of the combined OASI and DI Trust Funds, of the HI TrustFund, and of the combined OASI, DI, and HI Trust Funds, based on the low-cost, intermediate, and high-cost sets of assumptions.
High-cost:2018 . . . . . $913 $1,006 -$93 $301 $315 -$14 $1,214 $1,321 -$1072019 . . . . . 921 1,044 -123 300 326 -26 1,221 1,370 -1492020 . . . . . 930 1,082 -152 305 339 -33 1,236 1,421 -1852021 . . . . . 946 1,124 -178 314 358 -44 1,260 1,481 -2212022 . . . . . 963 1,167 -204 322 380 -58 1,285 1,547 -2622023 . . . . . 980 1,212 -232 330 403 -73 1,310 1,616 -3052024 . . . . . 998 1,259 -261 338 426 -88 1,336 1,685 -3482025 . . . . . 1,015 1,304 -289 347 450 -104 1,362 1,754 -3932026 . . . . . 1,041 1,349 -308 362 474 -113 1,403 1,824 -4202027 . . . . . 1,055 1,394 -339 369 498 -129 1,425 1,893 -468
2030 . . . . . 1,090 1,515 -425 387 590 -202 1,478 2,105 -6272035 . . . . . 1,145 1,687 -542 415 732 -316 1,560 2,418 -8582040 . . . . . 1,198 1,821 -623 442 879 -437 1,640 2,700 -1,0602045 . . . . . 1,251 1,928 -677 469 1,031 -562 1,720 2,959 -1,2392050 . . . . . 1,306 2,037 -731 496 1,167 -671 1,802 3,204 -1,4022055 . . . . . 1,362 2,159 -797 524 1,282 -758 1,886 3,441 -1,5552060 . . . . . 1,418 2,298 -880 553 1,382 -829 1,971 3,680 -1,7092065 . . . . . 1,471 2,444 -972 582 1,468 -886 2,053 3,912 -1,8582070 . . . . . 1,523 2,603 -1,079 611 1,542 -930 2,135 4,144 -2,0102075 . . . . . 1,577 2,765 -1,188 642 1,615 -973 2,219 4,380 -2,1612080 . . . . . 1,630 2,907 -1,278 672 1,676 -1,005 2,302 4,584 -2,2822085 . . . . . 1,685 3,032 -1,347 702 1,725 -1,023 2,387 4,757 -2,3712090 . . . . . 1,742 3,157 -1,415 733 1,773 -1,040 2,475 4,930 -2,4552095 . . . . . 1,801 3,289 -1,487 765 1,825 -1,060 2,566 5,113 -2,547
a CPI-indexed 2018 dollars equal current dollars adjusted by the CPI indexing series in table VI.G6.b OASDI benefit payments which were scheduled to be paid on January 3 for some past and future yearswere actually paid on December 31 as required by the statutory provision for early delivery of benefit pay-ments when the normal payment delivery date is a Saturday, Sunday, or legal public holiday. For compara-bility with the values for historical years and the projections in this report, all trust fund operations and assetreserves reflect the 12 months of benefits scheduled for payment each year.c Between $0 and $500 million.
Table VI.G9.—OASDI and HI Annual Non-interest Income, Cost, andBalance in CPI-Indexed 2018 Dollars,a Calendar Years 2018-2095 (Cont.)
[In billions]
Calendaryear
OASDI HI CombinedNon-
interestincome Costb Balanceb
Non-interestincome Cost Balance
Non-interestincome Costb Balanceb
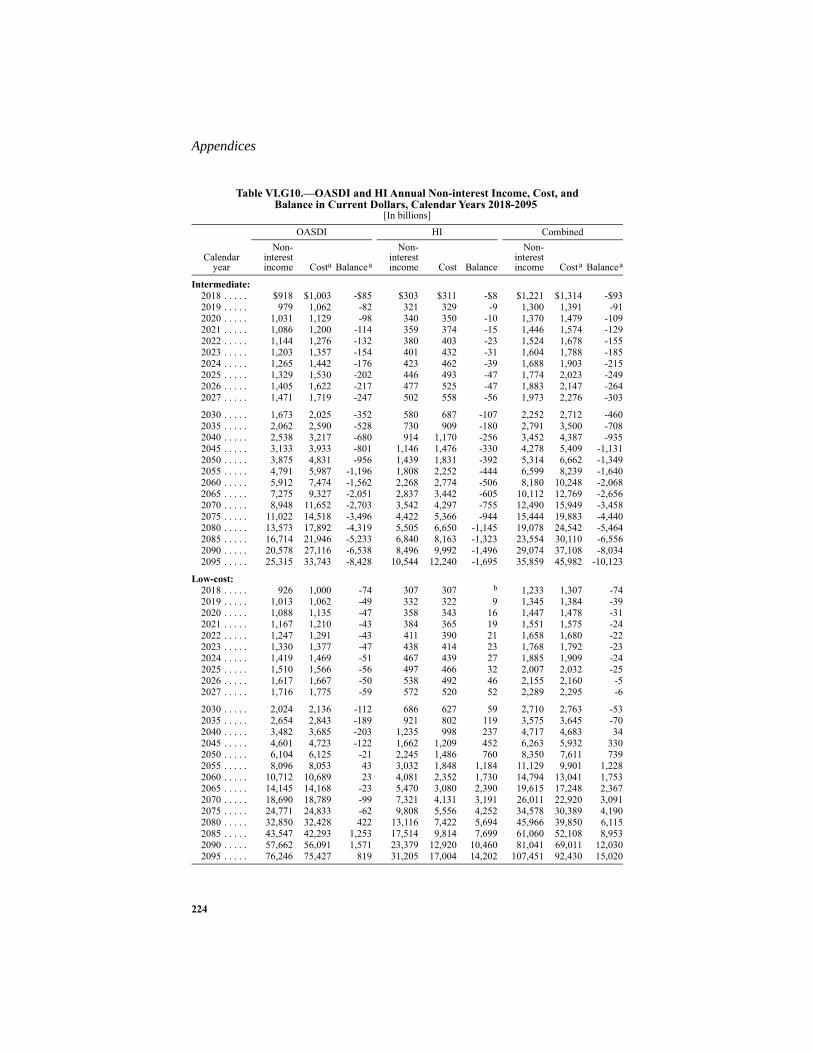
Appendices
224
Table VI.G10.—OASDI and HI Annual Non-interest Income, Cost, andBalance in Current Dollars, Calendar Years 2018-2095
[In billions]
Calendaryear
OASDI HI CombinedNon-
interestincome Costa Balancea
Non-interestincome Cost Balance
Non-interestincome Costa Balancea
Intermediate:2018 . . . . . $918 $1,003 -$85 $303 $311 -$8 $1,221 $1,314 -$932019 . . . . . 979 1,062 -82 321 329 -9 1,300 1,391 -912020 . . . . . 1,031 1,129 -98 340 350 -10 1,370 1,479 -1092021 . . . . . 1,086 1,200 -114 359 374 -15 1,446 1,574 -1292022 . . . . . 1,144 1,276 -132 380 403 -23 1,524 1,678 -1552023 . . . . . 1,203 1,357 -154 401 432 -31 1,604 1,788 -1852024 . . . . . 1,265 1,442 -176 423 462 -39 1,688 1,903 -2152025 . . . . . 1,329 1,530 -202 446 493 -47 1,774 2,023 -2492026 . . . . . 1,405 1,622 -217 477 525 -47 1,883 2,147 -2642027 . . . . . 1,471 1,719 -247 502 558 -56 1,973 2,276 -303
2030 . . . . . 1,673 2,025 -352 580 687 -107 2,252 2,712 -4602035 . . . . . 2,062 2,590 -528 730 909 -180 2,791 3,500 -7082040 . . . . . 2,538 3,217 -680 914 1,170 -256 3,452 4,387 -9352045 . . . . . 3,133 3,933 -801 1,146 1,476 -330 4,278 5,409 -1,1312050 . . . . . 3,875 4,831 -956 1,439 1,831 -392 5,314 6,662 -1,3492055 . . . . . 4,791 5,987 -1,196 1,808 2,252 -444 6,599 8,239 -1,6402060 . . . . . 5,912 7,474 -1,562 2,268 2,774 -506 8,180 10,248 -2,0682065 . . . . . 7,275 9,327 -2,051 2,837 3,442 -605 10,112 12,769 -2,6562070 . . . . . 8,948 11,652 -2,703 3,542 4,297 -755 12,490 15,949 -3,4582075 . . . . . 11,022 14,518 -3,496 4,422 5,366 -944 15,444 19,883 -4,4402080 . . . . . 13,573 17,892 -4,319 5,505 6,650 -1,145 19,078 24,542 -5,4642085 . . . . . 16,714 21,946 -5,233 6,840 8,163 -1,323 23,554 30,110 -6,5562090 . . . . . 20,578 27,116 -6,538 8,496 9,992 -1,496 29,074 37,108 -8,0342095 . . . . . 25,315 33,743 -8,428 10,544 12,240 -1,695 35,859 45,982 -10,123
Low-cost:2018 . . . . . 926 1,000 -74 307 307 b 1,233 1,307 -742019 . . . . . 1,013 1,062 -49 332 322 9 1,345 1,384 -392020 . . . . . 1,088 1,135 -47 358 343 16 1,447 1,478 -312021 . . . . . 1,167 1,210 -43 384 365 19 1,551 1,575 -242022 . . . . . 1,247 1,291 -43 411 390 21 1,658 1,680 -222023 . . . . . 1,330 1,377 -47 438 414 23 1,768 1,792 -232024 . . . . . 1,419 1,469 -51 467 439 27 1,885 1,909 -242025 . . . . . 1,510 1,566 -56 497 466 32 2,007 2,032 -252026 . . . . . 1,617 1,667 -50 538 492 46 2,155 2,160 -52027 . . . . . 1,716 1,775 -59 572 520 52 2,289 2,295 -6
2030 . . . . . 2,024 2,136 -112 686 627 59 2,710 2,763 -532035 . . . . . 2,654 2,843 -189 921 802 119 3,575 3,645 -702040 . . . . . 3,482 3,685 -203 1,235 998 237 4,717 4,683 342045 . . . . . 4,601 4,723 -122 1,662 1,209 452 6,263 5,932 3302050 . . . . . 6,104 6,125 -21 2,245 1,486 760 8,350 7,611 7392055 . . . . . 8,096 8,053 43 3,032 1,848 1,184 11,129 9,901 1,2282060 . . . . . 10,712 10,689 23 4,081 2,352 1,730 14,794 13,041 1,7532065 . . . . . 14,145 14,168 -23 5,470 3,080 2,390 19,615 17,248 2,3672070 . . . . . 18,690 18,789 -99 7,321 4,131 3,191 26,011 22,920 3,0912075 . . . . . 24,771 24,833 -62 9,808 5,556 4,252 34,578 30,389 4,1902080 . . . . . 32,850 32,428 422 13,116 7,422 5,694 45,966 39,850 6,1152085 . . . . . 43,547 42,293 1,253 17,514 9,814 7,699 61,060 52,108 8,9532090 . . . . . 57,662 56,091 1,571 23,379 12,920 10,460 81,041 69,011 12,0302095 . . . . . 76,246 75,427 819 31,205 17,004 14,202 107,451 92,430 15,020

225
OASDI and HI: Estimates in Dollars
High-cost:2018 . . . . . $913 $1,006 -$93 $301 $315 -$14 $1,214 $1,321 -$1072019 . . . . . 935 1,059 -124 305 331 -27 1,239 1,390 -1512020 . . . . . 962 1,119 -157 316 350 -34 1,278 1,469 -1912021 . . . . . 998 1,186 -188 331 377 -46 1,329 1,563 -2342022 . . . . . 1,036 1,256 -220 347 409 -62 1,383 1,665 -2822023 . . . . . 1,076 1,331 -255 363 443 -80 1,438 1,773 -3352024 . . . . . 1,117 1,409 -292 379 477 -98 1,496 1,886 -3902025 . . . . . 1,159 1,489 -330 396 514 -118 1,555 2,004 -4492026 . . . . . 1,213 1,572 -359 421 552 -131 1,634 2,124 -4902027 . . . . . 1,254 1,657 -403 439 592 -153 1,693 2,249 -556
2030 . . . . . 1,375 1,910 -536 488 743 -255 1,863 2,654 -7912035 . . . . . 1,594 2,348 -754 578 1,018 -440 2,172 3,366 -1,1942040 . . . . . 1,841 2,798 -957 679 1,352 -672 2,521 4,150 -1,6292045 . . . . . 2,123 3,272 -1,149 795 1,749 -954 2,918 5,021 -2,1032050 . . . . . 2,447 3,816 -1,369 929 2,186 -1,258 3,376 6,002 -2,6272055 . . . . . 2,818 4,467 -1,649 1,084 2,652 -1,568 3,902 7,118 -3,2172060 . . . . . 3,239 5,248 -2,010 1,263 3,156 -1,893 4,501 8,404 -3,9032065 . . . . . 3,710 6,162 -2,452 1,467 3,702 -2,234 5,178 9,864 -4,6862070 . . . . . 4,241 7,246 -3,005 1,702 4,292 -2,590 5,943 11,538 -5,5952075 . . . . . 4,847 8,499 -3,652 1,972 4,963 -2,991 6,819 13,462 -6,6432080 . . . . . 5,531 9,867 -4,335 2,279 5,689 -3,410 7,811 15,556 -7,7452085 . . . . . 6,313 11,361 -5,048 2,629 6,464 -3,835 8,942 17,825 -8,8832090 . . . . . 7,208 13,060 -5,852 3,031 7,334 -4,302 10,239 20,393 -10,1542095 . . . . . 8,227 15,021 -6,794 3,493 8,335 -4,841 11,720 23,356 -11,635
a OASDI benefit payments which were scheduled to be paid on January 3 for some past and future yearswere actually paid on December 31 as required by the statutory provision for early delivery of benefit pay-ments when the normal payment delivery date is a Saturday, Sunday, or legal public holiday. For compara-bility with the values for historical years and the projections in this report, all trust fund operations and assetreserves reflect the 12 months of benefits scheduled for payment each year.b Between $0 and $500 million.Note: Totals do not necessarily equal the sums of rounded components.
Table VI.G10.—OASDI and HI Annual Non-interest Income, Cost, andBalance in Current Dollars, Calendar Years 2018-2095 (Cont.)
[In billions]
Calendaryear
OASDI HI CombinedNon-
interestincome Costa Balancea
Non-interestincome Cost Balance
Non-interestincome Costa Balancea
Appendices
226
H. ANALYSIS OF BENEFIT DISBURSEMENTS FROM THE OASI TRUST FUND WITH RESPECT TO DISABLED BENEFICIARIES
(Required by section 201(c) of the Social Security Act)
Effective January 1957, the OASI Trust Fund pays monthly benefits to dis-abled children aged 18 and over of retired and deceased workers if the dis-ability began before age 18. The age by which disability must have begunwas later changed to age 22. Effective February 1968, the OASI Trust Fundpays reduced monthly benefits to disabled widows and widowers at ages 50and over. Effective January 1991, the requirements for the disability of thewidow or widower were made less restrictive.
At the end of 2017, the OASI Trust Fund was providing monthly benefit pay-ments to about 1,124,000 people because of their disabilities or the disabili-ties of children. This total includes approximately 24,000 mothers andfathers (wives or husbands under normal retirement age of retired-workerbeneficiaries and widows or widowers of deceased insured workers) whomet all other qualifying requirements and were receiving unreduced benefitssolely because they had disabled-child beneficiaries (or disabled childrenaged 16 or 17) in their care. In calendar year 2017, the OASI Trust Fund paida total of $11,355 million to the people described above. Table VI.H1 showsOASI scheduled benefits for disability for selected calendar years during1960 through 2017 and estimates for 2018 through 2027 based on the inter-mediate set of assumptions.

227
OASI Expenditures for the Disabled
Note: Totals do not necessarily equal the sums of rounded components.
Table VI.H1.—Scheduled Benefit Disbursements From the OASI Trust FundWith Respect to Disabled Beneficiaries
[Beneficiaries in thousands; scheduled benefits in millions]
Calendar year
Disabled beneficiaries, end of year Amount of scheduled benefitsa b
a Beginning in 1966, includes payments for vocational rehabilitation services.b Amounts for 2015 and 2016 are adjusted to include in 2016 operations those benefit payments regularlyscheduled in the law to be paid on January 3, 2016, which were actually paid on December 31, 2015 asrequired by the statutory provision for early benefit payments when the normal delivery date is on a Satur-day, Sunday, or public holiday. Such shifts in payments across calendar years occur periodically wheneverJanuary 3rd falls on a Sunday. In order to provide a consistent perspective on scheduled benefits over time,scheduled benefits in each year reflect the 12 months of benefits that are regularly scheduled for payment inthat year.
Total Children c
c Also includes certain mothers and fathers (see text).
Widows-widowers d
d In 1984 and later years, includes only disabled widows and widowers aged 50-59, because disabled wid-ows and widowers age 60 and older are eligible for the same benefit as a nondisabled aged widow or wid-ower. Therefore, they are not receiving benefits solely because of a disability.
Total ChildrencWidows-
widowers e
e In 1983 and prior years, includes the offsetting effect of lower benefits payable to disabled widows andwidowers who continued to receive benefits after attaining age 60 (62, for disabled widowers prior to 1973),compared to the higher nondisabled widow’s and widower’s benefits that would otherwise be payable. In1984 and later years, includes only scheduled benefits to disabled widows and widowers aged 50-59 (seefootnote d).
Historical data:1960 . . . . . . . . . 117 117 — $59 $59 —1965 . . . . . . . . . 214 214 — 134 134 —1970 . . . . . . . . . 316 281 36 301 260 $411975 . . . . . . . . . 435 376 58 664 560 1041980 . . . . . . . . . 519 460 59 1,223 1,097 1261985 . . . . . . . . . 594 547 47 2,072 1,885 1871990 . . . . . . . . . 662 613 49 2,882 2,649 2331995 . . . . . . . . . 772 681 91 4,202 3,672 5312000 . . . . . . . . . 811 707 104 5,203 4,523 6802005 . . . . . . . . . 836 728 108 6,449 5,556 8342006 . . . . . . . . . 840 732 108 6,720 5,852 8642007 . . . . . . . . . 851 744 107 7,053 6,181 8692008 . . . . . . . . . 922 813 109 7,688 6,776 9082009 . . . . . . . . . 969 857 112 8,595 7,618 9742010 . . . . . . . . . 996 879 117 8,858 7,848 1,0082011 . . . . . . . . . 1,020 899 121 9,136 8,085 1,0502012 . . . . . . . . . 1,045 920 125 9,698 8,595 1,1022013 . . . . . . . . . 1,065 939 126 9,953 8,840 1,1092014 . . . . . . . . . 1,079 954 125 10,326 9,217 1,1082015 . . . . . . . . . 1,096 972 124 10,736 9,624 1,1092016 . . . . . . . . . 1,109 988 121 11,025 9,933 1,0872017 . . . . . . . . . 1,124 1,006 117 11,355 10,288 1,061
Estimates under the intermediate assumptions:2018 . . . . . . . . . 1,139 1,025 114 11,737 10,689 1,0422019 . . . . . . . . . 1,153 1,044 110 12,250 11,213 1,0292020 . . . . . . . . . 1,168 1,062 106 12,828 11,796 1,0242021 . . . . . . . . . 1,183 1,079 103 13,388 12,357 1,0232022 . . . . . . . . . 1,197 1,097 100 13,972 12,942 1,022
2023 . . . . . . . . . 1,211 1,113 98 14,567 13,541 1,0182024 . . . . . . . . . 1,226 1,130 96 15,211 14,175 1,0282025 . . . . . . . . . 1,240 1,146 94 15,888 14,847 1,0332026 . . . . . . . . . 1,254 1,162 92 16,610 15,550 1,0512027 . . . . . . . . . 1,268 1,176 91 17,363 16,286 1,069
Appendices
228
Under the intermediate assumptions, estimated total scheduled benefits fromthe OASI Trust Fund with respect to disabled beneficiaries will increasefrom $11,737 million in calendar year 2018 to $17,363 million in calendaryear 2027.
In calendar year 2017, benefit payments (including expenditures for voca-tional rehabilitation services) with respect to disabled persons from the OASITrust Fund and from the DI Trust Fund (including payments from the DIfund to all children and spouses of disabled-worker beneficiaries) totaled$154,181 million. Of this amount, $11,355 million, or 7.4 percent, repre-sented payments from the OASI Trust Fund. Table VI.H2 contains these andsimilar figures for selected calendar years during 1960 through 2017 andestimates for calendar years 2018 through 2027.

229
OASI Expenditures for the Disabled
Note: Totals do not necessarily equal the sums of rounded components.
Table VI.H2.—Scheduled Benefit Disbursementsa Under the OASDI ProgramWith Respect to Disabled Beneficiaries
[Amounts in millions]
a Amounts for 2015 and 2016 are adjusted to include in 2016 operations those benefit payments regularlyscheduled in the law to be paid on January 3, 2016, which were actually paid on December 31, 2015 asrequired by the statutory provision for early benefit payments when the normal delivery date is on a Satur-day, Sunday, or public holiday. Such shifts in payments across calendar years occur periodically wheneverJanuary 3rd falls on a Sunday. In order to provide a consistent perspective on scheduled benefits over time,scheduled benefits in each year reflect the 12 months of benefits that are regularly scheduled for payment inthat year.
Calendar year Totalb
b Beginning in 1966, includes payments for vocational rehabilitation services.
DI Trust Fund c
c Scheduled benefits for disabled workers and their children and spouses.
OASI Trust FundAmount d
d Scheduled benefits for disabled children aged 18 and over, for certain mothers and fathers (see text), andfor disabled widows and widowers (see footnote e, table VI.H1).
Percentage of totalHistorical data:
1960 . . . . . . . . . $627 $568 $59 9.41965 . . . . . . . . . 1,707 1,573 134 7.91970 . . . . . . . . . 3,386 3,085 301 8.91975 . . . . . . . . . 9,169 8,505 664 7.21980 . . . . . . . . . 16,738 15,515 1,223 7.31985 . . . . . . . . . 20,908 18,836 2,072 9.91990 . . . . . . . . . 27,717 24,835 2,882 10.41995 . . . . . . . . . 45,140 40,937 4,202 9.32000 . . . . . . . . . 60,204 55,001 5,203 8.62005 . . . . . . . . . 91,835 85,386 6,449 7.02006 . . . . . . . . . 99,165 92,446 6,720 6.82007 . . . . . . . . . 106,200 99,147 7,053 6.62008 . . . . . . . . . 114,064 106,376 7,688 6.72009 . . . . . . . . . 127,002 118,407 8,595 6.82010 . . . . . . . . . 133,103 124,245 8,858 6.72011 . . . . . . . . . 138,115 128,979 9,136 6.62012 . . . . . . . . . 146,623 136,925 9,698 6.62013 . . . . . . . . . 150,108 140,155 9,953 6.62014 . . . . . . . . . 152,031 141,705 10,326 6.82015 . . . . . . . . . 154,124 143,388 10,736 7.02016 . . . . . . . . . 153,824 142,800 11,025 7.22017 . . . . . . . . . 154,181 142,826 11,355 7.4
Estimates under the intermediate assumptions:2018 . . . . . . . . . 158,036 146,298 11,737 7.42019 . . . . . . . . . 162,382 150,132 12,250 7.52020 . . . . . . . . . 167,069 154,240 12,828 7.72021 . . . . . . . . . 173,139 159,751 13,388 7.72022 . . . . . . . . . 179,634 165,662 13,972 7.82023 . . . . . . . . . 187,277 172,710 14,567 7.82024 . . . . . . . . . 195,532 180,321 15,211 7.82025 . . . . . . . . . 204,781 188,894 15,888 7.82026 . . . . . . . . . 214,571 197,961 16,610 7.72027 . . . . . . . . . 224,647 207,284 17,363 7.7
Appendices
230
I. GLOSSARY
Actuarial balance. The difference between the summarized income rate andthe summarized cost rate as a percentage of taxable payroll over a given val-uation period.Actuarial deficit. A negative actuarial balance.Administrative expenses. Expenses incurred by the Social Security Admin-istration and the Department of the Treasury in administering the OASDIprogram and the provisions of the Internal Revenue Code relating to the col-lection of contributions. Such administrative expenses are paid from theOASI and DI Trust Funds.Advance tax transfers. Amounts representing the estimated total OASDItax contributions for a given month. From May 1983 throughNovember 1990, such amounts were credited to the OASI and DI TrustFunds at the beginning of each month. The trust funds reimbursed the Gen-eral Fund of the Treasury for the associated loss of interest. Advance taxtransfers are no longer made unless needed in order to pay benefits.Alternatives I, II, or III. See “Assumptions.”Annual balance. The difference between the income rate and the cost ratefor a given year.Asset reserves. The cumulative excess of trust fund income over trust fundexpenditures over all years to date. These reserves are held by the trust fundsin the form of Treasury notes and bonds, other securities guaranteed by theFederal Government, certain Federally sponsored agency obligations, andcash.Assumptions. Values related to future trends in key factors that affect thetrust funds. Demographic assumptions include fertility, mortality, net immi-gration, marriage, and divorce. Economic assumptions include unemploy-ment rates, average earnings, inflation, interest rates, and productivity.Program-specific assumptions include retirement patterns, and disabilityincidence and termination rates. This report presents three sets of demo-graphic, economic, and program-specific assumptions: • Alternative II is the intermediate set of assumptions, and represents the
Trustees’ best estimates of likely future demographic, economic, andprogram-specific conditions.
• Alternative I is a low-cost set of assumptions—it assumes relativelyrapid economic growth, high inflation, and favorable (from the stand-point of program financing) demographic and program-specific condi-tions.

231
Glossary
• Alternative III is a high-cost set of assumptions—it assumes relativelyslow economic growth, low inflation, and unfavorable (from the stand-point of program financing) demographic and program-specific condi-tions.
See tables V.A2, V.B1, and V.B2.Automatic cost-of-living benefit increase. The annual increase in benefits,effective for December, reflecting the increase, if any, in the cost of living. Abenefit increase is applicable only after a beneficiary becomes eligible forbenefits. In general, the benefit increase equals the percentage increase in theConsumer Price Index for Urban Wage Earners and Clerical Workers(CPI-W) measured from the third quarter of the previous year to the thirdquarter of the current year. If there is no increase in the CPI-W, there is nocost-of-living benefit increase. See table V.C1.Auxiliary benefits. Monthly benefits payable to a spouse or child of aretired or disabled worker, or to a survivor of a deceased worker.Average indexed monthly earnings—AIME. The measure of lifetimeearnings used in determining the primary insurance amount (PIA) for mostworkers who attain age 62, become disabled, or die after 1978. A worker’sactual past earnings are adjusted by changes in the average wage index, inorder to bring them up to their approximately equivalent value at the time ofretirement or other eligibility for benefits.Average wage index—AWI. A series that generally increases with the aver-age amount of total wages for each year after 1950, including wages in non-covered employment and wages in covered employment in excess of theOASDI contribution and benefit base. (See Title 20, Chapter III,section 404.211(c) of the Code of Federal Regulations for a more precisedefinition.) These average wage amounts are used to index the taxable earn-ings of most workers first becoming eligible for benefits in 1979 or later, andfor automatic adjustments in the contribution and benefit base, bend points,earnings test exempt amounts, and other wage-indexed amounts. Seetable V.C1.Award. An administrative determination that an individual is entitled toreceive a specified type of OASDI benefit. Awards can represent not onlynew entrants to the benefit rolls but also persons already on the rolls whobecome entitled to a different type of benefit. Awards usually result in theimmediate payment of benefits, although payments may be deferred or with-held depending on the individual’s particular circumstances.Baby boom. The period from the end of World War II (1946) through 1965marked by unusually high birth rates.

Appendices
232
Bend points. The dollar amounts defining the AIME or PIA brackets in thebenefit formulas. For the bend points for years 1979 and later, seetable V.C2.Beneficiary. A person who has been awarded benefits on the basis of his orher own or another’s earnings record. The benefits may be either in current-payment status or withheld.Benefit award. See “Award.”Benefit conversion. See “Disability conversion.”Benefit payments. The amounts disbursed for OASI and DI benefits by theDepartment of the Treasury.Benefit termination. See “Termination.”Best estimate assumptions. See “Assumptions.”Board. See “Board of Trustees.”Board of Trustees. A Board established by the Social Security Act to over-see the financial operations of the Federal Old-Age and Survivors InsuranceTrust Fund and the Federal Disability Insurance Trust Fund. The Board iscomposed of six members. Four members serve by virtue of their positionsin the Federal Government: the Secretary of the Treasury, who is the Manag-ing Trustee; the Secretary of Labor; the Secretary of Health and Human Ser-vices; and the Commissioner of Social Security. The President appoints andthe Senate confirms the other two members to serve as public representa-tives. Also referred to as the “Board” or the “Trustees.”Cash flow. Actual or projected revenue and costs reflecting the levels ofpayroll tax contribution rates and benefits scheduled in the law. Net cashflow is the difference between non-interest income and cost.Consumer Price Index—CPI. An official measure of inflation in consumerprices. In this report, CPI refers to the Consumer Price Index for Urban WageEarners and Clerical Workers (CPI-W). The Bureau of Labor Statistics,Department of Labor, publishes historical values for the CPI-W.Contribution and benefit base. Annual dollar amount above which earn-ings in employment covered under the OASDI program are neither taxablenor creditable for benefit-computation purposes. (Also referred to as maxi-mum contribution and benefit base, annual creditable maximum, taxablemaximum, and maximum taxable.) See tables V.C1 and V.C6. See “HospitalInsurance (HI) contribution base.”Contributions. See “Payroll tax contributions.”Conversion. See “Disability conversion.”Cost. The cost shown for a year includes benefits scheduled for payment inthe year, administrative expenses, financial interchange with the Railroad

233
Glossary
Retirement program, and payments for vocational rehabilitation services fordisabled beneficiaries.Cost-of-living adjustment. See “Automatic cost-of-living benefit increase.”Cost rate. The cost rate for a year is the ratio of the cost of the program tothe taxable payroll for the year.Covered earnings. Wages or earnings from self-employment covered by theOASDI program.Covered employment. All employment for which earnings are creditablefor Social Security purposes. The program covers almost all employment.Some exceptions are: • State and local government employees whose employer has not elected
to be covered under Social Security and who are participating in anemployer-provided pension plan.
• Current Federal civilian workers hired before 1984 who have notelected to be covered.
• Self-employed workers earning less than $400 in a calendar year.Covered worker. A person who has earnings creditable for Social Securitypurposes based on services for wages in covered employment or incomefrom covered self-employment.CPI-indexed dollars. Amounts adjusted by the CPI to the value of the dollarin a particular year.Creditable earnings. Wages or self-employment earnings posted to aworker’s earnings record. Such earnings determine eligibility for benefitsand the amount of benefits on that worker’s record. The contribution andbenefit base is the maximum amount of creditable earnings for each workerin a calendar year.Current-cost financing. See “Pay-as-you-go financing.”Current dollars. Amounts expressed in nominal dollars with no adjustmentfor inflation.Currently insured status. A worker acquires currently insured status whenhe or she has accumulated six quarters of coverage during the 13-quarterperiod ending with the current quarter.Current-payment status. Status of a beneficiary to whom a benefit is beingpaid for a given month (with or without deductions, provided the deductionsadd to less than a full month’s benefit).Deemed filing. Under certain circumstances, a person applying for or receiv-ing either an aged-spouse benefit or a retired-worker benefit is required toalso file for the other of these two types of benefits. For those first eligiblefor benefits before 2016, this requirement applies to any person under normalretirement age who is eligible for the other benefit as of the starting month

Appendices
234
for the first benefit. For those first eligible for benefits in 2016 and later, thisrequirement applies whenever the person is eligible for the other benefit.This can occur at any age, and in months after the starting month of the firstbenefit.Deemed wage credit. See “Military service wage credits.”Delayed retirement credits. Increases in the benefit amount for certain indi-viduals who did not receive benefits for months after attaining normal retire-ment age but before age 70. Delayed retirement credits apply to benefits forJanuary of the year following the year they are earned or for the month ofattainment of age 70, whichever comes first. See table V.C3.Demographic assumptions. See “Assumptions.”Disability. For Social Security purposes, the inability to engage in substan-tial gainful activity (see “Substantial gainful activity—SGA”) by reason ofany medically determinable physical or mental impairment that can beexpected to result in death or to last for a continuous period of not less than12 months. Special rules apply for workers at ages 55 and over whose dis-ability is based on blindness.The law generally requires that a person be disabled continuously for5 months before he or she can qualify for a disabled-worker benefit.Disability conversion ratio. For a given year, the ratio of the number of dis-ability conversions to the average number of disabled-worker beneficiaries atall ages during the year.Disability conversion. Upon attainment of normal retirement age, a dis-abled-worker beneficiary is automatically converted to retired-worker status.Disability incidence rate. The proportion of workers in a given year,insured for but not receiving disability benefits, who apply for and areawarded disability benefits.Disability Insurance (DI) Trust Fund. See “Trust fund.”Disability insured status. A worker acquires disability insured status if heor she is: (1) a fully insured worker who has accumulated 20 quarters of cov-erage during the 40-quarter period ending with the current quarter, (2) a fullyinsured worker aged 24-30 who has accumulated quarters of coverage duringone-half of the quarters elapsed after the quarter of attainment of age 21 andup to and including the current quarter, or (3) a fully insured worker underage 24 who has accumulated six quarters of coverage during the 12-quarterperiod ending with the current quarter.Disability prevalence rate. The proportion of persons insured for disabilitybenefits who are disabled-worker beneficiaries in current-payment status.Disability termination rate. The proportion of disabled-worker beneficia-ries in a given year whose disability benefits terminate as a result of theirrecovery or death.

235
Glossary
Disabled-worker benefit. A monthly benefit payable to a disabled workerunder normal retirement age and insured for disability. BeforeNovember 1960, disability benefits were limited to disabled workersaged 50-64.Disbursements. Actual expenditures (outgo) made or expected to be madeunder current law, including benefits paid or payable, administrativeexpenses, financial interchange with the Railroad Retirement program, andpayments for vocational rehabilitation services for disabled beneficiaries.Dual entitlement. A person may be entitled to more than one benefit at thesame time. For example, a person may be entitled as a retired worker on hisor her own record and as a spouse on another record. However, a person'sbenefit amount can never exceed the highest single benefit to which that per-son is entitled. Some benefits are calculated independently with the largerbenefit being paid or the smaller benefit being paid plus the excess amount ofthe larger one.Earnings. Unless otherwise qualified, all wages from employment and netearnings from self-employment, whether or not they are taxable or covered.Earnings test. The provision requiring the withholding of benefits if benefi-ciaries under normal retirement age have earnings in excess of certainexempt amounts. See table V.C1.Economic assumptions. See “Assumptions.”Effective interest rate. See “Interest rate.”Excess wages. Wages in excess of the contribution and benefit base onwhich a worker initially makes payroll tax contributions, usually as a resultof working for more than one employer during a year. Employee payrolltaxes on excess wages are refundable to affected employees, while theemployer taxes are not refundable.Expenditures. See “Disbursements.”Federal Insurance Contributions Act—FICA. Provision authorizing pay-roll taxes on the wages of employed persons to provide for Old-Age, Survi-vors, and Disability Insurance, and for Hospital Insurance. Workers and theiremployers generally pay the tax in equal amounts.File and suspend. The ability to apply for a retired-worker benefit at or afternormal retirement age, then voluntarily suspend it, allowing the worker toearn delayed retirement credits and a spouse or child to receive benefits onthe worker’s record. Voluntary suspensions requested after April 29, 2016 nolonger allow spouses (other than divorced spouses) and children to receivebenefits while the worker’s benefit is suspended. Financial interchange. Provisions of the Railroad Retirement Act providingfor transfers between the trust funds and the Social Security Equivalent Ben-efit Account of the Railroad Retirement program in order to place each trust

Appendices
236
fund in the same financial position it would have been had railroad employ-ment always been covered under Social Security.Fiscal year. The accounting year of the United States Government. A fiscalyear is the 12-month period ending September 30. For example, fiscal year2018 began October 1, 2017, and will end September 30, 2018.Full advance funding. A financing method in which contributions are estab-lished to match the full cost of future benefits as these costs are incurredthrough current service. Such financing methods also provide for amortiza-tion over a fixed period of any financial obligation that is incurred at thebeginning of the program (or subsequent modification) as a result of grantingcredit for past service.Fully insured status. A worker acquires fully insured status when his or hertotal number of quarters of coverage is greater than or equal to the number ofyears elapsed after the year of attainment of age 21 (but not less than six).Once a worker has accumulated 40 quarters of coverage, he or she remainspermanently fully insured.General Fund of the Treasury. Funds held by the Treasury of the UnitedStates, other than receipts collected for a specific purpose (such as SocialSecurity), and maintained in a separate account for that purpose.General Fund reimbursements. Payments from the General Fund of theTreasury to the trust funds for specific purposes defined in the law, includ-ing: • The cost of noncontributory wage credits for military service before
1957, and periodic adjustments of previous determinations. • The cost in 1971-82 of deemed wage credits for military service per-
formed after 1956. • The cost of benefits to certain uninsured persons who attained age 72
before 1968. • The cost of payroll tax credits provided to employees in 1984 and self-
employed persons in 1984-89 by Public Law 98-21. • The cost in 2009-17 of excluding certain self-employment earnings
from SECA taxes under Public Law 110-246. • Payroll tax revenue forgone under the provisions of Public Laws 111-
147, 111-312, 112-78, and 112-96.The General Fund also reimburses the trust funds for various other items,including interest on checks which are not negotiated 6 months after themonth of issue and costs incurred in performing certain legislatively man-dated activities not directly related to administering the OASI and DI pro-grams.

237
Glossary
Gross domestic product—GDP. The total dollar value of all goods and ser-vices produced by labor and property located in the United States, regardlessof who supplies the labor or property.Hospital Insurance (HI) contribution base. Annual dollar amount abovewhich earnings in employment covered under the HI program are not tax-able. (Also referred to as maximum contribution base, taxable maximum,and maximum taxable.) Beginning in 1994, the HI contribution base waseliminated.High-cost assumptions. See “Assumptions.”Hospital Insurance (HI) Trust Fund. See “Trust fund.”Immigration. See “Lawful permanent resident (LPR) immigration” and“Other-than-LPR immigration.”Income. Income for a given year is the sum of tax revenue on a cash basis(payroll tax contributions and income from the taxation of scheduled bene-fits), reimbursements from the General Fund of the Treasury, if any, andinterest credited to the trust funds.Income rate. Ratio of non-interest income to the OASDI taxable payroll forthe year.Infinite horizon. The period extending indefinitely into the future.Inflation. An increase in the general price level of goods and services.Insured status. The state or condition of having sufficient quarters of cover-age to meet the eligibility requirements for retired-worker or disabled-workerbenefits, or to permit the worker’s spouse and children or survivors to estab-lish eligibility for benefits in the event of his or her disability, retirement, ordeath. See “Quarters of coverage.”Interest. A payment in exchange for the use of money during a specifiedperiod.Interest rate. Interest rates on new public-debt obligations issuable to Fed-eral trust funds (see “Special public-debt obligation”) are determinedmonthly. Such rates are equal to the average market yield on all outstandingmarketable U.S. securities not due or callable until after 4 years from the datethe rate is determined. See table V.B2 for historical and assumed future inter-est rates on new special-issue securities. The effective interest rate for a trustfund is the ratio of the interest earned by the fund over a given period of timeto the average level of asset reserves held by the fund during the period. Theeffective rate of interest thus represents a measure of the overall averageinterest earnings on the fund’s portfolio of investments.Interfund borrowing. The borrowing of asset reserves by a trust fund(OASI, DI, or HI) from another trust fund when the first fund is in danger ofdepletion. The Social Security Act permitted interfund borrowing onlyduring 1982 through 1987, and required all amounts borrowed to be repaidprior to the end of 1989. The only exercise of this authority occurred in 1982,
Appendices
238
when the OASI Trust Fund borrowed from the DI and HI Trust Funds. Thefinal repayment of borrowed amounts occurred in 1986.Intermediate assumptions. See “Assumptions.”Lawful permanent resident (LPR) immigration. Persons who enter theSocial Security area population and are granted LPR status, or who arealready in the Social Security area population and adjust their status tobecome LPRs. Persons who enter the country with legal visas but withoutLPR status, such as temporary foreign workers and students, are not includedin the “LPR immigration” category.Legal emigration. Lawful permanent residents and citizens who leave theSocial Security area population.Life expectancy. Average remaining number of years expected prior todeath. Period life expectancy is calculated for a given year using the actual orexpected death rates at each age for that year. Cohort life expectancy, some-times referred to as generational life expectancy, is calculated for individualsat a specific age in a given year using actual or expected death rates from theyears in which the individuals would actually reach each succeeding age ifthey survive.Long-range. The next 75 years. The Trustees make long-range actuarial esti-mates for this period because it covers approximately the maximum remain-ing lifetime for virtually all current Social Security participants.Low-cost assumptions. See “Assumptions.”Lump-sum death payment. A lump sum, generally $255, payable on thedeath of a fully or currently insured worker. The lump sum is payable to thesurviving spouse of the worker, under most circumstances, or to the worker’schildren.Maximum family benefit. The maximum monthly amount that can be paidon a worker’s earnings record. Whenever the total of the individual monthlybenefits payable to all the beneficiaries entitled on one earnings recordexceeds the maximum, each dependent’s or survivor’s benefit is proportion-ately reduced. Benefits payable to divorced spouses or surviving divorcedspouses are not reduced under the family maximum provision.Medicare. A nationwide, Federally administered health insurance programauthorized in 1965 under Title XVIII of the Social Security Act to cover thecost of hospitalization, medical care, and some related services for most per-sons age 65 and over. In 1972, lawmakers extended coverage to personsreceiving Social Security Disability Insurance payments for 2 years and per-sons with End-Stage Renal Disease. (For beneficiaries whose primary or sec-ondary diagnosis is Amyotrophic Lateral Sclerosis, the 2-year waiting periodis waived.) In 2010, persons exposed to environmental health hazards withinareas under a corresponding emergency declaration became Medicare-eligi-

239
Glossary
ble. In 2006, prescription drug coverage was added as well. Medicare con-sists of two separate but coordinated trust funds—Hospital Insurance (HI,Part A) and Supplementary Medical Insurance (SMI). The SMI Trust Fund iscomposed of two separate accounts—the Part B account and the Part Daccount. Almost all persons who are aged 65 and over or disabled and whoare entitled to HI are eligible to enroll in Part B and Part D on a voluntarybasis by paying monthly premiums.Military service wage credits. Credits toward OASDI earnings records forbenefit computation purposes, recognizing that military personnel receivenon-wage compensation (such as food and shelter) in addition to their basicpay and other cash payments. Military personnel do not pay payroll taxes onthese credits. Noncontributory wage credits of $160 were provided for eachmonth of active military service from September 16, 1940, through Decem-ber 31, 1956. For years after 1956, the basic pay of military personnel is cov-ered under the Social Security program on a contributory basis. In addition tothe contributory credits for basic pay, noncontributory wage credits of $300were granted for each calendar quarter, from January 1957 through Decem-ber 1977, in which a person received pay for military service. Noncontribu-tory wage credits of $100 were granted for each $300 of military wages, upto a maximum credit of $1,200 per calendar year, from January 1978 throughDecember 2001.National average wage index—AWI. See “Average wage index—AWI.”Non-interest income. Non-interest income for a given year is the sum of taxrevenue on a cash basis (payroll tax contributions and income from the taxa-tion of scheduled benefits) and reimbursements from the General Fund of theTreasury, if any.Nonresident alien beneficiary. An OASDI beneficiary who is not a U.S.citizen and who is living abroad while receiving benefits.Normal retirement age—NRA. The age at which a person may firstbecome entitled to retirement benefits without reduction based on age. Forpersons reaching age 62 before 2000, the normal retirement age is 65. It willincrease gradually to 67 for persons reaching that age in 2027 or later, begin-ning with an increase to 65 years and 2 months for persons reaching age 65in 2003. See table V.C3.Old-Age and Survivors Insurance (OASI) Trust Fund. See “Trust fund.”Old-law base. Amount the contribution and benefit base would have been ifthe 1977 amendments had not provided for ad hoc increases. The SocialSecurity Amendments of 1972 provided for automatic annual indexing of thecontribution and benefit base. The Social Security Amendments of 1977specified ad hoc bases for 1978-81, with subsequent bases updated in accor-dance with the normal indexing procedure. See table V.C2.

Appendices
240
Open group unfunded obligation. See “Unfunded obligation.”Other-than-LPR emigration. Other-than-LPR immigrants who leave theSocial Security area population or who adjust their status to become LPRs.Other-than-LPR immigration. Persons who enter the Social Security areapopulation and stay to the end of the year without being granted LPR status,such as undocumented immigrants, and foreign workers and students enter-ing with temporary visas.Outgo. See “Disbursements.”Par value. The value printed on the face of a bond. For both public and spe-cial issues held by the trust funds, par value is also the redemption value atmaturity.Partial advance funding. A financing method in which contributions areestablished to provide a substantial accumulation of trust fund asset reserves,thereby generating additional interest income to the trust funds and reducingthe need for payroll tax increases in periods when costs are relatively high.Higher general contributions or additional borrowing may be required, how-ever, to support the payment of such interest. While substantial, the trustfund buildup under partial advance funding is much smaller than it would bewith full advance funding.Pay-as-you-go financing. A financing method in which contributions areestablished to produce just as much income as required to pay current bene-fits, with trust fund asset reserves built up only to the extent needed to pre-vent depletion of the fund by random economic fluctuations.Payroll tax contributions. The amount based on a percent of earnings, up toan annual maximum, that must be paid by: • employers and employees on wages from employment under the Fed-
eral Insurance Contributions Act, • the self-employed on net earnings from self-employment under the
Self-Employment Contributions Act, and • States on the wages of State and local government employees covered
under the Social Security Act through voluntary agreements under sec-tion 218 of the act.
Also referred to as payroll taxes.Population in the Social Security area. See “Social Security area popula-tion.”Present value. The equivalent value, at the present time, of a stream of val-ues (either income or cost, past or future). Present values are used widely incalculations involving financial transactions over long periods of time toaccount for the time value of money, by discounting or accumulating thesetransactions at the rate of interest. Present-value calculations for this reportuse the effective yield on trust fund asset reserves.
241
Glossary
Primary insurance amount—PIA. The monthly amount payable to aretired worker who begins to receive benefits at normal retirement age or,generally, to a disabled worker. This amount, which is typically related to theworker’s average monthly wage or average indexed monthly earnings, is alsoused as a base for computing all types of benefits payable on an individual’searnings record.Primary-insurance-amount formula. The mathematical formula relatingthe PIA to the AIME for workers who attain age 62, become disabled, or dieafter 1978. The PIA is equal to the sum of 90 percent of AIME up to the firstbend point, plus 32 percent of AIME above the first bend point up to the sec-ond bend point, plus 15 percent of AIME in excess of the second bend point.Automatic benefit increases are applied beginning with the year of eligibility.See table V.C2 for historical and assumed future bend points and table V.C1for historical and assumed future benefit increases.Quarters of coverage. Basic unit of measurement for determining insuredstatus. In 2018, a worker receives one quarter of coverage (up to a total offour) for each $1,320 of annual covered earnings. For years after 1978, theamount of earnings required for a quarter of coverage is subject to annualautomatic increases in proportion to increases in average wages. Seetable V.C2. Railroad Retirement. A Federal insurance program, similar to Social Secu-rity, designed for workers in the railroad industry. The provisions of the Rail-road Retirement Act provide for a system of coordination and financialinterchange between the Railroad Retirement program and the Social Secu-rity program.Reallocation of payroll tax rates. An increase in the payroll tax rate foreither the OASI or DI Trust Fund, with a corresponding reduction in the ratefor the other fund, so that the total OASDI payroll tax rate is not changed. Real-wage differential. The difference between the percentage increases in:(1) the average annual wage in covered employment and (2) the averageannual Consumer Price Index. See table V.B1.Recession. A period of adverse economic conditions; in particular, two ormore successive calendar quarters of negative growth in gross domesticproduct.Reserves. See “Asset reserves.”Retired-worker benefit. A monthly benefit payable to a fully insured retiredworker aged 62 or older or to a person entitled under the transitionallyinsured status provision in the law.Retirement earnings test. See “Earnings test.”Retirement eligibility age. The age, currently age 62, at which a fullyinsured individual first becomes eligible to receive retired-worker benefits.
Appendices
242
Retirement test. See “Earnings test.”Scheduled benefits. The level of benefits specified under current law.Scenario-based model. A model with specified assumptions for and rela-tionships among variables. Under such a model, any specified set of assump-tions determines a single outcome directly reflecting the specifications.Self-employment. Operation of a trade or business by an individual or by apartnership in which an individual is a member.Self-Employment Contributions Act–SECA. Provision authorizing SocialSecurity payroll taxes on the net earnings of most self-employed persons.Short-range. The next 10 years. The Trustees prepare short-range actuarialestimates for this period because of the test of short-range financial ade-quacy. The Social Security Act requires estimates for 5 years; the Trusteesprepare estimates for an additional 5 years to help clarify trends which areonly starting to develop in the mandated first 5-year period. Social Security Act. Provisions of the law governing most operations of theSocial Security program. The original Social Security Act is PublicLaw 74-271, enacted August 14, 1935. With subsequent amendments, theSocial Security Act consists of 21 titles, of which three have been repealed.Title II of the Social Security Act authorized the Old-Age, Survivors, andDisability Insurance program.Social Security area population. The population comprised of: (1) residentsof the 50 States and the District of Columbia (adjusted for net census under-count); (2) civilian residents of Puerto Rico, the Virgin Islands, Guam,American Samoa, and the Northern Mariana Islands; (3) Federal civilianemployees and persons in the U.S. Armed Forces abroad and their depen-dents; (4) non-citizens living abroad who are insured for Social Security ben-efits; and (5) all other U.S. citizens abroad.Solvency. A program is solvent at a point in time if it is able to pay sched-uled benefits when due with scheduled financing. For example, the OASDIprogram is solvent over any period for which the trust funds maintain a posi-tive level of asset reserves.Special public-debt obligation. Securities of the United States Governmentissued exclusively to the OASI, DI, HI, and SMI Trust Funds and other Fed-eral trust funds. Section 201(d) of the Social Security Act provides that thepublic-debt obligations issued for purchase by the OASI and DI Trust Fundsshall have maturities fixed with due regard for the needs of the funds. Theusual practice has been to spread the holdings of special issues, as of eachJune 30, so that the amounts maturing in each of the next 15 years areapproximately equal. Special public-debt obligations are redeemable at parvalue at any time and carry interest rates determined by law (see “Interestrate”). See tables VI.A4 and VI.A5 for a listing of the obligations held by theOASI and DI Trust Funds, respectively.

243
Glossary
Stochastic model. A model used for projecting a probability distribution ofpotential outcomes. Such models allow for random variation in one or morevariables through time. The random variation is generally based on fluctua-tions observed in historical data for a selected period. A large number of sim-ulations, each of which reflects random variation in the variable(s), producea distribution of potential outcomes.Substantial gainful activity—SGA. The level of work activity used toestablish disability. A finding of disability requires that a person be unable toengage in substantial gainful activity. A person who earns more than a cer-tain monthly amount (net of impairment-related work expenses) is ordinarilyconsidered to be engaging in SGA. The amount of monthly earnings consid-ered as SGA depends on the nature of a person’s disability. The Social Secu-rity Act specifies a higher SGA amount for statutorily blind individuals;Federal regulations specify a lower SGA amount for non-blind individuals.Both SGA amounts increase with increases in the national average wageindex.Summarized balance. The difference between the summarized income rateand the summarized cost rate, expressed as a percentage of GDP. The differ-ence between the summarized income rate and cost rate as a percentage oftaxable payroll is referred to as the actuarial balance.Summarized cost rate. The ratio of the present value of cost to the presentvalue of the taxable payroll (or GDP) for the years in a given period,expressed as a percentage. To evaluate the financial adequacy of the pro-gram, the summarized cost rate is adjusted to include the cost of reachingand maintaining a target trust fund level. A trust fund level of about 1 year’scost is considered to be an adequate reserve for unforeseen contingencies;therefore, the targeted trust fund ratio is 100 percent of annual cost. Accord-ingly, the adjusted summarized cost rate is equal to the ratio of: (1) the sumof the present value of the cost during the period plus the present value of thetargeted ending trust fund level to (2) the present value of the taxable payroll(or GDP) during the projection period.Summarized income rate. The ratio of the present value of scheduled non-interest income to the present value of taxable payroll (or GDP) for the yearsin a given period, expressed as a percentage. To evaluate the financial ade-quacy of the program, the summarized income rate is adjusted to includeasset reserves on hand at the beginning of the period. Accordingly, theadjusted summarized income rate equals the ratio of: (1) the sum of the trustfund reserve at the beginning of the period plus the present value of non-interest income during the period to (2) the present value of the taxable pay-roll (or GDP) for the years in the period.Supplemental Security Income—SSI. A Federally administered program(often with State supplementation) of cash assistance for needy aged, blind,
Appendices
244
or disabled persons. The General Fund of the Treasury funds SSI and theSocial Security Administration administers it.Supplementary Medical Insurance (SMI) Trust Fund. See “Trust fund.”Survivor benefit. Benefit payable to a survivor of a deceased worker.Sustainable solvency. Sustainable solvency for the financing of the programunder a specified set of assumptions is achieved when the projected trustfund ratio is positive throughout the 75-year projection period and is eitherstable or rising at the end of the period.Taxable earnings. Wages or self-employment income, in employment cov-ered by the OASDI or HI programs, that is under the applicable annual maxi-mum taxable limit. For 1994 and later, no maximum taxable limit applies tothe HI program.Taxable payroll. A weighted sum of taxable wages and taxable self-employ-ment income. When multiplied by the combined employee-employer payrolltax rate, taxable payroll yields the total amount of payroll taxes incurred byemployees, employers, and the self-employed for work during the period.Taxable self-employment income. The maximum amount of net earningsfrom self-employment by an earner which, when added to any taxablewages, does not exceed the contribution and benefit base. For HI beginningin 1994, all net earnings from self-employment.Taxable wages. See “Taxable earnings.”Taxation of benefits. Beginning in 1984, Federal law subjected up to50 percent of an individual’s or a couple’s OASDI benefits to Federal incometaxation under certain circumstances. Treasury allocates the revenue derivedfrom this provision to the OASI and DI Trust Funds on the basis of theincome taxes paid on the benefits from each fund. Beginning in 1994, thelaw increased the maximum percentage from 50 percent to 85 percent. TheHI Trust Fund receives the additional tax revenue resulting from the increaseto 85 percent.Taxes. See “Payroll tax contributions” and “Taxation of benefits.”Termination. Cessation of payment because the beneficiary is no longerentitled to receive a specific type of benefit. For example, benefits might ter-minate as a result of the death of the beneficiary, the recovery of a disabledbeneficiary, or the attainment of age 18 by a child beneficiary. In some cases,an individual may cease one benefit and this is not a termination becausethey become immediately entitled to another type of benefit, such as the con-version of a disabled-worker beneficiary at normal retirement age to aretired-worker beneficiary.Test of long-range close actuarial balance. The conditions required tomeet this test are: • The trust fund satisfies the test of short-range financial adequacy; and

245
Glossary
• The trust fund ratios stay above zero throughout the 75-year projectionperiod, such that benefits would be payable in a timely manner through-out the period.
The Trustees apply the test to OASI, DI, and the combined OASDI programbased on the intermediate set of assumptions.Test of short-range financial adequacy. The conditions required to meetthis test are: • If the trust fund ratio for a fund is at least 100 percent at the beginning
of the projection period, the test requires that it remain at or above100 percent throughout the 10-year projection period;
• If the ratio is initially less than 100 percent, then it must reach at least100 percent within 5 years (without asset reserve depletion at any timeduring this period) and then remain at or above 100 percent throughoutthe remainder of the 10-year period.
The Trustees apply the test to OASI, DI, and the combined OASDI programbased on the intermediate set of assumptions.Total-economy productivity. The ratio of real GDP to hours worked by allworkers. Also referred to as “labor productivity.”Total fertility rate. The sum of the single year of age birth rates for womenaged 14 through 49, where the rate for age 14 includes births to womenaged 14 and under, and the rate for age 49 includes births to women aged 49and over. The total fertility rate may be interpreted as the average number ofchildren that would be born to a woman in her lifetime if she were to experi-ence, at each age of her life, the birth rate observed in, or assumed for, aspecified year, and if she were to survive the entire childbearing period.Trust fund. Separate accounts in the United States Treasury which hold thepayroll taxes received under the Federal Insurance Contributions Act and theSelf-Employment Contributions Act; payroll taxes resulting from coverageof State and local government employees; any sums received under thefinancial interchange with the railroad retirement account; voluntary hospitaland medical insurance premiums; and reimbursements or payments from theGeneral Fund of the Treasury. As required by law, the Department of theTreasury invests funds not required to meet current expenditures in interest-bearing securities backed by the full faith and credit of the U.S. Government.The interest earned is also deposited in the trust funds. • Old-Age and Survivors Insurance (OASI). The trust fund used for
paying monthly benefits to retired-worker (old-age) beneficiaries, theirspouses and children, and to survivors of deceased insured workers.
• Disability Insurance (DI). The trust fund used for paying monthly ben-efits to disabled-worker beneficiaries, their spouses and children, andfor providing rehabilitation services to the disabled.
Appendices
246
• Hospital Insurance (HI). The trust fund used for paying part of thecosts of inpatient hospital services and related care for aged and dis-abled individuals who meet the eligibility requirements. Also known asMedicare Part A.
• Supplementary Medical Insurance (SMI). The Medicare trust fundcomposed of the Part B Account, the Part D Account, and the Transi-tional Assistance Account. The Part B Account pays for a portion of thecosts of physicians’ services, outpatient hospital services, and otherrelated medical and health services for voluntarily enrolled aged anddisabled individuals. The Part D Account pays private plans to provideprescription drug coverage, beginning in 2006. The Transitional Assis-tance Account paid for transitional assistance under the prescriptiondrug card program in 2004 and 2005.
The trust funds are distinct legal entities which operate independently. Fundoperations are sometimes combined on a hypothetical basis.Trust fund ratio. A measure of trust fund adequacy. The asset reserves atthe beginning of a year, which do not include advance tax transfers,expressed as a percentage of the cost for the year. The trust fund ratio rep-resents the proportion of a year’s cost which could be paid solely with thereserves at the beginning of the year.Trustees. See “Board of Trustees.”Undisbursed balances. In general, refers to the cumulative differencesbetween the actual cash expenditures that the Social Security Administration(SSA) made each month compared to security redemptions from the trustfund reserves made on a preliminary basis to cover such cash expendituresduring the same month. On a monthly basis, SSA pays benefits and makespayments for other programmatic expenses associated with the trust funds.During each month, SSA draws cash from the trust funds on a preliminarybasis, which results in Treasury redeeming invested securities to cover theseexpenditures. This monthly difference can be either positive or negativedepending on net monthly activity, and is added to the balance at the end ofthe prior month. A net positive undisbursed balance represents a situation where cumulativeredemptions from the trust fund’s securities are more than was needed tocover actual program cash expenditures through the end of the month. A netnegative balance represents a situation where cumulative program cashexpenditures exceeded the amount redeemed from the invested securities. Anegative value requires future redemption of additional invested securities. In addition, about every seven years, when January 3 falls on a Sunday, ben-efit payments scheduled to be paid on January 3rd are actually paid onDecember 31 of the preceding year, as required by the statutory provisionincluded in the 1977 Social Security Amendments for early delivery of bene-
247
Glossary
fit payments when the normal payment delivery date is a Saturday, Sunday,or legal public holiday. Consistent with practice in prior reports and for com-parability with other historical years and the projections in this report, alltrust fund operations and asset reserves reflect the 12 months of benefitsscheduled for payment in each year. Therefore, such advance payments areincluded as positive values in the undisbursed balance at the end of the calen-dar years in which the advance payments are made.Unfunded obligation. A measure of the shortfall of trust fund income tofully cover program cost through a specified date after depletion of trust fundasset reserves. This measure can be expressed in present value dollars, dis-counted to the beginning of the valuation period, by computing the excess ofthe present value of the projected cost of the program through a specifieddate over the sum of: (1) the value of trust fund reserves at the beginning ofthe valuation period; and (2) the present value of the projected non-interestincome of the program through a specified date, assuming scheduled taxrates and benefit levels. This measure can apply for all participants through aspecified date, i.e., the open group, or be limited to a specified subgroup ofparticipants.Unfunded obligation ratio. The unfunded obligation accumulated throughthe beginning of a year expressed as a percentage of the cost for the year.Unnegotiated check. A check which has not been cashed 6 months after theend of the month in which the check was issued. When a check has been out-standing for a year, the Department of the Treasury administratively cancelsthe check and reimburses the issuing trust fund separately for the amount ofthe check and interest for the period the check was outstanding. The appro-priate trust fund also receives an interest adjustment for the time the checkwas outstanding if it is cashed 6-12 months after the month of issue. If acheck is presented for payment after it has been administratively canceled, areplacement check is issued.Valuation period. A period of years which is considered as a unit for pur-poses of calculating the financial status of a trust fund.Vocational rehabilitation. Services provided to disabled persons to helpthem to return to gainful employment. The trust funds reimburse the provid-ers of such services only in those cases where the services contributed to thesuccessful rehabilitation of the beneficiaries.Year of depletion. The year in which a trust fund becomes unable to paybenefits when due because the fund’s asset reserves have been used up.

List of Tables
248
LIST OF TABLES
II. OVERVIEWII.B1 Summary of 2017 Trust Fund Financial Operations . . . . . . . . 7II.B2 Payroll Tax Contribution Rates for 2017 . . . . . . . . . . . . . . . . 8II.C1 Long-Range Values of Key Assumptions for the
75-year Projection Period . . . . . . . . . . . . . . . . . . . . . . . . . . . 9II.D1 Projected Maximum Trust Fund Ratios During the Long-Range
Period and Trust Fund Reserve Depletion Dates . . . . . . . . . . . 15II.D2 Reasons for Change in the 75-Year Actuarial Balance,
Based on Intermediate Assumptions . . . . . . . . . . . . . . . . . . . 21
III. FINANCIAL OPERATIONS OF THE TRUST FUNDS ANDLEGISLATIVE CHANGES IN THE LAST YEAR
III.A1 Operations of the OASI Trust Fund, Calendar Year 2017 . . . . 27III.A2 Operations of the DI Trust Fund, Calendar Year 2017 . . . . . . . 31III.A3 Operations of the Combined OASI and DI Trust Funds,
Calendar Year 2017 . . . . . . . . . . . . . . . . . . . . . . . . . . . . . . . 33III.A4 Comparison of Actual Calendar Year 2017 Trust Fund
Operations With Estimates Made in Prior Reports, Based on Intermediate Assumptions . . . . . . . . . . . . . . . . . . . . . . . . . . 34
III.A5 Distribution of Benefit Payments by Type of Beneficiary or Payment, Calendar Years 2016 and 2017 . . . . . . . . . . . . . . . . 35
III.A6 Administrative Expenses as a Percentage of Non-interest Income and of Total Expenditures, Calendar Years 2013-2017 . . . . . . 36
III.A7 Trust Fund Investment Transactions, Calendar Year 2017 . . . . 36
IV. ACTUARIAL ESTIMATESIV.A1 Operations of the OASI Trust Fund,
Calendar Years 2013-2027 . . . . . . . . . . . . . . . . . . . . . . . . . . 41IV.A2 Operations of the DI Trust Fund,
Calendar Years 2013-2027 . . . . . . . . . . . . . . . . . . . . . . . . . . 45IV.A3 Operations of the Combined OASI and DI Trust Funds,
Calendar Years 2013-2027 . . . . . . . . . . . . . . . . . . . . . . . . . . 47IV.A4 Reasons for Change in Trust Fund (Unfunded Obligation) Ratios
at the Beginning of the Tenth Year of Projection Under Intermediate Assumptions. . . . . . . . . . . . . . . . . . . . . . . . . . . 50
IV.B1 Annual Income Rates, Cost Rates, and Balances,Calendar Years 1990-2095 . . . . . . . . . . . . . . . . . . . . . . . . . . 54
IV.B2 Components of Annual Income Rates, Calendar Years 1990-2095 . . . . . . . . . . . . . . . . . . . . . . . . . . 59

List of Tables
249
IV.B3 Covered Workers and Beneficiaries, Calendar Years 1945-2095 . . . . . . . . . . . . . . . . . . . . . . . . . . 61
IV.B4 Trust Fund Ratios, Calendar Years 2018-2095 . . . . . . . . . . . . 66IV.B5 Components of Summarized Income Rates and Cost Rates,
Calendar Years 2018-2092 . . . . . . . . . . . . . . . . . . . . . . . . . . 70IV.B6 Components of 75-Year Actuarial Balance
and Unfunded Obligation Under Intermediate Assumptions . . 72IV.B7 Reasons for Change in the 75-Year Actuarial Balance,
Based on Intermediate Assumptions . . . . . . . . . . . . . . . . . . . 73
V. ASSUMPTIONS AND METHODS UNDERLYINGACTUARIAL ESTIMATES
V.A1 Fertility and Mortality Assumptions, Calendar Years 1940-2095 . . . . . . . . . . . . . . . . . . . . . . . . . . 85
V.A2 Immigration Assumptions, Calendar Years 1940-2095 . . . . . . 90V.A3 Social Security Area Population on July 1 and
Dependency Ratios, Calendar Years 1945-2095 . . . . . . . . . . . 93V.A4 Period Life Expectancy . . . . . . . . . . . . . . . . . . . . . . . . . . . . 96V.A5 Cohort Life Expectancy . . . . . . . . . . . . . . . . . . . . . . . . . . . . 97V.B1 Principal Economic Assumptions . . . . . . . . . . . . . . . . . . . . . 105V.B2 Additional Economic Factors . . . . . . . . . . . . . . . . . . . . . . . . 111V.C1 Cost-of-Living Benefit Increases, Average Wage Index,
Contribution and Benefit Bases, and Retirement Earnings Test Exempt Amounts, 1975-2027 . . . . . . . . . . . . . 116
V.C2 Values for Selected Wage-Indexed Program Parameters, Calendar Years 1978-2027 . . . . . . . . . . . . . . . . . . . . . . . . . . 120
V.C3 Legislated Changes in Normal Retirement Age and Delayed Retirement Credits for Persons Reaching Age 62 in Each Year 1986 and Later . . . . . . . . . . . . . . . . . . . . . . . . . . . 122
V.C4 OASI Beneficiaries With Benefits in Current-Payment Statusat the End of Calendar Years 1945-2095 . . . . . . . . . . . . . . . . 130
V.C5 DI Beneficiaries With Benefits in Current-Payment Statusat the End of Calendar Years 1960-2095 . . . . . . . . . . . . . . . . 139
V.C6 Contribution and Benefit Base and Payroll Tax Contribution Rates . . . . . . . . . . . . . . . . . . . . . . 146
V.C7 Annual Scheduled Benefit Amounts for Retired Workers With Various Pre-Retirement Earnings Patterns Based on Intermediate Assumptions, Calendar Years 2018-2095 . . . . . . . . . . . . . . . . . . . . . . . . . . 150
List of Tables
250
VI. APPENDICESA. HISTORY OF OASI AND DI TRUST FUND OPERATIONS
VI.A1 Operations of the OASI Trust Fund, Calendar Years 1937-2017 . . . . . . . . . . . . . . . . . . . . . . . . . . 156
VI.A2 Operations of the DI Trust Fund, Calendar Years 1957-2017 . . . . . . . . . . . . . . . . . . . . . . . . . . 158
VI.A3 Operations of the Combined OASI and DI Trust Funds,Calendar Years 1957-2017 . . . . . . . . . . . . . . . . . . . . . . . . . . 160
VI.A4 OASI Trust Fund Asset Reserves, End of Calendar Years 2016 and 2017 . . . . . . . . . . . . . . . . . . . . . . . 162
VI.A5 DI Trust Fund Asset Reserves, End of Calendar Years 2016 and 2017 . . . . . . . . . . . . . . . . . . . . . . . 163
B. HISTORY OF ACTUARIAL STATUS ESTIMATESVI.B1 Long-Range OASDI Actuarial Balances and Trust Fund
Reserve Depletion Dates as Shown in the Trustees Reports for 1982-2018 under Intermediate Assumptions . . . . . . . . . . . 166
C. FISCAL YEAR HISTORICAL AND PROJECTED TRUST FUND OPERATIONS THROUGH 2027
VI.C1 Operations of the OASI Trust Fund, Fiscal Year 2017 . . . . . . . 171VI.C2 Operations of the DI Trust Fund, Fiscal Year 2017 . . . . . . . . . 172VI.C3 Operations of the Combined OASI and DI Trust Funds,
Fiscal Year 2017 . . . . . . . . . . . . . . . . . . . . . . . . . . . . . . . . . 173VI.C4 Operations of the OASI Trust Fund, Fiscal Years 2013-2027 . . 174VI.C5 Operations of the DI Trust Fund, Fiscal Years 2013-2027 . . . . 175VI.C6 Operations of the Combined OASI and DI Trust Funds,
Fiscal Years 2013-2027 . . . . . . . . . . . . . . . . . . . . . . . . . . . . 176
D. LONG-RANGE SENSITIVITY ANALYSISVI.D1 Sensitivity of OASDI Measures to Fertility Assumptions . . . . 178VI.D2 Sensitivity of OASDI Measures to Death-Rate Assumptions . . 179VI.D3 Sensitivity of OASDI Measures to
Total Net Immigration Assumptions . . . . . . . . . . . . . . . . . . . 180VI.D4 Sensitivity of OASDI Measures to Real-Wage Assumptions . . 182VI.D5 Sensitivity of OASDI Measures to
CPI-Increase Assumptions . . . . . . . . . . . . . . . . . . . . . . . . . . 183VI.D6 Sensitivity of OASDI Measures to
Real-Interest Assumptions . . . . . . . . . . . . . . . . . . . . . . . . . . 184VI.D7 Sensitivity of OASDI Measures to
Taxable Ratio Assumptions . . . . . . . . . . . . . . . . . . . . . . . . . . 185

List of Tables
251
VI.D8 Sensitivity of OASDI Measures to Disability Incidence Assumptions . . . . . . . . . . . . . . . . . . . . . 186
VI.D9 Sensitivity of OASDI Measures to Disability Termination Assumptions . . . . . . . . . . . . . . . . . . . 188
E. STOCHASTIC PROJECTIONS AND UNCERTAINTYVI.E1 Long-Range Estimates Relating to the Actuarial Status of
the Combined OASDI Program. . . . . . . . . . . . . . . . . . . . . . . 198
F. INFINITE HORIZON PROJECTIONSVI.F1 Unfunded OASDI Obligations Through the Infinite Horizon,
Based on Intermediate Assumptions . . . . . . . . . . . . . . . . . . . 200VI.F2 Present Values of OASDI Cost Less Non-interest Income
and Unfunded Obligations for Program Participants,Based on Intermediate Assumptions . . . . . . . . . . . . . . . . . . . 202
G. ESTIMATES FOR OASDI AND HI, SEPARATE AND COMBINED
VI.G1 Payroll Tax Contribution Rates for the OASDI and HI Programs . . . . . . . . . . . . . . . . . . . . . . . . 204
VI.G2 OASDI and HI Annual Income Rates, Cost Rates, and Balances,Calendar Years 2018-2095 . . . . . . . . . . . . . . . . . . . . . . . . . . 206
VI.G3 Summarized OASDI and HI Income Rates and Cost Rates for Valuation Periods, Calendar Years 2018-2092 . . . . . . . . . . . . 208
VI.G4 OASDI and HI Annual and Summarized Income, Cost, and Balance as a Percentage of GDP, Calendar Years 2018-2095 . . . . . . . . . . . . . . . . . . . . . . . . . . 211
VI.G5 Ratio of OASDI Taxable Payroll to GDP, Calendar Years 2018-2095 . . . . . . . . . . . . . . . . . . . . . . . . . . 213
VI.G6 Selected Economic Variables, Calendar Years 2017-2095 . . . . 216VI.G7 Operations of the Combined OASI and DI Trust Funds,
in CPI-indexed 2018 Dollars, Calendar Years 2018-2095 . . . . 218VI.G8 Operations of the Combined OASI and DI Trust Funds,
in Current Dollars, Calendar Years 2018-2095 . . . . . . . . . . . . 220VI.G9 OASDI and HI Annual Non-interest Income, Cost, and
Balance in CPI-Indexed 2018 Dollars, Calendar Years 2018-2095222
VI.G10 OASDI and HI Annual Non-interest Income, Cost, andBalance in Current Dollars, Calendar Years 2018-2095 . . . . . . 224

List of Tables
252
H. ANALYSIS OF BENEFIT DISBURSEMENTS FROM THE OASI TRUST FUND WITH RESPECT TO DISABLED BENEFICIARIES
VI.H1 Scheduled Benefit Disbursements From the OASI Trust FundWith Respect to Disabled Beneficiaries . . . . . . . . . . . . . . . . . 227
VI.H2 Scheduled Benefit Disbursements Under the OASDI ProgramWith Respect to Disabled Beneficiaries . . . . . . . . . . . . . . . . . 229
List of Figures
253
LIST OF FIGURES
II. OVERVIEWII.D1 Short-Range OASI and DI Combined Trust Fund Ratio . . . . . 11II.D2 OASDI Income, Cost, and Expenditures as Percentages
of Taxable Payroll . . . . . . . . . . . . . . . . . . . . . . . . . . . . . . . . 13II.D3 Number of Covered Workers Per OASDI Beneficiary. . . . . . . 14II.D4 OASDI Cost and Non-interest Income as a Percentage
of GDP . . . . . . . . . . . . . . . . . . . . . . . . . . . . . . . . . . . . . . . . 15II.D5 Cumulative Scheduled OASDI Income Less Cost,
From Program Inception Through Years 2017-2092 . . . . . . . . 17II.D6 Long-Range OASI and DI Combined Trust Fund Ratios
Under Alternative Scenarios . . . . . . . . . . . . . . . . . . . . . . . . . 19II.D7 Long-Range OASI and DI Combined Trust Fund Ratios
From Stochastic Modeling . . . . . . . . . . . . . . . . . . . . . . . . . . 20II.D8 OASDI Annual Balances: 2017 and 2018 Trustees Reports . . . 22
IV. ACTUARIAL ESTIMATESIV.A1 Short-Range OASI and DI Trust Fund Ratios . . . . . . . . . . . . . 43IV.B1 Long-Range OASI and DI Annual Income Rates
and Cost Rates . . . . . . . . . . . . . . . . . . . . . . . . . . . . . . . . . . . 58IV.B2 Number of OASDI Beneficiaries Per 100 Covered Workers . . 63IV.B3 Long-Range OASI and DI Trust Fund Ratios . . . . . . . . . . . . . 67IV.B4 OASDI Annual Balances: 2017 and 2018 Trustees Reports . . . 78
V. ASSUMPTIONS AND METHODS UNDERLYINGACTUARIAL ESTIMATES
V.C1 Primary-Insurance-Amount Formula for Those Newly Eligible in 2018 . . . . . . . . . . . . . . . . . . . . . . . . 118
V.C2 OASI Maximum-Family-Benefit Formula for Those Newly Eligible in 2018 . . . . . . . . . . . . . . . . . . . . . . . . 119
V.C3 DI Disability Incidence Rates, 1970-2095 . . . . . . . . . . . . . . . 135V.C4 DI Disability Termination Rates, 1970-2095 . . . . . . . . . . . . . 137V.C5 Comparison of DI Disability Incidence Rates,
Termination Rates and Conversion Ratios Under Intermediate Assumptions, 1970-2095 . . . . . . . . . . . . . . . . . . 138
V.C6 DI Disability Prevalence Rates, 1970-2095 . . . . . . . . . . . . . . 141
List of Figures
254
VI. APPENDICESVI.E1 Long-Range OASDI Cost Rates From Stochastic Modeling . . 192VI.E2 Long-Range OASDI Trust Fund Ratios From
Stochastic Modeling . . . . . . . . . . . . . . . . . . . . . . . . . . . . . . . 193VI.E3 OASDI Cost Rates: Comparison of Stochastic to Low-Cost,
Intermediate, and High-Cost Alternatives . . . . . . . . . . . . . . . 194VI.E4 OASDI Trust Fund (Unfunded Obligation) Ratios:
Comparison of Stochastic to Low-Cost, Intermediate, and High-Cost Alternatives . . . . . . . . . . . . . . . . . . . . . . . . . . 196
VI.G1 Estimated OASDI Income and Cost in CPI-indexed 2018 Dollars, Based on Intermediate Assumptions . . . . . . . . . 219
255
IndexINDEX
AActuarial balance 11, 16, 51, 164, 177Actuarial deficit 4, 16, 23, 69, 208Actuarial estimates, LR 51Actuarial estimates, SR 40Adjusted program amounts 114Administrative expenses 7, 35, 52, 151, 155, 171, 209, 217Advance tax transfers 40, 64, 157Amendments 37Annual balance 21, 51, 73Asset reserves 2, 7, 10, 29, 171, 184, 203Assumptions 10, 80, 98, 114, 164, 177, 204, 209, 214, 226Automatic cost-of-living benefit increase 44, 99, 114Auxiliary benefits 124Average benefits 148Average earnings assumptions 101Average indexed monthly earnings (AIME) 117Average wage index 114, 214Award 126
BBaby-boom generation 4, 23, 53, 61, 107, 133Bend points 117Beneficiaries, DI 132Beneficiary 13, 44, 61, 80, 115, 167, 178, 209, 217, 226Beneficiary, OASI 125Benefit payments 7, 52, 148, 155, 171Benefit termination 9Best estimate 9, 38, 80Board of Trustees 38, 98, 153
CConstant dollars 219Consumer Price Index 99, 182, 214, 231Contribution and benefit base 43, 101, 115, 231Contributions 7, 153, 171, 203, 209, 217, 230Cost 2, 47Cost rate 4, 52, 203Cost-of-living adjustment 114Covered earnings 7, 114, 213Covered employment 9, 43, 101, 122, 153, 181Covered worker 63, 179Creditable earnings 233Current dollars 214
Index
256
Current-payment status 46, 137, 138, 139, 232
DDeemed wage credit 52Delayed retirement credit 121Demographic assumptions 9, 21, 38, 81, 107, 114, 164, 215, 230Deterministic model 189, 198DI beneficiaries 132Disability 153, 180, 226Disability conversion ratio 137Disability incidence rate 80, 132, 135, 180, 186, 230Disability Insurance Trust Fund 232Disability prevalence rate 139, 141Disability termination rate 187Disabled-worker benefit 135, 234Disbursements 25, 27, 28, 30, 31, 33, 38, 171, 172, 173, 227, 229
EEarnings 2, 7, 43, 52, 101, 115, 153, 165, 203, 213, 214, 230Earnings test 102, 115, 231Economic assumptions 9, 21, 38, 49, 98, 107, 114, 164, 215, 230Excess wages 52, 214Expenditures 7, 9, 29, 36, 38, 155, 235
FFederal Insurance Contributions Act 203, 240Fertility assumptions 81Financial interchange 7, 151, 155Fiscal year 157, 170Full advance funding 236
GGeneral Fund of the Treasury 42, 44, 46, 48, 157, 159, 161, 174, 175, 176,230General fund reimbursement 236Gross domestic product 4, 11, 58, 80, 99, 109, 209Gross domestic product projections 109
HHigh-cost assumptions 9, 18, 38, 53, 80, 98, 136, 177, 197, 204, 210, 214,231Hospital Insurance program 145, 203, 239Hospital Insurance Trust Fund 209
IImmigration 9, 80, 86, 180, 189, 230, 237

257
Index
Immigration assumptions 86Income rate 4, 12, 52, 203Infinite horizon 11Inflation 9, 80, 99, 214, 230Inflation assumptions 99Insured population 9, 123Insured status 119Interest 110, 154, 164, 171, 205, 230Interest rate 80, 164, 184, 230Interest rate projections 110Interest rates 9Interfund borrowing 157, 237Intermediate assumptions 9, 38, 44, 53, 80, 135, 177, 205, 210, 214, 218,219, 220, 226, 230
LLabor force projections 106Lawful Permanent Resident (LPR) immigration 87Legal immigration 238Life expectancy 4, 23, 80, 95, 106, 238Life expectancy estimates 94Long range 11, 51, 81, 126, 164, 203, 209Low-cost assumptions 9, 18, 38, 53, 80, 98, 136, 177, 197, 204, 214, 230Lump-sum death payment 149
MMedicare 83, 239Military service 52, 153, 157, 159, 161
NNational average wage index 214Normal retirement age 115, 132, 149, 234
OOASI beneficiaries 125Old-Age and Survivors Insurance Trust Fund 153, 232Old-law base 119Other-than-LPR immigration 87
PPar value 155Partial advance funding 240Pay-as-you-go financing 164Payroll taxes 2, 114, 142, 167, 199, 203, 217Population estimates 92Population in the Social Security area 43, 63, 92, 122, 180

Index
258
Present value 164Primary insurance amount (PIA) 117Productivity assumptions 99
QQuarters of coverage 123
RRailroad Retirement 52, 68, 119, 151, 155, 171, 172, 173, 203, 209, 217,232Reallocation of tax rates 241Real-wage differential 104, 181Retired-worker benefit 126, 179, 226Retirement age 115, 149, 234Retirement earnings test 101, 115Retirement eligibility age 179
SScenario-based model 242Scheduled benefits 183, 209, 217, 228, 242Self-employment 52, 100, 204, 240Self-Employment Contributions Act 240, 242Sensitivity analysis 177Short range 10, 40, 126Social Security Act 114, 154, 214, 226, 232Social Security amendments 37Solvency 242Special public-debt obligation 113, 154, 184Stochastic projections 189Substantial gainful activity 132, 234Summarized balance 210Summarized income and cost rates 68, 164, 177, 207, 230Supplemental Security Income 171Supplementary Medical Insurance program 203, 239Survivor benefit 2, 8, 129, 231Sustainable solvency 64, 65
TTaxable earnings 43, 63, 115, 165, 231Taxable payroll 4, 23, 52, 100, 123, 164, 178, 203, 209, 214, 233Taxable ratio 185Taxable self-employment income 244Taxable wages 147, 204, 244Taxation of benefits 7, 147, 209, 217, 237Taxes 7, 114, 204

259
Index
Termination 80Termination rate 9, 126, 187, 230Test of short-range financial adequacy 40, 41, 242Total fertility rate 81, 177Trust fund financial operations 7, 25, 41, 153Trust fund ratio 10, 40, 51, 64, 157, 174, 246Trust fund reserves 40
UUnemployment projections 106Unfunded obligation 4, 11, 16, 18, 51, 71, 72, 200, 201, 202, 240, 246, 247Unnegotiated check 171
VValuation period 16, 49, 51, 164, 177, 207, 230Vocational rehabilitation 52, 155, 172, 209, 217, 228, 233
YYear of depletion 12, 15, 51, 66

260
STATEMENT OF ACTUARIAL OPINION
It is my opinion that, with the important caveat noted below: (1) the tech-niques and methodology used herein to evaluate the actuarial status of theFederal Old-Age and Survivors Insurance and Disability Insurance TrustFunds are based upon sound principles of actuarial practice and are generallyaccepted within the actuarial profession; and (2) the assumptions used andthe resulting actuarial estimates are, individually and in the aggregate, rea-sonable for the purpose of evaluating the actuarial status of the trust funds,taking into consideration the past experience and future expectations for thepopulation, the economy, and the program. I am an Associate of the Societyof Actuaries, a member of the American Academy of Actuaries, and I meetthe Qualification Standards of the American Academy of Actuaries to renderthe actuarial opinion contained herein.
Federal Budget Accounting
This report focuses on the actuarial status of the OASI and DI Trust Funds,as required by law. It includes important information on (1) the years inwhich trust fund asset reserves are projected to be depleted and (2) thedegree to which benefits scheduled in the law would no longer be fully pay-able on a timely basis after reserve depletion. However, the footnote onpage 44 of this report directs the reader to an appendix in the Medicare Trust-ees Report, which states, “The trust fund perspective does not encompass theinterrelationship between the Medicare and Social Security trust funds andthe overall Federal budget.” The reader of this report should consider this“overall” Federal unified budget perspective with care because the assump-tions underlying unified budget accounting are inconsistent with the assump-tions of trust fund accounting.
In particular, trust fund accounting accurately reflects the law, under whichbenefits cannot be paid in full on a timely basis after reserve depletion. Incontrast, unified budget accounting assumes that full scheduled benefits willcontinue to be paid through transfers from the General Fund of the Treasury,thus representing “a draw on other Federal resources for which there is noearmarked source of revenue from the public.” Not only are such “draws”not permissible under the law, no precedent exists for a change in the SocialSecurity Act to finance unfunded trust fund obligations with such draws onother Federal resources. Under this unified budget accounting assumption,$13.2 trillion of OASDI unfunded obligations, which are not payable underthe law over the next 75 years, are referred to as “expenditures” requiring a“draw” from the General Fund of the Treasury.

261
In addition, unified budget accounting treats redemptions of trust fundreserves as an addition to annual Federal deficits, referring to these redemp-tions also as “a draw on other Federal resources.” In fact, redemptions oftrust fund reserves represent a deferred use of revenues earmarked for thetrust fund program alone, which have been collected in prior years and savedfor later use. These redemptions utilize the entire $2.9 trillion accumulationof net past earmarked revenue for OASDI, but are referred to as draws on theGeneral Fund of the Treasury under the unified budget perspective.
Therefore, the actual operations of the trust funds under current law do notdraw on other Federal resources. Expenditures can only be paid from currentor deferred earmarked resources for the specific program financed from thetrust fund. Assertions that trust fund reserve redemption and shortfalls afterreserve depletion represent draws on other Federal resources are based onassumptions that are inconsistent with the law and with actual trust fundannual cash-flow operations.
In addition to Federal budget annual cash flows, the budget perspective isequally concerned with the build-up of Federal debt. The total Federal debtsubject to limit includes trust fund reserves. Thus, as trust fund reserves areaccumulated or redeemed, they are offset in the total Federal debt by securi-ties issued to the public, with no net effect on the total Federal debt. More-over, even in considering the Federal debt owed to (held by) the public, thereis no net direct effect on that debt from accumulating and then redeemingtrust fund asset reserves. However, budget analysis frequently refers to bothtrust fund reserve redemptions and trust fund obligations not payable underthe law after reserve depletion as factors that increase the Federal debt heldby the public in the future. This assertion is not consistent with a full assess-ment of the investment and redemption flows of the trust funds or with thelimitations in the law on paying benefits after trust fund reserves aredepleted.
Stephen C. Goss
Associate of the Society of ActuariesMember of the American Academy of ActuariesChief Actuary, Social Security Administration


![2016 Annual Report - Alberta Automobile Insurance Rate Board · AUTOMOBILE INSURANCE RATE BOARD 201 Annual Report pg i [Original signed by Allan Cleiren] LETTER OF TRANSMITTAL AND](https://img.pdfslide.net/doc/110x75/5b7e93cb7f8b9abe0e8de080/2016-annual-report-alberta-automobile-insurance-rate-automobile-insurance.jpg)