Embed Size (px)
Citation preview
The 2018 Diary of Consumer Payment Choice
2019 ● No. 19-03 Claire Greene and Joanna Stavins
Abstract
This paper describes key results from the 2018 Diary of Consumer Payment Choice (DCPC), the fifth in a
series of diary surveys that measure payment behavior through the daily recording of the spending of
U.S. consumers. The DCPC is the only diary survey of U.S. consumer payments with data and results that
are available to the public without a fee. In October 2018, consumers made more payments with debit
cards than with any other payment instrument (28 percent of payments). Cash, in all prior diary years
the most-used payment instrument, followed with 26 percent of payments. Together with credit cards
(23 percent), these instruments accounted for slightly more than three-quarters of the number of
payments. By value, electronic payments accounted for 36 percent of the value of total payments, a
statistically significant increase from 2017. The value share of payments made with paper instruments
continued its steady decline, from 31 percent in 2015 to 23 percent in 2018. The average value of a cash
transaction was $21, compared with $206 for the average noncash transaction (and $92 for all
transactions). The average value of consumers’ holdings of cash on their persons (in pocket, purse, or
wallet) was about $60.
Keywords: cash, checks, checking accounts, debit cards, credit cards, prepaid cards, electronic payments, payment preferences, Diary of Consumer Payment Choice JEL Classifications: D12, D14, E42
Claire Greene is a payments risk expert at the Federal Reserve Bank of Atlanta. Joanna Stavins is a senior economist and policy advisor at the Federal Reserve Bank of Boston. Their email addresses are [email protected] and [email protected], respectively. Acknowledgments appear on the first page of this report. The primary authors are responsible for any errors. This paper presents preliminary analysis and results intended to stimulate discussion and critical comment. The views expressed herein are those of the authors and do not indicate concurrence by the Federal Reserve Bank of Boston, the Federal Reserve Bank of Atlanta, the principals of the Board of Governors, or the Federal Reserve System. This report, which may be revised, is available at www.frbatlanta.org/banking-and-payments/consumer-payments/research-data-reports.aspx.
This version: November 25, 2019
Acknowledgments
The Diary of Consumer Payment Choice is a collaboration of the Federal Reserve Banks of Atlanta,
Boston, Richmond, and San Francisco (Cash Product Office).
The following individuals contributed directly to the production and dissemination of the 2018 Diary of
Consumer Payment Choice. From the Atlanta Fed are Kevin Foster, Claire Greene, Marcin Hitczenko,
Brian Prescott, and Oz Shy. From the Boston Fed are Joanna Stavins and Liang Zhang. From the
Richmond Fed is Sam Storey. From the San Francisco Fed, Cash Product Office are Doug Conover, Tayeba
Maktabi, and Shaun O’Brien. From the University of Southern California are Marco Angrisani, Tania
Gutsche, Arie Kapteyn, Bart Orriens, and Albert Weerman.
2
1. Introduction
The 2018 Diary of Consumer Payment Choice (DCPC) is the fifth official study conducted by the Federal
Reserve Banks of Atlanta, Boston, Richmond, and San Francisco to gain a comprehensive understanding
of the cash- and noncash-payment behavior of U.S. adult consumers (ages 18 and older).1 This report
contains results for 2018 and includes estimates of the number, value, and average value of payments
that all U.S. adult consumers made using U.S. payment instruments. It also includes estimates of cash
held on person (pocket, purse, or wallet) by denomination of currency.
The DCPC collects data on individual payments from daily records kept by consumers, including the
dollar values of payments. Because this daily recording method differs from the recall method used by
the Survey of Consumer Payment Choice (SCPC), estimates from the two surveys are not directly
comparable. For more details about the SCPC, see Foster, Greene, and Stavins (2019); Greene, Schuh,
and Stavins (2018); Greene and Schuh (2017); Greene, O’Brien, and Schuh (2017); Sampranathak, Schuh,
and Townsend (2017); and Schuh (2017).
This report focuses on estimates of the level of consumer payment use in 2018—that is, the number and
value of consumer payments. It also discusses changes from 2017 to 2018. Tables 1–9 report results for
2015 through 2018. Due to fewer respondents (1,016) in 2015, results for that year may not be
comparable to later years, when the numbers of respondents were more similar (2,848 in 2016, 2,793 in
2017, and 2,873 in 2018). In addition, the calendar periods when respondents recorded their payments
are aligned for 2016, 2017, and 2018 (October) and different from the 2015 calendar period (mid-
October to mid-November). Each year’s questionnaire includes modest changes, so the reader should
exercise caution when interpreting estimates of changes in payment behavior.
All DCPC data, along with technical documentation, are available to the public free of charge.
Throughout the paper, small discrepancies in the estimates may exist due to rounding. The data may be
revised in the future should important new information or analysis warrant doing so.
The remainder of this report is organized as follows. Section 2 provides an overview of the number and
value of payments for 2018 and describes changes relative to 2017. Section 3 reports estimates of the
level of consumer payment use by payment instrument and describes the implied changes in payment
instrument use from 2017 to 2018. Section 4 shows how payment instrument choice in 2018 differs for
purchases and bills. Section 5 reports whom consumers paid: consumers, businesses, and government.
1 The first official study was the 2012 Diary of Consumer Payment Choice (DCPC), which is described in detail in Greene, Schuh, and Stavins (2018).
3
Section 6 focuses on the use of cash and electronic devices, and Section 7 on cash holdings. Section 8
concludes the report. An appendix summarizes the underlying survey methodology.
2. Number and Value of Payments
U.S. consumers made on average 43 payments for the month2 (Table 1). Thus, on average, an adult
consumer made 1.4 payments per day. Notably, an average of 14 percent of consumers per day
reported making zero payments.
U.S. consumers made on average $3,999 worth of payments for the month. Consumer payments are not
the same as consumer (or household) expenditures, consumption, or income, so the estimated value of
consumer payments (and its growth rate) should not be compared with data on expenditure or income.
For example, this estimate does not include payments made on consumers’ behalf by other parties
(such as other household members, other family or friends, employers, insurers, or the government).
Dividing the value of payments by the number of payments yields an average value per consumer
payment of $92 (Table 2).
The number of consumer payments increased about 5 percent (that is, by 2 payments) compared with
October 2017 (41.0 payments per consumer per month), yet remains lower than the number of
payments reported in October 2016, which was 46. The total value of payments increased by $580 from
$3,419 in 2017, and is $83 more than the total value in 2016 ($3,916). The average dollar value of a
payment increased from $83 in 2017 to $92 in 2018, an increase that is not statistically significant (Table
2).
With the exception of 2017, the total value of payments increased from 2015 through 2018. The 2017
decline was unexpected. Although the total value of payments (which includes payments made for
savings, investment, and taxes) is not comparable to consumer expenditures (which include
expenditures made by the government, employers, or insurers on a consumer’s behalf and exclude
savings, investment, and taxes), one could expect it to grow in line with inflation and economic growth.
(For further discussion, see Greene and Stavins 2018.)
2 All the data reported in this paper refer to October 2018, unless specified otherwise.
4
3. Number and Value of Payments by Instrument
U.S. consumers made more than half of their payments with payment cards (debit, credit, and prepaid):
54 percent, or 23 payments. They used paper instruments (cash, checks, and money orders) for 32
percent, or 14 payments; electronic methods for 11 percent or 5 payments;3 and 4 percent, or 2
payments, through other methods4 (Table 1). Compared with 2017, the volume share of cards and
electronic instruments increased and the volume shares of paper instruments declined. All of those
changes are statistically significant.
Although cards were used more frequently than electronic payments, the values were approximately
equal for cards and for electronic instruments. Consumers on average each made $1,431 worth of
payments for the month using electronic instruments (36 percent of total), $1,245 using payment cards
(31 percent), and $929 using paper instruments (23 percent) (Table 1). The increase in the value share of
electronic payments from October 2017 was not statistically significant.
Debit cards, cash, and credit cards remain the most popular ways to pay,5 with debit cards used most by
number of payments (Table 1). Twenty-eight percent of payments were with debit cards, 26 percent
with cash, and 23 percent with credit cards. Altogether, consumers made about three-quarters of their
payments using debit cards, cash, and credit cards.
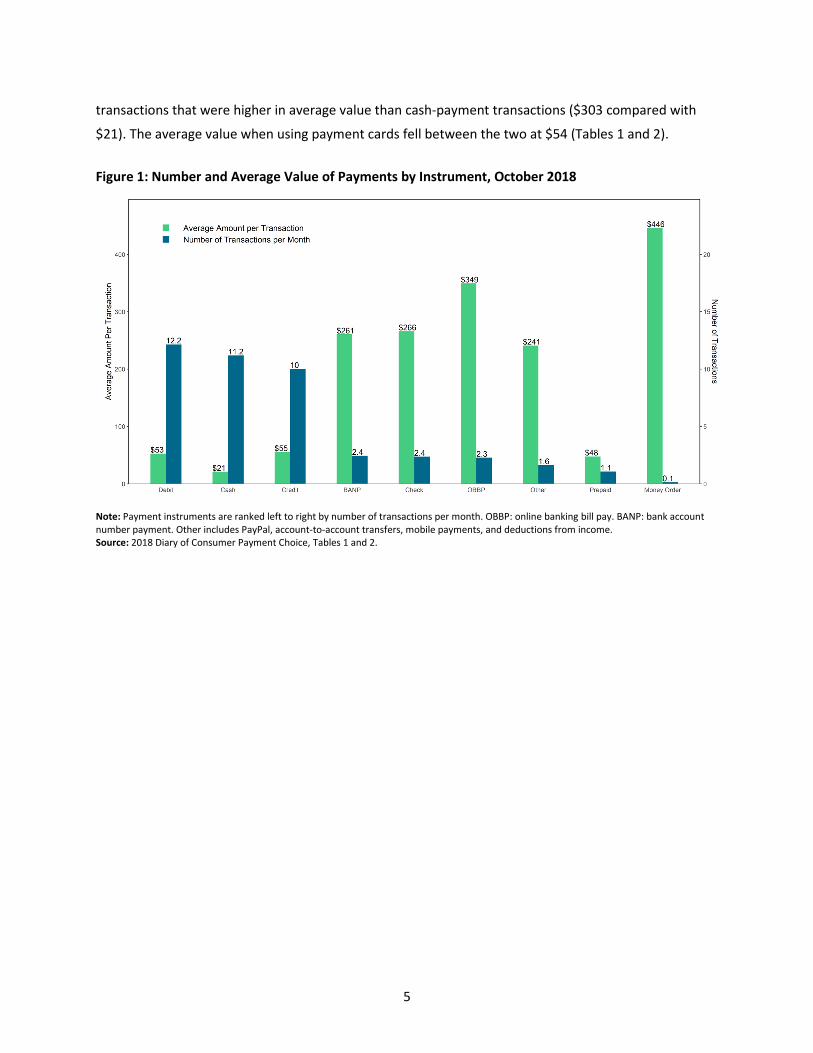
The distribution by value is different. Cash, debit, and credit payments accounted for 36 percent of the
value of their payments: 6 percent in cash, 16 percent in debit cards, and 14 percent in credit cards. The
combined value share of cash, debit, and credit decreased from 39 percent in 2017 (Table 1). The
increase from 2016 is not statistically significant. The difference between the distribution by volume and
by value reflects that consumers tend to use cash and payment cards more often, but for relatively low-
value payments, while they tend to use checks and electronic payments less often, but for relatively
high-value payments (Figures 1 and 2). For example, U.S. consumers on average made fewer electronic-
instrument payments than cash payments (5 compared with 11), but they used electronic payments for
3 The electronic payment instruments are defined as follows. Bank account number payment (BANP): a payment made by providing one’s bank account number to a third party, such as one’s employer or a utility company. The number can be given on websites, paper forms, and more. Online banking bill payment (OBBP): a payment made from a bank’s online banking website or online mobile app that accesses funds from a customer’s checking or savings account to pay a bill or to pay other people. This payment does not require the customer or the bank to disclose his or her bank account number to a third party.
4 Other methods include income deduction, PayPal, account-to-account transfers (using apps such as Zelle and Venmo), and mobile payments.
5 Debit, cash, and credit are also the three most frequently used payment instruments by consumers in the SCPC. See Foster, Greene, and Stavins (2019).
5
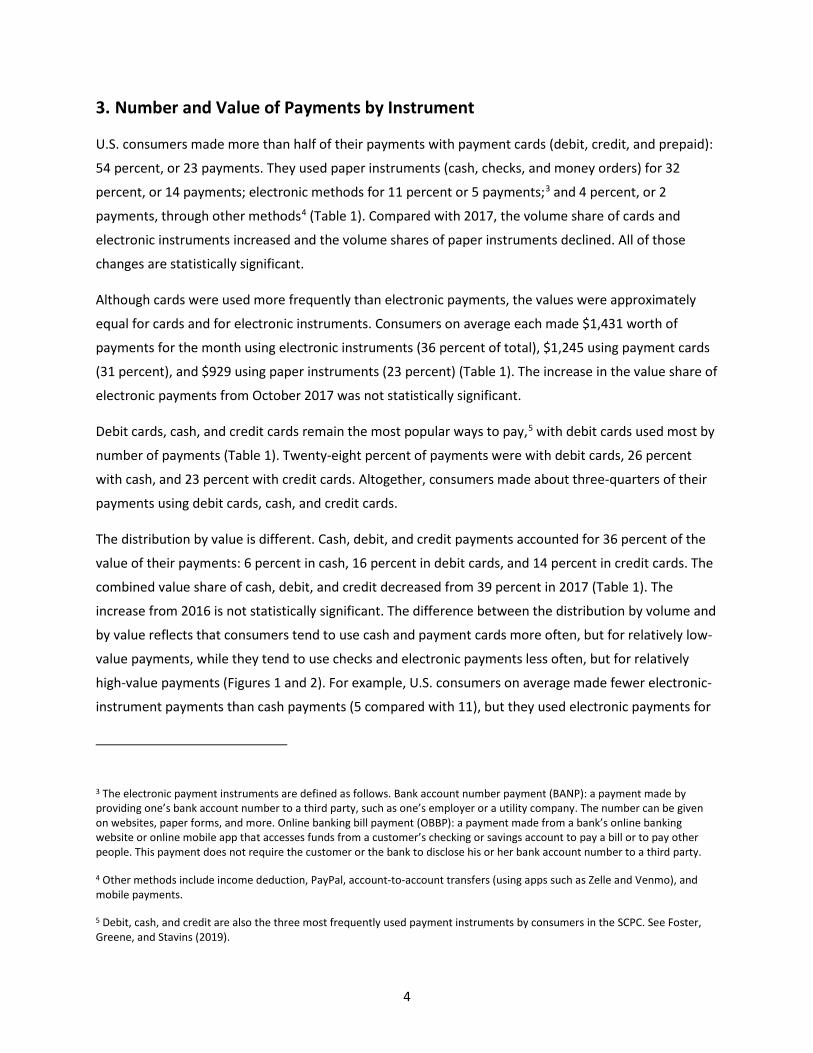
transactions that were higher in average value than cash-payment transactions ($303 compared with
$21). The average value when using payment cards fell between the two at $54 (Tables 1 and 2).
Figure 1: Number and Average Value of Payments by Instrument, October 2018
Note: Payment instruments are ranked left to right by number of transactions per month. OBBP: online banking bill pay. BANP: bank account number payment. Other includes PayPal, account-to-account transfers, mobile payments, and deductions from income. Source: 2018 Diary of Consumer Payment Choice, Tables 1 and 2.
6
Figure 2: Percentage Shares of Payments by Number and Value, October 2018
Source: 2018 Diary of Consumer Payment Choice, Table 1.
Changes in the Number and Value of Payments by Instrument
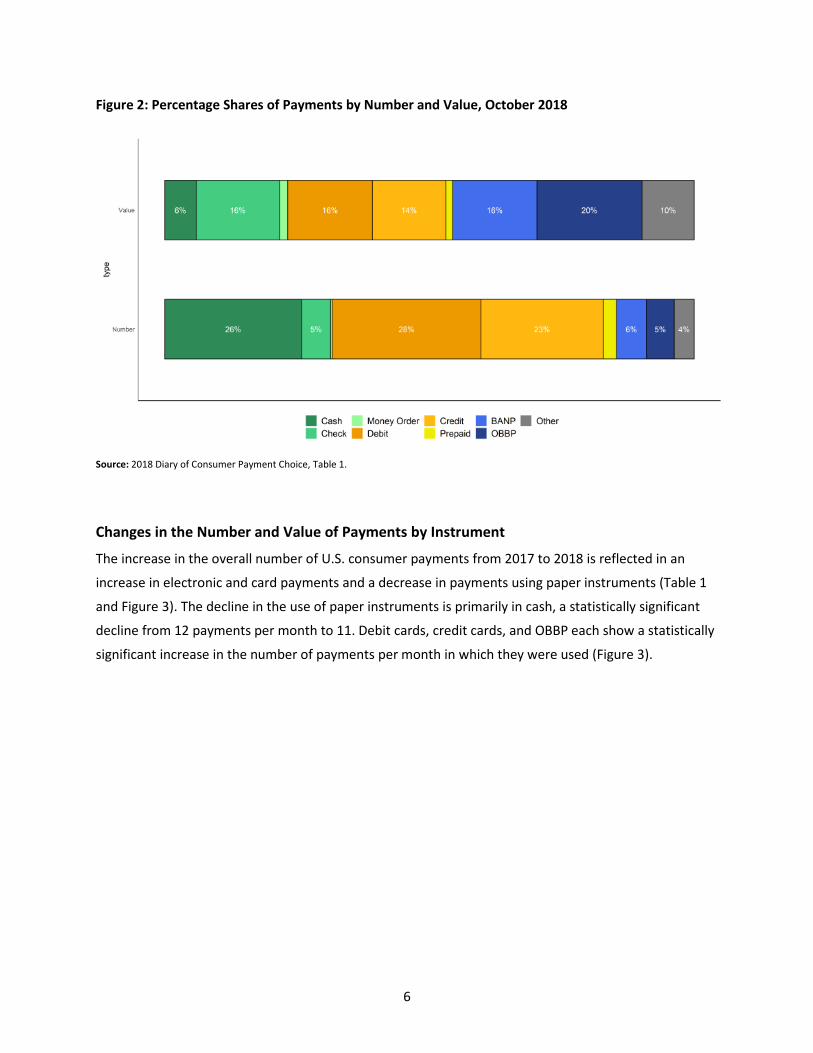
The increase in the overall number of U.S. consumer payments from 2017 to 2018 is reflected in an
increase in electronic and card payments and a decrease in payments using paper instruments (Table 1
and Figure 3). The decline in the use of paper instruments is primarily in cash, a statistically significant
decline from 12 payments per month to 11. Debit cards, credit cards, and OBBP each show a statistically
significant increase in the number of payments per month in which they were used (Figure 3).
7
Figure 3: Changes in the Number of Payments per Month by Payment Instrument, 2017 to 2018
Notes: The vertical lines depict the 95 percent confidence intervals of the changes in the number of payments between 2017 and 2018, and the numbered dots depict the point estimates. Confidence intervals that lie entirely above or below the horizontal zero line indicate changes that are statistically significantly different from zero. Money orders are omitted from this figure. Source: 2017 and 2018 Diary of Consumer Payment Choice
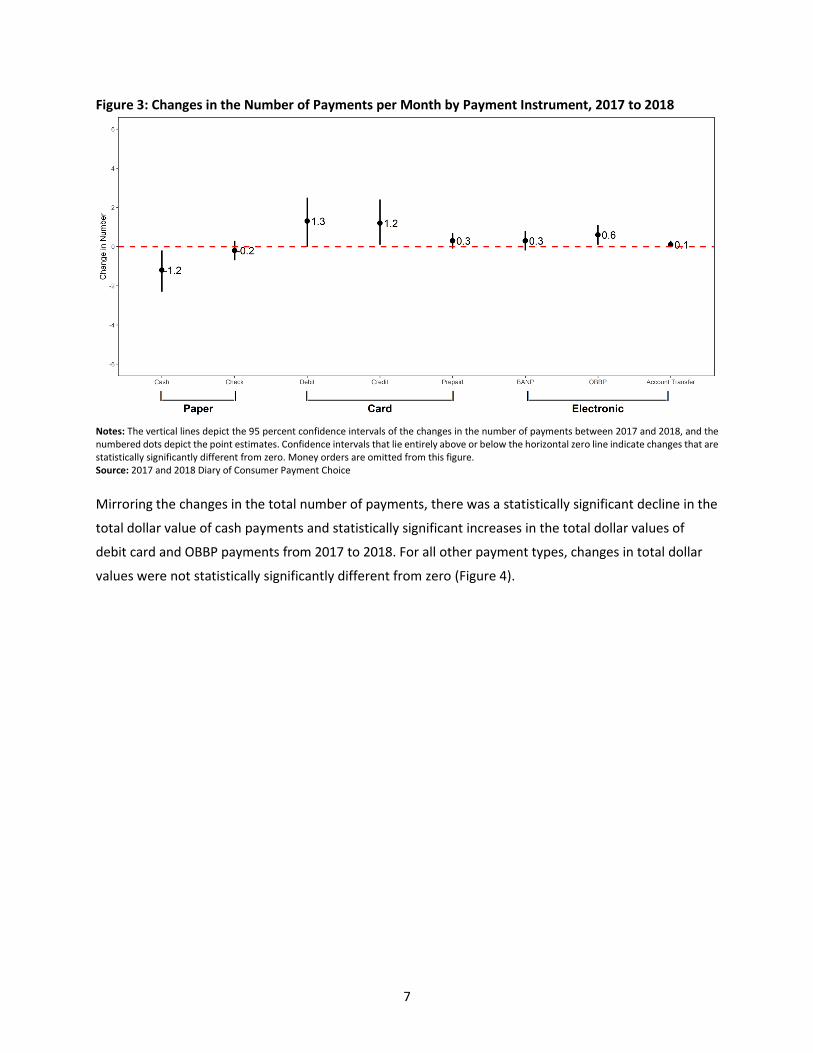
Mirroring the changes in the total number of payments, there was a statistically significant decline in the
total dollar value of cash payments and statistically significant increases in the total dollar values of
debit card and OBBP payments from 2017 to 2018. For all other payment types, changes in total dollar
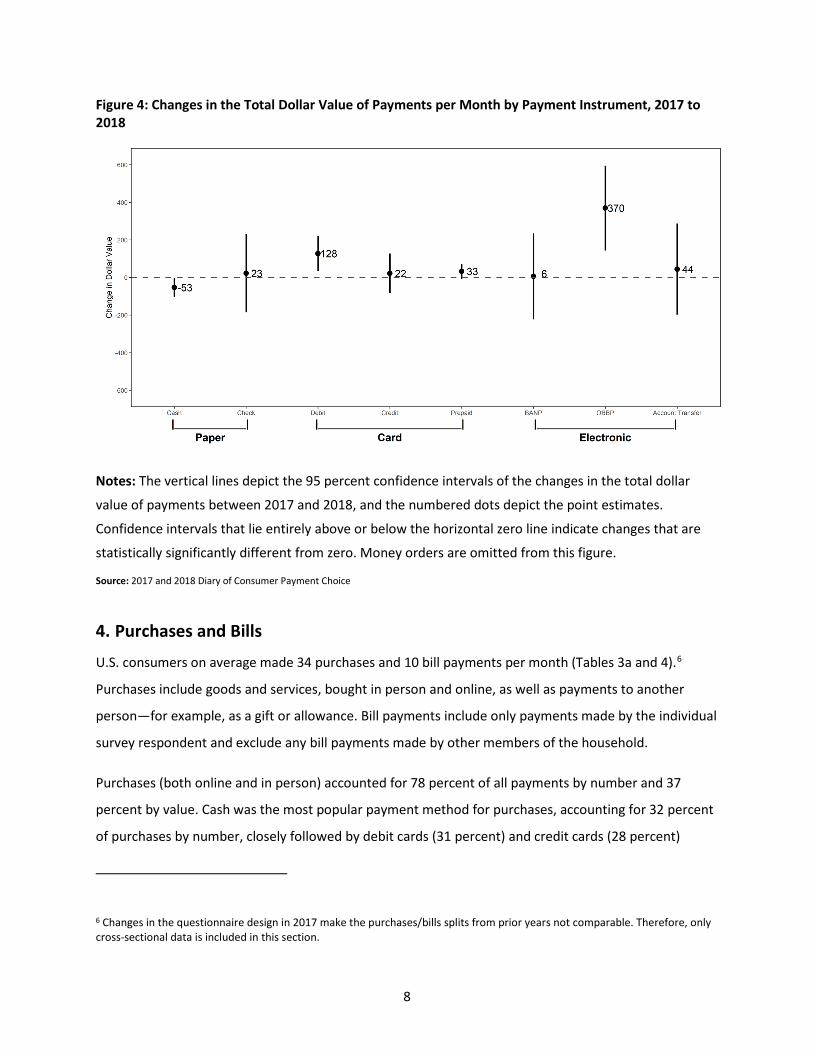
values were not statistically significantly different from zero (Figure 4).
8
Figure 4: Changes in the Total Dollar Value of Payments per Month by Payment Instrument, 2017 to 2018
Notes: The vertical lines depict the 95 percent confidence intervals of the changes in the total dollar
value of payments between 2017 and 2018, and the numbered dots depict the point estimates.
Confidence intervals that lie entirely above or below the horizontal zero line indicate changes that are
statistically significantly different from zero. Money orders are omitted from this figure.
Source: 2017 and 2018 Diary of Consumer Payment Choice
4. Purchases and Bills
U.S. consumers on average made 34 purchases and 10 bill payments per month (Tables 3a and 4).6
Purchases include goods and services, bought in person and online, as well as payments to another
person—for example, as a gift or allowance. Bill payments include only payments made by the individual
survey respondent and exclude any bill payments made by other members of the household.
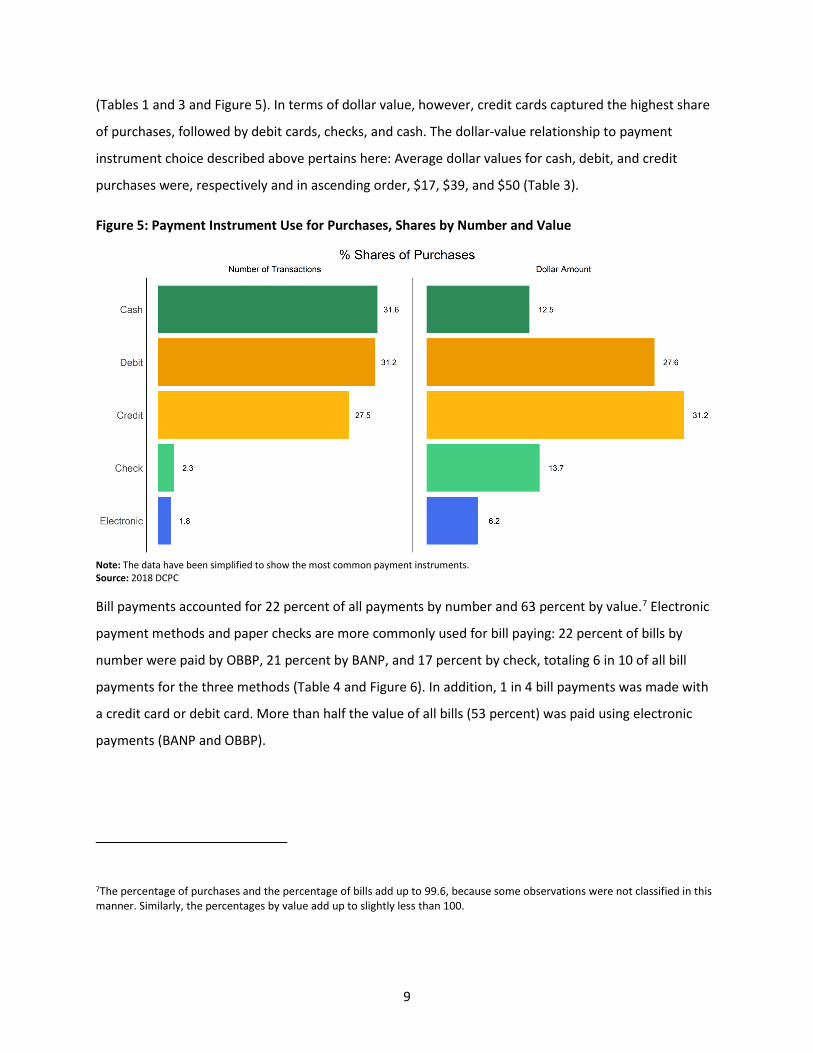
Purchases (both online and in person) accounted for 78 percent of all payments by number and 37
percent by value. Cash was the most popular payment method for purchases, accounting for 32 percent
of purchases by number, closely followed by debit cards (31 percent) and credit cards (28 percent)
6 Changes in the questionnaire design in 2017 make the purchases/bills splits from prior years not comparable. Therefore, only cross-sectional data is included in this section.
9
(Tables 1 and 3 and Figure 5). In terms of dollar value, however, credit cards captured the highest share
of purchases, followed by debit cards, checks, and cash. The dollar-value relationship to payment
instrument choice described above pertains here: Average dollar values for cash, debit, and credit
purchases were, respectively and in ascending order, $17, $39, and $50 (Table 3).
Figure 5: Payment Instrument Use for Purchases, Shares by Number and Value
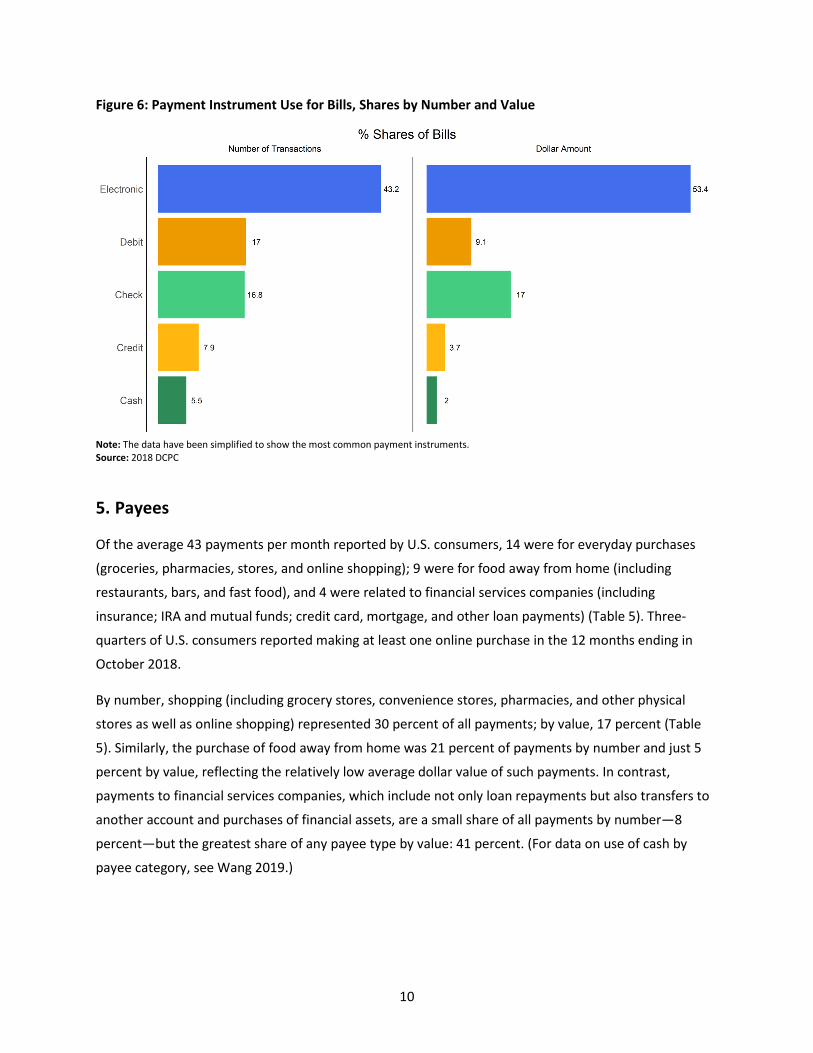
Note: The data have been simplified to show the most common payment instruments. Source: 2018 DCPC Bill payments accounted for 22 percent of all payments by number and 63 percent by value.7 Electronic
payment methods and paper checks are more commonly used for bill paying: 22 percent of bills by
number were paid by OBBP, 21 percent by BANP, and 17 percent by check, totaling 6 in 10 of all bill
payments for the three methods (Table 4 and Figure 6). In addition, 1 in 4 bill payments was made with
a credit card or debit card. More than half the value of all bills (53 percent) was paid using electronic
payments (BANP and OBBP).
7The percentage of purchases and the percentage of bills add up to 99.6, because some observations were not classified in this manner. Similarly, the percentages by value add up to slightly less than 100.
10
Figure 6: Payment Instrument Use for Bills, Shares by Number and Value
Note: The data have been simplified to show the most common payment instruments. Source: 2018 DCPC
5. Payees
Of the average 43 payments per month reported by U.S. consumers, 14 were for everyday purchases
(groceries, pharmacies, stores, and online shopping); 9 were for food away from home (including
restaurants, bars, and fast food), and 4 were related to financial services companies (including
insurance; IRA and mutual funds; credit card, mortgage, and other loan payments) (Table 5). Three-
quarters of U.S. consumers reported making at least one online purchase in the 12 months ending in
October 2018.
By number, shopping (including grocery stores, convenience stores, pharmacies, and other physical
stores as well as online shopping) represented 30 percent of all payments; by value, 17 percent (Table
5). Similarly, the purchase of food away from home was 21 percent of payments by number and just 5
percent by value, reflecting the relatively low average dollar value of such payments. In contrast,
payments to financial services companies, which include not only loan repayments but also transfers to
another account and purchases of financial assets, are a small share of all payments by number—8
percent—but the greatest share of any payee type by value: 41 percent. (For data on use of cash by
payee category, see Wang 2019.)
11
6. Use of Cash and Electronic Devices
Consumer payment diaries make it possible to track detailed use and management of cash, transaction
by transaction, during the course of a day. The DCPC reflects two important differences between cash
and other payment methods. First, cash payments account for a relatively large proportion of the
number of payments, as mentioned above. Of the total number of payments, 26 percent on average
involved cash. About a dozen other payment instruments accounted for the remaining 74 percent. A
second difference is that cash payments account for a relatively small proportion of the value of
payments. Of a consumer’s total payment value, only 6 percent on average was funded using cash. The
average value of a cash payment was $21, compared with $206 for the average value of all other
payments, and the average cash purchase was even lower in value, at $17 (Tables 2 and 3). (For details
on cash use, see Kumar and O’Brien 2019.)
Of course, it is not possible to make cash payments with electronic devices (computer, tablet, mobile
phone), so one could consider these electronic means of making payments the flip side of paying with
cash. In 2018, 24 percent of all payments were made using electronic devices. Of those, one-third—that
is, 8 percent of all payments—were made using a mobile phone.
7. Cash Holdings
The DCPC obtains data on consumers’ holdings of cash on their person (pocket, purse, or wallet) and
stored elsewhere (home, car, office, and such). The data on cash holdings were collected every night
during the diary recording period; the data on stored cash were collected on the first and final nights of
the survey. For both measures, respondents were asked to count by denomination the exact number of
bills held by denomination, and the online questionnaire automatically summed the dollar values of cash
holdings by denomination and in total. Holdings of coins were not reported.
A U.S. consumer held on average $58 of cash on his or her person each day, statistically unchanged from
cash holdings in 2016 and 2017.8 By value, about half of the cash on person was in the form of $20 bills
and one-quarter was in $100 bills (Table 6).
Fewer consumers store cash elsewhere. While 80 percent of consumers held at least $1 on their persons
on at least one of their diary days, just 32 percent had at least $1 stored elsewhere. For all consumers,
the average value of cash stored elsewhere was $158. Among the subset of consumers who had some
8 Cash holdings were calculated using day-of-week weights. The results were not statistically different from those using individual weights. Please see the Technical Appendix for more details on the weighting methodology.
12
stored cash, the average value of that cash was $654. As one might expect, most of the value of stored
cash was carried in $100 bills: almost three-quarters of the value of stored cash. (As documented
elsewhere [Judson 2017, Greene, and Schuh 2017], by value, most currency in circulation is not stored
with U.S. consumers.)
8. Conclusion
Data from the 2018 Diary of Consumer Payment Choice show that consumers continue to use debit
cards, cash, and credit cards for most of their payments by number. In particular, consumers tend to use
cash and cards for lower-value transactions, and electronic payments for high-value transactions. The
average dollar value of an electronic payment, for example, is $303, compared to $54 average dollar
value for card transactions. Cash is the most popular payment instrument by number for purchases,
accounting for 3 in 10 purchases, and electronic methods linked to a bank account are used for more
than 4 in 10 bill payments by number. By value, debit cards and credit cards represent almost 60 percent
of purchases. Also by value, electronic methods account for more than half of bill payments. Consumer
holdings of cash have been stable over the three years 2016, 2017, and 2018.
13
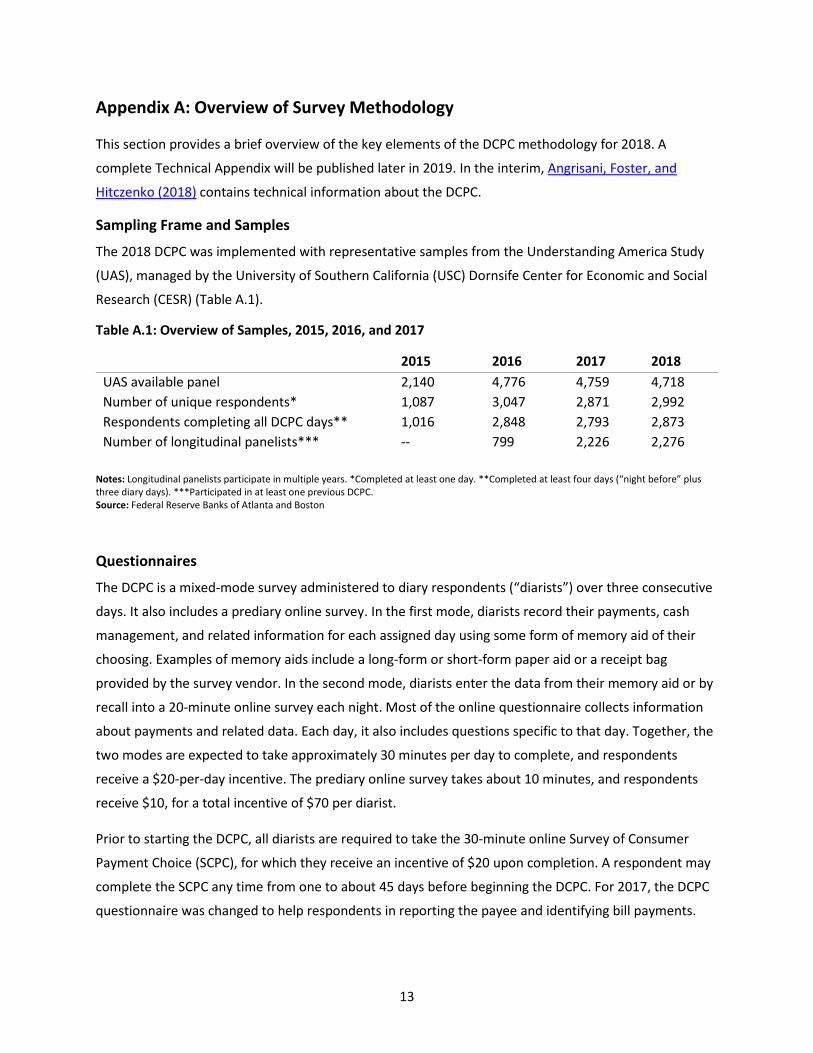
Appendix A: Overview of Survey Methodology
This section provides a brief overview of the key elements of the DCPC methodology for 2018. A
complete Technical Appendix will be published later in 2019. In the interim, Angrisani, Foster, and
Hitczenko (2018) contains technical information about the DCPC.
Sampling Frame and Samples
The 2018 DCPC was implemented with representative samples from the Understanding America Study
(UAS), managed by the University of Southern California (USC) Dornsife Center for Economic and Social
Research (CESR) (Table A.1).
Table A.1: Overview of Samples, 2015, 2016, and 2017
2015 2016 2017 2018 UAS available panel 2,140 4,776 4,759 4,718 Number of unique respondents* 1,087 3,047 2,871 2,992 Respondents completing all DCPC days** 1,016 2,848 2,793 2,873 Number of longitudinal panelists*** -- 799 2,226 2,276
Notes: Longitudinal panelists participate in multiple years. *Completed at least one day. **Completed at least four days (“night before” plus three diary days). ***Participated in at least one previous DCPC. Source: Federal Reserve Banks of Atlanta and Boston
Questionnaires
The DCPC is a mixed-mode survey administered to diary respondents (“diarists”) over three consecutive
days. It also includes a prediary online survey. In the first mode, diarists record their payments, cash
management, and related information for each assigned day using some form of memory aid of their
choosing. Examples of memory aids include a long-form or short-form paper aid or a receipt bag
provided by the survey vendor. In the second mode, diarists enter the data from their memory aid or by
recall into a 20-minute online survey each night. Most of the online questionnaire collects information
about payments and related data. Each day, it also includes questions specific to that day. Together, the
two modes are expected to take approximately 30 minutes per day to complete, and respondents
receive a $20-per-day incentive. The prediary online survey takes about 10 minutes, and respondents
receive $10, for a total incentive of $70 per diarist.
Prior to starting the DCPC, all diarists are required to take the 30-minute online Survey of Consumer
Payment Choice (SCPC), for which they receive an incentive of $20 upon completion. A respondent may
complete the SCPC any time from one to about 45 days before beginning the DCPC. For 2017, the DCPC
questionnaire was changed to help respondents in reporting the payee and identifying bill payments.
14
These changes mean that results for the breakdowns of bills and purchases are not comparable between
2016 and 2017/2018. All questionnaires are posted online.
Diary Implementation
Diarists are randomly chosen to begin participating in the DCPC each day throughout the defined sample
period for the year. Thus, each new diary wave contains a small sample of respondents (an average of
87 per day in 2018) that is, on average, representative of all U.S. consumers. Diary waves are staggered
to start two days before the official beginning of the DCPC and end two days after the official end date.
This way, each day contains approximately one-third of respondents who are completing each day of
the diary (one, two, or three) and every day-specific group of questions occurs on each day of the
month. As a result of this implementation strategy, DCPC data provide aggregate estimates that are
representative of all U.S. consumers on average for each day of the sample period (day-of-the-month
weights) and, under certain assumptions about temporal trends, for the sum of all days in the sample
period (monthly weights), usually the month of October.
In addition, the data provide strong evidence that payment behavior is heavily influenced by a weekly
cycle, with different behaviors on different days of the week. As a result, a hybrid approach for the
estimates generates estimates for each day of the week by pooling across the relevant monthly data and
then aggregates these to generate estimates for any particular period of time. (Also see Angrisani,
Foster, and Hitczenko [2017]; Angrisani, Foster, and Hitczenko [2018]; and Angrisani, Foster, and
Hitczenko [forthcoming].)
Data Preprocessing
All DCPC survey responses reported here have been analyzed for errors, inconsistencies, and influential
outlier effects. Where necessary, the DCPC data have been cleaned and adjusted using statistical
methods similar to methods used previously and reported in earlier SCPC and DCPC technical
appendices. Because consumer payments and cash management behavior exhibit significant day-of-the-
week effects, and calendar months can vary notably across years in their composition of days of the
week, the raw data contain seasonal fluctuations. The results for this report use revised sampling
weights that attempt to adjust for differences in consumer payment behaviors across days of the week
within each year.
15
References
Angrisani, Marco; Kevin Foster; and Marcin Hitczenko. 2017. “The 2012 Diary of Consumer Payment Choice: Technical Appendix.” Federal Reserve Bank of Boston Research Data Reports no. 17-5. Available at https://www.frbatlanta.org/banking-and-payments/consumer-payments/research-data-reports/2017/the-2012-diary-of-consumer-payment-choice-technical-appendix.aspx?panel=1.
Angrisani, Marco; Kevin Foster; and Marcin Hitczenko. 2018. “The 2015 and 2016 Diaries of Consumer Payment Choice: Technical Appendix.” Federal Reserve Bank of Boston Research Data Reports no. 18-2. Available at https://www.frbatlanta.org/banking-and-payments/consumer-payments/research-data-reports/2018/the-2015-and-2016-diaries-of-consumer-payment-choice-technical-appendix.aspx?panel=1.
Angrisani, Marco, Kevin Foster, and Marcin Hitczenko. Forthcoming. “The 2018 Survey and Diary of Consumer Payment Choice: Technical Appendix.” Federal Reserve Bank of Atlanta Research Data Reports.
Foster, Kevin; Claire Greene; and Joanna Stavins. 2019. “The 2018 Survey of Consumer Payment Choice: Summary Results.” Federal Reserve Bank of Atlanta Research Data Report no. 19-02. Available at https://www.frbatlanta.org/banking-and-payments/consumer-payments/survey-of-consumer-payment-choice/2018-survey.aspx.
Greene, Claire and Scott D. Schuh. 2017. “The 2016 Diary of Consumer Payment Choice.” Federal Reserve Bank of Boston Research Data Reports no. 17-7. Available at https://www.frbatlanta.org/banking-and-payments/consumer-payments/research-data-reports/2017/the-2016-diary-of-consumer-payment-choice.aspx?panel=1
Greene, Claire; Shaun O’Brien; and Scott Schuh. 2017. “U.S. Consumer Cash Use, 2012 and 2015: An Introduction to the Diary of Consumer Payment Choice.” Federal Reserve Bank of Boston Research Data Reports no. 17-6. Available at https://www.frbatlanta.org/banking-and-payments/consumer-payments/research-data-reports/2017/us-consumer-cash-use-2012-and-2015.aspx?panel=1.
Greene, Claire; Scott D. Schuh; and Joanna Stavins. 2018. "The 2012 Diary of Consumer Payment Choice: Summary Results." Federal Reserve Bank of Boston Research Data Reports no. 18-1. Available at https://www.frbatlanta.org/banking-and-payments/consumer-payments/research-data-reports/2018/the-2012-diary-of-consumer-payment-choice.aspx?panel=1.
Greene, Claire and Joanna Stavins. 2018. “The 2016 and 2017 Surveys of Consumer Payment Choice: Summary Results.” Federal Reserve Bank of Boston Research Data Reports no. 18–3. Available at https://www.frbatlanta.org/banking-and-payments/consumer-payments/research-data-reports/2018/the-2016-and-2017-surveys-of-consumer-payment-choice-summary-results.aspx?panel=1.
Greene, Claire and Joanna Stavins. 2018. The 2017 Diary of Consumer Payment Choice. Federal Reserve Bank of Atlanta Research Data Report no. 18-05. Available at
Judson, Ruth. 2017. “The Death of Cash? Not So Fast: Demand for U.S. Currency at Home and Abroad, 1990–2016.” International Cash Conference 2017, War on Cash: Is there a Future for Cash? Deutsche Bundesbank, Frankfurt am Main. Available at https://EconPapers.repec.org/RePEc:zbw:iccp17:162910.
16
Klee, Elizabeth. 2008. “How People Pay: Evidence from Grocery Store Data.” Journal of Monetary Economics 55(3): 526–41.
Kumar, Raynil and Shaun O’Brien. 2019. “2019 Findings from the Diary of Consumer Payment Choice.” Federal Reserve Bank of San Francisco FedNotes. Available at https://www.frbsf.org/cash/publications/fed-notes/2019/june/2019-findings-from-the-diary-of-consumer-payment-choice/.
Samphantharak, Krislert; Scott Schuh; and Robert M. Townsend. 2017. “Integrated Household Surveys: An Assessment of U.S. Methods and an Innovation.” Federal Reserve Bank of Boston Research Department Working Papers no. 17-7. Available at https://www.bostonfed.org/publications/research-department-working-paper/2017/integrated-household-surveys-an-assessment-of-us-methods-and-an-innovation.aspx.
Schuh, Scott. 2017. “Measuring Consumer Expenditures with Payment Diaries.” Economic Inquiry 56, no. 1 (January): 13–49. Available at https://doi.org/10.1111/ecin.12485.
Wang, Claire. 2019. “Cash Me If You Can: The Impacts of Cashless Businesses on Retailers, Consumers, and Cash Use.” Cash Product Office, Federal Reserve System. Available at https://www.frbsf.org/cash/files/Cash-Me-If-You-Can-August2019.pdf.