Embed Size (px)
Citation preview

iThe 3rd ASEAN Energy Outlook
DISCLAIMER "This report was prepared as part of the activities under the SOME-METI Programme on Energy Supply Security Planning in the ASEAN (ESSPA). The data and assumptions used were discussed and agreed by the members of the participating ASEAN Countries to enable harmonization of the forecasting techniques. As thus, the outcomes and recommendations presented do not necessarily constitute or imply the official national demand and policy outlook of the participating Member Countries."

ii The 3rd ASEAN Energy Outlook
iiiThe 3rd ASEAN Energy Outlook
FOREWORD
Japan has been involved in two cooperation programs in ASEAN region based on the SOME-METI Energy Cooperation Program such as:
a. Energy Supply Security Planning in the ASEAN (ESSPA)
b. Promotion on Energy Efficiency and Conservation (PROMEEC)
This report contains the results of the “3rd ASEAN Energy Outlook” project, one of ESSPA activities, which was started in February 2010.
In order to evaluate past and current energy security situation in ASEAN region, Japan assisted the ASEAN Centre for Energy (hereafter referred to as ACE), the representative body of ASEAN region on energy issues, to develop the ASEAN Energy Database from year 2001 to 2003, in order to maintain consistent annual historical energy data of the member countries. Japan also conducted the project for forecasting future energy security situation in ASEAN region based on projected energy demand using the energy demand outlook model from 2003 to 2005. However, the main purpose of this cooperation program is capacity building, thus The Institute of Energy Economics, Japan (hereafter referred to as IEEJ) shared its technical know-how on energy demand supply outlook work to ASEAN participants in 2010 while the participants implemented the practical work by themselves. It was marvelous that all the participants which included even beginners could reach the final step, in other words, succeeded to simulate energy outlook up to year 2030 using the skills learned in the capacity building activities.
This report is the 3rd version of the outlook project. The main difference from the first two versions of the report is the analysis of an energy efficiency scenario. In other words, the 3rd version of the ASEAN energy outlook model is enriched with an analysis of an alternative energy development path. The participants prepared the main part of this report - the country discussions - while IEEJ and ACE worked on the other parts.
Ideally, all ASEAN member states should have written their country reports that are included in this publication. Unfortunately, Cambodia and Myanmar did not write their country reports. However, the outlook results of these two states are included in the ASEAN total.
I hope that this report could contribute in policy decision making in ASEAN to maintain the energy security of Japan as well as the ASEAN in the future.
Shigeru Kimura Senior Research Fellow The Energy Data and Modelling Center The Institute of Energy Economics, Japan
February 2011

iv The 3rd ASEAN Energy Outlook

vThe 3rd ASEAN Energy Outlook
ACKNOWLEDGEMENTS
The 3rd ASEAN Energy Outlook is a project under the SOME-METI Energy Cooperation Program on the Energy Supply Security Planning in the ASEAN (ESSPA). This outlook is a product of a joint effort between ASEAN Member States, the ASEAN Centre for Energy (ACE) and the Institute of Energy Economics, Japan (IEEJ) to develop an energy demand and supply outlook model for the ASEAN region up to 2030 and at the same time to enhance the capacity building of ASEAN people in energy modeling.
For the successful of the publication of this outlook, I would like to acknowledge and express our sincere gratitude for all the supports provided by everyone who were involved as follows:
1. Dr. Ikuhiro Sumi, Senior Policy Advisor, METI, for his full support in approving and realizing the implementation of this activity under ESSPA Work Programme 2010 – 2011,
2. Mr. Soichiro Seki, Deputy Director-General for International Energy Negotiation, METI for his full support in the implementation projects under the SOME-METI,
3. Mr. Masakazu Toyoda, Chairman and CEO, The Institute of Energy Economics, Japan, for the provision of the funding support necessary to realize this activity and to release the publication the 3rd ASEAN Energy Outlook,
4. Mr. Shigeru Kimura, Senior Research Fellow, Director the Energy Data and Modelling Center (EDMC), The Institute of Energy Economics, Japan (IEEJ), for his expertise, continuous guidance and advices, encouragement, and patience in proposing, negotiating, implementing and finalizing this outlook.
5. Mr. Edito Barcelona, Senior Researcher of IEEJ, for his expertise, kind guidance and advices to all the participants of ASEAN member states and for his patience in directing the participants as well as his editing of this outlook,
6. Mrs. Cecilya Malik Sastrohartono, Energy Expert as ACE representative, for her expertise, kind guidance and advices to all the participants of ASEAN member states in developing the modelling and finalizing this outlook and for her strong and sincere commitment to cooperate with ACE since the first publication in 2005,
7. SOE Leaders of Brunei Darussalam, Cambodia, Indonesia, Lao PDR, Malaysia, Myanmar, the Philippines, Singapore, Thailand and Vietnam for approving the 3rd ASEAN Energy Outlook and continuously supporting the activities under ESSPA Work Programme until now,
8. ESSPA/REPP-SSN Focal Points for their cooperation in approving and providing appropriate technical personnel to participate in the development of this outlook,
9. Dr. Lim Chee Ming and other Brunei personnel for their hard work in modeling and finalizing the Brunei Energy Outlook and Country Report,
10. Mr. Heng Kunleang, Mr. Tan Sokun, Mr. Gnhoung Chounmnit and other Cambodia personnel for their hard work in modeling and finalizing the Cambodia Energy Outlook
11. Ms. RR. Fifi Indarwati, Mr. Catur Budi Kurniadi and other Indonesia personnel for their hard work in modeling and finalizing the Indonesia Energy Outlook and Country Report,
vi The 3rd ASEAN Energy Outlook
12. Mr. Khamso Kouphokham, Ms. Sengdeuane Vong Inh and other Lao PDR personnel for their hard work in modeling and finalizing the Lao PDR Energy Outlook and Country Report,
13. Mr. Zaharin Zulkifli, Ms. Noor Aizah Abdul Karim and other Malaysia personnel for their hard work in modeling and finalizing the Malaysia Energy Outlook and Country Report,
14. U Nay Aung, Saw He Nay Blut and other Myanmar personnel for their hard work in modeling and finalizing the Myanmar Energy Outlook
15. Ms. Desiree Joy C. Solis, Ms. Lana Rose Manaligod, and other Philippines personnel for their hard work in modeling and finalizing the Philippines Energy Outlook and Country Report,
16. Dr. Yuk Sum Wong. Mr. Neil Sebastian D'Souza, Ms. Belinda Salim and other Singapore personnel for their hard work in modeling and finalizing the Singapore Energy Outlook and Country Report,
17. Ms. Supit Padprem, Ms. Sukanlaya Trewitthayanurak, Ms. Vibharaj Prasertsook and other Thailand personnel for their hard work in modeling and finalizing the Thailand Energy Outlook and Country Report,
18. Mr. Nguyen Duc Song and other Vietnam personnel for their hard work in modeling and finalizing the Vietnam Energy Outlook and Country Report,
19. Mr. Beni Suryadi, ESSPA Project Officer and other ACE personnel for all their support and commitment in the initiation, implementation, proofreading and finalization of the 3rd ASEAN Energy Outlook,
20. Other experts and personnel from, among others, IEEJ and ASEAN member states who participated and provided valuable inputs from the initiation, implementation, and finalization of the 3rd ASEAN Energy Outlook.
I hope that this report could be a good reference for all policy makers in ASEAN as well as the investors.
Nguyen Manh Hung Executive Director ASEAN Centre for Energy
viiThe 3rd ASEAN Energy Outlook
ABBREVIATIONS AND ACRONYMS ACE – ASEAN Centre for Energy AEEMTRC – ASEAN-EC Energy Management Training and Research Centre APSA – ASEAN Petroleum Sharing Agreement ASEAN – Association of Southeast Asian Nations CCGT – Combined-cycle gas turbine CDM – Clean Development Mechanism CNG – Compressed natural gas CO2 – Carbon dioxide EDMC – The Energy Data and Modelling Center ESSPA – Energy Supply Security Planning for the ASEAN GDP – Gross domestic product GTL – Gas-to-liquid GVA – Gross value added GWh – Gigawatt-hour IEA – International Energy Agency IEEJ – The Institute of Energy Economics, Japan kt-C – Thousand tons of Carbon equivalent KTOE – Thousand tons of oil equivalent LEAP – Long-range Energy Alternative Planning System LNG – Liquefied natural gas METI – Ministry of the Economy, Trade and Industry, Japan Mt-C – Million ton of Carbon equivalent MTOE – Million tons of oil equivalent MW – Megawatt MWh- Megawatt-hour OECD – Organization for Economic Cooperation and Development R&D – Research and development SOE – Senior Official on Energy SOME – Senior Officials Meeting on Energy TOE – Tons of oil equivalent TWh – Terawatt-hour USD – United States Dollar

viii The 3rd ASEAN Energy Outlook

ixThe 3rd ASEAN Energy Outlook
TABLE OF CONTENTS Foreword iii
Acknowledgements v
Abbreviations and Acronyms vii
Executive Summary 1
Introduction 4
Energy Supply Security Planning in the ASEAN (ESSPA) and Development of the 3rd ASEAN Energy Outlook 4
The 3rd ASEAN Energy Outlook Project 5
Socio-Economic and Energy Situation in ASEAN in 2007 7
Economy and Demography 7
Energy Situation 7
Methodological Framework 11
Forecasting Final Energy Demand 12
Estimating Primary Energy Requirements 13
Projection Scenarios 14
Forecast Assumptions 15
GDP and Population Growth 15
Crude Oil Price Assumptions 15
Alternative Scenario Assumptions 16
ASEAN Energy Supply and Demand Outlook 19
Final Energy Consumption 19
Primary Energy Supply 21
Power Generation 23
CO2 Emissions 24
Findings and Policy Implications 25
Country Reports 27
Annex I – Energy Demand Equations 89
Annex II – Results Summary Tables 119

x The 3rd ASEAN Energy Outlook
LIST OF TABLES
Table 1: Work Schedule of the ESSPA Energy Outlook Model Activities 6
Table 2: Average Annual GDP and Population Growth Assumptions, 2007-2030 15
Table 3: Energy Efficiency and Conservation Goals of ASEAN Member States 17
Table 4: Renewable Energy, Biofuels and Nuclear Energy Targets by Country 17
Table 5: Electricity Production in ASEAN (BAU and APS), in TWh 23
Table 6: Fossil Fuel Inputs to Power Generation in ASEAN, in MTOE 24

xiThe 3rd ASEAN Energy Outlook
LIST OF FIGURES
Figure 1: ASEAN Primary Energy Mix, 1995 and 2007 8
Figure 2: Indigenous Production and Consumption of Fossil Fuels 8
Figure 3: ASEAN Electricity Generation by Source, 1995 and 2007 9
Figure 4: ASEAN Final Energy Consumption by Sector, 1995 and 2007 10
Figure 5: ASEAN Final energy Consumption by Fuel, 1995 and 2007 11
Figure 6: Structure of the ASEAN Energy Outlook Model 12
Figure 7: Oil Price Assumption (2009 US Dollars) 16
Figure 8: Projected Final Energy Consumption in ASEAN by Sector 19
Figure 9: Final Energy Consumption in ASEAN by Fuel Type 20
Figure 10: Primary Energy Requirements in ASEAN 21
Figure 11: CO2 Emission in the Reference and Alternative Scenarios, in Mt-C 24

xii The 3rd ASEAN Energy Outlook

1The 3rd ASEAN Energy Outlook
EXECUTIVE SUMMARY
The 3rd ASEAN Energy Outlook is the third edition of the ASEAN Energy Outlooks that were prepared in 2006 and 2008 in conjunction with the SOME-METI joint cooperation program on capacity building for Energy Supply Security Planning in the ASEAN (ESSPA). The objective of this activity was to prepare an energy demand outlook in ASEAN while at the same time provide capacity building to ASEAN energy analysts in energy demand modeling.
This work is a joint output of Japan being represented by The Institute of Energy Economics, Japan (IEEJ), the ASEAN Centre for Energy (ACE) and the National ESSPA Project teams from 10 member states of ASEAN.
The energy data used in the modeling work were taken from the Energy Balances for Non-OECD Members Countries that is published by the International Energy Agency (IEA) annually. The economic and social indicators were obtained from the World Bank’s World Development Indicators which is also published annually. Other relevant data that are not available from these publications are obtained by the national teams from their respective national sources.
This outlook is different from the two previous ones due to the following:
• While the first two energy outlooks used the GDP growth projections provided by IEEJ in the reference scenario and GDP growth targets of the 10 member states in the high growth scenario, the 3rd edition used the GDP growth targets of the 10 member states in the Business-as-Usual (BAU) scenario. This means that this outlook used higher GDP growth assumptions.
• The alternative scenario - termed alternative policy scenario (APS) - in this outlook analyzes the impact of the energy saving goals and action plans in the primary energy demand and CO2 emissions while the first two editions estimated the effect of higher GDP growth.
As mentioned above, the GDP growth assumptions were provided by each member state. Population growth also came from the member states. The growth rates of the GDPs of the industrial and services sectors if not available, were derived by regression analysis. The oil price assumptions and GDP deflators were projected by IEEJ.
The methodology applied for the final energy demand forecasting was econometrics while the estimation of primary energy consumption used an engineering based model but the energy development programs of each member states were the major inputs used in the models. The modeling work was carried out in two 1-week working/training meetings and in sets of homework given to each national team after every meeting.
As results of the foregoing, the following are the energy and CO2 emission outlook in the next two decades:
• With the assumed GDP growth rate of 5.2% per annum from 2007 to 2030, final energy consumption in ASEAN will grow at an average annual rate of 4.4% from 375 MTOE to 1,018 MTOE in the BAU scenario during the same period. The transportation sector is expected to have the highest growth in consumption of 5.6% per annum. The industry

The 3rd ASEAN Energy Outlook2
sector consumption will grow at an annual rate of 5.2% while the consumption of the combined residential, commercial and agriculture sectors will have a slower growth of 2.6% per annum. Electricity will have the highest growth rate among the energy consumed in the final consumption sector at 6.4% per annum. This is followed by coal at 5.9%, natural gas at 5.3% and oil at 4.9%. Other fuels which include biomass and liquid bio-fuels will have a slow growth rate of 1.0% per annum. In the APS, final energy demand will grow at a slower rate of 3.6% to 843 MTOE in 2030.
• The corresponding primary energy consumption in the BAU will have a slightly faster growth rate of 4.5% per annum from 511 MTOE in 2007 to 1,414 MTOE in 2030. Coal will have the fastest annual growth rate of 7.7%. This is due to the projected rapid growth in electricity consumption that will be met largely by coal-fired generation. Hydropower will have the second fastest growth rate of 7.1%% as countries in the Great Mekong Sub-region decide to develop their vast hydropower potential for electricity trade among the neighbors. Oil and natural gas will have growth rates of 4.4% and 3.2% per annum. Oil will remain as the major source of energy in the region with its share to the total primary energy supply remaining essentially the same from 36.2% in 2007 to 35.1% in 2030. Nuclear energy will be introduced in the region before 2020 and will have a 0.4% share of the total by 2020 which will increase to 1.7% in 2030. Geothermal energy will be developed in the Philippines and Indonesia which will result in a 5.2% annual growth rate in the production of this resource. Biomass will continue to grow albeit at a slow pace of 1.7% per annum. The growth in energy consumption will increase per capita energy consumption from 0.9 TOE per person in 2007 to 1.9 TOE per person in 2030. However, energy consumption per unit of GDP will decrease from 580 TOE/million US dollars (USD) in 2007 to 501 TOE/million USD in 2030, a reduction of 13.7% over a 23-year period. In the APS, the growth of primary energy consumption will be at a slower 3.6% per annum to 1152 MTOE in 2030. Primary energy intensity will decrease by 29.7% to 408 TOE/million USD.
• The above growth in primary energy consumption will result in a corresponding 5.7% annual growth in CO2 emission in the BAU and 4.4% in the APS. This is due to the faster growth rate in the consumption of fossil fuels than in the growth of carbon-free sources such as nuclear and renewable energy. As a result, CO2 emission per unit of energy consumption will increase from 0.49 tons of carbon equivalent (t-C)/TOE in 2007 to 0.63 t-C/TOE in 2030 in the BAU and 0.59 t-C/TOE in the APS. CO2 emission per unit of GDP will also increase at average annual rate of 0.5% from 283 t-C/million USD in 2007 to 317 t-C/million USD in 2030 in the BAU. In the APS, on the other hand, CO2 intensity will decrease by 0.7% per year to 240 t-C/million USD.
The above findings raised concerns to the energy supply security of ASEAN and global environmental stability. These concerns can be summarized as follows:
• ASEAN will continue to be heavily dependent on fossil fuels especially oil in the future. The region as a whole has become a net importer of oil and net imports will further increase in the future in view of stagnating or declining oil production and rapidly increasing demand.
• The rapid growth of electricity demand will also be a driving force in increasing use of fossil fuels especially coal. To lessen the environmental impact of coal use, ASEAN would need to utilize the latest most efficient and cleaner coal technologies.

3The 3rd ASEAN Energy Outlook
• One of the most effective ways of meeting future demand is improving energy efficiency as shown by the APS results. In this regard, ASEAN might to revisit their energy efficiency programs to optimize the benefits that could be derived from them.
• Another sustainable way to meet increasing demand is to accelerate the development of clean energy such as renewables and alternative energy by encouraging the use of alternative fuels from biomass, increasing renewable energy share and attain a more balanced mix in electricity generation, utilizing alternative fuels such as CNG in the transportation sector, and formulating policies to promote the utilization of renewables, alternative fuels and nuclear energy.
• ASEAN needs to improve the energy investment climate so that it will become more conducive to investors by formulating appropriate policies and incentives to encourage investment to develop geothermal, hydropower as well as hydrocarbon resource potential. ASEAN may also lobby for the inclusion of clean coal and nuclear energy in projects that qualify for CDM funding in international climate change negotiations.
• ASEAN should also continue to strengthen regional cooperation especially in sharing best practices in energy development and utilization including energy efficiency.

The 3rd ASEAN Energy Outlook4
THE 3rd ASEAN ENERGY OUTLOOK
1 INTRODUCTION
1.1 Energy Supply Security Planning in the ASEAN (ESSPA) and Development of the 3rd ASEAN Energy Outlook
On January 1, 1999, ASEAN established the ASEAN Centre for Energy (ACE) as a successor of the 10-year old organization AEEMTRC (ASEAN-EC Energy Management Training and Research Centre) established jointly by the ASEAN and the European Union (EU) in 1988. As a full-pledge ASEAN body, ACE conducted specific projects on energy in the region. One of the activities conducted by ACE was ESSPA. This activity is part of the SOME-METI joint Cooperation Program on energy initiated in 2000 and agreed by the ASEAN and Japan SOE Leaders during their First SOME-METI Consultation.
This ASEAN-Japan Energy Security Cooperation program was established on the basis of the following:
• A stable energy supply is indispensable to economic growth, and oil is and will be a main player in energy.
• Future high economic growth will inevitably increase energy use. Though there are some Asian countries which produce oil, Asia as a whole, as well as ASEAN, will rapidly increase oil imports from outside Asia. Therefore, securing a stable supply of energy, particularly oil, is important for policy makers in Asia.
• Recent trends show a high volatility in the volume and price of oil. The increase of oil imports may aggravate the fragility of the ASEAN economy against oil supply disruptions and fluctuations in oil price.
• Securing a stable trade in oil, in terms of volume and price, is an essential task of the governments. There must be mechanisms and infrastructure to cope with this issue.
• Japan has experienced two oil shocks, and the Japanese Ministry of Economy, Trade and Industry (METI), previously Ministry of International Trade and Industry (MITI), has been formulating and improving its energy policy.
• These experiences in Japan may be useful for ASEAN in considering the strengthening of its energy security by revising the ASEAN Petroleum Sharing Agreement (APSA) and other measures such as emergency preparedness and stockpiling.
The scope of the cooperation program covers the following:
• Information exchange and seminars for energy policy experts of ASEAN and Japan.
• Visits to facilities and study of the mechanisms in Japan by ASEAN energy policy officials.
5The 3rd ASEAN Energy Outlook
• Initiate joint research on how to strengthen energy security in ASEAN, which will contribute to the revision of APSA, and the establishment of emergency preparedness and necessary infrastructure such as oil stockpiling.
Recognizing the importance of energy supply security in ASEAN, the Energy Supply Security Program in ASEAN (ESSPA) was then conducted by establishing a working group responsible for analyzing energy security in ASEAN with ACE and IEEJ as implementing agencies. Because future energy demand is a key factor for evaluating energy security in ASEAN, ESSPA focal points decided to develop ASEAN Energy Demand Model as part of the ESSPA activities for 2004-2005.
The objectives for conducting the Energy Demand Outlook Model activity for 2004-2005 were two folds. First was capacity building to increase and enhance the participating member countries capability in developing energy demand outlook model based on econometric approach. The second objective was to develop the outlook model of these participating member countries in order to forecast their energy demand up to year 2030 and study the implications in securing future energy supply of ASEAN through comparison between the forecasted energy demand and energy supply planning information.
The Energy Demand Outlook Model project was conducted focusing only on the six major ASEAN countries namely Indonesia, Malaysia, Myanmar, Philippines, Thailand and Vietnam. The outcomes of which was published in 2006 with the title Final Report on the Development of Energy Demand Outlook Model for the ASEAN Project
The ASEAN energy demand outlook was updated in 2008 with the modeling work as part of the ESSPA activities for 2007-2008. The coverage of the second energy demand outlook was expanded to include the remaining four ASEAN member countries. Thus, Brunei Darussalam, Cambodia, Laos and Singapore joined the modeling activities in addition to the previous six ASEAN member countries; Indonesia, Malaysia, Myanmar, Philippines, Thailand and Vietnam.
The 2nd ASEAN energy demand outlook project was implemented through phases following the first ASEAN energy demand outlook project. However, it was preceded with a pre-meeting to explain the works conducted in the initial ASEAN demand outlook mainly to the four newly participating countries and also to share and understand the purposes and outcomes of 2nd ASEAN Energy Demand Outlook.
In principle, the basic assumptions for the 2nd ASEAN energy demand model had been updated but the scenarios formulated remain the same, i.e. Business-as-Usual (BAU) and Alternative Scenario which is the higher GDP growth case.
1.2. The 3rd ASEAN Energy Outlook Project
Publishing the ASEAN energy demand outlook has become a continuous activity of the ESSPA program. In this regard, the ten ASEAN member countries will now regularly update the ASEAN energy demand outlook. For updating the ASEAN energy demand outlook of 2008, the ESSPA activities for 2009-2010 and 2010-2011 focused on the 3rd energy demand outlook project.
The development of the 3rd ASEAN energy demand outlook, as in the previous outlook projects, was done in phases consisting of training and homework in model development, model improvement, model simulation and finally, report writing. The difference was that for this 3rd

The 3rd ASEAN Energy Outlook6
ASEAN energy demand outlook project, only two meetings were organized to monitor and evaluate the model development processes. These were:
a. First Working Meeting conducted on 22 - 26 February 2010, in Jakarta, Indonesia.
b. Final Working Meeting conducted on 18 - 22 October 2010, in Jakarta, Indonesia.
Although only two meetings were organized, the time frame for the development of the 3rd ASEAN energy demand outlook model was longer since it was conducted through two ESSPA periods, namely for 2009-2010 and 2010-2011. The first working meeting focused on the estimation of demand function using the econometric approach and the Microfit software. The final working meeting focused on forecasting the demand up to 2030 and estimating the primary energy requirements using a simulation model (LEAP).
Table 1 shows the working schedule for the 3rd ASEAN Energy Outlook project. This report on the 3rd ASEAN Energy Outlook is the outcome of the modeling work.
Table 1: Work Schedule of the ESSPA Energy Outlook Model Activities
Month Training Home Work
22-26 February, 2010 (First working meeting)
Understand how to use Microfit, Import the data into Microfit, and confirm the model structure for estimating the energy demand equations.
March - October 2010 Finalized the estimation of energy demand equations using Microfit
18-22 October 2010 (Final working meeting)
Finalize future assumption, understand to use LEAP, complete BAU scenario, and formulate APS scenario which is the Energy Efficiency and Conservation (EEC) scenario.
September-December 2010 Simulation with the alternative scenario by LEAP, finalization of the energy demand outlook to 2030, and extraction of implications
January-February 2011 Prepare country report based on the finalized energy outlook and the extracted implications
The initial part of this report is the introductory section followed by the methodological framework and the basic assumptions of the model. The next section discusses in detail the energy outlook of the individual participating member countries with a section discussing the total ASEAN. The implications of the outlook outcomes to energy security of the region are also discussed. The next steps to be undertaken to improve energy security will be presented in the last part of the report.
Finally, there will be a publication of the final report and distributed to the different related organizations in ASEAN and outside ASEAN to present the outcomes of the 3rd ASEAN Energy

7The 3rd ASEAN Energy Outlook
Outlook for each of the ten ASEAN countries and to enhance technical capacity on energy demand outlook modeling through sharing of know-how with experts on energy demand outlook from various organizations.
2 SOCIO-ECONOMIC AND ENERGY SITUATION IN THE ASEAN IN 2007
Like the 2nd Energy Demand Outlook for the ASEAN, this outlook covers the ten ASEAN member states, namely, Brunei Darussalam, Cambodia, Indonesia, Lao People’s Democratic Republic, Malaysia, Myanmar, Philippines, Singapore, Thailand and Vietnam.
2.1 Economy and Demography1
ASEAN is a regional bloc that was established on 8 August 1967 in Bangkok by the five original member countries, namely, Indonesia, Malaysia, Philippines, Singapore, and Thailand
2
The region’s total land area covers 4.34 million square kilometers equivalent to 3.3% of the world’s land area (bigger than India but is less than half of Brazil). It has a total population of 566 million in 2007 which is about 8.6% of the total world population.
. Brunei Darussalam joined on 8 January 1984, Vietnam on 28 July 1995, Laos and Myanmar on 23 July 1997, and Cambodia on 30 April 1999.
Total GDP of the region during the same year was 866 billion USD (constant 2000 values) having grown at an annual average rate of 4.3% from 1995 to 2007. The share of the region to the world’s GDP increased from 1.9% in 1995 to 2.2% in 2007. The region’s population grew by 1.4% per annum during the same period. GDP per capita also increased but varied widely among the 10 member states from 343 to 29,185 USD in 2007.
2.2 Energy Situation
Primary Energy Consumption
The region’s economic growth had a consequential increase in primary energy consumption which was registered at 3.6% per annum from 1995 to 2007. 3
1 The source of economic and demographic data in this report is World Development Indicator 2010 CD-ROM published by the World Bank.
Total primary energy consumption increased from 339 MTOE in 1995 to 511 MTOE in 2007. Among the energy sources consumed in the region, coal had the fastest growth rate increasing at an annual rate of 13.0% mostly due to the installation of coal-fired power plants in the region. Natural gas had the next fastest growth at 6.5% per annum increasing its share from 16.4% in 1995 to 21.4% in 2007. Oil remains as the major energy source in the ASEAN but its growth was relatively slower than other sources of energy at 2.2% per annum. As a result, its share in the primary energy mix decreased from 43.6% in 1995 to 36.2% in 2007.
2 http://www.aseansec.org/64.htm 3 The choice of 1995 as the base year for growth rates of GDP and energy was due to the unavailability of energy data from Cambodia before 1995.

The 3rd ASEAN Energy Outlook8
Geothermal energy also grew at a fast rate during the same period increasing by 6.2% annually. Its share, however, remained low registering at 2.9% in 2007. Hydro also grew faster than the total primary energy growing at 4.8% per annum. Like geothermal, its share remained low reaching only 1.2% in 2007. The growth of “Other Energy” which is mostly biomass was the slowest at 0.9%. Its share declined from 32.3% in 1995 to 23.5% in 2007 as a result.
Figure 1 shows the primary energy mix in the ASEAN in 1995 and 2007.
Figure 1: ASEAN Primary Energy Mix, 1995 and 2007
1995
4.6%
43.6%
16.4%
1.0% 2.1%
32.3%
CoalOilGasHydroGeothermalOthers
2007
14.8%36.2%
21.4%
1.2%
2.9%
23.5%
Sources: International Energy Agency (IEA), Lao PDR Ministry of Energy and Mines (Lao MEM).
Figure 2: Indigenous Production and Consumption of Fossil Fuels
0
50
100
150
200
250
1990 1995 2007 1990 1995 2007 1990 1995 2007
Coal Oil Gas
ConsumptionProduction
Sources: IEA, Lao MEM.

9The 3rd ASEAN Energy Outlook
The region as a whole is a net energy exporter although five of the member states are large energy importers. From 1990 to 2007, the region still has substantial net exports coal and natural gas. Indonesia, Malaysia and Brunei Darussalam, for instance, are major sources of natural gas of Japan, South Korea and Chinese Taipei.
In terms of oil, however, the region has become a net importer in 1995 as the rapid increase in oil demand was not matched by oil production. During the year, the region’s net oil import of was equivalent to 5.3% of its consumption or 7.9 MTOE. In 2007 however, the difference in consumption and production further increased. During the year, almost 35% of oil consumption or 70 MTOE has to be imported to the region. Figure 2 shows the consumption and production of coal, oil and gas. It could be noted that while production of coal and gas were greater than consumption from 1990 to 2007, oil production had become less than consumption in 1995 and much lesser in 2007.
Electricity Generation
The electricity generation mix in the ASEAN has changed substantially from 1995 to 2007. Although the share of fossil fuels increased from 81.4% in 1995 to 83.8% in 2007, the individual shares of coal, oil and natural gas changed. The share of coal increased from 13.4% to 27.3%. The share of oil decreased from 31.4% to 10.6% while the share of gas increased from 36.7% in 1995 to 45.9% in 2007.
Figure 3: ASEAN Electricity Generation by Source, 1995 and 2007
1995
13.4%
31.4%
36.7% 15.3%
3.2%
0.1%
CoalOilGasHydroGeothermalOthers
2007
27.3%
10.6%
12.5%
3.0%
0.7%
45.9%
Sources: IEA, Lao MEM.
The substantial changes in the share could be attributed to the policies of the government’s of most member states to reduce electricity generation from oil. These member states found coal and natural gas as better alternatives in terms of cost. For the case of Malaysia, however, the heavy dependence in natural gas was the main reason for increasing generation from coal.

The 3rd ASEAN Energy Outlook10
The ASEAN also increased its electricity generation from other sources such as geothermal, wind, solar and biomass with the three latter sources combining for a 26.2% average annual growth rate from 1995 to 2007. Their combined shares however, remained low slightly increasing from 0.1% in 1995 to 0.7% in 2007. Although geothermal not as growing as fast as the other sources of electricity, it had a respectable growth rate of 6.2% from 1995 to 2007. This is driven by developments in Indonesia and the Philippines during the 12-year period. Final Energy Consumption
The region’s final energy consumption increased at an annual rate of 3.8% from 241 MTOE in 1995 to 375 MTOE in 2007. The industrial sector had the fastest growth in consumption at an average annual rate of 6.1% resulting to its increased share of total final energy consumption from 23.1% in 1995 to 28.9% in 2007. The transport sector had the second fastest average annual growth rate at 3.5%. Its share to the total decreased from 27.7% in 1995 to 23.9% in 2007. The “Others” sector which include the residential, commercial, transport and non-energy sectors had the slowest growth rate of 2.2%. As a result, its share to the total consumption decreased from 49.2% in 1995 to 47.2% in 2007.
Figure 4: ASEAN Final Energy Consumption by Sector, 1995 and 2007
1995
23.1%
27.7%
49.2%
IndustryTransportOthers
2007
28.9%
23.9%
47.2%
Sources: IEA, Lao MEM.
In terms of fuel, final consumption of coal was the fastest growing at 14.0% per annum on the average. From just 2.7% in 1995, coal share to the total final energy increased to 9.9% in 2007. This growth is driven by the industrial sector.
The second fastest growing fuel was natural gas having an average annual growth rate of 9.9%. Its share of the total increased from 4.0% in 1995 to 8.0% in 2007. Electricity was the third fastest growing fuel having increased at an average annual rate of 6.6%. Its share in final energy consumption also increased from 9.2% in 1995 to 11.4% in 2007.

11The 3rd ASEAN Energy Outlook
Oil remained as the dominant fuel in final energy consumption as this is the most preferred fuel in the transportation, industrial and other sectors. However, its share has declined from 43.6% in 1995 to 41.7% in 2007 as a result of the slower 3.4% average annual growth rate. “Other fuels” which is mostly biomass had the slowest growth rate of 1.0%. This could be attributed to the displacement of this fuel by oil and gas used for cooking in the residential sector.
Figure 5: ASEAN Final energy Consumption by Fuel, 1995 and 2007
1995
2.7%43.6%
4.0%
9.2%
40.5%
CoalOilGasElectricityOthers
2007
9.9%41.7%
8.0%
11.4%
29.0%
Sources: IEA, Lao MEM.
3 METHODOLOGICAL FRAMEWORK
The energy demand projections of all the member states up to 2030 were estimated using the econometrics approach wherever possible. Historical energy demand data were taken from the Energy Balances for Non-Organization for Economic Cooperation and Development (Non-OECD) Countries of the International Energy Agency (IEA) as well as the national energy data compiled by the Department of Electricity, Ministry of Energy and Mines of Lao PDR. The economic indicators used in energy modeling such as Gross Domestic Products (GDP) and Gross Value Added (GVA) were taken from the World Development Indicators Publication of the World Bank. Other socio economic data such as numbers of households and vehicles were obtained from national sources.
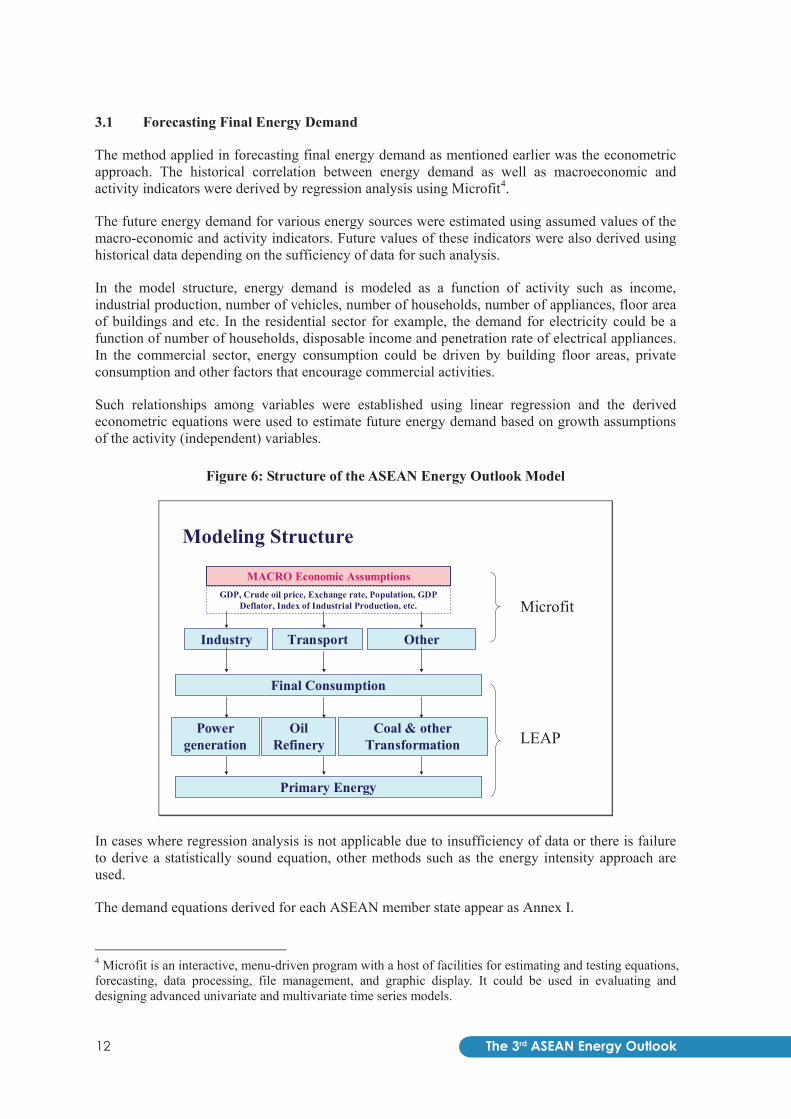
Energy modeling involved the estimation of final energy consumption (FEC) and the corresponding primary energy requirements or supply. Figure 6 shows the model structure from final energy demand projection and estimation of transformation inputs to arrive at the primary energy requirements including the computer software used in the modeling work.
The 3rd ASEAN Energy Outlook12
3.1 Forecasting Final Energy Demand
The method applied in forecasting final energy demand as mentioned earlier was the econometric approach. The historical correlation between energy demand as well as macroeconomic and activity indicators were derived by regression analysis using Microfit4
The future energy demand for various energy sources were estimated using assumed values of the macro-economic and activity indicators. Future values of these indicators were also derived using historical data depending on the sufficiency of data for such analysis.
.
In the model structure, energy demand is modeled as a function of activity such as income, industrial production, number of vehicles, number of households, number of appliances, floor area of buildings and etc. In the residential sector for example, the demand for electricity could be a function of number of households, disposable income and penetration rate of electrical appliances. In the commercial sector, energy consumption could be driven by building floor areas, private consumption and other factors that encourage commercial activities.
Such relationships among variables were established using linear regression and the derived econometric equations were used to estimate future energy demand based on growth assumptions of the activity (independent) variables.
Figure 6: Structure of the ASEAN Energy Outlook Model
Modeling Structure
MACRO Economic Assumptions
Industry
Primary Energy
GDP, Crude oil price, Exchange rate, Population, GDP Deflator, Index of Industrial Production, etc.
Transport Other
Final Consumption
Power generation
Oil Refinery
Coal & other Transformation
Microfit
LEAP
In cases where regression analysis is not applicable due to insufficiency of data or there is failure to derive a statistically sound equation, other methods such as the energy intensity approach are used.
The demand equations derived for each ASEAN member state appear as Annex I. 4 Microfit is an interactive, menu-driven program with a host of facilities for estimating and testing equations, forecasting, data processing, file management, and graphic display. It could be used in evaluating and designing advanced univariate and multivariate time series models.

13The 3rd ASEAN Energy Outlook
3.2 Estimating Primary Energy Requirements
Having estimated the future final energy demand, the corresponding primary energy requirements need to be estimated. These primary energy requirements are the inputs to transformation to produce secondary fuels. Energy transformation involves electricity generation, oil refining, city gas production, charcoal making and any other process that converts fuels from primary energy to secondary products.
For this 3rd ASEAN Energy Outlook, not only primary requirements for electricity generation were considered. The crude oil inputs to oil refining, biomass requirements for charcoal production and the own use of the energy sector (transformation and upstream sectors) were also included.
The Long-range Energy Alternatives Planning System (LEAP)5
Electricity Generation
is used to estimate primary energy consumption and produce the energy balance tables.
Electricity can be produced using various technologies and fuels. In ASEAN, the most common source of electricity is oil power plants which exist in all of the 10 member states. The next most common source is hydroelectric power plants followed by natural gas and coal power plants. Geothermal power plants also exist in 3 member states and there is also an increasing capacity of wind and solar photovoltaic power plants. Biomass-powered plants also exist in Thailand.
Electricity generation requires fuels to produce outputs and this section covers how these fuels are calculated. The calculation of the primary energy requirements for electricity generation involves the following steps:
Estimating total electricity generation requirements
The total electricity generation requirement is the sum of the demand of the final consumers, electricity consumption in the power stations and the expected losses in the transmission and distribution systems. The additional requirement among ASEAN member states is generally above 10% of the total final demand.
Estimating electricity generation capacity requirements
This involves two processes. First is estimating total capacity requirements which is the capacity needed to meet the peak demand. The total capacity requirement is the peak demand plus the assumed reserve margin which is a percentage of the peak demand. Reserve margin is the preferred amount of available capacity above the peak demand in order for the electrical system to ensure that there is zero or minimal disruption in the supply.
The second process is determining the power plants that should be built when the total capacity of the existing power plants cannot meet the peak demand. In five of the ASEAN countries, it is assumed that power plants for the base load should be coal-fired power plants in view of its relatively low operating costs. For intermediate and peak loads, it is assumed that these will be met by natural gas power plants. Myanmar is one of the exceptions in view of its government policy of developing the vast hydroelectric potential of the country. Viet Nam, Lao PDR and Cambodia are also developing sizeable amounts of their hydro resources. In Brunei Darussalam and Singapore,
5 LEAP or the Long-range Energy Alternatives Planning System is an energy policy analysis and climate change mitigation assessment software developed at the Stockholm Environment Institute. For more information see: http://www.energycommunity.org/default.asp?action=47

The 3rd ASEAN Energy Outlook14
future electricity demand will be met by natural gas power plants. Oil power plants are considered mostly only in isolated areas that cannot be connected economically to the electricity grids.
There is no strict criterion for determining the amount of coal and natural gas additions in view of the flexibility of the CCGT technology in being used to supply the intermediate and peak requirements.
Estimating generation by each type of power plant
Generation by individual types of power plants is assumed to follow the order of ascending operating costs. That is, the power plant with cheapest operating cost are made to generate at maximum available capacity before the next cheapest power plant is made to produce electricity. This order is followed until the generation requirement is met. In this case, hydroelectric, wind and geothermal power plants which have zero marginal costs are assumed to operate first before nuclear, coal, natural gas and oil power plants.
The operating cost is derived from the formula below:
i
iii Efficiency
CostFuelCostMOVariableCostOperating __&__ +=
,
where i are the types of power plants
Estimating fuel inputs
Finally, the information on electricity generation together with conversion efficiency variables or the thermal efficiencies are used to calculate the fuels required by power plants for the amount of calculated output. This can be derived from the simple formula below:
i
ii Efficiency
GenerationyElectricitInputFuel __ =
Oil Refining and other Transformation
In oil refining, the amount of crude oil and other inputs is calculated from capacity, capacity utilization, efficiency information and auxiliary fuels. Auxiliary fuels are the fuels needed for the operation of the refinery. The estimation of primary energy requirements for other transformation uses the same information as those in oil refining.
3.3 Projection Scenarios
In this outlook, two scenarios are analyzed like in the 1st and 2nd ASEAN energy outlooks. However, the alternative scenario in this outlook is different from the last two outlooks. The two scenarios are as follows:
The first scenario is the business-as-usual (BAU) scenario or the base case scenario. The scenario used the historical correlation of final energy consumption and economic activity from 1980 to 2007. The GDP growth rates are the growth targets set by the governments of each member states. These GDP growth rates are used to estimate other drivers of energy demand like GDP of the

15The 3rd ASEAN Energy Outlook
industrial sector, GDP per capita, number of vehicles and etc. In view of the use of regression analysis, the trends of future consumption follow historical trends. The energy supply would be based on current targets by each government as well.
The other scenario is the Alternative Policy Scenario, which will be known as APS from this point onwards. In this scenario, it is assumed that final energy consumption will be reduced by the energy efficiency and conservation programs of each government. Effectively, it is assumed that the energy efficiency saving goals of the governments of all the member states of ASEAN is met. The scenario also includes the improvement in thermal efficiencies of fossil fuel-fired power plants and as well as use of alternative fuels and technologies such as nuclear technology, renewable energy and biofuels. In this scenario, it could be expected that the final energy and primary energy consumption would be lower than in the BAU scenario in view of reductions in energy consumption brought about by more efficient use of energy. Consequently, CO2 emissions are projected to be lower than in the BAU scenario.
4 FORECAST ASSUMPTIONS
4.1 GDP and Population Growth
The GDP and population growth rate assumptions are obtained from each government of the 10 ASEAN member states. These are shown in Table 2.
Table 2: Average Annual GDP and Population Growth Assumptions, 2007-2030
GDP Population Brunei Darussalam 2.6% 2.1% Cambodia 6.9% 1.3% Indonesia 6.3% 1.1% Lao PDR 7.5% 1.7% Malaysia 5.0% 1.6% Myanmar 9.0% 1.7% Philippines 4.9% 1.4% Singapore 3.9% 0.7% Thailand 4.1% 0.3% Vietnam 7.5% 0.9% ASEAN 5.2% 1.1%
Sources: 10 ASEAN Member States.
4.2 Crude Oil Price Assumptions
The assumption of crude oil price, which is based on Japan CIF (includes cost of insurance and freight) built on the growth rates of the reference case oil price assumption in USDOE’s International Energy Outlook 2010. From these numbers the nominal values are estimated which are in turn used to estimate the nominal domestic prices using exchange rates. These prices are converted to constant prices using GDP Deflators.
The 3rd ASEAN Energy Outlook16
Nominal oil prices based on Japan CIF will increase to 150 US$/barrel to 2030. This is equivalent to an average annual growth rate of 4.1%. The 150 US$/barrel price in 2030 is equivalent to 106 US$/barrel at 2010 dollar values.
Figure 7 shows the graphical presentation of the crude oil price assumption.
Figure 7: Oil Price Assumption (2009 US Dollars)
0
25
50
75
100
125
150
175
200
2000 2005 2010 2015 2020 2025 2030
US$
/bar
rel
Nominal 2010 US$
Sources: USDOE, IEO 2010; EDMC/IEEJ.
4.3 Alternative Scenario Assumptions
As mentioned in Chapter 3, the APS assumes reduction of final energy consumption from the base case using the energy saving goals set by the government of the 10 ASEAN member states. The alternative scenario assumptions are grouped into energy efficiency and conservation, renewable energy including biofuels and use of nuclear energy. More information on these target, are discussed in the country reports. The tables below show these assumptions of each member states:
17The 3rd ASEAN Energy Outlook
Table 3: Energy Efficiency and Conservation Goals of ASEAN Member States
Member State Energy Efficiency Saving Goal Brunei Darussalam Attain 25% reduction of energy intensity from 2005 level by 2030 Cambodia Reduce final energy consumption by 10% in all sectors Indonesia Reduce final energy consumption by 1% per year from the BAU
scenario Lao PDR Reduce final energy consumption by 10% in all sectors Malaysia • Reduction of final energy consumption in the industrial,
commercial and residential sectors by 10% from 2011 to 2030 • Reduce the final energy consumption of the transportation sector by
1.39 ktoe in 2030 by modal and fuel switching from gasoline to electricity rail transport and electric vehicles
Myanmar • Reduce primary energy consumption by 5% in 2020 and 8% by 2030 compared to BAU
• Improve energy efficiency in all end-use by 16% by 2030 Philippines Reduce final energy consumption by 10% in all sectors Singapore • Reduce energy intensity by 20% by 2020 and by 35% by 2030 from
the 2005 level. • Cap CO2 emissions from combustion of fuel at 63 Mt-CO2 in 2020.
Thailand Save 22% of total energy in 2030 relative to BAU Vietnam Reduce energy consumption by 3%-5% by 2010 and between 5%-8%
by 2010-2015
Table 4: Renewable Energy, Biofuels and Nuclear Energy Targets by Country
Member State Renewable Energy and Bio-fuels Targets
Nuclear Energy Targets
Brunei Darussalam
10 MW of solar PV capacity by 2030 No biofuels target
No target
Cambodia Solar photovoltaic 1.5 MW Biomass Gasification (87 kW) Micro-hydro (500 kW) No biofuels target
No target
Indonesia By 2025, the energy mix of Indonesia should contain: • 5% biofuels • 5% geothermal • 2.6% hydro • 0.03% wind • 0.74 biomass
By 2025, the energy mix of Indonesia should contain: • 1.4% nuclear
Lao PDR Development of hydro projects for domestic use and export. No biofuels target
No target

The 3rd ASEAN Energy Outlook18
Table 4 continued… Member State Renewable Energy and Bio-fuels
Targets Nuclear Energy Targets
Malaysia Installed renewable energy capacity by 2030: • 1340 MW Biomass • 410 MW Biogas • 490 MW Mini-hydro • 854 MW Solar • 390 MW Municipal Solid Waste Biofuels to displace 5% of diesel in road transport
2000 MW by 2023
Myanmar • 15%-20% share of renewable energy to total installed electricity generating capacity
• Displace 8% conventional liquid fuels with biofuels in road transport
No target
Philippines Target by 2030: • ~ 1,500 MW of new geothermal
capacity • ~ 2,100 MW of new hydro capacity • ~950 MW of new wind capacity • ~71 MW of new solar PV capacity • ~102 MW of new biomass capacity • Displace 15% of diesel and 20% of
gasoline with biofuels
2000 MW by 2025
Singapore Solar energy to take a 5% share of the country’s power generation mix. No biofuels target
No target
Thailand Install 6,329 MW of various RE electricity generating facilities Biofuels to displace 12.2% of transport energy demand
Develop 5000 MW from 2020 to 2028 period
Vietnam RE Targets by 2030: • 2100 MW Wind • 2400 MW Small Hydro • 400 MW biomass No biofuels target
1,000 MW by 2020 to increase to 10,700 MW by 2030

19The 3rd ASEAN Energy Outlook
5 ASEAN ENERGY SUPPLY AND DEMAND OUTLOOK
5.1 Final Energy Consumption
The total ASEAN final energy consumption reached 345 MTOE in 2005 and continued increasing to almost 375 MTOE in 2007. The average annual growth rate of the total ASEAN final energy consumption was 4.2% over the 1990 to 2007 period. By sector, the industry sector contributed around 20.3% of the total ASEAN demand in 1990 while the transport and the other sectors contributed 20.5% and 53.0% respectively. From then to 2007, the transport and industrial demand had been growing rapidly, faster for the industry at an average annual growth rate of 6.4% per year while the transport demand growth was 5.1% per year. The rapid growth of these sectors resulted in an increase of their share in the total ASEAN demand to 23.9% and 28.9% respectively in 2007. The consumption of the other sectors, which comprise of commercial, residential and agricultural sub-sectors, grew the slowest at 2.3% per annum, reducing its share in the total demand to 38.9%.
Non-energy use accounted only around 6.2% of the total ASEAN final energy consumption in 1990. But its share’s increased to 8.4% in 2007 due to the rapid increase of its usage in Vietnam (21% per annum). The ASEAN average annual growth of energy consumption as feedstock was 6.1% per annum over the 1990 to 2007 period.
Figure 8: Projected Final Energy Consumption in ASEAN by Sector
0
200
400
600
800
1,000
1,200
MTOE
Non-energy 12 31 59 59 95 94
Others 99 146 193 173 263 225
Transport 38 90 183 157 313 243
Industry 38 108 205 173 348 280
1990 2007 2020 (BAU) 2020 (APS) 2030 (BAU) 2030 (APS)
Business-as-Usual (BAU) Scenario
For the future, under the business-as-usual (BAU) scenario, the total final energy consumption of the ASEAN is projected to grow at a slightly higher annual rate of 4.4% from 2007 to 2030 reaching almost 1,018 MTOE. The transport sector consumption will grow the fastest during the period with annual growth projected at 5.6% driven by the increasing per capita income. The industrial sector consumption will grow at a slightly lower rate of 5.2% while the other sectors

The 3rd ASEAN Energy Outlook20
which include residential, commercial and agricultural sectors will have an average annual growth of 2.6%. Non-energy consumption will grow at an average rate of 4.9% per annum.
Among the types of energy, electricity will grow the fastest, at 6.4% per annum in view of the projected growth in industrial GDP. Its share to the total will consequently increase from around 11.4% in 2007 to almost 17.6% by 2030. Coal will have the second highest growth rate of 5.9% per annum. Its share will increase from 9.9% in 2007 to 13.5% in 2030. Natural gas consumption will be growing at a slower average rate of 5.3% per annum over the 2007 to 2030 period.
Oil will remain as the most used fuel and is projected to grow at 4.9% per annum over the forecast period. Its share to the total consumption mix will also increase from 41.7% in 2007 to 45.8% in 2030. This is driven by the rapid growth in consumption of the transport sector, which is largely fuelled by oil products.
Consumption of other fuels, which are mostly biomass, will increase at an average annual rate of 1.0% resulting to a decreased share to the total consumption from 29.0% in 2007 to 13.4% in 2030.
Figure 9: Final Energy Consumption in ASEAN by Fuel Type
0
200
400
600
800
1,000
1,200
MTOE
Others 89 109 117 106 136 119
Electrici ty 13 43 97 85 179 148
Natura l gas 8 30 58 53 99 87
Oi l 77 156 283 249 466 379
Coal 5 37 82 69 138 110
1990 2007 2020 (BAU) 2020 (APS) 2030 (BAU) 2030 (APS)
Alternative Policy Scenario (APS)
In the APS, final energy consumption will grow at a lower annual rate of 3.6%. This lower growth is a result of implementing the Energy Efficiency and Conservation (EEC) programs in all sectors, excluding use as non-energy. Compared to the BAU, the energy savings potential of the transport sector in the APS will be around 22.4%, while for the industries and other sectors, the energy saving potential will be 19.3% and 14.5% respectively. Overall, the average total energy saving in final consumption will be around 17.2%.
The transportation sector will have an annual growth rate of 4.4% per annum while the industrial and other sectors annual growth rates will be 4.2% and 1.9%, respectively.

21The 3rd ASEAN Energy Outlook
Since oil is the main fuel consumed by the transport sector, its consumption in the APS will be lower than that of the BAU. By 2030, the oil saving potential will be around 18.6%, while for coal it will be 20.3%, electricity 17.4% and natural gas 12.6%.
Although reduced, the role of oil will still be dominant with its share increasing to 45.0% in 2030 from 41.7% in 2007. The average annual growth rate of oil consumption will be 3.9%. This growth is slower than the other fuels except for other energy, which consists mainly of biomass for the residential sector.
Final consumption of electricity will post the highest growth rate at 5.5%. Its share will subsequently increase from 11.4% in 2007 to 17.5% in 2030. Likewise, coal share will increase from 9.9% in 2007 to 13.0% in 2030 brought about by the growth in consumption of 4.8% annually. For natural gas, the consumption will grow at almost the same rate as coal (4.7% per annum), and the share will increase from 8.0% in 2007 to 10.3% in 2030.
5.2 Primary Energy Supply
Historically, the total primary energy supply of ASEAN increased from 252 MTOE in 1990 to 489 MTOE in 2005 and 511 MTOE in 2007. This is an average increase of 4.2% per annum over the 1990 to 2007 period. Indonesia has the largest share, amounting to 41% of the total primary energy requirement in 1990 but decreasing to 37% in 2007. This decreased share of Indonesia’s primary energy supply is due to the rapid increase of the requirement of Malaysia that grew at an average annual rate of 5.8% as well as Singapore and Thailand at almost 5.0% per annum.
Coal supply grew the fastest during the same period at almost 11.5% per annum due to the rapid growth in the consumption of the industrial sector and the construction of coal-fired power plants. Gas supply grew at a slower rate 7.3% per annum which is largely due also to the increase use in the final sectors and to the coming-on-stream and rapid expansion of natural gas power plants in Malaysia, the Philippines, Singapore, Thailand and Vietnam.
Figure 10: Primary Energy Requirements in ASEAN
0
200
400
600
800
1,000
1,200
1,400
1,600
MTOE
Others 103 120 143 130 176 154
Geothermal 6 15 35 35 47 47
Hydro 3 6 19 19 30 29
Nuclear 0 0 3 4 24 30
Natura l gas 33 109 149 129 227 183
Oi l 96 185 314 280 496 408
Coal 12 76 206 162 414 300
1990 2007 2020 (BAU) 2020 (APS) 2030 (BAU) 2030 (APS)

The 3rd ASEAN Energy Outlook22
Business-as-Usual (BAU) Scenario
The primary energy requirements in the ASEAN will grow at an annual rate of 4.5% from 511 MTOE in 2007 to 1,414 MTOE in 2030. Among the energy sources, coal will have the highest annual growth rate of 7.7% per annum due not only to the increasing demand of the industries but also that of the power sector. Primary coal supply will increase from around 76 MTOE in 2007 to 414 MTOE in 2030.
Oil supply, in view of the fast growth rate of the transport sector will grow by 4.4% annually. Gas will have a lower annual growth rate of 3.2%. Gas for power generation will comprise 50.7% of the total gas requirements in 2030. Its share to the total primary energy mix will be reduced to 16.0% in 2030 from 21.4% in 2007.
Hydropower share in the total primary energy supply in ASEAN is small, only 1.2% in 2007. The growth of hydropower however, will be significant at 7.1% per annum over the 2007 to 2030 period. This is due to the plan for aggressive development of hydroelectric potential in the Great Mekong Sub-region. Among the states in this sub-region, Cambodia will have the fastest growth of hydropower supply at almost 30.7% per annum followed by Lao PDR at 8.6% per annum. Hydropower development in Lao PDR is due largely to the planned increase in electricity exports mainly to Thailand. For Myanmar, electricity is mainly hydropower based (almost 100%). The hydropower electricity generation in Myanmar will experience a fast growth at an average rate 17.9% per annum as the state also plans to export electricity in the future. Vietnam electricity generation from hydropower will grow at an average annual rate of 4.0% and will account for almost 2.8% of the country’s total primary energy supply in 2030. From outside of the sub-region, Malaysia, with its Bakun hydropower development will increase its hydropower supply at an average growth of 5.4% per annum over the 2007 to 2030 period.
Philippines and Indonesia are the two countries in ASEAN having geothermal resources for power generation. The share of geothermal energy to total requirement in the region is almost 3%. This is projected to grow at an average rate of 5.2% per annum from 2007 to 2030. Consequently the share will be higher than that of 2007, increasing to 3.4% in 2030.
In this scenario, Thailand and Vietnam plan to construct nuclear power plants to meet demand for electricity from 2020 onwards. As a result, nuclear energy will take a 1.7% share of the total ASEAN primary energy supply in 2030.
Other energy will have a slower growth rate of 1.7% per annum. This covers mostly biomass use by the final sector and supply of other renewable energy such as bio-fuels, wind, solar, etc.
Alternative Policy Scenario (APS)
In the APS, total energy requirement in the ASEAN will reach 1,152 MTOE in 2030, 18.5% lower than in the BAU scenario. This is the result of imposing EE&C action plans and saving targets of the member countries. Since there will be a decrease of coal demand in the final sectors, the total coal supply will exhibit a slower growth than in the BAU scenario. The average annual growth rate of coal supply over the 2007 to 2030 period will only be 6.2% as compared to 7.7% in the BAU scenario. Similarly, natural gas and oil will also experience slower growth rates in this scenario. The average annual growth rate of natural gas supply will only be 2.3% while for oil it will be 3.5%.

23The 3rd ASEAN Energy Outlook
Hydropower will also experience a slower growth as compared to the Reference scenario, but it will still grow the fastest at 7.0% per annum. Its share to total primary energy requirement in 2030 will increase to 2.5%, higher than that of the Reference scenario (2.1%). Other fuels will be growing at a slightly lower rate of 1.1% per annum as compared to its growth rate of 1.6% per annum in the BAU scenario.
In this scenario, five countries in the ASEAN will develop nuclear power facilities. These are Indonesia, Malaysia, the Philippines, Thailand and Vietnam. As a result, nuclear energy share to the total primary energy supply will increase to 2.6% in 2030 higher than the 1.7% share in the BAU scenario.
5.3 Power Generation
Electricity production increased from 157 TWh in 1990 to 504 TWh in 2005 and 571 TWh in 2007. This is equivalent to an average annual growth rate of 7.9% over the 1990 to 2007 period. In the future, electricity production is projected to increase to almost 2,414 TWh in the BAU scenario and lower to 2,068 TWh in the APS or at average annual growth rates of 6.5% and 5.8%, respectively.
Both gas and coal will continue to form the bulk of the supply for power generation in the BAU scenario and APS. Coal share will reach 47.4% in the BAU scenario and 42.7% in the APS by 2030. Natural gas share will be 25.5% in the BAU scenario and 24.2% in the APS.
Oil share will decrease significantly from 10.6% in 2007 to 1.5% by 2030 in the BAU scenario and 1.6% in the APS. This indicates that the role of oil in power generation will become minimal due to the diversification program for alternative fuels in most of the ASEAN member countries. In addition, the renewable portfolio standard implemented in some ASEAN states recently has also reduced the role of oil in power generation.
Table 5: Electricity Production in ASEAN (BAU and APS), in TWh
By TYPE 1990 2005 2007 2030 (BAU)
2030 (APS)
Thermal 120 429 478 1796 1417 Nuclear 0 0 0 91 132 Hydro 29 57 71 351 338 Geothermal 7 17 17 55 55 Other 2 2 4 121 127 Total 157 504 571 2414 2068
Hydropower will grow at an average annual growth rate of 7.2% in the BAU scenario and 7.0% in the APS. Geothermal will also grow but at a slower pace of 5.2% due mainly to resource constraint.

The 3rd ASEAN Energy Outlook24
In regards to fuel inputs for power generation, oil formed the bulk of supply in 1990 at 55.3%. In 2007, natural gas became the main fuel input for power generation in the region at 50.7%. Oil was reduced to 13.4% of the total while coal increased from 23.2% in 1990 to 35.9% in 2007.
In view of the increasing utilization of coal and natural gas which could be used in new and more efficient technologies for power generation, thermal efficiency of the region is expected to increase from 38.6% in 2007 to 38.9% in 2030 for the BAU scenario and 43.2% for the APS.
Table 6: Fossil Fuel Inputs to Power Generation in ASEAN, in MTOE
Type of Fuel 1990 2005 2007 2030
(BAU) 2030
(APS)
Coal 7 30 38 274 189
Oil 16 16 14 8 8
Gas 6 51 54 115 86
Thermal Efficiency 34.6 38.1 38.6 38.9% 43.2%
5.4 CO2 Emission Outlook
The 4.5% annual growth in primary energy consumption in the BAU scenario will result in a corresponding 5.7% growth in CO2 emission. This is due largely to the projected 7.7% annual escalation of coal consumption which is the most carbon-intensive fossil fuel. The 4.4% annual growth rates in oil and the 3.2% in natural gas consumption will also contribute to this increasing emission.
Figure 11: CO2 Emission in the Reference and Alternative Scenarios, in Mt-C
0
100
200
300
400
500
600
700
800
900
1,000
1990 2005 2007 2020 2030
Mill
ion
tons
of C
arbo
n eq
uiva
lent
BAU
APS
In the Alternative scenario, CO2 emission will have a slower annual growth rate of 4.4%. This is the result of imposing the EE&C action plans and saving targets of the member countries which reduces the fuel consumptions in the end-users and power generation as well as the installation of

25The 3rd ASEAN Energy Outlook
more carbon free or carbon neutral energy such as nuclear, biomass, wind and solar power facilities.
Total CO2 emission in the APS will be about 679 million tons of Carbon equivalent (Mt-C), 24% lower than that of the BAU scenario (895 Mt-C).
5.5 Finding and Policy Implications
Finding
As member countries continue to pursue their economic and development goals, primary energy consumption and CO2 emission in ASEAN will increase almost three folds in the BAU scenario. Consequently, there will be increasing pressure on energy security and global environmental stability.
Likewise, oil consumption in the region will increase to around triple from 185 MTOE in 2007 to 496 MTOE by 2030. Being a net importer of oil, the region is becoming increasingly vulnerable to various supply disruptions in the oil market.
Although the region is still a net exporter of natural gas, its consumption of the fuel in 2030 will double from 109 MTOE in 2007 to 227 MTOE in 2030. If current production levels in the region do not increase, the region will have to source out this additional demand from outside the region.
Coal consumption will significantly increase from 76 MTOE in 2007 to 414 MTOE in 2030. This increasing consumption will have a corresponding increase in CO2 emission which is said to contribute to global warming.
Since increasing renewable energy for power generation and bio-fuels for the transportation sector have been taken into consideration in both scenarios, there are increasing use of these energy sources particularly hydro and geothermal.
Imposing EE&C action plans and/or saving targets in the Alternative scenario will increase energy efficiency and reduce growth in energy consumption. This will in turn reduce greenhouse gas emissions in the region. The result of this scenario relative to the BAU scenario indicates reductions of:
• 18.5% in primary energy demand;
• 18.5% in energy intensity; and
• 24.2% in energy derived CO2 emissions
The increased shares of non-fossil fuels (hydro, geothermal, nuclear and other renewable) in power generation will reduce carbon intensity and will contribute to the improvement in the regional energy security. The carbon intensity defined as emission divided by energy will be improved by almost 7% as compared to the BAU scenario.
On a sectoral basis, the transport sector is the major consumer of oil in the region. The energy saving potential for this sector will be around 22.4%, which will lead to CO2 emission reduction.

The 3rd ASEAN Energy Outlook26
In this regard, appropriate energy efficiency and conservation programs and low emission technologies are needed to contribute to energy saving and CO2 emissions reduction in this sector.
Policy Implications
The increasing demand for energy and the resultant increase in CO2 emission in the region needs serious attention from policy makers. Enhancing use of non-fossil fuels such as new and renewable energies will curb future CO2 emission. Additionally, imposing EE&C actions plans and energy saving target indicates that there is significant potential for the ASEAN member countries to reduce growth in energy consumption and CO2 emission. This is achievable by implementing policies across all sectors of the economy that encourage improvements in energy efficiency and conservation and increase the use of lower emission technologies and fuels. Such policies would include measures on the following:
• Increasing CDM projects in the member countries and other mechanisms such as the bilateral offset mechanism.
• Acceleration of development of clean energy such as renewable and alternative energy to replace oil consumption in the final sector and attain a more balanced mix in electricity generation,
• Formulating mechanisms/regulations to remove subsidies to fossil fuel energy and provision of incentives to encourage further development of renewable energy, hydrocarbon resource potential as well as nuclear energy.
• Promotion of more aggressive energy efficiency and conservation measures by encouraging modal shift in the transportation sector and use of more efficient demand technologies.
• Establishing energy management systems and energy efficiency standards.
• Utilizing highly efficient clean coal technologies in power generation and industries such as supercritical technologies, IGCC, etc. to reduce CO2 emission per unit of output.
• Promotion of technology transfers from the developed world and encourage R&D in renewable energy, energy efficient and clean technologies as well as alternative fuels.
• Strengthening regional cooperation especially in sharing best practices in energy development and utilization
The foregoing implications are big hurdles but they also offer a lot of opportunities such as: technological advancement to improve energy efficiency in the demand and supply sides, technology transfer from the developed to less developed countries, possible improvement of investment regimes in each ASEAN member states and increased flow of foreign investments for energy resource development and electricity generation.
Likewise, as these implications are common to all member states, collaborative actions to address these issues would also deepen the ties among the member states.

27The 3rd ASEAN Energy Outlook
COUNTRY REPORTS

The 3rd ASEAN Energy Outlook28

29The 3rd ASEAN Energy Outlook
BRUNEI DARUSSALAM 1 BACKGROUND
Brunei Darussalam is an independent sovereign constitutional Sultanate, headed by His Majesty Sultan Hassanal Bolkiah. Brunei Darussalam is situated on the northeast coast of Borneo Island in Southeast Asia, occupying a land area of 5,765 square kilometers, 1% of the total land area of the island of Borneo. Currently, 68% of the land area is still covered with tropical forests, and His Majesty's Government of Brunei has placed great emphasis on environmental protection and conservation.
1.1 Socio-Economic Situation
Brunei is an energy exporting country in Southeast Asia, exporting about 17.4 million tons of oil equivalent (MTOE). With a population of just over 400 thousand, Brunei Darussalam enjoys a high standard of living with the positive social indicators, like high literacy rates and life expectancy. The 2009 per capita GDP PPP for Brunei Darussalam is CID 48194 6 . Brunei Darussalam's GDP is projected to grow at an average of 3.9% and the population growth at 2.1%7
In the long-term development plan called Wawasan 2035
.
8
• A first class education system to meet the requirements of a changing economy and one that encourages life-long learning and achievements in sport and the arts.
, Brunei Darussalam has set out to achieve:
• Top 10 in the world in living standards as defined by the United Nations Human Development (UNHD) Index.
• A dynamic and sustainable economic growth.
1.2 Energy Supply-Demand Situation
The main energy sources in Brunei Darussalam are natural gas and oil. The primary energy supply (PES) for these two sources of energy in 2007 are 2.028 MTOE and 0.764 MTOE for gas and oil, respectively. The use of natural gas is mainly for the generation of electricity and town gas, and in mid-2010 the production of methanol came on line using natural gas as feed stock. The use of oil is primarily for final consumption.
In the electricity sector, 3396 GWh was generated in 2007. The installed generation capacity in 2010 stood at 690.5 MW, with 99% using natural gas. The efficiencies of power plants commissioned before 2005 are estimated to be above 25%.
1.3 Energy Policies
Brunei Darussalam has sufficient reserves of gas and oil. In 2007, Brunei Darussalam produced 20.19 MTOE of gas and oil of which 17.41 MTOE was exported. The exploitation of alternative energy sources are currently being studied, and policies pertaining to the use of renewable energy will not likely to be released before the completion of the studying mid-2011. The study cover 6 Asian Development Bank Key Indicators for Asia 2009. 7 UN population Data 2009. 8 Department of Economic Planning and Development. Development Board,
http://www.depd.gov.bn/productservice.html

The 3rd ASEAN Energy Outlook30
amongst others: wind, hydro, tidal, bio-energy and solar energy. In the meantime, a 1.2 MWp solar photo-voltaic demonstration plant has been commissioned. The solar PV implementation study is over a period of 3 years. The PV plant has six types of PV modules installed. Other renewable energy demonstration/research plants may come on-line in the near future.
Brunei Darussalam has been active in implementing energy conservation initiative projects. These energy conservation initiatives are being championed by the Energy Division, Prime Minister Office (EDPMO). EDPMO has been actively promoting energy conservation since 2007, where EDPMO's campaigns have lead to the declaration of 24th May as the national Energy Day.
Brunei Darussalam is committed to achieving a target of 25% improvement in energy efficiency by 2030, relative to 2005 levels.
The energy market in Brunei Darussalam is state regulated. Energy prices are subsidized. However, the state has increased considerably the price of Motor gasoline (Premium 97) and diesel for vehicles and vessels not registered in Brunei Darussalam in the wake of increased smuggling of fuels to neighboring economies. The government is concerned about the increasing cost of maintaining fuel subsidies, and in 2008 began a Subsidy Awareness Campaign.
2 ENERGY AND CO2 EMISSION OUTLOOK
2.1 Final Energy Consumption (FEC)
Business-as-Usual (BAU) Scenario
Energy consumption of Brunei Darussalam is increasing over the years. The FEC increased from 0.833 MTOE in 2005 to 0.94 MTOE in 2007. The projected average annual increase in FEC from 2007 to 2030 is 3.2%. The projection is linked to GDP growth. Real GDP growth is assumed at a constant rate of 3.9% per year.
The highest rate of increase in FEC by sector from the study is from the industrial sector which is expected to grow at an average annual rate of 3.8%. The FEC in the residential and commercial sectors 9
Oil, mainly as transportation fuel, remains the highest energy source used. The FEC for oil is 0.647 MTOE in 2007, corresponding to 68.3% of the total fuel consumed, and by 2030 FEC for oil is expected to be 1.285 MTOE. The increase in oil consumption is mainly attributed by the increase in the number of road vehicles. The model also assumed a 1% electricity production based on oil. The demand for electricity is expected to increase on average of 3.4% per year and this translates to an increase of 4.5% per year in oil consumption. The difference in%age growth is due to efficiency factor of electricity generators, set at approximately 35%.
will also see a steady increase at 3.2% per year. This is in-line with the population increase of 2.1% per year and the increase in economic activities in the commercial sector.
9 Residential and commercial consumption are grouped as “Others”

31The 3rd ASEAN Energy Outlook
Figure BD-1: Final Energy Consumption by Sector, 1990-2030
0
500
1,000
1,500
2,000
KTOE
Non-energy 17 16 23 23 33 33
Others 85 265 415 411 552 547
Transport 226 460 638 633 879 872
Industry 96 200 322 319 471 467
1990 2007 2020 (BAU) 2020 (APS) 2030 (BAU) 2030 (APS)
Alternative Policy Scenario
In the alternative policy scenario (APS) the model is dictated by the energy conservation policy, whereby a 25% reduction in energy intensity from 2005 level is targeted. However, the model does not show a significant decrease in total FEC. Only 0.92% decrease is observed between the total FEC in 2030. Total FEC by sector in the APS also remained similar as that in the reference scenario. The small change is mainly contributed by the improvement, 0.01 MTOE in the transport sector. This correlates to improvement in the efficiency of internal combustion engines.
Figure BD-2: final Energy Consumption by Fuel Type, 1990-2030
0
500
1,000
1,500
2,000
KTOE
Others 2 0 0 0 0 0
Electrici ty 87 268 437 432 600 594
Natura l gas 0 26 38 38 51 51
Oi l 336 647 924 916 1,285 1,274
1990 2007 2020 (BAU) 2020 (APS) 2030 (BAU) 2030 (APS)

The 3rd ASEAN Energy Outlook32
The shift in the energy mix may be changed if alternative energy sources are considered in the alternative policy scenario. It is appropriate to assume at this juncture that oil and gas remain the main sources of energy as there are no strong indications of alternative energy policies being implemented in the near future. Changes to this scenario maybe implemented once policies on alternative energy are introduced.
2.2 Primary Energy Supply
Business-as-Usual (BAU) Scenario
The primary energy supply is dominated by natural gas at 71.6% in 2007. PES increase is expected to be at an average of 2.8% per year for the period of 2007 to 2030, and in absolute values; from 2.5 MTOE to 5.4 MTOE. In the 2010 model, solar source is being included and this is at 1 thousand tons of oil equivalent (KTOE).
PES for oil will grow at 3.7% per year and the PES for natural gas is expected to increase at 2.4% per year. These figures show that Brunei Darussalam will continue to be a net exporter of energy. The energy balance table shows in 2030 Brunei Darussalam will still be exporting 18.89 MTOE of liquefied natural gas and crude oil.
Figure BD-3: Primary Energy Supply, 1990-2030
0
1,000
2,000
3,000
4,000
5,000
6,000
KTOE
Others 2 0 1 1 2 2
Natura l gas 1,676 2,042 2,795 2,239 3,538 2,438
Oi l 123 808 1,351 1,339 1,864 1,847
1990 2007 2020 (BAU) 2020 (APS) 2030 (BAU) 2030 (APS)
Alternative Policy Scenario
A significant decrease in PES is observed between the BAU and the APS in year 2030. The difference between the two scenarios is 1.117 MTOE which corresponds to 20.67% reduction. In the intermediate year of 2020, the difference in absolute value is 0.568 MTOE which corresponds to a decrease of 13.7% from the BAU.

33The 3rd ASEAN Energy Outlook
2.3 Power Generation
Business-as-Usual (BAU) Scenario
In Brunei Darussalam, power generation is dominated by natural gas power plant and only 1% is by diesel. In 2007, 3.396 GWh of electricity was generated and by 2030 7.604 GWh of electricity will be needed. This shows an average annual increase of 3.4%. The%age increase by diesel generation over the same period is 4.1%.
Figure BD-4: Electricity Generation, 1990-2030
0
1,000
2,000
3,000
4,000
5,000
6,000
7,000
8,000
GWh
Others 0 0 13 13 22 22
Natura l gas 1,161 3,362 5,462 5,407 7,492 7,417
Oi l 11 33 62 61 91 90
1990 2007 2020 (BAU) 2020 (APS) 2030 (BAU) 2030 (APS)
The model assumes low efficiency electricity generation. The efficiency is set only at 24%. This implies for 0.65 MTOE or 7.5 GWh of electricity generated approximately 2.69 MTOE of natural gas is needed.
Alternative Policy Scenario
In the alternative policy scenario, the efficiencies of power generation plants were improved to 41% and this produced a significant change drop in natural gas consumption. The model shows in 2030 for 7.6 GWh of electricity only requires 1.59 MTOE of natural gas. The alternative policy scenario did not take into account any improvement in diesel generators.
2.4 Carbon Dioxide Emission
Business-as-Usual (BAU) Scenario
The percentage increase in CO2 emission correlates strongly to the increase in total primary energy supply (TPES). This is expected because the energy mix for Brunei Darussalam is 99% dependent on fossil fuel. In 2007, the energy balance table shows 1.591 million tons of Carbon equivalent (Mt-C) and this will increase at a steady rate of 3.3% per year to a value of 3.350 Mt-C in year 2030.

The 3rd ASEAN Energy Outlook34
Figure BD-5. CO2 Emission, 1990-2030
0
500
1,000
1,500
2,000
2,500
3,000
3,500
4,000
1990 2005 2007 2020 2030
Mill
ion
tons
of C
arbo
n Eq
uiva
lent
BAU
APS
Alternative Policy Scenario
In the APS, CO2 emission will decrease by 21.3% in 2030 as compared to that of the BAU. The model shows 2.637 Mt-C will be emitted in 2030 in the APS. This decrease in carbon dioxide emission is significantly contributed by the improvements in efficiencies of power generation plants. CO2 per TPES value does not show any significant increase, where both the BAU and the APS values remain at 0.62 t-C/toe. This is because no significant amount of non-fossil fuel was introduced in the APS.
3 FINDINGS AND POLICY IMPLICATIONS
3.1 Findings
Brunei Darussalam is highly dependent on fossil fuel. The energy profile will remain predominantly gas and oil based. The introduction of non-fossil fuel will not be cost effective, and therefore, the most significant way to reduce carbon dioxide emission is to improve on energy efficiency. The model also shows that the improvement in energy efficiency not only reduces carbon dioxide emission but it also improves energy intensity, where a decrease from 397 toe/Million 2000 US$ in 2005 to 255 toe/Million 2000 US$ in 2030 as shown in the APS results.
The BAU and the APS only place emphasis on EEC. The results are considerable showing significant reduction in carbon dioxide emission (21.3%) and TPES (20.7%) between the two scenarios.
This work also shows EEC improvement to power generation plants have significant impact on TPES and CO2 emission.
Improvement in TFEC may be achieved by the reduction in fuel consumption in the transport, residential and commercial sectors. EEC initiatives in these sectors are necessary if significant decrease in TFEC is to be expected. Improved transport network could also play an important role in reducing TFEC and CO2 emission.
35The 3rd ASEAN Energy Outlook
3.2 Policy Implications
The projected increase in final energy consumption requires urgency for Brunei Darussalam to reduce its final energy consumption. The government will continue to promote and practice energy efficiency and conservation. Various efforts have already been put in motion such as adopting energy efficiency and conservation (EEC) techniques and technologies within the nation. Having only oil and natural gas for its main sources for energy, it is also imperative for Brunei Darussalam to intensify the EEC initiatives to further strengthen its energy efficiency guidelines and regulations as well as accelerating the adoption of the EEC best practices and advanced technologies.

The 3rd ASEAN Energy Outlook36
37The 3rd ASEAN Energy Outlook
INDONESIA 1 BACKGROUND
1.1 Socio-Economic Situation
With a population of more than 225.6 million in 2007 and a land area of almost 2 million square kilometers, Indonesia is the 4th most populous country in the world and largest country in ASEAN.
With the economic growth rate reaching 6.3%, Indonesia's economy continues to improve. In 2007 the national GDP reached 233 billion US$ (constant 2000 value) and income per capita of 1,030 US$/person. The three largest components of GDP are: the manufacturing sector accounting for 27% of national GDP, trade, restaurants, and hotels 14.9%, then the agricultural sector 13.8%. Energy intensity of GDP was 0.82 tons of oil equivalent (TOE) per thousand US$ (constant 2000) values.
Total primary energy consumption (TPES) reached 191.4 million tons of oil equivalent (MTOE) in 2007, while total final energy consumption (TFEC) stood at 145.9 MTOE. TPES and TFEC per capita were computed at 0.78 TOE per person and 0.64 TOE per person.
1.2 Energy Supply-Demand Situation
In the last 17 years, the TFEC of Indonesia increased from 79.2 MTOE in 1990 to 133.5 MTOE in 2005 and to 145.9 MTOE in 2007 with an average growth rate of 3.7% per annum over the 1990 to 2007 period. Based on fuel type, coal has the highest consumption growth rate over the same period (23.3% per annum) followed by electricity at 9.2% per annum. Natural gas grew at 4.8% per annum while oil grew at 3.4% per annum over the same period. The other energy type, dominated mainly by wood, grew only at an average rate of 1.1% per annum. These growth rates resulted in a shift in the share of the different types of energy in the TFEC, especially coal which significantly increased from 0.7% in 1990 to 14.3% in 2007. Electricity share increased from 2.9% in 1990 to 7.1% in 2007. Natural gas share increased slightly while oil more or less remained above 33%. The share of “Others” decreased significantly due to the slower growth of biomass consumption; from 53.1% in 1990 to 34.9% in 2007. By sector, the highest energy consumption growth over the 1990-2007 period was in the industrial sector (6.3% per annum), followed by the transportation sector at 5.0% per annum. The other sectors, consisting of agriculture, residential, commercial and others grew at an average growth of 2.2% per annum during the same period.
On the supply side, the primary energy supply of Indonesia increased at an average rate of 3.7% per annum over the 1990 to 2007 period, from 102.4 MTOE in 1990 to 191.4 MTOE in 2007. Coal and geothermal energy are the types that experienced the highest increases with average annual growth rates of at 14.9% and 11.5%, respectively. The increase in oil prices was the cause of the increased need for coal in the industrial sector, as well as the government policies to increase utilization of both geothermal energy and coal for power generation.
Natural gas and hydropower experienced moderate growths, with average growth rates of 3.7 and 3.1% per annum, respectively. Oil supply grew at an average rate of 3.5% per annum while biomass and other energy supply grew at a slow rate below 1% per annum.
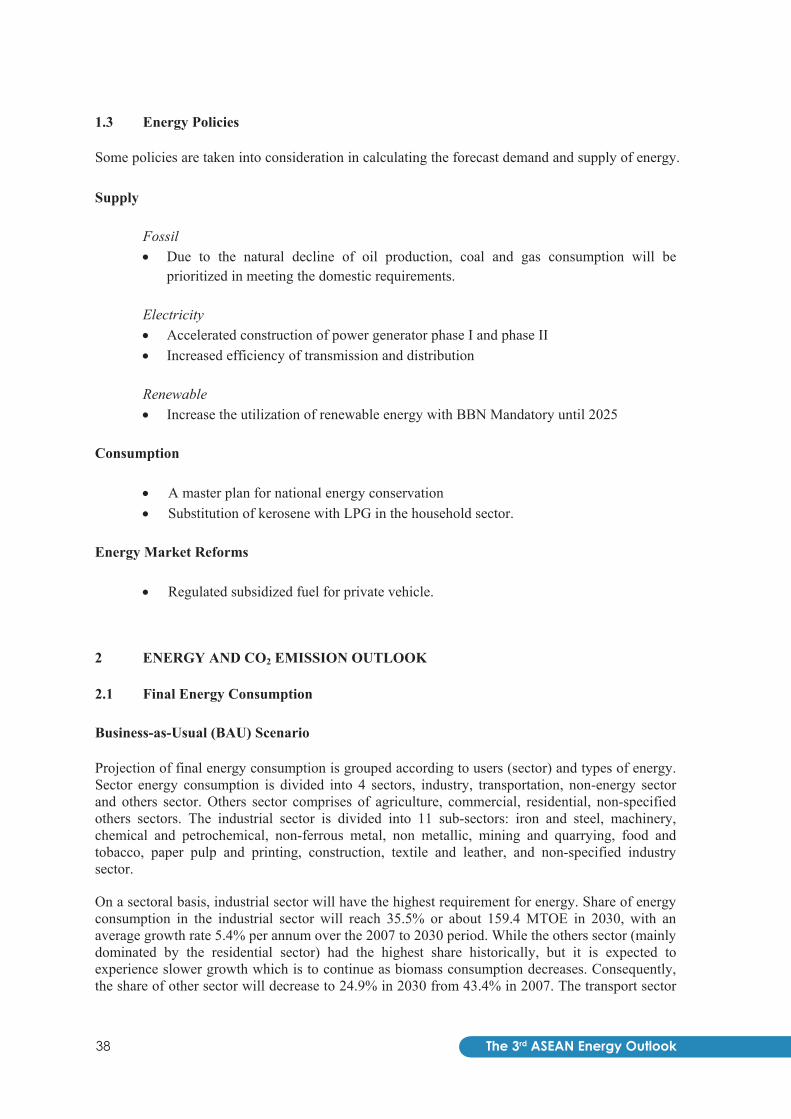
The 3rd ASEAN Energy Outlook38
1.3 Energy Policies
Some policies are taken into consideration in calculating the forecast demand and supply of energy.
Supply Fossil • Due to the natural decline of oil production, coal and gas consumption will be
prioritized in meeting the domestic requirements. Electricity • Accelerated construction of power generator phase I and phase II • Increased efficiency of transmission and distribution Renewable • Increase the utilization of renewable energy with BBN Mandatory until 2025
Consumption • A master plan for national energy conservation • Substitution of kerosene with LPG in the household sector.
Energy Market Reforms • Regulated subsidized fuel for private vehicle.
2 ENERGY AND CO2 EMISSION OUTLOOK
2.1 Final Energy Consumption
Business-as-Usual (BAU) Scenario
Projection of final energy consumption is grouped according to users (sector) and types of energy. Sector energy consumption is divided into 4 sectors, industry, transportation, non-energy sector and others sector. Others sector comprises of agriculture, commercial, residential, non-specified others sectors. The industrial sector is divided into 11 sub-sectors: iron and steel, machinery, chemical and petrochemical, non-ferrous metal, non metallic, mining and quarrying, food and tobacco, paper pulp and printing, construction, textile and leather, and non-specified industry sector.
On a sectoral basis, industrial sector will have the highest requirement for energy. Share of energy consumption in the industrial sector will reach 35.5% or about 159.4 MTOE in 2030, with an average growth rate 5.4% per annum over the 2007 to 2030 period. While the others sector (mainly dominated by the residential sector) had the highest share historically, but it is expected to experience slower growth which is to continue as biomass consumption decreases. Consequently, the share of other sector will decrease to 24.9% in 2030 from 43.4% in 2007. The transport sector

39The 3rd ASEAN Energy Outlook
will be the second largest energy consuming sector with consumption reaching 29.5% share in 2030 or about 132.3 MTOE. The average annual growth rate of the transportation sector will be 7.5% per annum over the 2007 to 2030 period.
Based on the type of energy, oil products will still be the most consumed energy form in 2030. The share of oil products in 2030 will reach 41.3%, or about 185.5 MTOE. Diesel, gasoline, and jet kerosene are the three oil products being consumed most as compared to the other oil products. The total share of these products will reach 72.2% of the total oil products in 2030. Kerosene, in the presence of the government program to substitute its usage in the household sector with LPG, will have a decreasing share from 12% in 2007 to 0.04%in 2030.
For coal, the share in the TFEC in 2030 will reach 17.1% or 76.8 MTOE. Meanwhile, electricity and natural gas consumption in 2030 will be almost equal, making their share in the total final energy consumption at almost 13%. The respective average annual growth rates will be 7.7% per annum and 6.1% per annum.
Alternative Policy Scenario (APS)
For the APS, final energy consumption in 2030 is estimated to be 20.3% lower than the BAU scenario. With an average growth rate of 4.0% per annum, the TFEC in 2030 will reach 358 MTOE.
Figure IN-1: Sectoral Final Energy Consumption by Scenario
0
20
40
60
80
100
120
140
160
180
REF APS REF APS REF APS REF APS
2005 2030 2005 2030 2005 2030 2005 2030
Industry Transportation Others Non-energy
Mill
ion
TOE
0
20
40
60
80
100
120
140
160
180
Mill
ion
TOE
-25%
-24%-18%
The shares of the sectors’ use of energy will not be too different than that of the BAU scenario. The industrial sector is still the dominant sector with a share of 33.4%. The share of the transport sector and others sector will be 28.1% and 25.8% respectively with average growth rates of 6.2% and 1.6% per annum, respectively.
By the type of energy, TFEC in 2030 will still be dominated by oil products. With an average growth rate of 5.0% per annum, consumption of oil products in 2030 will reach over 149 MTOE, or 41.7% of the TFEC.
With an increase in welfare and access to modern energy, consumption of other energy, currently dominated by biomass, is expected to increase slightly from 50.89 MTOE in 2005 to 55.6 MTOE

The 3rd ASEAN Energy Outlook40
in 2030 at an average annual rate of 0.4%. Electricity, on the other hand, is expected to increase significantly, at an average rate of 6.6% per annum, faster than the GDP growth rate. The increasing awareness of the environment will also lead to increased use of natural gas by an average of 5.4% per annum.
2.2 Total Primary Energy Supply
Business-as-Usual (BAU) Scenario
Total primary energy supply (TPES) will grow at an annual rate of 5.0% over the 2007-2030 period from 191.4 MTOE in 2007 to 592.9 MTOE in 2030. Compared to other types of energy, coal will still experience the highest growth with an average rate of 7.8% per annum as a result of increased demand in the industry and power generation sectors. Primary consumption of coal will increase to 209.1 MTOE in 2030. Natural gas is also expected to continue experiencing growth but at a slower rate than coal, i.e. 4.2% per annum. This is influenced by the policy to prioritize the use of natural gas for domestic needs but this will be tempered by infrastructure constraint.
Oil as one of the dominant energy, will experience moderate growth also at an average of 5.1% per annum. Geothermal on the other hand, is expected to increase rapidly by an average rate of 6.6% per annum due to the government's commitment in developing renewable energy. Hydro is also expected to increase in the future, but at a slower rate of 4.6% per annum. The others type of energy, including solar, wind, etc. will only increase at an average rate of 1.5% per annum.
Figure IN-2: Primary Energy Consumption by Scenario
0
50
100
150
200
250
REF
AP
S
REF
AP
S
REF
AP
S
REF
AP
S
REF
AP
S
2005 2030 2005 2030 2005 2030 2005 2030 2005 2030
Coal Oil Natural Gas Nuclear Others
Mill
ion
TOE
0
50
100
150
200
250
Mill
ion
TOE
Alternative Policy Scenario
With an average growth rate of 3.7% per annum, the TPES will increase to 444.8 MTOE in 2030, 148.1 MTOE or 25.0% lower than in the BAU scenario. This would be the result of introducing more efficient energy management and technologies in all of the major energy consuming sectors including the power sector.
41The 3rd ASEAN Energy Outlook
Just as in the reference scenario, the most significant increase will be coal and geothermal with average growth rates of 5.7% per annum and 6.6% per annum, respectively.
The existence of several conversion programs and fuel substitution to biofuels will lead to an average growth of oil at 4.2% per annum, lower than the growth in the reference scenario of 5.1%. Hydro will not be experiencing different growth as compared to its growth in the reference scenario. Natural gas will still be increasing, but the rate will be slower at an average rate of 3.1% per annum compared to the 4.2% in the BAU scenario.
2.3 Power Generation
Business-as-Usual (BAU) Scenario
Electricity production increased from 127.4 TWh in 2005 to 142.3 TWh in 2007 and will continue to increase to 782.9 TWh in 2030. This increase is equivalent to an average growth of 7.7% per annum over the 2007-2030 period.
The biggest increase in electricity production will come from coal power plants. , The production of electricity from coal is estimated to increase by an average of 9.7% per annum. This high increase in the use of coal for power generation is in line with the government phase I acceleration program of constructing 10,000 MW of coal power plants.
In addition to meeting the increasing electricity demand, coal generation is expected also to reduce oil-fired power plants which could reduce the cost of electricity providers. Consequently, electricity production from oil-fired power plant is expected to drop from 37.7 TWh in 2007 to 12.7 TWh in 2030. This decrease is equivalent to an average declining rate of 4.6% per annum.
Generation of electricity from natural gas will increase by an average of 9.1% per annum, while from hydro and geothermal the rates of increase on average will be 4.6% per annum and 6.6% per annum, respectively.
Alternative Policy Scenario (APS)
Under the APS, electricity production is expected to increase at an average rate of 6.6% per annum reaching around 618 TWh in 2030. This is a decrease by about 21.0% from that of the BAU scenario.
Not much different from the BAU scenario, production of electricity from coal will increase the highest at 8.2% per annum followed by natural gas, geothermal and hydro but with slower rates of growth of 7.7% per annum, 6.6% per annum and 4.6% per annum, respectively. On the other hand, electricity generation from oil will decrease at an average rate of 4.6% per annum.
2.4 CO2 Emission
Business-as-Usual (BAU) Scenario
With average consumption growth of 5.0% per annum, CO2 emissions from energy combustion are expected to increase from 93.4 Mt-C in 2007 to 406 Mt-C in 2030. During that period the average CO2 emissions generated will increase at an average rate of 6.6% per annum, higher than the rate of growth of GDP.

The 3rd ASEAN Energy Outlook42
When compared to the national GDP, it can be seen that the relationship of CO2 emissions per unit of GDP will increase from 401 t-C/million 2000 US$ in 2007 to 428 t-C/million 2000 US$ in 2030.
Alternative Policy Scenario (APS)
Under the Alternative Policy Scenario, the CO2 emissions in 2030 will be 281.2 Mt-C or 30.7% lower than emissions in the BAU scenario. The average growth of CO2 emissions will be lower at 4.9% per annum. Consequently, the CO2 emission per unit of national GDP will decline to 297 t-C/million 2000 US$ in 2030. This CO2 intensity is lower than that of the BAU by 30.7%.
3 FINDINGS AND POLICY IMPLICATION
3.1 Findings
• The share of coal in TPES will increase to 35.3% by 2030 in the BAU scenario, but at a slightly lower 29.5% in the APS.
• Oil will still have a high share of more than 30% in both scenarios as a result of its continuous and rapidly increasing use in the transportation sector.
• Geothermal contribution in power generation will increase at an average rat of 6.6% per annum over the 2007 to 2030 period.
• Nuclear will play a role in the generation mix only from 2020 onwards.
• Thermal efficiency of fossil fuel power plants will improve as more efficient coal power and gas combined cycle plants are being constructed. Thermal efficiency of fossil fueled power plants will improve from around 37.4% to almost 46.8% in the APS.
3.2 Policy Implication
• Increased use of coal may have an impact on emissions, so the Government needs a policy in order to maintain environmental quality in the future such as the addition of environmental taxes in any development of fossil energy.
• To reduce oil domination in transportation sector, government need to increase development of mass rapid transport, provision of incentives for the development of more efficient technologies, and reduction of subsidies for fuel.

43The 3rd ASEAN Energy Outlook
LAO PEOPLE’S DEMOCRATIC REPUBLIC (LAO P.D.R.)
1. BACKGROUND 1.1 Socio-Economic Situation
Lao People’s Democratic Republic (Lao P.D.R) is a small landlocked country in the middle of Southeast Asia. It has borders with five countries namely China in the north, Vietnam in the east, Cambodia in the south, Thailand and Myanmar in the west. Lao P.D.R has a total land area of 236,800 square kilometres and about 70% of that is covered by mountains. Lao P.D.R has a population of 5,873,616 people in 2007 with the female population accounting for a little bit more than 50% of the total. The average population density is 25 people per square kilometre. Laos consists of 17 provinces. Its capital city, Vientiane, has a population of 725,820 people in 2007.
Since Lao P.D.R had changed its economic policy to an open door policy in 1986, the economy has been progressing and expanding rapidly. The Gross Domestic Product (GDP) in 2007 increased by 7.9% from the previous year. GDP stood at about US$ 2,388 million at constant 2002 prices and about US$ 4,112 million in nominal terms. Per capita GDP was about US$ 700. The economy has been gradually changing from agriculture-oriented to a wider range of activities such as services and industry. In 2007, the services sector accounted for 38.4% while the agriculture sector had only 30.8% of GDP. The industry sector also increased rapidly due to investments in mineral and hydropower sectors. Even though in 2007 it has contributed only 26% to the GDP, it is projected to take a bigger share in the GDP within 5 years.
1.2 Energy Supply-Demand Situation
Laos’s total primary energy demand in 2007 was 2.2 MTOE. The country’s primary energy demand mix consists of four types of energy such as oil, hydro, coal and other energy which consist mostly of biomass and charcoal. The biomass energy is mainly supplied for cooking. In 2007, the biomass energy supply amounted to 1.3 MTOE and accounted for 61.4% of the total energy supply. Oil came second at 0.5 MTOE and a share of 21.5% of the total primary energy demand. Oil and petroleum products are all imported from Thailand and Vietnam. Oil is mainly used in the transportation sector. Other remaining energies in the primary energy supply are coal and hydro. In the 2007, 0.3 MTOE of hydro and 0.1 MTOE of coal had been supplied. Hydro represented 13.5% while coal had a 3.6% share in the total primary energy supply.
Lao P.D.R. is rich in hydro resources and in view of the low electrification ratio, rapidly increasing electricity demand and increasing power production for export, the development of the country’s hydropower potential is being promoted. According to the Lao Government plan, the country will increase the electrification ratio from 59% in 2007 to 70% in 2010 and 90% in 2020. This plan is among the priorities of the government to eradicate the country’s poverty. According to the Mekong River Commission Study in 1995, Lao has a hydropower potential of 23,000 MW. Up to 2007, only 3% of this potential has been developed with a total installed power capacity of only 673 MW. The total power supply is nearly 100% from hydro power source. In 2007, Lao P.D.R produced 3,374 GWh of electricity. From the total power generation, more than 66% or 2,230 GWh was exported to Thailand and 39% or 1,311 GWh was supplied domestically. The export figure is projected to increase sharply because by the year 2020, Lao P.D.R has agreed to export

The 3rd ASEAN Energy Outlook44
7,000 MW to Thailand and 5,000 MW to Viet Nam to help its neighboring countries fulfill their power demand. The power source for the export is mainly from the hydropower except for one coal thermal power plant, the Hongsa Lignite Power Project. This project alone has an installed capacity of 1,800 MW. At present, there are more than 50 hydropower sites planned to be developed for export. These hydropower projects are being developed jointly between the Lao government and foreign investors.
1.3 Energy Policies
Since the Ministry of Energy and Mines has been established in 2006, energy policy gained a lot of attention and has been developing in more complexity. In the past, it focused solely on the power sector but now it covers most of energy types and energy related activities. Lao P.D.R’s energy policy aims to develop the energy sector toward sustainability and environmental compatibility. This is brought about by the cooperation of the Ministry of Energy and Mines with ASEAN, other countries and international agencies. Many lessons and experiences learned from overseas have been incorporated into the policy.
Energy Supply
On the energy supply side, the Lao government has set up a number of measures and strategies to ensure greater energy supply security and sustainable development in the energy sector. The government would like to provide sufficient and stable energy supply for socio-economic development. At the same time, the government attempts to reduce the dependence on energy import and gradually diversify its energy supply. Now the renewable energy policy is being drafted aimed to increase the share of renewable energy in total energy supply by 30% by 2020. This targeted obligation also includes 10% of bio-fuels injection in the oil supply for the transportation sector. This policy will help the country to reduce the use of fossil fuels and oil import. For the nuclear energy policy, although there is no nuclear power plant planned to be developed in the medium term, the government is attempting to build its human resource capacity to be ready to cooperate with other countries and develop the nuclear power plants in the long term when it is necessary.
Energy Consumption
During the past decade, energy demand of Lao P.D.R increased substantially. In 1990, only 1.1 MTOE of energy had been consumed; in 2007 it increased to 2.2 MTOE and it is projected to increase to 8.7 MTOE by the year 2030. This requires a lot of investments in the energy supply side. Likewise, the country needs to use more of its natural resources and to import more oil from other countries. These can cause negative impacts to the environment and increase green house gas concentration in the atmosphere. Therefore the Lao government as well as the Ministry of Energy and Mines are taking this matter seriously. One of the most effective measures and policies to minimize the associated issues, which the government is currently promoting, is the energy efficiency and conservation program. In this program, 10% reduction in energy consumption by 2020 in all sectors is being proposed to the government. If it is approved the specific measures and activities will be discussed and implemented in different sectors.
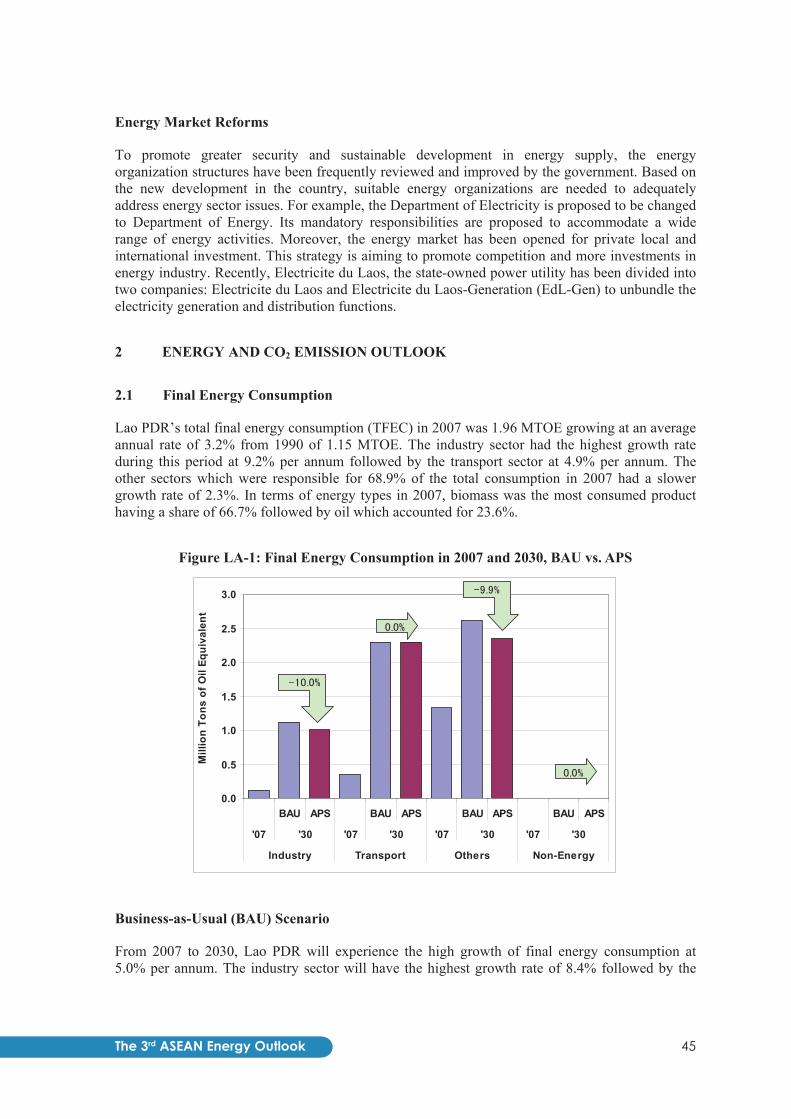
45The 3rd ASEAN Energy Outlook
Energy Market Reforms
To promote greater security and sustainable development in energy supply, the energy organization structures have been frequently reviewed and improved by the government. Based on the new development in the country, suitable energy organizations are needed to adequately address energy sector issues. For example, the Department of Electricity is proposed to be changed to Department of Energy. Its mandatory responsibilities are proposed to accommodate a wide range of energy activities. Moreover, the energy market has been opened for private local and international investment. This strategy is aiming to promote competition and more investments in energy industry. Recently, Electricite du Laos, the state-owned power utility has been divided into two companies: Electricite du Laos and Electricite du Laos-Generation (EdL-Gen) to unbundle the electricity generation and distribution functions.
2 ENERGY AND CO2 EMISSION OUTLOOK
2.1 Final Energy Consumption
Lao PDR’s total final energy consumption (TFEC) in 2007 was 1.96 MTOE growing at an average annual rate of 3.2% from 1990 of 1.15 MTOE. The industry sector had the highest growth rate during this period at 9.2% per annum followed by the transport sector at 4.9% per annum. The other sectors which were responsible for 68.9% of the total consumption in 2007 had a slower growth rate of 2.3%. In terms of energy types in 2007, biomass was the most consumed product having a share of 66.7% followed by oil which accounted for 23.6%.
Figure LA-1: Final Energy Consumption in 2007 and 2030, BAU vs. APS
0.0
0.5
1.0
1.5
2.0
2.5
3.0
BAU APS BAU APS BAU APS BAU APS
'07 '30 '07 '30 '07 '30 '07 '30
Industry Transport Others Non-Energy
Mill
ion
Tons
of O
il Eq
uiva
lent
-9.9%
-10.0%
0.0%
0.0%
Business-as-Usual (BAU) Scenario
From 2007 to 2030, Lao PDR will experience the high growth of final energy consumption at 5.0% per annum. The industry sector will have the highest growth rate of 8.4% followed by the
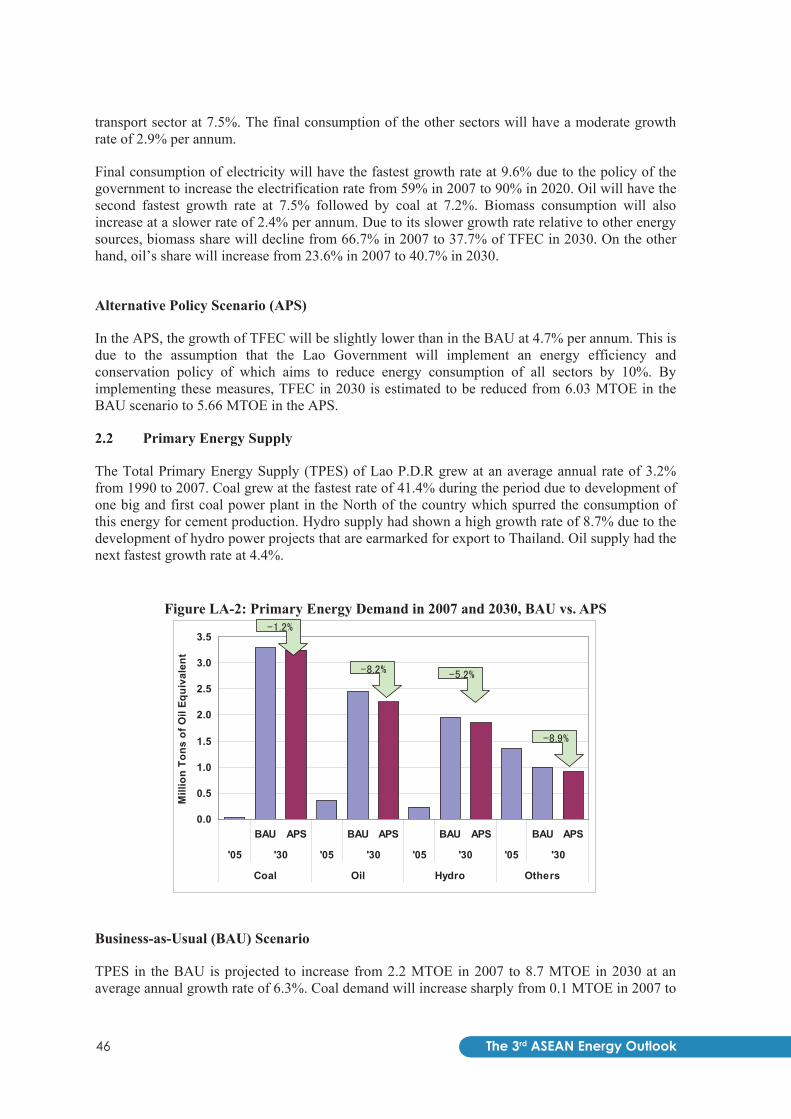
The 3rd ASEAN Energy Outlook46
transport sector at 7.5%. The final consumption of the other sectors will have a moderate growth rate of 2.9% per annum.
Final consumption of electricity will have the fastest growth rate at 9.6% due to the policy of the government to increase the electrification rate from 59% in 2007 to 90% in 2020. Oil will have the second fastest growth rate at 7.5% followed by coal at 7.2%. Biomass consumption will also increase at a slower rate of 2.4% per annum. Due to its slower growth rate relative to other energy sources, biomass share will decline from 66.7% in 2007 to 37.7% of TFEC in 2030. On the other hand, oil’s share will increase from 23.6% in 2007 to 40.7% in 2030.
Alternative Policy Scenario (APS)
In the APS, the growth of TFEC will be slightly lower than in the BAU at 4.7% per annum. This is due to the assumption that the Lao Government will implement an energy efficiency and conservation policy of which aims to reduce energy consumption of all sectors by 10%. By implementing these measures, TFEC in 2030 is estimated to be reduced from 6.03 MTOE in the BAU scenario to 5.66 MTOE in the APS.
2.2 Primary Energy Supply
The Total Primary Energy Supply (TPES) of Lao P.D.R grew at an average annual rate of 3.2% from 1990 to 2007. Coal grew at the fastest rate of 41.4% during the period due to development of one big and first coal power plant in the North of the country which spurred the consumption of this energy for cement production. Hydro supply had shown a high growth rate of 8.7% due to the development of hydro power projects that are earmarked for export to Thailand. Oil supply had the next fastest growth rate at 4.4%.
Figure LA-2: Primary Energy Demand in 2007 and 2030, BAU vs. APS
0.0
0.5
1.0
1.5
2.0
2.5
3.0
3.5
BAU APS BAU APS BAU APS BAU APS
'05 '30 '05 '30 '05 '30 '05 '30
Coal Oil Hydro Others
Mill
ion
Tons
of O
il Eq
uiva
lent
-5.2%
-1.2%
-8.2%
-8.9%
Business-as-Usual (BAU) Scenario
TPES in the BAU is projected to increase from 2.2 MTOE in 2007 to 8.7 MTOE in 2030 at an average annual growth rate of 6.3%. Coal demand will increase sharply from 0.1 MTOE in 2007 to

47The 3rd ASEAN Energy Outlook
3.3 MTOE in 2030 at an average rate of 17.6% per annum as a new coal power plant called Hongsa Lignite Power Plant will be operated from 2015 onwards. Hydro will also increase sharply but at a lower rate of 8.6% as compared to that of coal. It will increase from 0.3 MTOE in 2007 to 1.9 MTOE in 2030. Oil demand will rise at relatively slower pace of 7.5% from 0.5 MTOE in 2007 to 2.5 MTOE in 2030. As a result of these growth rates, coal share will increase significantly from 3.6% in 2007 to 37.9% in 2030. Coal will even represent 50.4% of TPES in 2020.
Alternative Policy Scenario (APS)
In APS, the TPES will increase at a low rate of 6.0% throughout the projection period between 2007 and 2030 on the average. It is projected to increase from 2.2 MTOE in 2007 to 8.3 MTOE in 2030. If compared with that of the BAU, the TPES in APS will be decreased by 5.0% or equivalent to 0.4 MTOE. The reduction in TPES would result from implementation of a number of energy strategies and measures mentioned above.
Figure LA-3: Evolution of Primary Energy Demand, RS vs. APS
0.0
1.0
2.0
3.0
4.0
5.0
6.0
7.0
8.0
9.0
10.0
BAU APS
1990 2005 2030
Mill
ion
Tons
of O
il Eq
uiva
lent
0.4 Mtoe, -5.0%
2.3. Power Generation
As the Lao Government has been promoting the power development, the power generation in the country will grow at a high average growth rate of 10.5% from 2007 to 2030. The sources are mainly from hydro power. There will be only one coal power plant to be developed during 2010 to 2015. The total of power production is projected to increase from 3.4 TWh in 2007 to 33.3 TWh in 2030. Hydropower generation will grow at the average rate of 8.4% and by the year 2030 it can generate power of 21.5 TWh while the coal plant can generate only 11.8 TWh. Hydro will remain as the dominant electricity source in Lao P.D.R. although its share will decline from 100% in 2007 to 64.5% in 2030.
Electricity generation in both the BAU and APS will be the same. However, the amount that could be exported to other countries will increase in the APS in view of the lower domestic consumption relative to BAU.

The 3rd ASEAN Energy Outlook48
2.4. CO2 Emission
Lao P.D.R.’s CO2 emission from fuel combustion increased by 5.8% per annum from 1990 to 2007. CO2 emission per unit of energy consumed of 0.22 t C/TOE is one of the lowest in the world due to the fact that almost 100% of its electricity generation comes from hydropower plants.
Business-as-Usual (BAU) Scenario
In the BAU, CO2 emission is expected to increase significantly from 0.5 Million Tons in 2007 to 5.8 Million Tons in 2030 an at average annual rate of 11.6%. This would be driven by the operation of a 1,800 MW coal power plant in addition to the consumption of oil in the final consumption sector. CO2 emission per unit of energy consumed will increase from 0.22 ton of Carbon per ton of oil equivalent (t C/toe) in 2007 to 0.67 t C/toe in 2030.
Alternative Policy Scenario (APS)
In the APS, CO2 emissions will grow at a lower average growth rate of 11.4% per annum due to the lower final energy consumption as the government implements the proposed energy efficiency and conservation program.
3. FINDINGS AND POLICY IMPLICATION
3.1. Findings
In this Energy Outlook, the GDP of Lao P.D.R is assumed to grow at an average annual growth rate of 7.7% from 2007 to 2030 while population growth is assumed to grow at an average annual growth rate of 1.6%. By the year 2030, if the three energy measures of the government are implemented, the TPES will decrease from 8.7 MTOE in the BAU Scenario to 8.3 MTOE in the APS. It means that Lao P.D.R can reduce TPES by 0.43 MTOE. At the same time, TFEC can decrease from 6.03 MTOE in BAU to 5.66 MTOE in the APS.
Comparative Table (BAU vs APS)
RS APS Value %
TFEC Mtoe 1,799 6,027 5,657 (370.0) (6.14)
TPES Mtoe 1,977 8,692 8,263 (429.0) (4.94)
CO2 Emission Mt-C 330 5,820 5,611 (209.3) (3.60)
Energy Intensity toe/Million 2000 US$ 824 581 552 (28.7) (4.94)
TPES/Capita toe/person 0.34 0.99 0.94 (0.05) (4.94)
TFEC/Capita toe/person 499 687 645 (42.16) (6.14)
CO2/TPES t C/toe 0.17 0.67 0.68 0.01 1.41
CO2 Intensity t C/Million 2000 US$ 138 389 375 (14.0) (3.60)
Decrease2030Unit 2005
3.2. Policy Implication
In this study, Lao P.D.R will get the energy savings mainly through the implementation of the government’s renewable energy and energy conservation programs. The programs consist of an

49The 3rd ASEAN Energy Outlook
increase of the renewable energy share in total energy supply by 30% by 2020, input 10% of bio-fuels in oil supply for the transportation sector and the reduction of 10% in energy consumption of all sectors.
In order to have energy reduction both in Total Primary Energy Supply and Total Final Energy Consumption, as well as the reduction in CO2 Emissions, Lao P.D.R should implement the renewable energy and energy conservation programs. Importantly, those programs should be implemented properly.

The 3rd ASEAN Energy Outlook50
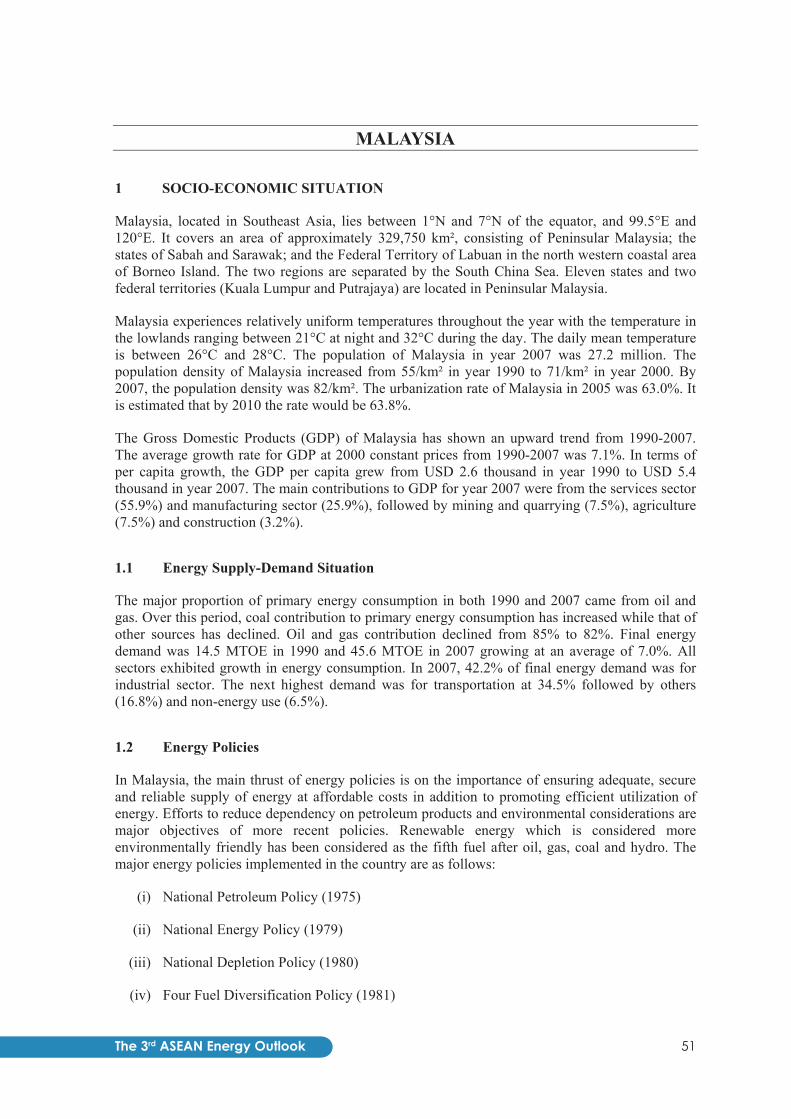
51The 3rd ASEAN Energy Outlook
MALAYSIA
1 SOCIO-ECONOMIC SITUATION
Malaysia, located in Southeast Asia, lies between 1°N and 7°N of the equator, and 99.5°E and 120°E. It covers an area of approximately 329,750 km², consisting of Peninsular Malaysia; the states of Sabah and Sarawak; and the Federal Territory of Labuan in the north western coastal area of Borneo Island. The two regions are separated by the South China Sea. Eleven states and two federal territories (Kuala Lumpur and Putrajaya) are located in Peninsular Malaysia.
Malaysia experiences relatively uniform temperatures throughout the year with the temperature in the lowlands ranging between 21°C at night and 32°C during the day. The daily mean temperature is between 26°C and 28°C. The population of Malaysia in year 2007 was 27.2 million. The population density of Malaysia increased from 55/km² in year 1990 to 71/km² in year 2000. By 2007, the population density was 82/km². The urbanization rate of Malaysia in 2005 was 63.0%. It is estimated that by 2010 the rate would be 63.8%.
The Gross Domestic Products (GDP) of Malaysia has shown an upward trend from 1990-2007. The average growth rate for GDP at 2000 constant prices from 1990-2007 was 7.1%. In terms of per capita growth, the GDP per capita grew from USD 2.6 thousand in year 1990 to USD 5.4 thousand in year 2007. The main contributions to GDP for year 2007 were from the services sector (55.9%) and manufacturing sector (25.9%), followed by mining and quarrying (7.5%), agriculture (7.5%) and construction (3.2%).
1.1 Energy Supply-Demand Situation
The major proportion of primary energy consumption in both 1990 and 2007 came from oil and gas. Over this period, coal contribution to primary energy consumption has increased while that of other sources has declined. Oil and gas contribution declined from 85% to 82%. Final energy demand was 14.5 MTOE in 1990 and 45.6 MTOE in 2007 growing at an average of 7.0%. All sectors exhibited growth in energy consumption. In 2007, 42.2% of final energy demand was for industrial sector. The next highest demand was for transportation at 34.5% followed by others (16.8%) and non-energy use (6.5%).
1.2 Energy Policies
In Malaysia, the main thrust of energy policies is on the importance of ensuring adequate, secure and reliable supply of energy at affordable costs in addition to promoting efficient utilization of energy. Efforts to reduce dependency on petroleum products and environmental considerations are major objectives of more recent policies. Renewable energy which is considered more environmentally friendly has been considered as the fifth fuel after oil, gas, coal and hydro. The major energy policies implemented in the country are as follows:
(i) National Petroleum Policy (1975)
(ii) National Energy Policy (1979)
(iii) National Depletion Policy (1980)
(iv) Four Fuel Diversification Policy (1981)

The 3rd ASEAN Energy Outlook52
(v) Five Fuel Policy (2001)
(vi) Biofuel Policy (2006)
(vii) Green Technology Policy (2009)
In recent years, renewable energy (RE) has been recognized as an option to reduce dependence on fossil fuels. Realizing this, the government has increased its role in promoting RE projects and activities. Shown in Table 1 are some of the government-initiated RE programs.
Table MA-1: Renewable Energy Programs in Malaysia
Year Programs
1980s Photo Voltaic (PV) System for Rural Electrification Program.
1998 First PV Grid Connected System Application.
2001 Formulation of Fifth Fuel policy. Small Renewable Energy Power Program (SREP).
2002 Biomass Power Generation and Co-Generation Project (BIOGEN).
2004 1st SREP Projects completed: Jana Landfill Project (Biogas - 2MW), TSH Bioenergy Project (Biomass - 10 MW).
2005 Malaysia Building Integrated Photovoltaic Project (MBIPV).
2006 National Biofuel Policy Source: Second National Communications, Ministry of Natural Resources and Environment Malaysia
In meeting the objectives of the policies, programs have been launched by both government and non-government organizations to improve the energy usage and efficiency in the sector. Among the significant developments is the National Green Technology Policy in the residential and commercial sectors. For example the construction of the Green Energy Office (GEO) Building followed the Malaysian Standard MS 1525:2007 “Code of Practice on Energy Efficiency and the Use of Renewable energy for Non-Residential Building” and the Malaysian Standard (MS 1837: 2005) for Installation of Grid-Connected Photovoltaic (PV). The following is a list of some of the programs:
i. Malaysia Guideline for Energy Efficiency in Buildings (1989)
ii. Energy Efficient Building Demonstration Projects for Government Buildings (on-going from 1999 until now)
iii. Energy Audit in Government Buildings (started in 2003)
iv. Rating and Labeling Program for Household Appliances (February 2006)
v. Code of Practice on EE and Use of RE for Non-Residential Buildings – MS 1525: 2001, revised 2007

53The 3rd ASEAN Energy Outlook
vi. National Energy Efficiency Awareness Campaign (Switch!) (2008)
vii. Green Building Index (GBI) – currently on voluntary basis
viii. Phasing out of incandescent bulb to be completed before 2014
2 ASSUMPTIONS AND SCENARIOS FOR THE ENERGY OUTLOOK
In the energy outlook for the period 2007-2030, it was assumed that the Malaysia population will grow at an average rate of 2.3% annually from 2010 until 2020 and 2.1% from 2020-2030. Based on this growth rate the total population is expected to register 39.4 million by the year 2030.
Table MA-2: Outlook Growth Rates of Population
Year Growth Rate 1990 - 2005 2.30%
2005 - 2010 2.30%
2010-2020 2.30% 2020-2030 2.10%
Source: Department of Statistics (2009)
Figure MA-1: Projected GDP by Sub-Sectors
-
200
400
600
800
1,000
1,200
1,400
2007
2008
2009
2010
2011
2012
2013
2014
2015
2016
2017
2018
2019
2020
2021
2022
2023
2024
2025
2026
2027
2028
2029
2030
RM Million at 2000 Prices
GDP Industrial GDP Commercial GDPAgriculture GDP Manufacturing GDP
Source: Economic Planning Unit, Study to Formulate a New Energy Policy for Malaysia, August 2009
New GDP growth was projected by the Economic Planning Unit under the Prime Minister’s Office while carrying a study to formulate a new energy policy for Malaysia in August 2009. The projected GDP growth was lower than that of the previous outlook due to economic slowdown following the deepening recession in several advanced economies as well as slower growth in the regional economies. The GDP is expected to grow by about 3.8% per annum for the period 2007-2030, much lower when compared to 1990-2007 growth rate of 7.1% per annum. The new economic outlook also includes projected growth rates by sub-sectors such industrial GDP, commercial GDP, manufacturing GDP and agriculture GDP. Information on breakdown of sub-sectoral GDP will help to improve the results of the energy outlook. This growth rate is used in all

The 3rd ASEAN Energy Outlook54
scenarios that will be discussed later. The table below shows the growth rates of GDP by sub-sectors.
Table MA-3: Outlook Growth rates of GDP
Year GDP (%)
Industrial GDP (%)
Commercial Sector GDP
(%)
Manufacturing GDP (%)
Agricultural GDP (%)
2007-2010 0.83 -0.22 1.62 -1.10 1.12
2011-2015 4.57 4.85 4.36 5.60 4.64
2016-2020 4.72 5.06 4.47 5.56 4.70
2021-2025 4.15 4.48 3.89 4.98 4.08
2026-2030 3.62 3.96 3.37 4.45 3.50 Source: Economic Planning Unit, Study to Formulate a New Energy Policy for Malaysia, August 2009
In formulating the energy outlook, several scenarios have been generated to look into several options and conditions of energy supply and demand in the country. The selected scenarios were based on the future potential option that Malaysian will achieve or adapt in the energy field. Some of the assumptions are still under review, and studies by the government and other institutions have been undertaken especially on future energy saving in the commercial and industrial sectors. The objectives of the scenarios and assumptions are to create new situations where Malaysia can be more energy saving and less pollutant emitting. These were assessed based on comparison with the Business As Usual (BAU) scenario where there are no assumed actions will be undertaken on energy efficiency and emissions. BAU will be the benchmark or basis for the others scenarios for future outlook. Alternative Policy Scenario (APS) is a scenario when the combinations of all scenarios are assessed. Table 4 below shows the scenarios and assumptions for the outlook.
The EEC scenario was based on the outcome of the energy audits conducted by the Malaysian Industrial Energy Efficiency Improvement Program (MIEEIP). According to the energy audits under the EEC scenario, the energy demand will have potential savings of 10% from 2011 until 2030 compared with BAU scenario. This assumption may be applicable to the commercial and residential sector as more activity and programs are and will be conducted by government and non-government in these sectors to promote energy efficiency in Malaysia.
In its latest Government Transformation Program (GTP) Roadmap, released in 2010, the government of Malaysia aims to increase the share of public transport in Klang Valley, Penang and Johor Bharu. The Government aims to starts with Klang Valley and has set a target of increasing public transport share during peak hours to 25% by 2012. This implies increasing the users of public transport system by 2.5 times during peak hours. The public transportation will be enhancing especially the electric train system in terms of increasing the number of trains and extending the railway track that will definitely help reducing the usage of liquid fuels from vehicle owners. People will expect to switch to public transportation such as electric train especially on daily transportation to work place. The Government of Malaysia is formulating the Electric Vehicle Infrastructure Roadmap and will be expecting to finish by first quarter of 2011. Promoting electric vehicles in the country will help to reduce liquid fuel usage. For a start, the Government of Malaysia is now extending the policy of tax-free acquisition of hybrid vehicles until December 2011.

55The 3rd ASEAN Energy Outlook
Table MA-4: Scenarios and Assumptions
Scenarios Assumptions
Energy Efficiency and Conservation (EEC) Scenario
1. Reduction of 10% in industrial sector energy consumption from 2011 to 2030
2. Reduction of 10% in commercial sector energy consumption from 2011 to 2030
3. Reduction of 10% in residential sector energy consumption from 2011 to 2030
4. Fuel Switching from Motor Gasoline to Electric Train in public sector • In 2010, the electric consumption in train will be at 12 ktoe and 20
ktoe in 2020 5. Fuel switching from Motor Gasoline to Electric Vehicle in
transportation sector • In 2011, there will be 50 EV in road and gradually increase to
1000 EV in 2030 • Assuming, motor gasoline per vehicle is about 0.00139 ktoe or
1,473 liter/year • c. In 2030, potential reduction of motor gasoline in transportation
sector is about 1.39 ktoe
Renewable Energy (RE) Scenario
1. Biomass : 330 MW in 2015 increasing to 1,340 MW in 2030 2. Biogas : 100 MW in 2015 increasing to 410 MW in 2030 3. Mini Hydro : 290 MW in 2015 increasing to 490 MW in 2020 4. Solar : 55 MW in 2015 increasing to 854 MW in 2030 5. MSW : 200 MW in 2015 increasing to 390 MW in 2030 6. Biodiesel: to replace 5% of diesel starting 2011
Nuclear (NUC) Scenario 2000 MW in 2023
APS Scenario EEC + RE + NUC
The grid connected RE capacity by 2030 is based on the National Renewable Energy Policy and Action Plan. By then, the Feed in Tariff (FiT) mechanism is anticipated to be implemented to help promote RE in the country. Regarding biofuels, it is anticipated that 5% of diesel consumption for the transport sector will come from biodiesel. For a start, by middle of year 2011, the biodiesel program will be implemented in the central region of Peninsular Malaysia. For electricity generation, Malaysia will be expecting to have nuclear power plant by 2023, consisting of two units with 1,000 MW each.
3 OUTLOOK RESULTS
3.1 Final Energy Consumption
The total final energy consumption of Malaysia grew at an average annual growth rate of 7.0%, from about 14.5 MTOE in 1990 to 45.6 MTOE in 2007. The total final energy consumption in the transport sector, which consumed the largest portion of energy, grew at an average rate of 6.4% per annum. The industrial sector energy consumption grew the fastest at an average rate of 7.9% per annum. Other sectors such as residential, commercial and agriculture sector grew at an average rate of 5.9% per annum. Consumption for non-energy use increased by 7.7% per annum during the same period.
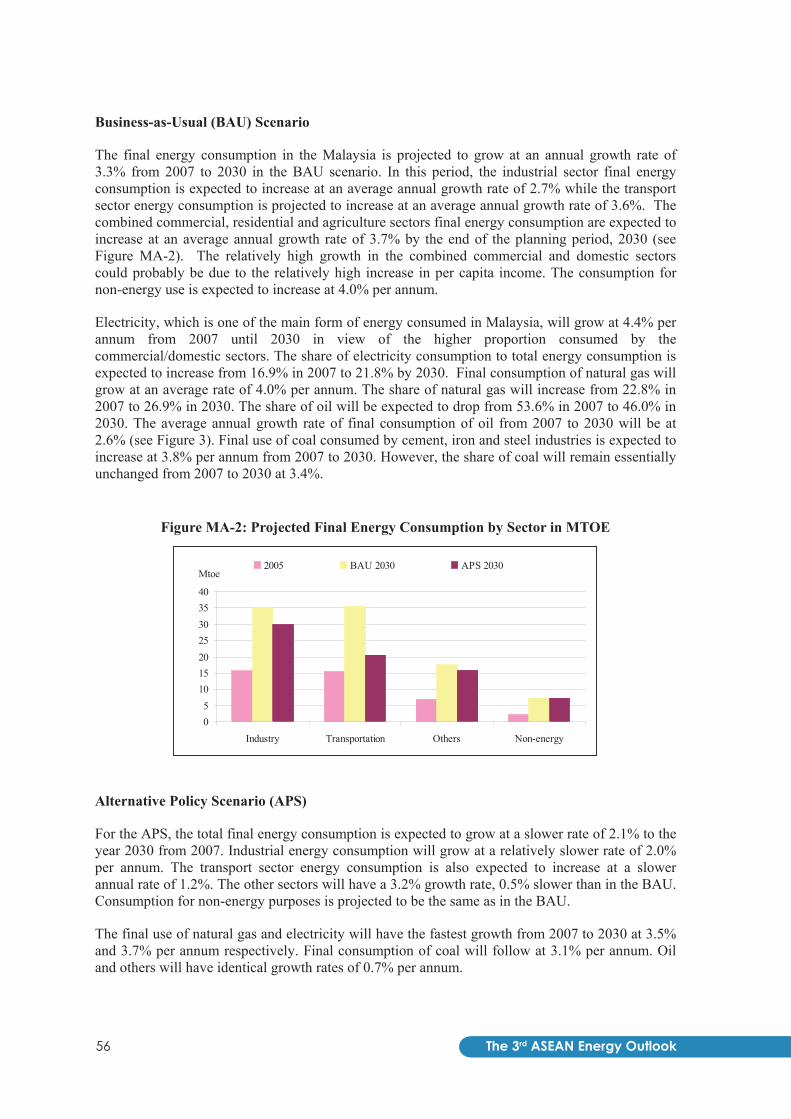
The 3rd ASEAN Energy Outlook56
Business-as-Usual (BAU) Scenario
The final energy consumption in the Malaysia is projected to grow at an annual growth rate of 3.3% from 2007 to 2030 in the BAU scenario. In this period, the industrial sector final energy consumption is expected to increase at an average annual growth rate of 2.7% while the transport sector energy consumption is projected to increase at an average annual growth rate of 3.6%. The combined commercial, residential and agriculture sectors final energy consumption are expected to increase at an average annual growth rate of 3.7% by the end of the planning period, 2030 (see Figure MA-2). The relatively high growth in the combined commercial and domestic sectors could probably be due to the relatively high increase in per capita income. The consumption for non-energy use is expected to increase at 4.0% per annum.
Electricity, which is one of the main form of energy consumed in Malaysia, will grow at 4.4% per annum from 2007 until 2030 in view of the higher proportion consumed by the commercial/domestic sectors. The share of electricity consumption to total energy consumption is expected to increase from 16.9% in 2007 to 21.8% by 2030. Final consumption of natural gas will grow at an average rate of 4.0% per annum. The share of natural gas will increase from 22.8% in 2007 to 26.9% in 2030. The share of oil will be expected to drop from 53.6% in 2007 to 46.0% in 2030. The average annual growth rate of final consumption of oil from 2007 to 2030 will be at 2.6% (see Figure 3). Final use of coal consumed by cement, iron and steel industries is expected to increase at 3.8% per annum from 2007 to 2030. However, the share of coal will remain essentially unchanged from 2007 to 2030 at 3.4%.
Figure MA-2: Projected Final Energy Consumption by Sector in MTOE
05
10152025303540
Industry Transportation Others Non-energy
Mtoe2005 BAU 2030 APS 2030
Alternative Policy Scenario (APS)
For the APS, the total final energy consumption is expected to grow at a slower rate of 2.1% to the year 2030 from 2007. Industrial energy consumption will grow at a relatively slower rate of 2.0% per annum. The transport sector energy consumption is also expected to increase at a slower annual rate of 1.2%. The other sectors will have a 3.2% growth rate, 0.5% slower than in the BAU. Consumption for non-energy purposes is projected to be the same as in the BAU.
The final use of natural gas and electricity will have the fastest growth from 2007 to 2030 at 3.5% and 3.7% per annum respectively. Final consumption of coal will follow at 3.1% per annum. Oil and others will have identical growth rates of 0.7% per annum.

57The 3rd ASEAN Energy Outlook
Figure MA-3: Final Energy Consumption by Energy Type in MTOE
-5
101520253035404550
Coal Oil Natural gas Electricity Others
Mtoe 2005 BAU 2030 APS 2030
3.2 Primary Energy Consumption
Historically, the primary energy consumption of Malaysia increased from 23.3 MTOE in 1990 to 60.8 MTOE in 2007. This is an average increase of 5.8% per annum. Natural gas was the dominant fuel with its share constituted about 42.9% in 2007. It was followed by oil at 39.0% and coal at 14.5%. Hydro and other energy sources had 1.0% and 2.6% shares, respectively.
Business-as-Usual (BAU) Scenario
Malaysia’s primary energy consumption is expected to grow at an annual rate of 3.1% from 2007 to 2030. Coal is expected to increase at an annual growth rate of 4.5% per annum with its share to the total primary energy requirement mix increasing from 14.5% in 2005 to 19.7% by 2030. The increase in primary supply of coal over the next 25 years is largely due to the use of coal as fuel for power generation.
Figure MA-4: Primary Energy Consumption in MTOE
-
10
20
30
40
50
60
Coal Oil Natural gas Nuclear Hydro Others
Mtoe 2005 BAU 2030 APS 2030
Natural gas that is consumed mostly by the thermal power stations, industry and for non-energy purposes will be expected to grow at 2.8% per annum from 2007 to 2030. However, the share of natural gas in primary supply mix will be expected to decrease from 42.9% in 2007 to 41.0% in 2030 due to the increasing share of coal. The primary supply of hydro will be expected to increase at 5.4% per annum from 2005 to 2030.

The 3rd ASEAN Energy Outlook58
Primary energy consumption of oil is expected to increase at an average annual rate of 2.7%, in view of the increasing consumption of the transport sector. The other forms of energy are expected to slightly increase at a rate of 1.2% over the forecast period.
Alternative Policy Scenario
In the APS scenario, the projected primary energy consumption will increase at a lower rate of 2.0% per annum from 2007 to 2030. Coal and natural gas are expected to increase at a slower rate, 2.7% and 2.3%, respectively. Oil is expected to have a lower growth rate of 0.8% per annum, 1.9%, lower than in the BAU scenario. Hydro is expected to grow at 5.6% per annum from 2007 to 2030. Other energy sources will be expected to grow at a faster rate of 3.8% per annum (1.2% in BAU) due to the commissioning of renewable energy power plants and consumption of biofuels for transportation.
3.3 Power Generation
Electricity production increased from 23.0 TWh in 1990 to 101.0 TWh in 2007. This is equivalent to an average annual growth rate of 9.1% over this period. By 2030, electricity production is expected to increase to 241.7 TWh in the BAU scenario with an annual growth rate of 3.9% and 204.4 TWh in the APS scenario posting an annual growth rate of 3.1%.
Table MA-5: Electricity Production to 2030 (BAU and APS) in TWh
By Type 1990 2005 2030 (BAU) 2030 (APS) Coal 2.8 22.1 93.1 60.5 Oil 11.1 2.5 3.5 3.5 Natural gas 5.1 55.0 121.4 103.7 Nuclear - - - 6.8 Hydro 4.0 5.2 23.7 24.5 Others - - - 5.4 Total 23.0 84.8 241.7 204.4
With regard to the fuel inputs to power generation, by 2030, natural gas will remain as the main fuel consumed for power generation for both in the BAU and APS scenarios although coal has an increasing share due to its faster growth rate. Coal share in 2030 for BAU and APS scenario is projected to be at 48.9% and 41.7% respectively. Consumption of oil will remain low and will not increase in view of its price volatility. From 2005 to 2030, natural gas input in power stations will be expected to increase by 1.8% per annum in BAU scenario and 1.2 per annum in the APS scenario.
Table MA-6: Fuel Inputs to Power generation (BAU and APS), MTOE
By Type 1990 2005 2030 (BAU) 2030 (APS) Coal 0.6 5.5 20.5 13.3 Oil 3.0 0.7 0.8 0.8 Natural Gas 1.4 13.2 20.6 17.8 Overall Thermal Efficiency (%) 32.9 35.3 44.7 45.2

59The 3rd ASEAN Energy Outlook
3.4 CO2 Emissions
In BAU scenario, Malaysia’s CO2 emission from energy combustion is projected to increase at 3.0% from 43.7 million tons of Carbon equivalent (Mt-C) in 2007 to 86.0 Mt-C in 2030. This growth rate is slower than the 3.1% of primary energy supply growth during the same period. This is in spite of the assumption that Malaysia will continue to be an oil and gas exporting country. Furthermore, coal and gas will be expected to be the major fuels for power plants. Most of the CO2 are emitted from the power sector.
In the APS scenario, the 2.0% average annual growth rate of final energy demand will have a corresponding 1.5% growth rate in CO2 emission to 61.6 Mt-C in 2030.
Figure MA-5: CO2 Emission to 2030 in the BAU and APS Scenarios
-102030405060708090
100
1990 2005 2007 2020 2030
Mt-C BAU APS
4 FINDINGS AND POLICY IMPLICATIONS
Historically, the primary energy intensity for the period 1990 to 2007 has improved from 513 toe/million 2000USD to 414 toe/million 2000USD. Growth is important for Malaysia to achieve the developmental goals of total poverty eradication, socio-economic equity and transformation into a high income nation. In order to develop sustainably, Malaysia has adopted certain policies. Timely access to appropriate technology and finances are necessary to ensure the overall achievement of the lower primary energy intensity.
For the residential and commercial sectors in Malaysia, the initiative to reduce consumption of energy are through energy efficiency programs, including the usage of energy efficient electrical appliances and retrofitting existing and new buildings that conform with the Green Building Index (GBI) requirements. Some of these initiatives have already been in place, but the sequence of their implementations is still not good enough.
The current trends of growth in the transport sector and the resulting energy consumption patterns make a strong case for undertaking interventions that can help reduce the sector’s dependence on petroleum products. There are several steps that can help reduce energy consumption in transport sector. These include modal shift from private to public transportation, fuel efficiency standard improvement, utilization of biodiesel, utilization of alternative fuel in vehicles and behavioral change towards energy efficiency improvement components.
There is a large mitigation potential in the power sector through advanced technology in power generation, use of renewable energy as an alternative source generation and promoting energy

The 3rd ASEAN Energy Outlook60
efficiency and demand side management. Furthermore, several other criteria such as planning for peak load are important for long term planning perspective; this would also influence the power sector mix of technologies and will need more in-depth analysis and evaluation.
In the manufacturing sector, the overall energy demand has been increasing and it is therefore necessary to further delineate which sub-sectors are most responsible for this trend and thereby identify what the possible actions could be. While some of the industrial sub-sectors have already adopted efficient technologies or processes, there remain subsectors that could improve efficiencies further. The information or knowledge gap is more pronounced in the case of small industries to help industries install energy efficient technologies as well as to ensure their optimum performance through best operating practices.
Two recent policies, the National Policy on Climate Change and the National Green Technology Policy, were formulated to collectively guide the nation towards addressing energy saving and climate change holistically, ensuring a climate-resilient development, developing a low carbon economy and promoting green technology. A key indicator to measure Malaysia’s success in this is the voluntary reduction of emissions intensity per GDP by up to 40% of 2005 levels to 2020. A National Green Technology and Climate Change Council, chaired by the Prime Minister was established in early 2010 to enable strategic implementation of these policies and foster greater coordination in these complementary areas.
61The 3rd ASEAN Energy Outlook
THE PHILIPPINES
1 BACKGROUND
Economic growth is an indispensable factor in determining energy demand and supply. In most cases, energy growth trend is correlated with economic growth. This is especially true for those economies that are driven by energy-intensive sectors. In the Philippines, average annual growth rate of real GDP from 1990 to 2007 reached 3.8%, with the industry10 and services11
Recognizing the importance of energy in economic growth, estimated GDP were incorporated in energy modeling. Real GDP grew by 7.3% in 2010. From 2011 to 2030, it is estimated to rise steadily at 5.0% every year.
, both energy-intensive sectors, as main drivers of growth.
1.1 Socio-Economic Situation
An archipelago comprising of 7,107 islands, the Republic of the Philippines is categorized broadly into three main geographical divisions (Luzon, Visayas, and Mindanao) with Manila as its capital. Its location on the Pacific Ring of Fire and its tropical climate have endowed the country with natural resources and made it one of the richest areas of biodiversity in the world.
The country has a total land area of around 300,000 square kilometers and a population of 88.7 million in 2007. Population is projected to grow at an average annual rate of 1.3% from 2007 to 2030.
1.2 Historical Demand
The average annual growth rate of the country’s primary energy consumption reached 2.3% from 27.8 million tons of oil equivalent (MTOE) in 1990 to 40.9 MTOE in 2007. Coal was a dominant fuel growing at an annual average rate of 10.0% during the same period followed by geothermal and hydro with 3.7% and 2.1%, respectively. The share of oil to the total consumption declined from 41.8% in 1990 to 35.4% in 2007 due to retirement of aging oil-fired power plants bringing the annual average growth rate to 1.3%. Natural gas utilization started in 1994 and its share to the total rose to 7.4% in 2007.
On a sectoral basis, final energy demand of the transportation sector was the highest and grew at 4.0% annually on the average from 1990 to 2007. This is followed by the industrial sector with 1.8% average annual growth rate. The final energy consumption of the other sectors (commercial, residential and agriculture), on the other hand, declined at an annual rate of 0.4% mainly due to the replacement of biomass with oil in the household sector. On a per fuel type, the share of oil in the final energy demand was the highest with 43.7% in 1990 which further increased to 54.1% and 52.7% in 2005 and 2007, respectively. Electricity share also increased from 10.0% in 1990 to 17.2% in 2007.
On power generation, the share of natural gas significantly increased from nil in 1990 to 32.6% in 2007. The share of coal likewise increased from 7.0% in 1990 to 27.0% and 28.2 in 2005 and 2007,
10 Includes manufacturing, construction, mining and quarrying, electricity & water 11 Includes trade, transport, communication & storage, finance, real estate, private and government services
The 3rd ASEAN Energy Outlook62
respectively. The share of oil-based plants to power generation decreased from 45.3% in 1990 to 7.5% in 2007 due to the retirement of large oil thermal power plants in Metro Manila area.
In terms of fuel input to electricity generation, coal became the main fuel with its usage increasing from 0.5 MTOE in 1990 to 4.1 MTOE or 51.0% of the total fossil fuel input in 2007. Meanwhile the use of oil for power generation decreased from 2.1 MTOE in 1990 to 1.0 MTOE in 2007. The use of natural gas for electricity generation started in 1994 and by 2007, the amount of fuel increased to 2.5 MTOE translating to 31.2% of the total fossil fuel input.
2 ENERGY and CO2 EMISSION OUTLOOK
2.1 Primary Energy Supply Business-as-Usual (BAU) Scenario
The average annual growth rate of the country’s total primary energy supply (TPES) will be 4.4% from 40.9 MTOE in 2007 to 111.2 MTOE in 2030. The share of oil to the TPES will remain the biggest although it will slightly decrease from 35.4% in 2007 to 34.4% in 2030 due to the projected annual increase in oil consumption of 4.3% per annum which is slightly lower than the 4.4% growth rate of the TPES. In absolute terms, oil supply will increase from 14.5 MTOE in 2007 to 38.3 MTOE in 2030. On the other hand, the share of coal to the TPES will increase from 15.3% in 2007 to 26.4% by 2030 due to the expected increase in the number of coal-based power plants that will be built to meet electricity demand growth. Primary coal consumption is projected to increase at an annual rate of 6.9% from 6.3 MTOE to 29.4 MTOE in 2030. Natural gas share is also seen to increase from 7.4% (3.0 MTOE) in 2007 to 10.3% (11.4 MTOE) in 2030. The share of renewable energy such as hydropower and geothermal will slightly decrease from 2007 levels of 1.8% and 21.1% to 1.3% and 18.8% by 2030, respectively. The growth rates of these renewable energy sources from 2007 to 2030 will be 2.9% and 3.8%, respectively and are not expected to increase in view of resource limitations. The bulk of the economic potential of these resources would have been exhausted by 2030.
Alternative Policy Scenario (APS)
In the APS, the country’s total primary energy consumption will grow by 4.0% to 102.1 MTOE in 2030 from only 41.0 MTOE in 2007 with the biggest share coming from oil. Similar to the BAU scenario, oil will continue to increase to 31.9 MTOE by 2030 due to the expected increase in the number of oil-consuming vehicles in the transport sector. Its share to the total will remain the highest at 31.3% although decreasing from the 2007 level of 35.4%. Coal share, on the other hand, will also be increasing to reach 22.2% in 2030 and a forecast volume of 22.7 MTOE. Geothermal will register the third largest share of 20.5% and will grow at an average rate of 3.8% from 2007 until 2030. Natural gas will likewise exhibit a significant increase to contribute 9.3 MTOE in 2030 and this will be used mostly for power generation.
The shares of coal, oil and natural gas will be lower in 2030 due to the assumption that the contributions of other energy sources such as nuclear, solar, wind and biomass to the TPES will be higher in this scenario than in the BAU. In 2030, the sum of the shares of these alternative energy sources will be 15.5% (11.7 MTOE) which is significantly higher than the 8.8% (9.8 MTOE) in the BAU Scenario.

63The 3rd ASEAN Energy Outlook
Figure PH-1: Total Primary Energy Supply, 1990-2030
0
20,000
40,000
60,000
80,000
100,000
120,000
Others 9,678 7,631 7,942 8,243 9,758 11,747
Geothermal 4,699 8,782 18,022 18,028 20,904 20,912
Hydro 521 736 1,041 1,041 1,424 1,424
Nuclear 0 0 0 0 0 4,108
Natura l gas 0 3,032 6,722 5,994 11,423 9,260
Oi l 11,611 14,510 26,199 22,983 38,289 31,932
Coal 1,248 6,269 15,772 13,171 29,353 22,686
1990 2007 2020 (BAU) 2020 (APS) 2030 (BAU) 2030 (APS)
2.2 Final Energy Consumption Business-as-Usual (BAU) Scenario
The final energy consumption of the country is projected to grow at a slower rate of 4.0% as compared to the TPES.
On a sectoral basis, transport sector consumption will have the fastest growth at 4.5 per annum from 9.7 MTOE in 2007 to 26.7 MTOE in 2030. This will result in the transport sector further increasing its share from 40.7% to 45.0% during the same period. The industrial sector consumption will increase at an annual rate of 3.8% keeping its share of the TFEC above 20.0% throughout the forecast period. The consumption of the other sectors will increase at slower 3.7% per annum and its share will decline from 35.4% in 2007 to 32.7% in 2030. Consumption for non-energy purposes will have a 1.7% annual growth rate.
Electricity consumption will have the fastest growth rate among the fuels at 5.8% per annum as energy consumption shifts from traditional fuels to electricity in the industrial, commercial and household sectors. It is assumed that the country’s household electrification level will increase considerably within the next two decades and will help drive electricity demand. In view of this, electricity share to the total TFEC will increase from 17.2% in 2007 to 25.6% in 2030. Oil, however, will remain as the most dominant fuel of choice and is expected to grow at 4.5% per annum which, coincidentally is the same as the growth rate of the transportation sector which is heavily dependent on oil. The share of oil in the TFEC will further increase from 52.7% in 2007 to 59.0% in 2030. Final consumption of coal will be at a slower rate of 2.1% per annum. Its share will eventually decrease from 6.5% in 2007 to 4.2% in 2030 due to the expected fuel substitution by some industries from coal to electricity. Consumption of other energy which is mostly biomass will have an even slower growth rate of 0.7% per annum.
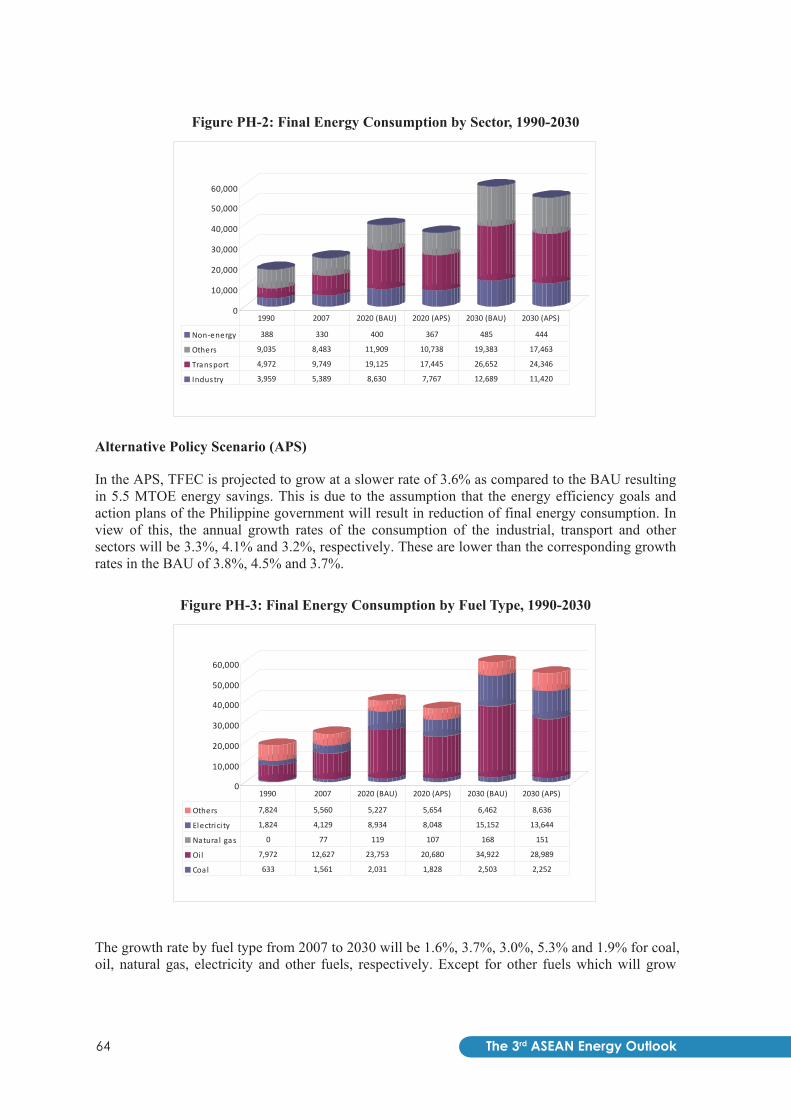
The 3rd ASEAN Energy Outlook64
Figure PH-2: Final Energy Consumption by Sector, 1990-2030
0
10,000
20,000
30,000
40,000
50,000
60,000
Non-energy 388 330 400 367 485 444
Others 9,035 8,483 11,909 10,738 19,383 17,463
Transport 4,972 9,749 19,125 17,445 26,652 24,346
Industry 3,959 5,389 8,630 7,767 12,689 11,420
1990 2007 2020 (BAU) 2020 (APS) 2030 (BAU) 2030 (APS)
Alternative Policy Scenario (APS)
In the APS, TFEC is projected to grow at a slower rate of 3.6% as compared to the BAU resulting in 5.5 MTOE energy savings. This is due to the assumption that the energy efficiency goals and action plans of the Philippine government will result in reduction of final energy consumption. In view of this, the annual growth rates of the consumption of the industrial, transport and other sectors will be 3.3%, 4.1% and 3.2%, respectively. These are lower than the corresponding growth rates in the BAU of 3.8%, 4.5% and 3.7%.
Figure PH-3: Final Energy Consumption by Fuel Type, 1990-2030
0
10,000
20,000
30,000
40,000
50,000
60,000
Others 7,824 5,560 5,227 5,654 6,462 8,636
Electrici ty 1,824 4,129 8,934 8,048 15,152 13,644
Natura l gas 0 77 119 107 168 151
Oi l 7,972 12,627 23,753 20,680 34,922 28,989
Coal 633 1,561 2,031 1,828 2,503 2,252
1990 2007 2020 (BAU) 2020 (APS) 2030 (BAU) 2030 (APS)
The growth rate by fuel type from 2007 to 2030 will be 1.6%, 3.7%, 3.0%, 5.3% and 1.9% for coal, oil, natural gas, electricity and other fuels, respectively. Except for other fuels which will grow
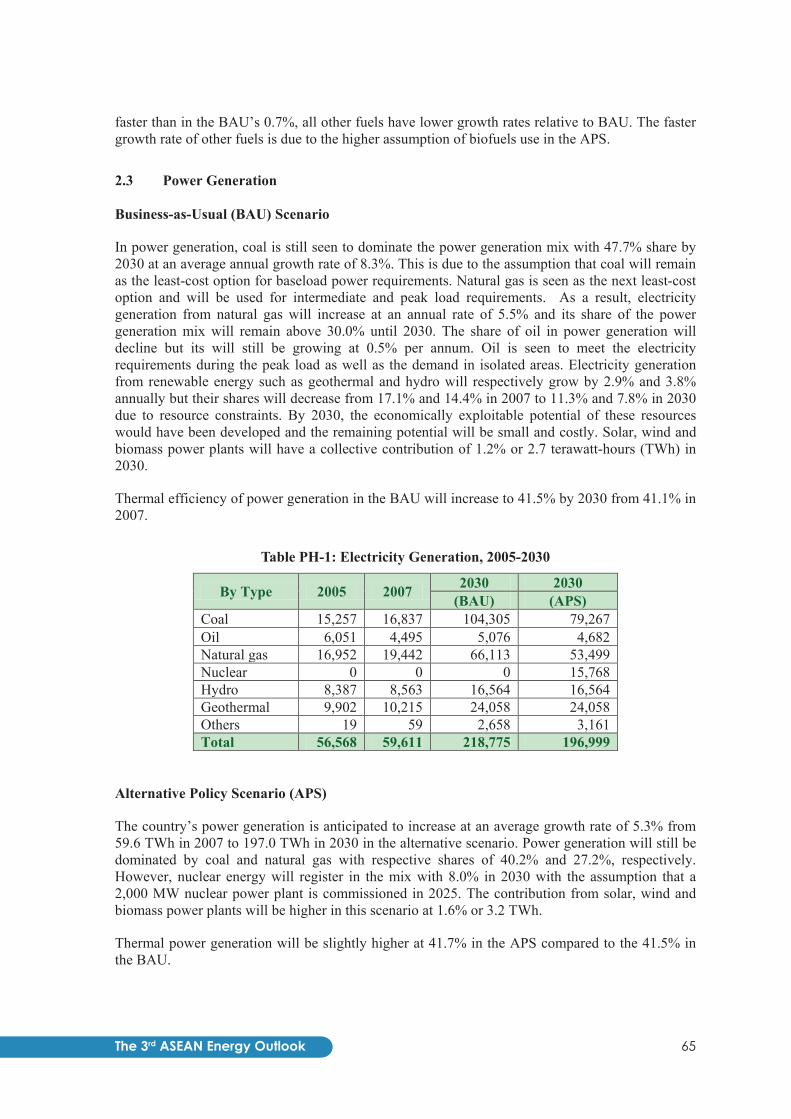
65The 3rd ASEAN Energy Outlook
faster than in the BAU’s 0.7%, all other fuels have lower growth rates relative to BAU. The faster growth rate of other fuels is due to the higher assumption of biofuels use in the APS.
2.3 Power Generation
Business-as-Usual (BAU) Scenario
In power generation, coal is still seen to dominate the power generation mix with 47.7% share by 2030 at an average annual growth rate of 8.3%. This is due to the assumption that coal will remain as the least-cost option for baseload power requirements. Natural gas is seen as the next least-cost option and will be used for intermediate and peak load requirements. As a result, electricity generation from natural gas will increase at an annual rate of 5.5% and its share of the power generation mix will remain above 30.0% until 2030. The share of oil in power generation will decline but its will still be growing at 0.5% per annum. Oil is seen to meet the electricity requirements during the peak load as well as the demand in isolated areas. Electricity generation from renewable energy such as geothermal and hydro will respectively grow by 2.9% and 3.8% annually but their shares will decrease from 17.1% and 14.4% in 2007 to 11.3% and 7.8% in 2030 due to resource constraints. By 2030, the economically exploitable potential of these resources would have been developed and the remaining potential will be small and costly. Solar, wind and biomass power plants will have a collective contribution of 1.2% or 2.7 terawatt-hours (TWh) in 2030.
Thermal efficiency of power generation in the BAU will increase to 41.5% by 2030 from 41.1% in 2007.
Table PH-1: Electricity Generation, 2005-2030
By Type 2005 2007 2030 2030 (BAU) (APS)
Coal 15,257 16,837 104,305 79,267 Oil 6,051 4,495 5,076 4,682 Natural gas 16,952 19,442 66,113 53,499 Nuclear 0 0 0 15,768 Hydro 8,387 8,563 16,564 16,564 Geothermal 9,902 10,215 24,058 24,058 Others 19 59 2,658 3,161 Total 56,568 59,611 218,775 196,999
Alternative Policy Scenario (APS)
The country’s power generation is anticipated to increase at an average growth rate of 5.3% from 59.6 TWh in 2007 to 197.0 TWh in 2030 in the alternative scenario. Power generation will still be dominated by coal and natural gas with respective shares of 40.2% and 27.2%, respectively. However, nuclear energy will register in the mix with 8.0% in 2030 with the assumption that a 2,000 MW nuclear power plant is commissioned in 2025. The contribution from solar, wind and biomass power plants will be higher in this scenario at 1.6% or 3.2 TWh.
Thermal power generation will be slightly higher at 41.7% in the APS compared to the 41.5% in the BAU.

The 3rd ASEAN Energy Outlook66
Table PH-2: Fuel Inputs for Thermal Electricity Generation, 2005-2030
By Type 2005 2007 2030 (BAU) (APS)
Coal 4,079 4,373 24,639 18,724 Oil 1,428 1,056 1,192 1,099 Natural gas 2,491 3,096 10,527 8,519 Thermal Efficiency (%) 41.1 41.1 41.5 41.7
2.4 CO2 Emission
Business-as-Usual (BAU ) Scenario
The computed CO2 emissions will grow at an average annual rate of 5.5% from 17.5 million tons of Carbon equivalent (Mt-C) in 2007 to 62.8 Mt-C in 2030. The growth rate is higher than the 4.4% growth of TPES. This is due to the reason that the share of fossil fuels in the Philippine energy mix will increase from 58.1% in 2007 to 71.1% in 2030. The CO2 emission per unit of primary energy consumption will consequently increase from 0.50 ton of Carbon per ton of oil equivalent (t-C/toe) to 0.56 t-C/toe.
Figure PH-4: CO2 Emission from Fossil Fuel Combustion, 1990-2030
0
10,000
20,000
30,000
40,000
50,000
60,000
70,000
1990 2005 2007 2020 2030
BAU
APS
Alternative Policy Scenario (APS)
In the APS, CO2 emission will grow at an annual average growth rate of 4.4% to 49.9 Mt-C in 2030. This growth rate is also higher than the growth rate of TPES of 4.0% per annum. Although there will be contribution from nuclear energy and increased contribution from renewable energy in this scenario the share of fossil fuels will still increase to 62.6% in 2030 from 58.2% in 2007. However, the CO2 emission per unit of energy consumption will decrease from 0.50 t-C/toe in 2007 to 0.49 t-C/toe in 2030.

67The 3rd ASEAN Energy Outlook
3 FINDINGS AND POLICY IMPLICATIONS 3.1 Findings
The 7.3-percent full-year GDP expansion of the country recorded in 2010 was the highest since 1986. Gross domestic product (GDP) growth in the last quarter of the year also surpassed expectations to reach 7.1% brought about by the global economic recovery. Meanwhile, renewed global demand for Philippine exports allowed industrial growth to accelerate to 8.3% in the final quarter of 2010, up from 3.8% during the same period the previous year. The strong growth came during a period of peaceful political transition for the Philippines in 2010.
The country’s primary energy consumption growth rate reached 2.3% from 1990 to 2007 and forecasted to steadily increase to 4.4% (BAU) and 4.0% (APS) until 2030. The primary consumption of oil will continue to increase up to 38.3 MTOE (BAU) and 31.9 MTOE (APS) in 2030 due to the continuous increasing demand in the transportation sector. Moreover, coal will remain as a dominant fuel with expected growth rates of up to 6.9% and 5.8% in the BAU and APS, respectively. These expected realities will cause strong pressure on the country’s energy security and would hugely contribute to climate change.
3.2 Policy Implications
To address the existing and impending problems in the Philippine energy sector, the government through the Department of Energy will strengthen its role in promoting better quality of life for the Filipino people, ensuring the delivery of secure, sustainable, sufficient, affordable and environment-friendly energy to all economic sectors through the following: (1) advocate immediate passage of energy laws especially the Energy Conservation Bill to address the growing sectoral demand for the country; (2) accelerate the alternative fuels programs such as biofuels, CNG, hydrogen, etc.; and (3) encourage more private sector investments in the development and promotion of indigenous and renewable energy sources through information campaigns and investment forums, as well as through the continuous implementation of the Philippine Energy Contracting Round, a government activity by which blocks of potential energy bearing areas are bid out to interested developers.
At the onset of the current administration, the government embarked on the formulation of the Energy Reform Agenda with the guiding vision of “Energy Access for More.” The said Agenda outlines three (3) major pillars as the overall direction, to wit: (a) Ensure energy security; (b) Achieve optimal energy pricing; and, (c) Develop a sustainable energy system.
Cross-cutting the three pillars are the over-arching strategy of promoting good governance and making use of information technology. Specifically, the strategic directions of the three major pillars are the following:
Ensure energy security
• Accelerate the exploration and development of oil, gas and coal resources; • Intensify development and utilization of renewable energy and environment-friendly
alternative resources/technologies; • Conduct renewable energy (RE) resource assessment to determine potential sites for
capacity addition; • Conduct Open and Competitive Selection Process (OCSP) for awarding RE Service
Contracts; • Convert RE Service Contract (Pre-development to commercial stage).

The 3rd ASEAN Energy Outlook68
• Continuously promote the use of other alternative fuels (i.e compressed natural gas auto liquefied petroleum gas) as well as other emerging energy technologies such as electric vehicles in the transport sector
• Enhance energy efficiency and conservation • Put in place reliable power supply • Nationwide electrification • Improve transmission and distribution systems • Ensure industry compliance to quality standards for products and facilities • Promote oil supply security • Provide climate conducive to investments and fair and orderly competition (to expand
local refining/storage/handling/distribution capability)
Achieve optimal energy pricing: • Develop/ Institute optimal price setting in the energy and power industries • Promote transparency of oil prices
Develop a sustainable energy system:
• Pursue Energy Legislative Agenda • Formulate/update energy plans and programs consistent with national and local
development plans • Strengthen policy researches and studies in aid of executive and legislative action • Interface with Stakeholders for a more participative delivery of energy service • Strengthen Human Resource Development • Strengthen International Cooperation • Expand reach through Information, Education & Communication (IEC) Campaign

69The 3rd ASEAN Energy Outlook
SINGAPORE 1 BACKGROUND
Singapore is a diamond-shaped island with several surrounding smaller islets. It has a relatively flat coastline with a land area of 710 square kilometres in 2009. Situated south of the Straits of Malacca on a major shipping route, the city-state is well-located for the energy industry with regard to international oil refining and trading.
Singapore is the most industrialized and urbanized country in the Southeast Asia region and it has a highly mixed economy. Exports, particularly in electronics and chemicals, and services are main sources of its trade revenue. Manufacturing and financial business services are the twin engines of Singapore’s economy. International aviation bunkers and domestic land transport sector are major consumers of petroleum products. Electricity is mainly consumed in industry, residential, commercial and the public service sectors.
Singapore’s GDP in 2007 was 133.9 billion of constant 2000 US dollars with a per capita GDP of 29,200 USD. The per capita GDP grew at 6.2% per annum from 1990 to 2007. Singapore’s GDP growth rate was 7.0% per annum from 1990 to 2007. The GDP is projected to grow by 3.5% per annum from 2007 to 2030.
2 ENERGY AND CO2 EMISSION OUTLOOK
Singapore depends on oil and natural gas imports for its energy needs. It is vulnerable to a number of supply risks, including under-investment in energy production by energy exporters, and events such as geopolitical conflicts that may disrupt supply. Its economic growth can also be undermined by rising energy prices. Singapore has a national energy policy framework to maintain a balance between policy objectives of economic competitiveness, energy security and environmental sustainability.
Singapore has a national target of reducing energy intensity by 20% by 2020 and by 35% by 2030 from the 2005 level. It also has a target of capping CO2 emissions from combustion of fuel at 63 Mt-CO2 in 2020. Singapore has energy efficiency and conservation programmes in six priority areas, namely, power generation, industry, transport, buildings, the public sector and households.
The industry sector has substantial scope for adopting cost-effective energy efficiency solutions that would contribute to its economic competitiveness. From 2013, the Government will be introducing mandatory energy management requirements for large energy users in the industry sector under an Energy Conservation Act.
2.1 Final Energy Consumption
Singapore’s total final energy consumption, including the energy use in international aviation sector, grew at 5.4% per annum from 6.9 million ton of oil equivalent (MTOE) in 1990 to 17.0 MTOE in 2007. The consumption for non-energy use had the highest growth rate in that period at 7.2% per annum followed by the other sectors (mainly residential and commercial) at 6.2% per annum. The industry sector grew at 4.5% per annum, while the transport sector grew at a lower rate of 3.8% per annum. The oil product was the most consumed product in 1990, which accounted for 82.9% of the total final energy consumption. Its share declined to 81.5% in 2007.
The 3rd ASEAN Energy Outlook70
Since 1st January 2008, registrable goods such as refrigerators, air-conditioners and clothes driers that are supplied in Singapore carry energy labels under the Environmental Protection and Management Act (EPMA)12
The Building and Construction Authority (BCA) of Singapore launched the BCA Green Mark Scheme in January 2005 to promote environmental awareness in the construction and real estate sectors. It is used as the yardstick to rate environmental friendliness of a building. From 15th April 2008, all new buildings and existing buildings undergoing major retrofitting works with gross floor area (GFA) above 2000 square meters must meet the Green Mark Certified standard. The BCA Green Mark Scheme will promote adoption of green building technologies and mitigate use of electricity in the commercial sector.
. Vehicle fuel economy labels are also affixed to vehicles at the point of sale. The mandatory energy labeling scheme will improve energy efficiency and mitigate growth of energy uses in residential, commercial and transport sectors.
Certificates of Entitlement (COEs) give Singaporeans the right to own a vehicle. COEs are integral to the Vehicle Quota System (VQS), a landmark scheme implemented to regulate the growth of vehicle population in Singapore. The VQS determines the exact number of vehicles of various categories allowed on the road. Under the VQS, vehicle growth rate could be pegged at 3% every year with the expansion of roads and highways taken into consideration. The compound annual growth rate of vehicle population from 1990 to 2008 is about 2.8% per annum. The vehicle population growth rate has been set at 1.5% per annum for 3 years, from 2009 to 2011. The energy use in the transport sector will grow at a rate lower than 3% per annum.
The Government launched the Energy Efficiency National Partnership (EENP) program in 2010 to help companies put in place energy management systems and implement projects to improve energy efficiency. The EENP is expected to be a significant program in improving energy efficiency of the industry sector.
Business-as-usual (BAU) Scenario
With the projected growth rates of 3.5% per annum and 0.8% per annum in GDP and population respectively, the total final energy consumption will grow at 3.1% per annum on the average from 2007 to 2030 in the Business-as-usual (BAU) scenario. It will increase from 17.0 MTOE in 2007 to 34.3 MTOE in 2030. The industry sector consumption will grow at 3.4% per annum while the non-energy use will grow at 3.5% per annum. The mandatory energy labeling scheme and BCA Green Mark Scheme will reduce energy uses in the residential and commercial sectors. The VQS will reduce energy use in the transport sector. Thus, the transport sector consumption will grow at 2.7% per annum and the other sectors consumption will grow at 2.5% per annum. The electricity consumption will grow at 2.9% per annum from 2007 to 2030.
Alternative Policy Scenario (APS)
In the APS, the non-energy use will also grow at 3.5% per annum, the same as the BAU’s. Programs of energy labeling scheme, BCA Green Mark Schemes, VGS and EENP are assumed to be more effective in reducing energy demand. Thus, the industry sector consumption will grow at a slower rate of 2.9%% per annum as compared to BAU. The transport sector consumption will grow at 2.7% per annum and the others sector consumption will grow at 2.3% per annum. Electricity consumption will increase at 2.6% per annum from 2007 to 2030.
12 As defined in the Environmental Protection and Management Act of Singapore. http://app.nea.gov.sg/cms/htdocs/article.asp?pid=2837

71The 3rd ASEAN Energy Outlook
The total final energy consumption will grow from 17.0 MTOE in 2007 to 33.7 MTOE in 2030. There will be a saving potential of 0.57 MTOE in the total final energy consumption in 2030. The saving potentials in different sectors are shown in Figure SI-1.
Figure SI-1. Final Energy Consumptions by Sectors in Singapore’s BAU and APS.
2.2 PRIMARY ENERGY SUPPLY
The total primary energy demand of Singapore grew at 5.0% per annum from 13.3 MTOE in 1990 to 30.5 MTOE in 2007. The sole energy source of Singapore in 1990 was oil, which increased from 13.3 MTOE in 1990 to 23.7 MTOE in 2007 at a growth rate of 3.4% per annum. Natural gas started to be consumed in 1992 after the construction of gas pipelines from Malaysia for natural gas fired power plants. In 2007, consumption of natural gas reached 6.8 MTOE. Singapore increased its natural gas supply by importing natural gas from Indonesia. By 2013, Singapore will have an LNG terminal with a capacity of 6 million tons per annum.
Business-as-usual (BAU) Scenario
In BAU scenario, Singapore’s total primary energy consumption will grow at 2.4% per annum to 52.4 MTOE in 2030. Consumption of natural gas will grow at 2.5% per annum in line with the expansion of gas fired power plants.
Alternative Policy Scenario (APS)
In APS, the consumption of natural gas will grow at 1.8% per annum from 2005 to 2030. The saving potential of oil will be 0.35 MTOE and that of natural gas will be 1.68 MTOE as shown in Figure SI-2. The total primary energy consumption will grow at 2.2% per annum and reach 50.4 MTOE in 2030. There will be a saving potential of 2.0 MTOE in the total primary energy consumption as shown in Figure SI-3.

The 3rd ASEAN Energy Outlook72
Figure SI-2. Primary Energy Consumption by Sources in Singapore’s BAU and APS.
Figure SI-3. Total Primary Energy Consumption in Singapore’s BAU and APS.
2.3 Power Generation
Electricity generation grew at 5.8% per annum from 15.7 TWh in 1990 to 41.1 TWh in 2007. Fuel sources for power generation have changed over the recent years. Oil was the dominant source since 1990 but the use of natural gas for power generation has increased rapidly from 18.5% in 2000 to 77.8% in 2007.
The efficiency in power generation has improved over the last decade. With the implementation of a competitive electricity market, that incentivizes efficient power generation, more efficient and less carbon intensive gas fired power plants will be built in Singapore.

73The 3rd ASEAN Energy Outlook
Business-as-usual (BAU) Scenario
In BAU scenario, the total power generation will grow at 2.8% per annum and reach 78 TWh in 2030. Natural gas will be the dominant source. Solar photovoltaic energy is a potential renewable energy of Singapore. It is assumed that 5% of electricity will be generated from solar photovoltaic and 80% of electricity will be generated from natural gas in 2030. The remaining 15% of electricity will be generated from oil.
The average thermal efficiency of oil fired power plants will increase from 39% in 2005 to 41.1% in 2030 and that of gas fired power plants will increase from 41.2% in 2005 to 45.3% in 2030.
Alternative Policy Scenario
In APS, the electricity generation will grow at 2.5% per annum and reach 73 TWh in 2030. The shares among natural gas, oil and solar energy for power generation are assumed to be same as in BAU. The average thermal efficiency of oil fired power plants is also assumed to be same as in BAU. However, the thermal efficiency of gas fired power plants is assumed to be improved to 49.4% in 2030.
2.4 CO2 Emission
Carbon dioxide emissions from consumption of fossil fuels increased from 7.7 million Carbon-tons (Mt-C) in 1990 to 12.1 Mt-C in 2007 with a growth rate of 2.7% per annum. In BAU scenario, the CO2 emissions will increase to 19.7 Mt-C in 2030 at a growth rate of 2.1% per annum. In APS, the CO2 emissions will grow at 1.8% per annum and reach 18.3 Mt-C in 2030. There will be a reduction potential of 1.4 Mt-C in CO2 emissions as shown in Figure SI-4.
Figure SI-4. CO2 Emissions in Singapore’s BAU and APS.

The 3rd ASEAN Energy Outlook74
3 FINDINGS AND POLICY IMPLICATION
3.1 Findings
Singapore has the national target of reducing energy intensity by 20% by 2020 and by 35% by 2030 from the 2005 level. The energy intensity, including the energy use in the international aviation sector, of Singapore was 270 ton of oil equivalent per million US dollar (toe/MUSD) in 2005. The energy intensity will be reduced by 25% in 2020 and by 35% in 2030 from year-2005 level in the BAU scenario. Hence, the goal on energy intensity improvement is achievable with current energy efficiency and conservation (EEC) policies.
The CO2 emissions, calculated by UNFCC’s sectoral approach, will reach 58.7 Mt-CO2 in 2020 in BAU scenario. Thus, the goal on capping CO2 emissions at 63 Mt-CO2 in 2020 is also achievable with current EEC policies.
3.2 Policy Implication
Singapore can enhance current EEC policies to achieve additional energy and CO2 emissions savings as indicated in APS. In the transport sector, the Government can achieve a 70:30 public transport modal split through improvements in public transport system and further restraints on vehicle population and usage. The Government can promote fuel efficient vehicles, such as bio-fuels and electric vehicles. In the building sector, the Government can raise Green Mark performance standards for old buildings. In household and industry sectors, the Government can encourage households to conserve energy, through energy labelling for more electrical appliances.

75The 3rd ASEAN Energy Outlook
THAILAND 1 BACKGROUND Thailand is in the middle of the Southeast Asian mainland, with the Pacific Ocean on the south-east coast and the Indian Ocean on the south-west coast. Its land area is approximately 513,115 square kilometres, with vast plains in the centre, mountainous areas up north and high-lands in the Northeast. It has a small economy with a gross domestic product (GDP) of around US$174 billion (constant 2000) in 2007. The population during the same year is 67 million with an income per capita of US$ 2,600 (constant 2000). Thailand is an energy importer, especially crude oil, due to very limited domestic resources. The indigenous energy resources in Thailand are mainly natural gas, coal (only lignite grade) and biomass. In 2007, proven reserves were 177 million barrels (23 million cubic metres) of oil, 11,198 billion cubic feet (304 billion cubic metres) of natural gas and 1,287 million tons of lignite. In 2007, Thailand’s total primary energy demand was 106 million tons of oil equivalent (MTOE). By fuel type, oil accounted for the largest share at around 41.9%, followed by natural gas (26.7%), coal (13.1%), hydro (0.7%) and others (mostly biomass, 17.6%). Net imports of energy during the same year accounted for about 45% of the total primary energy supply. Due to very limited indigenous oil resources, Thailand imported nearly 68% of its crude oil and most of its bituminous coal supply. Although Thailand produces large quantities of natural gas, about 28% was still imported from its neighbouring country, Myanmar, during the year. In Thailand, natural gas is used as a major energy source for power generation. In 2007, primary natural gas supply was 28.3 MTOE, around 72% was from domestic supply with the rest imported from neighbouring countries. Coal was mainly consumed for power generation and by industry. In addition it was also heavily used in cement and paper production. Thailand has 28.5 gigawatts (GW) of installed power capacity and power generation was about 143 terawatt-hours (TWh) in 2007. The shares of different fuel types in total electricity generation during the year were: thermal (coal, natural gas and oil) at 91.4%, hydro at 5.7% and geothermal, solar, small hydro and biomass making up the remainder. 2 MODELLING ASSUMPTIONS In this report, Thailand’s GDP is assumed to grow at an average rate of 3.9% per year from 2007 to 2030. Population growth is also projected to be reasonably slow at around 0.3% per annum from 2007 to 2030, compared with average growth rate of about 1.2% per annum during the period of 1990 to 2007. For power generation in Thailand, natural gas and coal are projected to be the largest energy sources. Conversely, the shares of fuel-oil and diesel power plants are projected to decrease. Nuclear power and renewable fuels, biomass in particular, are projected to increase their shares in the energy fuel mix in the APS relative to the BAU scenario. Biomass, including biogas and waste is projected to be the most significant renewable energy source in Thailand in the APS. Thailand’s energy saving goals can be achieved through the implementation of energy efficiency programs in all energy consumption sectors. In the industrial sector, improvements in technology

The 3rd ASEAN Energy Outlook76
in the manufacturing processes, along with efficiency labelling on appliances, should help improve energy efficiency. In the residential and commercial (other) sectors, large energy savings are projected driven by programs to promote public awareness of energy efficiency and energy efficiency labelling. In the transportation sector, further development in the Bangkok metro area railway network will also contribute to energy savings. Significant improvements in energy efficiency in passenger vehicles are also expected to be achieved due to new developments in car technologies and introduction of the Eco car program. Government policies will also continue to encourage the increased use of alternative fuels, such as nuclear power and biofuels. Reductions in the growth of CO2 emissions are also expected to be achieved through the increased adoption of more energy efficient and lower emissions technologies. In particular, in the APS, nuclear power and renewable fuels in power generation are expected to help reduce CO2 emissions from electricity generation. Gasohol and bio-diesel as oil alternatives are also expected to help curb CO2 emissions from transportation. 3 OUTLOOK RESULTS
3.1 Total Final Energy Consumption Between 1990 and 2007 Thailand’s final energy consumption grew at a robust rate on average at 5.1% per annum from 30.7 MTOE in 1990 to 72.1 MTOE in 2007. The transportation sector was the largest consumer of final energy at 10.9 MTOE in 1990. By 2007 the share of transport had declined a little from 35.5% in 1990 to 30.5%. Strong growth in the industrial sector of about 5.6% per annum between 1990 and 2007 drove increases from 9.0 MTOE in 1990 to 22.9 MTOE in 2007. By 2003, the industrial sector had overtaken transport as the largest consumer of final energy and by 2007 its share reached 31.8% while that of the transport sector decreased to 30.5%. Oil remained the dominant energy source in final energy consumption since 1990 and in 2007 accounting for 39.5 MTOE or a 54.8% share. Electricity was the second largest commercial energy source in final energy consumption, accounting for 11.3 MTOE or a 15.6% share in 2007.
Business-as-Usual (BAU) Scenario Given moderate economic growth, (at an annual average rate of 3.9%,) and the low growth rate of population, (at an annual average rate of 0.3%), final energy consumption is projected to grow rather high at around 4.0% per annum during the period 2007-2030. The industry sector is projected to remain the largest consumer with the highest shares of consumption at 35% in 2030. By fuel type, oil is expected to remain the largest final energy source throughout the projection period. Growth in oil is projected to decline from 5.2% per annum during 1990-2007 to quite a low growth rate of 3.8% per annum during 2007-2030. In 2030, the shares of electricity, coal and natural gas in final energy consumption are projected to increase to 20.4%, 12.3% and 3.4% respectively from 2007 levels. Alternative Policy Scenario (APS) In the APS, final energy consumption is projected to grow only at 2.8% per annum, from 72.1 MTOE in 2007 to 134.7 MTOE in 2030, which is much slower than the BAU average annual growth rate of 4.0%. Specifically, the majority of energy savings will be achieved through energy

77The 3rd ASEAN Energy Outlook
efficiency improvement programs implemented in the industry and transportation sectors. Improvements will also be achieved in other sectors as shown in Figure TH-1.
Figure TH-1. Final Energy Consumption by Sector in Thailand, BAU and APS
0
10
20
30
40
50
60
70
BAU APS BAU APS BAU APS BAU APS
'07 '30 '07 '30 '07 '30 '07 '30
Industry Transport Others Non-Energy
Mill
ion
Tons
of O
il Eq
uiva
lent
-20.0%
-40.2%
21.3%
3.2 Primary Energy Demand Primary energy demand grew reasonably fast at an average annual rate of 5.3% from 43.9 MTOE in 1990 to 106.1 MTOE in 2007 driven largely by fast economic development during 1990 and 1996. This growth in primary energy was achieved despite the severe economic crisis between 1997 and 1998 and a slow recovery during 1999 and 2007. In 2007, major sources of primary energy were oil, natural gas and coal with shares of 41.9% (44.5 MTOE), 26.7% (28.3 MTOE) and 1.31% (13.9 MTOE) respectively. Natural gas, which is mainly consumed in the power generation sector, became an important source of energy with its share in primary energy demand increasing significantly from 11.6% in 1990 to 26.7% in 2007. The share of hydropower remained low at less than 1% from 1990 through 2007. Business-as-Usual (BAU) Scenario In the BAU scenario, primary energy demand is projected to grow moderately at about 3.8% per annum from 2007 to 2030, reaching about 247.7 MTOE in 2030. The highest average annual growth rate of 4.9% is expected in coal with consumption expected to reach 41.8 MTOE in 2030. Given very strong average annual growth in natural gas of 11.6% between 1990 and 2007, growth is expected to slow to only 1.1% per year between 2007 and 2030. It is recognised that future strong growth in natural gas consumption in power generation may be limited and it could be replaced by nuclear and other alternative fuels, according to the government plan.

The 3rd ASEAN Energy Outlook78
Alternative Policy Scenario (APS) In the APS, growth in primary energy demand is projected to be slower than in the BAU scenario at only 2.7% per annum between 2007 and 2030 (compared with 3.8% in BAU) to reach 194.4 MTOE in 2030. Primary energy demand is expected to be about 21.5% lower in the APS than in the BAU scenario in 2030 – an energy saving of about 53.3 MTOE. Natural gas is projected to decrease from 28.3 MTOE in 2007 to 25.4 MTOE in 2030, at an annual average rate of 0.5%. Oil is still projected to increase from 44.5 MTOE in 2007 to 71.0 MTOE in 2030, at an annual average rate of 2.1%. These reductions in growth, relative to the BAU scenario, are mainly achieved through energy efficiency and conservation measures on the demand side. The differences in the projections between the two scenarios are shown in Figure TH-2.
Figure TH-2. Primary Energy Demand by Source in Thailand, BAU and APS
0
20
40
60
80
100
120
BAU APS BAU APS BAU APS BAU APS
'07 '30 '07 '30 '07 '30 '07 '30
Coal Oil Gas Others
Mill
ion
Tons
of O
il Eq
uiva
lent
-25.1%
-24.1%
-30.0%
3.3 Power Generation Electricity production increased from 44.2 TWh in 1990 to 143.1 TWh in 2007, an average growth rate of 7.2% per annum. Natural gas, coal, oil and hydro were the sources of power generation in Thailand during 1990-2007. Natural gas has been the main fuel in the power fuel mix. Its share increased from 40.2% in 1990 to 67.5% in 2007 or from 17.8 TWh to 96.6 TWh, equivalent to 10.5% growth per annum from 1990 to 2007. In 2007 coal, oil and hydro electricity generation amounted to 30.4 TWh, 3.8 TWh and 8.1 TWh, respectively and shared 21.3%, 2.7% and 5.7%, respectively. Business-as-Usual (BAU) Scenario In BAU scenario, during 2007-2030 power generation is projected to increase by 4.3% per annum on average from 143.1 TWh in 2007 to 379.8 TWh in 2030. Biomass and nuclear are expected to increase their shares significantly even though natural gas and coal shares will remain high. It will be an improvement in the power generation fuel mix, rather than to be bound with natural gas alone like in 2007.

79The 3rd ASEAN Energy Outlook
Alternative Policy Scenario (APS) In the APS, during 2007-2030 electricity production is likely to grow 3.6% per annum, reaching 321.3 TWh in 2030. It means APS electricity generation will be lower by around 15.4% or 58.5 TWh, compared to BAU. Fuel mix in APS will take a slightly different shape from BAU. It will contain more biomass and nuclear energy as in the BAU, but less in fossil fuels. These two cases might make the biomass reach its maximum capacity in that period of time.
Table TH-1: Electricity Production 2030, TWh
BAU APSThermal 130.8 229.6 171.0 Hydro 8.1 3.4 3.4 Geothermal - - - Nuclear - 43.8 43.8 Others 4.2 103.0 103.0 Total 143.1 379.8 321.3
2030By Type 2007
Table TH-2: Fuel Inputs in Power Generation, MTOE
BAU APSCoal 6.9 20.1 14.0 Oil 0.9 0.2 0.1 Natural Gas 19.4 22.5 14.6 Nuclear - 11.4 11.4 Total 27.2 54.2 40.1
By Type 2007 2030
3.4 Projected Energy Savings The difference between primary energy demand in the BAU scenario and the APS in 2030 is 53.3 MTOE (Figure TH-3). This represents the potential energy savings that could be achieved if energy efficiency and conservation goals and action plans were implemented. This energy saving is equivalent to about 45.6% of Thailand’s primary energy demand in 2007. Oil will contribute the most at about 23.3 MTOE in energy savings, while natural gas, as the second biggest, will contribute about 10.9 MTOE. In final energy consumption, the savings in the APS, relative to the BAU scenario in 2030 could reach 41.3 MTOE. A reduction in consumption by the transportation sector of 20.1 MTOE is projected at 2030. Energy savings by 2030 in other sectors are: industrial sector – 12.3 MTOE and other sector around 8.9 MTOE.

The 3rd ASEAN Energy Outlook80
Figure TH-3. Total Primary Energy Demand in Thailand, BAU and APS
0
50
100
150
200
250
300
BAU APS
1990 2007 2030
Mill
ion
Tons
of O
il Eq
uiva
lent
53.3 Mtoe, -21.5%
3.5 CO2 Emissions from Energy Consumption CO2 emissions from energy consumption are projected to increase by 3.5% per year on average from 51.0 Mt C in 2007 to 113.1 Mt C in 2030 in the BAU scenario. Thailand plans to promote the use of primary energy sources which are less carbon intensive, for example, nuclear and renewable fuels. In the APS, the average annual growth in CO2 emissions from 2007 to 2030 is projected to be about 1.9%, and emissions are projected to rise to 78.2 Mt C in 2030. The reduction in CO2 emissions between the APS and BAU scenario highlights the range of benefits that can be achieved through energy efficiency improvements and savings via action plans (Figure TH-4).
Figure TH-4. CO2 Emissions from Energy Consumption in Thailand, BAU and APS
0
20
40
60
80
100
120
BAU APS
1990 2007 2030
Mill
ion
Tons
of C
arbo
n
-35.0 Mt-C, -30.9%
81The 3rd ASEAN Energy Outlook
4 IMPLICATIONS AND POLICY RECOMMENDATIONS Due to the economic boom during the period before the crisis in 1997, Thailand’s primary energy intensity on average during 1990-2007 was rather high, although the crisis in 1997 held it back slightly. However, it has shown a significant decrease since the economy recovered from the 1997 crisis. Furthermore, with Thailand’s effort in energy efficiency programs in a wide range of areas (including industry, transportation and residential sectors), and the dramatic soar in world oil prices, the intensity is expected to further improve as time goes by. Thailand has a target to save energy in the transportation sector by reducing the consumption of gasoline and diesel by at least 4-5% a year in the near future. This target now also applies to the industry and residential sectors. These sectors will focus on decreasing consumption in electric power and fuel oil mainly. Improving energy efficiency will also help Thailand (which is an oil importer), to address the challenges faced by rising world oil prices. Thailand is committed to reducing the intensity of energy consumption, especially in oil, and is also looking for more sustainable energy sources and environmentally friendly fuels. It is recognised that the more Thailand saves energy, the less sensitive it will be to fluctuations in world energy prices and supply. It is wise and rational to try to be more self-sufficient and more sustainable. Furthermore, Thailand realises that cooperation on energy savings is important and that all countries should respond. Although Thailand has a 20-year plan, it is important that practical ways for achieving long-term action plans and strategic goals are implemented and to drive conservation policies in the future. Furthermore, policy evaluations should also be undertaken to identify potential areas for improvement. Cooperation among Thai government energy agencies also needs to be improved. Lastly, enhancements to Thailand’s energy end-use database should be made. This is useful for improving energy projections and also policy design and evaluation.

The 3rd ASEAN Energy Outlook82

83The 3rd ASEAN Energy Outlook
VIET NAM 1 Background Among ten ASEAN countries, the Socialist Republic of Viet Nam (hereinafter called as “Vietnam”), spreading over 300,000 square kilometers and having over 86 million people, is the third largest country after Indonesia and the Philippines in terms of population. However, its per capita GDP was just US$1000 in 2009, being positioned among the late developing group of countries in the ASEAN. Its per capita energy consumption is also low at 0.7 tons of oil equivalent (TOE). On the supply side, Vietnam yields various kinds of domestic energy such as coal, oil, natural gas, hydro and renewable energies, and has maintained a self-sufficient energy structure to date. Remarkable economic development has been achieved in Vietnam through adoption of the "Doi Moi (the Reform)" policy since 1986, implementing several socio-economic development plans." In the energy field, Vietnam was also successful in domestic energy resource development by effectively introducing foreign capitals. Thus, the country changed from an energy importing to an exporting country after 1990. According to the “Statistical Yearbook 2009” by the General Statistics Office (GSO), the real term economic growth rate for the period of 1990~2007 was 7.6%/year; real gross domestic product (GDP) increased from VND 132 Trillion to VND 461.3 Trillion. Vietnam experienced a very high economic growth rate of 8.3%/year until the “Asian Currency Crisis” in 1997. Economic growth rate temporally slowed down to 5.8% in 1998 and 4.8% in 1999. After then, its economic growth gradually recovered to a high level and recorded 8.5% in 2007. . 2 Current Energy Trend Situation 2.1 Primary energy supply The domestic energy production in 2007 was 49.4 million tons of oil equivalent (MTOE), in which coal was 24.33 MTOE, crude oil 16.54 MTOE, the natural gas 5.94 MTOE and hydro power 2.57 MTOE. The average growth rate of energy production for the period of 1990-2007 was 13.4%, in which coal growth rate was the highest or 14.1% followed by oil and gas production at 13.2%. In the energy production mix of 2007, coal shared 49.3%, oil 41.0%, natural gas 12.0% and hydropower 5.2%. Total primary energy supply (TPES) increased to 55.6 MTOE in 2007 from 24.3 MTOE in 1990; the average annual growth rate was 5.0%. 2.2 Energy export Crude oil export increased greatly in 2004. Vietnam exported 15.3 MTOE of crude oil and 17.8 MTOE of coal in 2007. Most of the petroleum products were imported for domestic supply, as no oil refinery exists in the country during the year. A total of 14.2 MTOE of petroleum products were imported in 2007.

The 3rd ASEAN Energy Outlook84
2.3 Final Energy Consumption In 2007 the total final energy consumption (TFEC) was about 48.8 MTOE and the annual average growth rate for the period 1990-2007 was 4.7%. During the same period, electricity consumption recorded a 14.4% annual growth, while that of oil and gas consumption was 10.9% and that of coal consumption was 9.5%. Compared to the GDP annual growth rate (7.65%), the GDP elasticity was 1.9 for electricity, 1.4 for oil and gas and 1.24 for coal, which may be deemed to be very high. In the energy consumption mix by sectors, the industry sector shared 21.2%, transport sector 16.6%, and other sectors 60.6%. In the energy consumption mix by energy sources, petroleum products shared 26.8%, coal 12.7%, electricity 10.8% and natural gas 1.1%. Biomass formed the remaining 48.6% of the energy consumption mix. 3 Energy Demand and CO2 Emission outlook 3.1 The Final Energy Demand Forecast Business-as-Usual (BAU) Scenario The final energy demand in Vietnam is predicted to grow at an average annual rate of 5.1% from 2007 to 2030. The energy demand of the industrial sector will grow the fastest with an average annual growth rate of 8.5%, followed by transport sector at 7.6%. The other sectors, which consist of commercial, residential and agriculture, will have a combined 1.4% annual growth rate.
Figure VN-1: Final Energy Demand by Sector, 1990-2030
-
20
40
60
80
100
120
140
160
MTOE
Non-energy 0.03 0.77 1.14 1.14 1.01 1.01
Others 19.36 29.57 32.43 30.51 40.35 37.35
Transport 1.41 8.11 18.95 18.95 43.29 43.29
Industry 1.72 10.35 31.32 25.96 67.85 60.39
1990 2007 2020 (BAU) 2020 (APS) 2030 (BAU) 2030 (APS)
Among the types of energy, electricity will grow the fastest at 9.1% per annum from 2007 to 2030, followed by coal at 7.4%. The electricity share to the total energy demand shall increase from 10.8% in 2007 to 25.4% in 2030. Oil demand will grow at an annual rate of 7.1% and its share to the total demand will further increase from 26.8% in 2007 to 41.9% in 2030. Annual growth rate of natural gas demand would be 4.9% in period 2007-2030. Meanwhile consumption of combustible renewable energy will decrease at 1.6% per year due to urbanization.
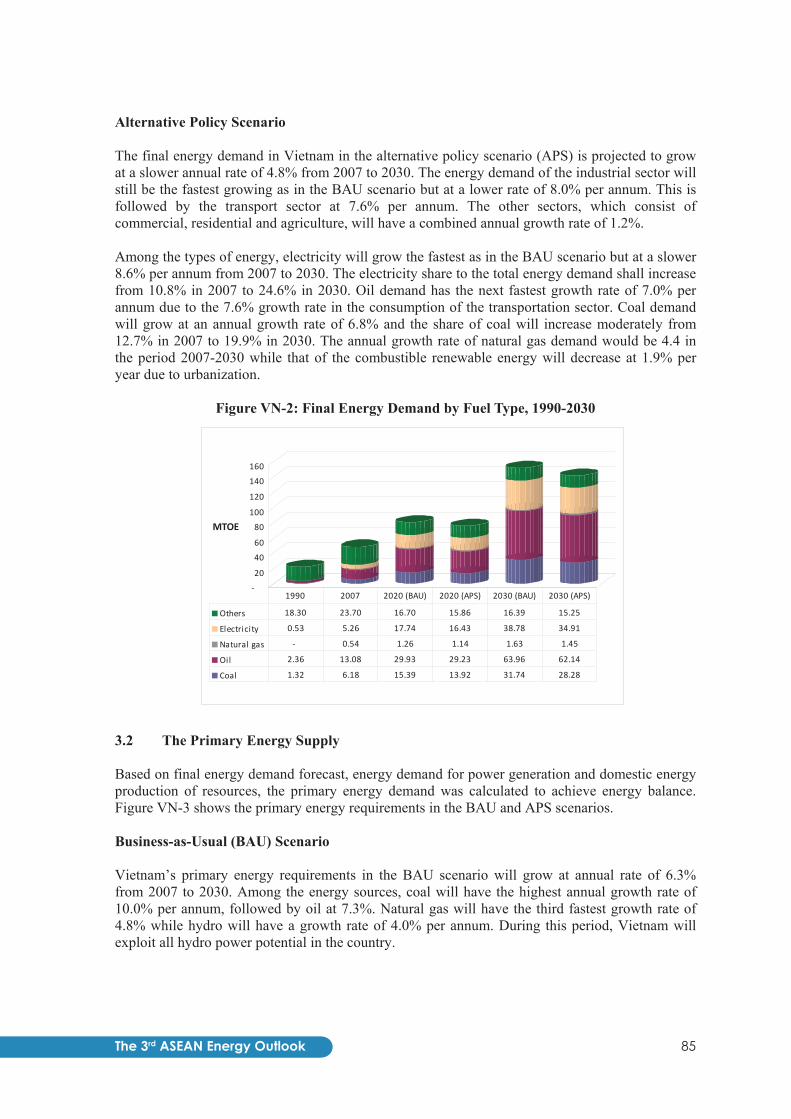
85The 3rd ASEAN Energy Outlook
Alternative Policy Scenario The final energy demand in Vietnam in the alternative policy scenario (APS) is projected to grow at a slower annual rate of 4.8% from 2007 to 2030. The energy demand of the industrial sector will still be the fastest growing as in the BAU scenario but at a lower rate of 8.0% per annum. This is followed by the transport sector at 7.6% per annum. The other sectors, which consist of commercial, residential and agriculture, will have a combined annual growth rate of 1.2%. Among the types of energy, electricity will grow the fastest as in the BAU scenario but at a slower 8.6% per annum from 2007 to 2030. The electricity share to the total energy demand shall increase from 10.8% in 2007 to 24.6% in 2030. Oil demand has the next fastest growth rate of 7.0% per annum due to the 7.6% growth rate in the consumption of the transportation sector. Coal demand will grow at an annual growth rate of 6.8% and the share of coal will increase moderately from 12.7% in 2007 to 19.9% in 2030. The annual growth rate of natural gas demand would be 4.4 in the period 2007-2030 while that of the combustible renewable energy will decrease at 1.9% per year due to urbanization.
Figure VN-2: Final Energy Demand by Fuel Type, 1990-2030
-
20
40
60
80
100
120
140
160
MTOE
Others 18.30 23.70 16.70 15.86 16.39 15.25
Electricity 0.53 5.26 17.74 16.43 38.78 34.91
Natural gas - 0.54 1.26 1.14 1.63 1.45
Oil 2.36 13.08 29.93 29.23 63.96 62.14
Coal 1.32 6.18 15.39 13.92 31.74 28.28
1990 2007 2020 (BAU) 2020 (APS) 2030 (BAU) 2030 (APS)
3.2 The Primary Energy Supply Based on final energy demand forecast, energy demand for power generation and domestic energy production of resources, the primary energy demand was calculated to achieve energy balance. Figure VN-3 shows the primary energy requirements in the BAU and APS scenarios. Business-as-Usual (BAU) Scenario Vietnam’s primary energy requirements in the BAU scenario will grow at annual rate of 6.3% from 2007 to 2030. Among the energy sources, coal will have the highest annual growth rate of 10.0% per annum, followed by oil at 7.3%. Natural gas will have the third fastest growth rate of 4.8% while hydro will have a growth rate of 4.0% per annum. During this period, Vietnam will exploit all hydro power potential in the country.

The 3rd ASEAN Energy Outlook86
Figure VN-3: Primary Energy Requirements, 1990-2030
-
50
100
150
200
250
MTOE
Others 18.90 24.54 19.52 18.57 21.14 19.83
Hydro 0.46 2.57 4.90 4.52 6.37 5.69
Nuclear - - 1.09 1.01 12.36 11.05
Natural gas 0.00 5.46 11.93 10.98 16.13 14.42
Oil 2.74 13.24 32.56 31.86 66.59 64.77
Coal 2.21 9.82 43.77 40.13 103.18 92.17
1990 2007 2020 (BAU) 2020 (APS) 2030 (BAU) 2030 (APS)
Coal share to the total primary energy supply shall increase from 17.7% in 2007 to 45.7% in 2030. Oil shall increase its share to the total primary energy supply from 23.8% in 2007 to 29.5% in 2030. The share of natural gas to the total primary energy supply increase from 9.8% in 2007 to 10.5% in2020 but will decrease to 7.1% in 2030. Other energy, which is mostly biomass will have growth rate of -0.6% per annum. Nuclear energy will start to figure in the primary energy mix in 2020 at 1.0% with the installation the nuclear power plant with a capacity of 1,000 MW. By 2030, nuclear energy will have a 5.5% share of the primary energy mix. Alternative Policy Scenario In the APS, Vietnam’s primary energy requirements will increase at a slower rate of 5.9% compared to the BAU scenario in view of the improved energy efficiency in the industrial, household and building sectors. In view of this, the shares of energy sources used for generation of electricity will be lower than in the BAU scenario. On the other hand, the share of oil will be higher than in the BAU (31.2% from BAU’s 29.5%) in view of the absence of energy efficiency improvement assumptions for the transportation sector. 3.3 Power Generation Electricity production increased from 8.7 TWh in 1990 to 69.5 TWh in 2007. This is equivalent to an average annual growth rate of 12.5% over the same period. In the future, electricity production is projected to increase to 480.9 TWh in the BAU scenario or to 430 TWh in the APS. In both scenarios, coal will be the major source of electricity which will attain 60.5% of the power generation mix by 2030. In 2007, coal formed only 21.4% of the mix with natural gas and hydro having 32.1% and 43.0% shares. These shares will fall to 13.7% and 15.4%, respectively due to the increased share of coal and the introduction of nuclear energy which will have a 9.9% share of the mix in 2030.

87The 3rd ASEAN Energy Outlook
Figure VN-4: Electricity production to 2030 by types of plant
-
100
200
300
400
500
Terr
awat
t-ho
urs
Others - - 1.51 1.40 2.79 2.50
Nuclear - - 4.20 3.88 47.44 42.42
Natural gas - 22.30 48.39 44.69 65.82 58.86
Oil 1.31 2.47 - - - -
Coal 2.00 14.84 115.54 106.69 290.80 260.04
1990 2007 2020 (BAU) 2020 (APS) 2030 (BAU) 2030 (APS)
3.4 CO2 Emission CO2 emission will increase along with increase of energy consumption as shown in Figure VN-5. It is projected to increase at average annual growth rates of 8.8% and 8.5% in the BAU and APS, respectively. The growth rates are faster than energy demand due to the reason that most of the future incremental energy demand needs will be supplied by fossil fuels such as coal, oil and natural gas.
Figure VN-5: CO2 emission in the BAU and EEC case to 2030
0
20
40
60
80
100
120
140
160
180
200
1990 2005 2007 2020 2030
Mill
ion
tons
of C
arbo
n Eq
uiva
lent
BAU
APS
4 Findings and Important Issues As explained above, it is anticipated that in the coming 20 years there will be an unprecedented structural change such as rapid increase of energy demand and change of the energy structure from exporter to net importer. Assuming these drastic changes in the energy circumstance, fundamental measures to be studied toward stable energy supply may be summarized as follows.

The 3rd ASEAN Energy Outlook88
1) Rapid Increase of Energy Demand
a) Energy Demand • Accurate grasp of the actual energy consumption and the demand trend • Promotion of energy efficiency and conservation • Establishment of proper environment policy on energy consumption
b) Supply Side
• Enhancement of domestic energy resource development • Securing stable supply of energy import: diversification of energy types and
geographical distribution of energy sources • Construction of domestic energy infrastructure and transportation system to
efficiently meet larger scale demand • Strict environment protection at energy related facilities
2) Increase of Energy Import
a) Establishment of a desirable and realistic energy import plan b) Development of energy import channels c) Construction and upgrading of energy import infrastructure d) Reinforcement of energy security measures
3) Fluctuation of Energy Price
a) Internationalization of the domestic energy prices in line with increase of import dependence
b) Examination of energy taxation and/or proper energy price policy with relief measures for socially weak people.
4) Efficient Energy Market to Support Larger Demand (Market Design)
a) Equitization of energy entities b) Liberalization of the energy market and proper rules for participation of private firms c) Proper rules for price setting in the market
5) Fund to implement Energy Policies
a) Taxation on energy such as petroleum products b) Establishment of a system to enhance capital inflow via international scheme such as
CDM c) Efficient utilization of ODA/PPP in the sub-commercial areas
89The 3rd ASEAN Energy Outlook
ANNEX I – ENERGY DEMAND EQUATIONS

The 3rd ASEAN Energy Outlook90

91The 3rd ASEAN Energy Outlook
EXPLANATION OF THE NAMES OF VARIABLES
In his Annex, the names of variables referring to consumption of a certain kind of energy by a certain sector can be derived from the “Sectors and Energy” table below. For example, the consumption of the Industrial sector (IN) of Hard Coal (HC) is INHC. Consumption of Electricity (EL) is INEL and Total Petroleum (PP) is INPP, etc. The key variables shown in the “Key Variables” table below can also be combined with the sectors listed in the “Sectors and Energy” table. The sectoral gross domestic product (GDP) of Industry (IN) is INGDP, sectoral gross domestic product of Iron and Steel industry (IS) is ISGDP, etc. The GDP of the Commercial and Public Services sector (CS) is CSGDP.
Sectors and Energy Sector Abbreviation Energy Abbreviation Total Final Consumption FC Hard Coal HC Industry IN Lignite/Brown Coal/Sub-
Bituminous Coal LB Iron and Steel IS Combustible Renewables
and Waste CB Chemical and Petrochemical CX Charcoal CH Non-Ferrous Metals NF Natural Gas NG Non-Metallic Minerals NM Crude Oil CR Transport Equipment TE Total Petroleum PP Machinery MC Refinery Gas RG
Mining and Quarrying MQ Liquefied Petroleum
Gases(LPG) LP Food and Tobacco FT Motor Gasoline MG Paper, Pulp and Printing PP Aviation Gasoline AV Wood and Wood Products WP Gasoline type jet Fuel GJ Construction CT Kerosene type Jet Fuel KJ Textile and Leather TL Other Kerosene OK Total Transport Sector TS Gas/Diesel Oil GD International Civil Aviation IC Heavy Fuel Oil HF Domestic Air Transport DA Naphtha NP Road RD Lubricants LU Rail RA Bitumen BT Pipeline Transport PT Petroleum PC Internal Navigation IV Other Petroleum Products OP Non-specified Transport N4 Nuclear NU Total Other Sectors OS Hydro HD Agriculture AG Geothermal GT Commercial and Public Services CS
Electricity EL
Residential RE Heat HT Non-specified Other N5 Total Energy TT
The 3rd ASEAN Energy Outlook92
Key Variables Variable Abbreviation Variable Abbreviation Gross Domestic Product GDP Population POP GDP of Industry INDGP Urban Population POPU GDP per Capita GDPC Rural Population POPR GDP Deflator PGDP Number of Households NHOU Private Consumption CP Price of Oil of Crude Oil POIL Exchange Rate EXR Domestic Price of Oil DPOIL Consumer Price Index CPI Real Price of Crude Oil RPOIL

93The 3rd ASEAN Energy Outlook
BRUNEI
Industry
INEL = 0.557 + .0029587*GDP + 0.24286*INEL(-1) INGD = same growth as electricity INOK = same growth as electricity INHF = same growth as electricity Transport (TS)
ICKJ = -20.9971 + 0.16872*Population + 0.48215*ICKJ(-1) RDMG = 7.9123 + .0022291* GDP -0.080347* RPOIL + 0 .88306*RDMG(-1) RDGD = same growth as gasoline
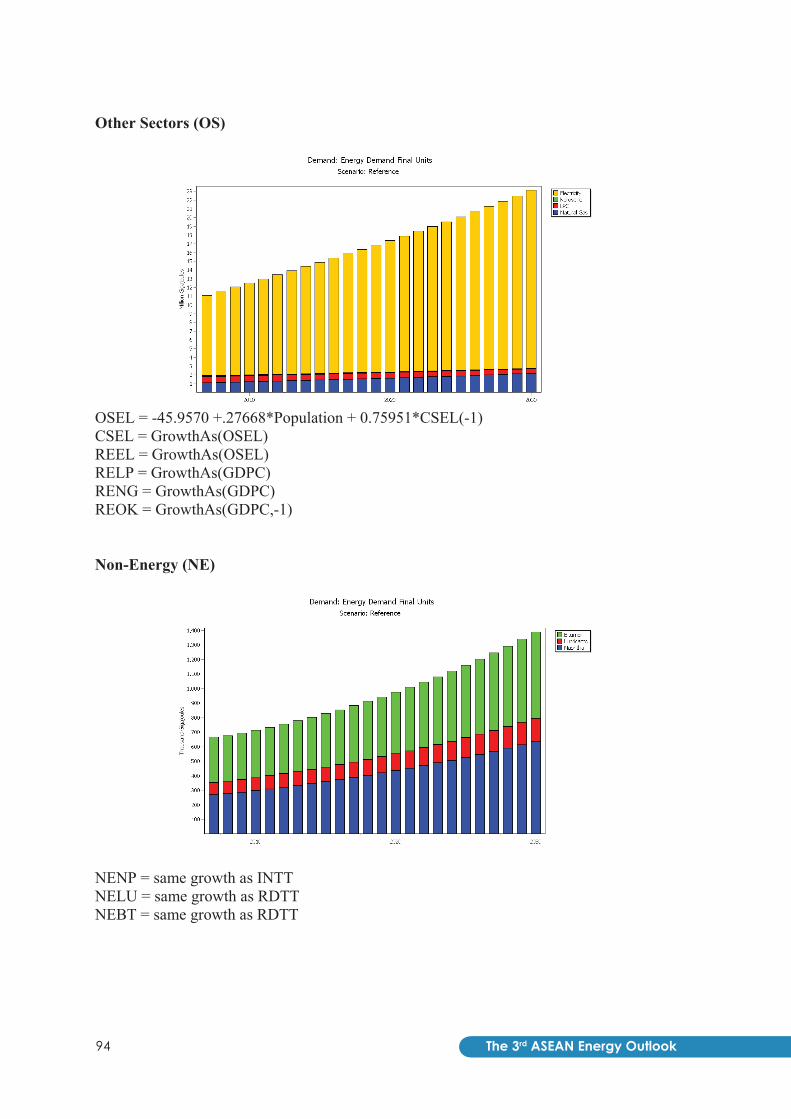
The 3rd ASEAN Energy Outlook94
Other Sectors (OS)
OSEL = -45.9570 +.27668*Population + 0.75951*CSEL(-1) CSEL = GrowthAs(OSEL) REEL = GrowthAs(OSEL) RELP = GrowthAs(GDPC) RENG = GrowthAs(GDPC) REOK = GrowthAs(GDPC,-1)
Non-Energy (NE)
NENP = same growth as INTT NELU = same growth as RDTT NEBT = same growth as RDTT

95The 3rd ASEAN Energy Outlook
CAMBODIA
Industry
INHC = Interp(2008,300, 2010,400, 2020,700, 2030,1000) INEL = Exp(-8.37033 + 0.64294*Ln(INGDP) + 0.53126*Ln(INEL(-1)) INPP = 11.5064 + 0.6738E-5* INGDP- 0.6294E-4* RPOIL + 0.056591*INPP INGD = 0.5186*INPP INHF = INPP – INGD
Transport
ICKJ = 0.50650 + 0.3906E-5* CSGDP - 0.4878E-4* RPOIL RDTT = 136.9741 + 0.9739E-5* GDP - 0.5257E-4* RPOIL + 0.0041563*RDTT(-1) RDMG = 0.4234*RDTT RDGD = RDTT - RDMG IVHF = growth is half the growth rate of road transport consumption

The 3rd ASEAN Energy Outlook96
Other Sectors
CSEL = Interp(2010,101.2, 2015,249.8, 2020,564.8, 2030,1230.7) RELP = -313.9714 + 0.22049* POPU - 0.3509E-4* RPOIL REOK = -139.0407 + 0.014512* POPR + 0.65092*REOK(-1) REGD = 19.6210 + .0012358* POPR - 0.8762E-5*RPOIL REEL = Exp(-10.21997 + 1.8859*Ln(GDPC) + RECB = same growth as Rural Population RECH = same growth as Urban Population AGMG = same growth as Agricultural GDP AGGD = same growth as AGGDP
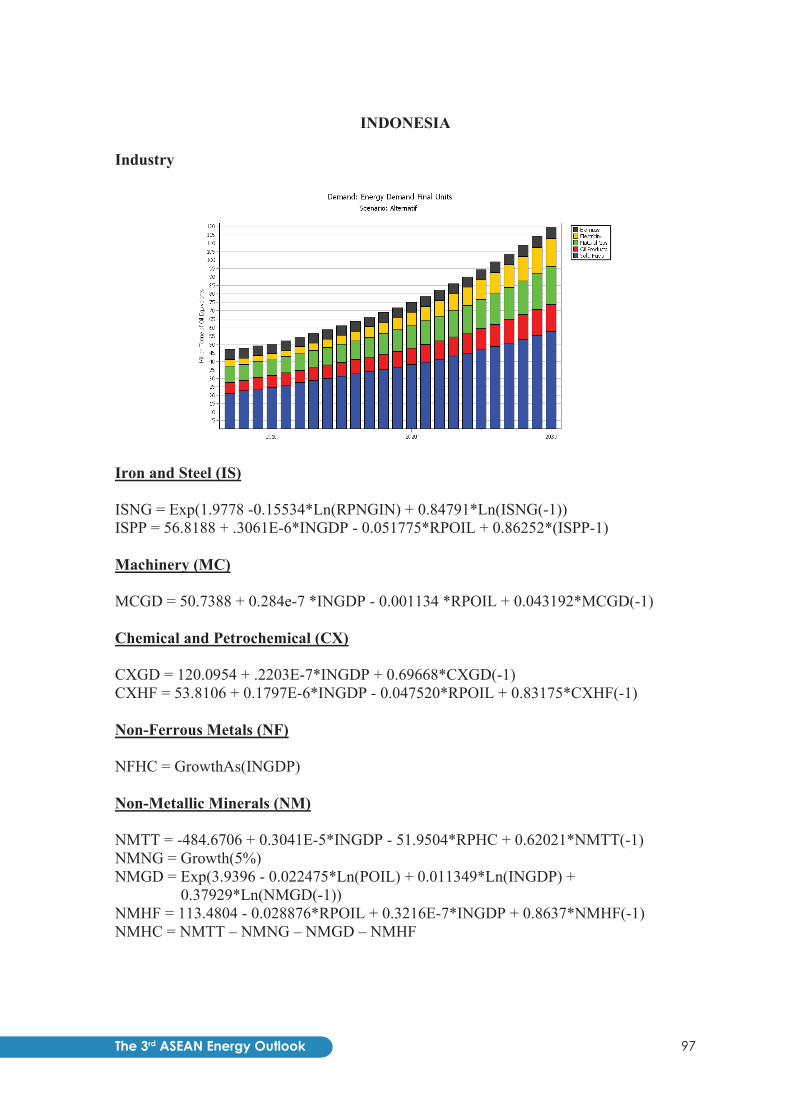
97The 3rd ASEAN Energy Outlook
INDONESIA Industry
Iron and Steel (IS)
ISNG = Exp(1.9778 -0.15534*Ln(RPNGIN) + 0.84791*Ln(ISNG(-1)) ISPP = 56.8188 + .3061E-6*INGDP - 0.051775*RPOIL + 0.86252*(ISPP-1)
Machinery (MC)
MCGD = 50.7388 + 0.284e-7 *INGDP - 0.001134 *RPOIL + 0.043192*MCGD(-1)
Chemical and Petrochemical (CX)
CXGD = 120.0954 + .2203E-7*INGDP + 0.69668*CXGD(-1) CXHF = 53.8106 + 0.1797E-6*INGDP - 0.047520*RPOIL + 0.83175*CXHF(-1)
Non-Ferrous Metals (NF)
NFHC = GrowthAs(INGDP)
Non-Metallic Minerals (NM)
NMTT = -484.6706 + 0.3041E-5*INGDP - 51.9504*RPHC + 0.62021*NMTT(-1) NMNG = Growth(5%) NMGD = Exp(3.9396 - 0.022475*Ln(POIL) + 0.011349*Ln(INGDP) +
0.37929*Ln(NMGD(-1)) NMHF = 113.4804 - 0.028876*RPOIL + 0.3216E-7*INGDP + 0.8637*NMHF(-1) NMHC = NMTT – NMNG – NMGD – NMHF
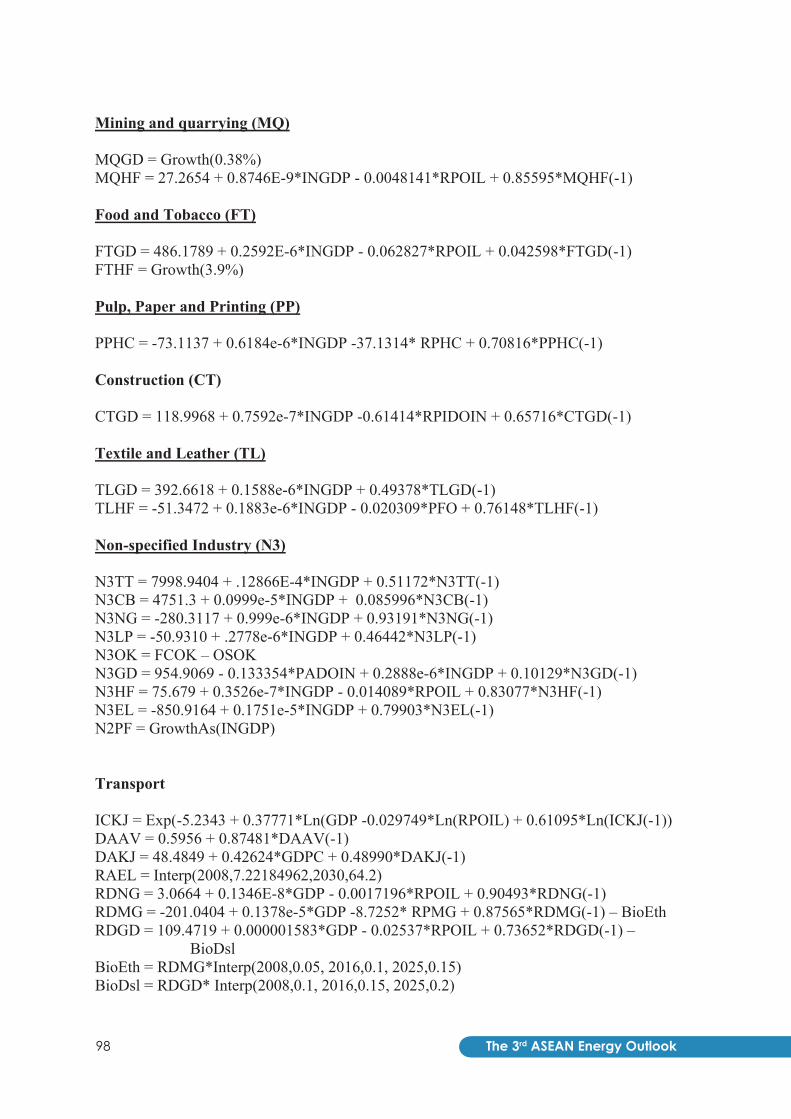
The 3rd ASEAN Energy Outlook98
Mining and quarrying (MQ)
MQGD = Growth(0.38%) MQHF = 27.2654 + 0.8746E-9*INGDP - 0.0048141*RPOIL + 0.85595*MQHF(-1)
Food and Tobacco (FT)
FTGD = 486.1789 + 0.2592E-6*INGDP - 0.062827*RPOIL + 0.042598*FTGD(-1) FTHF = Growth(3.9%)
Pulp, Paper and Printing (PP)
PPHC = -73.1137 + 0.6184e-6*INGDP -37.1314* RPHC + 0.70816*PPHC(-1) Construction (CT) CTGD = 118.9968 + 0.7592e-7*INGDP -0.61414*RPIDOIN + 0.65716*CTGD(-1)
Textile and Leather (TL)
TLGD = 392.6618 + 0.1588e-6*INGDP + 0.49378*TLGD(-1) TLHF = -51.3472 + 0.1883e-6*INGDP - 0.020309*PFO + 0.76148*TLHF(-1)
Non-specified Industry (N3)
N3TT = 7998.9404 + .12866E-4*INGDP + 0.51172*N3TT(-1) N3CB = 4751.3 + 0.0999e-5*INGDP + 0.085996*N3CB(-1) N3NG = -280.3117 + 0.999e-6*INGDP + 0.93191*N3NG(-1) N3LP = -50.9310 + .2778e-6*INGDP + 0.46442*N3LP(-1) N3OK = FCOK – OSOK N3GD = 954.9069 - 0.133354*PADOIN + 0.2888e-6*INGDP + 0.10129*N3GD(-1) N3HF = 75.679 + 0.3526e-7*INGDP - 0.014089*RPOIL + 0.83077*N3HF(-1) N3EL = -850.9164 + 0.1751e-5*INGDP + 0.79903*N3EL(-1) N2PF = GrowthAs(INGDP) Transport ICKJ = Exp(-5.2343 + 0.37771*Ln(GDP -0.029749*Ln(RPOIL) + 0.61095*Ln(ICKJ(-1)) DAAV = 0.5956 + 0.87481*DAAV(-1) DAKJ = 48.4849 + 0.42624*GDPC + 0.48990*DAKJ(-1) RAEL = Interp(2008,7.22184962,2030,64.2) RDNG = 3.0664 + 0.1346E-8*GDP - 0.0017196*RPOIL + 0.90493*RDNG(-1) RDMG = -201.0404 + 0.1378e-5*GDP -8.7252* RPMG + 0.87565*RDMG(-1) – BioEth RDGD = 109.4719 + 0.000001583*GDP - 0.02537*RPOIL + 0.73652*RDGD(-1) –
BioDsl BioEth = RDMG*Interp(2008,0.05, 2016,0.1, 2025,0.15) BioDsl = RDGD* Interp(2008,0.1, 2016,0.15, 2025,0.2)

99The 3rd ASEAN Energy Outlook
Other Sectors
Agriculture
AGGD = -24.3393+0.3477e-6*GDP + 0.77344*AGGD(-1) -1.5988* RPIDOIN AGHF = Growth(2.1%)
Commercial
CSCB = -42.8240 +0.00000005259*GDP + 0.0004669*POPR -0.016152*RPOIL + 0.73934*CSCB(-1)
CSNG = 32.6317 + 0.00000001320*GDP + 0.0013156*RPOIL - 0.0001519* POP + 0.11369*CSNG(-1)
CSOK = 98.3409 + 0.0000001024* GDP - 0.055942*RPOIL + 0.68800*CSOK(-1) CSGD = -26.2152 + 0.0089867 *CSGDP + 0.73258*CSGD(-1) CSEL = -20.2925 + .5102E-7*GDP + 1.062*CSEL(-1) CSLP = Growth(1.25%)

The 3rd ASEAN Energy Outlook100
Residential
RECB = Growth(0%) RECC = Growth(2.04%) REPF = GrowthAs(GDPC) RENG = -6.1915 - 0.00003664*RPOIL + 0.00000001586*CP + 0.36884*RENG(-1) RELP = Interp(2030,10060.23305) REOK = Exp(- 0.2117 - 0.057991*Ln(PKERORT) + 1.0632 *Ln(REOK(-1)) REEL = -115.3028 + 0.044900*GDPC + 0.99392*REEL(-1)
Non-Specified Other (N5)
N5OK = OSOK – REOK – CSOK Non-Energy
NENG = 565.6238 + 0.1792E-5*GDP + 0.48383*NENG(-1) NENP = -201.387 + 0.1124E-5 *GDP + 0.48215* NENP(-1) NELU = Growth(3.3%) NEBT = 35.8423 + 0.4921E-7*GDP + 0.73303*NEBT(-1) NEOP = 122.4187 + 0.4796E-8*GDP + 0.46385 *NEOP(-1)

101The 3rd ASEAN Energy Outlook
LAO PDR
Industry
INHC = 56.0711 + 0.7035E-4*INGDP INCB = 34.772698 + 0.415E-4*INGDP INEL = 8.6552 + 0.795E-4*INGDP INLP = -0.73042 + .1134E-4*INGDP + 0.29032*INLP(-1) INOP = 4.161082 + 0.1082E-4*INGDP - 0.9409E-3*RPOIL + Transportation
DAKJ = 13.4286 + 0.092172*GDPC + 0.76239*DAKJ(-1) ICKJ = =-13.4286 + 0.092172*GDPC + 0.76239*ICKJ(-1) RDPP = -23.7268 + 0.57248* GDPC + 0.71487*RDPP(-1) + 12.8356 RDGD = -4.5392 + .4714E-4*GDP + 0.76195*RDGD(-1) RDMG = RDPP – RDGD
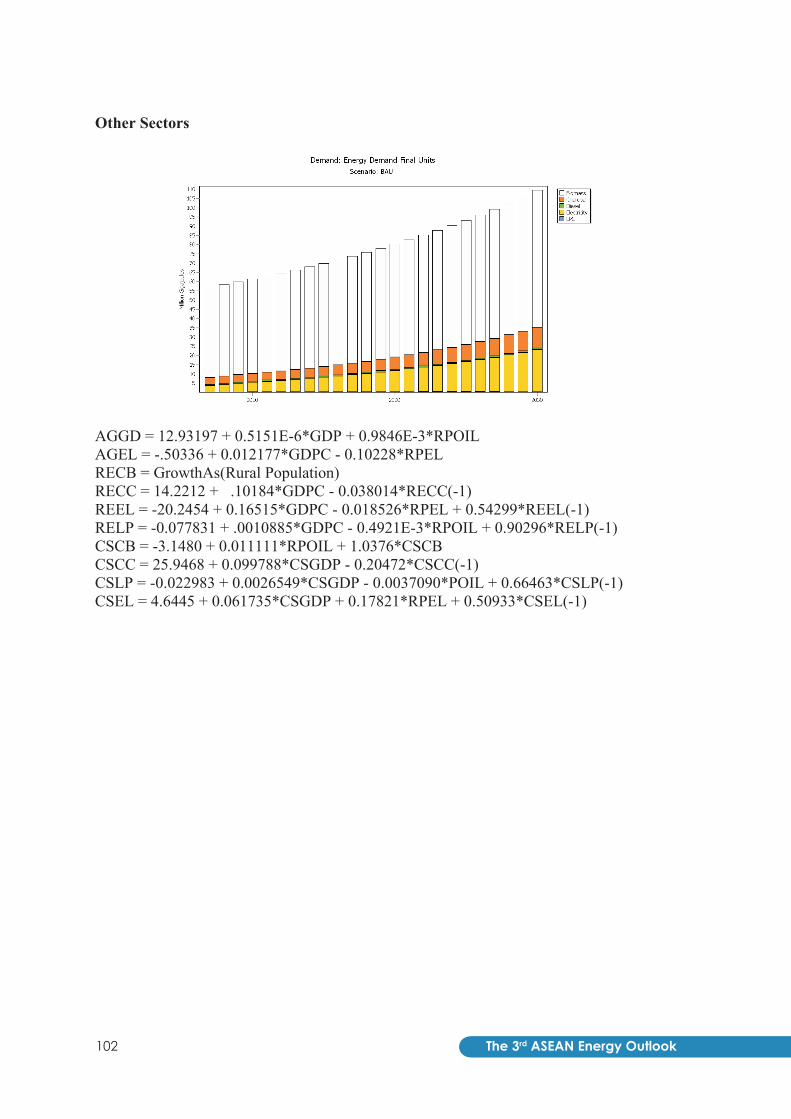
The 3rd ASEAN Energy Outlook102
Other Sectors
AGGD = 12.93197 + 0.5151E-6*GDP + 0.9846E-3*RPOIL AGEL = -.50336 + 0.012177*GDPC - 0.10228*RPEL RECB = GrowthAs(Rural Population) RECC = 14.2212 + .10184*GDPC - 0.038014*RECC(-1) REEL = -20.2454 + 0.16515*GDPC - 0.018526*RPEL + 0.54299*REEL(-1) RELP = -0.077831 + .0010885*GDPC - 0.4921E-3*RPOIL + 0.90296*RELP(-1) CSCB = -3.1480 + 0.011111*RPOIL + 1.0376*CSCB CSCC = 25.9468 + 0.099788*CSGDP - 0.20472*CSCC(-1) CSLP = -0.022983 + 0.0026549*CSGDP - 0.0037090*POIL + 0.66463*CSLP(-1) CSEL = 4.6445 + 0.061735*CSGDP + 0.17821*RPEL + 0.50933*CSEL(-1)

103The 3rd ASEAN Energy Outlook
MALAYSIA
Industry
Non-Metallic Minerals
NMHC = -23.0536 + 0.0031988*MNGGDP + 0.000003104*CNGVO + 0.56868*MCHC(-1)
Other Industry
INTT = -273.2372 + 0.0064657*GDP + 0.89633*INTT(-1) INNG = INTT – INPP - INEL INGD = 0.0915 + .2062E-3*PRINS - 10.6083*PCEL + 0.80617*INGD(-1) INEL = -72.2223 + 0.005457*INGDP + 0.72568*INEL(-1) INHF = 0.5579 + .1303e-3*PRINS - 1.6295*PCEL + 0.63755*INHF(-1) INCB = 8.4313 + 0.8347E-4*MNGGDP - 0.83844*RPOIL + 0.82627*INCB(-1) INMG = Interp(2030,0) INLP = 1.9%* INPP INOK = 3.9227 + 0.6347E-4*MNGGDP - 0.091044*PCOK + 0.70824*INOK(-1) INOP = 0.148%*INPP Transportation RDNG = 1.4173%*FCNG RDGD = 38.166 + 0.0081513*MNGGDP - 31.3572*RPOIL + 0.67728*RDGD(-1) RDMG = -118.8716 + 0.0076304*GDP - 144.1424*PCMP97 + 0.61556*RDMG(-1) RDHF = 0.0222%*RDPP RAEL = Growth(1.5%) ICKJ = -18.4492 + 0.005835*INGDP - 42.0177*RPOIL + 0.46302*ICKJ(-1)

The 3rd ASEAN Energy Outlook104
Other Sectors
Residential and Commercial (RC)
RCLP = 50.5067 + 0.0008528*CSGDP - 42.8209*RPOIL + 0.94*RCLP(-1) RCPP = 74.8423 + 0.0027824*GDP - 8.9439*PCMP97 + 0.19047*RCPP(-1) RCOK = Interp(2030, 0) RCHF = RCPP – RCLP - RCOK RCEL = -106.7071 + 0.0037432*CSGDP + 0.85614*RCEL(-1) RCNG = Interp(2030,50) RCCB = no growth RCCC = no growth
Agriculture
AGTT = 0.546%*FCTT AGMG = 2%*AGTT AGGD = 98%*AGTT

105The 3rd ASEAN Energy Outlook
Non-energy
NETT = 6.5%*FCTT NEPP = -381.3761+ 15.5746*CPI - 132.1306*RPOIL - 0.27975*NEPP(-1) NENG = NETT - NEPP NELP = NEPP - NEBT NEBT = 4.3431 + .0014432*INGDP - 5.1843*PCEL + 0.79996*NEBT(-1)

The 3rd ASEAN Energy Outlook106
MYANMAR
Industry
INHC = -24.2915 + .2800e-3*INGDP + 0.58975*INHC(-1) INFUEL = INNG + INPP INFUEL = -76.4565 + 0.0016741* INGDP + 0.64028*INFUEL(-1) INNG = GrowthAs(INFUEL) INLP = GrowthAs(INFUEL) INGD = GrowthAs(INFUEL) INHF = GrowthAs(INFUEL) INPC = GrowthAs(INFUEL) INCB = GrowthAs(INFUEL) Transport
RDTT = 100.1709 + 0.7090E-4* + 0.68431*RDTT(-1) RDMG = GrowthAs(RDTT) RDGD = GrowthAs(RDTT)

107The 3rd ASEAN Energy Outlook
RDNG = GrowthAs(RDTT) RDBDSL = 0.05*RDGD RDBETHNL = 0.05*RDMG IVHF = 20.4256 + 0.092992*GDPC Other Sectors
RELP = GrowthAs(Urban Population) REOK = GrowthAs(Urban Population) REGD = GrowthAs(Urban Population) REEL = -48.5186 + 0.13097*GDPC + 0.0015905*POP + 0.73536*REEL(-1) RECB = GrowthAs(Rural Population) RECC = GrowthAs(Urban Population) CSEL = -2.1907 + 0.7544E-3*CG + 0.39392*CSEL(-1) AGHF = No growth N5TT = -16.5544 + .0011616*CG + 0.36380*N5TT(-1) N5HC = GrowthAs(N5TT, 0.8) N5NG = GrowthAs(N5TT, 0.8) N5LP = GrowthAs(N5TT, 0.8) N5GD = GrowthAs(N5TT, 0.8) N5HF = GrowthAs(N5TT, 0.8)

The 3rd ASEAN Energy Outlook108
PHILIPPINES Industry
ISHC = GrowthAs(GVAIS,.8) Iron and Steel
ISPP = 216.2489 + 0.2638E-4*GVAIS -10.8158* RDPOIL + 0.21429*ISPP(-1) ISEL = 2.3384*1+ .0017985* GVAIS - 3.9007* RDPOIL + +94224*ISEL(-1)
CXHC = Interp(2010,0) Chemical and Petrochemical
CXPP = -4.2272*1 + 0.0088526* GVACX - 3.2773*RDPOIL + 0.26780*CXPP(-1_ CXEL = -40.3097*1 +0 .0086549* GVACX + 0.33458*CXEL(-1)
Non-Metallic Minerals
NMHC = -1.1015 + 0.018021* GVANM + 0.93142*NHMC(-1) NMPP = 87.3098*1 + 0.027053* GVANM + - 19.9156* RDPOIL + 0.37720*NMPP(-1) NMEL = 23.8205*1 + .015807*Key\Industry\GVANM[Million pesos] -21.3106*0 -7.8841*0 +
7.5918*Key\RDPOIL[constantPhP/barrel] + .16950*PrevYearValue
Machinery
MCEL = Exp(-1.4826 + 0.31722*Ln(GVAMC) + 0.67882*Ln(MCEL(-1)) MCLP = GrowthAs(Electricity) MCKJ = GrowthAs(Electricity) MCGD = GrowthAs(Electricity) MCHF = GrowthAs(Electricity)
Other Industries
OIHC = GrowthAs(NHMC) OIEL = INEL – ISEL – CXEL – MCEL – NHEL OIPP = GrowthAs(GVAOI,0.8) OICB = GrowthAs(GVAOI,.94) OING = GrowthAs(OIPP)

109The 3rd ASEAN Energy Outlook
Transportation
International Civil Aviation
ICKJ = 34.6723 + 0.6260E-3* GDP - 11.2753* RPOIL + 265.4746
Domestic Air Transport
DATT = Interp(2008,274.12, 2010,291.42, 2015,364.89, 2020,456.88, 2025,567.25, 2030,704.2)
Road
RDMG = 1005.3840 + .4700E-3*GASCARS - 191.9490* RPOIL + 0.61489*RDMG(-1) - Bioeth RDGD = 2665.2 + 0.0027413*DSLCARS - 169.2192*RPOIL - Biodsl Biodsl = RDBGD*0.02 Bioeth = RDBMG*0.1 RDLP = GrowthAs(Gasoline,0.5)
Internal Navigation
IVMG = GrowthAs(POP) IVGD = GrowthAs(POP) IVHF = GrowthAs(POP)
Rail
RAEL = Step(2012,12.27, 2017,15.34, 2025,20)

The 3rd ASEAN Energy Outlook110
Other Sectors
Agriculture
AGTT = GrowthAs(AGGDP,0.8) AGEL = AGTT- AGPP
Commercial
CSCOOK = CSCB + CSCC + CSLP CSCOOK = 54.3421 + 0.1499E-3*CSGDP + 0.75033*CSCOOK(-1) CSCB = CSCOOK*base year biomass share CSCC = CSCOOK*base year charcoal share CSLP = CSCOOK*base year LPG share CSPP = -4.3591 + 0.1674E-4*GDP + 0.97819*CSPP(-1) CSEL = -279.1130 + 0.0029779*POP + 0.3751E-3*GDP + 0.66165*CSEL(-1)
Residential
RECB = GrowthAs(LPG,-1) RELP = 3.7128 - 19.0602*RPOIL + 0.1665E-3*GDP - + 0.96070*RECB(-1) REKJ = GrowthAs(Electricity,-1) REEL = -82.7476 + 0.3468E-3*GDP - 12.0471*RPOIL + 0.83299*REEL(-1) RECC = GrowthAs(POPR)
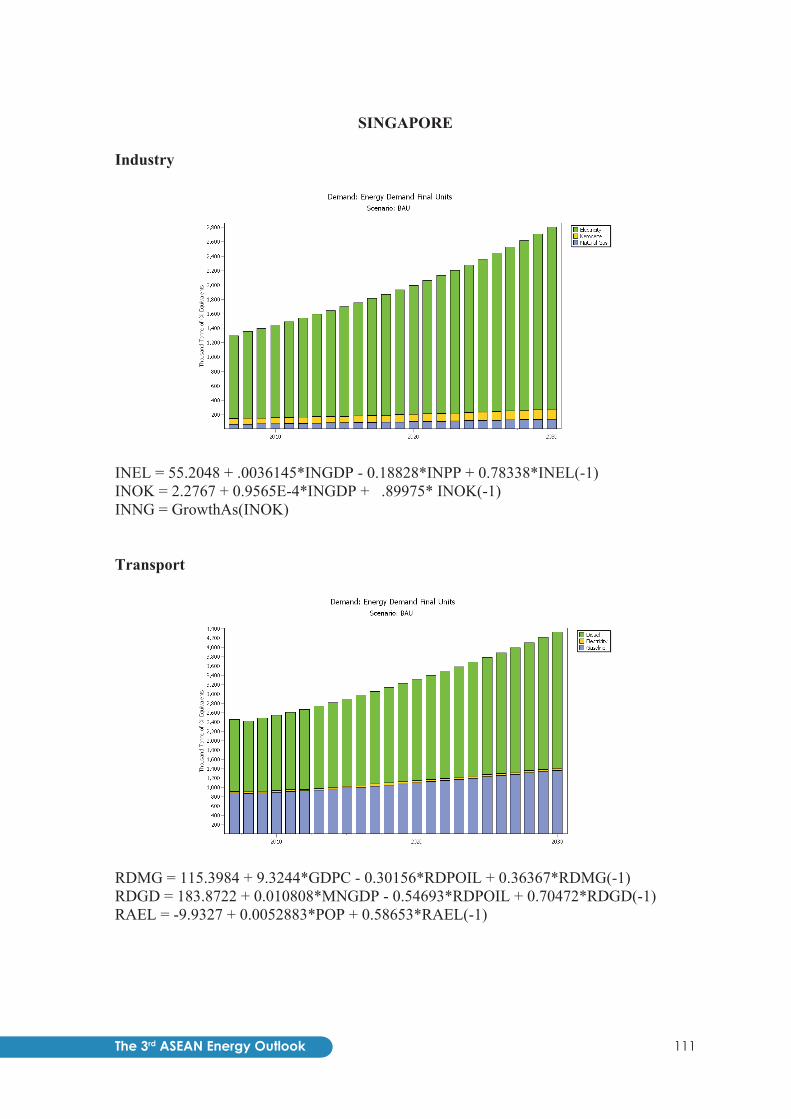
111The 3rd ASEAN Energy Outlook
SINGAPORE
Industry
INEL = 55.2048 + .0036145*INGDP - 0.18828*INPP + 0.78338*INEL(-1) INOK = 2.2767 + 0.9565E-4*INGDP + .89975* INOK(-1) INNG = GrowthAs(INOK) Transport
RDMG = 115.3984 + 9.3244*GDPC - 0.30156*RDPOIL + 0.36367*RDMG(-1) RDGD = 183.8722 + 0.010808*MNGDP - 0.54693*RDPOIL + 0.70472*RDGD(-1) RAEL = -9.9327 + 0.0052883*POP + 0.58653*RAEL(-1)

The 3rd ASEAN Energy Outlook112
Other Sectors
CSEL = -220.9282 + .0022157*CSGDP + 0.10051*POP + 0.55741*CSEL(-1) REELC = -0.09836 + 0.2559E-6*GDP + 0.3605E-4*POP REEL = REELC * population RENG = 73.6260 + 0.0025692*POP + 0.11280*RENG(-1) RELP = Growth(0%) AGEL = GrowthAs(population) Non-Energy
NELP = Interp(2020,0) NETT = -318.6068 + 0.054303*MNGDP + 0.65358*NETT(-1) NENP = GrowthAs(NETT) NELU = GrowthAs(Road transport consumption) NEBT = GrowthAs(Road transport consumption, 0.5) NEOP = Interp(2020,0)

113The 3rd ASEAN Energy Outlook
THAILAND
Industry
Iron and Steel
ISTT = 10.2242 + 0.5909E-3*MNGDP - 7.4355*RPOIL + 0.097071*ISTT(-1) -70.13352018
ISPP = ISTT - ISEL ISEL = -16.1272 + .1361E-3*MNGDP + 0.67260*ISEL(-1) + 36.37671604
Chemical and Petrochemical
CXTT = 36.7781 + 0.7666E-3*MNGDP - 11.3102*RPOIL + 0.30508*CXTT(-1) -123.8052993
CXPP = 58.0146+ 0.1492E-3*MNGDP - 6.8170*RPOIL + 0.57264*CXPP(-1) -106.6876915
CXEL = 3.1008 + 0.1877E-3*MNGDP - 4.0796*RPOIL + 0.72778*CXEL(-1) -16.4284829
CXCB = CTTT – CXPP – CXEL
Non-Metallic Minerals
NMHC = -2990.79+0.004592*MNGDP + 102.7939 NMLB = 451.3269 + .4401E-3*MNGDP - 61.9324*RPOIL + 0.50988*NMLB(-1) -
168.3904409 NMCB = GrowthAs(population) NMPP = 223.4156 -7.0643*RPOIL + 0.62991*NMPP(-1) -127.742461 NMEL = 135.8466 + .1570E-3*MNGDP - 68.7147*RPELE + 0.56298*NMEL(-1) -
31.20894761

The 3rd ASEAN Energy Outlook114
Machinery
MCTT = -51.2010+ 0.3000E-3*MNGDP + 0.69270*MCTT(-1) + 20.28379349 + 54.96978324
MCPP = MCTT - MCEL MCEL = -34.9466 + .1785E-3*MNGDP + 0.82323*MCEL(-1) + 28.29419329
Mining and Quarrying
MQPP = 7.7695 -.24671*RPOIL + 0.82378*MQPP - 4.356554577
Food and Tobacco
FTHC = -41.5450+ 0.9062E-4*MNGDP + 0.67071*FTHC(-1) +23.48154927 FTLB = 6.8407 + 0.3507E-5*MNGDP + 0.83482*FTLB(-1) -22.71997794 FTCB = 1028.1+ 0.0019902*MNGDP - 7.5527*RPOIL + 0.19286*FTCB(-1) -
105.6657665 FTPP = 211.0351 + 0.2634E-3*MNGDP - 13.7210*RPOIL + 0.40978*FTPP(-1) -
111.0390253 FTEL = 34.8050 + 0.1942E-3*MNGDP + 0.61883*FTEL(-1) +23.8914858 FTLP = FTPP – FTMG – FTOK – FTGD - FTHF FTMG = Growth(0%) FTOK = Growth(0%) FTGD = 10.0878 + 0.1452E-3*MNGDP - 0.18702*RPDSL + 0.18299*FTGD(-1) +
8.301632744 FTHF = 158.4746 + 0.1135E-3*MNGDP - 13.3638*RPOIL + 0.58413*FTHF(-1) -
99.05316479
Paper, Pulp and Printing
PPTT = 108.5959 + 0.1812E-3*PAPER - 8.6327*RPOIL + 0.47159*PPTT(-1) PPPP = 96.7751 + 0.1544E-3*PAPER - 11.8118*RPOIL + 0.37248*PPPP(-1) PPEL = PPTT – PPPP
Wood and Wood Products
WPTT = 4.2947 + 1.0500*WPTT(-1)
Construction
CTPP = 44.9585 - 4.2871*RPOIL + 0.2100E-4*MNGDP + 0.78320*CTPP(-1)
Textile and Leather
TLTT = 178.5074 - 46.6580*RPOIL + 38.4138*TREND TLEL = 51.3303 + 0.1657E-3*MNGDP - 10.5362*RPOIL + 0.73633*TLEL(-1) TLPP = TLTT – TLEL

115The 3rd ASEAN Energy Outlook
Non-Specified Industry
N3HC = -11.3970 + 0.7928E-4*MNGDP + 0.82142*N3HC(-1) N3LB = Interp(2007, 284.639, 2008, 229.808, 2009, 178.973, 2010, 131.841, 2011,
88.144, 2012, 47.63, 2013, 10.068,2014,0) N3NG = 86.488*TREND2 + 1145.6 N3PP = 191.7686 + 0.5068E-3*MNGDP - 32.1211*RPOIL + 0.48358*N3PP(-1) N3EL = 5.2483 + .8180E-4*MNGDP + 0.12851*N3EL(-1) Transport
RDNG = Growth(19%,2014,3%) RDLP = -177.6604 + .2679E-3*TRGDP + 21.7156*RPMG + 0.73626*RDLP(-1) RDMG = 18.886*TREND1 + 5311 - RBETHNL RDGD = 2295.4 + 0.015303*TRGDP - 325.9866*RPDSL + 0.59708*RDGD(-1) -
RBDSL RBDSL = RDGD*Interp(2008, 0.025121282, 2009, 0.033250387, 2010,
0.031722505,2030,0.031722505) RBETHNL = RDMG*Interp(2008,0.021,2009,0.038,2010,0.054,2030,0.12) RAEL = Interp(2007, 14.21, 2008, 13.46, 2009, 14.51, 2010, 14.51, 2011, 14.51, 2012,
19.29, 2013, 27.59, 2014, 34.92, 2015, 42.58, 2016, 51.19, 2017, 51.19, 2018, 51.19, 2019, 70.38, 2020, 89.56, 2021, 108.75, 2022, 108.75, 2023, 108.75, 2024, 108.75, 2025, 108.75, 2026, 108.75, 2027, 108.75, 2028, 108.75, 2029, 124.87, 2030, 141)
RAGD = 86.8332 - 1.6361*RPDSL + 0.30743*RAGD(-1) IVGD = 70.3905 - 1.6615*RPDSL + 0.16915*IVGD(-1) ICKJ = GrowthAs(GDP)
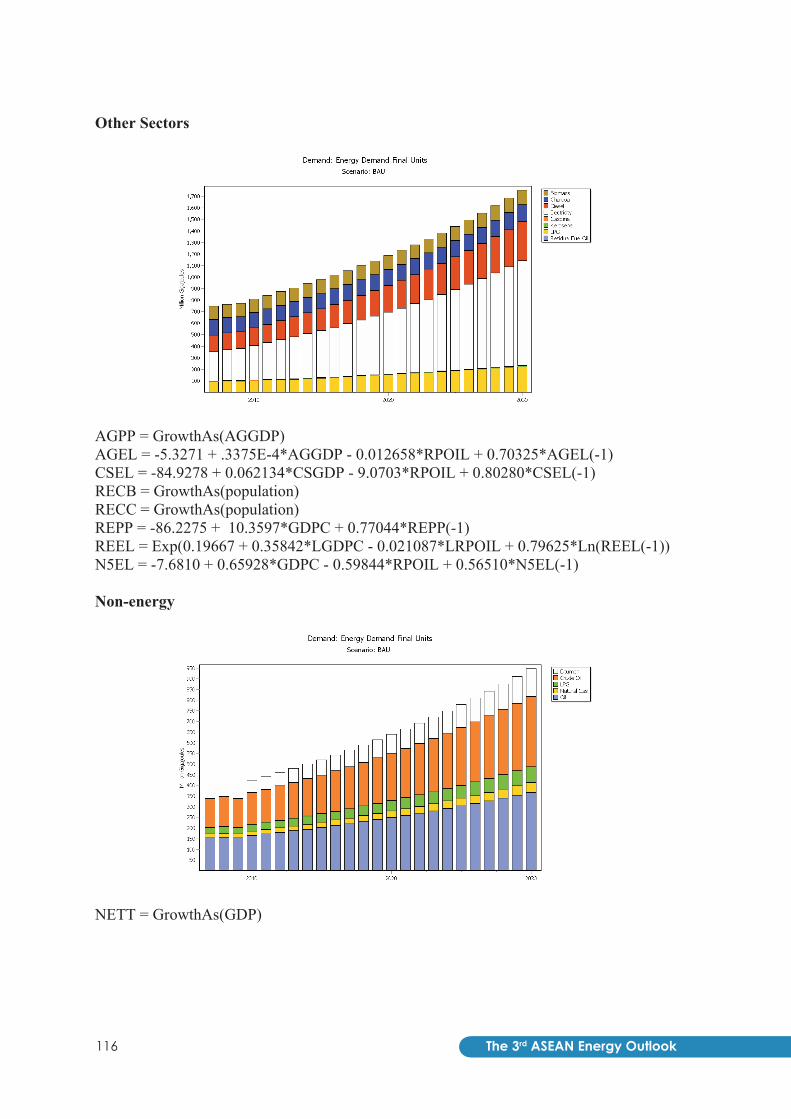
The 3rd ASEAN Energy Outlook116
Other Sectors
AGPP = GrowthAs(AGGDP) AGEL = -5.3271 + .3375E-4*AGGDP - 0.012658*RPOIL + 0.70325*AGEL(-1) CSEL = -84.9278 + 0.062134*CSGDP - 9.0703*RPOIL + 0.80280*CSEL(-1) RECB = GrowthAs(population) RECC = GrowthAs(population) REPP = -86.2275 + 10.3597*GDPC + 0.77044*REPP(-1) REEL = Exp(0.19667 + 0.35842*LGDPC - 0.021087*LRPOIL + 0.79625*Ln(REEL(-1)) N5EL = -7.6810 + 0.65928*GDPC - 0.59844*RPOIL + 0.56510*N5EL(-1) Non-energy
NETT = GrowthAs(GDP)

117The 3rd ASEAN Energy Outlook
VIET NAM Industry
INHC = 317.6419 + 0.011300*INGDP + 0.32329*(-INHC1) INNG = -91.0601+ .0000001660*INGDP + 0.019095*RPOIL + 0.9749*INNG(-1) INLP = -23.4180 -.0060502*RPOIL + .5209E-3*INGDP+ 0.33313*INLP(-1) INOK = 2.1031 -.3278E-3*RPOIL + 0.3004E-4*INGDP + 0.38008*INOK(-1) INGD = -22.2335* -.0034378*RPOIL + 0.0012999*INGDP+ 0.25330*INGD(-1) INHF = 237.6073 - 0.017075*RPOIL + 0.99597*INHF(-1) INEL = -123.7138 - 0.016870*RPOIL + 0.4251E-3*INGDP + 1.1061*INEL(-1)
Transport
ICKJ = -11.4295* - 0.0021616*RPOIL + 0.0013416*GDPC + 0.27305*ICKJ(-1) DAKJ = 67.5897 + 0.0037996*RPOIL + 0.3731E-3*GDPC + 0.43030*DAKJ(-1)
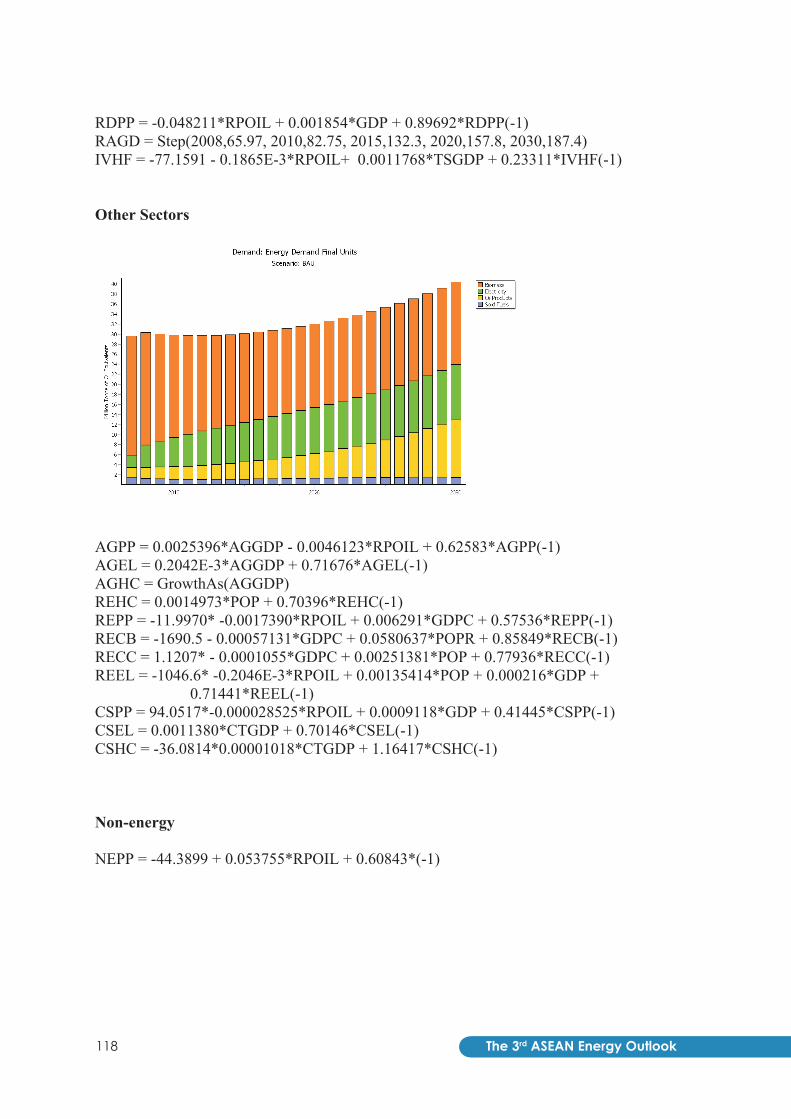
The 3rd ASEAN Energy Outlook118
RDPP = -0.048211*RPOIL + 0.001854*GDP + 0.89692*RDPP(-1) RAGD = Step(2008,65.97, 2010,82.75, 2015,132.3, 2020,157.8, 2030,187.4) IVHF = -77.1591 - 0.1865E-3*RPOIL+ 0.0011768*TSGDP + 0.23311*IVHF(-1) Other Sectors
AGPP = 0.0025396*AGGDP - 0.0046123*RPOIL + 0.62583*AGPP(-1) AGEL = 0.2042E-3*AGGDP + 0.71676*AGEL(-1) AGHC = GrowthAs(AGGDP) REHC = 0.0014973*POP + 0.70396*REHC(-1) REPP = -11.9970* -0.0017390*RPOIL + 0.006291*GDPC + 0.57536*REPP(-1) RECB = -1690.5 - 0.00057131*GDPC + 0.0580637*POPR + 0.85849*RECB(-1) RECC = 1.1207* - 0.0001055*GDPC + 0.00251381*POP + 0.77936*RECC(-1) REEL = -1046.6* -0.2046E-3*RPOIL + 0.00135414*POP + 0.000216*GDP +
0.71441*REEL(-1) CSPP = 94.0517*-0.000028525*RPOIL + 0.0009118*GDP + 0.41445*CSPP(-1) CSEL = 0.0011380*CTGDP + 0.70146*CSEL(-1) CSHC = -36.0814*0.00001018*CTGDP + 1.16417*CSHC(-1)
Non-energy NEPP = -44.3899 + 0.053755*RPOIL + 0.60843*(-1)

119The 3rd ASEAN Energy Outlook
ANNEX II – RESULTS SUMMARY TABLES

The 3rd ASEAN Energy Outlook120
121The 3rd ASEAN Energy Outlook
1990- 2007- 2020- 2007-1990 2005 2007 2020 2030 1990 2005 2007 2020 2030 2007 2020 2030 2030
Total 252 489 511 869 1,414 100.0 100.0 100.0 100.0 100.0 4.2 4.2 5.0 4.5Coal 12 54 76 206 414 4.7 11.1 14.8 23.7 29.3 11.5 8.0 7.3 7.7Oil 96 191 185 314 496 38.1 39.1 36.2 36.2 35.1 3.9 4.2 4.7 4.4Natural gas 33 107 109 149 227 13.0 21.9 21.4 17.1 16.0 7.3 2.4 4.3 3.2Nuclear - - - 3 24 - - - 0.4 1.7 - - 21.6 -Hydro 3 5 6 19 30 1.0 1.0 1.2 2.2 2.1 5.4 9.2 4.6 7.1Geothermal 6 14 15 35 47 2.2 2.9 2.9 4.0 3.4 5.8 6.7 3.2 5.2Others 103 117 120 143 176 41.0 23.9 23.5 16.5 12.5 0.9 1.3 2.1 1.7
1990- 2007- 2020- 2007-Sector 1990 2005 2007 2020 2030 1990 2005 2007 2020 2030 2007 2020 2030 2030Total 186 345 375 637 1,018 100.0 100.0 100.0 100.0 100.0 4.2 4.2 4.8 4.4
Industry 38 95 108 203 348 20.3 27.4 28.9 31.8 34.2 6.4 5.0 5.5 5.2Transportation 38 87 90 183 313 20.5 25.4 23.9 28.7 30.7 5.1 5.6 5.5 5.6Others 99 141 146 193 263 53.0 40.8 38.9 30.3 25.9 2.3 2.2 3.2 2.6Non-energy 12 22 31 59 95 6.2 6.4 8.4 9.3 9.3 6.1 5.0 4.8 4.9
Total 186 345 375 637 1,018 100.0 100.0 100.0 100.0 100.0 4.2 4.2 4.8 4.4Coal 4 24 37 82 138 2.3 7.0 9.9 12.9 13.5 13.5 6.3 5.3 5.9Oil 72 153 156 283 466 38.6 44.4 41.7 44.4 45.8 4.7 4.7 5.1 4.9Natural gas 8 24 30 58 99 4.4 7.0 8.0 9.2 9.7 7.9 5.3 5.4 5.3Electricity 11 38 43 97 179 5.9 11.0 11.4 15.2 17.6 8.3 6.5 6.4 6.4Heat - - - - - - - - - - - - - -Others 91 106 109 117 136 48.7 30.6 29.0 18.4 13.4 1.1 0.6 1.5 1.0
1990- 2007- 2020- 2007-1990 2005 2007 2020 2030 1990 2005 2007 2020 2030 2007 2020 2030 2030
Total 157 504 571 1,309 2,414 100.0 100.0 100.0 100.0 100.0 7.9 6.6 6.3 6.5Coal 28 118 156 508 1,144 18.1 23.5 27.3 38.8 47.4 10.5 9.5 8.5 9.1Oil 66 68 61 45 35 41.8 13.6 10.6 3.4 1.5 -0.5 -2.3 -2.3 -2.3Natural gas 26 242 262 412 616 16.4 48.0 45.9 31.5 25.5 14.6 3.5 4.1 3.8Nuclear - - - 13 91 - - - 1.0 3.8 - - 21.6 -Hydro 29 57 71 225 351 18.6 11.3 12.5 17.2 14.5 5.4 9.2 4.6 7.2Geothermal 7 17 17 40 55 4.2 3.3 3.0 3.1 2.3 5.8 6.7 3.2 5.2Others 2 2 4 67 121 1.0 0.4 0.7 5.1 5.0 6.1 23.6 6.2 15.7
1990- 2007- 2020- 2007-1990 2005 2007 2020 2030 1990 2005 2007 2020 2030 2007 2020 2030 2030
Total 30 97 107 211 397 100.0 100.0 100.0 100.0 100.0 7.8 5.4 6.5 5.9Coal 7 30 38 123 274 23.2 31.1 35.9 58.0 69.1 10.6 9.4 8.4 8.9Oil 16 16 14 10 8 55.3 16.4 13.4 4.8 2.0 -0.8 -2.6 -2.4 -2.5Natural gas 6 51 54 78 115 21.5 52.5 50.7 37.1 28.9 13.4 2.9 3.9 3.3
1990- 2007- 2020- 2007-1990 2005 2007 2020 2030 1990 2005 2007 2020 2030 2007 2020 2030 2030
Total 34.6 38.1 38.6 39.3 38.9 0.6 0.1 -0.1 0.0Coal 35.3 33.8 35.0 35.6 35.9 -0.1 0.1 0.1 0.1Oil 34.3 37.1 36.5 37.6 37.9 0.4 0.2 0.1 0.2Natural gas 34.6 40.9 41.7 45.2 46.1 1.1 0.6 0.2 0.4
1990- 2007- 2020- 2007-1990 2005 2007 2020 2030 1990 2005 2007 2020 2030 2007 2020 2030 2030
Total 101 251 250 504 895 5.4 5.6 5.9 5.7
Energy and economic indicators1990- 2007- 2020- 2007-
1990 2005 2007 2020 2030 2007 2020 2030 2030358 759 881 1,658 2,822 5.4 5.0 5.5 5.2439 551 568 659 732 1.5 1.1 1.1 1.10.8 1.4 1.6 2.5 3.9 3.8 3.8 4.4 4.00.6 0.9 0.9 1.3 1.9 2.7 3.0 3.9 3.4
704 644 580 524 501 -1.1 -0.8 -0.4 -0.6283 330 283 304 317 0.0 0.5 0.4 0.5
0.40 0.51 0.49 0.58 0.63 1.2 1.3 0.9 1.1
demand
AAGR(%)Power TWh Share, %
consumption
Share, % AAGR(%)Final energy Mtoe
ASEAN [BAU]Primary energy Mtoe Share, % AAGR(%)
Primary energy consumption per GDP (toe/million 2000 US Dollars)
GDP (billions of 2000 US dollars)Population (million of people)GDP per capita (thousands of 2000 USD/person)
CO2 emissions per primary energy consumption (t-C/toe)CO2 emissions per GDP (t-C/million 2000 US Dollars)
Primary energy consumption per capita (toe/person)
Thermal Efficiency
CO2 emissions Mt-C
generation
Power MTOEgeneration
Input
AAGR(%)
AAGR(%)
AAGR(%)
Share, %
Share, %
AAGR(%)
Share, %
%
The 3rd ASEAN Energy Outlook122
1990- 2007- 2020- 2007-1990 2005 2007 2020 2030 1990 2005 2007 2020 2030 2007 2020 2030 2030
Total 252 489 511 759 1,152 100 100 100 100 100 4.2 3.1 4.3 3.6Coal 12 54 76 162 300 4.7 11.1 14.8 21.4 26.0 11.5 6.0 6.3 6.2Oil 96 191 185 280 408 38.1 39.1 36.2 36.9 35.4 3.9 3.2 3.8 3.5Natural gas 33 107 109 129 183 13.0 21.9 21.4 17.1 15.9 7.3 1.3 3.5 2.3Nuclear - - - 4 30 0.0 0.0 0.0 0.6 2.6 - - 21.8 -Hydro 3 5 6 19 29 1.0 1.0 1.2 2.5 2.5 5.4 8.9 4.5 7.0Geothermal 6 14 15 35 47 2.2 2.9 2.9 4.6 4.1 5.8 6.7 3.2 5.2Others 103 117 120 130 154 41.0 23.9 23.5 17.1 13.4 0.9 0.6 1.8 1.1
1990- 2007- 2020- 2007-Sector 1990 2005 2007 2020 2030 1990 2005 2007 2020 2030 2007 2020 2030 2030Total 186 345 375 561 843 100 100 100 100 100 4.2 3.2 4.1 3.6
Industry 38 95 108 173 280 20.3 27.4 28.9 30.8 33.3 6.4 3.7 5.0 4.2Transportation 38 88 90 157 243 20.5 25.5 23.9 28.0 28.8 5.1 4.4 4.5 4.4Others 99 140 146 173 225 53.0 40.7 38.9 30.8 26.7 2.3 1.3 2.7 1.9Non-energy 12 22 31 59 94 6.2 6.4 8.4 10.5 11.2 6.1 5.0 4.8 4.9
Total 192 345 375 561 843 100 100 100 100 100 4.0 3.2 4.1 3.6Coal 5 24 37 69 110 2.6 7.0 9.9 12.3 13.0 12.5 4.9 4.8 4.8Oil 77 153 156 249 379 40.0 44.4 41.7 44.3 45.0 4.3 3.6 4.3 3.9Natural gas 8 24 30 53 87 4.3 7.0 8.0 9.4 10.3 7.9 4.5 5.1 4.7Electricity 13 38 43 85 148 6.8 11.1 11.4 15.1 17.5 7.2 5.4 5.7 5.5Heat - - - - - 0.0 0.0 0.0 0.0 0.0 - - - -Others 89 105 109 106 119 46.2 30.6 29.0 18.9 14.1 1.2 -0.2 1.2 0.4
1990- 2007- 2020- 2007-1990 2005 2007 2020 2030 1990 2005 2007 2020 2030 2007 2020 2030 2030
Total 157 504 571 1,179 2,068 100 100 100 100 100 7.9 5.7 5.8 5.8Coal 28 118 156 425 884 18.1 23.5 27.3 36.1 42.7 10.5 8.0 7.6 7.8Oil 66 68 61 43 33 41.8 13.6 10.6 3.7 1.6 -0.5 -2.6 -2.5 -2.6Natural gas 26 242 262 362 500 16.4 48.0 45.9 30.7 24.2 14.6 2.5 3.3 2.8Nuclear - - - 24 132 0.0 0.0 0.0 2.0 6.4 - - 18.8 -Hydro 29 57 71 218 338 18.6 11.3 12.5 18.5 16.3 5.4 9.0 4.5 7.0Geothermal 7 17 17 40 55 4.2 3.3 3.0 3.4 2.7 5.8 6.7 3.2 5.2Others 2 2 4 67 127 1.0 0.4 0.7 5.7 6.1 6.1 23.7 6.6 15.9
1990- 2007- 2020- 2007-1990 2005 2007 2020 2030 1990 2005 2007 2020 2030 2007 2020 2030 2030
Total 30 97 107 168 282 100 100 100 100 100 7.8 3.6 5.3 4.3Coal 7 30 38 92 189 23.2 31.1 35.9 55.0 66.9 10.6 7.0 7.4 7.2Oil 16 16 14 10 8 55.3 16.4 13.4 5.8 2.7 -0.8 -2.9 -2.6 -2.7Natural gas 6 51 54 66 86 21.5 52.5 50.7 39.2 30.5 13.4 1.5 2.7 2.0
1990- 2007- 2020- 2007-1990 2005 2007 2020 2030 1990 2005 2007 2020 2030 2007 2020 2030 2030
Total 34.6 38.1 38.6 42.5 43.2 0.6 0.8 0.2 0.5Coal 35.3 33.8 35.0 39.6 40.3 -0.1 1.0 0.2 0.6Oil 34.3 37.1 36.5 38.1 38.1 0.4 0.3 0.0 0.2Natural gas 34.6 40.9 41.7 47.3 50.1 1.1 1.0 0.6 0.8
1990- 2007- 2020- 2007-1990 2005 2007 2020 2030 1990 2005 2007 2020 2030 2007 2020 2030 2030
Total 101 251 249 419 679 5.4 4.1 4.9 4.4
Energy and economic indicators1990- 2007- 2020- 2007-
1990 2005 2007 2020 2030 2007 2020 2030 2030358 759 881 1,658 2,822 5.4 5.0 5.5 5.2439 551 568 659 732 1.5 1.1 1.1 1.10.8 1.4 1.6 2.5 3.9 3.8 3.8 4.4 4.00.6 0.9 0.9 1.2 1.6 2.7 1.9 3.2 2.5
704 644 580 458 408 -1.1 -1.8 -1.1 -1.5283 330 283 253 240 0.0 -0.9 -0.5 -0.7
0.40 0.51 0.49 0.55 0.59 1.1 1.0 0.6 0.8
AAGR(%)
Primary energy consumption per GDP (toe/million 2000 US Dollars)
GDP (billions of 2000 US dollars)Population (millions of people)GDP per capita (thousands of 2000 USD/person)Primary energy consumption per capita (toe/person)
CO2 emissions per GDP (t-C/million 2000 US Dollars)
AAGR(%)Efficiency
CO2 emissions Mt-C Share, % AAGR(%)
CO2 emissions per primary energy consumption (t-C/toe)
Thermal % Share, %
AAGR(%)
Power TWh
generation
generation
Power MTOE Share, %
demand
Share, %
Share, % AAGR(%)
AAGR(%)
Input
ASEAN [APS]Primary energy Mtoe Share, % AAGR(%)consumption
Final energy Mtoe
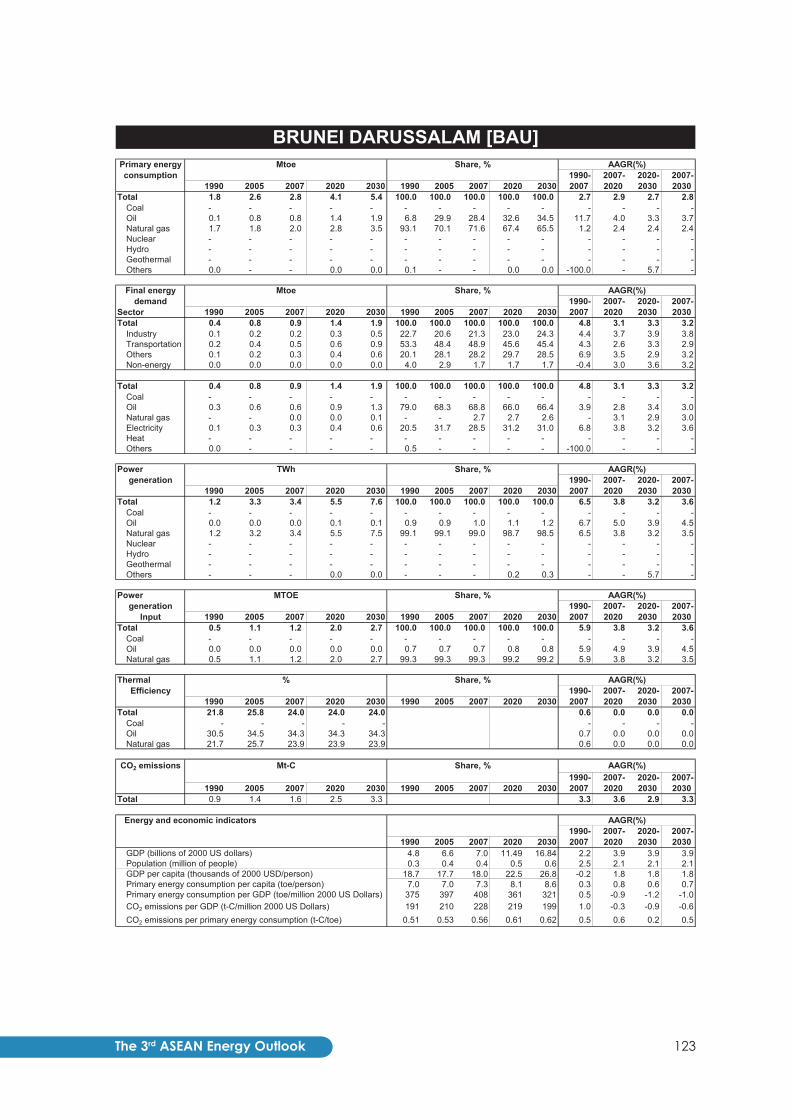
123The 3rd ASEAN Energy Outlook
1990- 2007- 2020- 2007-1990 2005 2007 2020 2030 1990 2005 2007 2020 2030 2007 2020 2030 2030
Total 1.8 2.6 2.8 4.1 5.4 100.0 100.0 100.0 100.0 100.0 2.7 2.9 2.7 2.8Coal - - - - - - - - - - - - - -Oil 0.1 0.8 0.8 1.4 1.9 6.8 29.9 28.4 32.6 34.5 11.7 4.0 3.3 3.7Natural gas 1.7 1.8 2.0 2.8 3.5 93.1 70.1 71.6 67.4 65.5 1.2 2.4 2.4 2.4Nuclear - - - - - - - - - - - - - -Hydro - - - - - - - - - - - - - -Geothermal - - - - - - - - - - - - - -Others 0.0 - - 0.0 0.0 0.1 - - 0.0 0.0 -100.0 - 5.7 -
1990- 2007- 2020- 2007-Sector 1990 2005 2007 2020 2030 1990 2005 2007 2020 2030 2007 2020 2030 2030Total 0.4 0.8 0.9 1.4 1.9 100.0 100.0 100.0 100.0 100.0 4.8 3.1 3.3 3.2
Industry 0.1 0.2 0.2 0.3 0.5 22.7 20.6 21.3 23.0 24.3 4.4 3.7 3.9 3.8Transportation 0.2 0.4 0.5 0.6 0.9 53.3 48.4 48.9 45.6 45.4 4.3 2.6 3.3 2.9Others 0.1 0.2 0.3 0.4 0.6 20.1 28.1 28.2 29.7 28.5 6.9 3.5 2.9 3.2Non-energy 0.0 0.0 0.0 0.0 0.0 4.0 2.9 1.7 1.7 1.7 -0.4 3.0 3.6 3.2
Total 0.4 0.8 0.9 1.4 1.9 100.0 100.0 100.0 100.0 100.0 4.8 3.1 3.3 3.2Coal - - - - - - - - - - - - - -Oil 0.3 0.6 0.6 0.9 1.3 79.0 68.3 68.8 66.0 66.4 3.9 2.8 3.4 3.0Natural gas - - 0.0 0.0 0.1 - - 2.7 2.7 2.6 - 3.1 2.9 3.0Electricity 0.1 0.3 0.3 0.4 0.6 20.5 31.7 28.5 31.2 31.0 6.8 3.8 3.2 3.6Heat - - - - - - - - - - - - - -Others 0.0 - - - - 0.5 - - - - -100.0 - - -
1990- 2007- 2020- 2007-1990 2005 2007 2020 2030 1990 2005 2007 2020 2030 2007 2020 2030 2030
Total 1.2 3.3 3.4 5.5 7.6 100.0 100.0 100.0 100.0 100.0 6.5 3.8 3.2 3.6Coal - - - - - - - - - - - - - -Oil 0.0 0.0 0.0 0.1 0.1 0.9 0.9 1.0 1.1 1.2 6.7 5.0 3.9 4.5Natural gas 1.2 3.2 3.4 5.5 7.5 99.1 99.1 99.0 98.7 98.5 6.5 3.8 3.2 3.5Nuclear - - - - - - - - - - - - - -Hydro - - - - - - - - - - - - - -Geothermal - - - - - - - - - - - - - -Others - - - 0.0 0.0 - - - 0.2 0.3 - - 5.7 -
1990- 2007- 2020- 2007-1990 2005 2007 2020 2030 1990 2005 2007 2020 2030 2007 2020 2030 2030
Total 0.5 1.1 1.2 2.0 2.7 100.0 100.0 100.0 100.0 100.0 5.9 3.8 3.2 3.6Coal - - - - - - - - - - - - - -Oil 0.0 0.0 0.0 0.0 0.0 0.7 0.7 0.7 0.8 0.8 5.9 4.9 3.9 4.5Natural gas 0.5 1.1 1.2 2.0 2.7 99.3 99.3 99.3 99.2 99.2 5.9 3.8 3.2 3.5
1990- 2007- 2020- 2007-1990 2005 2007 2020 2030 1990 2005 2007 2020 2030 2007 2020 2030 2030
Total 21.8 25.8 24.0 24.0 24.0 0.6 0.0 0.0 0.0Coal - - - - - - - - -Oil 30.5 34.5 34.3 34.3 34.3 0.7 0.0 0.0 0.0Natural gas 21.7 25.7 23.9 23.9 23.9 0.6 0.0 0.0 0.0
1990- 2007- 2020- 2007-1990 2005 2007 2020 2030 1990 2005 2007 2020 2030 2007 2020 2030 2030
Total 0.9 1.4 1.6 2.5 3.3 3.3 3.6 2.9 3.3
Energy and economic indicators1990- 2007- 2020- 2007-
1990 2005 2007 2020 2030 2007 2020 2030 20304.8 6.6 7.0 11.49 16.84 2.2 3.9 3.9 3.90.3 0.4 0.4 0.5 0.6 2.5 2.1 2.1 2.1
18.7 17.7 18.0 22.5 26.8 -0.2 1.8 1.8 1.87.0 7.0 7.3 8.1 8.6 0.3 0.8 0.6 0.7
375 397 408 361 321 0.5 -0.9 -1.2 -1.0191 210 228 219 199 1.0 -0.3 -0.9 -0.6
0.51 0.53 0.56 0.61 0.62 0.5 0.6 0.2 0.5
AAGR(%)
AAGR(%)
AAGR(%)
Share, %
Share, %
AAGR(%)
Share, %
%
generation
Power MTOEgeneration
Thermal Efficiency
CO2 emissions Mt-C
Primary energy consumption per GDP (toe/million 2000 US Dollars)
GDP (billions of 2000 US dollars)Population (million of people)GDP per capita (thousands of 2000 USD/person)
CO2 emissions per primary energy consumption (t-C/toe)CO2 emissions per GDP (t-C/million 2000 US Dollars)
Primary energy consumption per capita (toe/person)
BRUNEI DARUSSALAM [BAU]Primary energy Mtoe Share, % AAGR(%)consumption
Share, % AAGR(%)Final energy Mtoe
Input
demand
AAGR(%)Power TWh Share, %

The 3rd ASEAN Energy Outlook124
1990- 2007- 2020- 2007-1990 2005 2007 2020 2030 1990 2005 2007 2020 2030 2007 2020 2030 2030
Total 1.8 2.6 2.8 3.6 4.3 100 100 100 100 100 2.7 1.8 1.8 1.8Coal - - - - - 0.0 0.0 0.0 0.0 0.0 - - - -Oil 0.1 0.8 0.8 1.3 1.8 6.8 29.9 28.4 37.4 43.1 11.7 4.0 3.3 3.7Natural gas 1.7 1.8 2.0 2.2 2.4 93.1 70.1 71.6 62.6 56.9 1.2 0.7 0.9 0.8Nuclear - - - - - 0.0 0.0 0.0 0.0 0.0 - - - -Hydro - - - - - 0.0 0.0 0.0 0.0 0.0 - - - -Geothermal - - - - - 0.0 0.0 0.0 0.0 0.0 - - - -Others 0.0 - - 0.0 0.0 0.1 0.0 0.0 0.0 0.0 -100.0 - 5.7 -
1990- 2007- 2020- 2007-Sector 1990 2005 2007 2020 2030 1990 2005 2007 2020 2030 2007 2020 2030 2030Total 0.4 0.8 0.9 1.4 1.9 100 100 100 100 100 4.8 3.0 3.3 3.1
Industry 0.1 0.2 0.2 0.3 0.5 22.7 20.6 21.3 23.0 24.3 4.4 3.7 3.9 3.7Transportation 0.2 0.4 0.5 0.6 0.9 53.3 48.4 48.9 45.7 45.4 4.3 2.5 3.2 2.8Others 0.1 0.2 0.3 0.4 0.5 20.1 28.1 28.2 29.6 28.5 6.9 3.4 2.9 3.2Non-energy 0.0 0.0 0.0 0.0 0.0 4.0 2.9 1.7 1.7 1.7 -0.4 2.9 3.6 3.2
Total 0.4 0.8 0.9 1.4 1.9 100 100 100 100 100 4.8 3.0 3.3 3.1Coal - - - - - 0.0 0.0 0.0 0.0 0.0 - - - -Oil 0.3 0.6 0.6 0.9 1.3 79.0 68.3 68.8 66.1 66.4 3.9 2.7 3.4 3.0Natural gas - - 0.0 0.0 0.1 0.0 0.0 2.7 2.7 2.6 - 3.0 2.9 3.0Electricity 0.1 0.3 0.3 0.4 0.6 20.5 31.7 28.5 31.2 31.0 6.8 3.8 3.2 3.5Heat - - - - - 0.0 0.0 0.0 0.0 0.0 - - - -Others 0.0 - - - - 0.5 0.0 0.0 0.0 0.0 -100.0 - - -
1990- 2007- 2020- 2007-1990 2005 2007 2020 2030 1990 2005 2007 2020 2030 2007 2020 2030 2030
Total 1.2 3.3 3.4 5.5 7.5 100 100 100 100 100 6.5 3.8 3.2 3.5Coal - - - - - 0.0 0.0 0.0 0.0 0.0 - - - -Oil 0.0 0.0 0.0 0.1 0.1 0.9 0.9 1.0 1.1 1.2 6.7 4.9 3.9 4.5Natural gas 1.2 3.2 3.4 5.4 7.4 99.1 99.1 99.0 98.7 98.5 6.5 3.7 3.2 3.5Nuclear - - - - - 0.0 0.0 0.0 0.0 0.0 - - - -Hydro - - - - - 0.0 0.0 0.0 0.0 0.0 - - - -Geothermal - - - - - 0.0 0.0 0.0 0.0 0.0 - - - -Others - - - 0.0 0.0 0.0 0.0 0.0 0.2 0.3 - - 5.7 -
1990- 2007- 2020- 2007-1990 2005 2007 2020 2030 1990 2005 2007 2020 2030 2007 2020 2030 2030
Total 0.5 1.1 1.2 1.4 1.6 100 100 100 100 100 5.9 1.2 1.3 1.2Coal - - - - - 0.0 0.0 0.0 0.0 0.0 - - - -Oil 0.0 0.0 0.0 0.0 0.0 0.7 0.7 0.7 1.1 1.4 5.9 4.9 3.9 4.5Natural gas 0.5 1.1 1.2 1.4 1.6 99.3 99.3 99.3 98.9 98.6 5.9 1.2 1.2 1.2
1990- 2007- 2020- 2007-1990 2005 2007 2020 2030 1990 2005 2007 2020 2030 2007 2020 2030 2030
Total 21.8 25.8 24.0 33.0 39.9 0.6 2.5 1.9 2.2Coal - - - - - - - - -Oil 30.5 34.5 34.3 34.3 34.3 0.7 0.0 0.0 0.0Natural gas 21.7 25.7 23.9 33.0 40.0 0.6 2.5 1.9 2.3
1990- 2007- 2020- 2007-1990 2005 2007 2020 2030 1990 2005 2007 2020 2030 2007 2020 2030 2030
Total 0.9 1.4 1.6 2.1 2.6 3.3 2.3 2.1 2.2
Energy and economic indicators1990- 2007- 2020- 2007-
1990 2005 2007 2020 2030 2007 2020 2030 20304.8 6.6 7.0 11.5 16.8 2.2 3.9 3.9 3.90.3 0.4 0.4 0.5 0.6 2.5 2.1 2.1 2.1
18.7 17.7 18.0 22.5 26.8 -0.2 1.8 1.8 1.87.0 7.0 7.3 7.0 6.8 0.3 -0.3 -0.3 -0.3
375 397 408 311 255 0.5 -2.0 -2.0 -2.0191 210 228 187 157 1.0 -1.5 -1.8 -1.6
0.51 0.53 0.56 0.60 0.62 0.5 0.6 0.2 0.4
BRUNEI DARUSSALAM [APS]Primary energy Mtoe Share, % AAGR(%)consumption
Final energy Mtoe
Share, %
Share, % AAGR(%)
AAGR(%)generation
Power MTOE
demand
Power TWh
Share, %
AAGR(%)Share, %
Inputgeneration
Primary energy consumption per GDP (toe/million 2000 US Dollars)
GDP (billions of 2000 US dollars)Population (millions of people)GDP per capita (thousands of 2000 USD/person)Primary energy consumption per capita (toe/person)
CO2 emissions per GDP (t-C/million 2000 US Dollars)CO2 emissions per primary energy consumption (t-C/toe)
AAGR(%)
AAGR(%)Efficiency
CO2 emissions Mt-C Share, % AAGR(%)
Thermal %

125The 3rd ASEAN Energy Outlook
1990- 2007- 2020- 2007-1990 2005 2007 2020 2030 1990 2005 2007 2020 2030 2007 2020 2030 2030
Total 3.4 4.8 5.2 9.3 13.2 100.0 100.0 100.0 100.0 100.0 2.5 4.7 3.6 4.2Coal - - - 2.0 2.6 - - - 21.2 19.9 - - 2.9 -Oil 0.5 1.3 1.5 2.7 4.4 14.3 26.9 29.5 29.3 33.5 7.0 4.6 5.0 4.8Natural gas - - - - - - - - - - - - - -Nuclear - - - - - - - - - - - - - -Hydro - 0.0 0.0 0.8 2.0 - 0.1 0.1 8.5 15.3 - 49.5 9.8 30.7Geothermal - - - - - - - - - - - - - -Others 2.9 3.5 3.6 3.8 4.2 85.7 73.0 70.4 40.9 31.4 1.3 0.4 0.8 0.6
1990- 2007- 2020- 2007-Sector 1990 2005 2007 2020 2030 1990 2005 2007 2020 2030 2007 2020 2030 2030Total 3.2 4.4 4.6 7.7 10.9 100.0 100.0 100.0 100.0 100.0 2.3 4.0 3.6 3.8
Industry 0.0 0.1 0.1 1.0 1.6 0.1 1.2 1.7 12.5 14.4 19.9 21.5 5.1 14.1Transportation 0.3 0.4 0.4 0.9 1.7 9.0 10.1 9.1 12.2 15.5 2.4 6.3 6.2 6.2Others 2.9 3.9 4.1 5.8 7.7 90.9 88.7 89.2 75.4 70.1 2.1 2.6 2.8 2.7Non-energy - - - - - - - - - - - - - -
Total 3.2 4.4 4.6 7.7 10.9 100.0 100.0 100.0 100.0 100.0 2.3 4.0 3.6 3.8Coal - - - 0.7 1.0 - - - 9.1 9.2 - - 3.6 -Oil 0.4 0.9 1.0 2.3 3.9 11.6 21.6 22.3 30.6 36.1 6.2 6.5 5.3 6.0Natural gas - - - - - - - - - - - - - -Electricity 0.0 0.1 0.1 0.9 2.0 0.3 1.5 2.5 11.1 17.9 16.0 16.6 8.6 13.1Heat - - - - - - - - - - - - - -Others 2.8 3.4 3.5 3.8 4.0 88.1 76.9 75.2 49.1 36.8 1.3 0.6 0.6 0.6
1990- 2007- 2020- 2007-1990 2005 2007 2020 2030 1990 2005 2007 2020 2030 2007 2020 2030 2030
Total 0.2 0.9 1.3 14.8 30.5 100.0 100.0 100.0 100.0 100.0 11.9 20.2 7.5 14.5Coal - - - 4.5 5.7 - - - 30.3 18.6 - - 2.4 -Oil 0.2 0.8 1.3 1.0 1.3 100.0 95.0 95.9 6.8 4.2 11.7 -1.9 2.4 0.0Natural gas - - - - - - - - - - - - - -Nuclear - - - - - - - - - - - - - -Hydro - 0.0 0.1 9.3 23.6 - 5.0 3.7 62.8 77.2 - 49.5 9.8 30.7Geothermal - - - - - - - - - - - - - -Others - - 0.0 0.0 0.0 - - 0.4 0.0 0.0 - -2.0 2.4 -0.1
1990- 2007- 2020- 2007-1990 2005 2007 2020 2030 1990 2005 2007 2020 2030 2007 2020 2030 2030
Total 0.1 0.3 0.5 1.7 2.1 100.0 100.0 100.0 100.0 100.0 8.9 9.8 2.4 6.5Coal - - - 1.3 1.6 - - - 76.9 76.9 - - 2.4 -Oil 0.1 0.3 0.5 0.4 0.5 100.0 100.0 100.0 23.1 23.1 8.9 -1.9 2.4 0.0Natural gas - - - - - - - - - - - - - -
1990- 2007- 2020- 2007-1990 2005 2007 2020 2030 1990 2005 2007 2020 2030 2007 2020 2030 2030
Total 14.7 21.1 22.5 28.3 28.3 2.5 1.8 0.0 1.0Coal - - - 30.0 30.0 - - 0.0 -Oil 14.7 21.1 22.5 22.5 22.5 2.5 0.0 0.0 0.0Natural gas - - - - - - - - -
1990- 2007- 2020- 2007-1990 2005 2007 2020 2030 1990 2005 2007 2020 2030 2007 2020 2030 2030
Total 0.4 1.0 1.2 4.2 6.2 7.1 10.1 3.8 7.4
Energy and economic indicators1990- 2007- 2020- 2007-
1990 2005 2007 2020 2030 2007 2020 2030 20302.6 5.7 7.0 18.225 34.956 6.1 7.7 6.7 7.3
11.4 14.0 14.4 18.0 21.3 1.4 1.7 1.7 1.70.2 0.4 0.5 1.0 1.6 4.6 5.9 4.9 5.50.3 0.3 0.4 0.5 0.6 1.1 2.9 1.8 2.4
1,318 841 741 512 379 -3.3 -2.8 -3.0 -2.9147 180 174 233 177 1.0 2.3 -2.7 0.1
0.11 0.21 0.23 0.45 0.47 4.5 5.2 0.3 3.0
Input
demand
AAGR(%)Power TWh Share, %
consumption
Share, % AAGR(%)Final energy Mtoe
CAMBODIA [BAU]Primary energy Mtoe Share, % AAGR(%)
Primary energy consumption per GDP (toe/million 2000 US Dollars)
GDP (billions of 2000 US dollars)Population (million of people)GDP per capita (thousands of 2000 USD/person)
CO2 emissions per primary energy consumption (t-C/toe)CO2 emissions per GDP (t-C/million 2000 US Dollars)
Primary energy consumption per capita (toe/person)
%
generation
Power MTOEgeneration
Thermal Efficiency
CO2 emissions Mt-C
AAGR(%)
AAGR(%)
AAGR(%)
Share, %
Share, %
AAGR(%)
Share, %

The 3rd ASEAN Energy Outlook126
1990- 2007- 2020- 2007-1990 2005 2007 2020 2030 1990 2005 2007 2020 2030 2007 2020 2030 2030
Total 3.4 4.8 5.2 8.0 11.3 100 100 100 100 100 2.5 3.4 3.5 3.5Coal - - - 1.7 2.3 0.0 0.0 0.0 21.6 20.0 - - 2.8 -Oil 0.5 1.3 1.5 2.4 3.8 14.3 26.9 29.5 29.4 33.7 7.0 3.4 5.0 4.1Natural gas - - - - - 0.0 0.0 0.0 0.0 0.0 - - - -Nuclear - - - - - 0.0 0.0 0.0 0.0 0.0 - - - -Hydro - 0.0 0.0 0.7 1.8 0.0 0.1 0.1 8.8 15.5 - 48.8 9.6 30.3Geothermal - - - - - 0.0 0.0 0.0 0.0 0.0 - - - -Others 2.9 3.5 3.6 3.2 3.5 85.7 73.0 70.4 40.2 30.8 1.3 -0.9 0.8 -0.2
1990- 2007- 2020- 2007-Sector 1990 2005 2007 2020 2030 1990 2005 2007 2020 2030 2007 2020 2030 2030Total 3.2 4.4 4.6 6.5 9.3 100 100 100 100 100 2.3 2.7 3.6 3.1
Industry 0.0 0.1 0.1 0.8 1.3 0.1 1.2 1.7 12.4 14.3 19.9 20.0 5.1 13.2Transportation 0.3 0.4 0.4 0.8 1.5 9.0 10.1 9.1 12.4 15.9 2.4 5.2 6.2 5.6Others 2.9 3.9 4.1 4.9 6.5 90.9 88.7 89.2 75.2 69.8 2.1 1.4 2.8 2.0Non-energy - - - - - 0.0 0.0 0.0 0.0 0.0 - - - -
Total 3.2 4.4 4.6 6.5 9.3 100 100 100 100 100 2.3 2.7 3.6 3.1Coal - - - 0.6 0.9 0.0 0.0 0.0 9.1 9.1 - - 3.6 -Oil 0.4 0.9 1.0 2.0 3.4 11.6 21.6 22.3 30.8 36.4 6.2 5.3 5.4 5.3Natural gas - - - - - 0.0 0.0 0.0 0.0 0.0 - - - -Electricity 0.0 0.1 0.1 0.7 1.7 0.3 1.5 2.5 11.1 17.9 16.0 15.1 8.6 12.3Heat - - - - - 0.0 0.0 0.0 0.0 0.0 - - - -Others 2.8 3.4 3.5 3.2 3.4 88.1 76.9 75.2 49.0 36.6 1.3 -0.6 0.6 -0.1
1990- 2007- 2020- 2007-1990 2005 2007 2020 2030 1990 2005 2007 2020 2030 2007 2020 2030 2030
Total 0.2 0.9 1.3 13.0 26.5 100 100 100 100 100 11.9 19.0 7.4 13.8Coal - - - 3.9 4.9 0.0 0.0 0.0 30.3 18.6 - - 2.3 -Oil 0.2 0.8 1.3 0.9 1.1 100.0 95.0 95.9 6.8 4.2 11.7 -2.9 2.3 -0.7Natural gas - - - - - 0.0 0.0 0.0 0.0 0.0 - - - -Nuclear - - - - - 0.0 0.0 0.0 0.0 0.0 - - - -Hydro - 0.0 0.1 8.2 20.4 0.0 5.0 3.7 62.8 77.2 - 48.0 9.6 29.9Geothermal - - - - - 0.0 0.0 0.0 0.0 0.0 - - - -Others - - 0.0 0.0 0.0 0.0 0.0 0.4 0.0 0.0 - -3.0 2.3 -0.7
1990- 2007- 2020- 2007-1990 2005 2007 2020 2030 1990 2005 2007 2020 2030 2007 2020 2030 2030
Total 0.1 0.3 0.5 1.5 1.8 100 100 100 100 100 8.9 8.7 2.3 5.9Coal - - - 1.1 1.4 0.0 0.0 0.0 76.9 76.9 - - 2.3 -Oil 0.1 0.3 0.5 0.3 0.4 100.0 100.0 100.0 23.1 23.1 8.9 -2.9 2.3 -0.7Natural gas - - - - - 0.0 0.0 0.0 0.0 0.0 - - - -
1990- 2007- 2020- 2007-1990 2005 2007 2020 2030 1990 2005 2007 2020 2030 2007 2020 2030 2030
Total 14.7 21.1 22.5 28.3 28.3 2.5 1.8 0.0 1.0Coal - - - 30.0 30.0 - - 0.0 -Oil 14.7 21.1 22.5 22.5 22.5 2.5 0.0 0.0 0.0Natural gas - - - - - - - - -
1990- 2007- 2020- 2007-1990 2005 2007 2020 2030 1990 2005 2007 2020 2030 2007 2020 2030 2030
Total 0.4 1.0 1.2 3.7 5.3 7.1 8.9 3.8 6.6
Energy and economic indicators1990- 2007- 2020- 2007-
1990 2005 2007 2020 2030 2007 2020 2030 20302.6 5.7 7.0 18.2 35.0 6.1 7.7 6.7 7.3
11.4 14.0 14.4 18.0 21.3 1.4 1.7 1.7 1.70.2 0.4 0.5 1.0 1.6 4.6 5.9 4.9 5.50.3 0.3 0.4 0.4 0.5 1.1 1.7 1.8 1.7
1,318 841 741 439 324 -3.3 -3.9 -3.0 -3.5147 180 174 201 152 1.0 1.1 -2.8 -0.6
0.11 0.21 0.23 0.46 0.47 4.5 5.3 0.2 3.0
AAGR(%)
AAGR(%)Efficiency
CO2 emissions Mt-C Share, % AAGR(%)
Thermal %
Primary energy consumption per GDP (toe/million 2000 US Dollars)
GDP (billions of 2000 US dollars)Population (millions of people)GDP per capita (thousands of 2000 USD/person)Primary energy consumption per capita (toe/person)
CO2 emissions per GDP (t-C/million 2000 US Dollars)CO2 emissions per primary energy consumption (t-C/toe)
Share, %
AAGR(%)Share, %
Inputgeneration
generation
Power MTOE
demand
Power TWh Share, %
Share, % AAGR(%)
AAGR(%)
consumption
Final energy Mtoe
CAMBODIA [APS]Primary energy Mtoe Share, % AAGR(%)

127The 3rd ASEAN Energy Outlook
1990- 2007- 2020- 2007-1990 2005 2007 2020 2030 1990 2005 2007 2020 2030 2007 2020 2030 2030
Total 102.4 175.2 191.4 344.4 592.9 100.0 100.0 100.0 100.0 100.0 3.7 4.6 5.6 5.0Coal 3.5 23.0 36.8 102.4 209.1 3.4 13.1 19.2 29.7 35.3 14.9 8.2 7.4 7.8Oil 33.9 63.8 60.9 116.6 191.8 33.1 36.4 31.8 33.8 32.3 3.5 5.1 5.1 5.1Natural gas 18.5 30.6 34.4 44.0 88.3 18.1 17.5 18.0 12.8 14.9 3.7 1.9 7.2 4.2Nuclear - - - - - - - - - - - - - -Hydro 0.6 0.9 1.0 2.7 2.7 0.6 0.5 0.5 0.8 0.5 3.1 8.2 0.0 4.6Geothermal 0.9 5.7 6.0 16.6 26.5 0.9 3.2 3.2 4.8 4.5 11.5 8.1 4.8 6.6Others 45.0 51.1 52.4 62.2 74.4 43.9 29.2 27.4 18.1 12.6 0.9 1.3 1.8 1.5
1990- 2007- 2020- 2007-Sector 1990 2005 2007 2020 2030 1990 2005 2007 2020 2030 2007 2020 2030 2030Total 79.2 133.5 145.9 274.2 448.9 100.0 100.0 100.0 100.0 100.0 3.7 5.0 5.1 5.0
Industry 16.7 34.4 47.2 93.6 159.4 21.1 25.7 32.4 34.1 35.5 6.3 5.4 5.5 5.4Transportation 11.0 25.7 25.2 72.2 132.3 13.9 19.3 17.2 26.3 29.5 5.0 8.4 6.2 7.5Others 43.6 61.9 63.4 82.9 111.9 55.1 46.4 43.4 30.2 24.9 2.2 2.1 3.0 2.5Non-energy 7.8 11.5 10.1 25.5 45.4 9.9 8.6 6.9 9.3 10.1 1.5 7.4 6.0 6.8
Total 79.2 133.5 145.9 274.2 448.9 100.0 100.0 100.0 100.0 100.0 3.7 5.0 5.1 5.0Coal 0.6 9.5 20.9 47.5 76.8 0.7 7.1 14.3 17.3 17.1 23.3 6.5 4.9 5.8Oil 27.6 52.4 49.0 107.6 185.5 34.8 39.3 33.6 39.2 41.3 3.4 6.2 5.6 6.0Natural gas 6.6 12.7 14.7 32.0 57.1 8.4 9.5 10.1 11.7 12.7 4.8 6.2 6.0 6.1Electricity 2.3 9.2 10.4 27.0 57.4 2.9 6.9 7.1 9.8 12.8 9.2 7.6 7.8 7.7Heat - - - - - - - - - - - - - -Others 42.1 49.6 50.9 60.2 72.2 53.1 37.2 34.9 22.0 16.1 1.1 1.3 1.8 1.5
1990- 2007- 2020- 2007-1990 2005 2007 2020 2030 1990 2005 2007 2020 2030 2007 2020 2030 2030
Total 33.3 127.4 142.3 368.1 782.9 100.0 100.0 100.0 100.0 100.0 8.9 7.6 7.8 7.7Coal 10.5 51.8 63.9 222.3 533.9 31.5 40.6 44.9 60.4 68.2 11.2 10.1 9.2 9.7Oil 14.2 38.9 37.7 25.4 12.7 42.7 30.6 26.5 6.9 1.6 5.9 -3.0 -6.7 -4.6Natural gas 0.8 19.3 22.4 63.4 165.1 2.3 15.1 15.7 17.2 21.1 22.1 8.3 10.0 9.1Nuclear - - - - - - - - - - - - - -Hydro 6.7 10.8 11.3 31.5 31.5 20.2 8.4 7.9 8.6 4.0 3.1 8.2 0.0 4.6Geothermal 1.1 6.6 7.0 19.3 30.8 3.3 5.2 4.9 5.2 3.9 11.5 8.1 4.8 6.6Others - - - 6.2 8.9 - - - 1.7 1.1 - - 3.7 -
1990- 2007- 2020- 2007-1990 2005 2007 2020 2030 1990 2005 2007 2020 2030 2007 2020 2030 2030
Total 6.5 25.7 28.5 72.9 166.7 100.0 100.0 100.0 100.0 100.0 9.1 7.5 8.6 8.0Coal 2.3 13.5 15.9 55.3 132.7 36.0 52.5 55.7 75.8 79.6 12.0 10.1 9.2 9.7Oil 3.8 8.7 8.4 5.6 2.8 59.1 33.7 29.4 7.7 1.7 4.7 -3.0 -6.7 -4.6Natural gas 0.3 3.5 4.2 12.0 31.2 4.9 13.8 14.9 16.4 18.7 16.4 8.3 10.0 9.1
1990- 2007- 2020- 2007-1990 2005 2007 2020 2030 1990 2005 2007 2020 2030 2007 2020 2030 2030
Total 34.0 36.8 37.4 36.7 36.7 0.6 -0.2 0.0 -0.1Coal 38.9 33.0 34.6 34.6 34.6 -0.7 0.0 0.0 0.0Oil 32.1 38.6 38.7 38.7 38.7 1.1 0.0 0.0 0.0Natural gas 20.2 46.8 45.5 45.5 45.5 4.9 0.0 0.0 0.0
1990- 2007- 2020- 2007-1990 2005 2007 2020 2030 1990 2005 2007 2020 2030 2007 2020 2030 2030
Total 41.6 90.6 93.4 216.7 406.0 4.9 6.7 6.5 6.6
Energy and economic indicators1990- 2007- 2020- 2007-
1990 2005 2007 2020 2030 2007 2020 2030 2030109.2 207.9 233.2 504.8 947.7 4.6 6.1 6.5 6.3178.2 220.6 225.6 260.1 290.2 1.4 1.1 1.1 1.1
0.6 0.9 1.0 1.9 3.3 3.1 5.0 5.3 5.10.6 0.8 0.8 1.3 2.0 2.3 3.5 4.4 3.9
938 843 821 682 626 -0.8 -1.4 -0.9 -1.2381 436 401 429 428 0.3 0.5 0.0 0.3
0.41 0.52 0.49 0.63 0.68 1.1 2.0 0.9 1.5
AAGR(%)
AAGR(%)
AAGR(%)
Share, %
Share, %
AAGR(%)
Share, %
%
generation
Power MTOEgeneration
Thermal Efficiency
CO2 emissions Mt-C
Primary energy consumption per GDP (toe/million 2000 US Dollars)
GDP (billions of 2000 US dollars)Population (million of people)GDP per capita (thousands of 2000 USD/person)
CO2 emissions per primary energy consumption (t-C/toe)CO2 emissions per GDP (t-C/million 2000 US Dollars)
Primary energy consumption per capita (toe/person)
INDONESIA [BAU]Primary energy Mtoe Share, % AAGR(%)consumption
Share, % AAGR(%)Final energy Mtoe
Input
demand
AAGR(%)Power TWh Share, %

The 3rd ASEAN Energy Outlook128
1990- 2007- 2020- 2007-1990 2005 2007 2020 2030 1990 2005 2007 2020 2030 2007 2020 2030 2030
Total 102.4 175.2 191.4 282.3 444.8 100 100 100 100 100 3.7 3.0 4.7 3.7Coal 3.5 23.0 36.8 69.9 131.4 3.4 13.1 19.2 24.8 29.5 14.9 5.1 6.5 5.7Oil 33.9 63.8 60.9 102.8 155.5 33.1 36.4 31.8 36.4 35.0 3.5 4.1 4.2 4.2Natural gas 18.5 30.6 34.4 36.9 68.8 18.1 17.5 18.0 13.1 15.5 3.7 0.5 6.4 3.1Nuclear - - - 0.9 2.0 0.0 0.0 0.0 0.3 0.5 - - 7.9 -Hydro 0.6 0.9 1.0 2.7 2.7 0.6 0.5 0.5 1.0 0.6 3.1 8.2 0.0 4.6Geothermal 0.9 5.7 6.0 16.6 26.5 0.9 3.2 3.2 5.9 6.0 11.5 8.1 4.8 6.6Others 45.0 51.1 52.4 52.5 57.9 43.9 29.2 27.4 18.6 13.0 0.9 0.0 1.0 0.4
1990- 2007- 2020- 2007-Sector 1990 2005 2007 2020 2030 1990 2005 2007 2020 2030 2007 2020 2030 2030Total 79.2 133.5 145.9 233.1 357.8 100 100 100 100 100 3.7 3.7 4.4 4.0
Industry 16.7 34.4 47.2 74.9 119.5 21.1 25.7 32.4 32.1 33.4 6.3 3.6 4.8 4.1Transportation 11.0 25.7 25.2 60.7 100.6 13.9 19.3 17.2 26.1 28.1 5.0 7.0 5.2 6.2Others 43.6 61.9 63.4 72.0 92.2 55.1 46.4 43.4 30.9 25.8 2.2 1.0 2.5 1.6Non-energy 7.8 11.5 10.1 25.5 45.4 9.9 8.6 6.9 10.9 12.7 1.5 7.4 6.0 6.8
Total 79.2 133.5 145.9 233.1 357.8 100 100 100 100 100 3.7 3.7 4.4 4.0Coal 0.6 9.5 20.9 38.0 57.6 0.7 7.1 14.3 16.3 16.1 23.3 4.7 4.2 4.5Oil 27.6 52.4 49.0 93.1 149.2 34.8 39.3 33.6 40.0 41.7 3.4 5.1 4.8 5.0Natural gas 6.6 12.7 14.7 28.7 49.6 8.4 9.5 10.1 12.3 13.9 4.8 5.3 5.6 5.4Electricity 2.3 9.2 10.4 22.8 45.7 2.9 6.9 7.1 9.8 12.8 9.2 6.2 7.2 6.6Heat - - - - - 0.0 0.0 0.0 0.0 0.0 - - - -Others 42.1 49.6 50.9 50.5 55.6 53.1 37.2 34.9 21.6 15.5 1.1 -0.1 1.0 0.4
1990- 2007- 2020- 2007-1990 2005 2007 2020 2030 1990 2005 2007 2020 2030 2007 2020 2030 2030
Total 33.3 127.4 142.3 309.9 618.3 100 100 100 100 100 8.9 6.2 7.2 6.6Coal 10.5 51.8 63.9 168.8 388.1 31.5 40.6 44.9 54.5 62.8 11.2 7.8 8.7 8.2Oil 14.2 38.9 37.7 25.4 12.7 42.7 30.6 26.5 8.2 2.1 5.9 -3.0 -6.7 -4.6Natural gas 0.8 19.3 22.4 47.7 122.9 2.3 15.1 15.7 15.4 19.9 22.1 6.0 9.9 7.7Nuclear - - - 11.0 23.4 0.0 0.0 0.0 3.5 3.8 - - 7.9 -Hydro 6.7 10.8 11.3 31.5 31.5 20.2 8.4 7.9 10.2 5.1 3.1 8.2 0.0 4.6Geothermal 1.1 6.6 7.0 19.3 30.8 3.3 5.2 4.9 6.2 5.0 11.5 8.1 4.8 6.6Others - - - 6.2 8.9 0.0 0.0 0.0 2.0 1.4 - - 3.7 -
1990- 2007- 2020- 2007-1990 2005 2007 2020 2030 1990 2005 2007 2020 2030 2007 2020 2030 2030
Total 6.5 25.7 28.5 46.1 96.2 100 100 100 100 100 9.1 3.8 7.6 5.4Coal 2.3 13.5 15.9 32.3 74.2 36.0 52.5 55.7 70.0 77.1 12.0 5.6 8.7 6.9Oil 3.8 8.7 8.4 5.6 2.8 59.1 33.7 29.4 12.2 2.9 4.7 -3.0 -6.7 -4.6Natural gas 0.3 3.5 4.2 8.2 19.2 4.9 13.8 14.9 17.8 20.0 16.4 5.2 8.9 6.8
1990- 2007- 2020- 2007-1990 2005 2007 2020 2030 1990 2005 2007 2020 2030 2007 2020 2030 2030
Total 34.0 36.8 37.4 45.1 46.8 0.6 1.4 0.4 1.0Coal 38.9 33.0 34.6 45.0 45.0 -0.7 2.0 0.0 1.2Oil 32.1 38.6 38.7 38.7 38.7 1.1 0.0 0.0 0.0Natural gas 20.2 46.8 45.5 50.0 55.0 4.9 0.7 1.0 0.8
1990- 2007- 2020- 2007-1990 2005 2007 2020 2030 1990 2005 2007 2020 2030 2007 2020 2030 2030
Total 41.6 90.6 93.4 165.8 281.2 4.9 4.5 5.4 4.9
Energy and economic indicators1990- 2007- 2020- 2007-
1990 2005 2007 2020 2030 2007 2020 2030 2030109.2 207.9 233.2 504.8 947.7 4.6 6.1 6.5 6.3178.2 220.6 225.6 260.1 290.2 1.4 1.1 1.1 1.1
0.6 0.9 1.0 1.9 3.3 3.1 5.0 5.3 5.10.6 0.8 0.8 1.1 1.5 2.3 1.9 3.5 2.6
938 843 821 559 469 -0.8 -2.9 -1.7 -2.4381 436 401 328 297 0.3 -1.5 -1.0 -1.3
0.41 0.52 0.49 0.59 0.63 1.1 1.4 0.7 1.1
INDONESIA [APS]Primary energy Mtoe Share, % AAGR(%)consumption
Final energy Mtoe
Share, %
Share, % AAGR(%)
AAGR(%)generation
Power MTOE
demand
Power TWh
Share, %
AAGR(%)Share, %
Inputgeneration
Primary energy consumption per GDP (toe/million 2000 US Dollars)
GDP (billions of 2000 US dollars)Population (millions of people)GDP per capita (thousands of 2000 USD/person)Primary energy consumption per capita (toe/person)
CO2 emissions per GDP (t-C/million 2000 US Dollars)CO2 emissions per primary energy consumption (t-C/toe)
AAGR(%)
AAGR(%)Efficiency
CO2 emissions Mt-C Share, % AAGR(%)
Thermal %
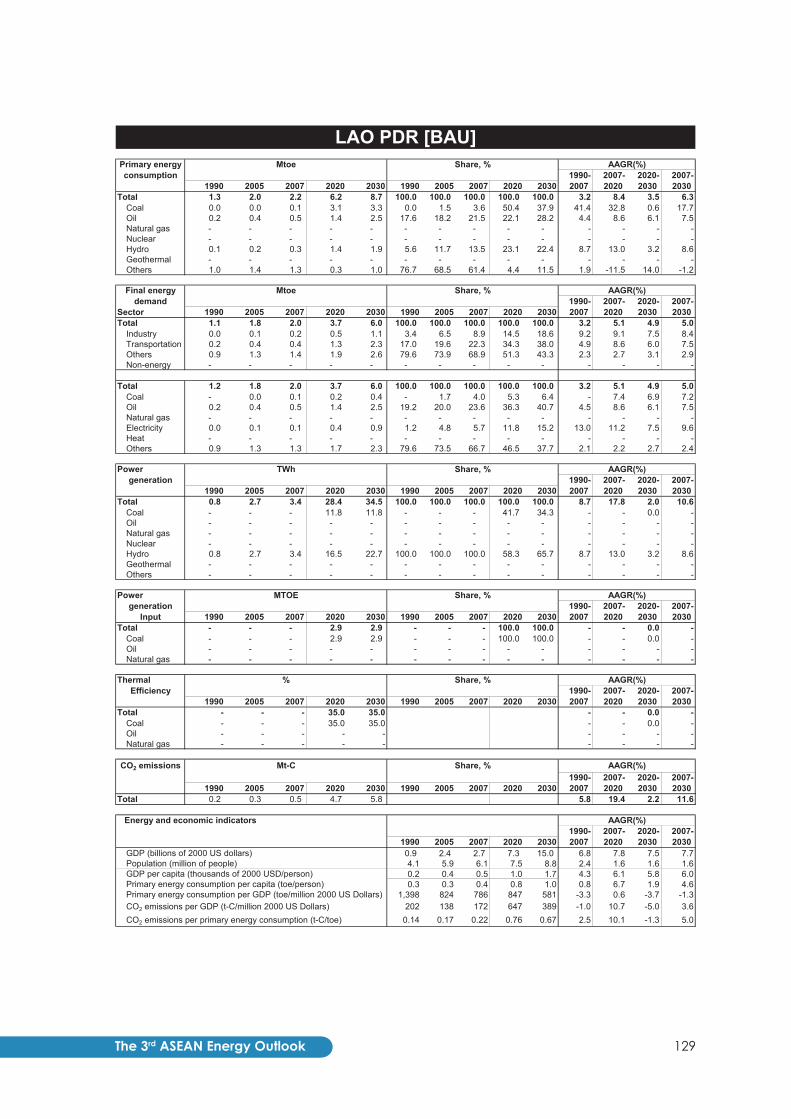
129The 3rd ASEAN Energy Outlook
1990- 2007- 2020- 2007-1990 2005 2007 2020 2030 1990 2005 2007 2020 2030 2007 2020 2030 2030
Total 1.3 2.0 2.2 6.2 8.7 100.0 100.0 100.0 100.0 100.0 3.2 8.4 3.5 6.3Coal 0.0 0.0 0.1 3.1 3.3 0.0 1.5 3.6 50.4 37.9 41.4 32.8 0.6 17.7Oil 0.2 0.4 0.5 1.4 2.5 17.6 18.2 21.5 22.1 28.2 4.4 8.6 6.1 7.5Natural gas - - - - - - - - - - - - - -Nuclear - - - - - - - - - - - - - -Hydro 0.1 0.2 0.3 1.4 1.9 5.6 11.7 13.5 23.1 22.4 8.7 13.0 3.2 8.6Geothermal - - - - - - - - - - - - - -Others 1.0 1.4 1.3 0.3 1.0 76.7 68.5 61.4 4.4 11.5 1.9 -11.5 14.0 -1.2
1990- 2007- 2020- 2007-Sector 1990 2005 2007 2020 2030 1990 2005 2007 2020 2030 2007 2020 2030 2030Total 1.1 1.8 2.0 3.7 6.0 100.0 100.0 100.0 100.0 100.0 3.2 5.1 4.9 5.0
Industry 0.0 0.1 0.2 0.5 1.1 3.4 6.5 8.9 14.5 18.6 9.2 9.1 7.5 8.4Transportation 0.2 0.4 0.4 1.3 2.3 17.0 19.6 22.3 34.3 38.0 4.9 8.6 6.0 7.5Others 0.9 1.3 1.4 1.9 2.6 79.6 73.9 68.9 51.3 43.3 2.3 2.7 3.1 2.9Non-energy - - - - - - - - - - - - - -
Total 1.2 1.8 2.0 3.7 6.0 100.0 100.0 100.0 100.0 100.0 3.2 5.1 4.9 5.0Coal - 0.0 0.1 0.2 0.4 - 1.7 4.0 5.3 6.4 - 7.4 6.9 7.2Oil 0.2 0.4 0.5 1.4 2.5 19.2 20.0 23.6 36.3 40.7 4.5 8.6 6.1 7.5Natural gas - - - - - - - - - - - - - -Electricity 0.0 0.1 0.1 0.4 0.9 1.2 4.8 5.7 11.8 15.2 13.0 11.2 7.5 9.6Heat - - - - - - - - - - - - - -Others 0.9 1.3 1.3 1.7 2.3 79.6 73.5 66.7 46.5 37.7 2.1 2.2 2.7 2.4
1990- 2007- 2020- 2007-1990 2005 2007 2020 2030 1990 2005 2007 2020 2030 2007 2020 2030 2030
Total 0.8 2.7 3.4 28.4 34.5 100.0 100.0 100.0 100.0 100.0 8.7 17.8 2.0 10.6Coal - - - 11.8 11.8 - - - 41.7 34.3 - - 0.0 -Oil - - - - - - - - - - - - - -Natural gas - - - - - - - - - - - - - -Nuclear - - - - - - - - - - - - - -Hydro 0.8 2.7 3.4 16.5 22.7 100.0 100.0 100.0 58.3 65.7 8.7 13.0 3.2 8.6Geothermal - - - - - - - - - - - - - -Others - - - - - - - - - - - - - -
1990- 2007- 2020- 2007-1990 2005 2007 2020 2030 1990 2005 2007 2020 2030 2007 2020 2030 2030
Total - - - 2.9 2.9 - - - 100.0 100.0 - - 0.0 -Coal - - - 2.9 2.9 - - - 100.0 100.0 - - 0.0 -Oil - - - - - - - - - - - - - -Natural gas - - - - - - - - - - - - - -
1990- 2007- 2020- 2007-1990 2005 2007 2020 2030 1990 2005 2007 2020 2030 2007 2020 2030 2030
Total - - - 35.0 35.0 - - 0.0 -Coal - - - 35.0 35.0 - - 0.0 -Oil - - - - - - - - -Natural gas - - - - - - - - -
1990- 2007- 2020- 2007-1990 2005 2007 2020 2030 1990 2005 2007 2020 2030 2007 2020 2030 2030
Total 0.2 0.3 0.5 4.7 5.8 5.8 19.4 2.2 11.6
Energy and economic indicators1990- 2007- 2020- 2007-
1990 2005 2007 2020 2030 2007 2020 2030 20300.9 2.4 2.7 7.3 15.0 6.8 7.8 7.5 7.74.1 5.9 6.1 7.5 8.8 2.4 1.6 1.6 1.60.2 0.4 0.5 1.0 1.7 4.3 6.1 5.8 6.00.3 0.3 0.4 0.8 1.0 0.8 6.7 1.9 4.6
1,398 824 786 847 581 -3.3 0.6 -3.7 -1.3202 138 172 647 389 -1.0 10.7 -5.0 3.6
0.14 0.17 0.22 0.76 0.67 2.5 10.1 -1.3 5.0
AAGR(%)
AAGR(%)
AAGR(%)
Share, %
Share, %
AAGR(%)
Share, %
%
generation
Power MTOEgeneration
Thermal Efficiency
CO2 emissions Mt-C
Primary energy consumption per GDP (toe/million 2000 US Dollars)
GDP (billions of 2000 US dollars)Population (million of people)GDP per capita (thousands of 2000 USD/person)
CO2 emissions per primary energy consumption (t-C/toe)CO2 emissions per GDP (t-C/million 2000 US Dollars)
Primary energy consumption per capita (toe/person)
LAO PDR [BAU]Primary energy Mtoe Share, % AAGR(%)consumption
Share, % AAGR(%)Final energy Mtoe
Input
demand
AAGR(%)Power TWh Share, %
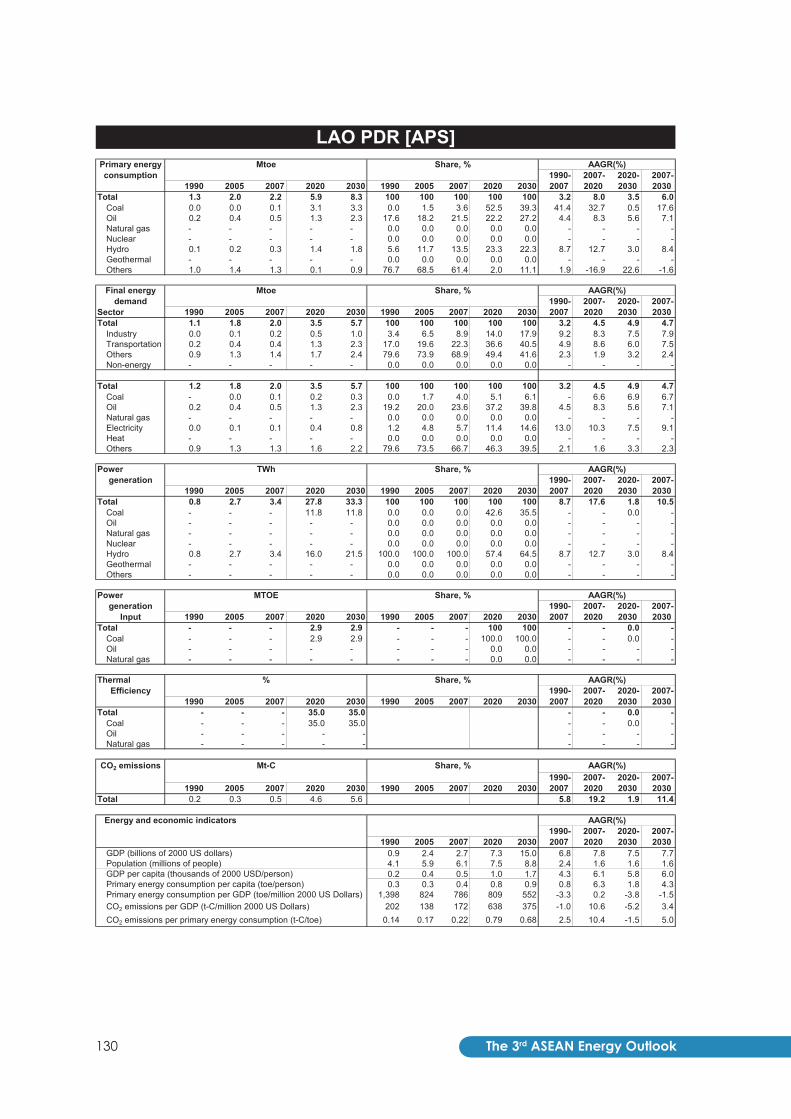
The 3rd ASEAN Energy Outlook130
1990- 2007- 2020- 2007-1990 2005 2007 2020 2030 1990 2005 2007 2020 2030 2007 2020 2030 2030
Total 1.3 2.0 2.2 5.9 8.3 100 100 100 100 100 3.2 8.0 3.5 6.0Coal 0.0 0.0 0.1 3.1 3.3 0.0 1.5 3.6 52.5 39.3 41.4 32.7 0.5 17.6Oil 0.2 0.4 0.5 1.3 2.3 17.6 18.2 21.5 22.2 27.2 4.4 8.3 5.6 7.1Natural gas - - - - - 0.0 0.0 0.0 0.0 0.0 - - - -Nuclear - - - - - 0.0 0.0 0.0 0.0 0.0 - - - -Hydro 0.1 0.2 0.3 1.4 1.8 5.6 11.7 13.5 23.3 22.3 8.7 12.7 3.0 8.4Geothermal - - - - - 0.0 0.0 0.0 0.0 0.0 - - - -Others 1.0 1.4 1.3 0.1 0.9 76.7 68.5 61.4 2.0 11.1 1.9 -16.9 22.6 -1.6
1990- 2007- 2020- 2007-Sector 1990 2005 2007 2020 2030 1990 2005 2007 2020 2030 2007 2020 2030 2030Total 1.1 1.8 2.0 3.5 5.7 100 100 100 100 100 3.2 4.5 4.9 4.7
Industry 0.0 0.1 0.2 0.5 1.0 3.4 6.5 8.9 14.0 17.9 9.2 8.3 7.5 7.9Transportation 0.2 0.4 0.4 1.3 2.3 17.0 19.6 22.3 36.6 40.5 4.9 8.6 6.0 7.5Others 0.9 1.3 1.4 1.7 2.4 79.6 73.9 68.9 49.4 41.6 2.3 1.9 3.2 2.4Non-energy - - - - - 0.0 0.0 0.0 0.0 0.0 - - - -
Total 1.2 1.8 2.0 3.5 5.7 100 100 100 100 100 3.2 4.5 4.9 4.7Coal - 0.0 0.1 0.2 0.3 0.0 1.7 4.0 5.1 6.1 - 6.6 6.9 6.7Oil 0.2 0.4 0.5 1.3 2.3 19.2 20.0 23.6 37.2 39.8 4.5 8.3 5.6 7.1Natural gas - - - - - 0.0 0.0 0.0 0.0 0.0 - - - -Electricity 0.0 0.1 0.1 0.4 0.8 1.2 4.8 5.7 11.4 14.6 13.0 10.3 7.5 9.1Heat - - - - - 0.0 0.0 0.0 0.0 0.0 - - - -Others 0.9 1.3 1.3 1.6 2.2 79.6 73.5 66.7 46.3 39.5 2.1 1.6 3.3 2.3
1990- 2007- 2020- 2007-1990 2005 2007 2020 2030 1990 2005 2007 2020 2030 2007 2020 2030 2030
Total 0.8 2.7 3.4 27.8 33.3 100 100 100 100 100 8.7 17.6 1.8 10.5Coal - - - 11.8 11.8 0.0 0.0 0.0 42.6 35.5 - - 0.0 -Oil - - - - - 0.0 0.0 0.0 0.0 0.0 - - - -Natural gas - - - - - 0.0 0.0 0.0 0.0 0.0 - - - -Nuclear - - - - - 0.0 0.0 0.0 0.0 0.0 - - - -Hydro 0.8 2.7 3.4 16.0 21.5 100.0 100.0 100.0 57.4 64.5 8.7 12.7 3.0 8.4Geothermal - - - - - 0.0 0.0 0.0 0.0 0.0 - - - -Others - - - - - 0.0 0.0 0.0 0.0 0.0 - - - -
1990- 2007- 2020- 2007-1990 2005 2007 2020 2030 1990 2005 2007 2020 2030 2007 2020 2030 2030
Total - - - 2.9 2.9 - - - 100 100 - - 0.0 -Coal - - - 2.9 2.9 - - - 100.0 100.0 - - 0.0 -Oil - - - - - - - - 0.0 0.0 - - - -Natural gas - - - - - - - - 0.0 0.0 - - - -
1990- 2007- 2020- 2007-1990 2005 2007 2020 2030 1990 2005 2007 2020 2030 2007 2020 2030 2030
Total - - - 35.0 35.0 - - 0.0 -Coal - - - 35.0 35.0 - - 0.0 -Oil - - - - - - - - -Natural gas - - - - - - - - -
1990- 2007- 2020- 2007-1990 2005 2007 2020 2030 1990 2005 2007 2020 2030 2007 2020 2030 2030
Total 0.2 0.3 0.5 4.6 5.6 5.8 19.2 1.9 11.4
Energy and economic indicators1990- 2007- 2020- 2007-
1990 2005 2007 2020 2030 2007 2020 2030 20300.9 2.4 2.7 7.3 15.0 6.8 7.8 7.5 7.74.1 5.9 6.1 7.5 8.8 2.4 1.6 1.6 1.60.2 0.4 0.5 1.0 1.7 4.3 6.1 5.8 6.00.3 0.3 0.4 0.8 0.9 0.8 6.3 1.8 4.3
1,398 824 786 809 552 -3.3 0.2 -3.8 -1.5202 138 172 638 375 -1.0 10.6 -5.2 3.4
0.14 0.17 0.22 0.79 0.68 2.5 10.4 -1.5 5.0
LAO PDR [APS]Primary energy Mtoe Share, % AAGR(%)consumption
Final energy Mtoe
Share, %
Share, % AAGR(%)
AAGR(%)generation
Power MTOE
demand
Power TWh
Share, %
AAGR(%)Share, %
Inputgeneration
Primary energy consumption per GDP (toe/million 2000 US Dollars)
GDP (billions of 2000 US dollars)Population (millions of people)GDP per capita (thousands of 2000 USD/person)Primary energy consumption per capita (toe/person)
CO2 emissions per GDP (t-C/million 2000 US Dollars)CO2 emissions per primary energy consumption (t-C/toe)
AAGR(%)
AAGR(%)Efficiency
CO2 emissions Mt-C Share, % AAGR(%)
Thermal %
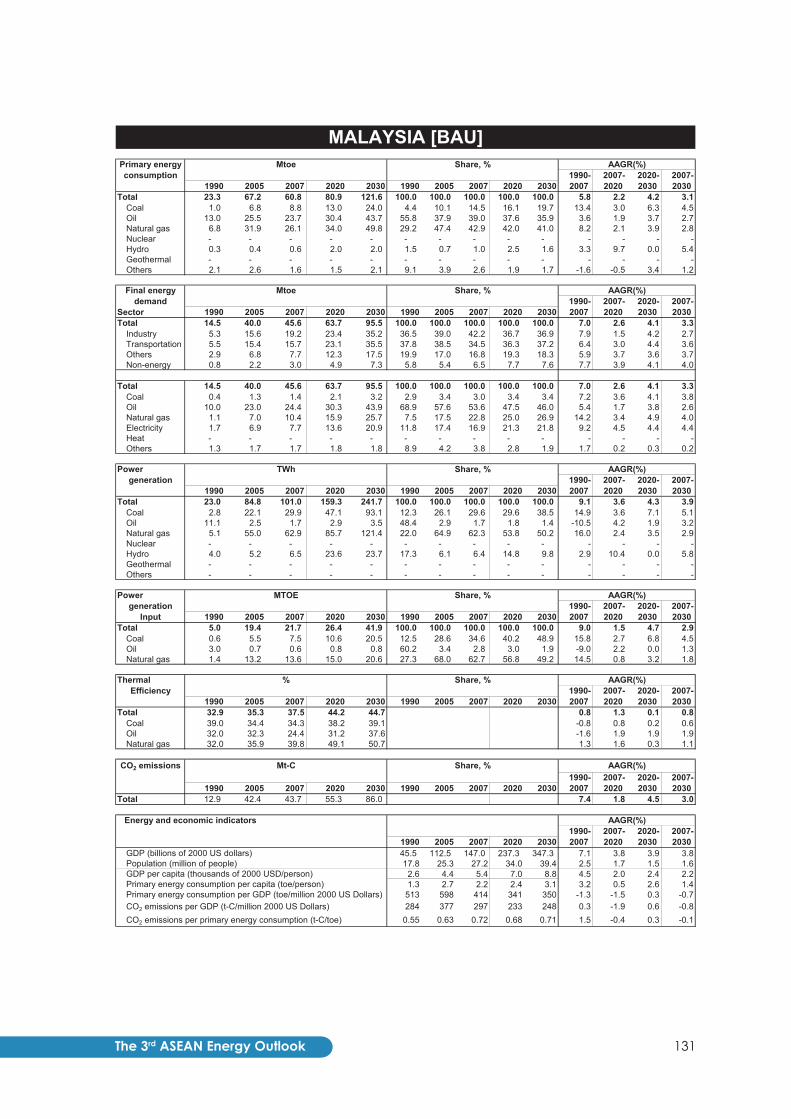
131The 3rd ASEAN Energy Outlook
1990- 2007- 2020- 2007-1990 2005 2007 2020 2030 1990 2005 2007 2020 2030 2007 2020 2030 2030
Total 23.3 67.2 60.8 80.9 121.6 100.0 100.0 100.0 100.0 100.0 5.8 2.2 4.2 3.1Coal 1.0 6.8 8.8 13.0 24.0 4.4 10.1 14.5 16.1 19.7 13.4 3.0 6.3 4.5Oil 13.0 25.5 23.7 30.4 43.7 55.8 37.9 39.0 37.6 35.9 3.6 1.9 3.7 2.7Natural gas 6.8 31.9 26.1 34.0 49.8 29.2 47.4 42.9 42.0 41.0 8.2 2.1 3.9 2.8Nuclear - - - - - - - - - - - - - -Hydro 0.3 0.4 0.6 2.0 2.0 1.5 0.7 1.0 2.5 1.6 3.3 9.7 0.0 5.4Geothermal - - - - - - - - - - - - - -Others 2.1 2.6 1.6 1.5 2.1 9.1 3.9 2.6 1.9 1.7 -1.6 -0.5 3.4 1.2
1990- 2007- 2020- 2007-Sector 1990 2005 2007 2020 2030 1990 2005 2007 2020 2030 2007 2020 2030 2030Total 14.5 40.0 45.6 63.7 95.5 100.0 100.0 100.0 100.0 100.0 7.0 2.6 4.1 3.3
Industry 5.3 15.6 19.2 23.4 35.2 36.5 39.0 42.2 36.7 36.9 7.9 1.5 4.2 2.7Transportation 5.5 15.4 15.7 23.1 35.5 37.8 38.5 34.5 36.3 37.2 6.4 3.0 4.4 3.6Others 2.9 6.8 7.7 12.3 17.5 19.9 17.0 16.8 19.3 18.3 5.9 3.7 3.6 3.7Non-energy 0.8 2.2 3.0 4.9 7.3 5.8 5.4 6.5 7.7 7.6 7.7 3.9 4.1 4.0
Total 14.5 40.0 45.6 63.7 95.5 100.0 100.0 100.0 100.0 100.0 7.0 2.6 4.1 3.3Coal 0.4 1.3 1.4 2.1 3.2 2.9 3.4 3.0 3.4 3.4 7.2 3.6 4.1 3.8Oil 10.0 23.0 24.4 30.3 43.9 68.9 57.6 53.6 47.5 46.0 5.4 1.7 3.8 2.6Natural gas 1.1 7.0 10.4 15.9 25.7 7.5 17.5 22.8 25.0 26.9 14.2 3.4 4.9 4.0Electricity 1.7 6.9 7.7 13.6 20.9 11.8 17.4 16.9 21.3 21.8 9.2 4.5 4.4 4.4Heat - - - - - - - - - - - - - -Others 1.3 1.7 1.7 1.8 1.8 8.9 4.2 3.8 2.8 1.9 1.7 0.2 0.3 0.2
1990- 2007- 2020- 2007-1990 2005 2007 2020 2030 1990 2005 2007 2020 2030 2007 2020 2030 2030
Total 23.0 84.8 101.0 159.3 241.7 100.0 100.0 100.0 100.0 100.0 9.1 3.6 4.3 3.9Coal 2.8 22.1 29.9 47.1 93.1 12.3 26.1 29.6 29.6 38.5 14.9 3.6 7.1 5.1Oil 11.1 2.5 1.7 2.9 3.5 48.4 2.9 1.7 1.8 1.4 -10.5 4.2 1.9 3.2Natural gas 5.1 55.0 62.9 85.7 121.4 22.0 64.9 62.3 53.8 50.2 16.0 2.4 3.5 2.9Nuclear - - - - - - - - - - - - - -Hydro 4.0 5.2 6.5 23.6 23.7 17.3 6.1 6.4 14.8 9.8 2.9 10.4 0.0 5.8Geothermal - - - - - - - - - - - - - -Others - - - - - - - - - - - - - -
1990- 2007- 2020- 2007-1990 2005 2007 2020 2030 1990 2005 2007 2020 2030 2007 2020 2030 2030
Total 5.0 19.4 21.7 26.4 41.9 100.0 100.0 100.0 100.0 100.0 9.0 1.5 4.7 2.9Coal 0.6 5.5 7.5 10.6 20.5 12.5 28.6 34.6 40.2 48.9 15.8 2.7 6.8 4.5Oil 3.0 0.7 0.6 0.8 0.8 60.2 3.4 2.8 3.0 1.9 -9.0 2.2 0.0 1.3Natural gas 1.4 13.2 13.6 15.0 20.6 27.3 68.0 62.7 56.8 49.2 14.5 0.8 3.2 1.8
1990- 2007- 2020- 2007-1990 2005 2007 2020 2030 1990 2005 2007 2020 2030 2007 2020 2030 2030
Total 32.9 35.3 37.5 44.2 44.7 0.8 1.3 0.1 0.8Coal 39.0 34.4 34.3 38.2 39.1 -0.8 0.8 0.2 0.6Oil 32.0 32.3 24.4 31.2 37.6 -1.6 1.9 1.9 1.9Natural gas 32.0 35.9 39.8 49.1 50.7 1.3 1.6 0.3 1.1
1990- 2007- 2020- 2007-1990 2005 2007 2020 2030 1990 2005 2007 2020 2030 2007 2020 2030 2030
Total 12.9 42.4 43.7 55.3 86.0 7.4 1.8 4.5 3.0
Energy and economic indicators1990- 2007- 2020- 2007-
1990 2005 2007 2020 2030 2007 2020 2030 203045.5 112.5 147.0 237.3 347.3 7.1 3.8 3.9 3.817.8 25.3 27.2 34.0 39.4 2.5 1.7 1.5 1.6
2.6 4.4 5.4 7.0 8.8 4.5 2.0 2.4 2.21.3 2.7 2.2 2.4 3.1 3.2 0.5 2.6 1.4
513 598 414 341 350 -1.3 -1.5 0.3 -0.7284 377 297 233 248 0.3 -1.9 0.6 -0.8
0.55 0.63 0.72 0.68 0.71 1.5 -0.4 0.3 -0.1
Input
demand
AAGR(%)Power TWh Share, %
consumption
Share, % AAGR(%)Final energy Mtoe
MALAYSIA [BAU]Primary energy Mtoe Share, % AAGR(%)
Primary energy consumption per GDP (toe/million 2000 US Dollars)
GDP (billions of 2000 US dollars)Population (million of people)GDP per capita (thousands of 2000 USD/person)
CO2 emissions per primary energy consumption (t-C/toe)CO2 emissions per GDP (t-C/million 2000 US Dollars)
Primary energy consumption per capita (toe/person)
%
generation
Power MTOEgeneration
Thermal Efficiency
CO2 emissions Mt-C
AAGR(%)
AAGR(%)
AAGR(%)
Share, %
Share, %
AAGR(%)
Share, %

The 3rd ASEAN Energy Outlook132
1990- 2007- 2020- 2007-1990 2005 2007 2020 2030 1990 2005 2007 2020 2030 2007 2020 2030 2030
Total 23.3 67.2 60.8 71.6 96.3 100 100 100 100 100 5.8 1.3 3.0 2.0Coal 1.0 6.8 8.8 11.5 16.3 4.4 10.1 14.5 16.1 16.9 13.4 2.1 3.5 2.7Oil 13.0 25.5 23.7 25.4 28.2 55.8 37.9 39.0 35.5 29.3 3.6 0.5 1.1 0.8Natural gas 6.8 31.9 26.1 31.0 44.1 29.2 47.4 42.9 43.3 45.8 8.2 1.3 3.6 2.3Nuclear - - - - 1.8 0.0 0.0 0.0 0.0 1.9 - - - -Hydro 0.3 0.4 0.6 2.0 2.1 1.5 0.7 1.0 2.8 2.2 3.3 9.7 0.5 5.6Geothermal - - - - - 0.0 0.0 0.0 0.0 0.0 - - - -Others 2.1 2.6 1.6 1.7 3.8 9.1 3.9 2.6 2.4 3.9 -1.6 0.5 8.4 3.8
1990- 2007- 2020- 2007-Sector 1990 2005 2007 2020 2030 1990 2005 2007 2020 2030 2007 2020 2030 2030Total 14.5 40.0 45.6 56.2 73.7 100 100 100 100 100 7.0 1.6 2.8 2.1
Industry 5.3 15.6 19.2 21.1 30.0 36.5 39.0 42.2 37.6 40.7 7.9 0.7 3.6 2.0Transportation 5.5 15.4 15.7 18.6 20.5 37.8 38.5 34.5 33.1 27.8 6.4 1.3 1.0 1.2Others 2.9 6.8 7.7 11.6 15.9 19.9 17.0 16.8 20.6 21.5 5.9 3.2 3.2 3.2Non-energy 0.8 2.2 3.0 4.9 7.3 5.8 5.4 6.5 8.7 9.9 7.7 3.9 4.1 4.0
Total 14.5 40.0 45.6 56.2 73.7 100 100 100 100 100 7.0 1.6 2.8 2.1Coal 0.4 1.3 1.4 1.9 2.7 2.9 3.4 3.0 3.4 3.7 7.2 2.7 3.5 3.1Oil 10.0 23.0 24.4 25.3 28.4 68.9 57.6 53.6 45.0 38.6 5.4 0.3 1.2 0.7Natural gas 1.1 7.0 10.4 14.7 22.8 7.5 17.5 22.8 26.2 30.9 14.2 2.7 4.4 3.5Electricity 1.7 6.9 7.7 12.2 17.7 11.8 17.4 16.9 21.8 24.1 9.2 3.6 3.8 3.7Heat - - - - - 0.0 0.0 0.0 0.0 0.0 - - - -Others 1.3 1.7 1.7 2.0 2.0 8.9 4.2 3.8 3.6 2.8 1.7 1.1 0.2 0.7
1990- 2007- 2020- 2007-1990 2005 2007 2020 2030 1990 2005 2007 2020 2030 2007 2020 2030 2030
Total 23.0 84.8 101.0 143.1 204.4 100 100 100 100 100 9.1 2.7 3.6 3.1Coal 2.8 22.1 29.9 41.5 60.5 12.3 26.1 29.6 29.0 29.6 14.9 2.6 3.8 3.1Oil 11.1 2.5 1.7 2.5 3.5 48.4 2.9 1.7 1.7 1.7 -10.5 3.0 3.4 3.2Natural gas 5.1 55.0 62.9 75.5 103.7 22.0 64.9 62.3 52.8 50.7 16.0 1.4 3.2 2.2Nuclear - - - - 6.8 0.0 0.0 0.0 0.0 3.3 - - - -Hydro 4.0 5.2 6.5 23.6 24.5 17.3 6.1 6.4 16.5 12.0 2.9 10.4 0.4 5.9Geothermal - - - - - 0.0 0.0 0.0 0.0 0.0 - - - -Others - - - - 5.4 0.0 0.0 0.0 0.0 2.6 - - - -
1990- 2007- 2020- 2007-1990 2005 2007 2020 2030 1990 2005 2007 2020 2030 2007 2020 2030 2030
Total 5.0 19.4 21.7 23.1 31.9 100 100 100 100 100 9.0 0.5 3.3 1.7Coal 0.6 5.5 7.5 9.3 13.3 12.5 28.6 34.6 40.3 41.7 15.8 1.7 3.6 2.5Oil 3.0 0.7 0.6 0.6 0.8 60.2 3.4 2.8 2.6 2.5 -9.0 0.0 2.9 1.3Natural gas 1.4 13.2 13.6 13.2 17.8 27.3 68.0 62.7 57.1 55.8 14.5 -0.2 3.0 1.2
1990- 2007- 2020- 2007-1990 2005 2007 2020 2030 1990 2005 2007 2020 2030 2007 2020 2030 2030
Total 32.9 35.3 37.5 44.5 45.2 0.8 1.3 0.2 0.8Coal 39.0 34.4 34.3 38.4 39.1 -0.8 0.9 0.2 0.6Oil 32.0 32.3 24.4 35.8 37.6 -1.6 3.0 0.5 1.9Natural gas 32.0 35.9 39.8 49.2 50.1 1.3 1.6 0.2 1.0
1990- 2007- 2020- 2007-1990 2005 2007 2020 2030 1990 2005 2007 2020 2030 2007 2020 2030 2030
Total 12.9 42.4 43.7 47.7 61.6 7.4 0.7 2.6 1.5
Energy and economic indicators1990- 2007- 2020- 2007-
1990 2005 2007 2020 2030 2007 2020 2030 203045.5 112.5 147.0 237.3 347.3 7.1 3.8 3.9 3.817.8 25.3 27.2 34.0 39.4 2.5 1.7 1.5 1.6
2.6 4.4 5.4 7.0 8.8 4.5 2.0 2.4 2.21.3 2.7 2.2 2.1 2.4 3.2 -0.5 1.5 0.4
513 598 414 302 277 -1.3 -2.4 -0.8 -1.7284 377 297 201 177 0.3 -3.0 -1.2 -2.2
0.55 0.63 0.72 0.67 0.64 1.5 -0.6 -0.4 -0.5
AAGR(%)
AAGR(%)Efficiency
CO2 emissions Mt-C Share, % AAGR(%)
Thermal %
Primary energy consumption per GDP (toe/million 2000 US Dollars)
GDP (billions of 2000 US dollars)Population (millions of people)GDP per capita (thousands of 2000 USD/person)Primary energy consumption per capita (toe/person)
CO2 emissions per GDP (t-C/million 2000 US Dollars)CO2 emissions per primary energy consumption (t-C/toe)
Share, %
AAGR(%)Share, %
Inputgeneration
generation
Power MTOE
demand
Power TWh Share, %
Share, % AAGR(%)
AAGR(%)
consumption
Final energy Mtoe
MALAYSIA [APS]Primary energy Mtoe Share, % AAGR(%)

133The 3rd ASEAN Energy Outlook
1990- 2007- 2020- 2007-1990 2005 2007 2020 2030 1990 2005 2007 2020 2030 2007 2020 2030 2030
Total 10.7 16.0 15.7 23.8 35.2 100.0 100.0 100.0 100.0 100.0 2.3 3.2 4.0 3.6Coal 0.1 0.1 0.1 0.4 0.7 0.6 0.7 0.8 1.8 2.0 4.8 9.5 5.0 7.5Oil 0.7 2.0 1.8 4.8 9.7 6.9 12.5 11.7 20.0 27.5 5.5 7.6 7.4 7.5Natural gas 0.8 3.5 3.1 5.5 9.4 7.1 21.6 19.5 23.3 26.7 8.5 4.7 5.4 5.0Nuclear - - - - - - - - - - - - - -Hydro 0.1 0.3 0.3 6.1 13.4 1.0 1.6 1.9 25.8 38.0 6.5 26.1 8.1 17.9Geothermal - - - - - - - - - - - - - -Others 9.0 10.2 10.4 6.9 2.0 84.5 63.6 66.0 29.1 5.8 0.8 -3.1 -11.5 -6.8
1990- 2007- 2020- 2007-Sector 1990 2005 2007 2020 2030 1990 2005 2007 2020 2030 2007 2020 2030 2030Total 9.4 14.2 14.0 21.6 32.6 100.0 100.0 100.0 100.0 100.0 2.4 3.4 4.2 3.7
Industry 0.4 1.4 1.4 2.8 5.0 4.2 10.1 9.9 12.8 15.4 7.7 5.4 6.1 5.7Transportation 0.5 1.3 1.4 3.9 8.5 4.8 9.4 9.8 18.2 26.1 6.8 8.5 8.0 8.3Others 8.5 11.2 11.0 14.4 18.0 90.0 78.7 78.7 66.4 55.2 1.6 2.1 2.3 2.2Non-energy 0.1 0.3 0.2 0.6 1.1 1.0 1.9 1.7 2.6 3.3 5.5 6.9 6.7 6.8
Total 9.4 14.2 14.0 21.6 32.6 100.0 100.0 100.0 100.0 100.0 2.4 3.4 4.2 3.7Coal 0.0 0.1 0.1 0.3 0.6 0.5 0.8 0.9 1.3 1.7 6.2 5.9 7.1 6.4Oil 0.6 1.8 1.7 4.5 9.5 6.3 12.3 12.5 21.0 29.1 6.6 7.6 7.6 7.6Natural gas 0.2 2.2 1.8 4.4 8.3 2.4 15.6 12.5 20.3 25.3 12.9 7.3 6.5 7.0Electricity 0.1 0.3 0.4 0.8 1.4 1.6 2.2 2.8 3.7 4.3 5.8 5.6 6.0 5.8Heat - - - - - - - - - - - - - -Others 8.4 9.8 10.0 11.6 12.9 89.2 69.1 71.3 53.8 39.6 1.0 1.2 1.0 1.1
1990- 2007- 2020- 2007-1990 2005 2007 2020 2030 1990 2005 2007 2020 2030 2007 2020 2030 2030
Total 2.5 6.0 6.5 75.1 159.2 100.0 100.0 100.0 100.0 100.0 5.8 20.7 7.8 14.9Coal 0.0 - - 0.5 0.5 1.6 - - 0.7 0.3 -100.0 - 0.0 -Oil 0.3 0.6 0.3 - - 10.9 10.3 4.5 - - 0.4 -100.0 - -100.0Natural gas 1.0 2.4 2.7 3.2 3.2 39.3 39.8 41.6 4.2 2.0 6.2 1.2 0.0 0.7Nuclear - - - - - - - - - - - - - -Hydro 1.2 3.0 3.5 71.4 155.5 48.1 49.8 53.9 95.1 97.7 6.5 26.1 8.1 17.9Geothermal - - - - - - - - - - - - - -Others - - - - - - - - - - - - - -
1990- 2007- 2020- 2007-1990 2005 2007 2020 2030 1990 2005 2007 2020 2030 2007 2020 2030 2030
Total 0.5 0.9 0.9 1.1 1.1 100.0 100.0 100.0 100.0 100.0 3.6 1.5 0.0 0.9Coal 0.0 - - 0.2 0.2 2.4 - - 13.3 13.2 -100.0 - -0.1 -Oil 0.1 0.1 0.1 - - 12.6 16.6 10.0 - - 2.2 -100.0 - -100.0Natural gas 0.4 0.7 0.8 1.0 1.0 85.0 83.4 90.0 86.7 86.8 4.0 1.2 0.0 0.7
1990- 2007- 2020- 2007-1990 2005 2007 2020 2030 1990 2005 2007 2020 2030 2007 2020 2030 2030
Total 21.6 29.1 27.6 28.0 28.0 1.5 0.1 0.0 0.1Coal 27.9 - - 29.9 30.0 - - 0.0 -Oil 36.2 36.3 26.9 - - -1.7 - - -Natural gas 19.3 27.7 27.7 27.7 27.7 2.2 0.0 0.0 0.0
1990- 2007- 2020- 2007-1990 2005 2007 2020 2030 1990 2005 2007 2020 2030 2007 2020 2030 2030
Total 1.0 3.6 3.2 7.6 14.2 6.9 7.0 6.4 6.7
Energy and economic indicators1990- 2007- 2020- 2007-
1990 2005 2007 2020 2030 2007 2020 2030 20302.6 13.3 17.1 59.0 131.1 11.7 10.0 8.3 9.340.8 50.5 48.8 61.1 72.7 1.1 1.8 1.7 1.7
0.1 0.3 0.4 1.0 1.8 10.5 8.1 6.4 7.40.3 0.3 0.3 0.4 0.5 1.2 1.5 2.2 1.8
4,107 1,207 919 402 269 -8.4 -6.2 -4.0 -5.2394 268 185 129 108 -4.3 -2.8 -1.7 -2.3
0.10 0.22 0.20 0.32 0.40 4.5 3.6 2.3 3.0
AAGR(%)
AAGR(%)
AAGR(%)
Share, %
Share, %
AAGR(%)
Share, %
%
generation
Power MTOEgeneration
Thermal Efficiency
CO2 emissions Mt-C
Primary energy consumption per GDP (toe/million 2000 US Dollars)
GDP (billions of 2000 US dollars)Population (million of people)GDP per capita (thousands of 2000 USD/person)
CO2 emissions per primary energy consumption (t-C/toe)CO2 emissions per GDP (t-C/million 2000 US Dollars)
Primary energy consumption per capita (toe/person)
MYANMAR [BAU]Primary energy Mtoe Share, % AAGR(%)consumption
Share, % AAGR(%)Final energy Mtoe
Input
demand
AAGR(%)Power TWh Share, %
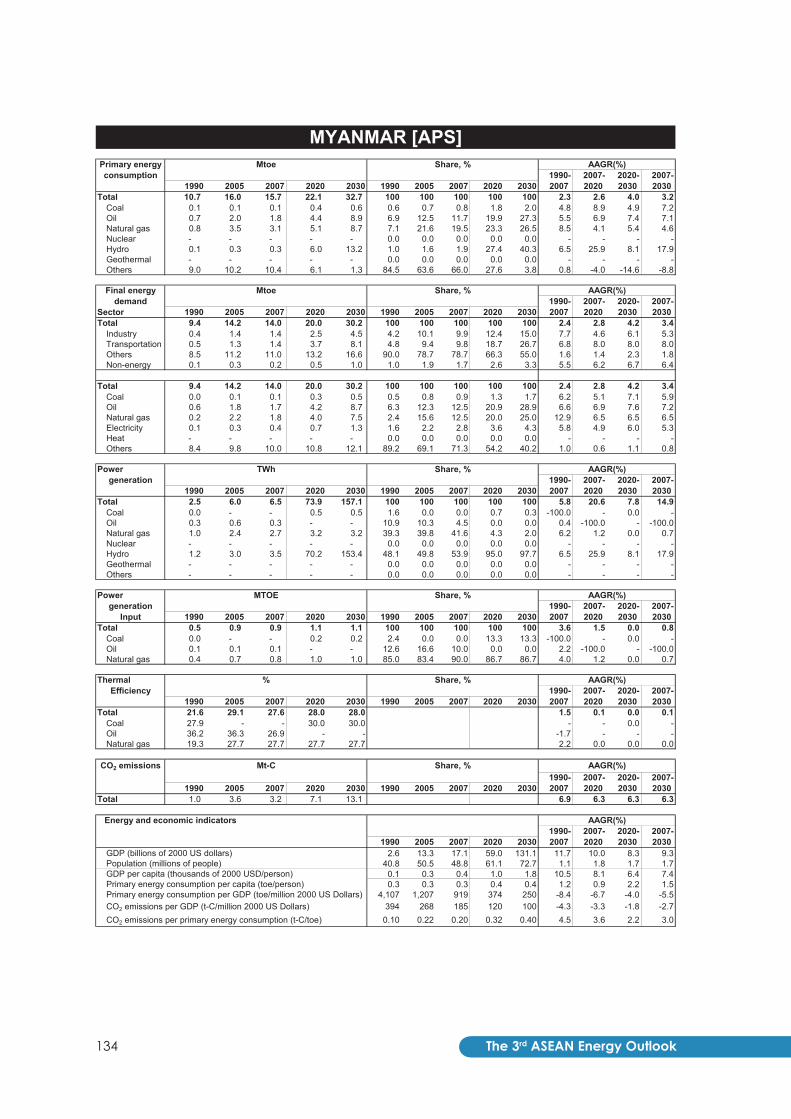
The 3rd ASEAN Energy Outlook134
1990- 2007- 2020- 2007-1990 2005 2007 2020 2030 1990 2005 2007 2020 2030 2007 2020 2030 2030
Total 10.7 16.0 15.7 22.1 32.7 100 100 100 100 100 2.3 2.6 4.0 3.2Coal 0.1 0.1 0.1 0.4 0.6 0.6 0.7 0.8 1.8 2.0 4.8 8.9 4.9 7.2Oil 0.7 2.0 1.8 4.4 8.9 6.9 12.5 11.7 19.9 27.3 5.5 6.9 7.4 7.1Natural gas 0.8 3.5 3.1 5.1 8.7 7.1 21.6 19.5 23.3 26.5 8.5 4.1 5.4 4.6Nuclear - - - - - 0.0 0.0 0.0 0.0 0.0 - - - -Hydro 0.1 0.3 0.3 6.0 13.2 1.0 1.6 1.9 27.4 40.3 6.5 25.9 8.1 17.9Geothermal - - - - - 0.0 0.0 0.0 0.0 0.0 - - - -Others 9.0 10.2 10.4 6.1 1.3 84.5 63.6 66.0 27.6 3.8 0.8 -4.0 -14.6 -8.8
1990- 2007- 2020- 2007-Sector 1990 2005 2007 2020 2030 1990 2005 2007 2020 2030 2007 2020 2030 2030Total 9.4 14.2 14.0 20.0 30.2 100 100 100 100 100 2.4 2.8 4.2 3.4
Industry 0.4 1.4 1.4 2.5 4.5 4.2 10.1 9.9 12.4 15.0 7.7 4.6 6.1 5.3Transportation 0.5 1.3 1.4 3.7 8.1 4.8 9.4 9.8 18.7 26.7 6.8 8.0 8.0 8.0Others 8.5 11.2 11.0 13.2 16.6 90.0 78.7 78.7 66.3 55.0 1.6 1.4 2.3 1.8Non-energy 0.1 0.3 0.2 0.5 1.0 1.0 1.9 1.7 2.6 3.3 5.5 6.2 6.7 6.4
Total 9.4 14.2 14.0 20.0 30.2 100 100 100 100 100 2.4 2.8 4.2 3.4Coal 0.0 0.1 0.1 0.3 0.5 0.5 0.8 0.9 1.3 1.7 6.2 5.1 7.1 5.9Oil 0.6 1.8 1.7 4.2 8.7 6.3 12.3 12.5 20.9 28.9 6.6 6.9 7.6 7.2Natural gas 0.2 2.2 1.8 4.0 7.5 2.4 15.6 12.5 20.0 25.0 12.9 6.5 6.5 6.5Electricity 0.1 0.3 0.4 0.7 1.3 1.6 2.2 2.8 3.6 4.3 5.8 4.9 6.0 5.3Heat - - - - - 0.0 0.0 0.0 0.0 0.0 - - - -Others 8.4 9.8 10.0 10.8 12.1 89.2 69.1 71.3 54.2 40.2 1.0 0.6 1.1 0.8
1990- 2007- 2020- 2007-1990 2005 2007 2020 2030 1990 2005 2007 2020 2030 2007 2020 2030 2030
Total 2.5 6.0 6.5 73.9 157.1 100 100 100 100 100 5.8 20.6 7.8 14.9Coal 0.0 - - 0.5 0.5 1.6 0.0 0.0 0.7 0.3 -100.0 - 0.0 -Oil 0.3 0.6 0.3 - - 10.9 10.3 4.5 0.0 0.0 0.4 -100.0 - -100.0Natural gas 1.0 2.4 2.7 3.2 3.2 39.3 39.8 41.6 4.3 2.0 6.2 1.2 0.0 0.7Nuclear - - - - - 0.0 0.0 0.0 0.0 0.0 - - - -Hydro 1.2 3.0 3.5 70.2 153.4 48.1 49.8 53.9 95.0 97.7 6.5 25.9 8.1 17.9Geothermal - - - - - 0.0 0.0 0.0 0.0 0.0 - - - -Others - - - - - 0.0 0.0 0.0 0.0 0.0 - - - -
1990- 2007- 2020- 2007-1990 2005 2007 2020 2030 1990 2005 2007 2020 2030 2007 2020 2030 2030
Total 0.5 0.9 0.9 1.1 1.1 100 100 100 100 100 3.6 1.5 0.0 0.8Coal 0.0 - - 0.2 0.2 2.4 0.0 0.0 13.3 13.3 -100.0 - 0.0 -Oil 0.1 0.1 0.1 - - 12.6 16.6 10.0 0.0 0.0 2.2 -100.0 - -100.0Natural gas 0.4 0.7 0.8 1.0 1.0 85.0 83.4 90.0 86.7 86.7 4.0 1.2 0.0 0.7
1990- 2007- 2020- 2007-1990 2005 2007 2020 2030 1990 2005 2007 2020 2030 2007 2020 2030 2030
Total 21.6 29.1 27.6 28.0 28.0 1.5 0.1 0.0 0.1Coal 27.9 - - 30.0 30.0 - - 0.0 -Oil 36.2 36.3 26.9 - - -1.7 - - -Natural gas 19.3 27.7 27.7 27.7 27.7 2.2 0.0 0.0 0.0
1990- 2007- 2020- 2007-1990 2005 2007 2020 2030 1990 2005 2007 2020 2030 2007 2020 2030 2030
Total 1.0 3.6 3.2 7.1 13.1 6.9 6.3 6.3 6.3
Energy and economic indicators1990- 2007- 2020- 2007-
1990 2005 2007 2020 2030 2007 2020 2030 20302.6 13.3 17.1 59.0 131.1 11.7 10.0 8.3 9.3
40.8 50.5 48.8 61.1 72.7 1.1 1.8 1.7 1.70.1 0.3 0.4 1.0 1.8 10.5 8.1 6.4 7.40.3 0.3 0.3 0.4 0.4 1.2 0.9 2.2 1.5
4,107 1,207 919 374 250 -8.4 -6.7 -4.0 -5.5394 268 185 120 100 -4.3 -3.3 -1.8 -2.7
0.10 0.22 0.20 0.32 0.40 4.5 3.6 2.2 3.0
MYANMAR [APS]Primary energy Mtoe Share, % AAGR(%)consumption
Final energy Mtoe
Share, %
Share, % AAGR(%)
AAGR(%)generation
Power MTOE
demand
Power TWh
Share, %
AAGR(%)Share, %
Inputgeneration
Primary energy consumption per GDP (toe/million 2000 US Dollars)
GDP (billions of 2000 US dollars)Population (millions of people)GDP per capita (thousands of 2000 USD/person)Primary energy consumption per capita (toe/person)
CO2 emissions per GDP (t-C/million 2000 US Dollars)CO2 emissions per primary energy consumption (t-C/toe)
AAGR(%)
AAGR(%)Efficiency
CO2 emissions Mt-C Share, % AAGR(%)
Thermal %

135The 3rd ASEAN Energy Outlook
1990- 2007- 2020- 2007-1990 2005 2007 2020 2030 1990 2005 2007 2020 2030 2007 2020 2030 2030
Total 27.8 40.4 41.0 75.7 111.2 100.0 100.0 100.0 100.0 100.0 2.3 4.8 3.9 4.4Coal 1.2 5.6 6.3 15.8 29.4 4.5 13.8 15.3 20.8 26.4 10.0 7.4 6.4 6.9Oil 11.6 15.1 14.5 26.2 38.3 41.8 37.3 35.4 34.6 34.4 1.3 4.7 3.9 4.3Natural gas - 2.7 3.0 6.7 11.4 - 6.7 7.4 8.9 10.3 - 6.3 5.4 5.9Nuclear - - - - - - - - - - - - - -Hydro 0.5 0.7 0.7 1.0 1.4 1.9 1.8 1.8 1.4 1.3 2.1 2.7 3.2 2.9Geothermal 4.7 8.5 8.8 18.0 20.9 16.9 21.1 21.4 23.8 18.8 3.7 5.7 1.5 3.8Others 9.7 7.8 7.6 7.9 9.8 34.9 19.3 18.6 10.5 8.8 -1.4 0.3 2.1 1.1
1990- 2007- 2020- 2007-Sector 1990 2005 2007 2020 2030 1990 2005 2007 2020 2030 2007 2020 2030 2030Total 18.4 23.9 24.0 40.1 59.2 100.0 100.0 100.0 100.0 100.0 1.6 4.0 4.0 4.0
Industry 4.0 5.4 5.4 8.6 12.7 21.6 22.7 22.5 21.5 21.4 1.8 3.7 3.9 3.8Transportation 5.0 9.2 9.7 19.1 26.7 27.1 38.6 40.7 47.7 45.0 4.0 5.3 3.4 4.5Others 9.0 9.0 8.5 11.9 19.4 49.2 37.7 35.4 29.7 32.7 -0.4 2.6 5.0 3.7Non-energy 0.4 0.2 0.3 0.4 0.5 2.1 1.0 1.4 1.0 0.8 -1.0 1.5 1.9 1.7
Total 18.3 23.9 24.0 40.1 59.2 100.0 100.0 100.0 100.0 100.0 1.6 4.0 4.0 4.0Coal 0.6 1.3 1.6 2.0 2.5 3.5 5.5 6.5 5.1 4.2 5.5 2.0 2.1 2.1Oil 8.0 12.9 12.6 23.8 34.9 43.7 54.1 52.7 59.3 59.0 2.7 5.0 3.9 4.5Natural gas - 0.0 0.1 0.1 0.2 - 0.1 0.3 0.3 0.3 - 3.4 3.5 3.4Electricity 1.8 3.9 4.1 8.9 15.2 10.0 16.3 17.2 22.3 25.6 4.9 6.1 5.4 5.8Heat - - - - - - - - - - - - - -Others 7.8 5.8 5.6 5.2 6.5 42.9 24.2 23.2 13.0 10.9 -2.0 -0.5 2.1 0.7
1990- 2007- 2020- 2007-1990 2005 2007 2020 2030 1990 2005 2007 2020 2030 2007 2020 2030 2030
Total 27.4 56.6 59.6 129.0 218.8 100.0 100.0 100.0 100.0 100.0 4.7 6.1 5.4 5.8Coal 1.9 15.3 16.8 51.1 104.3 7.0 27.0 28.2 39.6 47.7 13.6 8.9 7.4 8.3Oil 12.4 6.1 4.5 4.2 5.1 45.3 10.7 7.5 3.3 2.3 -5.8 -0.5 1.9 0.5Natural gas - 17.0 19.4 38.8 66.1 - 30.0 32.6 30.1 30.2 - 5.5 5.5 5.5Nuclear - - - - - - - - - - - - - -Hydro 6.1 8.4 8.6 12.1 16.6 22.1 14.8 14.4 9.4 7.6 2.1 2.7 3.2 2.9Geothermal 5.5 9.9 10.2 20.8 24.1 19.9 17.5 17.1 16.1 11.0 3.7 5.6 1.5 3.8Others 1.6 0.0 0.1 2.1 2.7 5.7 0.0 0.1 1.6 1.2 -17.5 31.5 2.5 18.0
1990- 2007- 2020- 2007-1990 2005 2007 2020 2030 1990 2005 2007 2020 2030 2007 2020 2030 2030
Total 2.7 8.0 8.5 19.7 36.4 100.0 100.0 100.0 100.0 100.0 7.1 6.7 6.3 6.5Coal 0.5 4.1 4.4 12.6 24.6 19.2 51.0 51.3 63.7 67.8 13.5 8.5 7.0 7.8Oil 2.1 1.4 1.1 1.0 1.2 80.8 17.8 12.4 5.0 3.3 -4.1 -0.5 1.9 0.5Natural gas - 2.5 3.1 6.2 10.5 - 31.2 36.3 31.3 29.0 - 5.5 5.5 5.5
1990- 2007- 2020- 2007-1990 2005 2007 2020 2030 1990 2005 2007 2020 2030 2007 2020 2030 2030
Total 46.6 41.1 41.1 41.0 41.5 -0.7 0.0 0.1 0.0Coal 32.7 32.2 33.1 35.0 36.4 0.1 0.4 0.4 0.4Oil 49.8 36.5 36.6 36.6 36.6 -1.8 0.0 0.0 0.0Natural gas - 58.5 54.0 54.0 54.0 - 0.0 0.0 0.0
1990- 2007- 2020- 2007-1990 2005 2007 2020 2030 1990 2005 2007 2020 2030 2007 2020 2030 2030
Total 10.5 19.5 17.5 38.2 62.8 3.1 6.2 5.1 5.7
Energy and economic indicators1990- 2007- 2020- 2007-
1990 2005 2007 2020 2030 2007 2020 2030 203056.2 94.4 106.6 204.3 332.8 3.8 5.1 5.0 5.161.1 83.1 88.7 107.5 118.7 2.2 1.5 1.0 1.3
0.9 1.1 1.2 1.9 2.8 1.6 3.6 4.0 3.80.5 0.5 0.5 0.7 0.9 0.1 3.3 2.9 3.1
494 428 384 371 334 -1.5 -0.3 -1.0 -0.6187 206 164 187 189 -0.8 1.0 0.1 0.6
0.38 0.48 0.43 0.51 0.56 0.7 1.3 1.1 1.2
Input
demand
AAGR(%)Power TWh Share, %
consumption
Share, % AAGR(%)Final energy Mtoe
PHILIPPINES [BAU]Primary energy Mtoe Share, % AAGR(%)
Primary energy consumption per GDP (toe/million 2000 US Dollars)
GDP (billions of 2000 US dollars)Population (million of people)GDP per capita (thousands of 2000 USD/person)
CO2 emissions per primary energy consumption (t-C/toe)CO2 emissions per GDP (t-C/million 2000 US Dollars)
Primary energy consumption per capita (toe/person)
%
generation
Power MTOEgeneration
Thermal Efficiency
CO2 emissions Mt-C
AAGR(%)
AAGR(%)
AAGR(%)
Share, %
Share, %
AAGR(%)
Share, %

The 3rd ASEAN Energy Outlook136
1990- 2007- 2020- 2007-1990 2005 2007 2020 2030 1990 2005 2007 2020 2030 2007 2020 2030 2030
Total 27.8 40.4 41.0 69.5 102.1 100 100 100 100 100 2.3 4.1 3.9 4.0Coal 1.2 5.6 6.3 13.2 22.7 4.5 13.8 15.3 19.0 22.2 10.0 5.9 5.6 5.8Oil 11.6 15.1 14.5 23.0 31.9 41.8 37.3 35.4 33.1 31.3 1.3 3.6 3.3 3.5Natural gas - 2.7 3.0 6.0 9.3 0.0 6.7 7.4 8.6 9.1 - 5.4 4.4 5.0Nuclear - - - - 4.1 0.0 0.0 0.0 0.0 4.0 - - - -Hydro 0.5 0.7 0.7 1.0 1.4 1.9 1.8 1.8 1.5 1.4 2.1 2.7 3.2 2.9Geothermal 4.7 8.5 8.8 18.0 20.9 16.9 21.1 21.4 26.0 20.5 3.7 5.7 1.5 3.8Others 9.7 7.8 7.6 8.2 11.7 34.9 19.3 18.6 11.9 11.5 -1.4 0.6 3.6 1.9
1990- 2007- 2020- 2007-Sector 1990 2005 2007 2020 2030 1990 2005 2007 2020 2030 2007 2020 2030 2030Total 18.4 24.0 24.0 36.3 53.7 100 100 100 100 100 1.6 3.3 4.0 3.6
Industry 4.0 5.4 5.4 7.8 11.4 21.6 22.5 22.5 21.4 21.3 1.8 2.9 3.9 3.3Transportation 5.0 9.7 9.7 17.4 24.3 27.1 40.7 40.7 48.0 45.4 4.0 4.6 3.4 4.1Others 9.0 8.5 8.5 10.7 17.5 49.2 35.4 35.4 29.6 32.5 -0.4 1.8 5.0 3.2Non-energy 0.4 0.3 0.3 0.4 0.4 2.1 1.4 1.4 1.0 0.8 -1.0 0.8 1.9 1.3
Total 23.9 24.0 24.0 36.3 53.7 100 100 100 100 100 0.0 3.3 4.0 3.6Coal 1.3 1.6 1.6 1.8 2.3 5.5 6.5 6.5 5.0 4.2 1.1 1.2 2.1 1.6Oil 12.9 12.6 12.6 20.7 29.0 54.1 52.7 52.7 56.9 54.0 -0.1 3.9 3.4 3.7Natural gas 0.0 0.1 0.1 0.1 0.2 0.1 0.3 0.3 0.3 0.3 11.5 2.5 3.5 3.0Electricity 3.9 4.1 4.1 8.0 13.6 16.3 17.2 17.2 22.2 25.4 0.4 5.3 5.4 5.3Heat - - - - - 0.0 0.0 0.0 0.0 0.0 - - - -Others 5.8 5.6 5.6 5.7 8.6 24.2 23.2 23.2 15.6 16.1 -0.2 0.1 4.3 1.9
1990- 2007- 2020- 2007-1990 2005 2007 2020 2030 1990 2005 2007 2020 2030 2007 2020 2030 2030
Total 27.4 56.6 59.6 116.2 197.0 100 100 100 100 100 4.7 5.3 5.4 5.3Coal 1.9 15.3 16.8 42.1 79.3 7.0 27.0 28.2 36.2 40.2 13.6 7.3 6.5 7.0Oil 12.4 6.1 4.5 4.1 4.7 45.3 10.7 7.5 3.5 2.4 -5.8 -0.7 1.4 0.2Natural gas - 17.0 19.4 34.6 53.5 0.0 30.0 32.6 29.8 27.2 - 4.5 4.5 4.5Nuclear - - - - 15.8 0.0 0.0 0.0 0.0 8.0 - - - -Hydro 6.1 8.4 8.6 12.1 16.6 22.1 14.8 14.4 10.4 8.4 2.1 2.7 3.2 2.9Geothermal 5.5 9.9 10.2 20.8 24.1 19.9 17.5 17.1 17.9 12.2 3.7 5.6 1.5 3.8Others 1.6 0.0 0.1 2.6 3.2 5.7 0.0 0.1 2.2 1.6 -17.5 33.6 2.1 18.9
1990- 2007- 2020- 2007-1990 2005 2007 2020 2030 1990 2005 2007 2020 2030 2007 2020 2030 2030
Total 2.7 8.0 8.5 16.8 28.3 100 100 100 100 100 7.1 5.4 5.4 5.4Coal 0.5 4.1 4.4 10.4 18.7 19.2 51.0 51.3 61.5 66.1 13.5 6.9 6.1 6.5Oil 2.1 1.4 1.1 1.0 1.1 80.8 17.8 12.4 5.7 3.9 -4.1 -0.7 1.4 0.2Natural gas - 2.5 3.1 5.5 8.5 0.0 31.2 36.3 32.7 30.1 - 4.5 4.5 4.5
1990- 2007- 2020- 2007-1990 2005 2007 2020 2030 1990 2005 2007 2020 2030 2007 2020 2030 2030
Total 46.6 41.1 41.1 41.3 41.7 -0.7 0.0 0.1 0.1Coal 32.7 32.2 33.1 35.0 36.4 0.1 0.4 0.4 0.4Oil 49.8 36.5 36.6 36.6 36.6 -1.8 0.0 0.0 0.0Natural gas - 58.5 54.0 54.0 54.0 - 0.0 0.0 0.0
1990- 2007- 2020- 2007-1990 2005 2007 2020 2030 1990 2005 2007 2020 2030 2007 2020 2030 2030
Total 10.5 19.5 17.5 32.7 49.9 3.1 4.9 4.3 4.7
Energy and economic indicators1990- 2007- 2020- 2007-
1990 2005 2007 2020 2030 2007 2020 2030 203056.2 94.4 106.6 204.3 332.8 3.8 5.1 5.0 5.161.1 83.1 88.7 107.5 118.7 2.2 1.5 1.0 1.3
0.9 1.1 1.2 1.9 2.8 1.6 3.6 4.0 3.80.5 0.5 0.5 0.6 0.9 0.1 2.6 2.9 2.7
494 428 384 340 307 -1.5 -0.9 -1.0 -1.0187 206 164 160 150 -0.8 -0.2 -0.6 -0.4
0.38 0.48 0.43 0.47 0.49 0.7 0.7 0.4 0.6
AAGR(%)
AAGR(%)Efficiency
CO2 emissions Mt-C Share, % AAGR(%)
Thermal %
Primary energy consumption per GDP (toe/million 2000 US Dollars)
GDP (billions of 2000 US dollars)Population (millions of people)GDP per capita (thousands of 2000 USD/person)Primary energy consumption per capita (toe/person)
CO2 emissions per GDP (t-C/million 2000 US Dollars)CO2 emissions per primary energy consumption (t-C/toe)
Share, %
AAGR(%)Share, %
Inputgeneration
generation
Power MTOE
demand
Power TWh Share, %
Share, % AAGR(%)
AAGR(%)
consumption
Final energy Mtoe
PHILIPPINES [APS]Primary energy Mtoe Share, % AAGR(%)

137The 3rd ASEAN Energy Outlook
1990- 2007- 2020- 2007-1990 2005 2007 2020 2030 1990 2005 2007 2020 2030 2007 2020 2030 2030
Total 13.3 31.0 30.5 40.8 52.4 100.0 100.0 100.0 100.0 100.0 5.0 2.3 2.5 2.4Coal - - - - - - - - - - - - - -Oil 13.3 25.0 23.7 31.3 40.2 100.0 80.8 77.8 76.8 76.8 3.4 2.2 2.5 2.3Natural gas - 5.9 6.8 9.3 11.8 - 19.2 22.2 22.9 22.6 - 2.5 2.4 2.5Nuclear - - - - - - - - - - - - - -Hydro - - - - - - - - - - - - - -Geothermal - - - - - - - - - - - - - -Others - - - 0.1 0.3 - - - 0.4 0.6 - - 8.9 -
1990- 2007- 2020- 2007-Sector 1990 2005 2007 2020 2030 1990 2005 2007 2020 2030 2007 2020 2030 2030Total 6.9 15.8 17.0 24.2 34.3 100.0 100.0 100.0 100.0 100.0 5.4 2.8 3.6 3.1
Industry 0.6 1.2 1.3 2.0 2.8 9.0 7.7 7.6 8.3 8.2 4.5 3.4 3.5 3.4Transportation 3.3 5.5 6.2 8.3 11.5 47.3 34.5 36.4 34.5 33.6 3.8 2.3 3.3 2.7Others 0.7 1.8 1.9 2.7 3.4 10.1 11.1 11.4 11.1 9.9 6.2 2.6 2.4 2.5Non-energy 2.3 7.4 7.6 11.2 16.6 33.6 46.7 44.6 46.2 48.3 7.2 3.0 4.0 3.5
Total 6.9 15.8 17.0 24.2 34.3 100.0 100.0 100.0 100.0 100.0 5.4 2.8 3.6 3.1Coal - - - - - - - - - - - - - -Oil 5.7 12.9 13.8 19.6 28.2 82.9 81.7 81.5 81.1 82.3 5.3 2.7 3.7 3.1Natural gas 0.1 0.1 0.1 0.2 0.2 0.9 0.7 0.7 0.8 0.7 3.4 4.6 1.7 3.3Electricity 1.1 2.8 3.0 4.4 5.8 16.2 17.6 17.8 18.1 17.0 6.1 2.9 2.9 2.9Heat - - - - - - - - - - - - - -Others - - - - - - - - - - - - - -
1990- 2007- 2020- 2007-1990 2005 2007 2020 2030 1990 2005 2007 2020 2030 2007 2020 2030 2030
Total 15.7 38.2 41.1 59.1 78.0 100.0 100.0 100.0 100.0 100.0 5.8 2.8 2.8 2.8Coal - - - - - - - - - - - - - -Oil 15.7 9.8 8.8 10.1 11.7 100.0 25.6 21.3 17.2 15.0 -3.4 1.1 1.4 1.3Natural gas - 28.4 32.4 47.3 62.4 - 74.4 78.7 80.0 80.0 - 3.0 2.8 2.9Nuclear - - - - - - - - - - - - - -Hydro - - - - - - - - - - - - - -Geothermal - - - - - - - - - - - - - -Others - - - 1.7 3.9 - - - 2.8 5.0 - - 8.8 -
1990- 2007- 2020- 2007-1990 2005 2007 2020 2030 1990 2005 2007 2020 2030 2007 2020 2030 2030
Total 4.4 8.1 8.7 11.5 14.3 100.0 100.0 100.0 100.0 100.0 4.1 2.2 2.2 2.2Coal - - - - - - - - - - - - - -Oil 4.4 2.2 1.9 2.2 2.4 100.0 26.7 22.2 18.9 17.1 -4.7 0.9 1.2 1.0Natural gas - 5.9 6.8 9.3 11.8 - 73.3 77.8 81.1 82.9 - 2.5 2.4 2.5
1990- 2007- 2020- 2007-1990 2005 2007 2020 2030 1990 2005 2007 2020 2030 2007 2020 2030 2030
Total 30.6 40.6 40.7 42.9 44.6 1.7 0.4 0.4 0.4Coal - - - - - - - - -Oil 30.6 39.0 39.0 40.2 41.1 1.4 0.2 0.2 0.2Natural gas - 41.2 41.2 43.5 45.3 - 0.4 0.4 0.4
1990- 2007- 2020- 2007-1990 2005 2007 2020 2030 1990 2005 2007 2020 2030 2007 2020 2030 2030
Total 7.7 11.6 12.1 16.0 19.7 2.7 2.2 2.1 2.1
Energy and economic indicators1990- 2007- 2020- 2007-
1990 2005 2007 2020 2030 2007 2020 2030 203042.5 114.7 133.9 202.2 296.4 7.0 3.2 3.9 3.5
4.0 4.3 4.6 5.2 5.5 0.8 1.0 0.5 0.810.5 26.4 29.2 38.6 53.9 6.2 2.2 3.4 2.7
3.3 7.1 6.6 7.8 9.5 4.2 1.2 2.0 1.6314 270 228 202 177 -1.9 -0.9 -1.3 -1.1181 101 90 79 66 -4.0 -1.0 -1.8 -1.3
0.58 0.37 0.40 0.39 0.38 -2.2 -0.1 -0.5 -0.2
AAGR(%)
AAGR(%)
AAGR(%)
Share, %
Share, %
AAGR(%)
Share, %
%
generation
Power MTOEgeneration
Thermal Efficiency
CO2 emissions Mt-C
Primary energy consumption per GDP (toe/million 2000 US Dollars)
GDP (billions of 2000 US dollars)Population (million of people)GDP per capita (thousands of 2000 USD/person)
CO2 emissions per primary energy consumption (t-C/toe)CO2 emissions per GDP (t-C/million 2000 US Dollars)
Primary energy consumption per capita (toe/person)
SINGAPORE [BAU]Primary energy Mtoe Share, % AAGR(%)consumption
Share, % AAGR(%)Final energy Mtoe
Input
demand
AAGR(%)Power TWh Share, %

The 3rd ASEAN Energy Outlook138
1990- 2007- 2020- 2007-1990 2005 2007 2020 2030 1990 2005 2007 2020 2030 2007 2020 2030 2030
Total 13.3 31.0 30.5 39.8 50.4 100 100 100 100 100 5.0 2.1 2.4 2.2Coal - - - - - 0.0 0.0 0.0 0.0 0.0 - - - -Oil 13.3 25.0 23.7 31.1 39.9 100.0 80.8 77.8 78.3 79.2 3.4 2.1 2.5 2.3Natural gas - 5.9 6.8 8.5 10.2 0.0 19.2 22.2 21.4 20.2 - 1.8 1.8 1.8Nuclear - - - - - 0.0 0.0 0.0 0.0 0.0 - - - -Hydro - - - - - 0.0 0.0 0.0 0.0 0.0 - - - -Geothermal - - - - - 0.0 0.0 0.0 0.0 0.0 - - - -Others - - - 0.1 0.3 0.0 0.0 0.0 0.3 0.7 - - 9.3 -
1990- 2007- 2020- 2007-Sector 1990 2005 2007 2020 2030 1990 2005 2007 2020 2030 2007 2020 2030 2030Total 6.9 15.8 17.0 23.9 33.7 100 100 100 100 100 5.4 2.7 3.5 3.0
Industry 0.6 1.2 1.3 1.9 2.5 9.0 7.7 7.6 7.8 7.5 4.5 2.8 3.1 2.9Transportation 3.3 5.5 6.2 8.3 11.3 47.3 34.5 36.4 34.6 33.6 3.8 2.3 3.2 2.7Others 0.7 1.8 1.9 2.6 3.3 10.1 11.1 11.4 10.9 9.7 6.2 2.4 2.3 2.3Non-energy 2.3 7.4 7.6 11.2 16.6 33.6 46.7 44.6 46.7 49.1 7.2 3.0 4.0 3.5
Total 6.9 15.8 17.0 23.9 33.7 100 100 100 100 100 5.4 2.7 3.5 3.0Coal - - - - - 0.0 0.0 0.0 0.0 0.0 - - - -Oil 5.7 12.9 13.8 19.5 28.0 82.9 81.7 81.5 81.7 83.1 5.3 2.7 3.7 3.1Natural gas 0.1 0.1 0.1 0.2 0.2 0.9 0.7 0.7 0.8 0.7 3.4 4.3 1.5 3.1Electricity 1.1 2.8 3.0 4.2 5.5 16.2 17.6 17.8 17.5 16.2 6.1 2.5 2.7 2.6Heat - - - - - 0.0 0.0 0.0 0.0 0.0 - - - -Others - - - - - 0.0 0.0 0.0 0.0 0.0 - - - -
1990- 2007- 2020- 2007-1990 2005 2007 2020 2030 1990 2005 2007 2020 2030 2007 2020 2030 2030
Total 15.7 38.2 41.1 56.7 73.0 100 100 100 100 100 5.8 2.5 2.6 2.5Coal - - - - - 0.0 0.0 0.0 0.0 0.0 - - - -Oil 15.7 9.8 8.8 9.7 11.0 100.0 25.6 21.3 17.2 15.0 -3.4 0.8 1.2 1.0Natural gas - 28.4 32.4 45.4 58.4 0.0 74.4 78.7 80.0 80.0 - 2.6 2.6 2.6Nuclear - - - - - 0.0 0.0 0.0 0.0 0.0 - - - -Hydro - - - - - 0.0 0.0 0.0 0.0 0.0 - - - -Geothermal - - - - - 0.0 0.0 0.0 0.0 0.0 - - - -Others - - - 1.6 3.6 0.0 0.0 0.0 2.8 5.0 - - 8.6 -
1990- 2007- 2020- 2007-1990 2005 2007 2020 2030 1990 2005 2007 2020 2030 2007 2020 2030 2030
Total 4.4 8.1 8.7 10.6 12.4 100 100 100 100 100 4.1 1.5 1.6 1.6Coal - - - - - 0.0 0.0 0.0 0.0 0.0 - - - -Oil 4.4 2.2 1.9 2.1 2.3 100.0 26.7 22.2 19.7 18.4 -4.7 0.6 0.9 0.7Natural gas - 5.9 6.8 8.5 10.2 0.0 73.3 77.8 80.3 81.6 - 1.8 1.8 1.8
1990- 2007- 2020- 2007-1990 2005 2007 2020 2030 1990 2005 2007 2020 2030 2007 2020 2030 2030
Total 30.6 40.6 40.7 44.8 47.9 1.7 0.7 0.7 0.7Coal - - - - - - - - -Oil 30.6 39.0 39.0 40.2 41.1 1.4 0.2 0.2 0.2Natural gas - 41.2 41.2 45.9 49.4 - 0.8 0.8 0.8
1990- 2007- 2020- 2007-1990 2005 2007 2020 2030 1990 2005 2007 2020 2030 2007 2020 2030 2030
Total 7.7 11.6 12.1 15.4 18.3 2.7 1.9 1.8 1.8
Energy and economic indicators1990- 2007- 2020- 2007-
1990 2005 2007 2020 2030 2007 2020 2030 203042.5 114.7 133.9 202.2 296.4 7.0 3.2 3.9 3.5
4.0 4.3 4.6 5.2 5.5 0.8 1.0 0.5 0.810.5 26.4 29.2 38.6 53.9 6.2 2.2 3.4 2.7
3.3 7.1 6.6 7.6 9.2 4.2 1.0 1.9 1.4314 270 228 197 170 -1.9 -1.1 -1.5 -1.3181 101 90 76 62 -4.0 -1.3 -2.1 -1.6
0.58 0.37 0.40 0.39 0.36 -2.2 -0.2 -0.6 -0.4
SINGAPORE [APS]Primary energy Mtoe Share, % AAGR(%)consumption
Final energy Mtoe
Share, %
Share, % AAGR(%)
AAGR(%)generation
Power MTOE
demand
Power TWh
Share, %
AAGR(%)Share, %
Inputgeneration
Primary energy consumption per GDP (toe/million 2000 US Dollars)
GDP (billions of 2000 US dollars)Population (millions of people)GDP per capita (thousands of 2000 USD/person)Primary energy consumption per capita (toe/person)
CO2 emissions per GDP (t-C/million 2000 US Dollars)CO2 emissions per primary energy consumption (t-C/toe)
AAGR(%)
AAGR(%)Efficiency
CO2 emissions Mt-C Share, % AAGR(%)
Thermal %

139The 3rd ASEAN Energy Outlook
1990- 2007- 2020- 2007-1990 2005 2007 2020 2030 1990 2005 2007 2020 2030 2007 2020 2030 2030
Total 43.9 98.9 106.1 169.8 247.7 100.0 100.0 100.0 100.0 100.0 5.3 3.7 3.9 3.8Coal 3.8 10.6 13.9 25.2 41.8 8.7 10.8 13.1 14.8 16.9 7.9 4.7 5.2 4.9Oil 19.8 45.4 44.5 67.0 96.7 45.2 45.9 41.9 39.5 39.0 4.9 3.2 3.7 3.4Natural gas 5.1 25.9 28.3 34.3 36.3 11.6 26.2 26.7 20.2 14.7 10.6 1.5 0.6 1.1Nuclear - - - 2.3 11.4 - - - 1.3 4.6 - - 17.5 -Hydro 0.4 0.5 0.7 0.3 0.3 1.0 0.5 0.7 0.2 0.1 2.9 -6.4 0.0 -3.7Geothermal 0.0 - - - - 0.0 - - - - -100.0 - - -Others 14.7 16.4 18.7 40.7 61.3 33.5 16.6 17.6 24.0 24.7 1.4 6.2 4.2 5.3
1990- 2007- 2020- 2007-Sector 1990 2005 2007 2020 2030 1990 2005 2007 2020 2030 2007 2020 2030 2030Total 30.7 65.3 72.1 119.4 176.0 100.0 100.0 100.0 100.0 100.0 5.1 4.0 4.0 4.0
Industry 9.0 27.1 22.9 41.7 61.6 29.4 41.4 31.8 34.9 35.0 5.6 4.7 4.0 4.4Transportation 10.9 22.1 22.0 34.1 49.9 35.5 33.8 30.5 28.5 28.4 4.2 3.4 3.9 3.6Others 10.8 16.2 17.8 28.3 41.9 35.1 24.8 24.7 23.7 23.8 3.0 3.6 4.0 3.8Non-energy - - 9.4 15.3 22.6 - - 13.0 12.8 12.9 - 3.8 4.0 3.9
Total 30.7 65.3 72.1 119.4 176.0 100.0 100.0 100.0 100.0 100.0 5.1 4.0 4.0 4.0Coal 1.3 5.7 6.8 13.7 21.6 4.3 8.8 9.5 11.4 12.3 10.2 5.5 4.7 5.1Oil 16.7 36.4 39.5 62.8 92.4 54.4 55.7 54.8 52.6 52.5 5.2 3.6 3.9 3.8Natural gas 0.2 1.9 2.4 4.5 5.9 0.8 2.8 3.3 3.7 3.4 14.4 5.0 2.9 4.1Electricity 3.3 10.4 11.3 22.4 36.0 10.7 15.9 15.6 18.8 20.4 7.5 5.4 4.8 5.2Heat - - - - - - - - - - - - - -Others 9.2 11.0 12.1 16.1 20.1 29.8 16.8 16.8 13.5 11.4 1.7 2.2 2.3 2.2
1990- 2007- 2020- 2007-1990 2005 2007 2020 2030 1990 2005 2007 2020 2030 2007 2020 2030 2030
Total 44.2 130.4 143.1 242.9 379.9 100.0 100.0 100.0 100.0 100.0 7.2 4.2 4.6 4.3Coal 11.1 20.6 30.4 54.9 104.0 25.0 15.8 21.3 22.6 27.4 6.1 4.6 6.6 5.5Oil 10.4 7.8 3.8 0.8 0.9 23.5 6.0 2.7 0.3 0.2 -5.7 -11.8 2.3 -5.9Natural gas 17.8 94.5 96.6 119.8 124.6 40.2 72.4 67.5 49.3 32.8 10.5 1.7 0.4 1.1Nuclear - - - 8.8 43.8 - - - 3.6 11.5 - - 17.5 -Hydro 5.0 5.7 8.1 3.4 3.4 11.3 4.3 5.7 1.4 0.9 2.9 -6.4 0.0 -3.7Geothermal 0.0 - - - - 0.0 - - - - -100.0 - - -Others - 1.9 4.2 55.3 103.0 - 1.4 2.9 22.7 27.1 - 22.0 6.4 15.0
1990- 2007- 2020- 2007-1990 2005 2007 2020 2030 1990 2005 2007 2020 2030 2007 2020 2030 2030
Total 8.9 25.7 27.3 34.0 42.9 100.0 100.0 100.0 100.0 100.0 6.8 1.7 2.3 2.0Coal 2.5 4.9 6.9 11.5 20.1 28.6 19.0 25.3 33.8 47.0 6.0 4.0 5.8 4.8Oil 2.6 1.8 0.9 0.2 0.2 28.6 6.9 3.4 0.5 0.5 -5.8 -11.8 2.3 -5.9Natural gas 3.8 19.0 19.4 22.3 22.5 42.8 74.1 71.3 65.7 52.5 10.0 1.1 0.1 0.6
1990- 2007- 2020- 2007-1990 2005 2007 2020 2030 1990 2005 2007 2020 2030 2007 2020 2030 2030
Total 37.8 41.2 41.3 44.4 46.1 0.5 0.6 0.4 0.5Coal 37.3 36.3 37.9 41.1 44.4 0.1 0.6 0.8 0.7Oil 35.0 37.8 36.0 36.0 36.0 0.2 0.0 0.0 0.0Natural gas 40.0 42.7 42.7 46.1 47.6 0.4 0.6 0.3 0.5
1990- 2007- 2020- 2007-1990 2005 2007 2020 2030 1990 2005 2007 2020 2030 2007 2020 2030 2030
Total 21.4 57.3 51.0 78.3 113.1 5.2 3.3 3.8 3.5
Energy and economic indicators1990- 2007- 2020- 2007-
1990 2005 2007 2020 2030 2007 2020 2030 203079.0 157.0 174.0 283.7 419.9 4.8 3.8 4.0 3.954.6 64.2 67.0 70.0 72.3 1.2 0.3 0.3 0.3
1.4 2.4 2.6 4.1 5.8 3.5 3.5 3.7 3.60.8 1.5 1.6 2.4 3.4 4.1 3.3 3.5 3.4
555 630 610 598 590 0.6 -0.1 -0.1 -0.1271 365 293 276 269 0.5 -0.5 -0.2 -0.4
0.49 0.58 0.48 0.46 0.46 -0.1 -0.3 -0.1 -0.2
Input
demand
AAGR(%)Power TWh Share, %
consumption
Share, % AAGR(%)Final energy Mtoe
THAILAND [BAU]Primary energy Mtoe Share, % AAGR(%)
Primary energy consumption per GDP (toe/million 2000 US Dollars)
GDP (billions of 2000 US dollars)Population (million of people)GDP per capita (thousands of 2000 USD/person)
CO2 emissions per primary energy consumption (t-C/toe)CO2 emissions per GDP (t-C/million 2000 US Dollars)
Primary energy consumption per capita (toe/person)
%
generation
Power MTOEgeneration
Thermal Efficiency
CO2 emissions Mt-C
AAGR(%)
AAGR(%)
AAGR(%)
Share, %
Share, %
AAGR(%)
Share, %
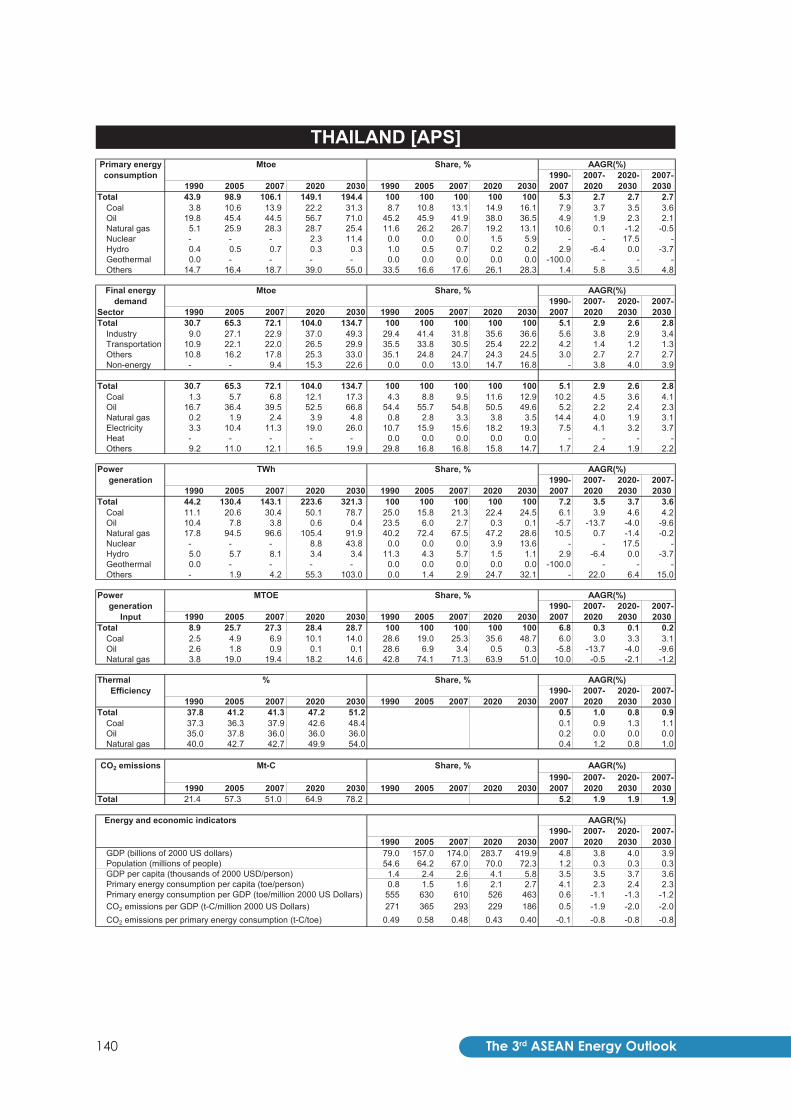
The 3rd ASEAN Energy Outlook140
1990- 2007- 2020- 2007-1990 2005 2007 2020 2030 1990 2005 2007 2020 2030 2007 2020 2030 2030
Total 43.9 98.9 106.1 149.1 194.4 100 100 100 100 100 5.3 2.7 2.7 2.7Coal 3.8 10.6 13.9 22.2 31.3 8.7 10.8 13.1 14.9 16.1 7.9 3.7 3.5 3.6Oil 19.8 45.4 44.5 56.7 71.0 45.2 45.9 41.9 38.0 36.5 4.9 1.9 2.3 2.1Natural gas 5.1 25.9 28.3 28.7 25.4 11.6 26.2 26.7 19.2 13.1 10.6 0.1 -1.2 -0.5Nuclear - - - 2.3 11.4 0.0 0.0 0.0 1.5 5.9 - - 17.5 -Hydro 0.4 0.5 0.7 0.3 0.3 1.0 0.5 0.7 0.2 0.2 2.9 -6.4 0.0 -3.7Geothermal 0.0 - - - - 0.0 0.0 0.0 0.0 0.0 -100.0 - - -Others 14.7 16.4 18.7 39.0 55.0 33.5 16.6 17.6 26.1 28.3 1.4 5.8 3.5 4.8
1990- 2007- 2020- 2007-Sector 1990 2005 2007 2020 2030 1990 2005 2007 2020 2030 2007 2020 2030 2030Total 30.7 65.3 72.1 104.0 134.7 100 100 100 100 100 5.1 2.9 2.6 2.8
Industry 9.0 27.1 22.9 37.0 49.3 29.4 41.4 31.8 35.6 36.6 5.6 3.8 2.9 3.4Transportation 10.9 22.1 22.0 26.5 29.9 35.5 33.8 30.5 25.4 22.2 4.2 1.4 1.2 1.3Others 10.8 16.2 17.8 25.3 33.0 35.1 24.8 24.7 24.3 24.5 3.0 2.7 2.7 2.7Non-energy - - 9.4 15.3 22.6 0.0 0.0 13.0 14.7 16.8 - 3.8 4.0 3.9
Total 30.7 65.3 72.1 104.0 134.7 100 100 100 100 100 5.1 2.9 2.6 2.8Coal 1.3 5.7 6.8 12.1 17.3 4.3 8.8 9.5 11.6 12.9 10.2 4.5 3.6 4.1Oil 16.7 36.4 39.5 52.5 66.8 54.4 55.7 54.8 50.5 49.6 5.2 2.2 2.4 2.3Natural gas 0.2 1.9 2.4 3.9 4.8 0.8 2.8 3.3 3.8 3.5 14.4 4.0 1.9 3.1Electricity 3.3 10.4 11.3 19.0 26.0 10.7 15.9 15.6 18.2 19.3 7.5 4.1 3.2 3.7Heat - - - - - 0.0 0.0 0.0 0.0 0.0 - - - -Others 9.2 11.0 12.1 16.5 19.9 29.8 16.8 16.8 15.8 14.7 1.7 2.4 1.9 2.2
1990- 2007- 2020- 2007-1990 2005 2007 2020 2030 1990 2005 2007 2020 2030 2007 2020 2030 2030
Total 44.2 130.4 143.1 223.6 321.3 100 100 100 100 100 7.2 3.5 3.7 3.6Coal 11.1 20.6 30.4 50.1 78.7 25.0 15.8 21.3 22.4 24.5 6.1 3.9 4.6 4.2Oil 10.4 7.8 3.8 0.6 0.4 23.5 6.0 2.7 0.3 0.1 -5.7 -13.7 -4.0 -9.6Natural gas 17.8 94.5 96.6 105.4 91.9 40.2 72.4 67.5 47.2 28.6 10.5 0.7 -1.4 -0.2Nuclear - - - 8.8 43.8 0.0 0.0 0.0 3.9 13.6 - - 17.5 -Hydro 5.0 5.7 8.1 3.4 3.4 11.3 4.3 5.7 1.5 1.1 2.9 -6.4 0.0 -3.7Geothermal 0.0 - - - - 0.0 0.0 0.0 0.0 0.0 -100.0 - - -Others - 1.9 4.2 55.3 103.0 0.0 1.4 2.9 24.7 32.1 - 22.0 6.4 15.0
1990- 2007- 2020- 2007-1990 2005 2007 2020 2030 1990 2005 2007 2020 2030 2007 2020 2030 2030
Total 8.9 25.7 27.3 28.4 28.7 100 100 100 100 100 6.8 0.3 0.1 0.2Coal 2.5 4.9 6.9 10.1 14.0 28.6 19.0 25.3 35.6 48.7 6.0 3.0 3.3 3.1Oil 2.6 1.8 0.9 0.1 0.1 28.6 6.9 3.4 0.5 0.3 -5.8 -13.7 -4.0 -9.6Natural gas 3.8 19.0 19.4 18.2 14.6 42.8 74.1 71.3 63.9 51.0 10.0 -0.5 -2.1 -1.2
1990- 2007- 2020- 2007-1990 2005 2007 2020 2030 1990 2005 2007 2020 2030 2007 2020 2030 2030
Total 37.8 41.2 41.3 47.2 51.2 0.5 1.0 0.8 0.9Coal 37.3 36.3 37.9 42.6 48.4 0.1 0.9 1.3 1.1Oil 35.0 37.8 36.0 36.0 36.0 0.2 0.0 0.0 0.0Natural gas 40.0 42.7 42.7 49.9 54.0 0.4 1.2 0.8 1.0
1990- 2007- 2020- 2007-1990 2005 2007 2020 2030 1990 2005 2007 2020 2030 2007 2020 2030 2030
Total 21.4 57.3 51.0 64.9 78.2 5.2 1.9 1.9 1.9
Energy and economic indicators1990- 2007- 2020- 2007-
1990 2005 2007 2020 2030 2007 2020 2030 203079.0 157.0 174.0 283.7 419.9 4.8 3.8 4.0 3.954.6 64.2 67.0 70.0 72.3 1.2 0.3 0.3 0.3
1.4 2.4 2.6 4.1 5.8 3.5 3.5 3.7 3.60.8 1.5 1.6 2.1 2.7 4.1 2.3 2.4 2.3
555 630 610 526 463 0.6 -1.1 -1.3 -1.2271 365 293 229 186 0.5 -1.9 -2.0 -2.0
0.49 0.58 0.48 0.43 0.40 -0.1 -0.8 -0.8 -0.8
AAGR(%)
AAGR(%)Efficiency
CO2 emissions Mt-C Share, % AAGR(%)
Thermal %
Primary energy consumption per GDP (toe/million 2000 US Dollars)
GDP (billions of 2000 US dollars)Population (millions of people)GDP per capita (thousands of 2000 USD/person)Primary energy consumption per capita (toe/person)
CO2 emissions per GDP (t-C/million 2000 US Dollars)CO2 emissions per primary energy consumption (t-C/toe)
Share, %
AAGR(%)Share, %
Inputgeneration
generation
Power MTOE
demand
Power TWh Share, %
Share, % AAGR(%)
AAGR(%)
consumption
Final energy Mtoe
THAILAND [APS]Primary energy Mtoe Share, % AAGR(%)

141The 3rd ASEAN Energy Outlook
1990- 2007- 2020- 2007-1990 2005 2007 2020 2030 1990 2005 2007 2020 2030 2007 2020 2030 2030
Total 24.3 50.8 55.6 113.8 225.8 100.0 100.0 100.0 100.0 100.0 5.0 5.7 7.1 6.3Coal 2.2 8.1 9.8 43.8 103.2 9.1 16.0 17.7 38.5 45.7 9.2 12.2 9.0 10.8Oil 2.7 12.0 13.2 32.6 66.6 11.3 23.6 23.8 28.6 29.5 9.7 7.2 7.4 7.3Natural gas 0.0 4.9 5.5 11.9 16.1 0.0 9.7 9.8 10.5 7.1 56.4 6.2 3.1 4.8Nuclear - - - 1.1 12.4 - - - 1.0 5.5 - - 27.4 -Hydro 0.5 1.8 2.6 4.9 6.4 1.9 3.6 4.6 4.3 2.8 10.6 5.1 2.7 4.0Geothermal - - - - - - - - - - - - - -Others 18.9 24.0 24.5 19.5 21.1 77.7 47.2 44.1 17.2 9.4 1.5 -1.7 0.8 -0.6
1990- 2007- 2020- 2007-Sector 1990 2005 2007 2020 2030 1990 2005 2007 2020 2030 2007 2020 2030 2030Total 22.5 45.2 48.8 81.0 152.5 100.0 100.0 100.0 100.0 100.0 4.7 4.0 6.5 5.1
Industry 1.7 9.2 10.4 28.8 67.8 7.6 20.5 21.2 35.6 44.5 11.1 8.2 8.9 8.5Transportation 1.4 7.1 8.1 19.0 43.3 6.3 15.6 16.6 23.4 28.4 10.8 6.7 8.6 7.6Others 19.4 28.6 29.6 32.1 40.4 86.0 63.2 60.6 39.6 26.5 2.5 0.6 2.3 1.4Non-energy 0.0 0.3 0.8 1.1 1.0 0.1 0.7 1.6 1.4 0.7 21.6 3.0 -1.2 1.2
Total 22.5 45.2 48.7 81.0 152.5 100.0 100.0 100.0 100.0 100.0 4.7 4.0 6.5 5.1Coal 1.3 6.0 6.2 15.4 31.7 5.9 13.3 12.7 19.0 20.8 9.5 7.3 7.5 7.4Oil 2.4 12.0 13.1 29.9 64.0 10.5 26.5 26.8 36.9 41.9 10.6 6.6 7.9 7.1Natural gas - 0.1 0.5 1.3 1.6 - 0.2 1.1 1.6 1.1 - 6.7 2.6 4.9Electricity 0.5 4.0 5.3 17.7 38.8 2.4 8.8 10.8 21.9 25.4 14.4 9.8 8.1 9.1Heat - - - - - - - - - - - - - -Others 18.3 23.1 23.7 16.7 16.4 81.3 51.2 48.6 20.6 10.7 1.5 -2.7 -0.2 -1.6
1990- 2007- 2020- 2007-1990 2005 2007 2020 2030 1990 2005 2007 2020 2030 2007 2020 2030 2030
Total 8.7 53.5 69.5 226.6 480.9 100.0 100.0 100.0 100.0 100.0 13.0 9.5 7.8 8.8Coal 2.0 8.7 14.8 115.5 290.8 23.1 16.2 21.4 51.0 60.5 12.5 17.1 9.7 13.8Oil 1.3 1.9 2.5 - - 15.0 3.5 3.5 - - 3.8 -100.0 - -100.0Natural gas - 21.8 22.3 48.4 65.8 - 40.8 32.1 21.4 13.7 - 6.1 3.1 4.8Nuclear - - - 4.2 47.4 - - - 1.9 9.9 - - 27.4 -Hydro 5.4 21.1 29.9 57.0 74.0 61.9 39.4 43.0 25.1 15.4 10.6 5.1 2.7 4.0Geothermal - - - - - - - - - - - - - -Others - - - 1.5 2.8 - - - 0.7 0.6 - - 6.3 -
1990- 2007- 2020- 2007-1990 2005 2007 2020 2030 1990 2005 2007 2020 2030 2007 2020 2030 2030
Total 1.3 7.6 9.4 39.0 85.9 100.0 100.0 100.0 100.0 100.0 12.5 11.6 8.2 10.1Coal 0.9 2.1 3.6 28.4 71.4 69.8 28.0 38.9 72.7 83.1 8.7 17.1 9.7 13.8Oil 0.4 0.7 0.8 - - 30.0 8.9 8.7 - - 4.6 -100.0 - -100.0Natural gas 0.0 4.8 4.9 10.7 14.5 0.2 63.1 52.4 27.3 16.9 55.5 6.1 3.1 4.8
1990- 2007- 2020- 2007-1990 2005 2007 2020 2030 1990 2005 2007 2020 2030 2007 2020 2030 2030
Total 22.3 36.5 36.3 36.1 35.7 2.9 0.0 -0.1 -0.1Coal 19.4 35.0 35.0 35.0 35.0 3.5 0.0 0.0 0.0Oil 29.4 23.8 25.8 - - -0.8 - - -Natural gas 0.0 39.0 39.0 39.0 39.0 - 0.0 0.0 0.0
1990- 2007- 2020- 2007-1990 2005 2007 2020 2030 1990 2005 2007 2020 2030 2007 2020 2030 2030
Total 4.6 22.9 25.4 80.5 177.7 10.5 9.3 8.2 8.8
Energy and economic indicators1990- 2007- 2020- 2007-
1990 2005 2007 2020 2030 2007 2020 2030 203015.0 44.8 52.6 129.5 279.6 7.7 7.2 8.0 7.566.2 83.1 85.2 94.7 102.8 1.5 0.8 0.8 0.8
0.2 0.5 0.6 1.4 2.7 6.1 6.3 7.1 6.70.4 0.6 0.7 1.2 2.2 3.4 4.8 6.2 5.4
1,621 1,135 1,059 879 808 -2.5 -1.4 -0.8 -1.2308 512 483 621 636 2.7 2.0 0.2 1.2
0.19 0.45 0.46 0.71 0.79 5.3 3.4 1.1 2.4
AAGR(%)
AAGR(%)
AAGR(%)
Share, %
Share, %
AAGR(%)
Share, %
%
generation
Power MTOEgeneration
Thermal Efficiency
CO2 emissions Mt-C
Primary energy consumption per GDP (toe/million 2000 US Dollars)
GDP (billions of 2000 US dollars)Population (million of people)GDP per capita (thousands of 2000 USD/person)
CO2 emissions per primary energy consumption (t-C/toe)CO2 emissions per GDP (t-C/million 2000 US Dollars)
Primary energy consumption per capita (toe/person)
VIETNAM [BAU]Primary energy Mtoe Share, % AAGR(%)consumption
Share, % AAGR(%)Final energy Mtoe
Input
demand
AAGR(%)Power TWh Share, %
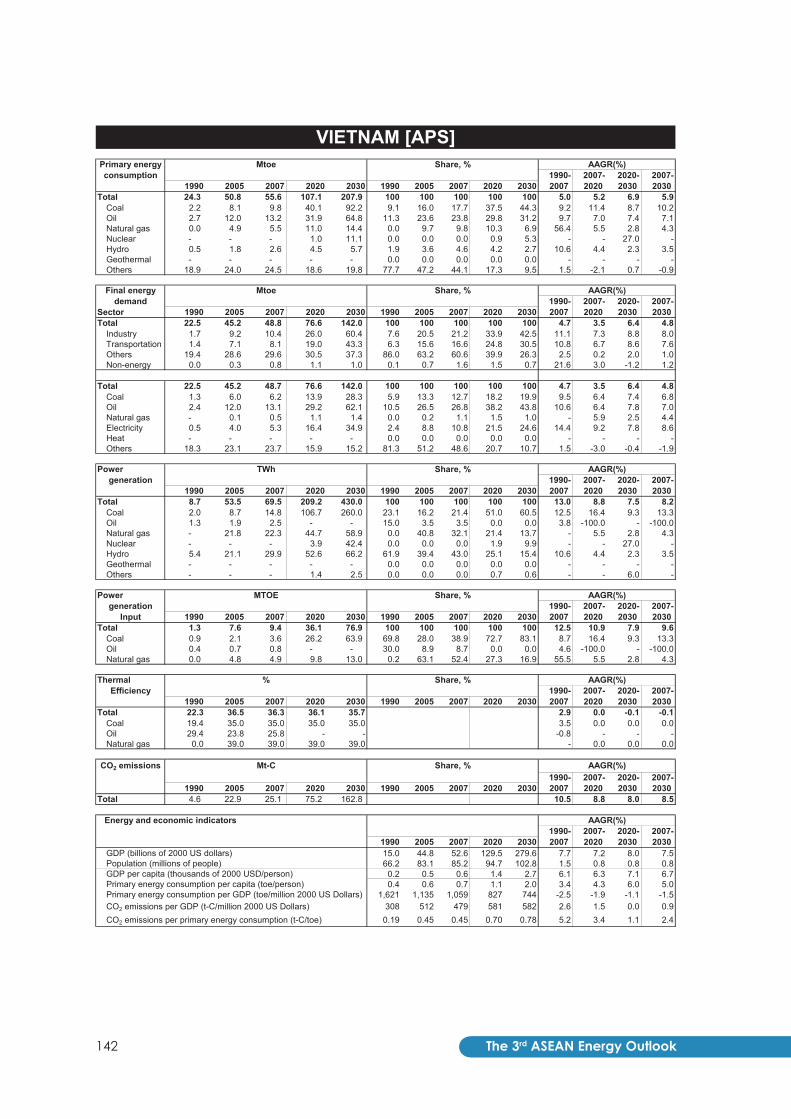
The 3rd ASEAN Energy Outlook142
1990- 2007- 2020- 2007-1990 2005 2007 2020 2030 1990 2005 2007 2020 2030 2007 2020 2030 2030
Total 24.3 50.8 55.6 107.1 207.9 100 100 100 100 100 5.0 5.2 6.9 5.9Coal 2.2 8.1 9.8 40.1 92.2 9.1 16.0 17.7 37.5 44.3 9.2 11.4 8.7 10.2Oil 2.7 12.0 13.2 31.9 64.8 11.3 23.6 23.8 29.8 31.2 9.7 7.0 7.4 7.1Natural gas 0.0 4.9 5.5 11.0 14.4 0.0 9.7 9.8 10.3 6.9 56.4 5.5 2.8 4.3Nuclear - - - 1.0 11.1 0.0 0.0 0.0 0.9 5.3 - - 27.0 -Hydro 0.5 1.8 2.6 4.5 5.7 1.9 3.6 4.6 4.2 2.7 10.6 4.4 2.3 3.5Geothermal - - - - - 0.0 0.0 0.0 0.0 0.0 - - - -Others 18.9 24.0 24.5 18.6 19.8 77.7 47.2 44.1 17.3 9.5 1.5 -2.1 0.7 -0.9
1990- 2007- 2020- 2007-Sector 1990 2005 2007 2020 2030 1990 2005 2007 2020 2030 2007 2020 2030 2030Total 22.5 45.2 48.8 76.6 142.0 100 100 100 100 100 4.7 3.5 6.4 4.8
Industry 1.7 9.2 10.4 26.0 60.4 7.6 20.5 21.2 33.9 42.5 11.1 7.3 8.8 8.0Transportation 1.4 7.1 8.1 19.0 43.3 6.3 15.6 16.6 24.8 30.5 10.8 6.7 8.6 7.6Others 19.4 28.6 29.6 30.5 37.3 86.0 63.2 60.6 39.9 26.3 2.5 0.2 2.0 1.0Non-energy 0.0 0.3 0.8 1.1 1.0 0.1 0.7 1.6 1.5 0.7 21.6 3.0 -1.2 1.2
Total 22.5 45.2 48.7 76.6 142.0 100 100 100 100 100 4.7 3.5 6.4 4.8Coal 1.3 6.0 6.2 13.9 28.3 5.9 13.3 12.7 18.2 19.9 9.5 6.4 7.4 6.8Oil 2.4 12.0 13.1 29.2 62.1 10.5 26.5 26.8 38.2 43.8 10.6 6.4 7.8 7.0Natural gas - 0.1 0.5 1.1 1.4 0.0 0.2 1.1 1.5 1.0 - 5.9 2.5 4.4Electricity 0.5 4.0 5.3 16.4 34.9 2.4 8.8 10.8 21.5 24.6 14.4 9.2 7.8 8.6Heat - - - - - 0.0 0.0 0.0 0.0 0.0 - - - -Others 18.3 23.1 23.7 15.9 15.2 81.3 51.2 48.6 20.7 10.7 1.5 -3.0 -0.4 -1.9
1990- 2007- 2020- 2007-1990 2005 2007 2020 2030 1990 2005 2007 2020 2030 2007 2020 2030 2030
Total 8.7 53.5 69.5 209.2 430.0 100 100 100 100 100 13.0 8.8 7.5 8.2Coal 2.0 8.7 14.8 106.7 260.0 23.1 16.2 21.4 51.0 60.5 12.5 16.4 9.3 13.3Oil 1.3 1.9 2.5 - - 15.0 3.5 3.5 0.0 0.0 3.8 -100.0 - -100.0Natural gas - 21.8 22.3 44.7 58.9 0.0 40.8 32.1 21.4 13.7 - 5.5 2.8 4.3Nuclear - - - 3.9 42.4 0.0 0.0 0.0 1.9 9.9 - - 27.0 -Hydro 5.4 21.1 29.9 52.6 66.2 61.9 39.4 43.0 25.1 15.4 10.6 4.4 2.3 3.5Geothermal - - - - - 0.0 0.0 0.0 0.0 0.0 - - - -Others - - - 1.4 2.5 0.0 0.0 0.0 0.7 0.6 - - 6.0 -
1990- 2007- 2020- 2007-1990 2005 2007 2020 2030 1990 2005 2007 2020 2030 2007 2020 2030 2030
Total 1.3 7.6 9.4 36.1 76.9 100 100 100 100 100 12.5 10.9 7.9 9.6Coal 0.9 2.1 3.6 26.2 63.9 69.8 28.0 38.9 72.7 83.1 8.7 16.4 9.3 13.3Oil 0.4 0.7 0.8 - - 30.0 8.9 8.7 0.0 0.0 4.6 -100.0 - -100.0Natural gas 0.0 4.8 4.9 9.8 13.0 0.2 63.1 52.4 27.3 16.9 55.5 5.5 2.8 4.3
1990- 2007- 2020- 2007-1990 2005 2007 2020 2030 1990 2005 2007 2020 2030 2007 2020 2030 2030
Total 22.3 36.5 36.3 36.1 35.7 2.9 0.0 -0.1 -0.1Coal 19.4 35.0 35.0 35.0 35.0 3.5 0.0 0.0 0.0Oil 29.4 23.8 25.8 - - -0.8 - - -Natural gas 0.0 39.0 39.0 39.0 39.0 - 0.0 0.0 0.0
1990- 2007- 2020- 2007-1990 2005 2007 2020 2030 1990 2005 2007 2020 2030 2007 2020 2030 2030
Total 4.6 22.9 25.1 75.2 162.8 10.5 8.8 8.0 8.5
Energy and economic indicators1990- 2007- 2020- 2007-
1990 2005 2007 2020 2030 2007 2020 2030 203015.0 44.8 52.6 129.5 279.6 7.7 7.2 8.0 7.566.2 83.1 85.2 94.7 102.8 1.5 0.8 0.8 0.8
0.2 0.5 0.6 1.4 2.7 6.1 6.3 7.1 6.70.4 0.6 0.7 1.1 2.0 3.4 4.3 6.0 5.0
1,621 1,135 1,059 827 744 -2.5 -1.9 -1.1 -1.5308 512 479 581 582 2.6 1.5 0.0 0.9
0.19 0.45 0.45 0.70 0.78 5.2 3.4 1.1 2.4
VIETNAM [APS]Primary energy Mtoe Share, % AAGR(%)consumption
Final energy Mtoe
Share, %
Share, % AAGR(%)
AAGR(%)generation
Power MTOE
demand
Power TWh
Share, %
AAGR(%)Share, %
Inputgeneration
Primary energy consumption per GDP (toe/million 2000 US Dollars)
GDP (billions of 2000 US dollars)Population (millions of people)GDP per capita (thousands of 2000 USD/person)Primary energy consumption per capita (toe/person)
CO2 emissions per GDP (t-C/million 2000 US Dollars)CO2 emissions per primary energy consumption (t-C/toe)
AAGR(%)
AAGR(%)Efficiency
CO2 emissions Mt-C Share, % AAGR(%)
Thermal %

143The 3rd ASEAN Energy Outlook
Please note that this publication is subject to specific restrictions that limit its use and distribution. All enquiries should be addressed to Beni Suryadi:
Telephone: (+62-21) 527-93-32 E-mail: [email protected]

144 The 3rd ASEAN Energy Outlook

145The 3rd ASEAN Energy Outlook