Embed Size (px)
Citation preview
The 7th CJK Trilateral Workshop (Tokyo, Japan; June 7, 2013)
The East Asian Economic Integration and the Role of CJK FTA
Fukunari Kimura Professor, Faculty of Economics, Keio University Chief Economist, Economic Research Institute
for ASEAN and East Asia (ERIA)
1 2013/06/07
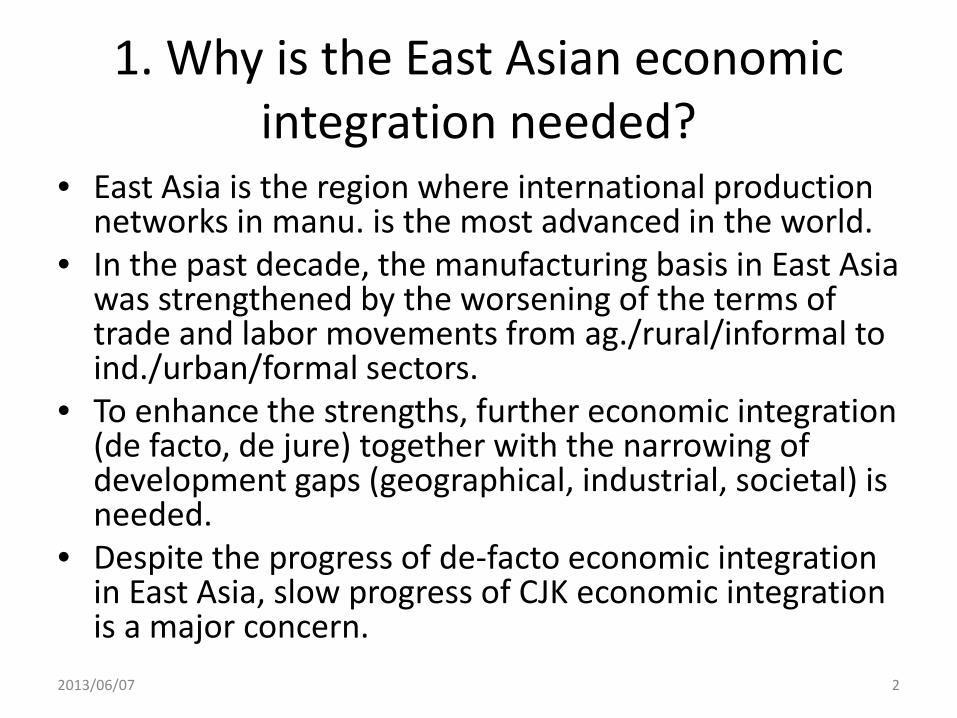
1. Why is the East Asian economic integration needed?
• East Asia is the region where international production networks in manu. is the most advanced in the world.
• In the past decade, the manufacturing basis in East Asia was strengthened by the worsening of the terms of trade and labor movements from ag./rural/informal to ind./urban/formal sectors.
• To enhance the strengths, further economic integration (de facto, de jure) together with the narrowing of development gaps (geographical, industrial, societal) is needed.
• Despite the progress of de-facto economic integration in East Asia, slow progress of CJK economic integration is a major concern.
2 2013/06/07
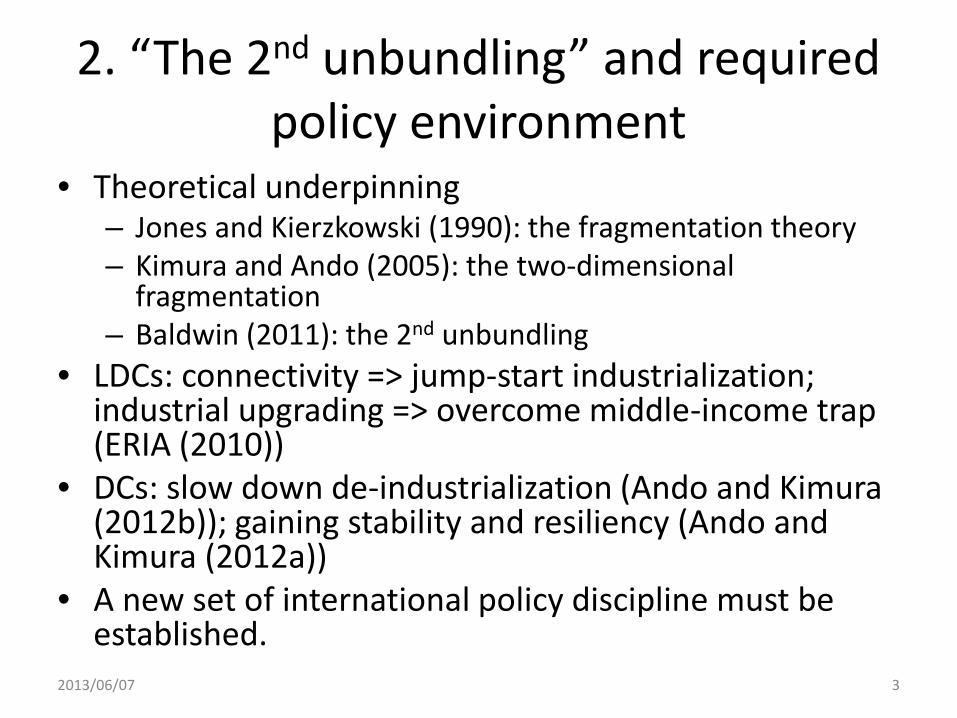
2. “The 2nd unbundling” and required policy environment
• Theoretical underpinning – Jones and Kierzkowski (1990): the fragmentation theory – Kimura and Ando (2005): the two-dimensional
fragmentation – Baldwin (2011): the 2nd unbundling
• LDCs: connectivity => jump-start industrialization; industrial upgrading => overcome middle-income trap (ERIA (2010))
• DCs: slow down de-industrialization (Ando and Kimura (2012b)); gaining stability and resiliency (Ando and Kimura (2012a))
• A new set of international policy discipline must be established.
3 2013/06/07
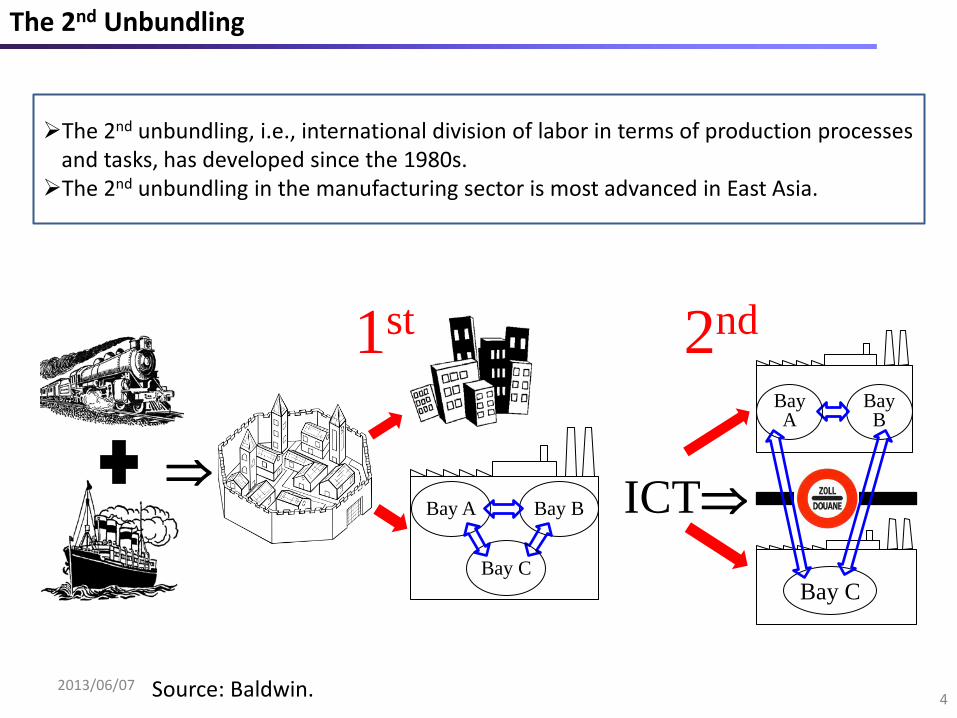
The 2nd Unbundling
⇒ Bay B Bay A
Bay C
Bay B
Bay A
Bay C
1st 2nd
ICT⇒
The 2nd unbundling, i.e., international division of labor in terms of production processes and tasks, has developed since the 1980s. The 2nd unbundling in the manufacturing sector is most advanced in East Asia.
Source: Baldwin. 4 2013/06/07
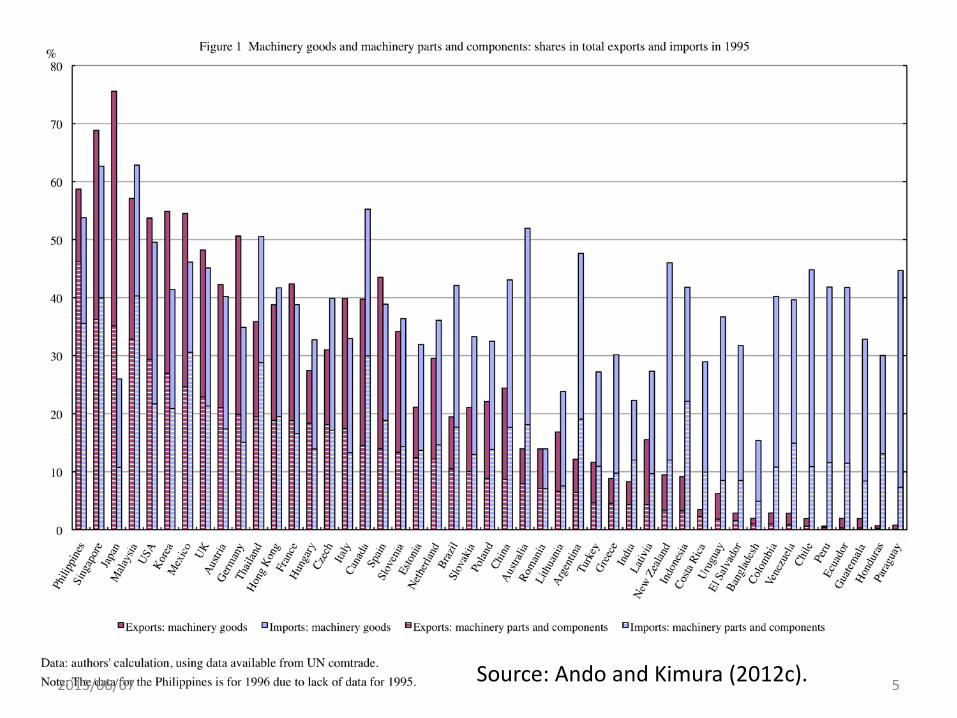
Source: Ando and Kimura (2012c). 5 2013/06/07
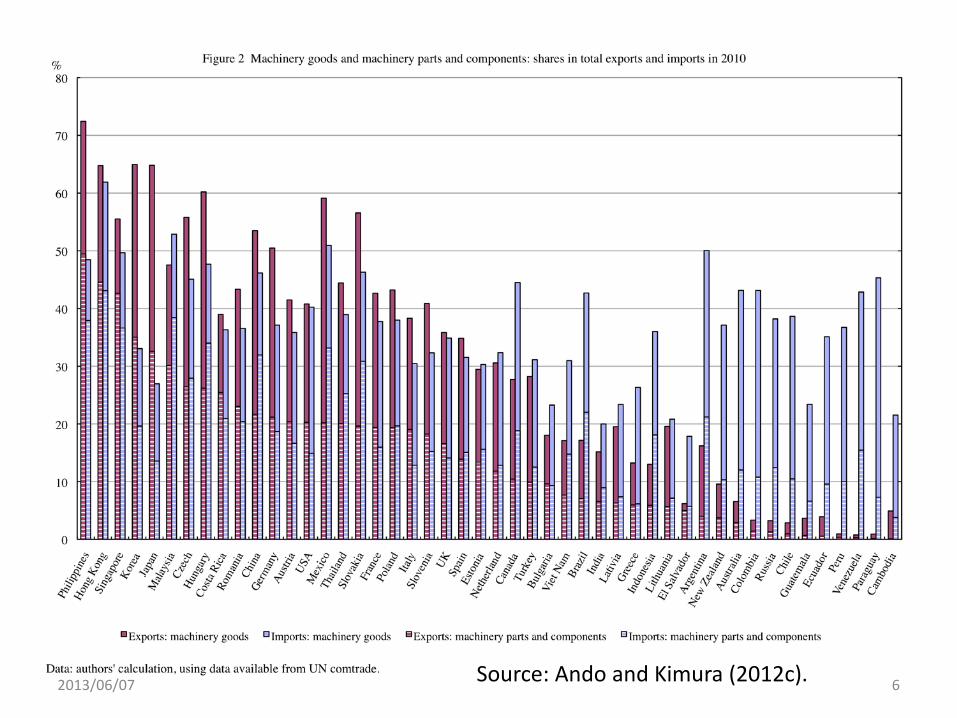
Source: Ando and Kimura (2012c). 6 2013/06/07
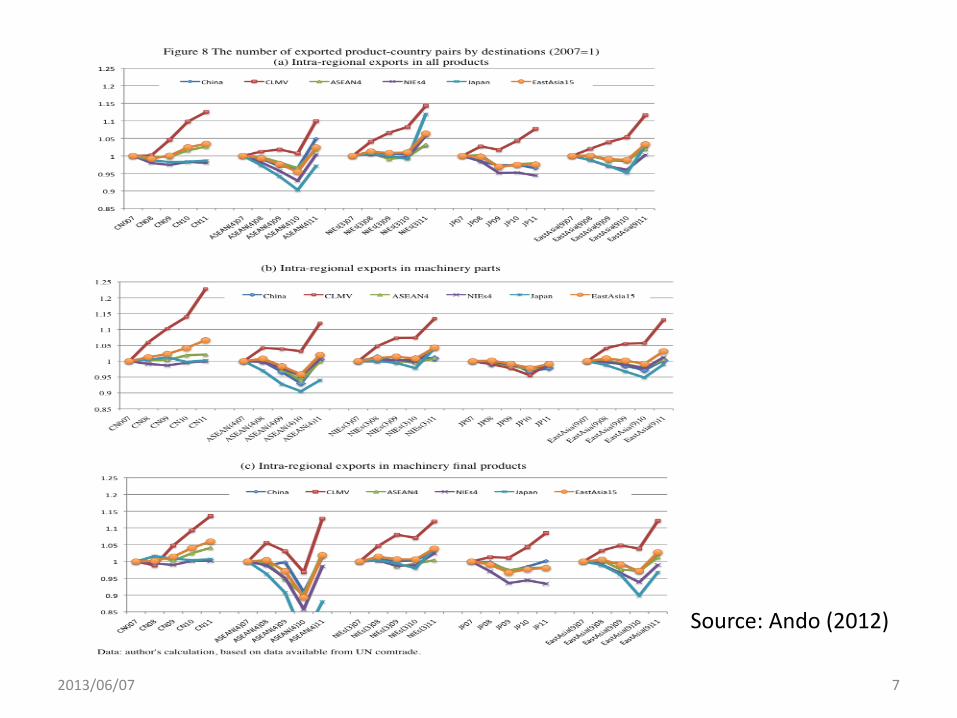
Source: Ando (2012)
7 2013/06/07
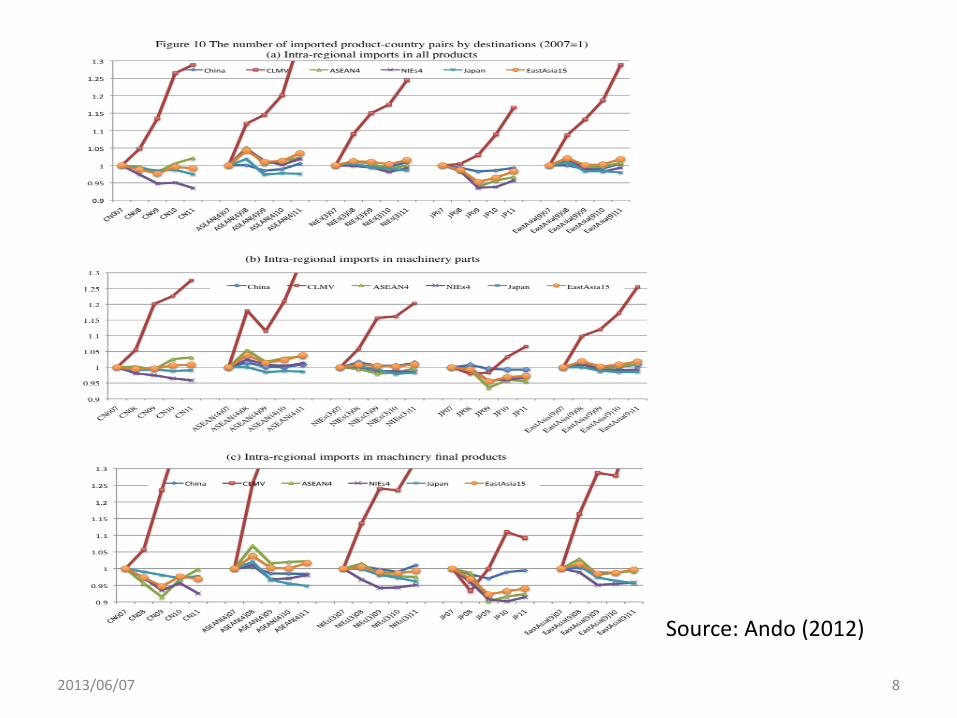
Source: Ando (2012)
8 2013/06/07
PB
PB PB
PB
PB
SL
SL
SL SL
SL
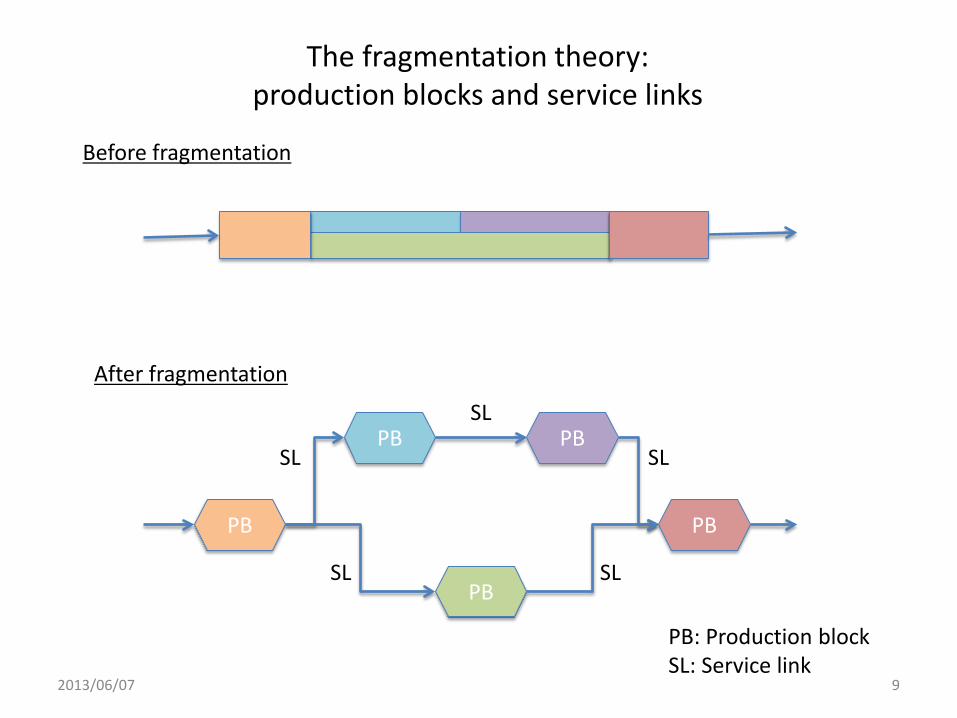
PB: Production block SL: Service link
Before fragmentation
After fragmentation
The fragmentation theory: production blocks and service links
9 2013/06/07
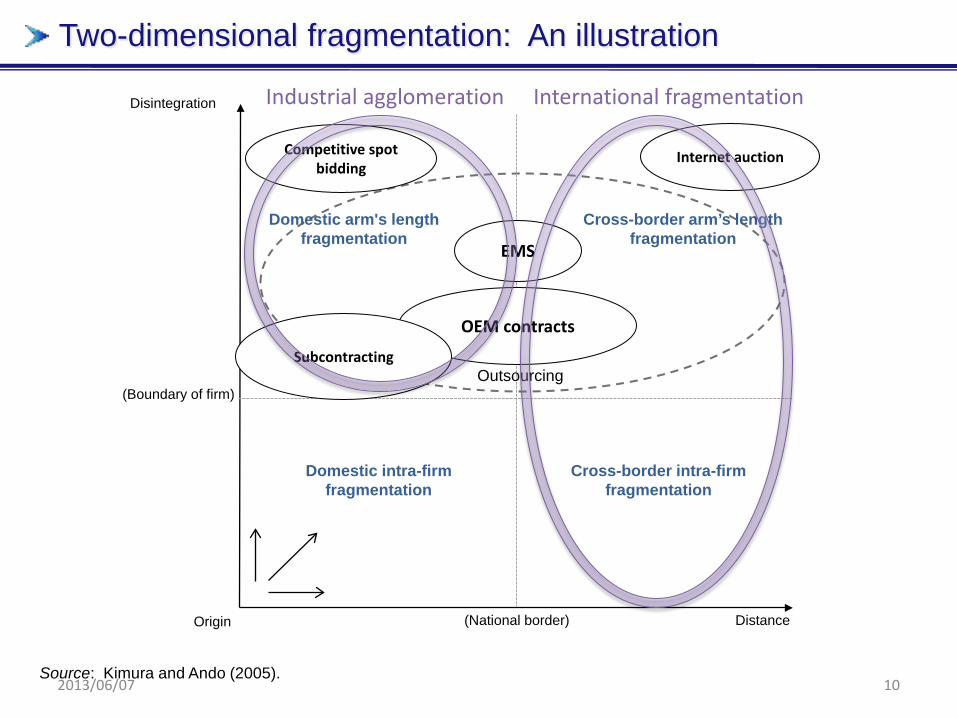
Two-dimensional fragmentation: An illustration
Source: Kimura and Ando (2005).
OEM contracts
Subcontracting
Internet auction Competitive spot bidding
Cross-border intra-firm fragmentation
Disintegration
(National border) Distance
(Boundary of firm)
Origin
Domestic intra-firm fragmentation
Domestic arm's length fragmentation
Cross-border arm’s length fragmentation
Outsourcing
EMS
Industrial agglomeration International fragmentation
10 2013/06/07
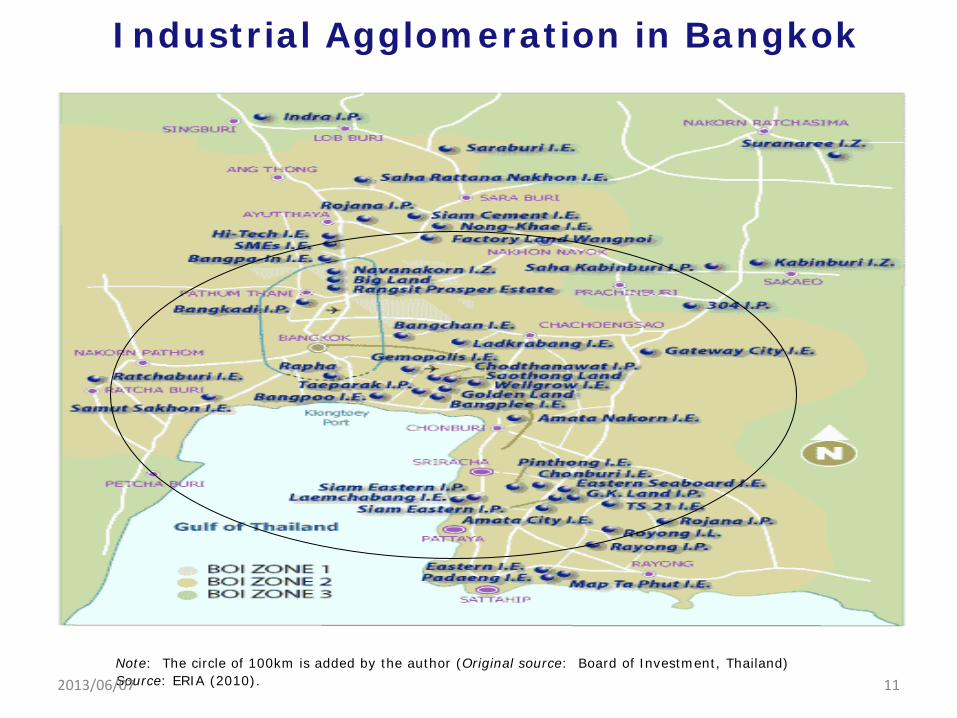
Industrial Agglomeration in Bangkok
Note: The circle of 100km is added by the author (Original source: Board of Investment, Thailand) Source: ERIA (2010). 11 2013/06/07
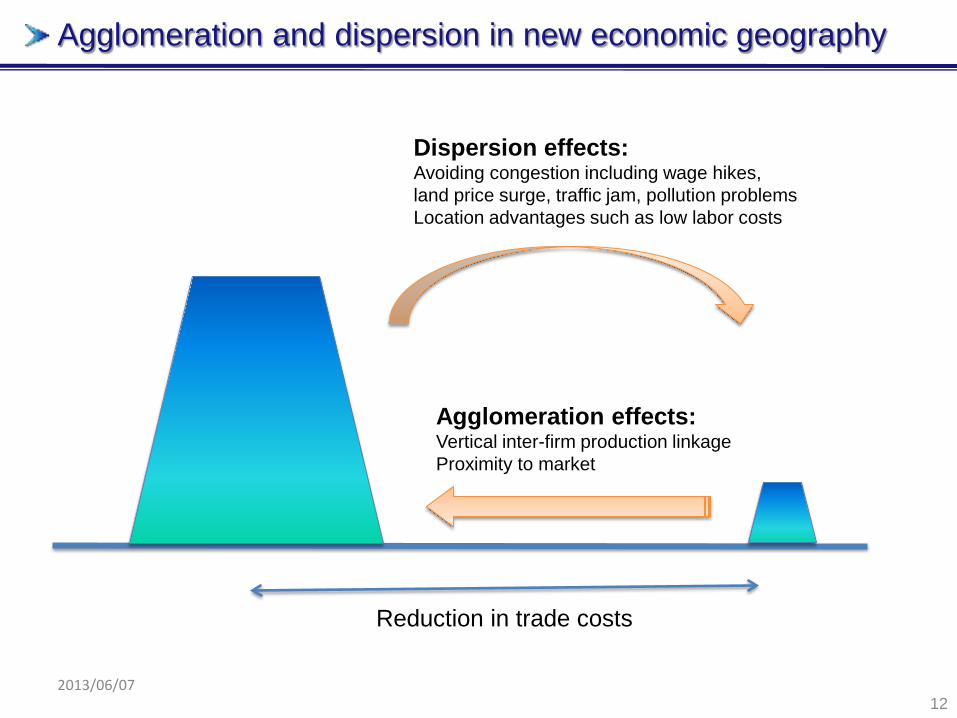
Agglomeration and dispersion in new economic geography
12
Reduction in trade costs
Agglomeration effects: Vertical inter-firm production linkage Proximity to market
Dispersion effects: Avoiding congestion including wage hikes, land price surge, traffic jam, pollution problems Location advantages such as low labor costs
2013/06/07

SMEs
Innovation in
industrial agglomeration
International production networks
Access to technology Access to finance Fostering human resources Establishing industrial organizations
SME-related policies reviewed by SME Policy Index
Technology transfer/spillover Managerial knowhow Market access
13 2013/06/07

time
Foreign
Domestic
Decision of international production networking
Establishment of a foreign
affiliate Reach full operation
Domestic adjustments on inputs (K, H, L) domestic establishments domestic affiliates exp./imp. patterns
Preparation period for FDI (typically 2-3 years)
Expanding operation (typically 2-3 years)
Figure Typical sequence in international production networking
Source: Ando and Kimura (2012b). 14 2013/06/07
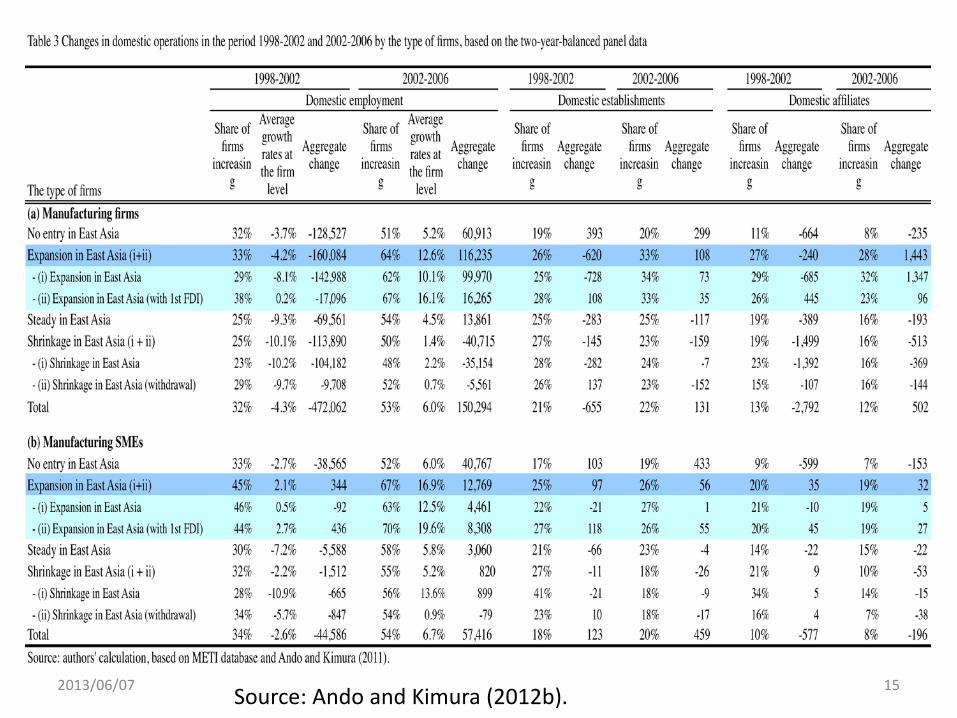
Source: Ando and Kimura (2012b). 15 2013/06/07
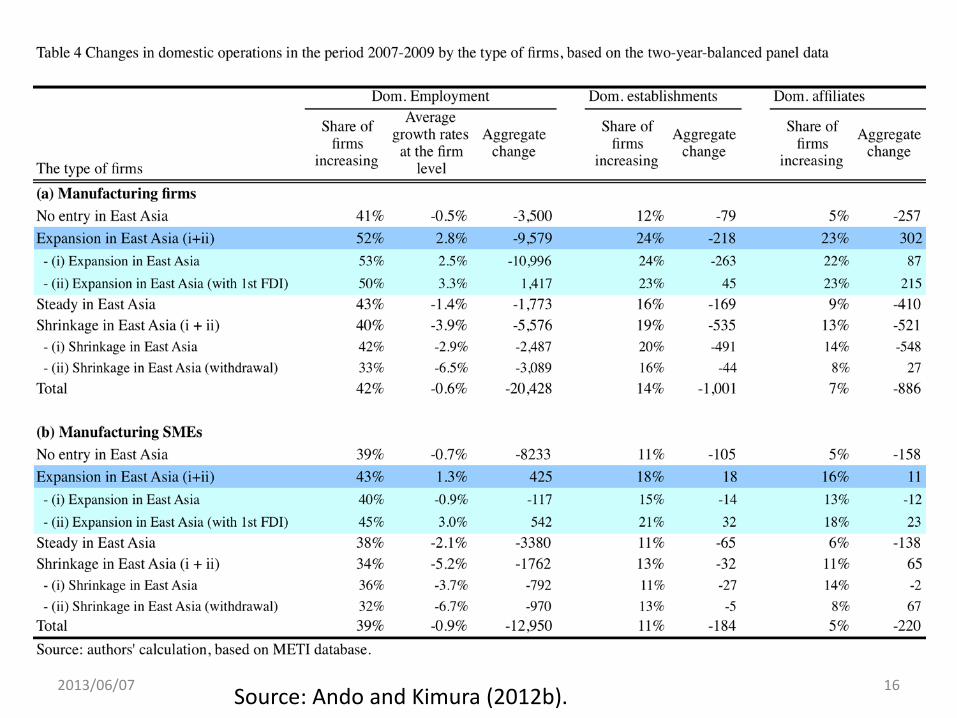
Source: Ando and Kimura (2012b). 16 2013/06/07
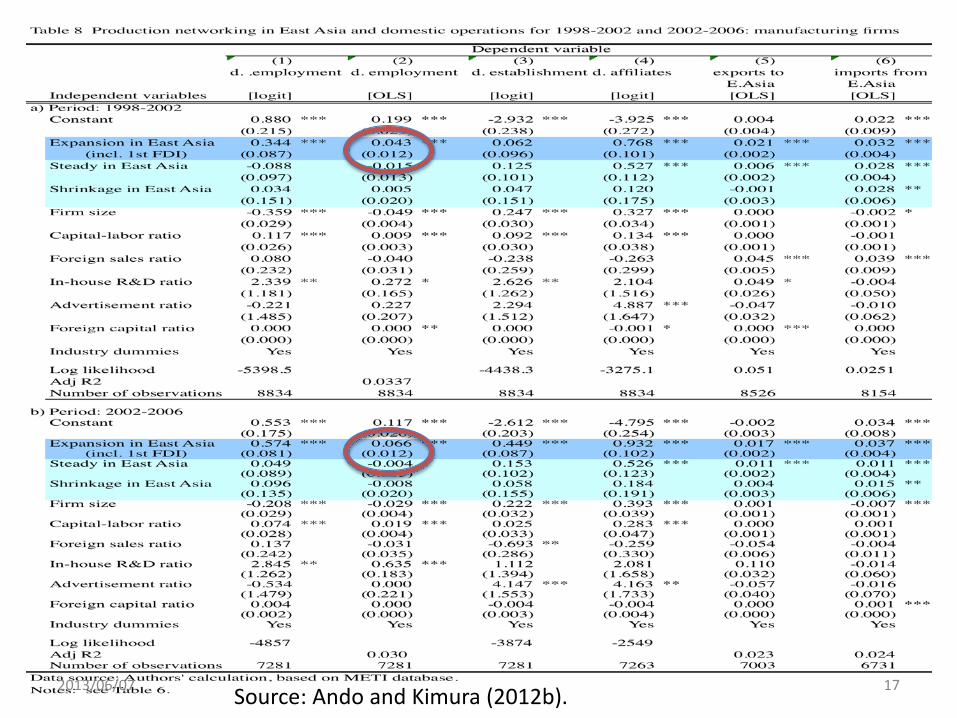
Source: Ando and Kimura (2012b). 17 2013/06/07
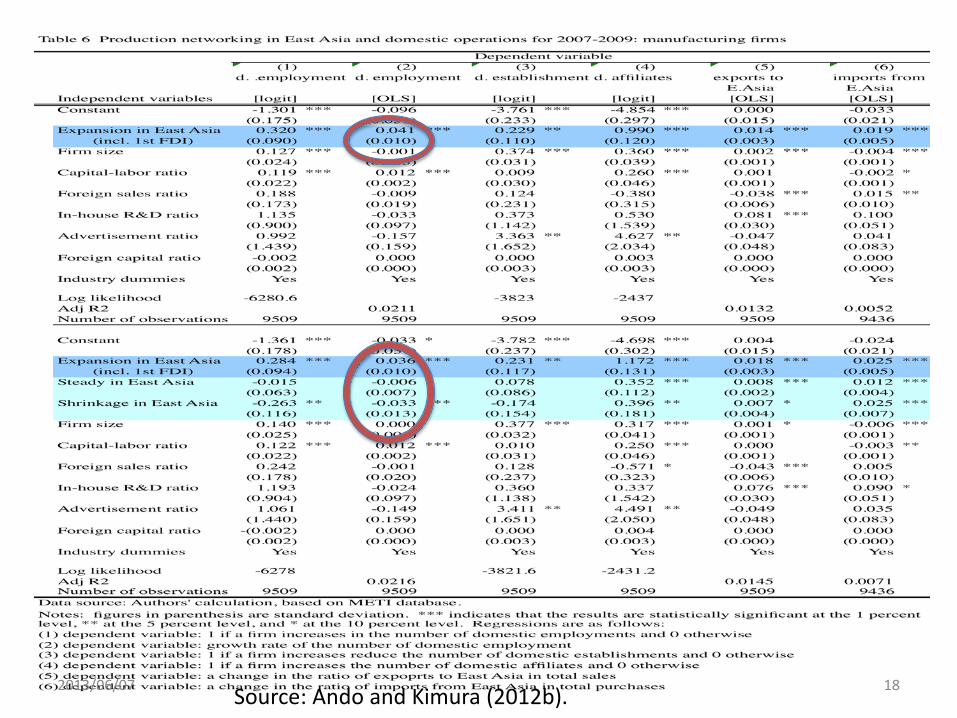
Source: Ando and Kimura (2012b). 18 2013/06/07
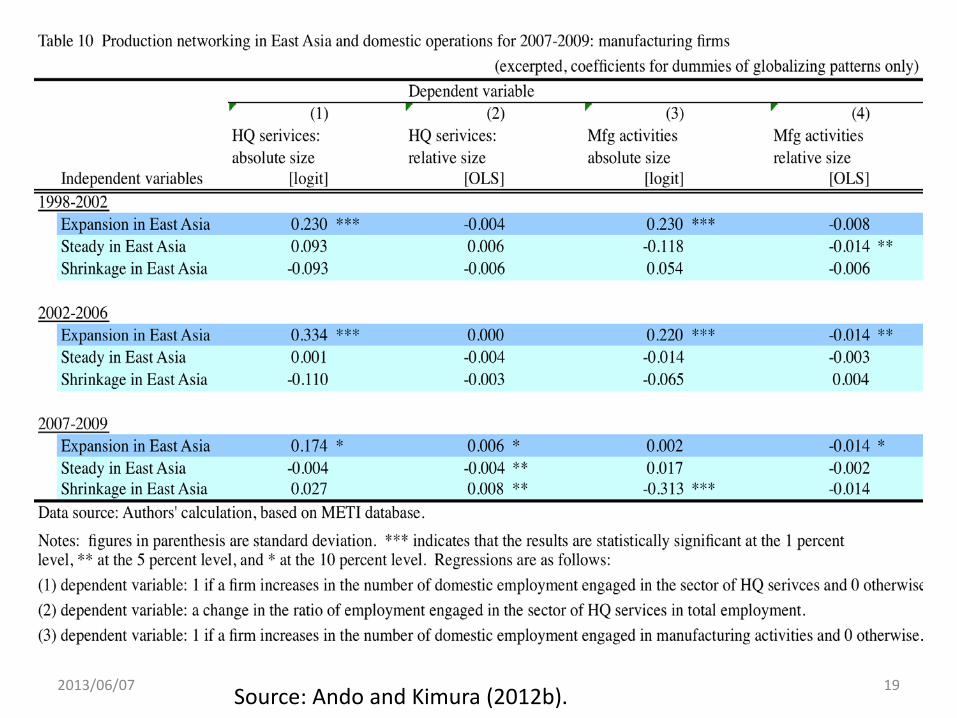
Source: Ando and Kimura (2012b). 19 2013/06/07
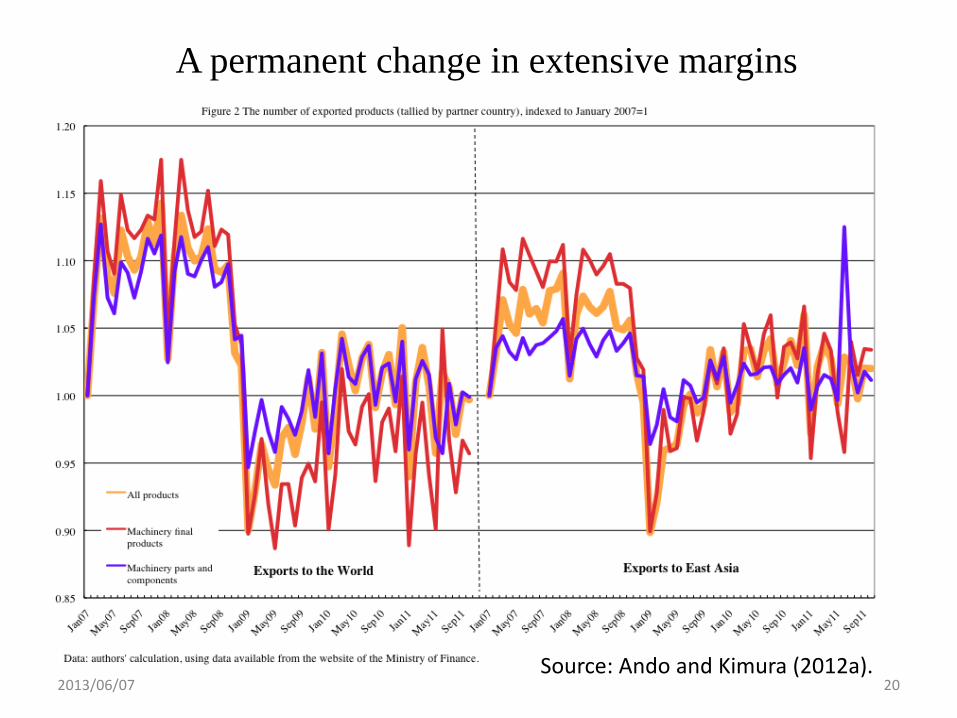
A permanent change in extensive margins
Source: Ando and Kimura (2012a). 20 2013/06/07
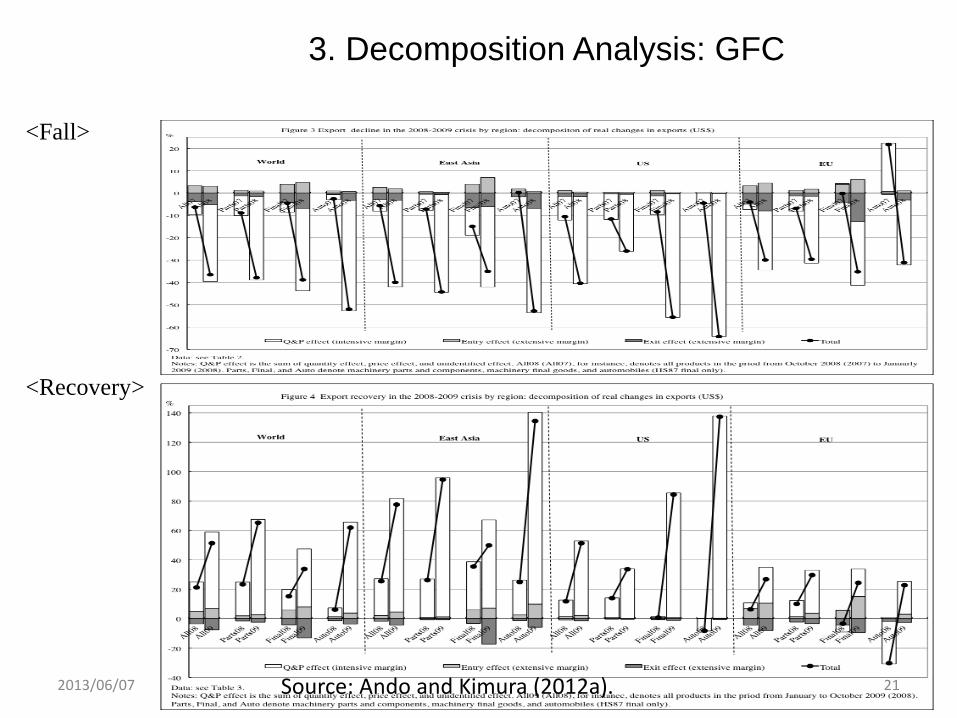
3. Decomposition Analysis: GFC
<Fall>
<Recovery>
Source: Ando and Kimura (2012a). 21 2013/06/07
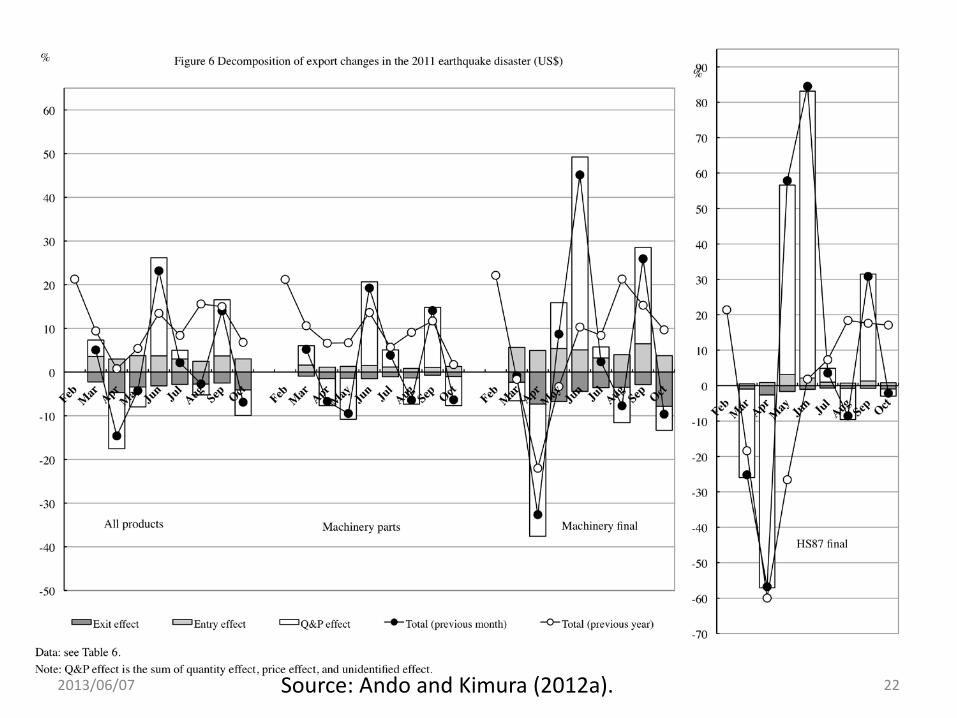
Source: Ando and Kimura (2012a). 22 2013/06/07
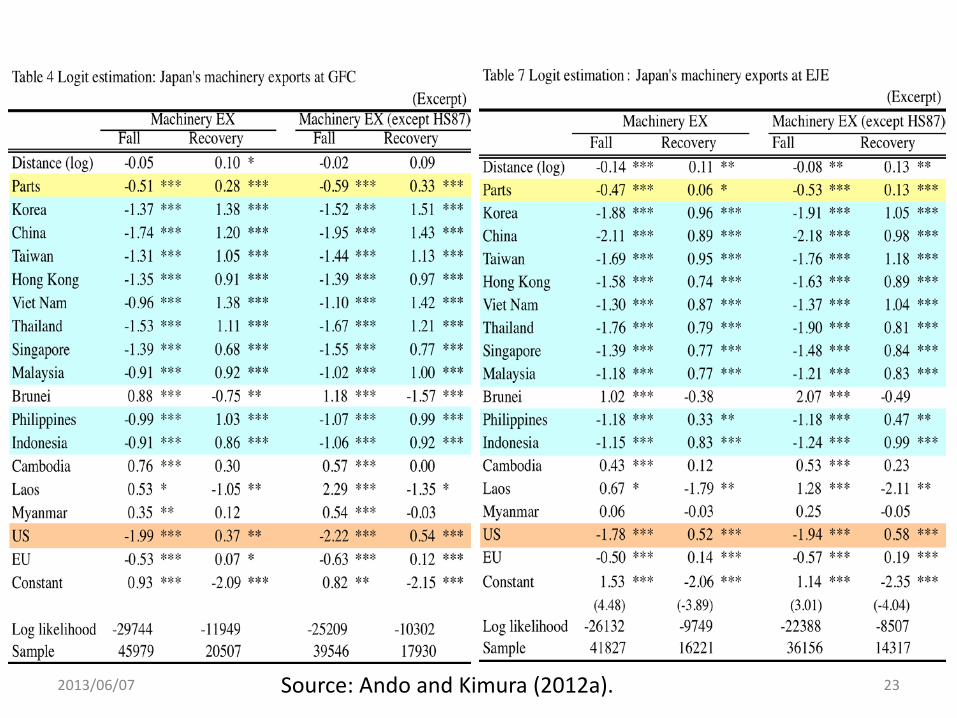
Source: Ando and Kimura (2012a). 23 2013/06/07
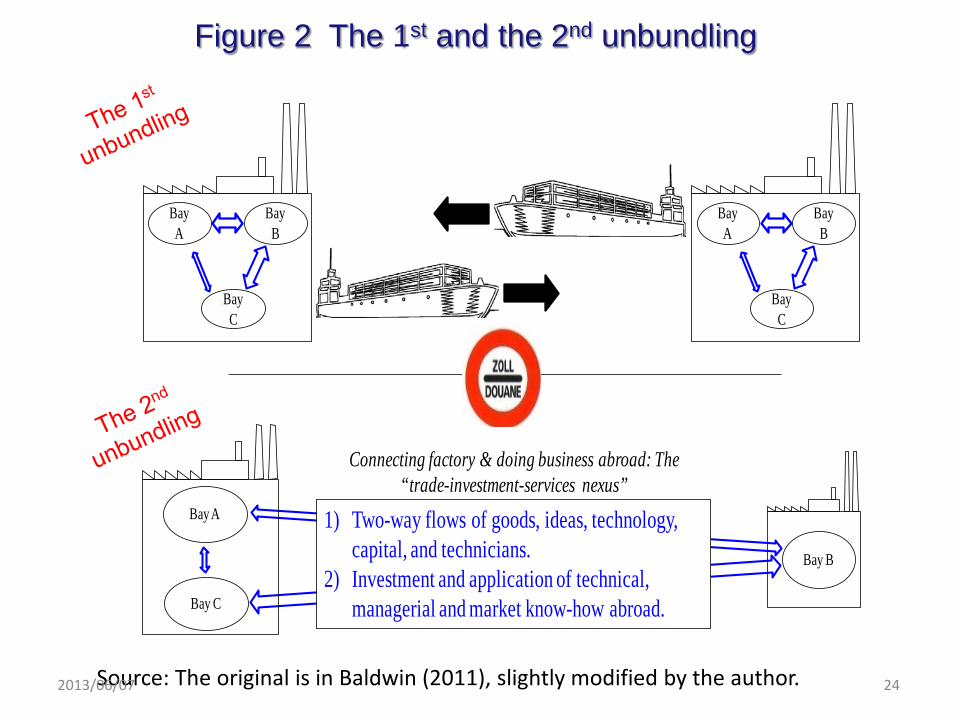
Bay B
Bay A
Bay C
Bay B
Bay A
Bay C
Bay B
Bay A
Bay C
1) Two-way flows of goods, ideas, technology, capital, and technicians.
2) Investment and application of technical, managerial and market know-how abroad.
Connecting factory & doing business abroad: The “trade-investment-services nexus”
Source: The original is in Baldwin (2011), slightly modified by the author.
Figure 2 The 1st and the 2nd unbundling
24 2013/06/07
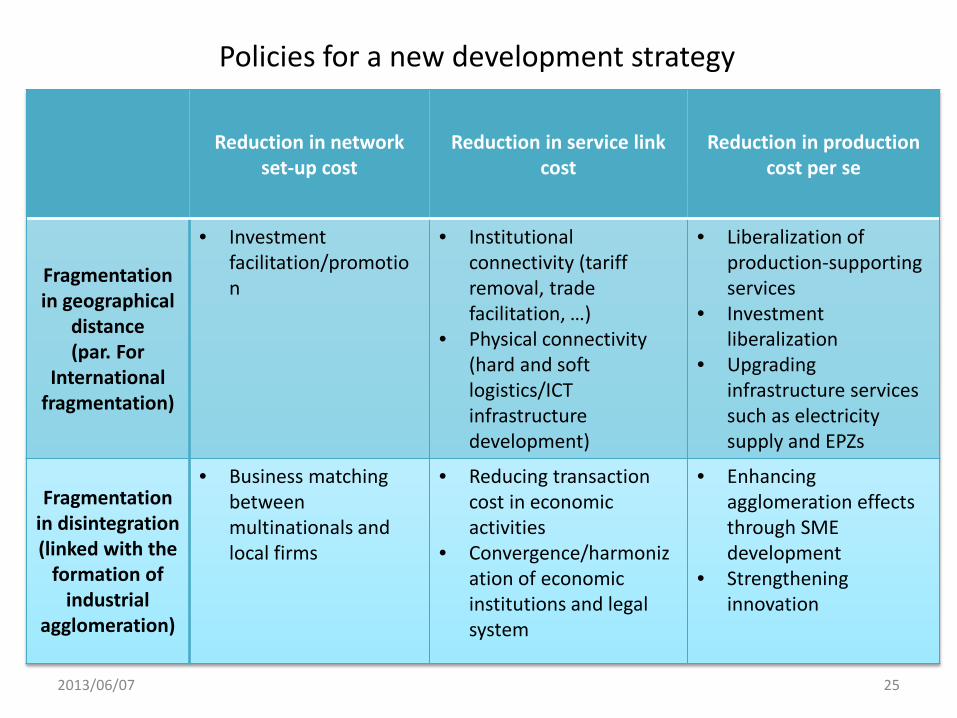
Reduction in network set-up cost
Reduction in service link cost
Reduction in production cost per se
Fragmentation in geographical
distance (par. For
International fragmentation)
• Investment facilitation/promotion
• Institutional connectivity (tariff removal, trade facilitation, …)
• Physical connectivity (hard and soft logistics/ICT infrastructure development)
• Liberalization of production-supporting services
• Investment liberalization
• Upgrading infrastructure services such as electricity supply and EPZs
Fragmentation in disintegration (linked with the
formation of industrial
agglomeration)
• Business matching between multinationals and local firms
• Reducing transaction cost in economic activities
• Convergence/harmonization of economic institutions and legal system
• Enhancing agglomeration effects through SME development
• Strengthening innovation
Policies for a new development strategy
25 2013/06/07
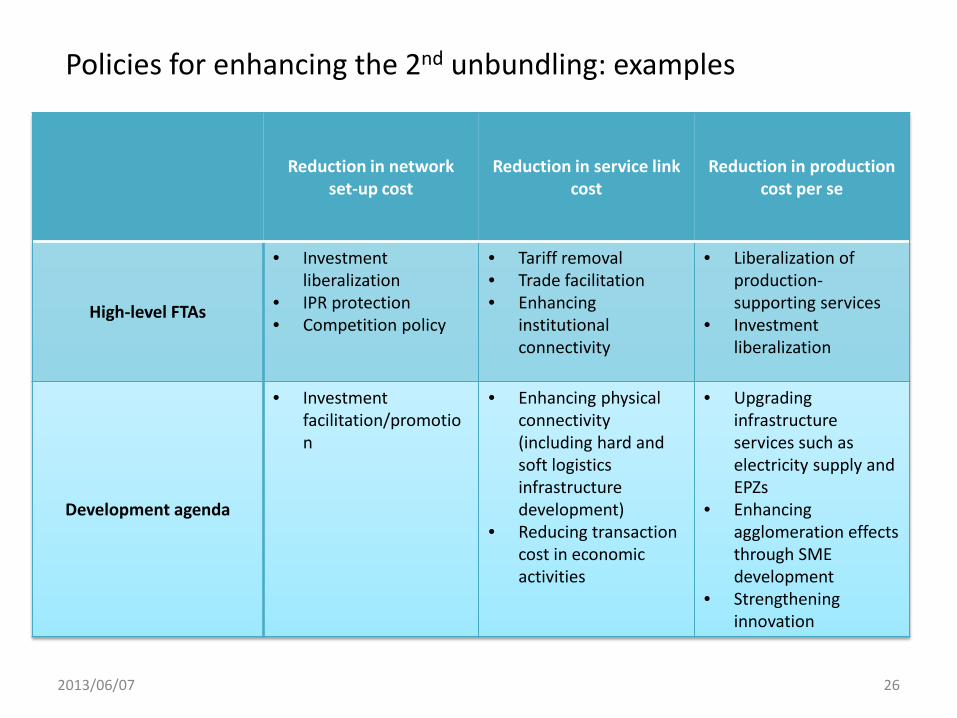
26
Reduction in network set-up cost
Reduction in service link cost
Reduction in production cost per se
High-level FTAs
• Investment liberalization
• IPR protection • Competition policy
• Tariff removal • Trade facilitation • Enhancing
institutional connectivity
• Liberalization of production-supporting services
• Investment liberalization
Development agenda
• Investment facilitation/promotion
• Enhancing physical connectivity (including hard and soft logistics infrastructure development)
• Reducing transaction cost in economic activities
• Upgrading infrastructure services such as electricity supply and EPZs
• Enhancing agglomeration effects through SME development
• Strengthening innovation
Policies for enhancing the 2nd unbundling: examples
2013/06/07
3. Possible influence of TPP • TPP is claimed to be a “high-level” FTA.
– Particularly, tariff removal, services and investment liberalization, IPR; possibly government procurement, competition policy
– Thinner intention to organize policy discipline for the 2nd unbundling (cf. global value chains)
– For Japan, effective way to clean up agricultural protection (to some extent) and gain negotiation power.
• Domino effect – Negotiating countries: 8 -> 9 -> 11 -> 12? – Jpn-EU FTA, US-EU FTA, …
• East Asian integration process would also be accelerated and deepened; “respectable levels of liberalization and coverage” are needed.
27 2013/06/07

4. Possible contents of RCEP
• Mid-term Review of AEC Blueprint (ERIA (2012)) – ASEAN’s economic integration is the deepest in East
Asia. • Logically, ASEAN should set the ASEAN integration
as a negotiation basis and deepen ASEAN+1 FTAs. – Tariffs, ROOs, trade facilitation, services liberalization – Cooperation on a series of development agenda (e.g.,
logistics and other infrastructure, SME development, innovation and industrial upgrading) with an “ASEAN way (binding vs. non-binding)”
28 2013/06/07

Substantial Achievements in AEC Measures
Tariff reduction/elimination Trade Facilitation ROOs; NSW
Investment Liberalization & Facilitation Air Transport ASEAN + 1 FTAs/RCEP Others (mainly cooperation): Agriculture Competition Policy IPR
29 2013/06/07
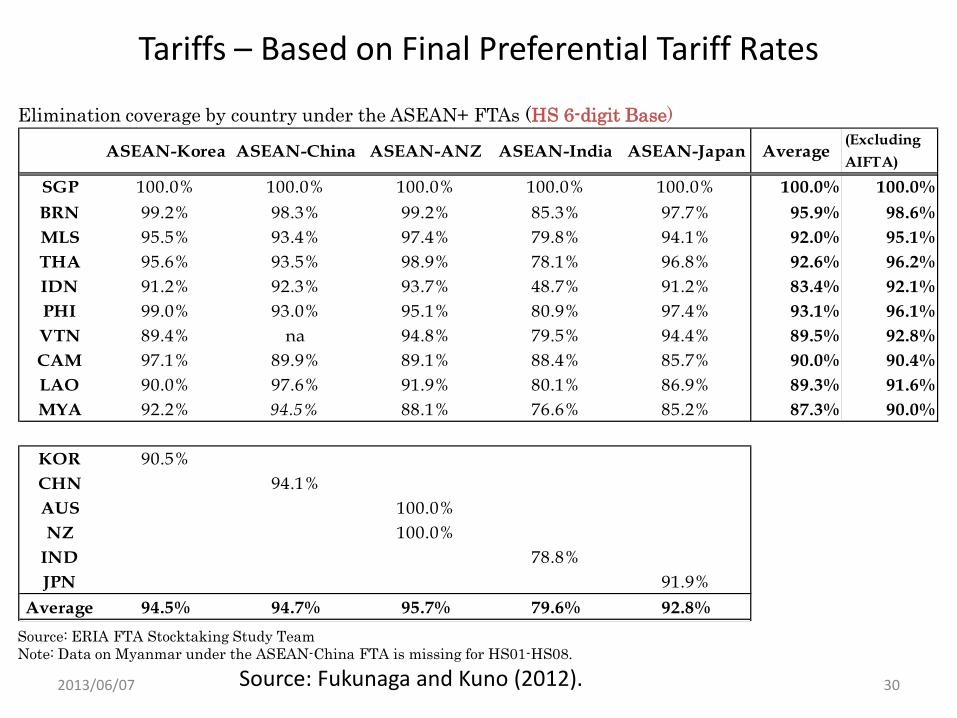
Tariffs – Based on Final Preferential Tariff Rates
Elimination coverage by country under the ASEAN+ FTAs (HS 6-digit Base)
Source: ERIA FTA Stocktaking Study Team Note: Data on Myanmar under the ASEAN-China FTA is missing for HS01-HS08.
ASEAN-Korea ASEAN-China ASEAN-ANZ ASEAN-India ASEAN-Japan Average(ExcludingAIFTA)
SGP 100.0% 100.0% 100.0% 100.0% 100.0% 100.0% 100.0%BRN 99.2% 98.3% 99.2% 85.3% 97.7% 95.9% 98.6%MLS 95.5% 93.4% 97.4% 79.8% 94.1% 92.0% 95.1%THA 95.6% 93.5% 98.9% 78.1% 96.8% 92.6% 96.2%IDN 91.2% 92.3% 93.7% 48.7% 91.2% 83.4% 92.1%PHI 99.0% 93.0% 95.1% 80.9% 97.4% 93.1% 96.1%VTN 89.4% na 94.8% 79.5% 94.4% 89.5% 92.8%CAM 97.1% 89.9% 89.1% 88.4% 85.7% 90.0% 90.4%LAO 90.0% 97.6% 91.9% 80.1% 86.9% 89.3% 91.6%MYA 92.2% 94.5% 88.1% 76.6% 85.2% 87.3% 90.0%
KOR 90.5%CHN 94.1%AUS 100.0%NZ 100.0%
IND 78.8%JPN 91.9%
Average 94.5% 94.7% 95.7% 79.6% 92.8%
30 Source: Fukunaga and Kuno (2012). 2013/06/07
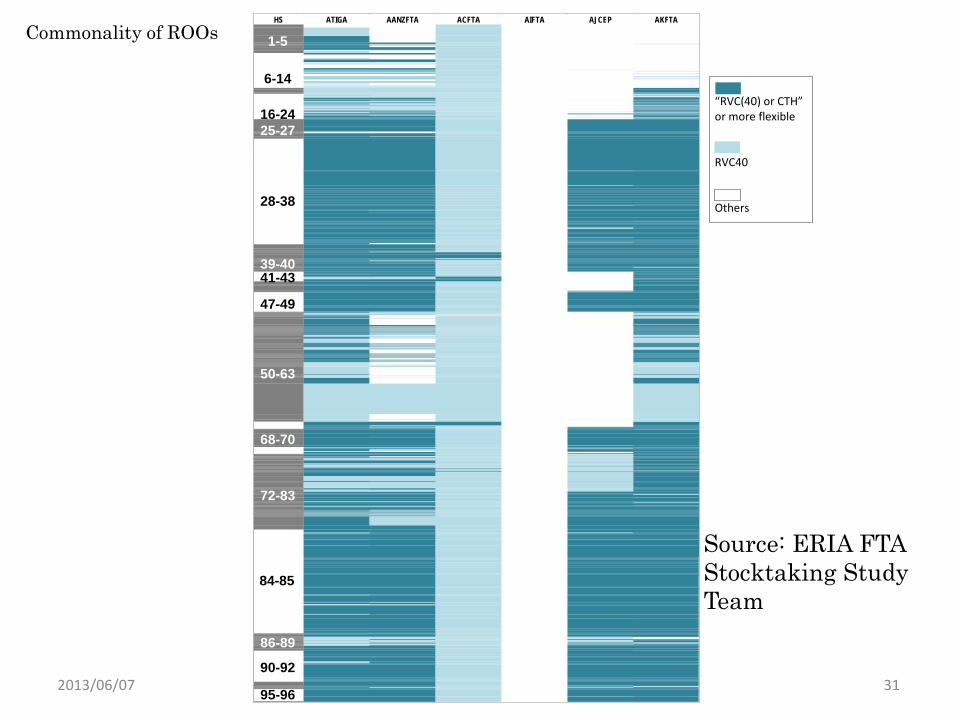
Commonality of ROOs
HS ATIGA AANZFTA ACFTA AIFTA AJCEP AKFTA
“RVC(40) or CTH” or more flexible RVC40 Others
1-5
25-27
39-40
50-63
68-70
86-89
72-83
6-14
16-24
28-38
41-43
47-49
84-85
90-92
95-96 31
Source: ERIA FTA Stocktaking Study Team
2013/06/07
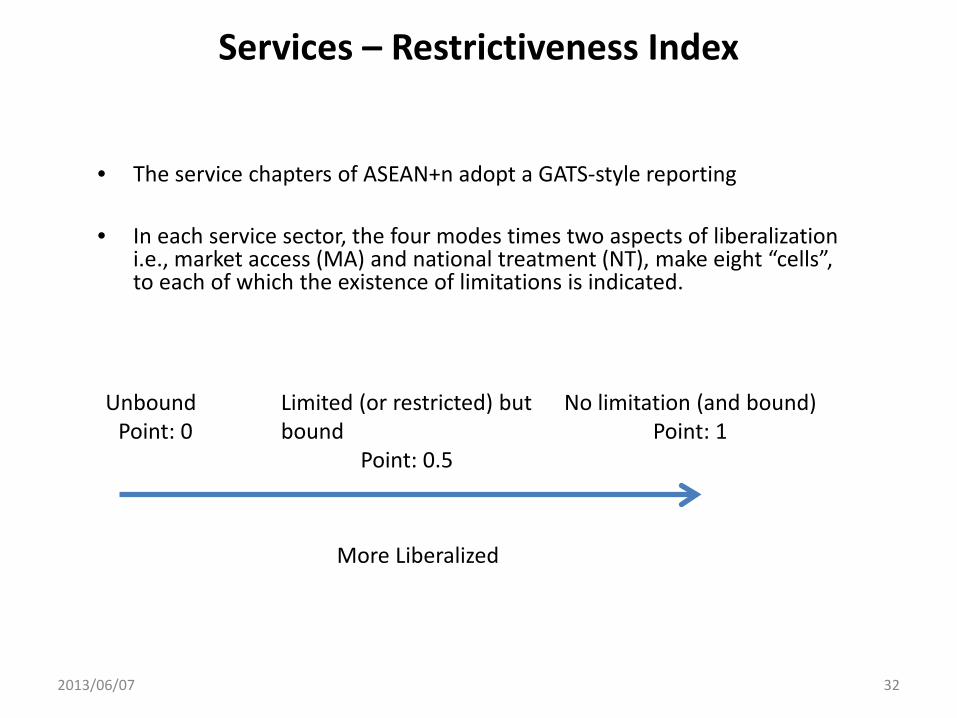
• The service chapters of ASEAN+n adopt a GATS-style reporting
• In each service sector, the four modes times two aspects of liberalization i.e., market access (MA) and national treatment (NT), make eight “cells”, to each of which the existence of limitations is indicated.
No limitation (and bound) Point: 1
Limited (or restricted) but bound
Point: 0.5
Unbound Point: 0
More Liberalized
Services – Restrictiveness Index
32 2013/06/07
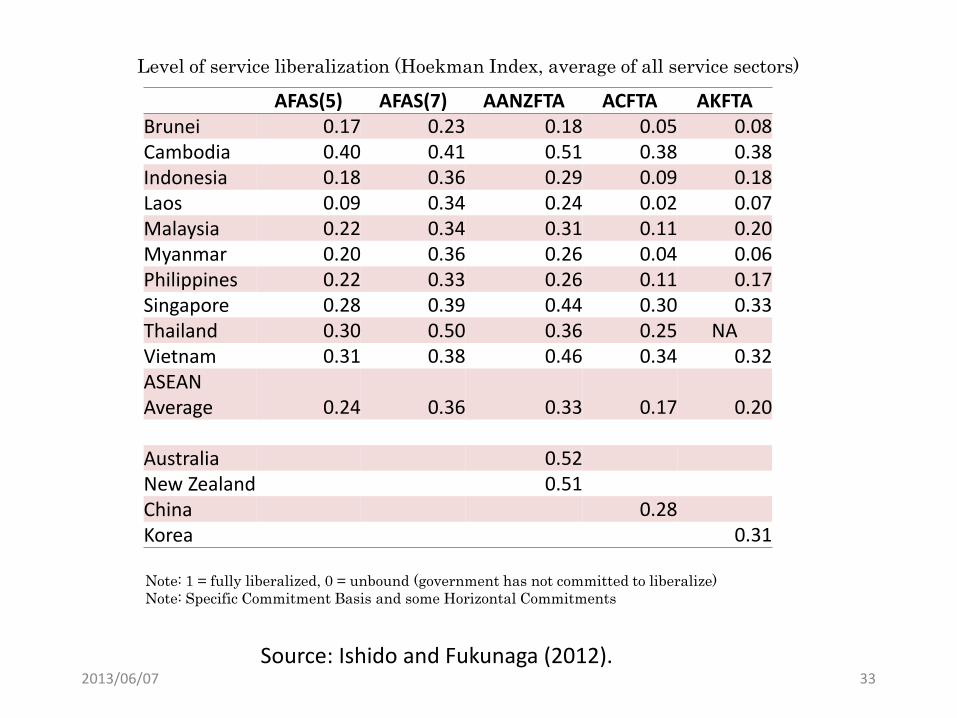
Note: 1 = fully liberalized, 0 = unbound (government has not committed to liberalize) Note: Specific Commitment Basis and some Horizontal Commitments
Level of service liberalization (Hoekman Index, average of all service sectors)
AFAS(5) AFAS(7) AANZFTA ACFTA AKFTA Brunei 0.17 0.23 0.18 0.05 0.08 Cambodia 0.40 0.41 0.51 0.38 0.38 Indonesia 0.18 0.36 0.29 0.09 0.18 Laos 0.09 0.34 0.24 0.02 0.07 Malaysia 0.22 0.34 0.31 0.11 0.20 Myanmar 0.20 0.36 0.26 0.04 0.06 Philippines 0.22 0.33 0.26 0.11 0.17 Singapore 0.28 0.39 0.44 0.30 0.33 Thailand 0.30 0.50 0.36 0.25 NA Vietnam 0.31 0.38 0.46 0.34 0.32 ASEAN Average 0.24 0.36 0.33 0.17 0.20
Australia 0.52 New Zealand 0.51 China 0.28 Korea 0.31
33 Source: Ishido and Fukunaga (2012).
2013/06/07
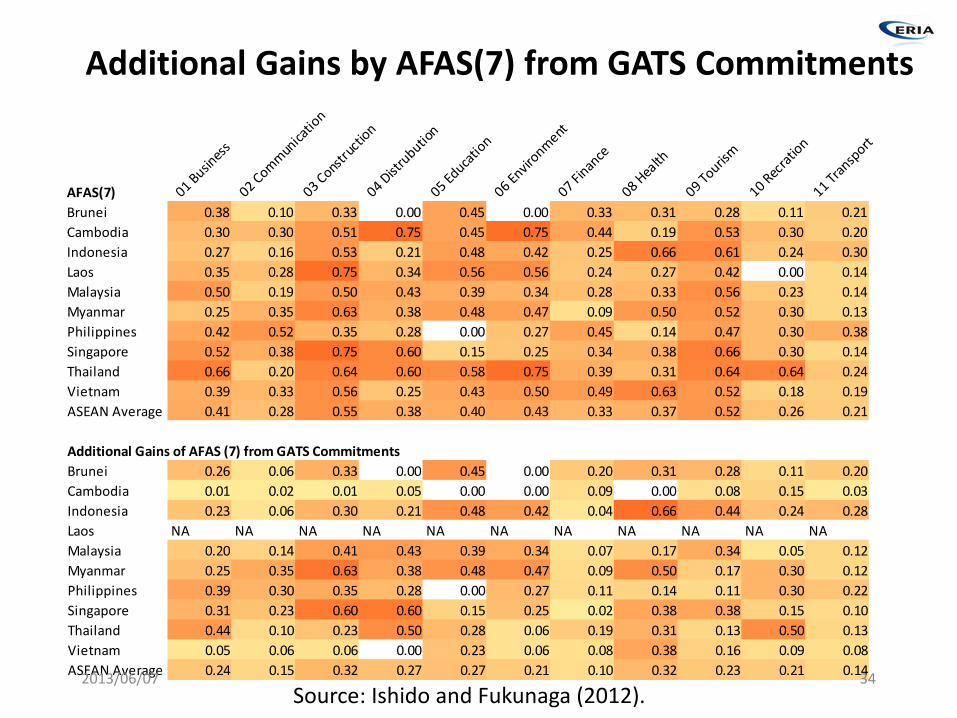
Additional Gains by AFAS(7) from GATS Commitments
AFAS(7) 01 Busin
ess
02 Commun
icatio
n
03 Const
ructio
n
04 Dist
rubution
05 Educat
ion
06 Envir
onment
07 Finan
ce
08 Hea
lth
09 Touris
m
10 Rec
ration
11 Tran
sport
Brunei 0.38 0.10 0.33 0.00 0.45 0.00 0.33 0.31 0.28 0.11 0.21Cambodia 0.30 0.30 0.51 0.75 0.45 0.75 0.44 0.19 0.53 0.30 0.20Indonesia 0.27 0.16 0.53 0.21 0.48 0.42 0.25 0.66 0.61 0.24 0.30Laos 0.35 0.28 0.75 0.34 0.56 0.56 0.24 0.27 0.42 0.00 0.14Malaysia 0.50 0.19 0.50 0.43 0.39 0.34 0.28 0.33 0.56 0.23 0.14Myanmar 0.25 0.35 0.63 0.38 0.48 0.47 0.09 0.50 0.52 0.30 0.13Philippines 0.42 0.52 0.35 0.28 0.00 0.27 0.45 0.14 0.47 0.30 0.38Singapore 0.52 0.38 0.75 0.60 0.15 0.25 0.34 0.38 0.66 0.30 0.14Thailand 0.66 0.20 0.64 0.60 0.58 0.75 0.39 0.31 0.64 0.64 0.24Vietnam 0.39 0.33 0.56 0.25 0.43 0.50 0.49 0.63 0.52 0.18 0.19ASEAN Average 0.41 0.28 0.55 0.38 0.40 0.43 0.33 0.37 0.52 0.26 0.21
Additional Gains of AFAS (7) from GATS CommitmentsBrunei 0.26 0.06 0.33 0.00 0.45 0.00 0.20 0.31 0.28 0.11 0.20Cambodia 0.01 0.02 0.01 0.05 0.00 0.00 0.09 0.00 0.08 0.15 0.03Indonesia 0.23 0.06 0.30 0.21 0.48 0.42 0.04 0.66 0.44 0.24 0.28Laos NA NA NA NA NA NA NA NA NA NA NAMalaysia 0.20 0.14 0.41 0.43 0.39 0.34 0.07 0.17 0.34 0.05 0.12Myanmar 0.25 0.35 0.63 0.38 0.48 0.47 0.09 0.50 0.17 0.30 0.12Philippines 0.39 0.30 0.35 0.28 0.00 0.27 0.11 0.14 0.11 0.30 0.22Singapore 0.31 0.23 0.60 0.60 0.15 0.25 0.02 0.38 0.38 0.15 0.10Thailand 0.44 0.10 0.23 0.50 0.28 0.06 0.19 0.31 0.13 0.50 0.13Vietnam 0.05 0.06 0.06 0.00 0.23 0.06 0.08 0.38 0.16 0.09 0.08ASEAN Average 0.24 0.15 0.32 0.27 0.27 0.21 0.10 0.32 0.23 0.21 0.1434
Source: Ishido and Fukunaga (2012). 2013/06/07
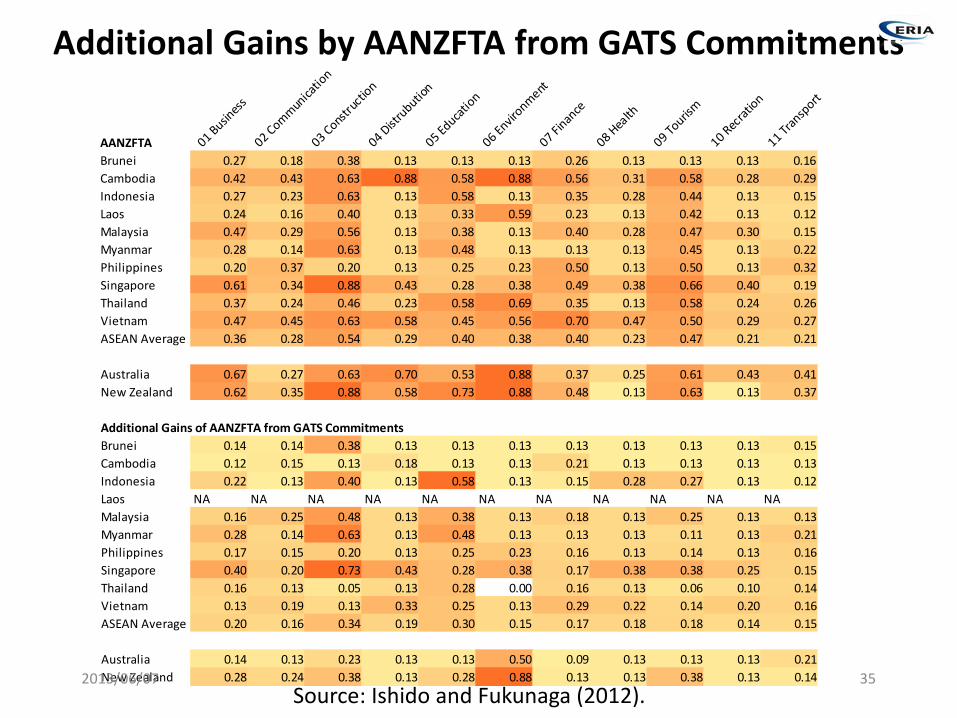
AANZFTA 01 Busin
ess
02 Commun
icatio
n
03 Const
ructio
n
04 Dist
rubution
05 Educat
ion
06 Envir
onment
07 Finan
ce
08 Hea
lth
09 Touris
m
10 Rec
ration
11 Tran
sport
Brunei 0.27 0.18 0.38 0.13 0.13 0.13 0.26 0.13 0.13 0.13 0.16Cambodia 0.42 0.43 0.63 0.88 0.58 0.88 0.56 0.31 0.58 0.28 0.29Indonesia 0.27 0.23 0.63 0.13 0.58 0.13 0.35 0.28 0.44 0.13 0.15Laos 0.24 0.16 0.40 0.13 0.33 0.59 0.23 0.13 0.42 0.13 0.12Malaysia 0.47 0.29 0.56 0.13 0.38 0.13 0.40 0.28 0.47 0.30 0.15Myanmar 0.28 0.14 0.63 0.13 0.48 0.13 0.13 0.13 0.45 0.13 0.22Philippines 0.20 0.37 0.20 0.13 0.25 0.23 0.50 0.13 0.50 0.13 0.32Singapore 0.61 0.34 0.88 0.43 0.28 0.38 0.49 0.38 0.66 0.40 0.19Thailand 0.37 0.24 0.46 0.23 0.58 0.69 0.35 0.13 0.58 0.24 0.26Vietnam 0.47 0.45 0.63 0.58 0.45 0.56 0.70 0.47 0.50 0.29 0.27ASEAN Average 0.36 0.28 0.54 0.29 0.40 0.38 0.40 0.23 0.47 0.21 0.21
Australia 0.67 0.27 0.63 0.70 0.53 0.88 0.37 0.25 0.61 0.43 0.41New Zealand 0.62 0.35 0.88 0.58 0.73 0.88 0.48 0.13 0.63 0.13 0.37
Additional Gains of AANZFTA from GATS CommitmentsBrunei 0.14 0.14 0.38 0.13 0.13 0.13 0.13 0.13 0.13 0.13 0.15Cambodia 0.12 0.15 0.13 0.18 0.13 0.13 0.21 0.13 0.13 0.13 0.13Indonesia 0.22 0.13 0.40 0.13 0.58 0.13 0.15 0.28 0.27 0.13 0.12Laos NA NA NA NA NA NA NA NA NA NA NAMalaysia 0.16 0.25 0.48 0.13 0.38 0.13 0.18 0.13 0.25 0.13 0.13Myanmar 0.28 0.14 0.63 0.13 0.48 0.13 0.13 0.13 0.11 0.13 0.21Philippines 0.17 0.15 0.20 0.13 0.25 0.23 0.16 0.13 0.14 0.13 0.16Singapore 0.40 0.20 0.73 0.43 0.28 0.38 0.17 0.38 0.38 0.25 0.15Thailand 0.16 0.13 0.05 0.13 0.28 0.00 0.16 0.13 0.06 0.10 0.14Vietnam 0.13 0.19 0.13 0.33 0.25 0.13 0.29 0.22 0.14 0.20 0.16ASEAN Average 0.20 0.16 0.34 0.19 0.30 0.15 0.17 0.18 0.18 0.14 0.15
Australia 0.14 0.13 0.23 0.13 0.13 0.50 0.09 0.13 0.13 0.13 0.21New Zealand 0.28 0.24 0.38 0.13 0.28 0.88 0.13 0.13 0.38 0.13 0.14
Additional Gains by AANZFTA from GATS Commitments
35 Source: Ishido and Fukunaga (2012).
2013/06/07
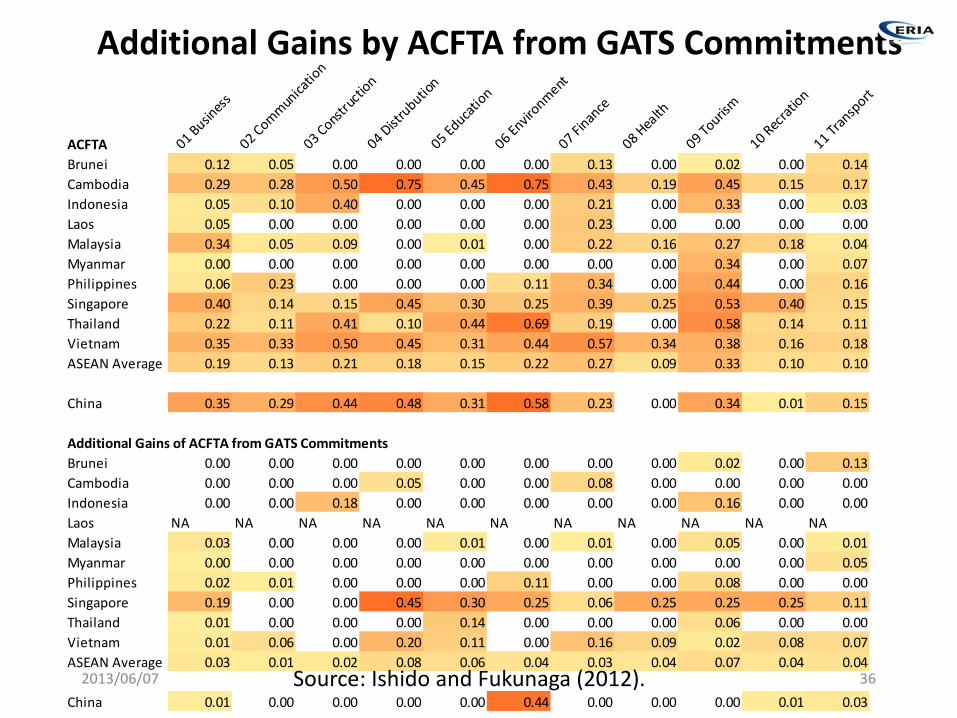
ACFTA 01 Busin
ess
02 Commun
icatio
n
03 Const
ructio
n
04 Dist
rubution
05 Educat
ion
06 Envir
onment
07 Finan
ce
08 Hea
lth
09 Touris
m
10 Rec
ration
11 Tran
sport
Brunei 0.12 0.05 0.00 0.00 0.00 0.00 0.13 0.00 0.02 0.00 0.14Cambodia 0.29 0.28 0.50 0.75 0.45 0.75 0.43 0.19 0.45 0.15 0.17Indonesia 0.05 0.10 0.40 0.00 0.00 0.00 0.21 0.00 0.33 0.00 0.03Laos 0.05 0.00 0.00 0.00 0.00 0.00 0.23 0.00 0.00 0.00 0.00Malaysia 0.34 0.05 0.09 0.00 0.01 0.00 0.22 0.16 0.27 0.18 0.04Myanmar 0.00 0.00 0.00 0.00 0.00 0.00 0.00 0.00 0.34 0.00 0.07Philippines 0.06 0.23 0.00 0.00 0.00 0.11 0.34 0.00 0.44 0.00 0.16Singapore 0.40 0.14 0.15 0.45 0.30 0.25 0.39 0.25 0.53 0.40 0.15Thailand 0.22 0.11 0.41 0.10 0.44 0.69 0.19 0.00 0.58 0.14 0.11Vietnam 0.35 0.33 0.50 0.45 0.31 0.44 0.57 0.34 0.38 0.16 0.18ASEAN Average 0.19 0.13 0.21 0.18 0.15 0.22 0.27 0.09 0.33 0.10 0.10
China 0.35 0.29 0.44 0.48 0.31 0.58 0.23 0.00 0.34 0.01 0.15
Additional Gains of ACFTA from GATS CommitmentsBrunei 0.00 0.00 0.00 0.00 0.00 0.00 0.00 0.00 0.02 0.00 0.13Cambodia 0.00 0.00 0.00 0.05 0.00 0.00 0.08 0.00 0.00 0.00 0.00Indonesia 0.00 0.00 0.18 0.00 0.00 0.00 0.00 0.00 0.16 0.00 0.00Laos NA NA NA NA NA NA NA NA NA NA NAMalaysia 0.03 0.00 0.00 0.00 0.01 0.00 0.01 0.00 0.05 0.00 0.01Myanmar 0.00 0.00 0.00 0.00 0.00 0.00 0.00 0.00 0.00 0.00 0.05Philippines 0.02 0.01 0.00 0.00 0.00 0.11 0.00 0.00 0.08 0.00 0.00Singapore 0.19 0.00 0.00 0.45 0.30 0.25 0.06 0.25 0.25 0.25 0.11Thailand 0.01 0.00 0.00 0.00 0.14 0.00 0.00 0.00 0.06 0.00 0.00Vietnam 0.01 0.06 0.00 0.20 0.11 0.00 0.16 0.09 0.02 0.08 0.07ASEAN Average 0.03 0.01 0.02 0.08 0.06 0.04 0.03 0.04 0.07 0.04 0.04
China 0.01 0.00 0.00 0.00 0.00 0.44 0.00 0.00 0.00 0.01 0.03
Additional Gains by ACFTA from GATS Commitments
36 Source: Ishido and Fukunaga (2012). 2013/06/07
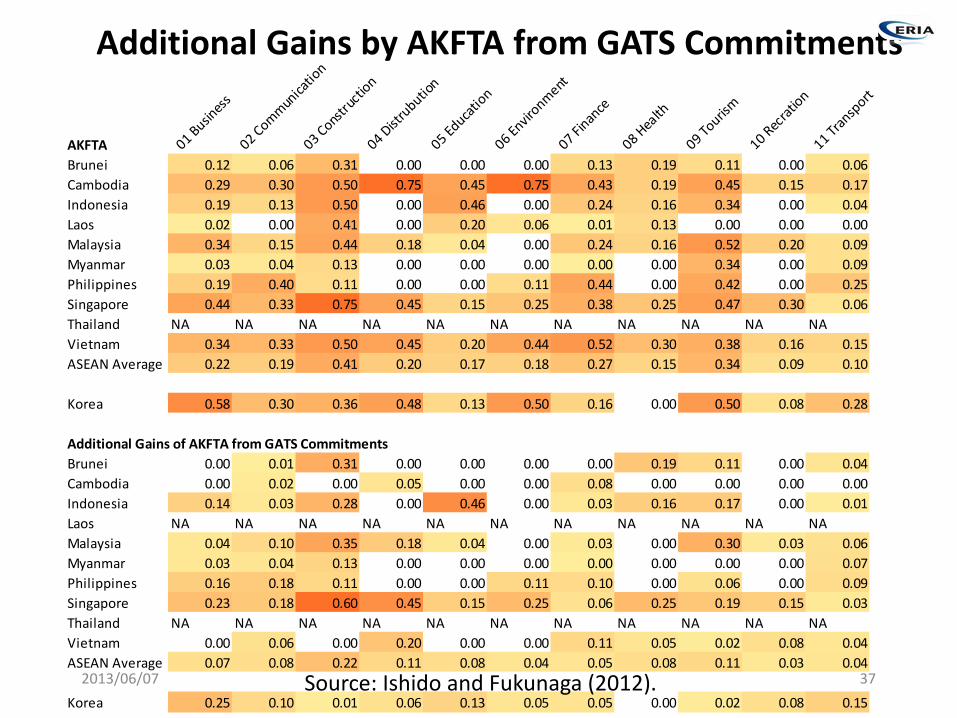
AKFTA 01 Busin
ess
02 Commun
icatio
n
03 Const
ructio
n
04 Dist
rubution
05 Educat
ion
06 Envir
onment
07 Finan
ce
08 Hea
lth
09 Touris
m
10 Rec
ration
11 Tran
sport
Brunei 0.12 0.06 0.31 0.00 0.00 0.00 0.13 0.19 0.11 0.00 0.06Cambodia 0.29 0.30 0.50 0.75 0.45 0.75 0.43 0.19 0.45 0.15 0.17Indonesia 0.19 0.13 0.50 0.00 0.46 0.00 0.24 0.16 0.34 0.00 0.04Laos 0.02 0.00 0.41 0.00 0.20 0.06 0.01 0.13 0.00 0.00 0.00Malaysia 0.34 0.15 0.44 0.18 0.04 0.00 0.24 0.16 0.52 0.20 0.09Myanmar 0.03 0.04 0.13 0.00 0.00 0.00 0.00 0.00 0.34 0.00 0.09Philippines 0.19 0.40 0.11 0.00 0.00 0.11 0.44 0.00 0.42 0.00 0.25Singapore 0.44 0.33 0.75 0.45 0.15 0.25 0.38 0.25 0.47 0.30 0.06Thailand NA NA NA NA NA NA NA NA NA NA NAVietnam 0.34 0.33 0.50 0.45 0.20 0.44 0.52 0.30 0.38 0.16 0.15ASEAN Average 0.22 0.19 0.41 0.20 0.17 0.18 0.27 0.15 0.34 0.09 0.10
Korea 0.58 0.30 0.36 0.48 0.13 0.50 0.16 0.00 0.50 0.08 0.28
Additional Gains of AKFTA from GATS CommitmentsBrunei 0.00 0.01 0.31 0.00 0.00 0.00 0.00 0.19 0.11 0.00 0.04Cambodia 0.00 0.02 0.00 0.05 0.00 0.00 0.08 0.00 0.00 0.00 0.00Indonesia 0.14 0.03 0.28 0.00 0.46 0.00 0.03 0.16 0.17 0.00 0.01Laos NA NA NA NA NA NA NA NA NA NA NAMalaysia 0.04 0.10 0.35 0.18 0.04 0.00 0.03 0.00 0.30 0.03 0.06Myanmar 0.03 0.04 0.13 0.00 0.00 0.00 0.00 0.00 0.00 0.00 0.07Philippines 0.16 0.18 0.11 0.00 0.00 0.11 0.10 0.00 0.06 0.00 0.09Singapore 0.23 0.18 0.60 0.45 0.15 0.25 0.06 0.25 0.19 0.15 0.03Thailand NA NA NA NA NA NA NA NA NA NA NAVietnam 0.00 0.06 0.00 0.20 0.00 0.00 0.11 0.05 0.02 0.08 0.04ASEAN Average 0.07 0.08 0.22 0.11 0.08 0.04 0.05 0.08 0.11 0.03 0.04
Korea 0.25 0.10 0.01 0.06 0.13 0.05 0.05 0.00 0.02 0.08 0.15
Additional Gains by AKFTA from GATS Commitments
37 Source: Ishido and Fukunaga (2012). 2013/06/07
5. The role of CJK overcoming political difficulty
• The fast-moving world does not wait for slow-moving CJK. Take an initiative for the East Asian economic integration.
• Establish a new model of economic development together with a new international economic order.
• Dirty and/or slow conclusion of CJK/RCEP would cost a lot.
38 2013/06/07
References • Ando, Mitsuyo. (2012) “Development and Restructuring of Regional Production/Distribution Networks in East
Asia.” Forthcoming in an ERIA Report. • Ando, Mitsuyo Ando Fukunari Kimura (2012a) “How Did the Japanese Exports Respond to Two Crises in the
International Production Networks? The Global Financial Crisis and the East Japan Earthquake.” Asian Economic Journal, 26, No. 3: 261-287.
• Ando, Mitsuyo and Kimura, Fukunari. (2012b) “International Production Networks and Domestic Operations by Japanese Manufacturing Firms: Normal Periods and the Global Financial Crisis.” July. RIETI Discussion Paper Series 12-E-047 (http://www.rieti.go.jp/jp/publications/act_dp.html).
• Ando, Mitsuyo and Kimura, Fukunari. (2012c) “From Regional to Global Production Networks: Linkage between Europe and East Asia via CEE.” October. Forthcoming in a special issue of the Journal of Economic Integration.
• Baldwin, Richard. (2011) “21st Century Regionalism: Filling the Gap between 21st Century Trade and 20th Century Trade Rules.” Centre for Economic Policy Research Policy Insight No. 56 (May) (http://www.cepr.org).
• ERIA. (2010) Comprehensive Asia Development Plan (http://www.eria.org/projects/CADP.html). • ERIA. (2012) Mid-term Review of the Impoementation of AEC Blueprint: The Executive Summary
(http://www.eria.org/publications/key_reports/mid-term-review-of-the-implementation-of-aec-blueprint-executive-summary.html).
• Fukunaga, Yoshifumi and Kuno, Arata. (2012) “Toward a Consolidated Preferential Tariff Structure in East Asia: Going beyond ASEAN+1 FTAs” (http://www.eria.org/ERIA-PB-2012-03.pdf).
• Ishido, Hikari and Fukunaga, Yoshifumi. (2012) “Liberalization of Trade in Services: Toward a Harmonized ASEAN++ FTA” (http://www.eria.org/ERIA-PB-2012-02.pdf).
• Jones, Ronald W. and Kierzkowski, Henryk. (1990) “The Role of Services in Production and International Trade: A Theoretical Framework.” In Ronald W. Jones and Anne O. Krueger, eds., The Political Economy of International Trade: Essays in Honor of Robert E. Baldwin, Oxford: Basil Blackwell: 31-48.
• Kimura, Fukunari and Ando, Mitsuyo. (2005) “Two-dimensional Fragmentation in East Asia: Conceptual Framework and Empirics.” International Review of Economics and Finance (special issue on “Outsourcing and Fragmentation: Blessing or Threat” edited by Henryk Kierzkowski), 14, Issue 3: 317-348.
39 2013/06/07