Embed Size (px)
Citation preview

The 8th
Report of the National
Eye Database 2014
Included reports on
Cataract Surgery Registry 2002, 2003, 2004, 2007, 2008, 2009, 2010, 2011, 2012, 2013 and 2014
Klinik Katarak 1Malaysia, MAIWP-Hospital Selayang, Retinoblastoma Registry and
Ophthalmology Service Census 2015
Editors
Goh Pik Pin
Mohamad Aziz Salowi
Tassha Hilda Adnan
Nadiah Sa’at
With contributions from
Nor Sharina Yusof, Adlina Abdul Rahim, Ruqqayah Ahmadshah Khan,
Lee Annie, Jamalia Rahmat and Teng Kam Yoke

The 8th Report of the
National Eye Database
2014
Sponsors:
The Network of Clinical Research Centre, Ministry of Health
The National Eye Database is funded with grants from:
The Ministry of Health
Malaysian Society of Ophthalmology
June 2016©
National Eye Database
ISSN 1985-7489
Published by the
National Eye Database (NED)
Registry Coordinating Centre
c/o Clinical Research Centre
Level 4, Specialist Office
Hospital Selayang
Lebuhraya Selayang -Kepong
68100 Batu Caves Selangor, Malaysia
telephone: 603-61203233 Ext.: 4169
Fax: 603-61202761
Email: [email protected]
Website: http://www.acrm.org.my/ned

1
Important information
The Eighth Report of the National Eye Database is the copyright of Ophthalmology Sevice, Ministry of Health and
Clinical Research Centre. We are happy for our materials to be downloaded, printed, copied, used and distributed free
of charge for non-commercial purposes only. Where our materials are copied, used or distributed, the source of the
material must be identified and the copyright status acknowledged. No alteration or adaptation of any of the materials
may be made without obtaining the permission of the steering committee of National Eye Database. Reproduction or
distribution of materials either in whole or in part for a commercial purpose is prohibited without the prior written
permission of steering committee of National Eye Database.
Suggested citation is: Mohamad Aziz Salowi, Goh PP (Eds) Eighth Report of the National Eye Database 2016, Kuala
Lumpur 2016
This report is published electronically on the website of the national eye database at: http://acrm.org.my/ned
Disclaimer
There is a potential that data published for previous years in current reports may differ from annual reports published
earlier. This is because analysis is based on latest dataset in NED database which may have been updated by source
data producers.

2
ACKNOWLEDGEMENTS
The National Eye Database (NED) would like thank each and everyone who have directly or indirectly contributed
to the success of the National Eye Database.
In particular we would like to thank the following:
1. Ophthalmologists, Heads of MOH Ophthalmology Departments, doctors in-charge, site coordinators mainly
optometrists and paramedics at all the 40 MOH hospitals with ophthalmology service and resident
optometrists at district hospitals without ophthalmologists. Thank you for being the source data providers for
NED. The success of NED depends on you.
2. Staff Nurse Teng Kam Yoke, NED clinical registry manager at Registry Coordinating Centre.
3. The Division of Research and Technology Support, Ministry of Health, for financial support.
4. Information Technology Personnel; Ms Lim Jie Ying and Mr Sebastian Thoo.
5. Database administrator; Ms Amy R Porle, Web application programmer; Mr Abdul Malik Bin Tanjeng and
Graphics Designer; Mr Azizi Bin Abd Rahman.
6. Clinical Data Management Personnel; Ms Teo Jau Shya and Ms Huziana.
7. Malaysian Society of Ophthalmology, Malaysia Medical Association Foundation, and Alcon Laboratories Sdn
Bhd for providing financial support.
Last but not least, the Director-General of Health for the permission to publish this report.
Thank you.
NED Steering Committee Members
May 2016
3
NED STEERING COMMITTEE MEMBERS 2014
Advisor Dr Nor Fariza Ngah
Head of Service, Department of Ophthalmology, Hospital Selayang
Chairperson
Dr Mohamad Aziz Salowi
Department of Ophthalmology, Hospital Selayang
Members
Dr Goh Pik Pin
Clinical Research Centre, Ministry of Health
Dr Elias Hussein
Department of Ophthalmology, Hospital Selayang
Dr Zuraidah Mustari
Department of Ophthalmology, Hospital Sultanah Nur Zahirah
Prof Dr Abdul Mutalib Othman
Department of Ophthalmology, Universiti Sultan Zainal Abidin
Dr Zaharidah Abd Kadir
Department of Ophthalmology, Hospital Sultan Abdul Halim
Puan Che Rohani
Cawangan Kualiti & Penyelidikan, Bahagian Sains Kesihatan
Bersekutu, Putrajaya
Secretariat Teng Kam Yoke
Ophthalmic trained staff nurse, NED Clinical Registry Manager
4
ABOUT NATIONAL EYE DATABASE
Introduction
The National Eye Database (NED) is an eye health information system supported by MOH. It is a clinical database
consisting of six patient registries and a monthly ophthalmology service census. The patient registries are Cataract
Surgery Registry, Diabetic Eye Registry, Contact Lens-Related Corneal Ulcer Surveillance, Glaucoma Registry,
Retinoblastoma Registry, and Age Related Macular Degeneration Registry. The source data producers are eye care
providers, currently from the public. Information collected, both clinical and epidemiological, are very useful in
assisting the MOH, Non-Governmental Organizations, private healthcare providers and industry in the planning,
evaluation and continuous improvement of eye care services, leading to prevention and control of blindness in the
nation.
Vision
Accessible eye health information.
General Objectives of the National Eye Databases
1.
To establish and maintain a web based eye health information system on natural history of visual threatening
eye diseases, which are of public health importance. The information is useful in the planning and evaluation of
eye care service.
2. To determine the effectiveness of treatment, both clinical outcomes and cost, and to identify factors influencing
outcomes. This serves the needs of outcome assessment.
3. To provide information necessary to evaluate ophthalmology services through census and key performance
indicators, as well as on safety or harm of products and services used in the treatment of a disease. This
contributes to continuous quality initiative.
4. To evaluate the accessibility and equity in health care provision. This information enhances accountability.
5. To provide a mean of prompt and wide dissemination of epidemiological and clinical information through web
such as real time registries reports and notification of epidemic of contact lens-related corneal ulcer. This is
essential for public health advocacy.
6. To stimulate and facilitate research on eye diseases.
Cataract Surgery Registry
The Cataract Surgery Registry (CSR) was initiated in 2002 and collects data pertaining to patients who have had
cataract surgery. Data collected include demography, medical history, operative events, post-operative visual
outcomes and probable causes for poor outcome. Since 2008, data on posterior capsular rupture, visual outcome and
post-operative endophthalmitis were linked to online key performance indicator for monitoring centre performance
while data on incidence of posterior capsular rupture and patients with poor visual outcome are linked to online
cumulative sum (CUSUM) to monitor competency of individual surgeon. Annual reports for the year 2002, 2003, 2004
and 2007 are available at www.acrm.org.my/ned, under the section of publication.
Objectives
1. To determine the frequency, distribution and practice pattern of cataract surgery in Malaysia.
2. To determine the outcomes and factors influencing outcomes of cataract surgery.
3. To evaluate cataract surgery services based on rate of posterior capsular rupture, post-operative infection,
post-operative visual outcome and induced astigmatism.
4. To stimulate and facilitate research on cataract and its management.

5
Retinoblastoma Registry
Retinoblastoma registry collects data on the pattern of clinical presentation, mode of treatment and outcome of
patients with retinoblastoma seen at ophthalmology clinics with paediatric ophthalmology service. The main SDP is
Hospital Kuala Lumpur.
Objectives
1. To determine the incidence and distribution of retinoblastoma in different states in Malaysia.
2. To determine the ethnic-specific prevalence of retinoblastoma in Malaysia.
3. To study characteristics of RB patients in terms of clinical presentation and stage of disease based on
International Intraocular Retinoblastoma Classification.
4. To evaluate types of treatments and monitor treatment trends.
5. To evaluate treatment outcomes including complications related to treatment.
Monthly Ophthalmology Service Census
Since 2002, Ophthalmology Service of MOH has been collecting annual census from all the hospitals with
ophthalmology departments. Data include essential service census and key performance indicators for ophthalmology
service. There are 13 sections in the census return, namely out-patients, inpatients, major eye operations, cataract
service, diabetic service, glaucoma service, and optometry service, and subspecialty services which include
vitreoretinal, corneal, paediatric ophthalmology, oculoplasty, medical retinal, and a public health ophthalmology, and
data on training records and prevention of blindness activities. Data are entered monthly by staff at sites via on-line
data entry. Heads of ophthalmology department can view their own and other hospitals’ real-time reports.
Objectives
1. To evaluate service output in all ophthalmology departments.
2. To study trends in service output and service patterns.
3. To get baseline and norm from services provided by MOH ophthalmology departments.
4. To determine norm and set standards for performance indicators for centres which differ in strength of
physical and human resources.
Outreach Programme Census
Ministry of Health (MOH) is the biggest provider of ophthalmology service in the country including the outreach
activities. However, data for these activities conducted by all the Ophthalmology Departments are not readily
available and most are not properly documented.
Due to the increasing number of cataract surgeries performed in MOH facilities, the existence of the mobile and the
satellite cataract services and the expansion in the outreach activities, these data need to be compiled and
organised both at the central and departmental level. These data can possibly be analysed and be used for the
improvement of ophthalmology outreach services in the country.
Data collected include details of activity, total number of individual screened by age and disease, total number of
referral to ophthalmologist and optometrists, total number of cataract surgeries done and the updated number of eye
trained paramedics.

6
Objectives
1. To compile data pertaining to outreach activities by all ophthalmology department in the country.
2. To update the number of Primary Eye Care and Ophthalmic Post Basic staff available in the country.
3. To study the patients’ demography in the outreach activities
4. To study the eye disease workload in the outreach activities
5. To study the cataract surgery workload in the outreach activities
Key Performance Indicator
The Ministry of Health (MOH) launched the implementation of Key Performance Indicators (KPIs) in February 2008
with the aim to assess the overall performance of services provided by Clinical Departments in MOH. The MOH
Ophthalmology Service has identified KPIs which measure clinical performance of core ophthalmology service such
as out-patient service, cataract surgery and diabetic eye screening.
From 2008 to 2011, there were 7 KPIs being measured in MOH Ophthalmology Service. However, the Quality Unit of
MOH revised these KPIs in January 2012 and has 3 KPIs and 4 performance indicators (PIs). Rate of infectious
endophthalmitis following cataract surgery and Percentage of patients with post-operative visual acuity of 6/12 or
better within 3 months are both PIs and National Indicator Approach (NIA). Rate of Posterior Capsular Rupture during
Cataract Surgery has been removed both from KPI and NIA lists.
MEASUREMENT INDICATOR STANDARD
PI 1
Percentage of patients with waiting time of ≤ 90 minutes to see the doctor at specialist clinic
≥ 80% of the patients are seen within ninety (90) minutes
PI 2
KPI 1 Percentage of diabetic patients who were given an appointment for first consultation within 6 weeks
≥ 80% of the patients are given an appointment for First Consultation within 6 weeks
PI 3
Percentage of patients with waiting time of within 16 weeks for cataract surgery
≥ 80% of patients have appointment given for cataract surgery within 16 weeks
PI 4
KPI 2 NIA Rate of infectious endophthalmitis following cataract surgery (2 cases per 1000 operations)
< 0.2% (2 cases per 1000 operations)
PI 5
KPI 3 NIA
Percentage of patients with post-operative visual acuity of 6/12 or better within 3 months following cataract surgery in patients without ocular co-morbidity (850 cases 1000 operations)
> 85% (900 cases per 1000 operations)
PI 6
Cancellation rate of patients listed for cataract surgery under local Anaesthesia
≤ 10% cancellation
PI 7
Number of mortality/morbidity audits/ meetings conducted in the Department (in 6 months)
At least 6 times in 6 months
Note:
PI=Performance Indicator
KPI=Key Performance Indicator
NIA=National Indicator Approach
7
Adverse Incidence Reporting – Intraocular Lens
Intraocular lens may have defect during the manufacturing process and implantation into the patients’ eyes. This
ranges from the production of IOL, packaging, distribution, insertion to when the IOL is already implanted into the
patients’ eyes.
This defect may range from manufacturing defect such as no IOL in the box or fracture of haptics or optics. It may also
be in the form of deposits on the IOL or opacification detected weeks to years after surgery. All these defects will
contribute directly to the patients’ visual outcome. Some defects may require explantation and results in distress to
both the patients and the surgeons. The cost for explantation of an opacified IOL also has to be borne by the patient
and eye care providers.
It is also important to identify any common defect for example fracture of haptics or optics as this will be used as
feedback to the industries to improve their IOL quality or be used for platform for further training pertaining to the IOL if
required. Data collected include patient’s demography, action taken, outcome and details of IOL.
Objectives
1. To identify any common defect in IOL
2. To detect cases with IOL opacification
3. To study the patients’ characteristics in developing IOL opacification
4. To study the patient’s outcome following treatment if any
Adverse Incidence Reporting – Endophthalmitis
This is a complication which can occur following any intraocular surgery. Although uncommon, once occurred, it may
lead to the loss of vision and possible loss of the eye itself. It is a devastating complication both to the patient, the
care provider and the health system as the treatment is costly the outcome after treatment can be uncertain.
Therefore prevention of disease and surveillance of an outbreak is important. Data in CSR shows a decreasing
percentage of endophthalmitis occurrences following cataract surgery among patients in the Ministry of Health (MOH)
over the years. This is possibly due to the use of prophylactic antibiotics and the general improvement in technique
and care in cataract surgery. However, it is imperative to monitor this complication closely due to the increasing
number of cataract surgeries performed in MOH facilities, the existence of the mobile and the satellite cataract
services and also the expansion in the outreach activities throughout the countries. Monitoring is also essential to
prevent outbreak. Data collected include demography, possible risk factors, mode of treatment and the outcome
following treatment.
Objectives
1. To detect outbreak and therefore exercise the necessary measure to control disease spread
2. To identify its risk factors or any common risk factors among cases
3. To study the patients’ characteristics in developing post-operative infectious endophthalmitis
4. To study the patient’s outcome following treatment

8
e-CUSUM
Cataract surgery is the most common procedure done in ophthalmology departments. The procedure is quite
consistent and outcome is measured by visual acuity. Cataract surgery outcome depends greatly on surgeons’ skill.
With advancement in technology and intraocular lens implantation, good visual outcome is almost certain among
patients without pre-existing ocular co-morbidity. Hence, monitoring and evaluating surgeons’ competency, especially
trainees’ performance, are essential in ensuring standard of care.
Cumulative Sum (CUSUM) software auto-mine data on occurrence of posterior capsular rupture and patients with
post-operative vision worse then 6/12 from cataract surgery registry on surgery done by individual surgeon using
unique surgeon ID. From 2008, by using individual unique username and password, surgeon can access his/her own
CUSUM charts via eCUSUM web page. Consultant ophthalmologists can view their own as well as their trainees’
charts. By doing so, monitoring on surgeons’ competency in cataract surgery is made most effectively and easily.
Methods of the National Eye Database
The National Eye Database is designed as a cohort study. It is an online clinical database hosted at the Association of
Clinical Registry Malaysia website at www.acrm.org.my/ned. Its protocol was approved by the Medical Research
Ethical Committee of MOH on 2nd September 2008 (reference number NMRR 08-552-1707) and is accessible at the
NED website.
Data collection and data entry are done at SDP sites. Data are collected either using case report forms (CRF) which
are later entered into the web application, or are directly entered into the web application during the course of clinical
work.
Data management using data query are set in the web application to reduce inconsistency, out-of-range or missing
values. Authorised staff at each SDP is given passwords to perform data entry. Individual SDP reports and
aggregated reports based on cumulative data of all SDPs are available real-time at NED website. These reports are
only accessible by heads of department, doctors-in-charge and site coordinators via authorised password. The web
reports are descriptive analysis of data which have been entered. Annual statistical report will be produced based on
data collected for a specific year. The statistical reports will be published yearly and distributed to users in MOH
divisions and units, all the ophthalmology departments, universities, other relevant public agencies and non-
governmental organisations.
The NED has high level of security for protection of its data. Data protection is ensured at all times through strict
compliance with regulatory requirements such as authentications of users and web application owners, access
control, encryption, audit trail, control of external communication links and access, as well as system backup and
disaster recovery.

9
NED ORGANIZATION
Organisation Chart
Organization chart
Governance
/Advisory Board (MOH, public, university,
private ophthalmologist)
Steering Committee
(Ophthalmologists
Optometrists)
Source Data Producers(Heads of Department (Site Co-Investigator)
Doctor s in charge
Site Coordinators)
Users( SDP, MOH, Universities, NGO, Industry
Public)
Registry Coordinating Centre (Public health ophthalmologist / epidemiologist
Clinical Registry manager
Research Assistant
IT personnel
Statistician )
Sub committee/expert panels
•Registry PI/Co-PI
•Independent data monitoring
•Outcome evaluation
•Data access & Publication
•Medical writing
Sponsor

10
NED SOURCE DATA PROVIDERS
LIST OF SITE COORDINATOR FOR 2015
NORTHERN ZONE
No. SDP Site Coordinator
1. Hospital Kangar Roslinda bt Rahman
2. Hospital Sultanah Bahiyah Nur Diana Mohd Zani
3. Hospital Sungai Petani Juliana Md Desa
4. Hospital Pulau Pinang Noor Asmah Md Azmi
5. Hospital Bukit Mertajam Marhaini Othman
6. Hospital Ipoh Noraini Harith
7. Hospital Taiping Rohaiza bt Abdul Hamid
8. Hospital Teluk Intan Adawiyah Ismail
9. Hospital Sri Manjung Juhaida bt Zahri
EASTERN ZONE
No. SDP Site Coordinator
1. Hospital Kuantan Noor Azhari bin Ahmad
2. Hospital Temerloh Nor Hanim Ahmad Adnan
3. Hospital Kuala Terengganu Noor Hayati Mohammad
4. Hospital Kota Bharu Rossaidah bt Mustapa
5. Hospital Kuala Krai Farawahida Fakaruddin
CENTRAL ZONE
No. SDP Site Coordinator
1. Hospital Kuala Lumpur Intan Khusiah Abd Rahman
2. Hospital Putrajaya Lily Muhanifa Mustafa
3. Hospital Selayang Nurul Aini Yusoff
4. Hospital Klang Najihah Muhammad Sharif
5. Hospital Serdang Yusrina Mohamat Hata

11
CENTRAL ZONE
No. SDP Site Coordinator
6. Hospital Sungai Buloh Majidah Zainal Abidin
7. Hospital Ampang Noriah binti Abdullah
8. Hospital Seremban Normalisa Muhammad Som
9. Hospital Kuala Pilah Nazura Selamat
SOUTHERN ZONE
No. SDP Site Coordinator
1. Hospital Melaka Eryanti Md Omar
2. Hospital Johor Baru Nurazilah Ismail
3. Hospital Muar Roziana Sumardi
4. Hospital Batu Pahat Nur Adilah Abdullah
5. Hospital Sultan Ismail Nursalinah bt Adam
SARAWAK
No SDP Site Coordinator
1. Hospital Umum Sarawak Nazirin bin Arshad
2. Hospital Sibu Mohammad Ridzwan Bihem
3. Hospital Bintulu Mohd Zharif Mohd Nor
4. Hospital Miri Nur Hafizah Mat Jalil
5 Hospital Sarikei
SABAH
No SDP Site Coordinator
1. Hospital Queen Elizabeth Iramayanah Ambo Mase
2. Hospital Duchess Of Kent Norhafizah Abd Razik
3. Hospital Tawau Arni Rehny Ahmad Rakhli
4. Hospital Keningau Hr Shredznear

12
FOREWORD
The overall data submission for Cataract Surgery Registry (CSR) has increased over the years. This indicates an
increasing awareness regarding the importance of CSR data and readiness among SDPs to submit data for service
improvement and publication. However, this trend has to be sustained to ensure representativeness of data in the
National Eye Database (NED). The effort to sustain this will require colossal contribution and commitment from each
individual at all level of eye care providers. Let us also hope that the ascertainment will further increase following the
implementation of NED medical officership in most SDPs beginning January 2015. These Medical Officers (MOs) are
given tasks within dedicated working hours in a week by 1-2 monthly rotation to monitor data entry for CSR and
completeness of all data fields in various registries and department service/census in the NED.
Results from the National Eye Survey (NES) II in 2014 has produced an estimate on the number of people with
cataract blindness in the country by WHO definition (corrected vision <3/60 in the better eye). In order to effectively
address this issue over time, we have set a target to increase the country’s Cataract Surgical Rate to up to 20% from
the current rate each year. This target projects a 10 000 cataract surgeries increase per year by the Ministry of Health
(MOH) alone. Data in CSR have been showing an increasing total yearly output by MOH although it has not reached
the target yet. It is indeed an uphill battle for us to achieve this desired target in the years to come especially during
the time when we are facing health care budget cut. However, this is not the main national concern. As we progress
over the years putting a concerted effort to improve cataract surgical services in the country, some of us are still
unaware about the alarming issue of cataract tsunami therefore comfortable operating below their individual
capacities. Some hospitals are complacent by the label of “high output” hospital based on yearly cataract surgery
number by ignoring the cost-efficiency aspect of the cataract surgery. If we take into account capacity and cost-
efficiency, these hospitals could actually be under-performing because they had more manpower and resources as
compared to other “high output” hospitals which probably had only one operating table with limited manpower and
resources. In future, we will hopefully be able to overcome this by projecting the number of cataract surgery per
cataract hour per year rather than number of cataract surgery per year alone.
As part of an eye care planning cycle, NED will continue its role in monitoring and evaluating our performance in our
mission to improve the country’s eye health. This can potentially be achieved by sharing and disseminating results in
NED to all individuals at all levels of eye care to encourage data cleaning and utility. NED Newsletters publishing NED
results in segments have come to its fourth year of publication. NED MO regular presentation within individual
department and roadshows are the novel process of reaching the users. Let us complement and enhance these roles
by giving our full commitment and ideas in making NED central in the national eye health agenda.
Steering Committee Members
National Eye Database 2014/2015

13
ABBREVIATION
ADED Advanced Diabetic Eye Disease NED National Eye Database
AMD Age related Macular Degeneration NPDR Non Proliferative Diabetic
Retinopathy
CAI Carbonic Anhydrase Inhibitor NPL No Perception Of Light
CF Counting Finger OT Operating Theatre
CLRCU Contact Lens-Related Corneal Ulcer PCO Posterior Capsule Opacification
CSMO Clinically Significant Macular Odema PCR Posterior Capsule Rapture
CMO Cystoid Macular Oedema PDR Proliferative Diabetic Retinopathy
CSR Cataract Surgery Registry Phaco Phacoemulsification
DER Diabetic Eye Registry PL Perception Of Light
DM Diabetes Mellitus PI Principal Investigator
DR Diabetic Retinopathy RB Retinoblastoma
ECCE Extracapsular Cataract Extraction RCC Registry Coordinating Centre
FU Follow Up SD Standard Division
HM Hand Movement SDP Source Data Producers
HPT Hypertension VA Visual Acuity
ICCE Intracapsular Cataract Extraction VR Vitreoretinal Surgery
IOL Intraocular Lens ZD Zonular Dialysis
MOH Ministry Of Health

14
Contents
Acknowledgements ....................................................................................................................................... 2
NED Steering Committee Members 2014 ..................................................................................................... 3
About National Eye Database ....................................................................................................................... 4
Cataract Surgery Registry ......................................................................................................................... 4
Retinoblastoma Registry ........................................................................................................................... 5
Monthly Ophthalmology Service Census .................................................................................................. 5
Outreach Programme Census .................................................................................................................. 5
Key Performance Indicator ........................................................................................................................ 6
Adverse Incidence Reporting – Intraocular Lens ...................................................................................... 7
Adverse Incidence Reporting – Endophthalmitis ...................................................................................... 7
e-CUSUM .................................................................................................................................................. 8
Methods of the National Eye Database .................................................................................................... 8
NED Organization ......................................................................................................................................... 9
NED Source Data Providers ....................................................................................................................... 10
FOREWORD ............................................................................................................................................... 12
Abbreviation ................................................................................................................................................ 13
Contents ...................................................................................................................................................... 14
List of Tables ............................................................................................................................................... 18
List of Figures .............................................................................................................................................. 22
EXECUTIVE SUMMARY ............................................................................................................................ 24
REPORT SUMMARY .................................................................................................................................. 25
CATARACT SURGERY REGISTRY....................................................................................................... 25
KLINIK KATARAK 1MALAYSIA .............................................................................................................. 27
MAIWP-HOSPITAL SELAYANG............................................................................................................. 29
RETINOBLASTOMA REGISTRY............................................................................................................ 32
CHAPTER 1: CATARACT SURGERY REGISTRY .................................................................................... 35
1.1 Stock and Flow ............................................................................................................................ 35
1.1.1 Stock and Flow .................................................................................................................... 35
1.2 Characteristics of Patient ............................................................................................................ 38
1.2.1 Demography ........................................................................................................................ 38
1.2.2 Systemic Co-morbidity ........................................................................................................ 39
1.2.3 Cause of Cataract ............................................................................................................... 40
1.2.4 First or Second Eye Surgery ............................................................................................... 41
1.2.5 Past Ocular Surgery of the Operated Eye........................................................................... 41
1.2.6 Pre-existing Ocular Co-morbidity ........................................................................................ 43
1.2.7 Pre-operative Vision ............................................................................................................ 44
1.2.8 Target Refractive Power ..................................................................................................... 46
1.3 Cataract Surgical Practice ........................................................................................................... 48
1.3.1 Number of Cataract Surgery by SDP .................................................................................. 48

15
1.3.2 Number of Cataract Surgery Registered to CSR by State .................................................. 50
1.3.3 Surgeon Status .................................................................................................................... 50
1.3.4 Duration of Surgery ............................................................................................................. 55
1.3.5 Distribution of Cataract Surgery Performed as Day Care ................................................... 55
1.3.6 Distribution of Types of Cataract Surgery ........................................................................... 58
1.3.7 Distribution of Combined Surgery ....................................................................................... 62
1.3.8 Anaesthesia in Cataract Surgery ........................................................................................ 64
1.3.9 Intraocular Lens (IOL) ......................................................................................................... 82
1.4 Intra-operative Complications ..................................................................................................... 84
1.4.1 Intra-operative Complications ............................................................................................. 85
1.4.2 Intra-operative Complications by Type of Cataract Surgery ............................................... 85
1.4.3 Intra-operative Complications by Combined Surgery ......................................................... 89
1.4.4 Intra-operative Complications by Type of Local Anaesthesia ............................................. 91
1.4.5 Intra-operative Complications by Surgeon Status ............................................................... 91
1.4.6 Posterior Capsular Rupture (PCR) ...................................................................................... 95
1.4.7 Posterior Capsular Rupture (PCR) by Type of Cataract Surgery ..................................... 100
1.5 Cataract Surgery Outcome ....................................................................................................... 101
1.5.1 Post-operative Complications Record and Ascertainment................................................ 101
1.5.2 Post-operative Infectious Endophthalmitis ........................................................................ 101
1.5.3 Unplanned Return to Operating Theatre (OT) .................................................................. 103
1.5.4 Post-operative Follow Up Period ....................................................................................... 105
1.5.5 Post-operative Visual Acuity (All Eyes) ............................................................................. 105
1.5.6 Post-operative Visual Acuity (Eyes without Ocular Co-morbidity) .................................... 109
1.5.7 Post-operative Visual Acuity 6/12 or Better in Eyes without Ocular Co-morbidity ............ 112
1.5.8 Reasons for No Record of Visual Acuity ........................................................................... 117
1.5.9 Factors Contributing to Post-operative Refracted Visual Acuity of Worse than 6/12 ....... 117
1.5.10 Actual or Residual Refractive Power (in Spherical Equivalent) ........................................ 119
CHAPTER 2: KLINIK KATARAK 1MALAYSIA .......................................................................................... 130
2.1 Stock and Flow .......................................................................................................................... 130
2.1.1 Stock and Flow .................................................................................................................. 130
2.2 Characteristics of Patients ........................................................................................................ 130
2.2.2 Demography ...................................................................................................................... 130
2.2.1 Systemic Co-Morbidity ...................................................................................................... 132
2.2.2 Causes of Cataract ............................................................................................................ 133
2.2.3 First of Second Eye Surgery ............................................................................................. 133
2.2.4 Past Ocular Surgery of the Operated Eye......................................................................... 134
2.2.5 Pre-existing Ocular Co-morbidity ...................................................................................... 135
2.2.6 Pre-operative Vision .......................................................................................................... 136
2.2.7 Target Refractive Power ................................................................................................... 138
2.3 Cataract Surgical Practices ....................................................................................................... 140
2.3.1 Number of Cataract Surgery Registered to CSR by State ................................................ 140

16
2.3.2 Surgeon Status .................................................................................................................. 140
2.3.3 Duration of Surgery ........................................................................................................... 140
2.3.4 Distribution of Cataract Surgery Performed Under Day Care Setting ............................... 141
2.3.5 Distribution of Types of Cataract Surgery ......................................................................... 141
2.3.6 Anaesthesia in Cataract Surgery ...................................................................................... 142
2.3.7 Intraocular Lens Implantation ............................................................................................ 144
2.4 Intra-operative Complications ................................................................................................... 145
2.4.1 Intra-operative Complications ........................................................................................... 145
2.4.2 PCR ................................................................................................................................... 146
2.4.3 PCR by Type of Cataract Surgery ..................................................................................... 148
2.5 Cataract Surgery Outcome ....................................................................................................... 148
2.5.1 Post-operative Complications Record and Ascertainment................................................ 148
2.5.2 Post-operative Infectious Endophthalmitis ........................................................................ 148
2.5.3 Post-operative Follow-up Period ....................................................................................... 149
2.5.4 Post-operative Visual Acuity ............................................................................................. 149
2.5.5 Post-operative Visual Acuity 6/12 or Better Among Eyes without Ocular Co-morbidity .. 151
2.5.6 Factors Contributing to Post-operative Refracted Visual Acuity of Worse than 6/12 ....... 152
2.5.7 Actual or Residual Refractive Power (in Spherical Equivalent) ........................................ 153
CHAPTER 3: MAIWP-HOSPITAL SELAYANG (PPKM-HS) .................................................................... 158
3.1 Stock and Flow .......................................................................................................................... 158
3.1.1 Stock and Flow .................................................................................................................. 158
3.2 Characteristics of Patients ........................................................................................................ 158
3.2.1 Patient Demography.......................................................................................................... 158
3.2.2 Systemic co-morbidity ....................................................................................................... 160
3.2.3 Causes of cataract ............................................................................................................ 161
3.2.4 First or Second Eye Surgery ............................................................................................. 161
3.2.5 Past Ocular Surgery of the Operated Eye......................................................................... 162
3.2.6 Pre-existing Ocular Co-morbidity ...................................................................................... 162
3.2.7 Pre-operative Vision .......................................................................................................... 164
3.2.8 Target Refractive Power ................................................................................................... 166
3.3 Cataract Surgical Practices ....................................................................................................... 167
3.3.1 Surgeon Status .................................................................................................................. 167
3.3.2 Duration of Surgery ........................................................................................................... 167
3.3.3 Distribution of Types of Cataract Surgery ......................................................................... 168
3.3.4 Anaesthesia in Cataract Surgery ...................................................................................... 168
3.3.5 Intraocular Lens Implantation ............................................................................................ 169
3.4 Intra-operative Complications ................................................................................................... 170
3.4.1 Intra-operative Complications by Years ............................................................................ 170
3.4.2 PCR ................................................................................................................................... 171
3.4.3 PCR by Type of Cataract Surgery ..................................................................................... 172
3.5 Cataract Surgery Outcome ....................................................................................................... 172

17
3.5.1 Post-operative Complications Record and Ascertainment................................................ 172
3.5.2 Post-operative Infectious Endophthalmitis ........................................................................ 173
3.5.3 Post-operative Follow-up Period ....................................................................................... 173
3.5.4 Post-operative Visual Acuity ............................................................................................. 174
3.5.5 Post-operative Visual Acuity 6/12 or Better Among Eyes without Ocular Co-morbidity ... 177
3.5.7 Factors Contributing to Post-operative Refracted Visual Acuity of Worse than 6/12 ....... 178
3.5.8 Actual or Residual Refractive Power (Spherical Equivalent) ............................................ 179
CHAPTER 4: RETINOBLASTOMA REGISTRY ....................................................................................... 183
4.1 Stock and Flow .......................................................................................................................... 183
4.1.1 Stock and Flow .................................................................................................................. 183
4.2 Patient Demography ................................................................................................................. 183
4.2.1 Age, Gender and Ethnics .................................................................................................. 183
4.3 Ocular History and Presentation ............................................................................................... 184
4.3.1 Ocular History and Presentation ....................................................................................... 184
4.4 Investigation and Classification ................................................................................................. 185
4.4.1 Investigation and Classification ......................................................................................... 185
4.5 Management and Outcome ....................................................................................................... 187
4.5.1 Management and Outcome ............................................................................................... 187

18
List of Tables
Table 1.1.1-1: Stock and Flow, CSR 2007-2014 ............................................................................................................ 35 Table 1.1.1-2: Ascertainment for MOH Hospitals, CSR 2007-2014 ............................................................................... 35 Table 1.1.1-3: Ascertainment by SDP, CSR 2014 .......................................................................................................... 36 Table 1.2.1-1: Age and Gender Distribution, CSR 2007-2014 ....................................................................................... 38 Table 1.2.2-1: Distribution of Systemic Co-morbidity, CSR 2007-2014 .......................................................................... 39 Table 1.2.3-1: Causes of Cataract, CSR 2007-2014 ...................................................................................................... 40 Table 1.2.4-1: First of Second/Fellow eye Surgery, CSR 2007-2014 ............................................................................. 41 Table 1.2.5-1: Past Ocular Surgery of the Operated Eye, CSR 2007-2014 ................................................................... 42 Table 1.2.6-1: Distribution of Pre-existing Ocular Co-Morbidity, CSR 2007-2014 .......................................................... 43 Table 1.2.7-1: Distribution of Pre-Operative Vision, CSR 2007-2014 ............................................................................. 44 Table 1.2.8-1: Distribution of Target Refractive Power, CSR 2007-2014 ....................................................................... 46 Table 1.2.8-2: Distribution of Target Refractive Power (excluding age 0-5 years), CSR 2009-2014 ............................. 46 Table 1.2.8-3: Distribution of Target Refractive Power, CSR 2007-2014 ....................................................................... 47 Table 1.2.8-4: Distribution of Target Refractive Power (excluding age 0-5 years), CSR 2007-2014 ............................. 48 Table 1.3.1-1: Range of Cataract Surgery Registered by SDP per year, Census versus CSR 2007-2014 ................... 49 Table 1.3.1-2: Number of Cataract Surgery by Month, CSR 2007-2014 ........................................................................ 49 Table 1.3.3-1: Surgeon Status, CSR 2007-2014 ............................................................................................................ 51 Table 1.3.3-2: Surgeon Status for Phaco, CSR 2007-2014 ............................................................................................ 51 Table 1.3.3-3: Surgeon Status for ECCE, CSR 2007-2014 ............................................................................................ 51 Table 1.3.3-4: Specialist by SDP, CSR 2007-2014 ........................................................................................................ 52 Table 1.3.3-5: GazettingSpecialist by SDP, CSR 2007-2014 ......................................................................................... 53 Table 1.3.3-6: Medical Officer by SDP, CSR 2007-2014 ................................................................................................ 54 Table 1.3.4-1: Duration of Surgery by Types of Cataract Surgery, CSR 2007-2014 ...................................................... 55 Table 1.3.4-2: Duration of Surgery by Surgeon Status, CSR 2007-2014 ....................................................................... 55 Table 1.3.5-1: Distribution of Cataract Surgery Performed as Day Care, CSR 2007-2014 ........................................... 55 Table 1.3.5-2: Distribution of Cataract Surgery Performed as Day Care (Excluding Children and Combined Surgery),
CSR 2007-2014 .............................................................................................................................................................. 56 Table 1.3.6-1: Distribution of Types Cataract Surgery, CSR 2007-2014 ........................................................................ 58 Table 1.3.6-2: Distribution of Types Cataract Surgery by SDP, CSR 2007-2014 .......................................................... 59 Table 1.3.6-3: Distribution of Phaco by SDP, CSR 2007-2014 ...................................................................................... 60 Table 1.3.6-4: Distribution of ECCE by SDP, CSR 2007-2014 ....................................................................................... 61 Table 1.3.7-1: Distribution of Combined Surgery, CSR 2007-2014 ................................................................................ 62 Table 1.3.7-2: Distribution of Combined Surgery by SDP, CSR 2007-2014 .................................................................. 63 Table 1.3.8-1: Types of Anaesthesia, CSR 2007-2014 .................................................................................................. 65 Table 1.3.8-2: Types of Anaesthesia (50 years and above), CSR 2007-2014 ............................................................... 66 Table 1.3.8-3: Types of Anaesthesia by SDP, CSR 2014 .............................................................................................. 67 Table 1.3.8-4: Types of Anaesthesia by SDP (50 years and above), CSR 2014 ........................................................... 68 Table 1.3.8-5: Types of Local Anaesthesia by SDP, CSR 2014 ..................................................................................... 69 Table 1.3.8-6: Types of Local Anaesthesia by SDP (50 years and above), CSR 2014 ................................................. 70 Table 1.3.8-7: Types of Local Anaesthesia by SDP (Excluding Combined Surgery), CSR 2014 .................................. 71 Table 1.3.8-8: Types of Local Anaesthesia by SDP (50 years and above, Excluding Combined Surgery), CSR 2014 72 Table 1.3.8-9: Subtenon Anaesthesia by SDP, CSR 2007-2014 ................................................................................... 73 Table 1.3.8-10: Subtenon Anaesthesia by SDP (50 years and above), CSR 2007-2014 .............................................. 74 Table 1.3.8-11: Topical Anaesthesia by SDP, CSR 2007-2014 ..................................................................................... 75 Table 1.3.8-12: Topical Anaesthesia by SDP (50 years and above), CSR 2007-2014 .................................................. 76 Table 1.3.8-13: Types of Sedation in Eyes Given Local Anaesthesia by SDP, CSR 2014 ............................................ 77 Table 1.3.8-14: Types of Sedation in Eyes Given Local Anaesthesia by SDP (50 years and above), CSR 2014 ......... 78 Table 1.3.8-15: Oral Sedation Alone by SDP, CSR 2007-2014 ..................................................................................... 79 Table 1.3.8-16: Oral Sedation Alone by SDP (50 years and above), CSR 2007-2014 .................................................. 80 Table 1.3.8-17: Intravenous Sedation Alone by SDP, CSR 2007-2014 ......................................................................... 81 Table 1.3.8-18: Intravenous Sedation Alone by SDP (50 years and above), CSR 2007-2014 ...................................... 82 Table 1.3.9-1: IOL Implantation, CSR 2007-2014........................................................................................................... 83 Table 1.3.9-2: Distribution of IOL Placement by SDP, CSR 2014 .................................................................................. 84 Table 1.4.1-1: Distribution of Type of Intra-operative Complications, CSR 2007-2014 .................................................. 85

19
Table 1.4.1-2: Distribution of Type of Intra-operative Complications (Posterior Capsular Rupture) CSR 2007-2014 ... 85 Table 1.4.2-1: Intra-operative Complications by Types of Cataract Surgery, CSR 2007-2014 ...................................... 86 Table 1.4.2-2: Types Intra-operative Complications by Types of Cataract Surgery, CSR 2014 .................................... 87 Table 1.4.2-3: Distribution of the Types Intra-operative Complications by SDP (All Cataract Surgeries), CSR 2014 ... 87 Table 1.4.2-4: Distribution of the Types Intra-operative Complications by SDP (Phaco converted to ECCE), CSR 2014
........................................................................................................................................................................................ 88 Table 1.4.3-1: Distribution of Intra-operative Complications by Any Combined Surgery, CSR 2007-2014.................... 89 Table 1.4.3-2: Distribution of Intra-operative Complications by Specific Combined Surgery, CSR 2014 ...................... 90 Table 1.4.3-3: Distribution of Intra-operative Complications when Combined with Filtering Surgery, CSR 2007-2014 . 90 Table 1.4.3-4: Distribution of Intra-operative Complications when Combined with Vitreoretinal Surgery, CSR 2007-
2014 ................................................................................................................................................................................ 90 Table 1.4.4-1: Intra-operative Complications by Types of Local Anaesthesia, CSR 2014 ............................................. 91 Table 1.4.5-1: Intra-operative Complications by Surgeon Status (All Surgery), CSR 2007-2014 .................................. 91 Table 1.4.5-2: Intra-operative Complications by Surgeon Status (Phaco), CSR 2009-2014 ......................................... 93 Table 1.4.6-1: PCR by SDP, CSR 2007-2014 ................................................................................................................ 95 Table 1.4.6-2: PCR by Surgeon Status and SDP (Phaco), CSR 2014 ........................................................................... 96 Table 1.4.7-1: PCR by Type of Cataract Surgery, CSR 2007-2014 ............................................................................. 100 Table 1.5.1-1: Distribution of Cataract Surgery with Post-operative Complication Record, CSR 2007-2014 .............. 101 Table 1.5.2-1: Post-operative Infectious Endophthalmitis, CSR 2007-2014 ................................................................ 101 Table 1.5.2-2: Time from Surgery to Diagnosis, CSR 2007-2014 ................................................................................ 103 Table 1.5.3-1: Unplanned Return to OT, CSR 2007-2014 ............................................................................................ 104 Table 1.5.3-2: Reasons for Unplanned Return to OT, CSR 2007-2014 ....................................................................... 104 Table 1.5.3-3: Time from Surgery to Unplanned Return to OT, CSR 2014 .................................................................. 105 Table 1.5.4-1: Median Follow-up Period by Types of Cataract Surgery (Eyes with Unaided Vision in Weeks), CSR
2014 .............................................................................................................................................................................. 105 Table 1.5.4-2: Median Follow-up Period by Types of Cataract Surgery (Eyes with Refracted Vision) in Weeks, CSR
2014 .............................................................................................................................................................................. 105 Table 1.5.5-1: Post-operative Visual Acuity (All Eyes), CSR 2007-2014 ..................................................................... 106 Table 1.5.6-1: Post-operative Visual Acuity (Eyes without Ocular Co-morbidity), CSR 2007-2014 ............................. 109 Table 1.5.7-1: Post-operative Visual Acuity in Eyes without Ocular Co-morbidity by Types of Surgery, CSR 2007-2014
...................................................................................................................................................................................... 112 Table 1.5.7-2: Post-operative Refracted Visual Acuity in Eyes without Ocular Co-morbidity by Intra-operative
Complications and Types of Surgery, CSR 2014 ......................................................................................................... 113 Table 1.5.7-3: Post-operative Refracted Visual Acuity in Eyes without Ocular Co-morbidity by Surgeon Status and
Types of Surgery, CSR 2014 ........................................................................................................................................ 113 Table 1.5.7-4: Post-operative Refracted Visual Acuity in Eyes without Ocular Co-morbidity by SDP and Types of
Surgery, CSR 2014 ....................................................................................................................................................... 115 Table 1.5.8-1: Reasons for No Records of Visual Acuity, CSR 2007-2014 .................................................................. 117 Table 1.5.9-1: Factors Contributing to Post-operative Refracted Visual Acuity of Worse than 6/12 (All Eyes), CSR
2007-2014 ..................................................................................................................................................................... 118 Table 1.5.9-2: Factors Contributing to Post-operative Refracted Visual Acuity of Worse than 6/12 (Eyes without Ocular
Co-morbidity), CSR 2007-2014 ..................................................................................................................................... 119 Table 1.5.10-1: Distribution of Target and Actual Refractive Power in ECCE and Phaco, CSR 2007-2014 ............... 119 Table 1.5.10-2: Distribution of Target and Actual Refractive Power in ECCE and Phaco by Diopter, CSR 2007-2014
...................................................................................................................................................................................... 121 Table 1.5.10-3: Difference Between Target and Actual Refractive Power by Diopter in Phaco, CSR 2007-2014 ....... 125 Table 1.5.10-4: Difference Between Target and Actual Refractive Power within ±1.0D by SDP in Phaco and ECCE,
CSR 2014 ...................................................................................................................................................................... 127 Table 1.5.10-5:Post-operative Visual Acuity and Week of Outcome Notification, CSR 2014 ...................................... 128 2.1.1-1: Stock and Flow, CSR 2013-2014 .................................................................................................................... 130 2.2.2-1: Age Distribution, CSR 2013-2014 .................................................................................................................... 130 Table 2.2.1-1: Distribution of Systemic Co-morbidity, CSR 2013-2014 ........................................................................ 132 Table 2.2.2-1: Causes of Cataract, CSR 2013-2014 .................................................................................................... 133 Table 2.2.3-1: First or Fellow Eye Surgery, CSR 2013-2014 ....................................................................................... 133 Table 2.2.4-1: Past Ocular Surgery of the Operated Eye, CSR 2013-2014 ................................................................. 134 Table 2.2.5-1:Distribution of Pre-existing Ocular Co-morbidity, CSR 2013-2014 ......................................................... 135

20
Table 2.2.6-1:Distribution of Pre-Operative Vision, CSR 2013-2014............................................................................ 136 Table 2.2.7-1:Distribution of Target Refractive Power, CSR 2013-2014 ...................................................................... 138 Table 2.2.7-2:Distribution of Target Refractive Power, CSR 2013-2014 ...................................................................... 139 Table 2.3.1-1:Number of Cataract Surgery Registered to CSR by State, CSR 2013-2014 ......................................... 140 Table 2.3.2-1:Surgeon Status, CSR 2013-2014 ........................................................................................................... 140 Table 2.3.3-1:Duration of Surgery by Types of Cataract Surgery in minutes, CSR 2013-2014 ................................... 140 Table 2.3.4-1:Distribution of Cataract Surgery Performed Under Day Care Setting, CSR 2013-2014 ........................ 141 Table 2.3.5-1Distribution of Types of Cataract Surgery, CSR 2013-2014 .................................................................... 141 Table 2.3.5-2:Distribution of Types of Cataract Surgery by SDP, CSR 2013-2014 ..................................................... 141 Table 2.3.5-3:Distribution of Phacoemulsification by SDP, CSR 2013-2014 ............................................................... 142 Table 2.3.5-4:Distribution of ECCE by SDP, CSR 2013-2014 ...................................................................................... 142 Table 2.3.6-1:Types of Anaesthesia, CSR 2013-2014 ................................................................................................. 142 Table 2.3.6-2:Types of Anaesthesia in Patients 50 years and above, CSR 2013-2014............................................... 143 Table 2.3.7-1:Intraocular Lens Implantation, CSR 2013-2014 ..................................................................................... 144 Table 2.3.7-2:Distribution of IOL Placement, CSR 2013-2014 ..................................................................................... 145 Table 2.4.1-1:Distribution of Type of Intra-operative Complications, CSR 2013-2014 ................................................. 145 Table 2.4.1-2:Distribution of Type of Intra-operative Complications – Posterior Capsule Rupture, CSR 2013-2014 .. 145 Table 2.4.1-3:Distribution of Types of Intra-operative Complications, CSR 2013-2014 ............................................... 146 Table 2.4.2-1:PCR, CSR 2013-2014 ............................................................................................................................ 146 Table 2.4.3-1:PCR by Type of Cataract Surgery, CSR 2013-2014 .............................................................................. 148 Table 2.5.1-1:Distribution of Cataract Surgery with Post-operative Complication Record, CSR 2013-2014 ............... 148 Table 2.5.2-1:Post-operative Infectious Endophthalmitis, CSR 2013-2014 ................................................................. 148 Table 2.5.3-1:Median Follow-up Period for Eyes with Unaided Vision (in weeks) by Types of Surgery, CSR 2013-2014
...................................................................................................................................................................................... 149 Table 2.5.3-2:Median Follow-up Period for Eyes with Refracted Vision (in weeks) by Types of Surgery, CSR 2013-
2014 .............................................................................................................................................................................. 149 Table 2.5.4-1:Post-operative Visual Acuity, All Eyes, CSR 2013-2014 ........................................................................ 149 Table 2.5.4-2:Post-Operative Visual Acuity for Eyes without Ocular Co-morbidity, CSR 2013-2014 .......................... 150 Table 2.5.5-1:Post-operative Visual Acuity 6/12 or Better for Eyes without Ocular Co-morbidities by Types of Surgery,
CSR 2013-2014 ............................................................................................................................................................ 151 Table 2.5.5-2:Post-operative Refracted Visual Acuity 6/12 or Better in Eyes without Ocular Co-morbidities by
Complications and Types of Surgery, CSR 2013-2014 ................................................................................................ 152 Table 2.5.6-1:Factors Contributing to Post-operative Refracted VA of Worse than 6/12 in All Eyes, CSR 2013-2014152 Table 2.5.6-2:Factors Contributing to Post-operative Refracted VA of Worse than 6/12 in Eyes without Preexisting
Ocular co-morbidity, CSR 2013-2014 ........................................................................................................................... 153 Table 2.5.7-1:Distribution of Target and Actual Refractive Power in ECCE and Phaco, CSR 2013-2014 ................... 153 Table 2.5.7-2:Percentage Distribution of Target and Actual Refractive Power in ECCE and Phaco, CSR 2013-2014153 Table 2.5.7-3:Difference in Target and Actual Refractive Power for Patients who had Phacoemulsification Only, CSR
2013-2014 ..................................................................................................................................................................... 155 Table 2.5.7-4:Percentage of Difference in Target and Actual Refractive Power within ±1.0D by SDP, CSR 2013-2014
...................................................................................................................................................................................... 156 Table 3.1.1-1:Stock and Flow, CSR 2013-2014 ........................................................................................................... 158 Table 3.2.1-1:Age and Gender Distributions, CSR 2013-2014 ..................................................................................... 158 Table 3.2.2-1:Distribution of Systemic Co-Morbidity, CSR 2013-2014 ......................................................................... 160 Table 3.2.3-1:Causes of Cataract, CSR 2013-2014 ..................................................................................................... 161 Table 3.2.4-1:First or Fellow Eye Surgery, CSR 2013-2014 ........................................................................................ 161 Table 3.2.5-1:Past Ocular Surgery of the Operated Eye, CSR 2013-2014 .................................................................. 162 Table 3.2.6-1:Distribution of Pre-existing Ocular Co-Morbidity, CSR 2013-2014 ......................................................... 163 Table 3.2.7-1:Distribution of Pre-Operative Vision, CSR 2013-2014............................................................................ 164 Table 3.2.8-1:Distribution of Target Refractive Power, CSR 2013-2014 ...................................................................... 166 Table 3.2.8-2:Distribution of Target Refractive Power, CSR 2013-2014 ...................................................................... 166 Table 3.3.1-1:Surgeon Status, CSR 2013-2014 ........................................................................................................... 167 Table 3.3.2-1:Duration of Surgery by Types of Cataract Surgery in minutes, CSR 2013-2014 ................................... 167 Table 3.3.3-1:Distribution of Types of Cataract Surgery, CSR 2013-2014 ................................................................... 168 Table 3.3.4-1:Types of Anaesthesia, CSR 2013-2014 ................................................................................................. 168 Table 3.3.5-1:Intraocular Lens Implantation, CSR 2013-2014 ..................................................................................... 169
21
Table 3.3.5-2:Distribution of IOL Placement, CSR 2013-2014 ..................................................................................... 170 Table 3.4.1-1:Distribution of Type of Intra-operative Complications, CSR 2013-2014 ................................................. 170 Table 3.4.1-2:Distribution of Type of Intra-operative Complications – Posterior Capsule Rupture, CSR 2013-2014 .. 170 Table 3.4.1-3:Distribution of Types of Intra-operative Complications, CSR 2013-2014 ............................................... 171 Table 3.4.3-1:PCR by Type of Cataract Surgery, CSR 2013-2014 .............................................................................. 172 Table 3.5.1-1:Distribution of Cataract Surgery with Post-operative Complication Record, CSR 2013-2014 ............... 172 Table 3.5.2-1:Post-operative Infectious Endophthalmitis, CSR 2013-2014 ................................................................. 173 Table 3.5.3-1:Median Follow-up Period for Eyes with Unaided Vision (in weeks) by Types of Surgery, CSR 2013-2014
...................................................................................................................................................................................... 173 Table 3.5.3-2:Median Follow-up Period for Eyes with Refracted Vision (in weeks) by Types of Surgery, CSR 2013-
2014 .............................................................................................................................................................................. 173 Table 3.5.4-1:Post-operative Visual Acuity, All Eyes, CSR 2013-2014 ........................................................................ 174 Table 3.5.4-2:Post-Operative Visual Acuity for Eyes without Ocular Co-morbidity, CSR 2013-2014 .......................... 175 Table 3.5.5-1:Post-operative Visual Acuity 6/12 or Better for Eyes without Ocular Co-morbidities by Types of Surgery,
CSR 2013-2014 ............................................................................................................................................................ 177 Table 3.5.5-2:Post-operative Refracted Visual Acuity 6/12 or Better in Eyes without Ocular Co-morbidities by
Complications and Types of Surgery, CSR 2013-2014 ................................................................................................ 177 Table 3.5.7-1:Factors Contributing to Post-operative Refracted VA of Worse than 6/12 in All Eyes, CSR 2013-2014178 Table 3.5.7-2:Factors Contributing to Post-operative Refracted VA of Worse than 6/12 in Eyes without Preexisting
Ocular co-morbidity, CSR 2013-2014 ........................................................................................................................... 178 Table 3.5.8-1:Distribution of Target and Actual Refractive Power in ECCE and Phaco, CSR 2013-2014 ................... 179 Table 3.5.8-2:Percentage Distribution of Target and Actual Refractive Power in ECCE and Phaco, CSR 2013-2014179 Table 3.5.8-3:Difference in Target and Actual Refractive Power for Patients who had Phacoemulsification Only, CSR
2013-2014 ..................................................................................................................................................................... 180 Table 3.5.8-4:Difference in Target and Actual Refractive Power within ±1.0D, CSR 2013-2014 ................................. 181 Table 4.1.1-1: Stock and Flow ...................................................................................................................................... 183 Table 4.2.1-1:Distribution of Patients by Age ................................................................................................................ 183 Table 4.2.1-2:Distribution of Patients by Gender .......................................................................................................... 184 Table 4.2.1-3:Distribution of Patients by Ethnics .......................................................................................................... 184 Table 4.3.1-1:Clinical Presentation ............................................................................................................................... 184 Table 4.3.1-2:Duration of Disease at the Time of Presentation .................................................................................... 184 Table 4.3.1-3:Eyes Affected .......................................................................................................................................... 185 Table 4.4.1-1:Type of imaging done at diagnosis, by no. of eyes (n=230) ................................................................... 186 Table 4.4.1-2:Type of imaging done at diagnosis by patient (n=170) ........................................................................... 186 Table 4.4.1-3:Presence of mass, by CT scan ............................................................................................................... 186 Table 4.4.1-4:Presence of mass, by MRI scan ............................................................................................................. 186 Table 4.4.1-5:Presence of calcification, by CT scan ..................................................................................................... 186 Table 4.4.1-6:Presence of calcification, by MRI scan ................................................................................................... 186 Table 4.4.1-7:Presence of extraocular extension, by CT scan ..................................................................................... 186 Table 4.4.1-8:Presence of extraocular extension, by MRI scan ................................................................................... 186 Table 4.4.1-9:Type of extraocular extension, by CT scan ............................................................................................ 186 Table 4.4.1-10:Type of extraocular extension, by MRI scan ........................................................................................ 186 Table 4.4.1-11:Classification of Retinoblastoma ........................................................................................................... 187 Table 4.5.1-1:Table 3.5.1: Chemotherapy by patient ................................................................................................... 188 Table 4.5.1-2:Table 3.5.2: Treatment method by no. of eyes ....................................................................................... 188 Table 4.5.1-3:Table 3.5.3: Treatment method for all patients with chemotherapy ....................................................... 188 Table 4.5.1-4:Table 3.5.4: Outcome and complications, by no. of eyes ....................................................................... 189 Table 4.5.1-5:Table 3.5.5: Outcome by patient............................................................................................................. 189

22
LIST OF FIGURES
Figure 1.1.1-1: Stock and Flow, CSR 2002-2014 ........................................................................................................... 36 Figure 1.1.1-2: Ascertainment by SDP, CSR 2014 ......................................................................................................... 37 Figure 1.2.1-1: Age Distribution, CSR 2007-2014 .......................................................................................................... 39 Figure 1.2.2-1: Percentage of Patients with Specific Ocular Co-morbidity, CSR 2002-2014 ......................................... 40 Figure 1.2.5-1: Percentage Distribution of Past Ocular Surgery of the Operated Eye, CSR 2002-2014 ....................... 42 Figure 1.2.6-1: Percentage Distribution of Eyes with Diabetic Retinopathy, Glaucoma and Lens-induced Glaucoma,
CSR 2002-2014 .............................................................................................................................................................. 44 Figure 1.2.7-1: Distribution of Pre-operative Vision (Unaided and Refracted) CSR 2014 .............................................. 45 Figure 1.2.7-2: Distribution of Pre-operative Vision (Unaided), CSR 2002-2014 ........................................................... 45 Figure 1.2.7-3: Distribution of Pre-operative Vision (Refracted), CSR 2002-2014 ......................................................... 46 Figure 1.3.1-1: Number of Cataract Surgeries by Month, CSR 2002-2014 .................................................................... 50 Figure 1.3.2-1: Number of Cataract Surgeries by State, CSR 2003-2014...................................................................... 50 Figure 1.3.5-2: Distribution of Cataract Surgery Performed by SDP (Day Care VS In Patient, Excluding Surgery Done
in Children and Combined Surgery), CSR 2014 ............................................................................................................. 57 Figure 1.3.5-3: Distribution of Cataract Surgery Performed as Day Care by SDP (Excluding Surgery Done in Children
and Combined Surgery), CSR 2002-2014 ...................................................................................................................... 57 Figure 1.3.5-1: Distribution of Cataract Surgery by SDP (Day Care VS In Patient), CSR 2014 .................................... 58 Figure 1.3.6-1: Distribution of Phaco, ECCE and Phaco Converted to ECCE, CSR 2002-2014 ................................... 59 Figure 1.3.7-1: Distribution of Specific Combined Surgery, CSR 2002-2014 ................................................................. 63 Figure 1.3.8-1: Types of Anaesthesia, CSR 2002-2014 ................................................................................................. 66 Figure 1.3.9-1: Intraocular Lens Implantation, CSR 2002-2014 ..................................................................................... 83 Figure 1.4.1-1: Distribution of Specific Type of Intra-operative Complications, CSR 2002-2014 ................................... 85 Figure 1.4.2-1: Intra-operative Complications by Type of Cataract Surgery, CSR 2007-2014....................................... 86 Figure 1.4.5-1: Percentage Distribution of Intra-operative Complications by Surgeon Status (All Surgery), CSR 2007-
2014 ................................................................................................................................................................................ 93 Figure 1.4.5-2: Percentage Distribution of Intra-operative Complications by Surgeon Status (Phaco), CSR 2007-2014
........................................................................................................................................................................................ 94 Figure 1.4.6-1: PCR by SDP, Bar Chart (All Surgery), CSR 2014 .................................................................................. 97 Figure 1.4.6-2: PCR by SDP, Bar Chart (Phaco), CSR 2014 ......................................................................................... 97 Figure 1.4.6-3: PCR by SDP, Radar Chart (All Surgery), CSR 2014 ............................................................................. 98 Figure 1.4.6-4: PCR by SDP, Radar Chart (Phaco), CSR 2014 ..................................................................................... 98 Figure 1.4.6-5: PCR by SDP, Funnel Plot (All Surgery), CSR 2014 ............................................................................... 99 Figure 1.4.6-6: PCR by SDP, Funnel Plot (Phaco), CSR 2014 ...................................................................................... 99 Figure 1.4.7-1: PCR by Type of Cataract Surgery, CSR 2007-2014 ............................................................................ 100 Figure 1.5.2-1: Percentage of Post-operative Infectious Endophthalmitis, CSR 2007-2014 ........................................ 102 Figure 1.5.2-2: Percentage of Post-operative Infectious Endophthalmitis in Bar Chart, CSR 2014 ............................. 102 Figure 1.5.2-3: Percentage of Post-operative Infectious Endophthalmitis in Radar Chart, CSR 2014 ........................ 103 Figure 1.5.3-1: Reasons for Unplanned Return to Operating Theatre, CSR 2007-2014.............................................. 104 Figure 1.5.5-1: Percentage Distribution of Post-operative Unaided and Refracted Visual Acuity, CSR 2007-2014 .... 108 Figure 1.5.5-2: Post-operative Unaided Visual Acuity by Visual Category (All Eyes), CSR 2007-2014 ...................... 108 Figure 1.5.5-3: Post-operative Refracted Visual Acuity by Visual Category (All Eyes), CSR 2007-2014 .................... 108 Figure 1.5.6-1: Post-operative Visual Acuity for Eyes Without Ocular Co-morbidity, CSR 2007-2014 ........................ 111 Figure 1.5.6-2: Post-operative Unaided Visual Acuity by Visual Category (No Ocular Co-morbidity), CSR 2007-2014
...................................................................................................................................................................................... 111 Figure 1.5.6-3: Post-operative Refracted Visual Acuity by Visual Category (No Ocular Co-morbidity), CSR 2007-2014
...................................................................................................................................................................................... 111 Figure 1.5.7-1: Post-operative Visual Acuity 6/12 or Better for Eyes Without Ocular Co-morbidity (ECCE and Phaco),
CSR 2007-2014 ............................................................................................................................................................ 113 Figure 1.5.7-2: Post-operative Refracted Visual Acuity 6/12 or Better in Eyes Without Ocular Co-morbidity by Surgeon
Status in Phaco, CSR 2007-2014 ................................................................................................................................. 114 Figure 1.5.7-3: Post-operative Refracted Visual Acuity 6/12 or Better in Eyes Without Ocular Co-morbidity by Surgeon
Status in ECCE, CSR 2007-2014 ................................................................................................................................. 114 Figure 1.5.7-4: Post-operative Refracted Visual Acuity 6/12 or Better in Eyes Without Ocular Co-morbidity by Surgeon
Status in Phaco Converted to ECCE, CSR 2007-2014 ................................................................................................ 114

23
Figure 1.5.7-5: Post-operative Refracted Visual Acuity 6/12 or Better in Eyes Without Ocular Co-morbidity by SDP (All
Surgery), CSR 2014 ...................................................................................................................................................... 116 Figure 1.5.7-6: Post-operative Refracted Visual Acuity 6/12 or Better in Eyes Without Ocular Co-morbidity by SDP
(Phaco), CSR 2014 ....................................................................................................................................................... 116 Figure 1.5.7-7: Post-operative Refracted Visual Acuity 6/12 or Better in Eyes Without Ocular Co-morbidity by SDP
(ECCE), CSR 2014 ....................................................................................................................................................... 117 Figure 1.5.9-1: Factors Contributing to Post-operative Refracted Visual Acuity worse than 6/12 (All Eyes), CSR 2007-
2014 .............................................................................................................................................................................. 118 Figure 1.5.10-1: Percentage Distribution of Actual Refractive Power (ECCE), CSR 2007-2014 ................................. 124 Figure 1.5.10-2: Percentage Distribution of Actual Refractive Power (Phaco), CSR 2007-2014 ................................. 124 Figure 1.5.10-3: Difference in Target and Actual Refractive Power (Phaco), CSR 2007-2014 .................................... 126 Figure 2.2.1-1: Percentage of Patients with Specific Systemic Co-morbidity, CSR 2013-2014 ................................... 132 Figure 2.2.4-1:Distribition of Past Ocular Surgery of the Operated Eye, CSR 2013-2014 ........................................... 134 Figure 2.2.5-1:Distribution of Eyes with Specific Ocular Co-morbidity, CSR 2013-2014 ............................................. 136 Figure 2.2.6-1:Distribution of Pre-Operative Vision (Unaided/presenting and refracted), CSR 2013 .......................... 137 Figure 2.2.6-2:Distribution of Pre-Operative Vision (Unaided/presenting and refracted), CSR 2014 .......................... 137 Figure 2.2.6-3:Distribution of Pre-Operative Vision (Unaided/presenting), CSR 2013-2014 ....................................... 138 Figure 2.2.6-4:Distribution of Pre-Operative Vision (Refracted), CSR 2013-2014 ....................................................... 138 Figure 2.3.6-1:Types of Anaesthesia, CSR 2013-2014 ................................................................................................ 143 Figure 2.3.7-1:Intraocular Lens Implantation, CSR 2013-2014 .................................................................................... 144 Figure 2.4.1-1:Distribution of Specific Type of Intra-operative Complications, CSR 2013-2014 .................................. 146 Figure 2.4.2-1:PCR (all surgeries) (National standard set at <3.0%), CSR 2013-2014 ............................................... 147 Figure 2.4.2-2:PCR (Phaco only) (National standard set at <3.0%), CSR 2013-2014 ................................................. 147 Figure 2.5.4-1:Distribution of Post-operative Unaided and Refracted Visual Acuity, All Eyes, CSR 2013-2014 ......... 150 Figure 2.5.4-2:Post-Operative Visual Acuity for Eyes without Ocular Co-morbidity, CSR 2013-2014 ......................... 151 Figure 2.5.5-1:Figure 2.5.5 1:Post-operative Visual Acuity 6/12 or Better for Eyes without Ocular Co-morbidities by
ECCE and Phaco, CSR 2013-2014 .............................................................................................................................. 152 Figure 2.5.7-1:Distribution of Actual Refractive Power in ECCE and Phaco, CSR 2013-2014 .................................... 154 Figure 2.5.7-2:Difference in Target and Actual Refractive Power for Patients who had Phacoemulsification Only, CSR
2013-2014 ..................................................................................................................................................................... 155 Figure 3.2.1-1:Age Distribution, CSR 2013-2014 ......................................................................................................... 159 Figure 3.2.2-1: Percentage of Patients with Specific Systemic Co-morbidity, CSR 2013-2014 ................................... 160 Figure 3.2.5-1:Distribution of Past Ocular Surgery of the Operated Eye, CSR 2013-2014 .......................................... 162 Figure 3.2.6-1:Distribution of Eyes with Specific Ocular Co-morbidity, CSR 2013-2014 ............................................. 163 Figure 3.2.7-1:Distribution of Pre-Operative Vision (Unaided/presenting and refracted), CSR 2013 .......................... 164 Figure 3.2.7-2:Distribution of Pre-Operative Vision (Unaided/presenting and refracted), CSR 2014 .......................... 165 Figure 3.2.7-3:Distribution of Pre-Operative Vision (Unaided/presenting), CSR 2013-2014 ....................................... 165 Figure 3.2.7-4:Distribution of Pre-Operative Vision (Refracted), CSR 2013-2014 ....................................................... 166 Figure 3.3.4-1:Types of Anaesthesia, CSR 2013-2014 ................................................................................................ 169 Figure 3.4.1-1:Distribution of Specific Type of Intra-operative Complications, CSE 2013-2014 .................................. 171 Figure 3.4.2-1:PCR (all surgeries) (National standard set at <3.0%), CSR 2013-2014 ............................................... 171 Figure 3.4.2-2:PCR (Phaco only) (National standard set at <3.0%), CSR 2013-2014 ................................................. 172 Figure 3.5.4-1:Distribution of Post-operative Unaided and Refracted Visual Acuity, All Eyes, CSR 2013................... 174 Figure 3.5.4-2:Distribution of Post-operative Unaided and Refracted Visual Acuity, All Eyes, CSR 2014................... 175 Figure 3.5.4-3:Post-Operative Visual Acuity for Eyes without Ocular Co-morbidity, CSR 2013 .................................. 176 Figure 3.5.4-4:Post-Operative Visual Acuity for Eyes without Ocular Co-morbidity, CSR 2014 .................................. 176 Figure 3.5.5-1:Post-operative Visual Acuity 6/12 or Better for Eyes without Ocular Co-morbidities by ECCE and
Phaco, CSR 2013-2014 ................................................................................................................................................ 177 Figure 3.5.8-1:Distribution of Actual Refractive Power in ECCE and Phaco, CSR 2013-2014 .................................... 180 Figure 3.5.8-2:Difference in Target and Actual Refractive Power for Patients who had Phacoemulsification Only, CSR
2013-2014 ..................................................................................................................................................................... 181 Figure 4.3.1-1:Onset of Disease ................................................................................................................................... 185 Figure 4.4.1-1:Disease Staging (IIRC) .......................................................................................................................... 187

24
EXECUTIVE SUMMARY
The ascertainment for the submission of both operative and outcome data increased over the years denoting an
increasing representativeness of data in NED. In general, the cataract surgical output per SDP increased throughout
the years with Hospital Alor Setar, Hospital Ipoh, Hospital Pulau Pinang, Hospital Melaka and Hospital Umum
Sarawak leading the way by producing more than 2000 surgeries per year. Similar to past years, the issue of
increasing percentages of patients with Hypertension and Diabetes Mellitus and the low percentage of patients who
had second eye cataract surgery need to be acknowledged and addressed by optimising pre-operative care and
increasing population awareness. The implementation of day care surgery concept also has to be strengthened as
only 66.7% of surgery was done as Day Care in 2014. The percentage of surgery using Phaco technique however,
was increasing (39.7% in 2002 to 87.4% in 2014) with a parallel increase in the use of topical anaesthesia and
foldable acrylic Intraocular Lens. There was also an increasing trend in the combined usage of intracameral
anaesthesia for cataract surgery. Although the percentage of Posterior Capsular Rupture remained at 2.7%, the
percentage of intra-operative complications in general was in a decreasing trend. The percentage of eye with post-
operative infectious endophthalmitis also decreased from 0.08% in 2013 to 0.05% in 2014.

25
REPORT SUMMARY
CATARACT SURGERY REGISTRY
1. Stock and Flow
The number of SDP increased from 25 SDPs in 2002 to 43 SDPs in 2014 onwards.
The total number of cataract surgery registered to CSR increased from 12798 in 2002 to 40532 in 2014.
The CSR ascertainment slightly increased from 94.3% in 2013 to 96.7% in 2014.
2. Characteristics of Patients
The mean age of patients at the time of cataract surgery was 65.9 in 2014. This age was younger than data
published by the Swedish cataract surgery register (74 years old).
Up to 1/5 of patients presented within the age group of 65-69 years old (21.1% in 2014).
The proportion of patients with systemic co-morbidity increased from 56.8% in 2002 to 75.6% in 2014.
There was an increase in the proportion of patients presented for cataract surgery who had hypertension (from
35.4% in 2002 to 60.3% in 2014) and diabetes mellitus (from 28.9% in 2002 to 44.4% in 2014).
Senile cataract was the commonest cause of primary cataract (99.3 % in 2014).
Trauma was the commonest cause for secondary cataract (63.4% in 2014).
The proportion of patients who returned for cataract surgery in the fellow eye remained the same from 2002 to
2014, i.e. only one third (35.2% in 2014).
Majority of the eyes had no prior ocular surgery (97.4% in 2014).The commonest prior ocular surgery was
pterygium excision (1.0% in 2014).
One third of the eyes had ocular co-morbidity (39.8% in 2014). The commonest ocular co-morbidity was diabetic
retinopathy in any forms (10.9% in 2014).
About half of the eyes had unaided vision <3/60 (43.2% in 2014).
Refraction was not done in more than 2/3 of the eyes (76.5% in 2014). Most of them had VA<3/60 (46.8% in
2014).
Bimodal pattern of pre-operative vision was consistently observed over the years with one peak at the range
between 6/18 to 6/36 and another peak at CF-HM.
In term of the choice of IOL power, majority of surgeons chose target refraction as emmetropia or slightly myopic.
The mean target refractive power in 2014 was -0.4D (SD 0.3)

26
3. Cataract Surgery Practice Patterns
The number of cataract surgery performed by SDPs varied. In 2014, out of the 43 SDPs, 13 SDPs performed 500
surgeries or less, 14 performed between 501 to 1000 and 16 performed more than 1000 cataract surgeries a year.
Selangor (5 main SDPs), Perak (4 main SDPS) and Sarawak (5 main SDPS), performed higher number of
cataract surgeries compared to other state.
More than 2/3 of the cataract surgery was performed by specialists (89.3% in 2014).
The percentage of Phaco surgery done by medical officers was decreasing (3.6% in 2013 to 3.4% in 2014)
The median duration taken to do a cataract surgery was 25 min for phaco and 45 min for ECCE in 2014.
Though there is an increasing trend for day care surgery, from 39.3% in 2002 to 66.7% in 2014, the percentage
varied among SDPs.
Phaco was the preferred method of cataract surgery and the proportion increased from 39.7% in 2002 to 87.4% in
2014. Percentage of ECCE decreased from 54.0% in 2002 to 8.9% in 2014.
The preferred IOL material was acrylic and foldable type.
The percentage of phaco converted to ECCE was 2.0% in 2014. It remained the same over the years.
Among combined surgery, VR surgery was the highest. It showed a decreasing trend.
Majority of cases were done under local anaesthesia (92.9% in 2014). The preferred type of local anesthesia was
topical (66.6% in 2014).
The use of topical anesthesia increased from 11.7% in 2002 to 66.6% in 2014.
The use of intracameral anesthesia increased from 1.5% in 2007 to 16.8% in 2014.
The use of retrobulbar anesthesia decreased from 25.9% in 2002 to 1.2% in 2014.
Majority of the patient operated had IOL implantation (98.7% in 2014). Among these patients who had IOL, 96.1%
had posterior chamber IOL.
4. Intra-operative Complications
The percentage of intra-operative complication decreased from 5.2% in 2012 to 5.3% in 2014
PCR was maintained at 2.7% in 2014.
Intra-op complication was seen among 49.9% of patients who had phaco converted to ECCE and 39.8% who had
ICCE in 2014.
In 2014, the percentage of intra-operative complication was higher in cataract surgeries performed by gazetting
specialists (10.2%), followed by MO (8.4%) as compared to specialist (4.9%). For phaco surgeries, gazetting
specialists (7.4%, MO (7.0%),) and specialist (3.3%)
5. Cataract Surgery Outcome
In average, more than 85.0% of patient registered to CSR had cataract surgery outcome data.
The percentage of patients with post-operative endophthalmitis reduced from 0.08% in 2013 (27 patients) to
0.05% in 2014 (19 patients).
The percentage of patients with unplanned return to OT showed a decreasing trend, 0.26% in 2014.
Iris prolapse showed a decreasing trend but wound dehiscence, high post- operative IOP and IOL related problem
showed no specific trend.
In eyes without ocular co-morbidity, only ½ of eyes had post-op unaided visual acuity 6/12 or better (58.5% in
2014) and the patterns were consistent over the years. With refraction, more than 80.0% achieved post-op vision

27
6/12 or better (81.0% in 2002, 89.0% in 2003, 90.0% in 2004, 84.0% in 2007, 88.0% in 2008, 90.9% in 2009,
92.0% in 2010, 92.4% in 2011, 92.6% in 2012, 93.3% in 2013 and 93.8% in 2014). This observation suggested
that poor post- op unaided vision was due to refractive error and patients’ vision could be improved with glasses.
Patients who had phaco had better post-op visual outcome when compared to other type of surgeries. 94.8% of
phaco patients had refracted vision of 6/12 or better in 2014 as compared to ECCE (84.3.0%), phaco convert to
ECCE (74.6%), lens aspiration (85.6%) and ICCE (57.1%).
Post-op visual outcome improved over the years. Refracted visual outcome of 6/12 or better among phaco patient
improved from 87.0% in 2002 to 94.8% in 2014 and among ECCE patients from 78.0% in 2002 to 84.3% in 2014.
In all type of surgeries, visual outcome became less favourable when there were intra-operative complications.
The main contributing factor for eyes with post-operative refracted VA worse than 6/12 was pre-existing ocular co-
morbidity followed by high astigmatism and Cystoid Macula Edema.
When patients with preexisting ocular co-morbidity were excluded from analysis, high astigmatism followed by
preexisting ocular co-morbidity (not detected preoperatively) were the major causes of poor visual outcome.
In 2014, with the mean target refraction (all eyes) of -0.4D, the mean actual refraction was -0.6D for phaco eyes,
and -0.9D for ECCE eyes. Thus, eyes which had undergone ECCE had more myopic shift than eyes which had
phaco.
In 2014, there was disparity between the targeted and the actual refraction. 81.7% of eyes had a different in target
and actual refraction of between ±1.0D.
KLINIK KATARAK 1MALAYSIA
1. Stock and Flow
The number of SDP increased from 2 SDPs in 2013 to 4 SDPs in 2014.
The total number of cataract surgery registered to CSR increased from 140 in 2013 to 1055 in 2014.
2. Characteristics of Patients
The mean age of patients at the time of cataract surgery was 68.6 in 2014. This age was older than total MOH
(65.9 years old).
Up to 1/5 of patients presented within the age group of 65-69 years old (22.8% in 2014).
In 2014, there proportion of patients presented for cataract surgery who had hypertension was 47.4% and
diabetes mellitus was 24.5%.
Senile cataract was the commonest cause of primary cataract (99.6 % in 2014).
Trauma was the cause for secondary cataract (100% in 2014).
The proportion of patients who returned for cataract surgery in the fellow eye was only 1/5 (19.4% in 2014).
Majority of the eyes had no prior ocular surgery (99.5% in 2014).
Less than one third of the eyes had ocular co-morbidity (24.3% in 2014). The commonest ocular co-morbidity was
diabetic retinopathy in any forms (1.6% in 2014) and pterygium significantly involving the cornea (1.6% in 2014)
More than half of the eyes had unaided vision <3/60 (59.2% in 2014).
Refraction was not done in most of the eyes (94.0% in 2014). Most of them had VA<3/60 (60.1% in 2014).

28
Bimodal pattern of pre-operative vision was observed over the years with one peak at the range between 6/18 to
6/36 and another peak at CF-HM.
In term of the choice of IOL power, majority of surgeons chose target refraction as emmetropia or slightly myopic.
The mean target refractive power in 2014 was -0.3D (SD 0.2)
3. Cataract Surgery Practice Patterns
The number of cataract surgery performed by SDPs varied depending on location, period of service and
availability of the bus (for KK1M mobile)
The median duration taken to do a cataract surgery was 20 min for phaco and 35 min for ECCE in 2014.
The percentage of surgeries performed under daycare setting increased from 55.5% in 2013 to 97.3% in 2014.
Phaco was the preferred method of cataract surgery and the proportion increased from 88.5% in 2013 to 88.5% in
2014. Percentage of ECCE slightly increased from 8.6% in 2013 to 9.5% in 2014.
The preferred IOL material was acrylic and non-foldable type.
Majority of cases were done under local anaesthesia (98.8% in 2014). The preferred type of local anesthesia was
topical (84.4% in 2014).
The use of topical anesthesia increased from 64.7% in 2013 to 84.4% in 2014.
Majority of the patient operated had IOL implantation (97.3% in 2014). Among these patients who had IOL, 94.9%
had posterior chamber IOL.
4. Intra-operative Complications
The percentage of intra-operative complication decreased from 7.1% in 2013 to 4.93% in 2014
PCR increased from 1.4% in 2014 to 2.7% in 2014.
5. Cataract Surgery Outcome
In average, more than 80.0% of patient registered to CSR had cataract surgery outcome data.
The percentage of patients with post-operative endophthalmitis was 0%.
In eyes without ocular co-morbidity, only ½ of eyes had post-op unaided visual acuity 6/12 or better (46.1% in
2014). With refraction, more than 90.0% achieved post-op vision 6/12 or better (90.5% in 2014). This observation
suggested that poor post- op unaided vision was due to refractive error and patients’ vision could be improved
with glasses.
Patients who had phaco had better post-op visual outcome when compared to other type of surgeries. 90.7% of
phaco patients had refracted vision of 6/12 or better in 2014 as compared to ECCE (88.6%).
The main contributing factor for eyes with post-operative refracted VA worse than 6/12 was high astigmatism
followed by pre-existing ocular co-morbidity.
When patients with preexisting ocular co-morbidity were excluded from analysis, preexisting ocular co-morbidity
(not detected preoperatively) followed by high astigmatism were the major causes of poor visual outcome.
In 2014, with the mean target refraction (all eyes) of -0.3D, the mean actual refraction was -1.0D for phaco eyes,
and -1.2D for ECCE eyes. Thus, eyes which had undergone ECCE had more myopic shift than eyes which had
phaco.

29
In 2014, there was disparity between the targeted and the actual refraction. 62.2%of eyes had a different in target
and actual refraction of between ±1.0D.
MAIWP-HOSPITAL SELAYANG
1. Stock and Flow
The total number of cataract surgery registered to CSR increased from 1506 in 2013 to 2266 in 2014.
2. Characteristics of Patients
The mean age of patients at the time of cataract surgery was 65.2 in 2014. This age was younger than total MOH
(65.9 years old).
Up to 1/5 of patients presented within the age group of 65-69 years old (23.6% in 2014).
In 2014, there proportion of patients presented for cataract surgery who had hypertension was 62.0% and
diabetes mellitus was 46.0%.
Senile cataract was the commonest cause of primary cataract (99.7 % in 2014).
The proportion of patients who returned for cataract surgery in the fellow eye was almost half (40.3% in 2014).
Majority of the eyes had no prior ocular surgery (97.8% in 2014).
Less than one third of the eyes had ocular co-morbidity (16.9% in 2014). The commonest ocular co-morbidity was
diabetic retinopathy in any forms (7.3% in 2014) and glaucoma (2.0% in 2014)
One third of the eyes had unaided vision <3/60 (33.3% in 2014).
Refraction was not done in most of the eyes (94.0% in 2014). Most of them had VA<3/60 (60.1% in 2014).
Bimodal pattern of pre-operative vision was observed over the years with one peak at the range between 6/18 to
6/36 and another peak at CF-HM.
In term of the choice of IOL power, majority of surgeons chose target refraction as emmetropia or slightly myopic.
The mean target refractive power in 2014 was -0.4D (SD 0.3)
3. Cataract Surgery Practice Patterns
The median duration taken to do a cataract surgery was 20 min for phaco and 38 min for ECCE in 2014.
Phaco was the preferred method of cataract surgery and the proportion increased from 95.1% in 2013 to 96.9%
in 2014. Percentage of ECCE decreased from 2.5% in 2013 to 0.8% in 2014.
The preferred IOL material was acrylic and non-foldable type.
The use of topical anesthesia increased from 85.1% in 2013 to 95.8% in 2014.
Majority of the patient operated had IOL implantation (99.6% in 2014). Among these patients who had IOL, 98.2%
had posterior chamber IOL.
4. Intra-operative Complications
The percentage of intra-operative complication decreased from 7.1% in 2013 to 4.93% in 2014
PCR was 1.3% in 2014.

30
5. Cataract Surgery Outcome
In average, more than 90.0% of patient registered to CSR had cataract surgery outcome data.
The percentage of patients with post-operative endophthalmitis was 0%.
In eyes without ocular co-morbidity, almost 2/3 eyes had post-op unaided visual acuity 6/12 or better (69.7% in
2014). With refraction, more than 90.0% achieved post-op vision 6/12 or better (96.6% in 2014). This observation
suggested that poor post- op unaided vision was due to refractive error and patients’ vision could be improved
with glasses.
Patients who had phaco had better post-op visual outcome when compared to other type of surgeries. 96.9% of
phaco patients had refracted vision of 6/12 or better in 2014 as compared to ECCE (85.7%).
The main contributing factor for eyes with post-operative refracted VA worse than 6/12 was high astigmatism
followed by pre-existing ocular co-morbidity.
When patients with preexisting ocular co-morbidity were excluded from analysis, preexisting ocular co-morbidity
(not detected preoperatively) followed by high astigmatism were the major causes of poor visual outcome.
In 2014, with the mean target refraction (all eyes) of -0.3D, the mean actual refraction was -0.5D for phaco eyes,
and -0.3D for ECCE eyes. Thus, eyes which had undergone ECCE had more myopic shift than eyes which had
phaco.
In 2014, there was disparity between the targeted and the actual refraction. 93.9% of eyes had a different in target
and actual refraction of between ±1.0D.
COMPARISON BETWEEN ALL MOH AND KK1M (2014)
All MOH PPKM-HS KK1M Mobile and Transit
Concept of Service
Outreach Low risk patients Fully day care Fully certified surgeons
Outreach Multilevel risk of patients Fully certified surgeons
Patient Profile Age Mean 65.9
65.2 Mean 68.6
Systemic Co-morbidity
75.6% (Hypertension 61.3%) (Diabetis Mellitus 44.4%)
77.3% (Hypertension 62.0%) (Diabetis Mellitus 46.0%)
57.3% (Hypertension 47.4%) (Diabetis Mellitus 24.5%)
First eye vs Second Eye Surgery
First eye 64.3% Second eye 35.2%
First eye 53.5% Second eye 40.3%
First eye 80.6% Second eye 19.4%
Past Ocular Surgery 97.4% no past ocular surgery
97.8% no past ocular surgery
99.5% no past ocular surgery
Ocular Co-morbidity
39.8%. The commonest was diabetic retinopathy in any forms (10.9%)
16.9& The commonest was diabetic retinopathy in any forms (7.3%) and glaucoma (2.0%)
24.3% The commonest was diabetic retinopathy in any forms and pterygium significantly involving the cornea (1.6%)

31
All MOH PPKM-HS KK1M Mobile and Transit
Pre-operative VA
<6/60 (50.7%) <6/60 (45.0%) <6/60 (63.4%)
Bimodal VA
Bimodal pattern of pre-operative vision was consistently observed over the years with one peak at the range between 6/18 to 6/36 and another peak at CF-HM.
Similar pattern Similar pattern
Surgical Practices Day Care 66.7%
NA 97.3%
Method of Cataract Extraction
Phaco 87.4% ECCE 8.9%
Phaco 96.9% ECCE 0.8%
Phaco 88.5% ECCE 9.5%
Topical anaesthesia
66.6% 95.8% 84.4
Subtenon anaesthesia
24.8% 5.4% 14.7%
Intracameral anaesthesia
16.8% 21.8% 0.5%
Intraoperative Complication
Overall percentage of intra-operative complication
5.3% 2.69% 5.0%
PCR 2.7%
1.3% (may not be accurate due to data mapping error)
2.7%
Outcome Surgeries with outcome data
93.0% 99.0% 80.0%
Post-operative Endophthalmitis
0.05% (19 patients). 0% 0%
Percentage of unaided VA 6/12 or better in eye without ocular co-morbidity
58.5% 69.7% 46.1%
Percentage of refracted VA 6/12 or better in eye without ocular co-morbidity
93.8% 96.6% 90.5%
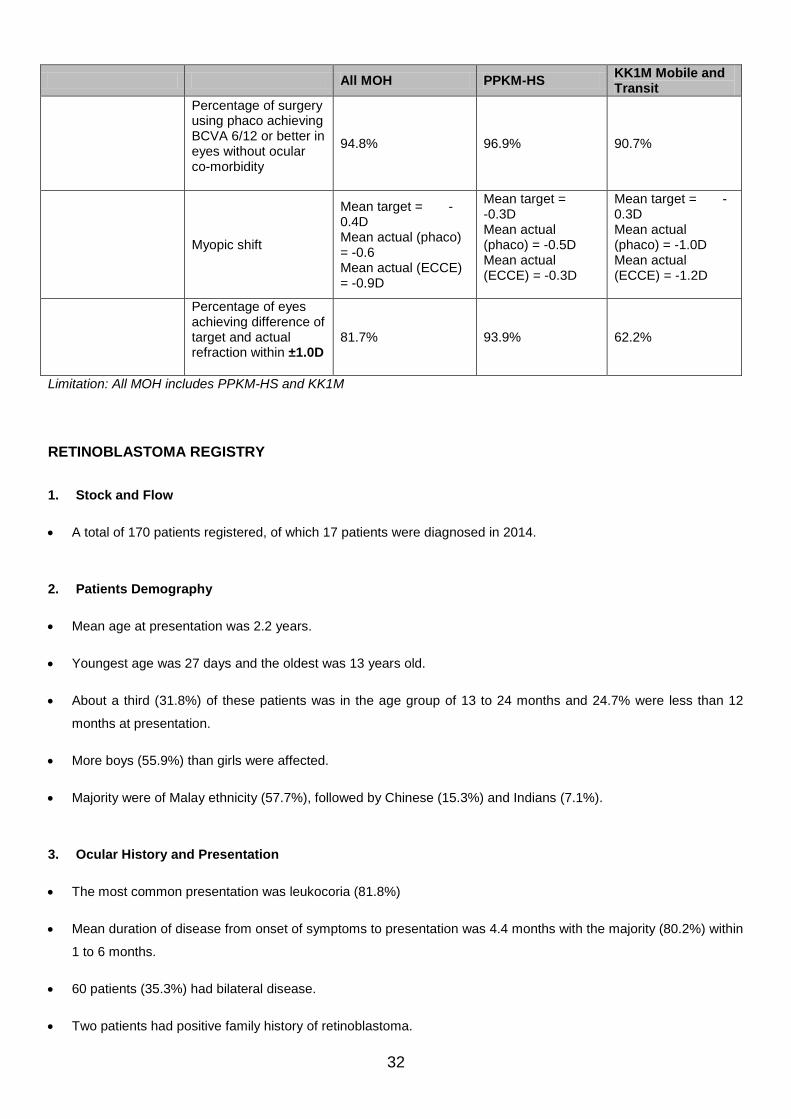
32
All MOH PPKM-HS KK1M Mobile and Transit
Percentage of surgery using phaco achieving BCVA 6/12 or better in eyes without ocular co-morbidity
94.8% 96.9% 90.7%
Myopic shift
Mean target = -0.4D Mean actual (phaco) = -0.6 Mean actual (ECCE) = -0.9D
Mean target = -0.3D Mean actual (phaco) = -0.5D Mean actual (ECCE) = -0.3D
Mean target = -0.3D Mean actual (phaco) = -1.0D Mean actual (ECCE) = -1.2D
Percentage of eyes achieving difference of target and actual refraction within ±1.0D
81.7% 93.9% 62.2%
Limitation: All MOH includes PPKM-HS and KK1M
RETINOBLASTOMA REGISTRY
1. Stock and Flow
A total of 170 patients registered, of which 17 patients were diagnosed in 2014.
2. Patients Demography
Mean age at presentation was 2.2 years.
Youngest age was 27 days and the oldest was 13 years old.
About a third (31.8%) of these patients was in the age group of 13 to 24 months and 24.7% were less than 12
months at presentation.
More boys (55.9%) than girls were affected.
Majority were of Malay ethnicity (57.7%), followed by Chinese (15.3%) and Indians (7.1%).
3. Ocular History and Presentation
The most common presentation was leukocoria (81.8%)
Mean duration of disease from onset of symptoms to presentation was 4.4 months with the majority (80.2%) within
1 to 6 months.
60 patients (35.3%) had bilateral disease.
Two patients had positive family history of retinoblastoma.

33
4. Investigation and Classification
The presence of calcified mass was detected in 68.7% by CT scan.
In patients who underwent MRI, 10.0% showed presence of mass but only 8.3% had calcification.
Extraocular extension detected by CT scan in 23 eyes, 10% and 2.6% through CT scan and MRI respectively, the
majority involved the optic pathway.
More than half (54.8%) of the patients presented with Group E Retinoblastoma.
5. Management
60.6% of patients had systemic chemotherapy with a mean of 7 cycles (maximum 15 chemotherapy cycles).
In bilateral cases, 10 patients had ocular (7 subtenon and 3 intravitreal injection) chemotherapy combined with
systemic chemotheraphy
82 affected eyes out of 110 eyes (74.5%) with unilateral RB were enucleated with 41.8% of these eyes showed
histopathological extension outside eyeball.
Among eyes with bilateral involvement, 40.0% of eyes were enucleated, 9 patients had external beam
radiotherapy.

34
CHAPTER 1
CATARACT SURGERY REGISTRY 2014
Contributing Editors
Mohamad Aziz Salowi
Goh Pik Pin
Nor Sharina Yusof
Adlina Abdul Rahim
Ruqqayah Ahmadshah Khan
Tassha Hilda Adnan
Nadiah Sa’at

35
CHAPTER 1: CATARACT SURGERY REGISTRY
1.1 Stock and Flow
1.1.1 Stock and Flow
The number of CSR source data provider (SDP) continued to increase. In 2014, there were in total 43 SDPs. The number of cataract surgeries being registered to CSR also increased from 18426 in 2007 to 40532 in 2014.
Table 1.1.1-1: Stock and Flow, CSR 2007-2014
Year No. of SDP Total no. of cataract surgery registered to
CSR
Cataract surgery with visual outcome records
n %
2007 32 18426 15786 85.7
2008 36 21496 19063 88.7
2009 36 24438 20590 84.3
2010 36 28506 24521 86.0
2011 36 30611 27219 88.0
2012 36 32473 28589 88.0
2013 41 37150 33063 89
2014 43 40532 36251 89.4
Table 1.1.1-2: Ascertainment for MOH Hospitals, CSR 2007-2014
Year
Total number of cataract surgery performed at
MOH Hospitals (Source: MOH census returns)
Total number of cataract surgery performed at MOH hospitals and registered to CSR
Ascertainment (%)
2007 22051 18426 83.6%
2008 25393 21496 84.6%
2009 26274 24438 93.0%
2010 29873 28506 95.4%
2011 32099 30611 95.4%
2012 34363 32473 94.5%
2013 39389 37150 94.3%
2014 41927 40532 96.7%

36
1.1.1-3: Ascertainment by SDP, CSR 2014
Ascertainment
Total no. of
cataract surgery (based
on census)
(a)
Total no. of cataract
surgery registered
to CSR (based on operative record)
(b)
Total no. of
outcome form
submitted (c)
Total no. of
outcome form with unaided vision
(d)
Total no. of
outcome form with refracted
vision (e)
% Ascertainment for
CSR (b/a*100)
% Ascertainm
ent for Outcome
form submitted (c/b*100)
% Ascertainment for Outcome
with unaided vision
(d/c*100)
% Ascertainm
ent for Outcome
with refracted
vision (e/c*100)
All Centres 41927 40532 37946 36251 33532 96.7 93.6 95.5 88.4 Alor Setar 2106 2106 2106 2054 1778 100.0 100.0 97.5 84.4 Ampang 950 946 946 936 812 99.6 100.0 98.9 85.8 Batu Pahat 458 467 467 420 420 102.0 100.0 89.9 89.9 Bintulu 349 374 302 291 285 107.2 80.7 96.4 94.4 Bukit Mertajam
1056 998 998 916 821 94.5 100.0 91.8 82.3
Sandakan 527 237 235 182 180 45.0 99.2 77.4 76.6 Ipoh 2786 2759 2574 2524 2302 99.0 93.3 98.1 89.4 Kangar 496 426 335 334 305 85.9 78.6 99.7 91.0 Keningau 133 133 133 128 119 100.0 100.0 96.2 89.5 Kota Bharu 285 285 141 140 83 100.0 49.5 99.3 58.9 Kuala Krai 582 365 355 353 303 62.7 97.3 99.4 85.4 Kuala Lumpur 1777 1932 938 920 905 108.7 48.6 98.1 96.5 Kuala Pilah 520 493 492 481 468 94.8 99.8 97.8 95.1 Kuala Terengganu
961 900 850 848 835 93.7 94.4 99.8 98.2
Melaka 2148 2139 2139 1979 1781 99.6 100.0 92.5 83.3 Miri 1003 949 902 859 847 94.6 95.0 95.2 93.9 Muar 734 729 648 640 606 99.3 88.9 98.8 93.5
Figure 1.1.1-1: Stock and Flow, CSR 2002-2014
0
5000
10000
15000
20000
25000
30000
35000
40000
45000
2002 2003 2004 2007 2008 2009 2010 2011 2012 2013 2014
No.
Year
Total number of cataract surgery (census) Total number of cataract surgery (CSR)
No. of cataract surgery with visual outcome records

37
Ascertainment
Total no. of
cataract surgery (based
on census)
(a)
Total no. of cataract
surgery registered
to CSR (based on operative record)
(b)
Total no. of
outcome form
submitted (c)
Total no. of
outcome form with unaided vision
(d)
Total no. of
outcome form with refracted
vision (e)
% Ascertainment for
CSR (b/a*100)
% Ascertainment for Outcome
form submitted (c/b*100)
% Ascertainment for Outcome
with unaided vision
(d/c*100)
% Ascertainm
ent for Outcome
with refracted
vision (e/c*100)
Pulau Pinang
2074 1791 1769 1759 1572 86.4 98.8 99.4 88.9
Putrajaya 444 367 367 362 330 82.7 100.0 98.6 89.9 Kota Kinabalu 1187 1040 951 939 844 87.6 91.4 98.7 88.7 Selayang 899 899 899 875 831 100.0 100.0 97.3 92.4 Serdang 1151 1265 1265 1252 1118 109.9 100.0 99.0 88.4 Sibu 852 866 862 814 774 101.6 99.5 94.4 89.8 Sri Manjung 628 625 624 613 574 99.5 99.8 98.2 92.0 Sultan Ismail 610 609 609 594 594 99.8 100.0 97.5 97.5 Johor Bahru 1470 1381 1056 1003 923 93.9 76.5 95.0 87.4 Sungai Buloh 792 693 693 662 650 87.5 100.0 95.5 93.8 Sungei Petani 1021 1022 1022 1008 859 100.1 100.0 98.6 84.1 Taiping 1233 1233 1233 1221 1165 100.0 100.0 99.0 94.5 Tawau 589 540 501 449 309 91.7 92.8 89.6 61.7 Teluk Intan 1035 1013 1013 922 854 97.9 100.0 91.0 84.3 Temerloh 1046 1047 1047 828 909 100.1 100.0 79.1 86.8 Kuantan 706 576 551 517 498 81.6 95.7 93.8 90.4 Klang 1683 1461 1461 1370 1291 86.8 100.0 93.8 88.4 Seremban 1332 1585 1416 1409 1328 119.0 89.3 99.5 93.8 Kuching 2089 2068 2000 1825 1641 99.0 96.7 91.3 82.1 Kemaman 72 72 24 23 18 100.0 33.3 95.8 75.0 Sarikei 555 555 524 519 475 100.0 94.4 99.0 90.6 Kulim 267 265 265 236 234 99.3 100.0 89.1 88.3 KK1M Terengganu
37 37 36 35 35 100.0 97.3 97.2 97.2
KK1M Kelantan
186 186 130 117 101 100.0 69.9 90.0 77.7
KK1M Sarawak
832 832 815 711 707 100.0 98.0 87.2 86.7
MAIWP 2266 2266 2252 2183 2048 100.0 99.4 96.9 90.9
Figure 1.1.1-2: Ascertainment by SDP, CSR 2014
0
1000
2000
3000
Alo
r Set
ar
Am
pang
Batu
Pah
at
Bint
ulu
Buki
t M
erta
jam
Sand
akan
Ipoh
Kang
ar
Keni
nga
u
Kota
Bha
ru
Kual
a Kr
ai
Kual
a Lu
mpu
r
Kual
a Pi
lah
Kua
la T
ere
ngg
anu
Mel
aka
Mir
i
Mua
r
Pu
lau
Pin
ang
Putr
ajay
a
Kota
Kin
abal
u
Sela
yang
Serd
ang
Sib
u
Sri M
anju
ng
Sulta
n Is
mai
l
Joho
r Bah
ru
Sung
ai B
ulo
h
Sung
ei P
etan
i
Taip
ing
Taw
au
Telu
k In
tan
Tem
erlo
h
Kuan
tan
Klan
g
Sere
mba
n
Kuch
ing
Kem
aman
Sari
kei
Kulim
KK1M
Ter
engg
anu
KK1M
Kel
anta
n
KK1M
Sar
awak
MA
IWP
Center
Total no. of cataract surgery (census)
Total no. of cataract surgery (CSR)

38
1.2 Characteristics of Patient
1.2.1 Demography
The mean age for patients presented for cataract surgery was 65. A larger percentage of patients presented within the age group of 65-74 years old. There was no marked gender difference over the years.
Table 1.2.1-1: Age and Gender Distribution, CSR 2007-2014
Year 2007 2008 2009 2010 2011 2012 2013 2014
Total number of cataract surgery
18426 21496 24438 28506 30611 32473 37150 40532
Age
Mean (yrs) 64.3 64.6 64.7 65 65 65 65.7 65.9
Median (yrs) 66 66 66 66 66 66 67 67
Minimum (month)
1 1 1.2 1.8 2.6 0.8 0.8 3.3
Maximum (yrs)
97 102 99 99 104 99 105 101
% Distribution
Age group, years
n % n % n % n % n % n % n % n %
0-4 54 0.3 49 0.2 56 0.2 60 0.2 49 0.2 64 0.2 20 0.1 25 0.1
5-9 54 0.3 59 0.3 66 0.3 70 0.3 74 0.2 81 0.3 41 0.1 40 0.1
10-14 51 0.3 42 0.2 43 0.2 47 0.2 57 0.2 61 0.2 64 0.2 49 0.1
15-19 49 0.3 49 0.2 52 0.2 70 0.3 72 0.2 64 0.2 82 0.2 77 0.2
20-24 71 0.4 84 0.4 77 0.3 73 0.3 103 0.3 75 0.2 94 0.3 86 0.2
25-29 77 0.4 67 0.3 104 0.4 90 0.3 90 0.3 96 0.3 113 0.3 106 0.3
30-34 80 0.4 100 0.5 106 0.4 137 0.5 125 0.4 146 0.5 133 0.4 128 0.3
35-39 180 1.0 162 0.8 180 0.7 198 0.7 224 0.7 196 0.6 219 0.6 212 0.5
40-44 314 1.7 377 1.8 377 1.5 457 1.6 408 1.3 474 1.5 459 1.2 469 1.2
45-49 727 4.0 777 3.6 881 3.6 966 3.4 984 3.2 988 3.0 1110 3.0 1035 2.6
50-54 1409 7.7 1630 7.6 1816 7.4 2077 7.3 2186 7.1 2089 6.4 2220 6.0 2365 5.8
55-59 2128 11.6 2540 11.8 2868 11.7 3379 11.9 3646 11.9 3758 11.6 4158 11.2 4507 11.1
60-64 2895 15.7 3497 16.3 4088 16.7 4846 17.0 5341 17.5 5689 17.5 6443 17.3 7272 17.9
65-69 3675 19.9 4169 19.4 4656 19.1 5069 17.8 5609 18.3 6372 19.6 7556 20.3 8563 21.1
70-74 3425 18.6 4138 19.3 4878 20.0 5651 19.8 5870 19.2 6102 18.8 7045 19.0 7444 18.4
75-79 2059 11.2 2456 11.4 2789 11.4 3446 12.1 3816 12.5 4135 12.7 5077 13.7 5502 13.6
≥80 1128 6.1 1279 6.0 1401 5.7 1868 6.6 1957 6.4 2083 6.4 2316 6.2 2652 6.5
Missing 50 0.3 21 0.1 0 0 2 0.0 0 0 0 0 0 0 0 0
Gender
Male 8820 47.9 10295 47.9 11829 48.4 13631 47.8 14696 48 15506 47.8 17604 47.4 19109 47.2
Female 9606 52.1 11168 52 12609 51.6 14871 52.2 15915 52 16966 52.3 19546 52.6 21423 52.8
Missing 0 0 33 0.2 0 0 4 0 0 0 1 0 0 0 0 0

39
1.2.2 Systemic Co-morbidity
The common systemic co-morbidity encountered in patients presenting for cataract surgery were hypertension, diabetes mellitus, ischemic heart disease and renal failure The overall percentage of such patients showed an increasing trend over the years. The percentages of patients with hypertension and diabetes mellitus were increasing.
Table 1.2.2-1: Distribution of Systemic Co-morbidity, CSR 2007-2014
Year 2007 2008 2009 2010 2011 2012 2013 2014
No of patients (N) 18426 21496 24438 28506 30611 32473 37150 40532
Percentage of patients with any systemic co-morbidity
67.5 68.7 71 70.6 72 72.4 74.8 75.6
Percentage of patients with specific systemic co-morbidity
n % n % n % n % n % n % n % n %
1. Hypertension 8630 46.8 10932 50.9 13050 53.4 15630 54.8 17238 56.3 18655 57.5 22327 60.1 24832 61.3
2. Diabetes Mellitus 6869 37.3 8188 38.1 9556 39.1 11598 40.7 12778 41.7 13635 42.0 16073 43.3 17976 44.4
3. Ischaemic Heart Disease
1668 9.1 2037 9.5 2294 9.4 2441 8.6 2515 8.2 2565 7.9 3026 8.1 3283 8.1
4. Renal Failure 461 2.5 624 2.9 679 2.8 804 2.8 814 2.7 822 2.5 1021 2.7 1160 2.9
5. Cerebrovascular accident
0 0 29 0.1 305 1.2 302 1.1 380 1.2 352 1.1 444 1.2 571 1.4
6. COAD/Asthma 798 4.3 955 4.4 1039 4.3 1024 3.6 1088 3.6 1104 3.4 1340 3.6 1543 3.8
7. Others 1399 7.6 1974 9.2 2460 10.1 2891 10.1 3538 11.6 3916 12.1 5766 15.5 6797 16.8
Number or percentage may be more than total or 100% as patients might have more than one systemic co-morbidity
Figure 1.2.1-1: Age Distribution, CSR 2007-2014
0
1000
2000
3000
4000
5000
6000
7000
8000
9000
0-4 5-9 10-14 15-19 20-24 25-29 30-34 35-39 40-44 45-49 50-54 55-59 60-64 65-69 70-74 75-79 ≥80
No
.
Age Group
2007 2008 2009 2010 2011 2012 2013 2014

40
38.140.4
46.850.9
53.454.8
56.3 57.5
60.1 61.3
30.5 31.5
37.3 38.1 39.140.7 41.7 42.0 43.3 44.4
9.0 9.7 9.1 9.5 9.4 8.6 8.2 7.98.1 8.1
1.8 1.9 2.5 2.9 2.8 2.8 2.7 2.52.7 2.9
0
10
20
30
40
50
60
70
2003 2004 2007 2008 2009 2010 2011 2012 2013 2014
%
Year
HPT
DM
IHD
Renal Failure
Figure 1.2.2-1: Percentage of Patients with Specific Ocular Co-morbidity, CSR 2002-2014
1.2.3 Cause of Cataract
Majority of the patients presented with primary cataract. In eyes with primary cataract, senile or age-related cataract was the commonest. In eyes with secondary cataract, trauma was the commonest. This pattern remained unchanged over the years.
Table 1.2.3-1: Causes of Cataract, CSR 2007-2014
Year 2007 2008 2009 2010 2011 2012 2013 2014
No of patients (N)
18426 21496 24438 28506 30611 32473 37150 40532
n % n % n % n % n % n % n % n % Primary cataract 17410 94.4 20329 94.6 23117 94.6 26981 94.7 29050 94.9 30813 94.9 35116 94.5 38908 96.0 Secondary cataract
557 3 530 2.5 587 2.4 660 2.3 764 2.5 608 1.9 547 1.5 568 1.4
Missing value 460 2.5 637 3 734 3 865 3 797 2.6 1052 3.2 1487 4.0 1056 2.6
Primary Cataract (N)
17410 20329 23117 26981 29050 30813 35116 38168
n % n % n % n % n % n % n % n % Senile/age related
17075 98.1 19995 98.4 22782 98.6 26671 98.9 28736 98.9 30299 98.3 34841 99.2 37904 99.3
Congenital 129 0.7 124 0.6 124 0.5 44 0.2 34 0.1 57 0.2 11 0.0 13 0.0 Development 169 1 156 0.8 166 0.7 236 0.9 249 0.9 419 1.4 233 0.7 215 0.6 Others 37 0.2 54 0.3 45 0.2 30 0.1 31 0.1 38 0.1 31 0.1 36 0.1
Secondary Cataract (N)
557 530 587 660 764 608 547 541
n % n % n % n % n % n % n % n % Trauma 355 63.7 330 62.3 330 56.2 346 52.4 383 50.1 313 51.5 322 58.9 343 63.4 Drug induced 55 9.9 76 14.3 79 13.5 64 9.7 60 7.9 46 7.6 48 8.8 71 13.1 Surgery induced 82 14.7 39 7.4 107 18.2 93 14.1 101 13.2 122 20.1 88 16.1 78 14.4 Others 65 11.7 85 16 71 12.1 157 23.8 220 28.8 127 20.9 89 16.3 49 9.1

41
1.2.4 First or Second Eye Surgery
Two third of patients were operated for the first time. Only one third of the patients returned for second surgery (for the fellow eye). This pattern remained unchanged since 2007. This was despite the declining percentage of eyes with intra-operative complications during surgery in the previous eye surgery (from 5.6% in 2002 to 2.7% in 2014). The mean duration between the first and fellow eye showed an increasing trend, from 23.4 months in 2007 to 47.5 months in 2014. Table 1.2.4-1: First of Second/Fellow eye Surgery, CSR 2007-2014
Year 2007 2008 2009 2010 2011 2012 2013 2014
No of patients (N)
18426 21496 24438 28506 30611 32473 37150 40532
n % n % n % n % n % n % n % n % First eye surgery
12810 69.5 14610 68.0 16446 67.3 18919 66.4 20466 66.9 21539 66.3 23986 64.6 26080 64.3
Fellow eye surgery
5559 30.2 6849 31.9 7938 32.5 9441 33.1 10088 33.0 10896 33.6 13045 35.1 14267 35.2
Missing 57 0.3 37 0.2 54 0.2 146 0.5 57 0.2 38 0.1 119 0.3 185 0.5 Patients who had second surgery in the same year
759 4.1 1135 5.3 2702 11.1 2129 7.5 2246 7.3 2545 7.8 3214 8.7 3336 8.2
Period of time between first and fellow eye surgery (months)
N 4860 5953 7353 9378 10009 10784 12922 14170 Mean 23.4 22 24.4 36.1 39.2 40.9 42.3 47.5 SD 24.3 22.8 31.5 43.6 49.3 52.4 58.4 59.6 Median 13.3 13.1 12.1 15.1 15.4 14.7 14.3 15.0
Patients who had cataract surgery before
5559 6849 7938 9441 10088 10896 13045 14267
n % n % n % n % n % n % n % n % Eyes with intra-operative complications during surgery in the first eye
313 5.6 298 4.4 346 4.4 324 3.4 302 3.0 281 2.6 341 2.6 386 2.7
1.2.5 Past Ocular Surgery of the Operated Eye
Most eyes to be operated had no prior ocular surgery. The commonest past ocular surgery was vitreoretinal (VR)
surgery and pterygium surgery. The percentage of eye with past history of filtering surgery and penetrating
keratoplasty remained low.

42
Table 1.2.5-1: Past Ocular Surgery of the Operated Eye, CSR 2007-2014
Year 2007 2008 2009 2010 2011 2012 2013 2014
No. of patients 18426 21496 24438 28506 30611 32473 37150 40532
No. of eyes with past ocular surgery record (N)
17379 20674 23109 26711 28349 30687 34625 37935
n % n % n % n % n % n % n % n %
Patients with no past ocular surgery
16545 95.2 20010 96.8 22387 96.9 25870 96.9 27400 96.7 29770 97.0 33721 97.4 36938 97.4
Vitreoretinal surgery
261 1.4 161 0.8 267 1.2 352 1.3 325 1.1 326 1.1 350 1.0 329 0.9
Pterygium excision 869 0.5 140 0.7 164 0.7 212 0.8 207 0.7 208 0.7 268 0.8 386 1.0
Filtering surgery 1043 0.4 57 0.3 69 0.3 65 0.2 80 0.3 75 0.2 66 0.2 60 0.2
Penetrating keratoplasty
1738 0.1 14 0.1 18 0.1 21 0.1 11 0 11 0.0 18 0.1 8 0.0
Others 417 2.4 304 1.5 216 0.9 203 0.8 332 1.2 305 1.0 220 0.6 236 0.6
Number or percentage may be more than total or 100% as patients might have more than one past ocular surgery
0.0
0.5
1.0
1.5
2.0
2.5
3.0
2002 2003 2004 2007 2008 2009 2010 2011 2012 2013 2014
%
Year
Vitreoretinal surgery
Pterygium excision
Filtering surgery
Penetrating keratoplasty
Others
Figure 1.2.5-1: Percentage Distribution of Past Ocular Surgery of the Operated Eye, CSR 2002-2014

43
1.2.6 Pre-existing Ocular Co-morbidity
One third of the eyes to be operated had ocular co-morbidities. The commonest was diabetic retinopathy (DR) in any
forms then followed by glaucoma.. The percentage of eyes presented with lens related complications (phacolytic and
phacomorphic) appeared to be decreasing.
Table 1.2.6-1: Distribution of Pre-existing Ocular Co-Morbidity, CSR 2007-2014
Year 2007 2008 2009 2010 2011 2012 2013 2014
No of patients (N) 18426 21496 24438 28506 30611 32473 37150 40532
n % n % n % n % n % n % n % n %
Patients with any ocular co-morbidity
5973 32.4 7269 33.8 9442 38.6 11977 42.0 12756 41.7 13024 40.1 15088 40.6 16142 39.8
Patients with specific ocular co-morbidity
Anterior segment
1. Glaucoma 1126 6.1 1408 6.6 1655 6.8 1799 6.3 1976 6.5 2095 6.5 2349 6.3 2385 5.9
2. Pterygium involving the cornea
288 1.6 319 1.5 345 1.4 387 1.4 405 1.3 405 1.3 477 1.3 540 1.3
3. Pseudoexfoliation 221 1.2 253 1.2 318 1.3 289 1 312 1 365 1.1 381 1.0 445 1.1
4. Corneal opacity 176 1 194 0.9 231 0.9 251 0.9 299 1 311 1 338 0.9 447 1.1
5. Chronic uveitis 81 0.4 63 0.3 80 0.3 89 0.3 98 0.3 70 0.2 96 0.3 100 0.2
Len related complication
1. Phacomorphic 89 0.5 85 0.4 83 0.3 120 0.4 114 0.4 138 0.4 90 0.2 110 0.3
2. Phacolytic 44 0.2 45 0.2 47 0.2 59 0.2 69 0.2 41 0.1 56 0.2 63 0.2
3. Subluxated/Disclosed 101 0.5 89 0.4 83 0.3 95 0.3 119 0.4 120 0.4 112 0.3 119 0.3
Posterior segment
1. Diabetic Retinopathy: Non Proliferative
1125 6.1 1273 5.9 916 3.7 996 3.5 1783 5.8 1915 5.9 2214 6.0 2471 6.1
2. Diabetic Retinopathy: Proliferative
465 2.5 614 2.9 1307 5.3 1973 6.9 1031 3.4 933 2.9 1021 2.7 1134 2.8
3. Diabetic Retinopathy: CSME*
198 1.1 221 1 278 1.1 346 1.2 384 1.3 368 1.1 473 1.3 544 1.3
4. Diabetic Retinopathy: Vitreous haemorrhage
176 1 165 0.8 230 0.9 250 0.9 296 1 258 0.8 237 0.6 275 0.7
5. ARMD 231 1.3 259 1.2 387 1.6 462 1.6 494 1.6 521 1.6 609 1.6 695 1.7
6. Other macular disease (includes hole or scar)
118 0.6 148 0.7 188 0.8 277 1 251 0.8 308 1.0 309 0.8 375 0.9
7. Optic nerve disease, any type
71 0.4 69 0.3 118 0.5 149 0.5 123 0.4 182 0.6 191 0.5 206 0.5
8. Retinal detachment 218 1.2 204 0.9 294 1.2 308 1.1 432 1.4 341 1.1 295 0.8 270 0.7
9. Cannot be assessed 1357 7.4 2092 9.7 3139 12.8 4457 15.6 5053 16.5 4914 15.1 5881 15.8 6238 15.4
Miscellaneous
1. Amblyopia 71 0.4 65 0.3 62 0.3 75 0.3 99 0.3 98 0.3 97 0.3 93 0.2
2. Significant previous eye trauma
41 0.2 39 0.2 39 0.2 51 0.2 45 0.2 49 0.2 48 0.1 61 0.2
3. Pre-existing non glaucoma field defect
4 0 2 0 6 0 3 0 4 0 6 0.0 4 0.0 8 0.0
4. Others 668 3.6 755 3.5 1053 4.3 1321 4.6 1505 4.9 1729 5.3 2119 5.7 2065 5.1
*CSME=Clinically Significant Macular Oedema Number or percentage may be more than total or 100% as patients might have more than one ocular co-morbidity

44
8.0 9.7
10.7 10.611
11.0
11.5
10.7 10.6 10.9
6.5 6.76.1
6.6 6.86.3 6.5 6.5 6.3
5.9
1.3 1 1.0 0.6 0.5 0.6 0.6 0.5 0.4 0.5
0
2
4
6
8
10
12
14
2003 2004 2007 2008 2009 2010 2011 2012 2013 2014
%
Year
DR
Glaucoma
Phacomorphic/ Phacolytic
Figure 1.2.6-1: Percentage Distribution of Eyes with Diabetic Retinopathy, Glaucoma and Lens-induced Glaucoma,
CSR 2002-2014
1.2.7 Pre-operative Vision
In each year, more than 70% of all patients did not have refraction pre-operatively. The proportion of eyes operated
(with unaided vision) in the category of <3/60 appeared to be decreasing but the percentages were still high. The
bimodal pattern of pre-operative vision remained the same over the years. The first peak was at 6/18 and the second
peak was at CF/HM. There was a low proportion of patients between 5/60 to1/60.
Table 1.2.7-1: Distribution of Pre-Operative Vision, CSR 2007-2014
Year 2007 2008 2009 2010 2011 2012 2013 2014
No. of patients (N) 18426 21496 24438 28506 30611 32473 37150 40532 n % n % n % n % n % n % n % n % Patients with unaided VA
18356 99.6 21212 98.7 23796 97.4 27977 98.1 30018 98.1 31833 98.0 35988 96.9 39019 96.3
Patients with refracted VA
5071 27.8 5683 26.4 5150 21.1 7895 27.7 7932 25.9 7315 22.5 8418 22.7 9524 23.5
Patients with no refraction
13355 72.5 15813 73.6 19288 78.9 20611 72.3 22679 74.1 25158 77.5 28732 77.3 31008 76.5
6/12 and better
Unaided 602 3.3 646 3.0 788 3.3 1016 3.6 1133 3.8 1397 4.4 1865 5.2 1855 4.8
Refracted 678 13.4 935 16.5 944 18.3 1474 18.7 1712 21.6 1840 25.2 2297 27.3 2280 23.9
<6/12 - 6/18
Unaided 1010 5.5 1172 5.5 1392 5.8 1750 6.3 2087 7.0 2311 7.3 2701 7.5 2958 7.6 Refracted 625 12.3 851 15.0 838 16.3 1262 16.0 1481 18.7 1503 20.5 1564 18.6 1832 19.2
<6/18 - 6/60
Unaided 5638 30.7 6840 32.2 7869 33.1 9238 33.0 10255 34.2 11296 35.5 12787 35.5 14404 36.9
Refracted 1497 29.5 1800 31.7 1729 33.6 2672 33.8 2731 34.4 2531 34.6 2788 33.1 3243 34.1
<6/60 - 3/60
Unaided 1086 5.9 1363 6.4 1588 6.7 2085 7.5 2227 7.4 2316 7.3 2686 7.5 2954 7.6
Refracted 253 5.0 241 4.2 229 4.4 390 4.9 324 4.1 228 3.1 361 4.3 383 4.0
<3/60 Unaided 9920 54.0 11180 52.7 12159 51.1 13888 49.6 14316 47.7 14513 45.6 15949 44.3 16848 43.2
Refracted 2018 39.8 1845 32.5 1410 27.4 2097 26.6 1684 21.2 1213 16.6 1408 16.7 1786 18.8
Unaided VA for patient with no refraction N 13355 15813 19288 20611 22679 25158 28732 31008 6/12 and better 396 3.0 414 2.6 553 2.9 651 3.2 702 3.1 887 3.5 1210 4.2 1228 4.0 <6/12 - 6/18 643 4.8 726 4.6 992 5.1 1062 5.2 1217 5.4 1431 5.7 1704 5.9 1893 6.1 <6/18 - 6/60 3794 28.4 4509 28.5 5654 29.3 5795 28.1 6624 29.2 7762 30.9 8755 30.5 9875 31.8 <6/60 - 3/60 696 5.2 920 5.8 1182 6.1 1382 6.7 1509 6.7 1755 7.0 1943 6.8 2056 6.6 <3/60 7666 57.4 9009 57.0 10412 54.0 11302 54.8 12134 53.5 12777 50.8 14091 49.0 14525 46.8

45
Figure 1.2.7-1: Distribution of Pre-operative Vision (Unaided and Refracted) CSR 2014
Figure 1.2.7-2: Distribution of Pre-operative Vision (Unaided), CSR 2002-2014
3.3 3.0 3.3 3.6 3.8 4.4 5.2 4.85.5 5.5 5.8 6.3 7.0 7.3 7.5 7.6
30.7 32.2 33.1 33.0 34.2 35.5 35.5 36.9
5.9 6.4 6.7 7.5 7.4 7.3 7.5 7.6
54.0 52.7 51.1 49.647.7
45.6 44.3 43.2
0.0
10.0
20.0
30.0
40.0
50.0
60.0
2007 2008 2009 2010 2011 2012 2013 2014
6/12 and better
<6/12 - 6/18
<6/18 - 6/60
<6/60 - 3/60
<3/60
0.0
5.0
10.0
15.0
20.0
25.0
6/56/6
6/96/12
6/186/24
6/366/60
5/604/60
3/602/60
1/60CF
HMPL
NPL
Visual Acuity
Unaided Refracted

46
1.2.8 Target Refractive Power
The mean target refractive power in 2014 was -0.4D (SD 0.3), with minimum at -8.1D and maximum at +6.0D. The
percentage of eyes aimed to have target refraction within (-0.5 to 0 D) increased to 75.1% in 2014. Overall data
demonstrated that most surgeons participated in CSR aimed to give patient either emmetropic or slightly myopic
refraction post- operatively.
Table 1.2.8-1: Distribution of Target Refractive Power, CSR 2007-2014
Year 2007 2008 2009 2010 2011 2012 2013 2014
Operated eye ( N) 11876 15083 20279 24524 25885 26059 28685 32256
Mean -0.5 -0.1 -0.4 -0.4 -0.4 -0.4 -0.4 -0.4
SD 0.4 0.4 0.4 0.4 0.3 0.4 0.3 0.3
Median -0.5 -0.5 -0.5 -0.4 -0.4 -0.4 -0.4 -0.4
Minimum -9 -9.9 -9.9 -9.1 -9.1 -8 -8.5 -8.1
Maximum 5 9.5 5.9 6 4.8 9 9 6.0
Table 1.2.8-2: Distribution of Target Refractive Power (excluding age 0-5 years), CSR 2009-2014
Year 2009 2010 2011 2012 2013 2014
Operated eye ( N) 20236 24490 25848 26017 28678 32236
Mean -0.4 -0.4 -0.4 -0.4 -0.4 -0.4
SD 0.4 0.4 0.3 0.4 0.3 0.3
Median -0.5 -0.4 -0.4 -0.4 -0.4 -0.4
Minimum -9.9 -9.1 -9.1 -8 -8.5 -8.1
Maximum 4.9 6 4.8 9 9 2.8
Figure 1.2.7-3: Distribution of Pre-operative Vision (Refracted), CSR 2002-2014
13.4 16.5
18.3 18.7 21.6
25.2 27.3
23.9
12.3 15.0 16.3 16.0
18.7
20.5 18.6 19.2
29.5 31.7
33.6 33.8 34.4 34.6 33.1 34.1
5.0 4.2 4.4 4.9 4.1 3.1 4.3 4.0
39.8
32.5
27.4 26.6
21.2
16.6 16.7 18.8
0.0
5.0
10.0
15.0
20.0
25.0
30.0
35.0
40.0
45.0
1 2 3 4 5 6 7 8
6/12 andbetter
<6/12 - 6/18
<6/18 - 6/60
<6/60 - 3/60
<3/60

47
Table 1.2.8-3: Distribution of Target Refractive Power, CSR 2007-2014
Year 2007 2008 2009 2010 2011 2012 2013 2014
Target
refractive
power
Dioptres
Operated
eye
Operated
eye
Operated
eye
Operated
eye
Operated
eye
Operated
eye
Operated
eye
Operated
eye
N=11876 N=15083 N=20279 N=24524 N=25885 N=26059 N=28685 N=32256
n % n % n % n % n % n % n % n %
-10-<(-9.5) 0 0 1 0 2 0 0 0 0 0 0 0 0 0 0 0
-9.5-<(-9) 2 0 1 0 1 0 2 0 1 0 0 0 0 0 0 0
-9-<(-8.5) 0 0 1 0 0 0 0 0 0 0 0 0 1 0 0 0
-8.5-<(-8) 1 0 1 0 0 0 0 0 0 0 0 0 1 0 1 0
-8-<(-7.5) 2 0 3 0 1 0 1 0 0 0 1 0 0 0 1 0
-7.5-<(-7) 1 0 0 0 1 0 1 0 0 0 2 0 0 0 0 0
-7-<(-6.5) 3 0 1 0 0 0 1 0 1 0 1 0 1 0 1 0
-6.5-<(-5) 1 0 2 0 7 0 4 0 10 0 10 0 9 0 10 0
-5-<(-4.5) 3 0 4 0 7 0 3 0 3 0 5 0 5 0 1 0
-4.5-<(-4) 1 0 3 0 5 0 10 0 3 0 5 0 3 0 4 0
-4-<(-3.5) 7 0.1 8 0.1 11 0.1 5 0 11 0 5 0 1 0 5 0
-3.5-<(-3) 6 0.1 7 0 11 0.1 15 0.1 12 0.1 6 0 8 0 5 0
-3-<(-2.5) 12 0.1 22 0.1 18 0.1 29 0.1 15 0.1 15 0.1 15 0.1 9 0.0
-2.5-<(-2) 26 0.2 21 0.1 29 0.1 33 0.1 26 0.1 38 0.2 35 0.1 27 0.1
-2-<(-1.5) 77 0.6 48 0.3 58 0.3 46 0.2 54 0.2 67 0.3 55 0.2 52 0.2
-1.5-<(-1) 414 3.5 373 2.5 260 1.3 292 1.2 201 0.8 226 0.9 174 0.6 209 0.7
-1-<(-0.5) 4299 36.2 6151 40.8 7972 39.3 7590 31 7507 29 7190 27.6 6241 21.8 6840 21.2
-0.5-<0 6077 51.2 7480 49.6 10604 52.3 15218 62.1 16913 65.3 17421 66.9 21135 73.7 24210 75.1
0-<0.5 821 6.9 731 4.8 977 4.8 920 3.8 849 3.3 629 2.4 697 2.4 790 2.5
0.5-<1 91 0.8 158 1 182 0.9 237 1 234 0.9 216 0.8 187 0.7 73 0.2
1-<1.5 8 0.1 31 0.2 17 0.1 23 0.1 20 0.1 32 0.1 8 0 4 0
1.5-<2 5 0 14 0.1 22 0.1 19 0.1 9 0 52 0.2 28 0.1 5 0.0
2-<2.5 13 0.1 10 0.1 85 0.4 69 0.3 12 0.1 123 0.5 69 0.2 5 0.0
2.5-<3 1 0 6 0 4 0 3 0 2 0 10 0 11 0 2 0
3-<3.5 1 0 2 0 2 0 0 0 1 0 1 0 0 0 0 0
3.5-<4 0 0 2 0 0 0 0 0 0 0 0 0 0 0 1 0
4-<4.5 2 0 0 0 0 0 0 0 0 0 1 0 0 0 0 0
4.5-<5 1 0 1 0 1 0 1 0 1 0 0 0 0 0 0 0
5-<5.5 1 0 0 0 0 0 1 0 0 0 0 0 0 0 0 0
5.5-<6 0 0 0 0 2 0 0 0 0 0 0 0 0 0 0 0
6-<6.5 0 0 0 0 0 0 1 0 0 0 0 0 0 0 1 0
6.5-<7 0 0 0 0 0 0 0 0 0 0 0 0 0 0 0 0
7-<7.5 0 0 0 0 0 0 0 0 0 0 0 0 0 0 0 0
7.5-<8 0 0 0 0 0 0 0 0 0 0 0 0 0 0 0 0
8-<8.5 0 0 0 0 0 0 0 0 0 0 1 0 0 0 0 0
8.5-<9 0 0 0 0 0 0 0 0 0 0 1 0 0 0 0 0
9-<9.5 0 0 0 0 0 0 0 0 0 0 1 0 1 0 0 0
9.5-10 0 0 1 0 0 0 0 0 0 0 0 0 0 0 0 0
Values outside the +10D and -10D were excluded from analysis as they would skew the mean.
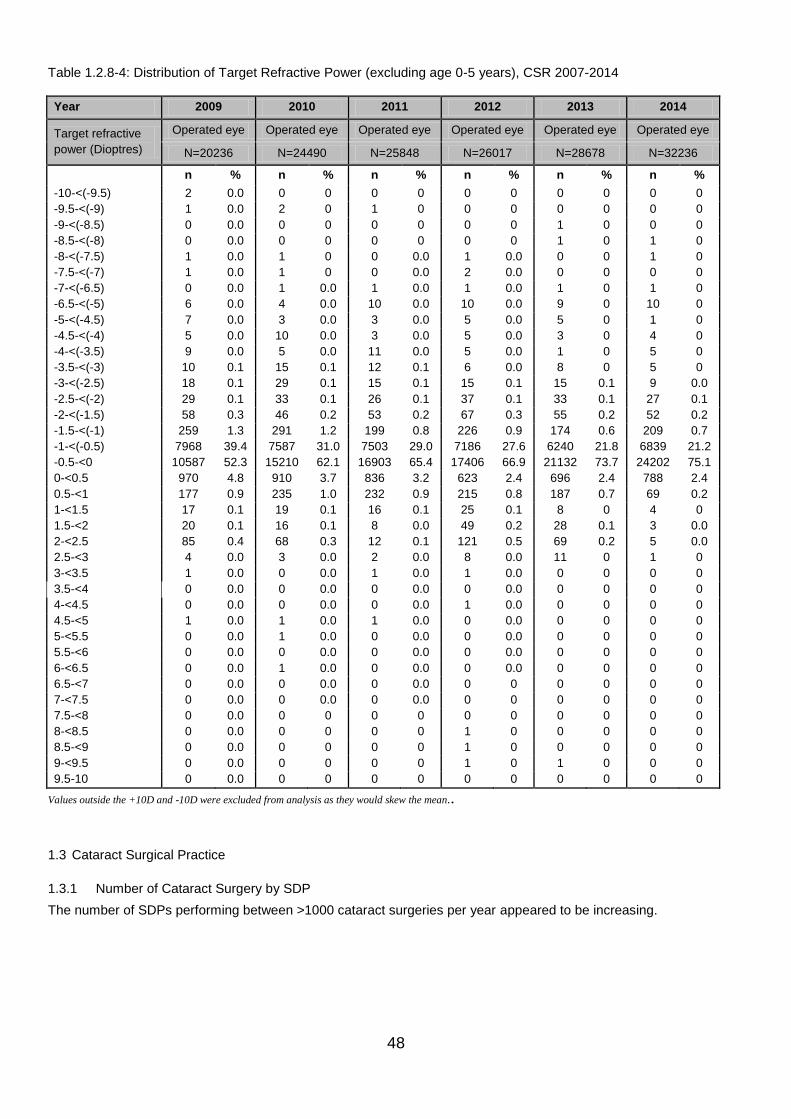
48
Table 1.2.8-4: Distribution of Target Refractive Power (excluding age 0-5 years), CSR 2007-2014
Year 2009 2010 2011 2012 2013 2014
Target refractive
power (Dioptres)
Operated eye Operated eye Operated eye Operated eye Operated eye Operated eye
N=20236 N=24490 N=25848 N=26017 N=28678 N=32236
n % n % n % n % n % n %
-10-<(-9.5) 2 0.0 0 0 0 0 0 0 0 0 0 0
-9.5-<(-9) 1 0.0 2 0 1 0 0 0 0 0 0 0
-9-<(-8.5) 0 0.0 0 0 0 0 0 0 1 0 0 0
-8.5-<(-8) 0 0.0 0 0 0 0 0 0 1 0 1 0
-8-<(-7.5) 1 0.0 1 0 0 0.0 1 0.0 0 0 1 0
-7.5-<(-7) 1 0.0 1 0 0 0.0 2 0.0 0 0 0 0
-7-<(-6.5) 0 0.0 1 0.0 1 0.0 1 0.0 1 0 1 0
-6.5-<(-5) 6 0.0 4 0.0 10 0.0 10 0.0 9 0 10 0
-5-<(-4.5) 7 0.0 3 0.0 3 0.0 5 0.0 5 0 1 0
-4.5-<(-4) 5 0.0 10 0.0 3 0.0 5 0.0 3 0 4 0
-4-<(-3.5) 9 0.0 5 0.0 11 0.0 5 0.0 1 0 5 0
-3.5-<(-3) 10 0.1 15 0.1 12 0.1 6 0.0 8 0 5 0
-3-<(-2.5) 18 0.1 29 0.1 15 0.1 15 0.1 15 0.1 9 0.0
-2.5-<(-2) 29 0.1 33 0.1 26 0.1 37 0.1 33 0.1 27 0.1
-2-<(-1.5) 58 0.3 46 0.2 53 0.2 67 0.3 55 0.2 52 0.2
-1.5-<(-1) 259 1.3 291 1.2 199 0.8 226 0.9 174 0.6 209 0.7
-1-<(-0.5) 7968 39.4 7587 31.0 7503 29.0 7186 27.6 6240 21.8 6839 21.2
-0.5-<0 10587 52.3 15210 62.1 16903 65.4 17406 66.9 21132 73.7 24202 75.1
0-<0.5 970 4.8 910 3.7 836 3.2 623 2.4 696 2.4 788 2.4
0.5-<1 177 0.9 235 1.0 232 0.9 215 0.8 187 0.7 69 0.2
1-<1.5 17 0.1 19 0.1 16 0.1 25 0.1 8 0 4 0
1.5-<2 20 0.1 16 0.1 8 0.0 49 0.2 28 0.1 3 0.0
2-<2.5 85 0.4 68 0.3 12 0.1 121 0.5 69 0.2 5 0.0
2.5-<3 4 0.0 3 0.0 2 0.0 8 0.0 11 0 1 0
3-<3.5 1 0.0 0 0.0 1 0.0 1 0.0 0 0 0 0
3.5-<4 0 0.0 0 0.0 0 0.0 0 0.0 0 0 0 0
4-<4.5 0 0.0 0 0.0 0 0.0 1 0.0 0 0 0 0
4.5-<5 1 0.0 1 0.0 1 0.0 0 0.0 0 0 0 0
5-<5.5 0 0.0 1 0.0 0 0.0 0 0.0 0 0 0 0
5.5-<6 0 0.0 0 0.0 0 0.0 0 0.0 0 0 0 0
6-<6.5 0 0.0 1 0.0 0 0.0 0 0.0 0 0 0 0
6.5-<7 0 0.0 0 0.0 0 0.0 0 0 0 0 0 0
7-<7.5 0 0.0 0 0.0 0 0.0 0 0 0 0 0 0
7.5-<8 0 0.0 0 0 0 0 0 0 0 0 0 0
8-<8.5 0 0.0 0 0 0 0 1 0 0 0 0 0
8.5-<9 0 0.0 0 0 0 0 1 0 0 0 0 0
9-<9.5 0 0.0 0 0 0 0 1 0 1 0 0 0
9.5-10 0 0.0 0 0 0 0 0 0 0 0 0 0
Values outside the +10D and -10D were excluded from analysis as they would skew the mean..
1.3 Cataract Surgical Practice
1.3.1 Number of Cataract Surgery by SDP
The number of SDPs performing between >1000 cataract surgeries per year appeared to be increasing.

49
Table 1.3.1-1: Range of Cataract Surgery Registered by SDP per year, Census versus CSR 2007-2014
Year 2007 2008 2009 2010 2011 2012 2013 2014
No. of SDP
Census 33 36 36 36 36 36 41 43
CSR 36 36 36 36 36 36 41 43
Year <100 100-500 501-1000 >1000
Census CSR Census CSR Census CSR Census CSR
2007 1 1 15 10 8 14 9 11
2008 1 1 10 15 14 11 11 9
2009 1 1 12 12 14 12 9 8
2010 1 1 10 13 14 12 11 10
2011 1 1 9 9 16 16 10 10
2012 1 1 8 8 15 16 12 11
2013 4 4 7 9 14 13 16 15
2014 2 2 8 11 15 14 18 16
Table 1.3.1-2: Number of Cataract Surgery by Month, CSR 2007-2014
Year 2007 2008 2009 2010 2011 2012 2013 2014
No. of
patients
(N)
18426 21496 24438 28506 30611 32473 37150 40532
Month n % n % n % n % n % n % n % n %
January 1579 8.6 1862 8.7 1668 6.8 2347 8.2 2241 7.3 2460 7.6 2844 7.7 3161 7.8
February 1290 7.0 1653 7.7 1884 7.7 1985 7.0 1815 5.9 2762 8.5 2448 6.6 3258 8.0
March 1782 9.7 1812 8.4 2122 8.7 2850 10.0 2676 8.7 3055 9.4 2997 8.1 3924 9.7
April 1625 8.8 2321 10.8 2295 9.4 2714 9.5 2634 8.6 2612 8.0 3378 9.1 3855 9.5
May 1618 8.8 1871 8.7 2036 8.3 2559 9.0 2576 8.4 3004 9.3 3233 8.7 3153 7.8
June 1476 8.0 1950 9.1 2086 8.5 2591 9.1 2686 8.8 2652 8.2 3119 8.4 3501 8.6
July 1808 9.8 2049 9.5 2322 9.5 2670 9.4 2845 9.3 3121 9.6 3557 9.6 3122 7.7
August 1814 9.8 1791 8.3 1975 8.1 2401 8.4 2570 8.4 2237 6.9 2591 7.0 3403 8.4
September 1486 8.1 1462 6.8 1572 6.4 1659 5.8 2468 8.1 2454 7.6 3372 9.1 3433 8.5
October 1376 7.5 1552 7.2 2266 9.3 2447 8.6 2794 9.1 3064 9.4 3421 9.2 3163 7.8
November 1443 7.8 1646 7.7 2006 8.2 2102 7.4 2632 8.6 2625 8.1 3162 8.5 3477 8.6
December 1129 6.1 1527 7.1 2206 9.0 2181 7.6 2674 8.7 2427 7.5 3028 8.2 3082 7.6

50
0
500
1000
1500
2000
2500
3000
3500
4000
4500
Jan Feb Mar Apr May Jun Jul Aug Sep Oct Nov Dec
No
. o
f su
rge
ry
2002
2003
2004
2007
2008
2009
2010
2011
2012
2013
2014
Figure 1.3.1-1: Number of Cataract Surgeries by Month, CSR 2002-2014
1.3.2 Number of Cataract Surgery Registered to CSR by State
0
1000
2000
3000
4000
5000
6000
7000
8000
No
.
State
2003 2004 2007 2008 2009 2010 2011 2012 2013 2014
Figure 1.3.2-1: Number of Cataract Surgeries by State, CSR 2003-2014
*Wilayah Persekutuan in 2007 and 2008 for Putrajaya Hospital only
1.3.3 Surgeon Status
Specialists performed the highest number of cataract surgery followed by the medical officers (MO) and the gazetting
specialists. This trend remained unchanged throughout the years. The percentage of eyes operated by the specialists
appeared to be increasing corresponding to the decrease in the percentage operated by the MOs.

51
Table 1.3.3-1: Surgeon Status, CSR 2007-2014
Year 2007 2008 2009 2010 2011 2012 2013 2014
No. of
patients (N) 18426 21496 24438 28506 30611 32473 37150 40532
n % n % n % n % n % n % n % n %
Specialist 14327 77.8 16846 78.4 19400 79.4 24216 84.9 25590 83.6 27684 85.3 32861 88.5 36197 89.3
Gazetting
Specialist 1276 6.9 1399 6.5 2053 8.4 1405 4.9 2487 8.1 2411 7.4 2014 5.4 2034 5.02
Medical
Officer 2690 14.6 2697 12.5 2750 11.3 2871 10.1 2478 8.1 2354 7.3 2244 6.0 2249 5.55
Missing/NA 133 1.0 554 2.6 235 1.0 14 0.1 56 0.2 24 0.1 31 0.1 52 0.13
Table 1.3.3-2: Surgeon Status for Phaco, CSR 2007-2014
Year 2007 2008 2009 2010 2011 2012 2013 2014
No. of
patients
(N)
11960 14781 17717 21810 23872 26345 31625 35429
n % n % n % n % n % n % n % n %
Specialist 10294 86.1 12458 84.3 15206 85.8 19797 90.8 20963 87.8 23291 88.4 28774 91.0 32417 91.5
Gazetting
Specialist 805 6.7 882 6.0 1422 8.0 929 4.3 1845 7.7 1850 7.0 1694 5.4 1776 5.0
Medical
Officer 780 8.5 1064 7.2 923 5.2 1078 4.9 1050 4.4 1182 4.5 1132 3.6 1189 3.4
Missing/NA 81 0.7 377 2.6 166 0.9 6 0.0 14 0.1 22 0.1 25 0.1 47 0.1
Table 1.3.3-3: Surgeon Status for ECCE, CSR 2007-2014
Year 2007 2008 2009 2010 2011 2012 2013 2014
No. of
patients
(N)
5524 5627 5457 5363 5291 4784 4086 3613
n % n % n % n % n % n % n % n %
Specialist 3240 58.7 3528 62.7 3133 57.4 3237 60.4 3406 64.4 3231 67.5 2794 68.4 2434 67.4
Gazetting
Specialist 391 7.1 403 7.2 516 9.5 405 7.6 513 9.7 435 9.1 218 5.3 170 4.7
Medical
Officer 1848 33.5 1555 27.6 1754 32.1 1718 32.0 1369 25.9 1116 23.3 1072 26.2 1007 27.9
Missing/NA 45 0.8 141 2.5 54 1.0 3 0.0 3 0.1 2 0.0 2 0.1 2 0.1

52
Table 1.3.3-4: Specialist by SDP, CSR 2007-2014
Year 2007 2008 2009 2010 2011 2012 2013 2014
n % n % n % n % n % n % n % n %
All Centres 14327 77.8 16846 78.4 19400 79.4 24216 85.0 25590 83.6 27684 85.3 32861 88.5 36197 89.3
Alor Setar 334 81.3 765 77.6 846 76.2 1376 90.1 1742 89.8 1595 86.9 1429 81.3 1839 87.3
Ampang 4 100.0 200 96.2 421 97.2 491 78.3 620 87.6 809 90.3 813 82.7 722 76.3
Batu Pahat 511 91.9 500 87.3 336 55.8 290 70.6 410 74.0 262 43.1 405 93.5 467 100.0
Bintulu - - 25 83.3 101 81.5 219 84.9 330 99.4 389 99.5 375 97.9 374 100.0
Bukit Mertajam 620 91.0 434 89.1 715 96.2 782 97.3 744 92.7 879 94.7 853 93.8 967 96.9
Sandakan
100 73.0 72 45.6 123 59.1 98 36.2 128 48.3 404 98.3 235 99.2
Ipoh 1068 68.2 1392 80.8 1460 68.3 1859 84.5 1479 81.0 2459 83.9 2741 90.4 2614 94.7
Kangar 317 97.8 390 97.5 395 99.0 395 98.8 402 99.8 445 98.0 386 82.8 365 85.7
Keningau - - 34 100.0 31 100.0 16 21.1 32 61.5 5 29.4 6 40.0 22 16.5
Kota Bharu 680 83.5 583 78.9 804 88.3 858 89.4 862 91.1 485 89.0 625 91.6 279 97.9
Kuala Krai 99 79.2 168 98.8 169 96.6 211 97.2 230 95.8 226 91.5 397 100.0 354 97.0
Kuala Lumpur - - 28 70.0 871 62.0 1359 82.5 1265 78.0 1387 91.5 1090 94.8 1750 90.6
Kuala Pilah 180 84.1 225 79.8 257 88.6 310 96.3 465 96.3 424 98.8 425 86.4 461 93.5
Kuala Terengganu 371 70.4 611 84.2 665 89.5 612 85.7 629 81.7 700 91.5 890 87.8 712 79.1
Melaka 1112 72.8 1119 66.6 1098 79.2 1342 80.9 1367 83.3 1392 93.5 1550 90.2 1968 92.0
Miri 12 75.0 356 89.9 404 100.0 576 99.8 501 76.3 513 56.9 904 98.8 888 93.6
Muar 332 94.3 237 70.1 388 71.6 606 98.2 405 58.5 493 74.1 699 97.5 445 61.0
Pulau Pinang 754 68.2 1142 84.2 1024 74.5 1516 80.8 1816 83.1 1079 81.1 1320 77.8 1639 91.5
Putrajaya 196 96.6 254 99.2 251 100.0 282 100.0 329 100.0 349 98.3 386 98.7 360 98.1
Kota Kinabalu 423 79.4 265 75.5 344 79.4 552 88.5 540 78.7 551 72.2 658 67.3 737 70.9
Selayang 1221 86.2 1190 83.3 1164 82.1 1414 83.2 1523 81.9 1465 80.1 1088 81.4 730 81.2
Serdang 532 87.9 620 89.1 567 94.8 506 97.3 610 91.6 677 95.5 957 93.5 1233 97.5
Sibu 337 88.0 254 96.6 130 33.6 345 75.8 230 45.5 675 90.6 759 84.3 859 99.2
Sri Manjung 121 79.6 285 81.4 318 97.2 375 96.9 417 99.3 464 99.6 820 98.6 623 99.7
Sultan Ismail 101 94.4 180 100.0 183 98.9 203 78.7 283 100.0 279 100.0 353 94.4 609 100.0
Johor Bahru 1031 66.8 825 60.0 1079 81.9 1097 79.7 770 68.3 1079 90.3 1177 87.2 1362 98.6
Sungai Buloh 144 98.6 273 85.6 361 93.3 467 99.8 450 100.0 514 100.0 579 99.8 686 99.0
Sungei Petani 488 98.2 626 98.9 683 99.9 546 97.8 731 90.1 740 87.6 859 92.4 932 91.2
Taiping 279 100.0 378 99.7 610 99.7 683 76.8 853 89.5 899 80.4 1195 93.1 1231 99.8
Tawau 184 91.5 312 98.4 296 99.3 399 99.5 574 99.8 648 100.0 503 100.0 540 100.0
Teluk Intan 504 75.1 511 86.9 539 88.1 642 93.0 397 59.9 439 71.3 677 61.4 684 67.5
Temerloh 244 55.0 405 76.3 382 59.7 290 64.4 651 95.6 827 95.3 837 96.7 954 91.1
Kuantan 21 87.5 306 77.5 235 80.2 553 89.9 614 90.3 607 88.7 490 79.2 497 86.3
Klang 841 80.8 841 69.1 690 76.3 833 82.7 966 91.0 1317 93.3 1523 94.5 1363 93.3
Seremban 547 57.2 249 27.7 812 66.1 1147 75.5 1262 78.6 1109 71.1 1167 76.8 1078 68.0
Kuching 719 71.8 763 75.5 698 78.2 941 78.0 993 87.8 1375 83.0 1490 86.6 1514 73.2
Kemaman
47 100.0 72 100.0
Sarikei
285 99.7 554 99.8
Kulim
- - 265 100.0
KK1M Pahang
59 92.2 - -
KK1M Terengganu
- - 33 86.8
KK1M Kelantan
- - 185 99.5
KK1M Sarawak
76 100.0 798 96.0
MAIWP
1564 98.8 2197 97.0
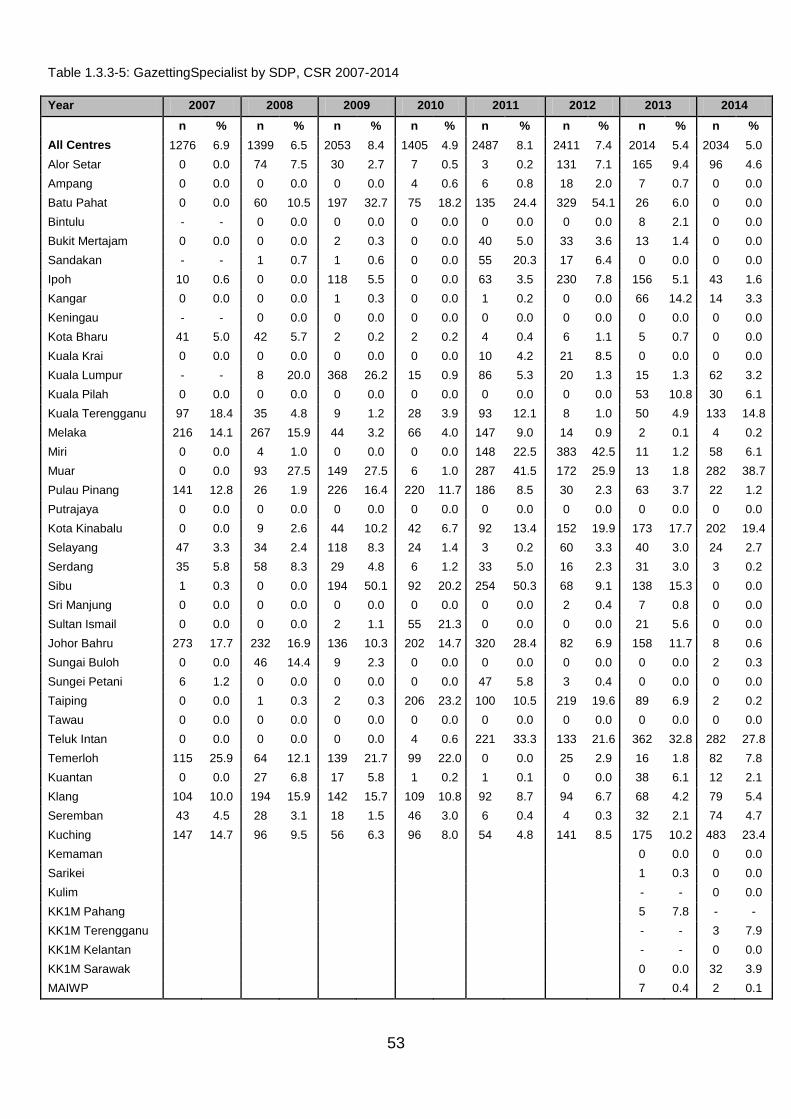
53
Table 1.3.3-5: GazettingSpecialist by SDP, CSR 2007-2014
Year 2007 2008 2009 2010 2011 2012 2013 2014
n % n % n % n % n % n % n % n %
All Centres 1276 6.9 1399 6.5 2053 8.4 1405 4.9 2487 8.1 2411 7.4 2014 5.4 2034 5.0
Alor Setar 0 0.0 74 7.5 30 2.7 7 0.5 3 0.2 131 7.1 165 9.4 96 4.6
Ampang 0 0.0 0 0.0 0 0.0 4 0.6 6 0.8 18 2.0 7 0.7 0 0.0
Batu Pahat 0 0.0 60 10.5 197 32.7 75 18.2 135 24.4 329 54.1 26 6.0 0 0.0
Bintulu - - 0 0.0 0 0.0 0 0.0 0 0.0 0 0.0 8 2.1 0 0.0
Bukit Mertajam 0 0.0 0 0.0 2 0.3 0 0.0 40 5.0 33 3.6 13 1.4 0 0.0
Sandakan - - 1 0.7 1 0.6 0 0.0 55 20.3 17 6.4 0 0.0 0 0.0
Ipoh 10 0.6 0 0.0 118 5.5 0 0.0 63 3.5 230 7.8 156 5.1 43 1.6
Kangar 0 0.0 0 0.0 1 0.3 0 0.0 1 0.2 0 0.0 66 14.2 14 3.3
Keningau - - 0 0.0 0 0.0 0 0.0 0 0.0 0 0.0 0 0.0 0 0.0
Kota Bharu 41 5.0 42 5.7 2 0.2 2 0.2 4 0.4 6 1.1 5 0.7 0 0.0
Kuala Krai 0 0.0 0 0.0 0 0.0 0 0.0 10 4.2 21 8.5 0 0.0 0 0.0
Kuala Lumpur - - 8 20.0 368 26.2 15 0.9 86 5.3 20 1.3 15 1.3 62 3.2
Kuala Pilah 0 0.0 0 0.0 0 0.0 0 0.0 0 0.0 0 0.0 53 10.8 30 6.1
Kuala Terengganu 97 18.4 35 4.8 9 1.2 28 3.9 93 12.1 8 1.0 50 4.9 133 14.8
Melaka 216 14.1 267 15.9 44 3.2 66 4.0 147 9.0 14 0.9 2 0.1 4 0.2
Miri 0 0.0 4 1.0 0 0.0 0 0.0 148 22.5 383 42.5 11 1.2 58 6.1
Muar 0 0.0 93 27.5 149 27.5 6 1.0 287 41.5 172 25.9 13 1.8 282 38.7
Pulau Pinang 141 12.8 26 1.9 226 16.4 220 11.7 186 8.5 30 2.3 63 3.7 22 1.2
Putrajaya 0 0.0 0 0.0 0 0.0 0 0.0 0 0.0 0 0.0 0 0.0 0 0.0
Kota Kinabalu 0 0.0 9 2.6 44 10.2 42 6.7 92 13.4 152 19.9 173 17.7 202 19.4
Selayang 47 3.3 34 2.4 118 8.3 24 1.4 3 0.2 60 3.3 40 3.0 24 2.7
Serdang 35 5.8 58 8.3 29 4.8 6 1.2 33 5.0 16 2.3 31 3.0 3 0.2
Sibu 1 0.3 0 0.0 194 50.1 92 20.2 254 50.3 68 9.1 138 15.3 0 0.0
Sri Manjung 0 0.0 0 0.0 0 0.0 0 0.0 0 0.0 2 0.4 7 0.8 0 0.0
Sultan Ismail 0 0.0 0 0.0 2 1.1 55 21.3 0 0.0 0 0.0 21 5.6 0 0.0
Johor Bahru 273 17.7 232 16.9 136 10.3 202 14.7 320 28.4 82 6.9 158 11.7 8 0.6
Sungai Buloh 0 0.0 46 14.4 9 2.3 0 0.0 0 0.0 0 0.0 0 0.0 2 0.3
Sungei Petani 6 1.2 0 0.0 0 0.0 0 0.0 47 5.8 3 0.4 0 0.0 0 0.0
Taiping 0 0.0 1 0.3 2 0.3 206 23.2 100 10.5 219 19.6 89 6.9 2 0.2
Tawau 0 0.0 0 0.0 0 0.0 0 0.0 0 0.0 0 0.0 0 0.0 0 0.0
Teluk Intan 0 0.0 0 0.0 0 0.0 4 0.6 221 33.3 133 21.6 362 32.8 282 27.8
Temerloh 115 25.9 64 12.1 139 21.7 99 22.0 0 0.0 25 2.9 16 1.8 82 7.8
Kuantan 0 0.0 27 6.8 17 5.8 1 0.2 1 0.1 0 0.0 38 6.1 12 2.1
Klang 104 10.0 194 15.9 142 15.7 109 10.8 92 8.7 94 6.7 68 4.2 79 5.4
Seremban 43 4.5 28 3.1 18 1.5 46 3.0 6 0.4 4 0.3 32 2.1 74 4.7
Kuching 147 14.7 96 9.5 56 6.3 96 8.0 54 4.8 141 8.5 175 10.2 483 23.4
Kemaman
0 0.0 0 0.0
Sarikei
1 0.3 0 0.0
Kulim
- - 0 0.0
KK1M Pahang
5 7.8 - -
KK1M Terengganu
- - 3 7.9
KK1M Kelantan
- - 0 0.0
KK1M Sarawak
0 0.0 32 3.9
MAIWP
7 0.4 2 0.1

54
Table 1.3.3-6: Medical Officer by SDP, CSR 2007-2014
Year 2007 2008 2009 2010 2011 2012 2013 2014
n % n % n % n % n % n % n % n %
All Centres 2690 14.6 2697 12.5 2750 11.3 2871 10.1 2478 8.1 2354 7.2 2244 6.0 2249 5.5
Alor Setar 76 18.5 146 14.8 234 21.1 144 9.4 194 10.0 109 5.9 164 9.3 169 8.0
Ampang 0 0.0 2 1.0 12 2.8 132 21.1 82 11.6 69 7.7 163 16.6 224 23.7
Batu Pahat 45 8.1 13 2.3 69 11.5 46 11.2 9 1.6 17 2.8 2 0.5 0 0.0
Bintulu - - 5 16.7 23 18.5 39 15.1 2 0.6 2 0.5 0 0.0 0 0.0
Bukit Mertajam 59 8.7 53 10.9 26 3.5 22 2.7 19 2.4 16 1.7 43 4.7 31 3.1
Sandakan
35 25.5 85 53.8 85 40.9 118 43.5 120 45.3 7 1.7 2 0.8
Ipoh 441 28.2 291 16.9 335 15.7 330 15.0 230 12.6 220 7.5 114 3.8 102 3.7
Kangar 5 1.5 6 1.5 3 0.8 5 1.3 0 0.0 9 2.0 14 3.0 47 11.0
Keningau - - 0 0.0 0 0.0 60 78.9 20 38.5 12 70.6 9 60.0 111 83.5
Kota Bharu 91 11.2 114 15.4 105 11.5 100 10.4 80 8.5 54 9.9 52 7.6 6 2.1
Kuala Krai 26 20.8 2 1.2 6 3.4 6 2.8 0 0.0 0 0.0 0 0.0 11 3.0
Kuala Lumpur - - 3 7.5 166 11.8 274 16.6 271 16.7 108 7.1 44 3.8 120 6.2
Kuala Pilah 31 14.5 57 20.2 33 11.4 12 3.7 18 3.7 5 1.2 14 2.8 2 0.4
Kuala Terengganu 59 11.2 78 10.7 69 9.3 74 10.4 48 6.2 57 7.5 74 7.3 55 6.1
Melaka 198 13.0 285 17.0 244 17.6 250 15.1 128 7.8 82 5.5 167 9.7 166 7.8
Miri 4 25.0 36 9.1 0 0.0 1 0.2 8 1.2 5 0.6 0 0.0 3 0.3
Muar 17 4.8 8 2.4 5 0.9 5 0.8 0 0.0 0 0.0 5 0.7 2 0.3
Pulau Pinang 208 18.8 188 13.9 124 9.0 140 7.5 184 8.4 221 16.6 312 18.4 130 7.3
Putrajaya 0 0.0 0 0.0 0 0.0 0 0.0 0 0.0 6 1.7 5 1.3 7 1.9
Kota Kinabalu 104 19.5 76 21.7 45 10.4 30 4.8 54 7.9 60 7.9 147 15.0 100 9.6
Selayang 139 9.8 199 13.9 136 9.6 261 15.4 333 17.9 304 16.6 209 15.6 145 16.1
Serdang 38 6.3 18 2.6 2 0.3 8 1.5 23 3.5 16 2.3 35 3.4 28 2.2
Sibu 44 11.5 9 3.4 63 16.3 18 4.0 21 4.2 2 0.3 3 0.3 7 0.8
Sri Manjung 24 15.8 64 18.3 9 2.8 12 3.1 3 0.7 0 0.0 0 0.0 0 0.0
Sultan Ismail 5 4.7 0 0.0 0 0.0 0 0.0 0 0.0 0 0.0 0 0.0 0 0.0
Johor Bahru 234 15.2 313 22.7 102 7.7 77 5.6 37 3.3 34 2.8 15 1.1 11 0.8
Sungai Buloh 0 0.0 0 0.0 17 4.4 1 0.2 0 0.0 0 0.0 1 0.2 5 0.7
Sungei Petani 2 0.4 0 0.0 1 0.1 12 2.2 33 4.1 102 12.1 71 7.6 90 8.8
Taiping 0 0.0 0 0.0 0 0.0 0 0.0 0 0.0 0 0.0 0 0.0 0 0.0
Tawau 16 8.0 5 1.6 2 0.7 2 0.5 1 0.2 0 0.0 0 0.0 0 0.0
Teluk Intan 166 24.7 77 13.1 73 11.9 44 6.4 45 6.8 44 7.1 62 5.6 46 4.5
Temerloh 81 18.2 60 11.3 119 18.6 61 13.6 30 4.4 16 1.8 13 1.5 11 1.1
Kuantan 3 12.5 62 15.7 41 14.0 61 9.9 65 9.6 77 11.3 90 14.5 67 11.6
Klang 89 8.5 179 14.7 70 7.7 63 6.3 1 0.1 0 0.0 20 1.2 19 1.3
Seremban 351 36.7 163 18.2 392 31.9 326 21.5 337 21.0 446 28.6 321 21.1 433 27.3
Kuching 134 13.4 150 14.8 139 15.6 170 14.1 84 7.4 141 8.5 56 3.3 71 3.4
Kemaman
0 0.0 0 0.0
Sarikei
0 0.0 1 0.2
Kulim
- - 0 0.0
KK1M Pahang
0 0.0 - -
KK1M Terengganu
- - 2 5.3
KK1M Kelantan
- - 1 0.5
KK1M Sarawak
0 0.0 1 0.1
MAIWP
12 0.8 23 1.0

55
1.3.4 Duration of Surgery
Table 1.3.4-1: Duration of Surgery by Types of Cataract Surgery, CSR 2007-2014
Year 2007 2008 2009* 2010* 2011* 2012* 2013* 2014*
Mean SD Mean SD Mean SD Mean SD Median IQR Median IQR Median IQR Median IQR
All eyes 40.2 20.6 38.2 19.6 38.2 20.4 35.5 19.3 30 20-40 30 20-40 27 20-38 26 20-36
Phaco 36.8 19.7 34.1 17.7 33.6 17.7 31.3 16.4 26 20-35 25 19-33 25 20-33 25 20-32
ECCE 45.3 19.7 45.8 19.5 49.1 20.9 47.4 20.2 43 31-60 40 30-55 45 33-60 45 35-61
Phaco → ECCE 57.8 20.6 44.8 24 59.7 24.2 56.1 21.7 55 40-70 55 40-70 55 41-67 55 43-70
ICCE 57.6 23.7 57.5 23.7 58.1 24.4 57.6 28.3 55 45-71 55 40-71 52 35-69 53 42-70
Lens Aspiration 47.8 27.2 60.0 25.6 46.1 25.9 45.4 28.9 40 30-60 35 25-56 31 23-50 35 25-51
Data entered with extreme values i.e. more than 3 hours and less than 15 minutes were not analyzed as it would skew the data
Table 1.3.4-2: Duration of Surgery by Surgeon Status, CSR 2007-2014
Year 2007 2008 2009 2010 2011 2012 2013 2014
Mean SD Mean SD Mean SD Mean SD Median IQR Median IQR Median IQR Median IQR
Phaco Specialist 36 19.8 35.4 17.9 32.6 17.3 30.7 16.3 25 20-35 25 20-34 25 20-31 25 20-30
Gazetting
Specialist 40.2 18 47.5 20.8 39.8 19.9 36.2 15.8 30 24-40 28 21-37 30 23-40 30 25-40
Medical
Officers 42.2 18.2 49.2 22.8 41.5 17.7 38.2 16.6 30 25-44 34 25-45 32 25-44 30 25-40
ECCE Specialist 40.2 17.6 43.9 69.5 42.6 18 42 17.3 36 30-50 35 30-48 40 30-53 40 30-55
Gazetting
Specialist 45.9 17.8 54 71.5 48.4 19.1 48.6 16.1 46 39-60 45 35-55 50 40-60 54 45-70
Medical
Officers 53.9 20.2 63 89.8 60.5 21.4 57.4 22 55 45-70 57 45-66 60 50-72 60 50-75
1.3.5 Distribution of Cataract Surgery Performed as Day Care
The day care cataract surgery percentages were calculated by excluding eyes of children and combined surgeries
because surgeries done in these eyes might require general anaesthesia therefore hospital admission.
The total number of eyes (excluding children and combined surgeries) and the total number of eyes operated as day
care were increasing corresponding to the increasing numbers of cataract surgery registered to CSR. Although the
percentage appeared to be increasing over the years, it varied between SDPs.
Table 1.3.5-1: Distribution of Cataract Surgery Performed as Day Care, CSR 2007-2014
Year 2007 2008 2009 2010 2011 2012 2013 2014
Number of SDPs 32 36 36 36 36 36 41 43
Total number of
cataract surgery
registered to CSR
18426 21496 24438 28506 30611 32473 37150 40532
Number of surgery
excluding children
and combined
surgery
17402 19835 22517 26514 28398 30144 32833 37999
n % n % n % n % n % n % n % n %
Number and % of
day care surgery
excluding children
and combined
surgery
7297 41.9 8449 42.6 10633 47.2 13657 51.5 14842 52.3 17827 59.1 20495 62.4 25342 66.7
*SDP in 2002, 2003 and 2004 included private centres and university hospitals

56
Table 1.3.5-2: Distribution of Cataract Surgery Performed as Day Care (Excluding Children and Combined Surgery),
CSR 2007-2014
Year 2007 2008 2009 2010 2011 2012 2013 2014
n % n % n % n % n % n % n % n %
All Centres 7297 41.9 8449 42.6 10633 47.2 13657 51.5 14842 52.3 17827 59.1 20495 62.4 25342 66.7
Alor Setar 91 27.6 74 8.0 3 0.3 186 13.8 206 11.9 265 16.1 330 21.4 613 33.4
Ampang 3 100.0 181 99.5 412 97.4 574 93.6 685 98.8 832 96.4 886 92.3 824 91.0
Batu Pahat 317 62.2 311 56.9 303 52.0 246 61.3 353 65.2 367 61.2 248 58.6 248 54.0
Bintulu 0 0.0 2 7.7 1 0.9 9 3.8 18 6.1 206 60.4 225 71.0 204 65.2
Bukit Mertajam 82 12.4 25 5.5 650 88.8 714 90.8 719 93.5 846 94.3 840 96.2 906 95.3
Sandakan 0 0.0 0 0.0 0 0.0 0 0.0 0 0.0 92 35.7 343 88.2 177 95.2
Ipoh 672 48.2 896 58.1 1267 66.0 1487 75.4 1104 71.5 1894 78.5 2284 92.2 2058 86.6
Kangar 1 0.3 2 0.5 3 0.8 3 0.8 5 1.3 7 1.6 3 0.7 3 0.7
Keningau 0 0.0 1 3.5 3 10.7 0 0.0 0 0.0 0 0.0 0 0.0 0 0.0
Kota Bharu 8 1.1 17 2.5 124 14.8 294 33.5 220 24.9 102 20.5 70 11.4 18 6.6
Kuala Krai 0 0.0 0 0.0 0 0.0 2 1.0 75 33.3 133 61.6 295 79.1 306 89.0
Kuala Lumpur 0 0.0 35 92.1 725 53.3 684 42.4 486 30.3 351 24.8 46 4.5 426 25.3
Kuala Pilah 61 29.0 49 19.0 10 5.1 14 4.6 17 4.0 87 22.1 252 54.4 153 33.2
Kuala Terengganu 142 29.5 194 28.0 168 24.3 222 34.2 334 47.0 356 50.6 488 51.0 449 55.1
Melaka 1420 98.2 1483 95.9 1121 89.3 1425 90.2 1530 95.7 1384 95.5 1504 91.9 1983 96.7
Miri 15 100.0 385 99.7 397 99.7 568 99.3 640 100.0 868 99.9 910 100.0 939 100.0
Muar 2 0.6 0 0.0 1 0.2 0 0.0 1 0.1 22 3.3 4 0.6 8 1.1
Pulau Pinang 960 93.5 1193 91.9 1232 92.0 1682 94.8 1946 97.1 1262 96.8 1606 97.7 1599 97.7
Putrajaya 182 95.3 201 81.7 191 76.7 254 90.7 299 92.3 335 96.3 367 94.1 331 90.9
Kota Kinabalu 326 67.2 212 64.8 384 97.0 500 98.4 640 97.3 703 97.4 918 96.0 901 90.6
Selayang 1011 90.7 995 78.8 1026 86.8 1219 87.0 1305 91.1 1388 90.4 1088 93.5 760 94.1
Serdang 313 55.0 382 57.4 388 67.2 310 60.5 291 46.5 434 62.7 415 42.7 652 53.7
Sibu 0 0.0 1 0.4 1 0.3 2 0.4 3 0.6 394 59.7 630 76.1 790 93.9
Sri Manjung 10 7.0 45 13.1 83 25.9 194 51.2 224 53.8 304 66.7 556 70.7 385 66.5
Sultan Ismail 1 1.0 8 4.6 1 0.5 1 0.4 2 0.7 1 0.4 0 0.0 21 3.5
Johor Bahru 48 3.2 44 3.3 42 3.5 45 3.7 14 1.4 26 2.5 75 6.0 529 40.3
Sungai Buloh 99 78.0 230 74.4 312 81.0 392 85.4 377 85.9 422 82.9 376 65.7 442 74.9
Sungei Petani 5 1.0 2 0.4 3 0.5 59 11.0 377 47.3 291 35.7 366 41.2 297 30.6
Taiping 54 20.5 46 12.7 95 16.4 117 13.9 130 14.3 516 48.5 621 50.1 689 57.4
Tawau 1 0.6 0 0.0 0 0.0 0 0.0 0 0.0 0 0.0 2 0.4 1 0.2
Teluk Intan 2 0.3 66 11.5 1 0.2 1 0.1 5 0.8 3 0.5 6 0.9 4 0.4
Temerloh 1 0.2 5 1.0 2 0.3 1 0.2 151 22.3 438 52.4 456 53.3 567 54.8
Kuantan 7 30.4 50 14.8 20 7.9 28 5.1 38 5.9 168 26.5 280 48.6 352 63.4
Klang 11 1.1 22 1.9 65 7.5 87 9.6 159 17.9 373 28.2 631 41.1 547 40.0
Seremban 589 70.3 399 69.3 789 85.3 1241 89.4 1433 93.7 1410 96.4 1405 96.8 1442 96.1
Kuching 863 91.0 893 93.6 809 95.2 1096 95.0 1055 97.1 1547 97.7 1575 97.9 1838 95.5
Kemaman
44 100.0 69 97.2
Sarikei
274 96.1 536 96.9
Kulim
- - 11 4.4
KK1M Pahang
2 3.2 - -
KK1M Terengganu
- - 5 15.2
KK1M Kelantan
- - 184 99.5
KK1M Sarawak
74 98.7 811 99.8
MAIWP
0 0.0 2264 100.0

57
Figure 1.3.5-2: Distribution of Cataract Surgery Performed as Day Care by SDP (Excluding Surgery Done in
Children and Combined Surgery), CSR 2002-2014
Figure 1.3.5-1: Distribution of Cataract Surgery Performed by SDP (Day Care VS In Patient,
Excluding Surgery Done in Children and Combined Surgery), CSR 2014
0.0
50.0
100.0K
en
ing
au
Ta
wa
u
Te
luk
Inta
n
Ka
ng
ar
Mu
ar
Su
lta
n I
sma
il
Ku
lim
Ko
ta B
ha
ru
Ku
ala
Lu
mp
ur
Su
ng
ei P
eta
ni
Alo
r S
eta
r
Ku
ala
Pil
ah
Joh
or
Ba
hru
Kla
ng
KK
1M
Te
ren
gg
an
u
Ku
ala
Te
ren
gg
an
u
Ba
tu P
ah
at
Te
me
rlo
h
Se
rda
ng
Ta
ipin
g
Ku
an
tan
Bin
tulu
Sri
Ma
nju
ng
Su
ng
ai
Bu
loh
Ipo
h
Ku
ala
Kra
i
Ko
ta K
ina
ba
lu
Se
lay
an
g
Am
pa
ng
Pu
tra
jay
a
Ku
ch
ing
Sib
u
Se
rem
ba
n
Pu
lau
Pin
an
g
Bu
kit
Me
rta
jam
Sa
nd
ak
an
Ke
ma
ma
n
Me
lak
a
Sa
rik
ei
KK
1M
Sa
raw
ak
KK
1M
Ke
lan
tan
Mir
i
MA
IWP
Average day care (all patients) = 65.6% Daycare Inpatient
Average=65.6
0.0
50.0
100.0
Ke
nin
ga
u
Ta
wa
u
Te
luk
Inta
n
Ka
ng
ar
Mu
ar
Su
lta
n I
sma
il
Ku
lim
Ko
ta B
ha
ru
Ku
ala
Lu
mp
ur
Su
ng
ei P
eta
ni
Ku
ala
Pil
ah
Alo
r S
eta
r
Kla
ng
Joh
or
Ba
hru
KK
1M
Te
ren
gg
an
u
Ba
tu P
ah
at
Te
me
rlo
h
Ku
ala
Te
ren
gg
an
u
Se
rda
ng
Ta
ipin
g
Ku
an
tan
Bin
tulu
Sri
Ma
nju
ng
Su
ng
ai
Bu
loh
Ipo
h
Ku
ala
Kra
i
Ko
ta K
ina
ba
lu
Pu
tra
jay
a
Am
pa
ng
Sib
u
Se
lay
an
g
Sa
nd
ak
an
Bu
kit
Me
rta
jam
Ku
ch
ing
Ke
ma
ma
n
Se
rem
ba
n
Me
lak
a
Sa
rik
ei
Pu
lau
Pin
an
g
KK
1M
Sa
raw
ak
KK
1M
Ke
lan
tan
Mir
i
MA
IWP
Average day care = 66.7% Daycare Inpatient
Average=66.7

58
1.3.6 Distribution of Types of Cataract Surgery
There is a shift from ECCE to phaco as the preferred method of performing cataract surgery. The percentage of phaco
converted to ECCE, the proxy indicator for competency in performing phaco surgery, remained the same over the
years.
Table 1.3.5-3: Distribution of Types Cataract Surgery, CSR 2007-2014
Year 2007 2008* 2009 2010 2011 2012 2013 2014
No of patients
(N) 18426 21496 24438 28506 30611 32473 37150 40532
n % n % n % n % n % n % n % n %
Phaco 11960 65.1 14781 69.1 17717 72.5 21810 76.5 23872 78 26345 81.1 31625 85.1 35429 87.4
ECCE 5524 30.1 5627 26.3 5457 22.3 5363 18.8 5291 17.3 4784 14.7 4086 11.0 3613 8.9
Lens Aspiration 323 1.8 340 1.6 400 1.6 451 1.6 460 1.5 444 1.4 364 1.0 370 0.9
Phaco converted
to ECCE 432 2.4 524 2.4 573 2.3 586 2.1 652 2.1 621 1.9 769 2.1 805 2.0
ICCE 141 0.8 129 0.6 134 0.5 143 0.5 123 0.4 136 0.4 173 0.5 176 0.4
Figure 1.3.5-3: Distribution of Cataract Surgery by SDP (Day Care VS In Patient), CSR 2014
0
5000
10000
15000
20000
25000
30000
35000
40000
45000
2002 2003 2004 2007 2008 2009 2010 2011 2012 2013 2014
No
. o
f su
rge
ry
Year
Cataract surgeryregistered to CSR
Cataract surgeryexcluding children
and combinedsurgery
Day care surgeryexcluding children
and combinedsurgery

59
Figure 1.3.5-4: Distribution of Phaco, ECCE and Phaco Converted to ECCE, CSR 2002-2014
Table 1.3.5-4: Distribution of Types Cataract Surgery by SDP, CSR 2007-2014
Type of Cataract Surgery
All Surgeries Phaco ECCE Lens
Aspiration
Phaco
Converted to
ECCE
ICCE
N % n % n % n % n % n %
All Centres 40532 100.0 35429 87.4 3613 8.9 370 0.9 805 2.0 176 0.4
Alor Setar 2,106 100.0 1,687 80.1 343 16.3 29 1.4 24 1.1 4 0.2
Ampang 946 100.0 809 85.5 105 11.1 7 0.7 20 2.1 1 0.1
Batu Pahat 467 100.0 341 73.0 80 17.1 5 1.1 38 8.1 3 0.6
Bintulu 374 100.0 353 94.4 6 1.6 1 0.3 12 3.2 0 0.0
Bukit Mertajam 998 100.0 749 75.1 237 23.7 3 0.3 7 0.7 1 0.1
Sandakan 237 100.0 206 86.9 29 12.2 2 0.8 0 0.0 0 0.0
Ipoh 2,759 100.0 2,566 93.0 126 4.6 8 0.3 40 1.4 6 0.2
Kangar 426 100.0 356 83.6 50 11.7 8 1.9 6 1.4 6 1.4
Keningau 133 100.0 96 72.2 33 24.8 1 0.8 3 2.3 0 0.0
Kota Bharu 285 100.0 162 56.8 106 37.2 7 2.5 8 2.8 2 0.7
Kuala Krai 365 100.0 292 80.0 51 14.0 4 1.1 13 3.6 5 1.4
Kuala Lumpur 1,932 100.0 1,576 81.6 289 15.0 18 0.9 32 1.7 1 0.1
Kuala Pilah 493 100.0 430 87.2 32 6.5 6 1.2 21 4.3 4 0.8
Kuala Terengganu 900 100.0 707 78.6 150 16.7 18 2.0 17 1.9 6 0.7
Melaka 2,139 100.0 1,919 89.7 147 6.9 21 1.0 35 1.6 13 0.6
Miri 949 100.0 893 94.1 38 4.0 3 0.3 7 0.7 7 0.7
Muar 729 100.0 628 86.1 56 7.7 7 1.0 26 3.6 11 1.5
Pulau Pinang 1,791 100.0 1,712 95.6 29 1.6 13 0.7 24 1.3 7 0.4
Putrajaya 367 100.0 289 78.7 46 12.5 8 2.2 21 5.7 3 0.8
Kota Kinabalu 1040 100.0 847 81.4 131 12.6 16 1.5 22 2.1 10 1.0
Selayang 899 100.0 809 90.0 34 3.8 19 2.1 20 2.2 4 0.4
Serdang 1265 100.0 1072 84.7 122 9.6 24 1.9 42 3.3 3 0.2
Sibu 866 100.0 826 95.4 12 1.4 3 0.3 8 0.9 12 1.4
Sri Manjung 625 100.0 608 97.3 11 1.8 2 0.3 1 0.2 0 0.0
Sultan Ismail 609 100.0 496 81.4 70 11.5 13 2.1 29 4.8 1 0.2
39.745.6
50.5
65.169.1
72.576.5 78.0
81.185.1 87.4
54.0
47.6
42.6 30.126.3
22.318.8 17.3
14.711.0 8.9
2.4 2.8 2.5 2.4 2.4 2.3 2.1 2.1 1.9 2.1 2.0
0
10
20
30
40
50
60
70
80
90
100
2002 2003 2004 2007 2008 2009 2010 2011 2012 2013 2014
%
Year
Phacoemulsification
ECCE
Phaco converted to ECCE
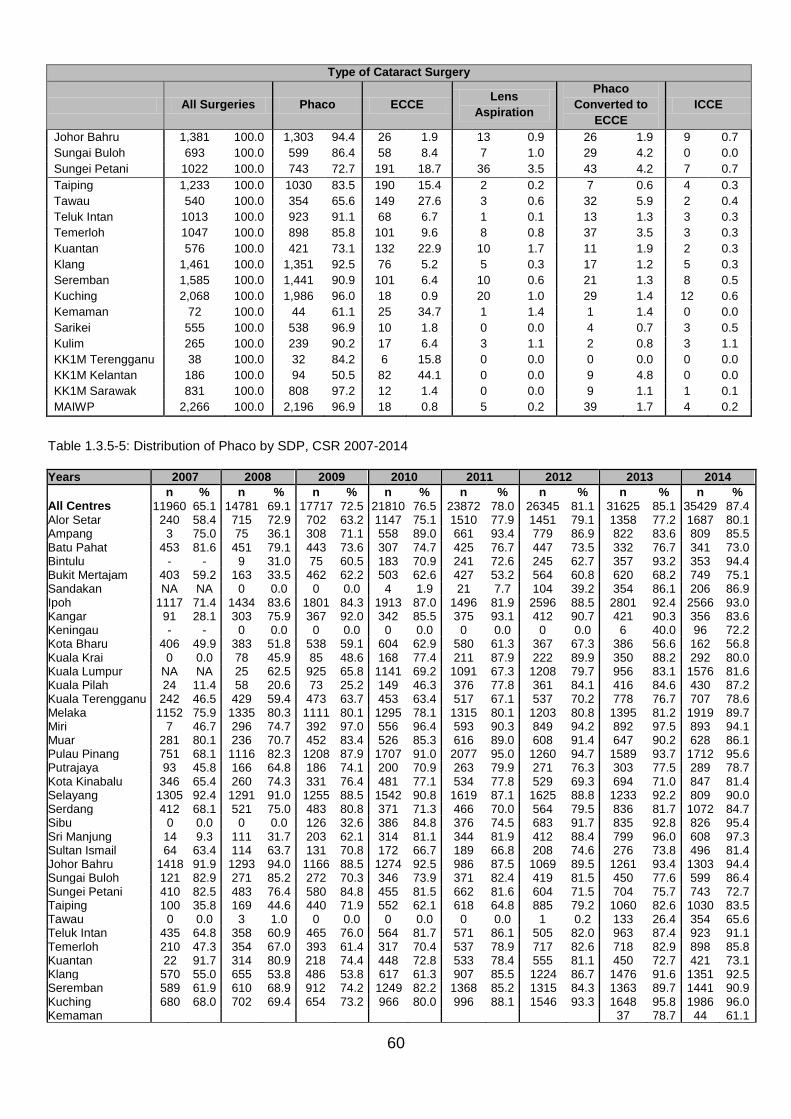
60
Type of Cataract Surgery
All Surgeries Phaco ECCE Lens
Aspiration
Phaco
Converted to
ECCE
ICCE
Johor Bahru 1,381 100.0 1,303 94.4 26 1.9 13 0.9 26 1.9 9 0.7
Sungai Buloh 693 100.0 599 86.4 58 8.4 7 1.0 29 4.2 0 0.0
Sungei Petani 1022 100.0 743 72.7 191 18.7 36 3.5 43 4.2 7 0.7
Taiping 1,233 100.0 1030 83.5 190 15.4 2 0.2 7 0.6 4 0.3
Tawau 540 100.0 354 65.6 149 27.6 3 0.6 32 5.9 2 0.4
Teluk Intan 1013 100.0 923 91.1 68 6.7 1 0.1 13 1.3 3 0.3
Temerloh 1047 100.0 898 85.8 101 9.6 8 0.8 37 3.5 3 0.3
Kuantan 576 100.0 421 73.1 132 22.9 10 1.7 11 1.9 2 0.3
Klang 1,461 100.0 1,351 92.5 76 5.2 5 0.3 17 1.2 5 0.3
Seremban 1,585 100.0 1,441 90.9 101 6.4 10 0.6 21 1.3 8 0.5
Kuching 2,068 100.0 1,986 96.0 18 0.9 20 1.0 29 1.4 12 0.6
Kemaman 72 100.0 44 61.1 25 34.7 1 1.4 1 1.4 0 0.0
Sarikei 555 100.0 538 96.9 10 1.8 0 0.0 4 0.7 3 0.5
Kulim 265 100.0 239 90.2 17 6.4 3 1.1 2 0.8 3 1.1
KK1M Terengganu 38 100.0 32 84.2 6 15.8 0 0.0 0 0.0 0 0.0
KK1M Kelantan 186 100.0 94 50.5 82 44.1 0 0.0 9 4.8 0 0.0
KK1M Sarawak 831 100.0 808 97.2 12 1.4 0 0.0 9 1.1 1 0.1
MAIWP 2,266 100.0 2,196 96.9 18 0.8 5 0.2 39 1.7 4 0.2
Table 1.3.5-5: Distribution of Phaco by SDP, CSR 2007-2014
Years 2007 2008 2009 2010 2011 2012 2013 2014
n % n % n % n % n % n % n % n % All Centres 11960 65.1 14781 69.1 17717 72.5 21810 76.5 23872 78.0 26345 81.1 31625 85.1 35429 87.4 Alor Setar 240 58.4 715 72.9 702 63.2 1147 75.1 1510 77.9 1451 79.1 1358 77.2 1687 80.1 Ampang 3 75.0 75 36.1 308 71.1 558 89.0 661 93.4 779 86.9 822 83.6 809 85.5 Batu Pahat 453 81.6 451 79.1 443 73.6 307 74.7 425 76.7 447 73.5 332 76.7 341 73.0 Bintulu - - 9 31.0 75 60.5 183 70.9 241 72.6 245 62.7 357 93.2 353 94.4 Bukit Mertajam 403 59.2 163 33.5 462 62.2 503 62.6 427 53.2 564 60.8 620 68.2 749 75.1 Sandakan NA NA 0 0.0 0 0.0 4 1.9 21 7.7 104 39.2 354 86.1 206 86.9 Ipoh 1117 71.4 1434 83.6 1801 84.3 1913 87.0 1496 81.9 2596 88.5 2801 92.4 2566 93.0 Kangar 91 28.1 303 75.9 367 92.0 342 85.5 375 93.1 412 90.7 421 90.3 356 83.6 Keningau - - 0 0.0 0 0.0 0 0.0 0 0.0 0 0.0 6 40.0 96 72.2 Kota Bharu 406 49.9 383 51.8 538 59.1 604 62.9 580 61.3 367 67.3 386 56.6 162 56.8 Kuala Krai 0 0.0 78 45.9 85 48.6 168 77.4 211 87.9 222 89.9 350 88.2 292 80.0 Kuala Lumpur NA NA 25 62.5 925 65.8 1141 69.2 1091 67.3 1208 79.7 956 83.1 1576 81.6 Kuala Pilah 24 11.4 58 20.6 73 25.2 149 46.3 376 77.8 361 84.1 416 84.6 430 87.2 Kuala Terengganu 242 46.5 429 59.4 473 63.7 453 63.4 517 67.1 537 70.2 778 76.7 707 78.6 Melaka 1152 75.9 1335 80.3 1111 80.1 1295 78.1 1315 80.1 1203 80.8 1395 81.2 1919 89.7 Miri 7 46.7 296 74.7 392 97.0 556 96.4 593 90.3 849 94.2 892 97.5 893 94.1 Muar 281 80.1 236 70.7 452 83.4 526 85.3 616 89.0 608 91.4 647 90.2 628 86.1 Pulau Pinang 751 68.1 1116 82.3 1208 87.9 1707 91.0 2077 95.0 1260 94.7 1589 93.7 1712 95.6 Putrajaya 93 45.8 166 64.8 186 74.1 200 70.9 263 79.9 271 76.3 303 77.5 289 78.7 Kota Kinabalu 346 65.4 260 74.3 331 76.4 481 77.1 534 77.8 529 69.3 694 71.0 847 81.4 Selayang 1305 92.4 1291 91.0 1255 88.5 1542 90.8 1619 87.1 1625 88.8 1233 92.2 809 90.0 Serdang 412 68.1 521 75.0 483 80.8 371 71.3 466 70.0 564 79.5 836 81.7 1072 84.7 Sibu 0 0.0 0 0.0 126 32.6 386 84.8 376 74.5 683 91.7 835 92.8 826 95.4 Sri Manjung 14 9.3 111 31.7 203 62.1 314 81.1 344 81.9 412 88.4 799 96.0 608 97.3 Sultan Ismail 64 63.4 114 63.7 131 70.8 172 66.7 189 66.8 208 74.6 276 73.8 496 81.4 Johor Bahru 1418 91.9 1293 94.0 1166 88.5 1274 92.5 986 87.5 1069 89.5 1261 93.4 1303 94.4 Sungai Buloh 121 82.9 271 85.2 272 70.3 346 73.9 371 82.4 419 81.5 450 77.6 599 86.4 Sungei Petani 410 82.5 483 76.4 580 84.8 455 81.5 662 81.6 604 71.5 704 75.7 743 72.7 Taiping 100 35.8 169 44.6 440 71.9 552 62.1 618 64.8 885 79.2 1060 82.6 1030 83.5 Tawau 0 0.0 3 1.0 0 0.0 0 0.0 0 0.0 1 0.2 133 26.4 354 65.6 Teluk Intan 435 64.8 358 60.9 465 76.0 564 81.7 571 86.1 505 82.0 963 87.4 923 91.1 Temerloh 210 47.3 354 67.0 393 61.4 317 70.4 537 78.9 717 82.6 718 82.9 898 85.8 Kuantan 22 91.7 314 80.9 218 74.4 448 72.8 533 78.4 555 81.1 450 72.7 421 73.1 Klang 570 55.0 655 53.8 486 53.8 617 61.3 907 85.5 1224 86.7 1476 91.6 1351 92.5 Seremban 589 61.9 610 68.9 912 74.2 1249 82.2 1368 85.2 1315 84.3 1363 89.7 1441 90.9 Kuching 680 68.0 702 69.4 654 73.2 966 80.0 996 88.1 1546 93.3 1648 95.8 1986 96.0 Kemaman
37 78.7 44 61.1

61
Years 2007 2008 2009 2010 2011 2012 2013 2014
Sarikei
281 98.3 538 96.9
Kulim
- - 239 90.2
KK1M Pahang
47 73.4 - -
KK1M Terengganu
- - 32 84.2
KK1M Kelantan
- - 94 50.5
KK1M Sarawak
74 97.4 808 97.2
MAIWP
1504 95.0 2196 96.9
Table 1.3.5-6: Distribution of ECCE by SDP, CSR 2007-2014
Years 2007 2008 2009 2010 2011 2012 2013 2014
n % n % n % n % n % n % n % n %
All Centres 5524 30.1 5627 26.3 5457 22.3 5363 18.8 5291 17.3 4784 14.7 4086 11.0 3613 8.9
Alor Setar 160 38.9 247 25.2 349 31.4 310 20.3 349 18.0 294 16.0 338 19.2 343 16.3
Ampang 1 25.0 106 51.0 102 23.6 38 6.1 28 4.0 72 8.0 118 12.0 105 11.1
Batu Pahat 83 15.0 95 16.7 130 21.6 78 19.0 104 18.8 111 18.3 81 18.7 80 17.1
Bintulu - - 19 65.5 38 30.6 70 27.1 83 25.0 136 34.8 14 3.7 6 1.6
Bukit Mertajam 265 38.9 315 64.7 265 35.7 284 35.3 350 43.6 338 36.4 277 30.5 237 23.7
Sandakan NA NA 130 99.2 154 97.5 191 91.8 231 85.2 148 55.8 45 10.9 29 12.2
Ipoh 396 25.3 240 14.0 238 11.1 208 9.5 193 10.6 250 8.5 146 4.8 126 4.6
Kangar 223 68.8 86 21.6 18 4.5 46 11.5 19 4.7 27 5.9 34 7.3 50 11.7
Keningau - - 33 97.1 28 90.3 72 94.7 51 98.1 17 100.0 9 60.0 33 24.8
Kota Bharu 337 41.4 302 40.9 302 33.2 280 29.2 287 30.3 141 25.9 246 36.1 106 37.2
Kuala Krai 119 95.2 81 47.6 82 46.9 33 15.2 15 6.3 16 6.5 24 6.0 51 14.0
Kuala Lumpur NA NA 12 30.0 403 28.7 447 27.1 454 28.0 263 17.3 163 14.2 289 15.0
Kuala Pilah 164 77.7 190 67.6 175 60.3 137 42.5 81 16.8 52 12.1 44 8.9 32 6.5
Kuala Terengganu 243 46.7 238 33.0 226 30.4 207 29.0 201 26.1 177 23.1 185 18.2 150 16.7
Melaka 307 20.2 271 16.3 205 14.8 283 17.1 274 16.7 248 16.7 279 16.2 147 6.9
Miri 7 46.7 95 24.0 10 2.5 15 2.6 48 7.3 28 3.1 11 1.2 38 4.0
Muar 49 14.0 81 24.3 52 9.6 44 7.1 38 5.5 19 2.9 41 5.7 56 7.7
Pulau Pinang 270 24.5 177 13.1 124 9.0 127 6.8 68 3.1 34 2.6 47 2.8 29 1.6
Putrajaya 104 51.2 79 30.9 57 22.7 65 23.0 42 12.8 48 13.5 48 12.3 46 12.5
Kota Kinabalu 155 29.3 74 21.1 62 14.3 117 18.8 96 14.0 163 21.4 223 22.8 131 12.6
Selayang 44 3.1 70 4.9 106 7.5 80 4.7 116 6.2 75 4.1 43 3.2 34 3.8
Serdang 151 25.0 133 19.1 79 13.2 113 21.7 156 23.4 109 15.4 128 12.5 122 9.6
Sibu 372 97.1 257 97.7 258 66.7 48 10.5 96 19.0 43 5.8 34 3.8 12 1.4
Sri Manjung 134 88.7 233 66.6 122 37.3 71 18.3 65 15.5 40 8.6 14 1.7 11 1.8
Sultan Ismail 32 31.7 61 34.1 49 26.5 72 27.9 83 29.3 55 19.7 63 16.8 70 11.5
Johor Bahru 53 3.4 30 2.2 55 4.2 27 2.0 72 6.4 69 5.8 44 3.3 26 1.9
Sungai Buloh 8 5.5 25 7.9 88 22.7 89 19.0 54 12.0 63 12.3 89 15.3 58 8.4

62
Years 2007 2008 2009 2010 2011 2012 2013 2014
Sungei Petani 57 11.5 99 15.7 58 8.5 70 12.5 101 12.5 204 24.1 167 18.0 191 18.7
Taiping 159 57.0 194 51.2 154 25.2 303 34.1 315 33.1 208 18.6 206 16.0 190 15.4
Tawau 196 97.5 305 97.1 292 98.0 380 94.8 557 96.9 634 97.8 308 61.2 149 27.6
Teluk Intan 222 33.1 193 32.8 111 18.1 92 13.3 72 10.9 86 14.0 109 9.9 68 6.7
Temerloh 210 47.3 138 26.1 204 31.9 104 23.1 79 11.6 87 10.0 81 9.4 101 9.6
Kuantan 1 4.2 37 9.5 46 15.7 114 18.5 98 14.4 89 13.0 140 22.6 132 22.9
Klang 403 38.9 499 41.0 368 40.7 341 33.9 120 11.3 146 10.3 64 4.0 76 5.2
Seremban 319 33.5 219 24.7 261 21.2 226 14.9 194 12.1 207 13.3 128 8.4 101 6.4
Kuching 276 27.6 263 26.0 186 20.8 181 15.0 101 8.9 87 5.3 33 1.9 18 0.9
Kemaman
9 19.1 25 34.7
Sarikei
2 0.7 10 1.8
Kulim
- - 17 6.4
KK1M Pahang
11 17.2 - -
KK1M Terengganu
- - 6 15.8
KK1M Kelantan
- - 82 44.1
KK1M Sarawak
1 1.3 12 1.4
MAIWP
39 2.5 18 0.8
1.3.6 Distribution of Combined Surgery
Table 1.3.6-1: Distribution of Combined Surgery, CSR 2007-2014
Year 2007 2008 2009 2010 2011 2012 2013 2014
No of patients (N) 18426 21496 24438 28506 30611 32473 37150 40532
n % n % n % n % n % n % n % n %
Any types of combined
surgeries 891 4.8 664 3.1 871 3.6 1082 3.8 1194 3.9 1221 3.8 1026 2.8 1028 2.6
Specific types of combined surgery
Pterygium Surgery 135 0.7 94 0.4 100 0.4 99 0.3 133 0.4 111 0.3 83 0.2 115 0.3
Filtering Glaucoma
Surgery 131 0.7 142 0.7 132 0.5 121 0.4 64 0.2 71 0.2 114 0.3 95 0.2
Vitreoretinal Surgery 435 2.4 237 1.1 402 1.6 601 2.1 672 2.2 585 1.8 536 1.4 532 1.3
Penetrating
Keratoplasty 0 0.0 3 0.0 6 0.0 2 0.0 1 0.0 3 0.0 2 0.0 2 0.0
Others 190 1.0 188 0.9 259 1.1 272 1.0 344 1.1 477 1.5 311 0.8 304 0.8

63
Table 1.3.6-2: Distribution of Combined Surgery by SDP, CSR 2007-2014
Combined Surgery
All
Surgeries
Any
Combined
Surgery
Pterygium
Surgery
Filtering
Surgery
Vitreo-
Retinal
Surgery
Penetrating
Keratoplasty Others
N n % n % n % n % n % n %
All Centres 40532 1028 2.5 115 0.3 95 0.2 532 1.3 2 0.0 304 0.8
Alor Setar 2106 178 8.5 6 0.3 19 0.9 113 5.4 0 0.0 50 2.4
Ampang 946 22 2.3 2 0.2 18 1.9 0 0.0 0 0.0 2 0.2
Batu Pahat 467 6 1.3 0 0.0 0 0.0 1 0.2 0 0.0 5 1.1
Bintulu 374 29 7.8 25 6.7 0 0.0 1 0.3 0 0.0 3 0.8
Bukit Mertajam 998 7 0.7 2 0.2 0 0.0 0 0.0 0 0.0 5 0.5
Sandakan 237 0 0.0 0 0.0 0 0.0 0 0.0 0 0.0 0 0.0
Ipoh 2759 80 2.9 3 0.1 2 0.1 69 2.5 0 0.0 7 0.3
Kangar 426 3 0.7 0 0.0 3 0.7 0 0.0 0 0.0 0 0.0
Keningau 133 0 0.0 0 0.0 0 0.0 0 0.0 0 0.0 0 0.0
Kota Bharu 285 8 2.8 0 0.0 0 0.0 8 2.8 0 0.0 0 0.0
Kuala Krai 365 10 2.7 1 0.3 3 0.8 0 0.0 0 0.0 6 1.6
Kuala Lumpur 1932 39 2.0 2 0.1 0 0.0 20 1.0 2 0.1 15 0.8
Kuala Pilah 493 7 1.4 0 0.0 0 0.0 0 0.0 0 0.0 7 1.4
Kuala Terengganu 900 58 6.4 12 1.3 3 0.3 13 1.4 0 0.0 36 4.0
Melaka 2139 38 1.8 4 0.2 18 0.8 11 0.5 0 0.0 5 0.2
Miri 949 5 0.5 1 0.1 0 0.0 0 0.0 0 0.0 4 0.4
Muar 729 4 0.5 0 0.0 4 0.5 0 0.0 0 0.0 0 0.0
Pulau Pinang 1791 108 6.0 2 0.1 7 0.4 96 5.4 0 0.0 3 0.2
Figure 1.3.6-1: Distribution of Specific Combined Surgery, CSR 2002-2014
0.0
0.5
1.0
1.5
2.0
2.5
3.0
2002 2003 2004 2007 2008 2009 2010 2011 2012 2013 2014
%
Year
Pterygium Surgery Filtering Glaucoma Surgery Vitreoretinal Surgery
Penetrating Keratoplasty Others

64
Combined Surgery
All Surgeries Any Combined
Surgery
Pterygium
Surgery
Filtering
Surgery
Vitreo-Retinal
Surgery
Penetrating
Keratoplasty Others
N n % n % n % n % n % n %
Putrajaya 367 3 0.8 0 0.0 0 0.0 0 0.0 0 0.0 3 0.8
Kota Kinabalu 1040 22 2.1 4 0.4 0 0.0 14 1.3 0 0.0 4 0.4
Selayang 899 60 6.7 0 0.0 4 0.4 38 4.2 0 0.0 18 2.0
Serdang 1265 20 1.6 0 0.0 1 0.1 0 0.0 0 0.0 20 1.6
Sibu 866 10 1.2 3 0.3 4 0.5 0 0.0 0 0.0 3 0.3
Sri Manjung 625 10 1.6 6 1.0 2 0.3 0 0.0 0 0.0 2 0.3
Sultan Ismail 609 10 1.6 3 0.5 0 0.0 0 0.0 0 0.0 7 1.1
Johor Bahru 1381 26 1.9 1 0.1 1 0.1 14 1.0 0 0.0 10 0.7
Sungai Buloh 693 3 0.4 0 0.0 0 0.0 0 0.0 0 0.0 3 0.4
Sungei Petani 1022 13 1.3 1 0.1 0 0.0 0 0.0 0 0.0 12 1.2
Taiping 1233 30 2.4 4 0.3 0 0.0 0 0.0 0 0.0 26 2.1
Tawau 540 23 4.3 19 3.5 0 0.0 0 0.0 0 0.0 4 0.7
Teluk Intan 1013 0 0.0 0 0.0 0 0.0 0 0.0 0 0.0 0 0.0
Temerloh 1047 6 0.6 3 0.3 0 0.0 0 0.0 0 0.0 3 0.3
Kuantan 576 3 0.5 0 0.0 0 0.0 3 0.5 0 0.0 0 0.0
Klang 1461 7 0.5 2 0.1 0 0.0 0 0.0 0 0.0 5 0.3
Seremban 1585 48 3.0 0 0.0 0 0.0 32 2.0 0 0.0 16 1.0
Kuching 2068 119 5.8 6 0.3 6 0.3 96 4.6 0 0.0 11 0.5
Kemaman 72 0 0.0 0 0.0 0 0.0 0 0.0 0 0.0 0 0.0
Sarikei 555 1 0.2 0 0.0 0 0.0 0 0.0 0 0.0 1 0.2
Kulim 265 7 2.6 0 0.0 0 0.0 3 1.1 0 0.0 6 2.3
KK1M Terengganu 38 1 2.6 0 0.0 0 0.0 0 0.0 0 0.0 1 2.6
KK1M Kelantan 186 0 0.0 0 0.0 0 0.0 0 0.0 0 0.0 0 0.0
KK1M Sarawak 831 3 0.4 3 0.4 0 0.0 0 0.0 0 0.0 0 0.0
MAIWP 2266 1 0.0 0 0.0 0 0.0 0 0.0 0 0.0 1 0.0
1.3.7 Anaesthesia in Cataract Surgery
Majority of cataract surgeries were done under local anaesthesia (LA). There was a shift from subtenon to topical
anaesthesia as the preferred method of LA.
The percentage of surgeons using combined, subconjunctival and intracameral LA appeared to be increasing

65
Table 1.3.7-1: Types of Anaesthesia, CSR 2007-2014
Year 2007 2008 2009 2010 2011 2012 2013 2014
No of patients
(N) 18426 21496 24438 28506 30611 32473 37150 40532
n % n % n % n % n % n % n % n %
General
Anesthesia 1207 6.6 1223 5.7 1578 6.5 1884 6.6 1845 6.0 2117 6.5 2229 6.0 2415 6.0
Local
Anesthesia 17143 93.4 20188 94.3 22776 93.2 26440 92.8 28634 93.5 30215 93.1 34622 93.2 37654 92.9
Type of local anasthesia
Subtenon 9990 58.3 11014 54.6 11525 50.6 10952 41.4 10512 36.7 9849 32.6 9913 28.6 9351 24.8
Topical 4853 28.3 6680 33.1 8382 36.8 13112 49.6 16825 58.8 18461 61.1 22220 64.2 25068 66.6
Peribulbar 1282 7.5 1227 6.1 1244 5.5 881 3.3 440 1.5 279 0.9 308 0.9 474 1.3
Retrobulbar 1031 6.0 1182 5.9 1037 4.6 864 3.3 808 2.8 667 2.2 503 1.5 436 1.2
Intracameral 249 1.5 710 3.5 1596 7.0 2587 9.8 2933 10.2 3419 11.3 4733 13.7 6311 16.8
Subconjunctival 232 1.4 251 1.2 437 1.9 898 3.4 771 2.7 1266 4.2 1338 3.9 1352 3.6
Facial block 20 0.1 143 0.7 95 0.4 40 0.2 43 0.2 21 0.1 24 0.1 14 0.0
Others 0 0.0 NA NA 0 0.0 NA NA NA NA NA NA NA NA NA NA
Combined local
anaesthesia 720 4.2 1274 6.3 1918 8.4 3182 12.0 4038 14.1 4375 14.5 4868 14.1 5954 15.8
Types of sedation for patients under local anaesthesia
No sedation 9668 56.4* 11234 55.6 12809 56.2 15970 60.4 18646 65.1 19379 64.1 18685 54.0 19249 51.1
Oral sedation
alone 2387 13.9 2923 14.5 3532 15.5 3171 12.0 2852 10.0 1810 6.0 1391 4.0 1823 4.8
Intravenous
alone 72 0.4 37 0.2 35 0.2 22 0.1 27 0.1 36 0.1 31 0.1 36 0.1
Intravenous
plus oral 0 0.0 NA NA NA NA 2 0.0 6 0.0 6 0.0 1 0.0 2 0.0
Intramuscular
alone 3 0.0 121 0.6 52 0.2 0 0.0 3 0.0 2 0.0 18 0.1 1 0.0
*There was a significant percentage of missing values in sedation for 2007; these missing values may be in ‘no sedation’ category where data
were not entered.

66
Table 1.3.7-2: Types of Anaesthesia (50 years and above), CSR 2007-2014
Year 2007 2008 2009 2010 2011 2012 2013 2014
No of patients
(N) 16715 19709 22496 26336 28425 30228 34815 38305
n % n % n % n % n % n % n % n %
General
Anesthesia 628 3.8 681 3.5 950 6.5 1184 4.5 1173 4.1 1412 4.7 1545 4.4 1760 4.6
Local
Anesthesia 16018 95.8 18946 96.1 21468 93.2 24981 94.9 27131 95.5 28689 94.9 32985 94.7 36107 94.3
Type of local anasthesia
Subtenon 9397 58.7 10354 54.7 10861 50.6 10338 41.4 9979 36.8 9340 32.6 9435 28.6 8938 24.8
Topical 4510 28.2 6274 33.1 7952 37.0 12473 49.9 16003 59.0 17557 61.2 21203 64.3 24071 66.7
Peribulbar 1224 7.6 1159 6.1 1173 5.5 842 3.4 415 1.5 257 0.9 287 0.9 441 1.2
Retrobulbar 905 5.6 1084 5.7 921 4.3 749 3.0 665 2.5 573 2.0 430 1.3 382 1.1
Intracameral 231 1.4 685 3.6 1527 7.1 2447 9.8 2818 10.4 3287 11.5 4539 13.8 6089 16.9
Subconjunctival 218 1.4 233 1.2 412 1.9 847 3.4 721 2.7 1200 4.2 1272 3.9 1295 3.6
Facial block 20 0.1 134 0.7 86 0.4 39 0.2 40 0.1 20 0.1 24 0.1 13 0.0
Others 0 0.0 NA NA 0 0.0 NA NA NA NA NA NA NA NA NA NA
Combined local
anaesthesia 672 4.2 1219 6.4 1815 8.5 3030 12.1 3830 14.1 4135 14.4 4645 14.1 5700 15.8
Types of sedation for patients under local anaesthesia
No sedation 9027 56.4 10524 55.5 12056 56.2 15019 60.1 17616 64.9 18386 64.1 17810 54.0 18485 51.2
Oral sedation
alone 2264 14.1 2798 14.8 3355 15.6 3055 12.2 2731 10.1 1748 6.1 1339 4.1 1755 4.9
Intravenous
alone 55 0.3 37 0.2 29 0.1 18 0.1 23 0.1 34 0.1 28 0.1 26 0.1
Intravenous
plus oral 0 0.0 NA NA NA NA 2 0.0 5 0.0 6 0.0 1 0.0 1 0.0
Intramuscular
alone 3 0.0 114 0.6 47 0.2 0 0.0 2 0.0 2 0.0 17 0.1 1 0.0
0
10
20
30
40
50
60
70
2002 2003 2004 2007 2008 2009 2010 2011 2012 2013 2014
%
Year
Subtenon
Topical
Peribulbar
Retrobulbar
Intracameral
Subconjunctival
Facial block
Combined local anaesthesia
Figure 1.3.7-1: Types of Anaesthesia, CSR 2002-2014

67
Table 1.3.7-3: Types of Anaesthesia by SDP, CSR 2014
Types of Anaesthesia
General Local
N n % n %
All Centres 40532 2415 6.0 37654 92.9
Alor Setar 2106 312 14.8 1793 85.1
Ampang 946 33 3.5 908 96.0
Batu Pahat 467 15 3.2 452 96.8
Bintulu 374 0 0.0 374 100.0
Bukit Mertajam 998 29 2.9 966 96.8
Sandakan 237 3 1.3 233 98.3
Ipoh 2,759 352 12.8 2,225 80.6
Kangar 426 7 1.6 418 98.1
Keningau 133 4 3.0 129 97.0
Kota Bharu 285 9 3.2 275 96.5
Kuala Krai 365 5 1.4 358 98.1
Kuala Lumpur 1,932 166 8.6 1,734 89.8
Kuala Pilah 493 28 5.7 460 93.3
Kuala Terengganu 900 53 5.9 838 93.1
Melaka 2,139 50 2.3 2,059 96.3
Miri 949 1 0.1 947 99.8
Muar 729 31 4.3 695 95.3
Pulau Pinang 1,791 32 1.8 1,752 97.8
Putrajaya 367 12 3.3 353 96.2
Kota Kinabalu 1040 79 7.6 958 92.1
Selayang 899 25 2.8 781 86.9
Serdang 1,265 86 6.8 1168 92.3
Sibu 866 11 1.3 853 98.5
Sri Manjung 625 27 4.3 597 95.5
Sultan Ismail 609 124 20.4 484 79.5
Johor Bahru 1,381 34 2.5 1,345 97.4
Sungai Buloh 693 90 13.0 592 85.4
Sungei Petani 1022 137 13.4 882 86.3
Taiping 1,233 151 12.2 1,082 87.8
Tawau 540 7 1.3 526 97.4
Teluk Intan 1,013 10 1.0 995 98.2
Temerloh 1047 24 2.3 1019 97.3
Kuantan 576 110 19.1 464 80.6
Klang 1,461 195 13.3 1,251 85.6
Seremban 1,585 62 3.9 1,521 96.0
Kuching 2,068 89 4.3 1,975 95.5
Kemaman 72 1 1.4 71 98.6
Sarikei 555 3 0.5 552 99.5
Kulim 265 4 1.5 261 98.5
KK1M Terengganu 38 0 0.0 35 92.1
KK1M Kelantan 186 1 0.5 183 98.4
KK1M Sarawak 831 3 0.4 824 99.2
MAIWP 2,266 0 0.0 2,266 100.0
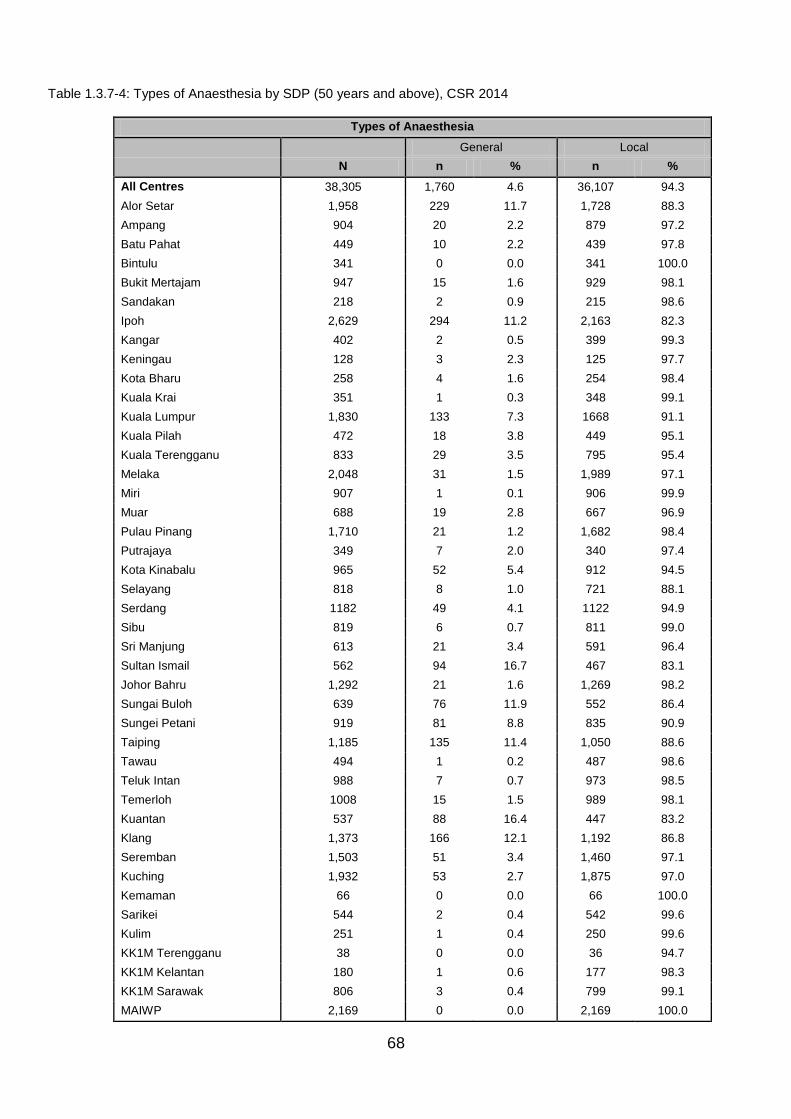
68
Table 1.3.7-4: Types of Anaesthesia by SDP (50 years and above), CSR 2014
Types of Anaesthesia
General Local
N n % n %
All Centres 38,305 1,760 4.6 36,107 94.3
Alor Setar 1,958 229 11.7 1,728 88.3
Ampang 904 20 2.2 879 97.2
Batu Pahat 449 10 2.2 439 97.8
Bintulu 341 0 0.0 341 100.0
Bukit Mertajam 947 15 1.6 929 98.1
Sandakan 218 2 0.9 215 98.6
Ipoh 2,629 294 11.2 2,163 82.3
Kangar 402 2 0.5 399 99.3
Keningau 128 3 2.3 125 97.7
Kota Bharu 258 4 1.6 254 98.4
Kuala Krai 351 1 0.3 348 99.1
Kuala Lumpur 1,830 133 7.3 1668 91.1
Kuala Pilah 472 18 3.8 449 95.1
Kuala Terengganu 833 29 3.5 795 95.4
Melaka 2,048 31 1.5 1,989 97.1
Miri 907 1 0.1 906 99.9
Muar 688 19 2.8 667 96.9
Pulau Pinang 1,710 21 1.2 1,682 98.4
Putrajaya 349 7 2.0 340 97.4
Kota Kinabalu 965 52 5.4 912 94.5
Selayang 818 8 1.0 721 88.1
Serdang 1182 49 4.1 1122 94.9
Sibu 819 6 0.7 811 99.0
Sri Manjung 613 21 3.4 591 96.4
Sultan Ismail 562 94 16.7 467 83.1
Johor Bahru 1,292 21 1.6 1,269 98.2
Sungai Buloh 639 76 11.9 552 86.4
Sungei Petani 919 81 8.8 835 90.9
Taiping 1,185 135 11.4 1,050 88.6
Tawau 494 1 0.2 487 98.6
Teluk Intan 988 7 0.7 973 98.5
Temerloh 1008 15 1.5 989 98.1
Kuantan 537 88 16.4 447 83.2
Klang 1,373 166 12.1 1,192 86.8
Seremban 1,503 51 3.4 1,460 97.1
Kuching 1,932 53 2.7 1,875 97.0
Kemaman 66 0 0.0 66 100.0
Sarikei 544 2 0.4 542 99.6
Kulim 251 1 0.4 250 99.6
KK1M Terengganu 38 0 0.0 36 94.7
KK1M Kelantan 180 1 0.6 177 98.3
KK1M Sarawak 806 3 0.4 799 99.1
MAIWP 2,169 0 0.0 2,169 100.0

69
Table 1.3.7-5: Types of Local Anaesthesia by SDP, CSR 2014
Local Anaesthesia
All Retrobulbar Peribulbar Subtenon Sub-
conjunctival Facial block Topical Intracameral Combined
N n % n % n % n % n % n % n % n %
All Centres 37,654 436 1.2 474 1.3 9,351 24.8 1,352 3.6 14 0.0 25,068 66.6 6,311 16.8 5,954 15.8
Alor Setar 1,793 79 4.4 4 0.2 379 21.1 3 0.2 0 0.0 1107 61.7 655 36.5 438 24.4
Ampang 908 0 0.0 1 0.1 125 13.8 4 0.4 0 0.0 827 91.1 800 88.1 829 91.3
Batu Pahat 452 5 1.1 7 1.5 293 64.8 148 32.7 0 0.0 0 0.0 0 0.0 1 0.2
Bintulu 374 0 0.0 0 0.0 374 100.0 0 0.0 0 0.0 0 0.0 0 0.0 0 0.0
Bukit Mertajam 966 0 0.0 1 0.1 283 29.3 0 0.0 1 0.1 2 0.2 678 70.2 4 0.4
Sandakan 233 0 0.0 0 0.0 7 3.0 0 0.0 0 0.0 225 96.6 0 0.0 1 0.4
Ipoh 2,225 18 0.8 2 0.1 198 8.9 197 8.9 4 0.2 2,163 97.2 961 43.2 1,153 51.8
Kangar 418 1 0.2 0 0.0 414 99.0 0 0.0 0 0.0 0 0.0 0 0.0 0 0.0
Keningau 129 1 0.8 35 27.1 20 15.5 0 0.0 1 0.8 74 57.4 0 0.0 2 1.6
Kota Bharu 275 0 0.0 0 0.0 273 99.3 1 0.4 0 0.0 0 0.0 0 0.0 0 0.0
Kuala Krai 358 1 0.3 0 0.0 248 69.3 3 0.8 0 0.0 161 45.0 1 0.3 58 16.2
Kuala Lumpur 1,734 21 1.2 331 19.1 761 43.9 11 0.6 1 0.1 509 29.4 397 22.9 330 19.0
Kuala Pilah 460 0 0.0 0 0.0 303 65.9 1 0.2 0 0.0 103 22.4 0 0.0 10 2.2
Kuala Terengganu 838 0 0.0 0 0.0 207 24.7 5 0.6 0 0.0 650 77.6 10 1.2 42 5.0
Melaka 2,059 4 0.2 2 0.1 123 6.0 0 0.0 0 0.0 2,008 97.5 2 0.1 86 4.2
Miri 947 1 0.1 0 0.0 364 38.4 1 0.1 0 0.0 627 66.2 0 0.0 51 5.4
Muar 695 0 0.0 0 0.0 53 7.6 2 0.3 5 0.7 644 92.7 247 35.5 253 36.4
Pulau Pinang 1,752 97 5.5 8 0.5 122 7.0 2 0.1 0 0.0 1,573 89.8 19 1.1 87 5.0
Putrajaya 353 0 0.0 0 0.0 77 21.8 1 0.3 0 0.0 4 1.1 288 81.6 17 4.8
Kota Kinabalu 958 2 0.2 16 1.7 248 25.9 1 0.1 0 0.0 796 83.1 6 0.6 118 12.3
Selayang 781 50 6.4 10 1.3 131 16.8 1 0.1 0 0.0 600 76.8 118 15.1 145 18.6
Serdang 1168 0 0.0 1 0.1 362 31.0 1 0.1 0 0.0 752 64.4 452 38.7 418 35.8
Sibu 853 0 0.0 0 0.0 22 2.6 0 0.0 0 0.0 843 98.8 0 0.0 14 1.6
Sri Manjung 597 0 0.0 0 0.0 4 0.7 0 0.0 0 0.0 587 98.3 1 0.2 2 0.3
Sultan Ismail 484 0 0.0 0 0.0 159 32.9 313 64.7 0 0.0 95 19.6 1 0.2 84 17.4
Johor Bahru 1,345 15 1.1 0 0.0 278 20.7 400 29.7 1 0.1 440 32.7 554 41.2 339 25.2
Sungai Buloh 592 3 0.5 1 0.2 158 26.7 56 9.5 0 0.0 193 32.6 140 23.6 80 13.5
Sungei Petani 882 0 0.0 0 0.0 218 24.7 2 0.2 0 0.0 756 85.7 0 0.0 95 10.8
Taiping 1,082 0 0.0 0 0.0 189 17.5 0 0.0 0 0.0 906 83.7 0 0.0 14 1.3
Tawau 526 0 0.0 0 0.0 406 77.2 6 1.1 0 0.0 112 21.3 0 0.0 3 0.6
Teluk Intan 995 1 0.1 0 0.0 986 99.1 0 0.0 1 0.1 33 3.3 0 0.0 33 3.3
Temerloh 1019 12 1.2 32 3.1 491 48.2 7 0.7 0 0.0 243 23.8 162 15.9 234 23.0
Kuantan 464 11 2.4 0 0.0 399 86.0 1 0.2 0 0.0 49 10.6 0 0.0 1 0.2
Klang 1,251 50 4.0 0 0.0 58 4.6 1 0.1 0 0.0 1,138 91.0 1 0.1 33 2.6
Seremban 1,521 0 0.0 8 0.5 240 15.8 165 10.8 0 0.0 1156 76.0 79 5.2 126 8.3
Kuching 1,975 57 2.9 15 0.8 59 3.0 4 0.2 0 0.0 1,855 93.9 34 1.7 103 5.2
Kemaman 71 0 0.0 0 0.0 24 33.8 1 1.4 0 0.0 52 73.2 1 1.4 10 14.1
Sarikei 552 0 0.0 0 0.0 5 0.9 0 0.0 0 0.0 546 98.9 0 0.0 2 0.4
Kulim 261 1 0.4 0 0.0 14 5.4 0 0.0 0 0.0 189 72.4 205 78.5 148 56.7
KK1M Terengganu 35 0 0.0 0 0.0 10 28.6 0 0.0 0 0.0 28 80.0 0 0.0 3 8.6
KK1M Kelantan 183 0 0.0 0 0.0 138 75.4 2 1.1 0 0.0 33 18.0 5 2.7 0 0.0
KK1M Sarawak 824 0 0.0 0 0.0 5 0.6 0 0.0 0 0.0 818 99.3 0 0.0 3 0.4
MAIWP 2,266 6 0.3 0 0.0 123 5.4 12 0.5 0 0.0 2,171 95.8 494 21.8 584 25.8

70
Table 1.3.7-6: Types of Local Anaesthesia by SDP (50 years and above), CSR 2014
Local Anaesthesia
All Retrobulbar Peribulbar Subtenon
Sub-
conjunctival Facial block Topical Intracameral Combined
N n % n % n % n % n % n % n % n %
All Centres 36,107 382 1.1 441 1.2 8,938 24.8 1,295 3.6 13 0.0 24,071 66.7 6,089 16.9 5,700 15.8
Alor Setar 1,728 69 4.0 4 0.2 373 21.6 3 0.2 0 0.0 1064 61.6 628 36.3 417 24.1
Ampang 879 0 0.0 0 0.0 121 13.8 4 0.5 0 0.0 801 91.1 775 88.2 803 91.4
Batu Pahat 439 5 1.1 7 1.6 285 64.9 143 32.6 0 0.0 0 0.0 0 0.0 1 0.2
Bintulu 341 0 0.0 0 0.0 341 100.0 0 0.0 0 0.0 0 0.0 0 0.0 0 0.0
Bukit Mertajam 929 0 0.0 1 0.1 269 29.0 0 0.0 1 0.1 1 0.1 656 70.6 4 0.4
Sandakan 215 0 0.0 0 0.0 6 2.8 0 0.0 0 0.0 207 96.3 0 0.0 0 0.0
Ipoh 2,163 18 0.8 2 0.1 192 8.9 188 8.7 4 0.2 2,104 97.3 937 43.3 1,123 51.9
Kangar 399 1 0.3 0 0.0 395 99.0 0 0.0 0 0.0 0 0.0 0 0.0 0 0.0
Keningau 125 1 0.8 32 25.6 20 16.0 0 0.0 1 0.8 73 58.4 0 0.0 2 1.6
Kota Bharu 254 0 0.0 0 0.0 252 99.2 1 0.4 0 0.0 0 0.0 0 0.0 0 0.0
Kuala Krai 348 1 0.3 0 0.0 239 68.7 3 0.9 0 0.0 157 45.1 1 0.3 55 15.8
Kuala Lumpur 1,668 20 1.2 310 18.6 737 44.2 10 0.6 1 0.1 494 29.6 382 22.9 319 19.1
Kuala Pilah 449 0 0.0 0 0.0 294 65.5 1 0.2 0 0.0 101 22.5 0 0.0 10 2.2
Kuala
Terengganu 795 0 0.0 0 0.0 197 24.8 5 0.6 0 0.0 615 77.4 10 1.3 40 5.0
Melaka 1,989 3 0.2 2 0.1 118 5.9 0 0.0 0 0.0 1,940 97.5 2 0.1 81 4.1
Miri 906 1 0.1 0 0.0 348 38.4 1 0.1 0 0.0 600 66.2 0 0.0 48 5.3
Muar 667 0 0.0 0 0.0 51 7.6 2 0.3 5 0.7 618 92.7 240 36.0 246 36.9
Pulau Pinang 1,682 85 5.1 8 0.5 113 6.7 2 0.1 0 0.0 1,518 90.2 19 1.1 81 4.8
Putrajaya 340 0 0.0 0 0.0 74 21.8 1 0.3 0 0.0 4 1.2 278 81.8 17 5.0
Kota Kinabalu 912 2 0.2 16 1.8 235 25.8 1 0.1 0 0.0 754 82.7 6 0.7 109 12.0
Selayang 721 39 5.4 8 1.1 116 16.1 1 0.1 0 0.0 568 78.8 109 15.1 131 18.2
Serdang 1122 0 0.0 1 0.1 345 30.7 1 0.1 0 0.0 723 64.4 434 38.7 400 35.7
Sibu 811 0 0.0 0 0.0 21 2.6 0 0.0 0 0.0 801 98.8 0 0.0 13 1.6
Sri Manjung 591 0 0.0 0 0.0 4 0.7 0 0.0 0 0.0 581 98.3 1 0.2 2 0.3
Sultan Ismail 467 0 0.0 0 0.0 153 32.8 303 64.9 0 0.0 89 19.1 1 0.2 79 16.9
Johor Bahru 1,269 13 1.0 0 0.0 254 20.0 378 29.8 1 0.1 414 32.6 532 41.9 318 25.1
Sungai Buloh 552 3 0.5 0 0.0 146 26.4 55 10.0 0 0.0 181 32.8 128 23.2 75 13.6
Sungei Petani 835 0 0.0 0 0.0 212 25.4 2 0.2 0 0.0 712 85.3 0 0.0 92 11.0
Taiping 1,050 0 0.0 0 0.0 182 17.3 0 0.0 0 0.0 879 83.7 0 0.0 12 1.1
Tawau 487 0 0.0 0 0.0 377 77.4 5 1.0 0 0.0 102 20.9 0 0.0 2 0.4
Teluk Intan 973 1 0.1 0 0.0 964 99.1 0 0.0 0 0.0 31 3.2 0 0.0 30 3.1
Temerloh 989 11 1.1 31 3.1 478 48.3 7 0.7 0 0.0 238 24.1 158 16.0 228 23.1
Kuantan 447 11 2.5 0 0.0 386 86.4 1 0.2 0 0.0 45 10.1 0 0.0 1 0.2
Klang 1,192 46 3.9 0 0.0 54 4.5 1 0.1 0 0.0 1,084 90.9 1 0.1 30 2.5
Seremban 1,460 0 0.0 8 0.5 234 16.0 159 10.9 0 0.0 1103 75.5 78 5.3 121 8.3
Kuching 1,875 46 2.5 11 0.6 52 2.8 3 0.2 0 0.0 1,770 94.4 31 1.7 91 4.9
Kemaman 66 0 0.0 0 0.0 21 31.8 0 0.0 0 0.0 49 74.2 1 1.5 8 12.1
Sarikei 542 0 0.0 0 0.0 5 0.9 0 0.0 0 0.0 536 98.9 0 0.0 2 0.4
Kulim 250 1 0.4 0 0.0 14 5.6 0 0.0 0 0.0 179 71.6 197 78.8 141 56.4
KK1M
Terengganu 35 0 0.0 0 0.0 10 28.6 0 0.0 0 0.0 28 80.0 0 0.0 3 8.6
KK1M Kelantan 177 0 0.0 0 0.0 133 75.1 2 1.1 0 0.0 33 18.6 5 2.8 0 0.0
KK1M Sarawak 799 0 0.0 0 0.0 5 0.6 0 0.0 0 0.0 794 99.4 0 0.0 3 0.4
MAIWP 2,169 5 0.2 0 0.0 112 5.2 12 0.6 0 0.0 2,080 95.9 479 22.1 562 25.9

71
Table 1.3.7-7: Types of Local Anaesthesia by SDP (Excluding Combined Surgery), CSR 2014
Local Anesthesia
All Retrobulbar Peribulbar Subtenon Sub-
conjunctival Facial block Topical Intracameral Combined
N n % n % n % n % n % n % n % n %
All Centres 36,919 171 0.5 441 1.2 9,091 24.6 1,334 3.6 14 0.0 24,801 67.2 6,262 17.0 5,792 15.7
Alor Setar 1,679 8 0.5 1 0.1 357 21.3 2 0.1 0 0.0 1,081 64.4 643 38.3 415 24.7
Ampang 887 0 0.0 1 0.1 108 12.2 4 0.5 0 0.0 814 91.8 791 89.2 816 92.0
Batu Pahat 446 5 1.1 7 1.6 288 64.6 147 33.0 0 0.0 0 0.0 0 0.0 1 0.2
Bintulu 345 0 0.0 0 0.0 345 100.0 0 0.0 0 0.0 0 0.0 0 0.0 0 0.0
Bukit Mertajam 961 0 0.0 1 0.1 280 29.1 0 0.0 1 0.1 2 0.2 676 70.3 4 0.4
Sandakan 233 0 0.0 0 0.0 7 3.0 0 0.0 0 0.0 225 96.6 0 0.0 1 0.4
Ipoh 2,205 7 0.3 0 0.0 198 9.0 196 8.9 4 0.2 2,148 97.4 957 43.4 1,142 51.8
Kangar 415 1 0.2 0 0.0 411 99.0 0 0.0 0 0.0 0 0.0 0 0.0 0 0.0
Keningau 129 1 0.8 35 27.1 20 15.5 0 0.0 1 0.8 74 57.4 0 0.0 2 1.6
Kota Bharu 269 0 0.0 0 0.0 267 99.3 1 0.4 0 0.0 0 0.0 0 0.0 0 0.0
Kuala Krai 348 1 0.3 0 0.0 240 69.0 2 0.6 0 0.0 160 46.0 1 0.3 57 16.4
Kuala Lumpur 1,713 21 1.2 324 18.9 754 44.0 11 0.6 1 0.1 502 29.3 394 23.0 327 19.1
Kuala Pilah 453 0 0.0 0 0.0 296 65.3 1 0.2 0 0.0 102 22.5 0 0.0 9 2.0
Kuala
Terengganu 793 0 0.0 0 0.0 178 22.4 3 0.4 0 0.0 629 79.3 10 1.3 34 4.3
Melaka 2,035 1 0.0 1 0.0 111 5.5 0 0.0 0 0.0 1,992 97.9 2 0.1 78 3.8
Miri 942 1 0.1 0 0.0 360 38.2 1 0.1 0 0.0 624 66.2 0 0.0 49 5.2
Muar 692 0 0.0 0 0.0 50 7.2 2 0.3 5 0.7 642 92.8 247 35.7 251 36.3
Pulau Pinang 1,650 9 0.5 8 0.5 113 6.8 2 0.1 0 0.0 1,549 93.9 19 1.2 68 4.1
Putrajaya 350 0 0.0 0 0.0 74 21.1 1 0.3 0 0.0 4 1.1 288 82.3 17 4.9
Kota Kinabalu 945 1 0.1 16 1.7 240 25.4 1 0.1 0 0.0 789 83.5 5 0.5 114 12.1
Selayang 727 20 2.8 5 0.7 126 17.3 0 0.0 0 0.0 580 79.8 116 16.0 131 18.0
Serdang 1,155 0 0.0 1 0.1 357 30.9 1 0.1 0 0.0 743 64.3 446 38.6 411 35.6
Sibu 845 0 0.0 0 0.0 19 2.2 0 0.0 0 0.0 836 98.9 0 0.0 12 1.4
Sri Manjung 590 0 0.0 0 0.0 4 0.7 0 0.0 0 0.0 580 98.3 1 0.2 2 0.3
Sultan Ismail 476 0 0.0 0 0.0 155 32.6 309 64.9 0 0.0 92 19.3 1 0.2 81 17.0
Johor Bahru 1,323 9 0.7 0 0.0 268 20.3 397 30.0 1 0.1 436 33.0 549 41.5 334 25.2
Sungai Buloh 591 3 0.5 1 0.2 157 26.6 56 9.5 0 0.0 193 32.7 140 23.7 80 13.5
Sungei Petani 876 0 0.0 0 0.0 217 24.8 2 0.2 0 0.0 750 85.6 0 0.0 94 10.7
Taiping 1,063 0 0.0 0 0.0 177 16.7 0 0.0 0 0.0 898 84.5 0 0.0 13 1.2
Tawau 504 0 0.0 0 0.0 387 76.8 5 1.0 0 0.0 110 21.8 0 0.0 2 0.4
Teluk Intan 995 1 0.1 0 0.0 986 99.1 0 0.0 1 0.1 33 3.3 0 0.0 33 3.3
Temerloh 1,013 12 1.2 32 3.2 487 48.1 7 0.7 0 0.0 240 23.7 161 15.9 231 22.8
Kuantan 464 11 2.4 0 0.0 399 86.0 1 0.2 0 0.0 49 10.6 0 0.0 1 0.2
Klang 1,245 50 4.0 0 0.0 57 4.6 1 0.1 0 0.0 1,133 91.0 1 0.1 33 2.7
Seremban 1,505 0 0.0 7 0.5 230 15.3 163 10.8 0 0.0 1,151 76.5 79 5.2 124 8.2
Kuching 1,875 2 0.1 1 0.1 52 2.8 3 0.2 0 0.0 1,812 96.6 33 1.8 79 4.2
Kemaman 71 0 0.0 0 0.0 24 33.8 1 1.4 0 0.0 52 73.2 1 1.4 10 14.1
Sarikei 552 0 0.0 0 0.0 5 0.9 0 0.0 0 0.0 546 98.9 0 0.0 2 0.4
Kulim 256 1 0.4 0 0.0 12 4.7 0 0.0 0 0.0 184 71.9 202 78.9 144 56.3
KK1M
Terengganu 34 0 0.0 0 0.0 10 29.4 0 0.0 0 0.0 27 79.4 0 0.0 3 8.8
KK1M Kelantan 183 0 0.0 0 0.0 138 75.4 2 1.1 0 0.0 33 18.0 5 2.7 0 0.0
KK1M Sarawak 821 0 0.0 0 0.0 5 0.6 0 0.0 0 0.0 815 99.3 0 0.0 3 0.4
MAIWP 2,265 6 0.3 0 0.0 122 5.4 12 0.5 0 0.0 2,171 95.8 494 21.8 584 25.8

72
Table 1.3.7-8: Types of Local Anaesthesia by SDP (50 years and above, Excluding Combined Surgery), CSR 2014
Local Anesthesia
All Retrobulbar Peribulbar Subtenon Sub-
conjunctival Facial block Topical Intracameral Combined
N n % n % n % n % n % n % n % n %
All Centres 35,447 153 0.4 415 1.2 8,703 24.6 1,278 3.6 13 0.0 23,827 67.2 6,043 17.0 5,557 15.7
Alor Setar 1,625 8 0.5 1 0.1 351 21.6 2 0.1 0 0.0 1,041 64.1 617 38.0 397 24.4
Ampang 858 0 0.0 0 0.0 104 12.1 4 0.5 0 0.0 788 91.8 766 89.3 790 92.1
Batu Pahat 433 5 1.2 7 1.6 280 64.7 142 32.8 0 0.0 0 0.0 0 0.0 1 0.2
Bintulu 313 0 0.0 0 0.0 313 100.0 0 0.0 0 0.0 0 0.0 0 0.0 0 0.0
Bukit Mertajam 924 0 0.0 1 0.1 266 28.8 0 0.0 1 0.1 1 0.1 654 70.8 4 0.4
Sandakan 215 0 0.0 0 0.0 6 2.8 0 0.0 0 0.0 207 96.3 0 0.0 0 0.0
Ipoh 2,143 7 0.3 0 0.0 192 9.0 187 8.7 4 0.2 2,089 97.5 933 43.5 1,112 51.9
Kangar 396 1 0.3 0 0.0 392 99.0 0 0.0 0 0.0 0 0.0 0 0.0 0 0.0
Keningau 125 1 0.8 32 25.6 20 16.0 0 0.0 1 0.8 73 58.4 0 0.0 2 1.6
Kota Bharu 250 0 0.0 0 0.0 248 99.2 1 0.4 0 0.0 0 0.0 0 0.0 0 0.0
Kuala Krai 338 1 0.3 0 0.0 231 68.3 2 0.6 0 0.0 156 46.2 1 0.3 54 16.0
Kuala Lumpur 1,651 20 1.2 306 18.5 731 44.3 10 0.6 1 0.1 488 29.6 379 23.0 317 19.2
Kuala Pilah 443 0 0.0 0 0.0 288 65.0 1 0.2 0 0.0 100 22.6 0 0.0 9 2.0
Kuala
Terengganu 754 0 0.0 0 0.0 172 22.8 3 0.4 0 0.0 595 78.9 10 1.3 33 4.4
Melaka 1,968 1 0.1 1 0.1 108 5.5 0 0.0 0 0.0 1,927 97.9 2 0.1 76 3.9
Miri 901 1 0.1 0 0.0 344 38.2 1 0.1 0 0.0 597 66.3 0 0.0 46 5.1
Muar 664 0 0.0 0 0.0 48 7.2 2 0.3 5 0.8 616 92.8 240 36.1 244 36.7
Pulau Pinang 1,591 8 0.5 8 0.5 105 6.6 2 0.1 0 0.0 1,497 94.1 19 1.2 66 4.1
Putrajaya 339 0 0.0 0 0.0 73 21.5 1 0.3 0 0.0 4 1.2 278 82.0 17 5.0
Kota Kinabalu 902 1 0.1 16 1.8 229 25.4 1 0.1 0 0.0 749 83.0 5 0.6 106 11.8
Selayang 677 13 1.9 4 0.6 112 16.5 0 0.0 0 0.0 552 81.5 108 16.0 119 17.6
Serdang 1,109 0 0.0 1 0.1 340 30.7 1 0.1 0 0.0 714 64.4 428 38.6 393 35.4
Sibu 803 0 0.0 0 0.0 18 2.2 0 0.0 0 0.0 794 98.9 0 0.0 11 1.4
Sri Manjung 584 0 0.0 0 0.0 4 0.7 0 0.0 0 0.0 574 98.3 1 0.2 2 0.3
Sultan Ismail 460 0 0.0 0 0.0 150 32.6 299 65.0 0 0.0 86 18.7 1 0.2 76 16.5
Johor Bahru 1,250 7 0.6 0 0.0 247 19.8 375 30.0 1 0.1 410 32.8 527 42.2 313 25.0
Sungai Buloh 551 3 0.5 0 0.0 145 26.3 55 10.0 0 0.0 181 32.8 128 23.2 75 13.6
Sungei Petani 830 0 0.0 0 0.0 211 25.4 2 0.2 0 0.0 707 85.2 0 0.0 91 11.0
Taiping 1,031 0 0.0 0 0.0 170 16.5 0 0.0 0 0.0 871 84.5 0 0.0 11 1.1
Tawau 466 0 0.0 0 0.0 359 77.0 5 1.1 0 0.0 100 21.5 0 0.0 2 0.4
Teluk Intan 973 1 0.1 0 0.0 964 99.1 0 0.0 0 0.0 31 3.2 0 0.0 30 3.1
Temerloh 983 11 1.1 31 3.2 474 48.2 7 0.7 0 0.0 235 23.9 157 16.0 225 22.9
Kuantan 447 11 2.5 0 0.0 386 86.4 1 0.2 0 0.0 45 10.1 0 0.0 1 0.2
Klang 1,186 46 3.9 0 0.0 53 4.5 1 0.1 0 0.0 1,079 91.0 1 0.1 30 2.5
Seremban 1,447 0 0.0 7 0.5 226 15.6 157 10.9 0 0.0 1,100 76.0 78 5.4 120 8.3
Kuching 1,789 1 0.1 0 0.0 46 2.6 2 0.1 0 0.0 1,730 96.7 31 1.7 69 3.9
Kemaman 66 0 0.0 0 0.0 21 31.8 0 0.0 0 0.0 49 74.2 1 1.5 8 12.1
Sarikei 542 0 0.0 0 0.0 5 0.9 0 0.0 0 0.0 536 98.9 0 0.0 2 0.4
Kulim 245 1 0.4 0 0.0 12 4.9 0 0.0 0 0.0 174 71.0 194 79.2 137 55.9
KK1M
Terengganu 34 0 0.0 0 0.0 10 29.4 0 0.0 0 0.0 27 79.4 0 0.0 3 8.8
KK1M Kelantan 177 0 0.0 0 0.0 133 75.1 2 1.1 0 0.0 33 18.6 5 2.8 0 0.0
KK1M Sarawak 796 0 0.0 0 0.0 5 0.6 0 0.0 0 0.0 791 99.4 0 0.0 3 0.4
MAIWP 2,168 5 0.2 0 0.0 111 5.1 12 0.6 0 0.0 2,080 95.9 479 22.1 562 25.9

73
Table 1.3.7-9: Subtenon Anaesthesia by SDP, CSR 2007-2014
Years 2007 2008 2009 2010 2011 2012 2013 2014
n % n % n % n % n % n % n % n %
All Centres 9990 58.3 11014 54.6 11525 50.6 10952 41.4 10512 36.7 9849 32.6 9,913 28.6 9,351 24.8
Alor Setar 35 9.5 109 12.1 239 25.3 274 20.7 323 18.8 426 26.5 600 40.8 379 21.1
Ampang 3 75.0 162 78.3 110 27.1 70 11.5 27 3.8 58 6.7 117 12.4 125 13.8
Batu Pahat 545 99.6 567 99.5 562 94.8 280 69.5 156 29.1 161 27.4 166 39.8 293 64.8
Bintulu - - 24 0.0 118 99.2 255 99.6 328 100.0 382 100.0 374 98.9 374 100.0
Bukit Mertajam 422 69.5 294 64.1 239 32.7 399 50.8 423 54.3 384 42.7 275 31.0 283 29.3
Sandakan NA NA 0 0.0 86 57.7 116 61.4 140 55.6 113 45.0 24 6.0 7 3.0
Ipoh 702 47.1 921 56.2 872 43.5 567 27.3 387 23.5 517 19.6 448 16.8 198 8.9
Kangar 313 98.4 389 98.5 383 98.5 383 98.7 397 100.0 442 99.1 457 98.5 414 99.0
Keningau - - 0 0.0 0 0.0 0 0.0 0 0.0 0 0.0 1 7.1 20 15.5
Kota Bharu 726 99.2 672 99.3 837 98.0 885 97.6 884 99.0 495 97.6 629 98.6 273 99.3
Kuala Krai 115 100.0 142 86.6 169 98.8 203 95.8 222 94.9 243 99.6 388 100.0 248 69.3
Kuala Lumpur NA NA 27 73.0 620 50.7 800 56.7 829 60.7 601 46.8 310 31.0 761 43.9
Kuala Pilah 208 99.5 270 97.8 252 89.7 237 79.5 371 79.6 304 72.6 208 44.1 303 65.9
Kuala Terengganu 419 85.2 590 84.8 417 59.7 267 39.8 274 38.1 291 40.6 215 22.7 207 24.7
Melaka 443 30.1 463 28.9 376 28.5 310 19.5 211 13.4 128 9.0 223 13.7 123 6.0
Miri 1 6.3 352 90.0 187 46.9 90 15.7 161 24.9 60 6.8 24 2.7 364 38.4
Muar 166 49.7 326 98.5 528 99.2 460 77.7 104 15.8 54 8.3 37 5.4 53 7.6
Pulau Pinang 967 97.6 687 54.5 474 37.3 328 18.5 76 3.5 56 4.4 165 10.0 122 7.0
Putrajaya 188 98.9 236 99.6 240 99.2 260 100.0 240 80.3 125 37.4 100 27.0 77 21.8
Kota Kinabalu 195 39.2 81 24.1 82 20.3 115 22.0 91 14.0 142 19.9 206 22.3 248 25.9
Selayang 152 11.1 174 12.7 190 13.9 249 15.1 211 11.8 323 18.4 260 19.9 131 16.8
Serdang 522 91.7 375 56.9 396 70.7 375 80.5 432 70.7 414 60.6 339 36.1 362 31.0
Sibu 33 9.6 96 38.9 155 40.4 26 5.8 37 7.4 10 1.3 11 1.2 22 2.6
Sri Manjung 136 92.5 133 38.7 28 8.6 35 9.2 47 11.4 32 7.2 9 1.1 4 0.7
Sultan Ismail 0 0.0 0 0.0 0 0.0 0 0.0 0 0.0 1 0.5 15 5.3 159 32.9
Johor Bahru 1103 74.0 801 60.1 942 74.8 464 35.3 436 41.1 501 43.9 521 40.4 278 20.7
Sungai Buloh 98 80.3 221 90.2 325 99.4 374 91.2 319 79.4 292 67.4 373 77.9 158 26.7
Sungei Petani 472 99.0 591 98.2 646 99.2 235 44.9 180 23.3 236 29.3 229 26.1 218 24.7
Taiping 156 71.2 166 54.2 121 22.4 328 41.4 402 48.4 356 36.4 373 32.5 189 17.5
Tawau 195 100.0 303 98.4 287 99.7 382 99.5 553 100.0 615 99.2 380 78.8 406 77.2
Teluk Intan 190 28.6 406 72.0 397 66.4 386 58.2 472 73.2 586 99.2 1,063 98.9 986 99.1
Temerloh 390 94.4 429 83.1 425 67.8 410 96.7 611 94.0 586 69.9 403 47.5 491 48.2
Kuantan 9 47.4 162 54.9 143 63.8 358 78.9 456 77.2 345 63.3 366 76.3 399 86.0
Klang 468 57.1 297 27.3 178 24.1 326 38.5 67 7.2 62 5.0 45 3.3 58 4.6
Seremban 210 24.1 294 35.4 356 30.7 563 38.3 591 38.5 422 29.1 270 18.7 240 15.8
Kuching 404 42.7 254 26.3 145 17.1 142 12.5 54 4.9 86 5.4 56 3.4 59 3.0
Kemaman
8 17.4 24 33.8
Sarikei
2 0.7 5 0.9
Kulim
- - 14 5.4
KK1M Pahang
51 79.7 - -
KK1M Terengganu
- - 10 28.6
KK1M Kelantan
- - 138 75.4
KK1M Sarawak
1 1.3 5 0.6
MAIWP
171 10.8 123 5.4

74
Table 1.3.7-10: Subtenon Anaesthesia by SDP (50 years and above), CSR 2007-2014
Years 2007 2008 2009 2010 2011 2012 2013 2014
n % n % n % n % n % n % n % n %
All Centres 9397 56.2 10354 54.7 10861 50.6 10338 41.4 9979 36.8 9340 32.6 9435 28.6 8938 24.8
Alor Setar 33 8.8 103 11.9 228 25.8 263 21.0 309 19.0 418 27.0 586 41.2 373 21.6
Ampang 2 66.7 150 77.7 103 26.8 66 11.3 27 4.0 56 6.7 114 12.7 121 13.8
Batu Pahat 511 99.2 534 99.4 537 94.5 269 70.6 152 29.4 157 27.8 163 40.2 285 64.9
Bintulu - - 22 88.0 106 99.1 230 100.0 303 100.0 356 100.0 342 99.4 341 100.0
Bukit Mertajam 402 65.2 279 64.1 224 32.4 372 50.7 408 54.9 358 42.2 265 31.5 269 29.0
Sandakan - - 0 0.0 80 58.8 110 61.5 134 55.8 107 46.1 23 6.2 6 2.8
Ipoh 663 46.0 881 55.9 838 43.4 550 27.6 378 23.6 500 19.7 430 16.8 192 8.9
Kangar 298 97.1 363 98.6 365 98.4 365 98.6 383 100.0 418 99.1 446 98.5 395 99.0
Keningau - - 0 0.0 0 0.0 0 0.0 0 0.0 0 0.0 1 7.1 20 16.0
Kota Bharu 683 95.5 628 99.2 760 98.1 818 97.4 828 99.0 459 97.7 591 98.7 252 99.2
Kuala Krai 111 96.5 132 86.8 163 98.8 188 95.4 208 94.5 231 99.6 369 100.0 239 68.7
Kuala Lumpur - - 27 77.1 594 50.8 759 56.6 796 61.3 581 47.4 298 31.0 737 44.2
Kuala Pilah 197 98.5 251 98.0 240 89.6 228 79.7 355 79.2 292 72.5 195 43.1 294 65.5
Kuala Terengganu 390 82.5 557 84.7 392 59.7 251 40.1 261 38.1 273 40.6 198 22.0 197 24.8
Melaka 428 30.6 455 30.0 363 29.2 303 20.0 210 14.0 125 9.2 216 14.0 118 5.9
Miri 1 6.3 330 89.7 176 46.2 85 15.7 151 24.5 56 6.6 22 2.5 348 38.4
Muar 158 48.2 308 98.4 507 99.2 429 77.7 100 15.9 51 8.0 36 5.6 51 7.6
Pulau Pinang 929 91.5 668 54.6 462 37.4 320 18.7 74 3.6 53 4.2 153 9.6 113 6.7
Putrajaya 178 95.2 226 99.6 231 99.1 255 100.0 224 80.3 116 36.4 95 26.5 74 21.8
Kota Kinabalu 181 39.2 73 23.7 74 20.2 108 22.3 85 13.9 132 19.9 193 22.2 235 25.8
Selayang 132 10.6 165 13.5 178 14.4 227 15.1 191 11.8 300 18.5 244 20.2 116 16.1
Serdang 485 89.2 358 57.0 380 70.5 354 80.6 407 71.3 389 61.1 324 36.5 345 30.7
Sibu 32 9.3 89 39.0 145 40.6 23 5.5 33 7.1 10 1.4 10 1.2 21 2.6
Sri Manjung 128 90.1 123 38.9 27 8.7 34 9.2 44 11.2 31 7.2 9 1.2 4 0.7
Sultan Ismail 4 4.1 0 0.0 0 0.0 0 0.0 0 0.0 1 0.6 15 5.5 153 32.8
Johor Bahru 1025 72.9 724 59.5 846 74.7 427 35.1 403 41.3 468 45.1 478 40.2 254 20.0
Sungai Buloh 91 70.5 207 90.4 306 99.4 346 91.1 294 78.8 280 67.1 356 77.9 146 26.4
Sungei Petani 444 96.3 551 98.2 612 99.2 225 45.5 172 23.4 231 30.1 221 26.3 212 25.4
Taiping 148 58.3 158 53.6 117 22.5 313 41.3 385 48.7 349 36.8 367 33.1 182 17.3
Tawau 169 100.0 275 98.2 258 99.6 334 99.7 500 100.0 561 99.1 338 78.1 377 77.4
Teluk Intan 176 28.2 386 72.0 375 65.6 371 58.2 458 73.0 570 99.3 1,031 98.8 964 99.1
Temerloh 371 90.5 410 83.5 402 68.4 401 96.6 587 94.1 555 69.7 382 47.2 478 48.3
Kuantan 7 33.3 151 54.5 138 63.3 338 78.6 444 77.5 330 62.9 356 76.2 386 86.4
Klang 442 47.4 271 26.7 169 24.1 312 39.2 63 7.3 58 5.0 43 3.3 54 4.5
Seremban 199 22.7 272 34.6 336 30.7 529 37.9 562 38.2 392 28.4 258 18.5 234 16.0
Kuching 379 42.6 227 25.6 129 16.2 135 12.6 50 4.9 76 5.1 49 3.2 52 2.8
Kemaman
8 18.2 21 31.8
Sarikei
2 0.7 5 0.9
Kulim
- - 14 5.6
KK1M Pahang
48 80.0 - -
KK1M Terengganu
- - 10 28.6
KK1M Kelantan
- - 133 75.1
KK1M Sarawak
1 1.4 5 0.6
MAIWP
159 10.5 112 5.2

75
Table 1.3.7-11: Topical Anaesthesia by SDP, CSR 2007-2014
Year 2007 2008 2009 2010 2011 2012 2013 2014
n % n % n % n % n % n % n % n %
All Centres 4853 28.3 6680 33.1 8382 36.8 13112 49.6 16825 58.8 18461 61.1 22220 64.2 25068 66.6
Alor Setar 1 0.3 95 10.6 124 13.1 676 51.2 876 51.0 922 57.4 547 37.2 1107 61.7
Ampang 3 75.0 64 30.9 248 61.1 500 81.8 674 95.9 807 92.7 908 96.3 827 91.1
Batu Pahat 1 0.2 0 0.0 25 4.2 85 21.1 355 66.2 184 31.3 15 3.6 0 0.0
Bintulu - - 0 0.0 0 0.0 0 0.0 0 0.0 0 0.0 0 0.0 0 0.0
Bukit Mertajam 0 0.0 2 0.4 62 8.5 0 0.0 1 0.1 8 0.9 0 0.0 2 0.2
Sandakan NA NA 12 9.2 34 22.8 86 45.5 83 32.9 92 36.7 367 91.5 225 96.6
Ipoh 573 38.5 594 36.2 1137 56.7 1521 73.3 1348 81.7 2167 82.1 2,417 90.8 2,163 97.2
Kangar 0 0.0 0 0.0 3 0.8 3 0.8 0 0.0 0 0.0 0 0.0 0 0.0
Keningau - - 28 93.3 21 91.3 2 2.8 0 0.0 0 0.0 0 0.0 74 57.4
Kota Bharu 0 0.0 1 0.1 12 1.4 22 2.4 7 0.8 8 1.6 0 0.0 0 0.0
Kuala Krai 0 0.0 9 5.5 1 0.6 14 6.6 93 39.7 0 0.0 0 0.0 161 45.0
Kuala Lumpur NA NA 2 5.4 208 17.0 237 16.8 202 14.8 163 12.7 352 35.2 509 29.4
Kuala Pilah 0 0.0 1 0.4 0 0.0 9 3.0 38 8.2 51 12.2 236 50.0 103 22.4
Kuala Terengganu 75 15.2 99 14.2 274 39.3 402 59.9 445 61.8 434 60.5 765 80.6 650 77.6
Melaka 1075 73.1 1233 76.9 1014 76.9 1572 98.7 1549 98.6 1415 99.3 1,541 94.8 2,008 97.5
Miri 0 0.0 12 3.1 211 52.9 483 84.3 478 73.9 823 92.9 882 97.5 627 66.2
Muar 160 47.9 4 1.2 1 0.2 130 22.0 547 83.1 584 89.3 580 84.8 644 92.7
Pulau Pinang 8 0.8 560 44.4 814 64.1 1387 78.4 2002 92.4 1185 92.2 1,525 92.6 1,573 89.8
Putrajaya 0 0.0 0 0.0 0 0.0 0 0.0 3 1.0 1 0.3 4 1.1 4 1.1
Kota Kinabalu 242 48.7 221 65.8 265 65.8 416 79.7 582 89.4 624 87.4 791 85.7 796 83.1
Selayang 983 71.5 981 71.7 989 72.2 1142 69.4 1255 70.1 1262 71.9 969 74.1 600 76.8
Serdang 33 5.8 247 37.5 151 27.0 88 18.9 164 26.8 264 38.7 533 56.8 752 64.4
Sibu 0 0.0 0 0.0 173 45.1 347 77.1 450 89.6 736 99.3 889 99.6 843 98.8
Sri Manjung 11 7.5 201 58.4 298 92.0 353 92.9 365 88.8 418 93.9 781 98.9 587 98.3
Sultan Ismail 0 0.0 0 0.0 1 0.8 10 5.7 58 32.0 87 46.8 212 75.4 95 19.6
Johor Bahru 359 24.1 501 37.6 159 12.6 488 37.1 1034 97.5 1114 97.7 289 22.4 440 32.7
Sungai Buloh 27 22.1 15 6.1 6 1.8 33 8.0 76 18.9 105 24.2 62 12.9 193 32.6
Sungei Petani 0 0.0 0 0.0 0 0.0 240 45.9 640 82.9 633 78.6 711 81.1 756 85.7
Taiping 63 28.8 102 33.3 213 39.4 466 58.8 431 51.9 626 64.1 776 67.7 906 83.7
Tawau 0 0.0 0 0.0 0 0.0 0 0.0 0 0.0 0 0.0 94 19.5 112 21.3
Teluk Intan 469 70.6 152 27.0 287 48.0 258 38.9 152 23.6 12 2.0 17 1.6 33 3.3
Temerloh 27 6.5 103 20.0 234 37.3 21 5.0 39 6.0 226 27.0 337 39.7 243 23.8
Kuantan 4 21.1 40 13.6 2 0.9 9 2.0 7 1.2 0 0.0 0 0.0 49 10.6
Klang 210 25.6 566 52.1 427 57.7 480 56.7 751 81.0 981 79.4 1,298 94.8 1,138 91.0
Seremban 1 0.1 102 12.3 273 23.5 632 43.0 1059 69.0 999 68.9 980 67.8 1156 76.0
Kuching 528 55.8 733 75.9 714 84.0 1000 88.3 1061 96.5 1530 95.6 1,592 97.8 1,855 93.9
Kemaman
29 63.0 52 73.2
Sarikei
280 98.6 546 98.9
Kulim
- - 189 72.4
KK1M Pahang
16 25.0 - -
KK1M Terengganu
- - 28 80.0
KK1M Kelantan
- - 33 18.0
KK1M Sarawak
74 98.7 818 99.3
MAIWP
1,351 85.3 2,171 95.8

76
Table 1.3.7-12: Topical Anaesthesia by SDP (50 years and above), CSR 2007-2014
Year 2007 2008 2009 2010 2011 2012 2013 2014
n % n % n % n % n % n % n % n %
All Centres 4510 27.0 6274 33.1 7952 37.0 12473 49.9 16003 59.0 17557 61.2 21203 64.3 24071 66.7
Alor Setar 1 0.3 88 10.1 115 13.0 652 52.0 839 51.5 888 57.4 523 36.8 1064 61.6
Ampang 2 66.7 62 32.1 236 61.3 475 81.6 653 96.3 777 92.5 867 96.2 801 91.1
Batu Pahat 1 0.2 0 0.0 25 4.4 80 21.0 340 65.8 172 30.5 14 3.5 0 0.0
Bintulu - - 0 0.0 0 0.0 0 0.0 0 0.0 0 0.0 0 0.0 0 0.0
Bukit Mertajam 0 0.0 2 0.5 62 9.0 0 0.0 1 0.1 8 0.9 0 0.0 1 0.1
Sandakan - - 11 8.9 31 22.8 83 46.4 79 32.9 84 36.2 339 91.6 207 96.3
Ipoh 534 37.1 575 36.5 1090 56.5 1455 73.0 1309 81.8 2090 82.3 2,333 91.1 2,104 97.3
Kangar 0 0.0 0 0.0 3 0.8 3 0.8 0 0.0 0 0.0 0 0.0 0 0.0
Keningau - - 23 92.0 19 90.5 2 3.0 0 0.0 0 0.0 0 0.0 73 58.4
Kota Bharu 0 0.0 1 0.2 10 1.3 22 2.6 6 0.7 8 1.7 0 0.0 0 0.0
Kuala Krai 0 0.0 9 5.9 1 0.6 14 7.1 86 39.1 0 0.0 0 0.0 157 45.1
Kuala Lumpur - - 1 2.9 198 16.9 223 16.6 189 14.6 157 12.8 338 35.2 494 29.6
Kuala Pilah 0 0.0 0 0.0 0 0.0 9 3.1 38 8.5 49 12.2 229 50.7 101 22.5
Kuala Terengganu 68 14.4 94 14.3 259 39.4 373 59.6 423 61.8 408 60.6 732 81.2 615 77.4
Melaka 991 70.8 1151 75.9 951 76.5 1495 98.7 1483 98.5 1350 99.3 1,464 94.8 1,940 97.5
Miri 0 0.0 12 3.3 204 53.5 457 84.3 457 74.2 791 93.1 842 97.6 600 66.2
Muar 155 47.3 4 1.3 1 0.2 121 21.9 521 83.0 568 89.4 543 84.3 618 92.7
Pulau Pinang 7 0.7 543 44.4 789 63.9 1346 78.6 1931 92.8 1153 92.4 1,473 92.9 1,518 90.2
Putrajaya 0 0.0 0 0.0 0 0.0 0 0.0 2 0.7 1 0.3 4 1.1 4 1.2
Kota Kinabalu 210 45.5 204 66.2 241 65.8 390 80.4 546 89.5 583 87.8 745 85.8 754 82.7
Selayang 927 74.5 906 73.9 921 74.3 1080 71.7 1192 73.4 1185 72.9 907 75.0 568 78.8
Serdang 26 4.8 235 37.4 149 27.6 82 18.7 149 26.1 243 38.1 504 56.8 723 64.4
Sibu 0 0.0 0 0.0 163 45.7 328 77.9 419 89.5 695 99.3 833 99.6 801 98.8
Sri Manjung 10 7.0 184 58.2 284 91.6 341 92.7 350 89.1 406 94.0 761 98.8 581 98.3
Sultan Ismail 0 0.0 0 0.0 1 0.9 10 5.8 58 32.2 82 45.3 207 75.5 89 19.1
Johor Bahru 339 24.1 464 38.2 151 13.3 458 37.6 951 97.5 1016 98.0 271 22.8 414 32.6
Sungai Buloh 24 18.6 14 6.1 6 1.9 31 8.2 73 19.6 102 24.5 59 12.9 181 32.8
Sungei Petani 0 0.0 0 0.0 0 0.0 225 45.5 607 82.7 596 77.7 678 80.8 712 85.3
Taiping 61 24.0 102 34.6 205 39.3 447 59.0 409 51.7 605 63.8 744 67.1 879 83.7
Tawau 0 0.0 0 0.0 0 0.0 0 0.0 0 0.0 0 0.0 88 20.3 102 20.9
Teluk Intan 440 70.5 146 27.2 279 48.8 248 38.9 148 23.6 11 1.9 16 1.5 31 3.2
Temerloh 24 5.9 97 19.8 217 36.9 21 5.1 37 5.9 216 27.1 314 38.8 238 24.1
Kuantan 4 19.0 37 13.4 2 0.9 9 2.1 5 0.9 0 0.0 0 0.0 45 10.1
Klang 196 21.0 531 52.3 408 58.2 446 56.0 695 81.0 922 79.3 1,230 94.6 1,084 90.9
Seremban 1 0.1 97 12.3 255 23.3 602 43.1 1015 69.0 962 69.7 947 67.9 1103 75.5
Kuching 489 55.0 681 76.8 675 84.7 945 88.2 992 96.4 1429 95.6 1,514 98.2 1,770 94.4
Kemaman
27 61.4 49 74.2
Sarikei
267 98.9 536 98.9
Kulim
- - 179 71.6
KK1M Pahang
16 26.7 - -
KK1M Terengganu
- - 28 80.0
KK1M Kelantan
- - 33 18.6
KK1M Sarawak
73 98.6 794 99.4
MAIWP
1,301 85.6 2,080 95.9

77
Table 1.3.7-13: Types of Sedation in Eyes Given Local Anaesthesia by SDP, CSR 2014
Types of sedation
All Local
Anaesthesia
No Oral Intravenous Intramuscular
Alone Sedation Alone Alone
N n % n % n % n %
All Centres 37,654 19,249 51.1 1,823 4.8 36 0.1 1 0.0
Alor Setar 1,793 1,213 67.7 0 0.0 1 0.1 0 0.0
Ampang 908 109 12.0 0 0.0 0 0.0 0 0.0
Batu Pahat 452 339 75.0 4 0.9 0 0.0 0 0.0
Bintulu 374 374 100.0 0 0.0 0 0.0 0 0.0
Bukit Mertajam 966 325 33.6 108 11.2 7 0.7 0 0.0
Sandakan 233 2 0.9 0 0.0 0 0.0 0 0.0
Ipoh 2,225 577 25.9 3 0.1 3 0.1 0 0.0
Kangar 418 0 0.0 0 0.0 0 0.0 0 0.0
Keningau 129 121 93.8 0 0.0 1 0.8 0 0.0
Kota Bharu 275 268 97.5 0 0.0 0 0.0 0 0.0
Kuala Krai 358 222 62.0 1 0.3 0 0.0 0 0.0
Kuala Lumpur 1,734 146 8.4 10 0.6 1 0.1 0 0.0
Kuala Pilah 460 163 35.4 24 5.2 0 0.0 0 0.0
Kuala Terengganu 838 614 73.3 3 0.4 7 0.8 0 0.0
Melaka 2,059 1,858 90.2 2 0.1 1 0.0 0 0.0
Miri 947 38 4.0 0 0.0 1 0.1 0 0.0
Muar 695 674 97.0 0 0.0 1 0.1 0 0.0
Pulau Pinang 1,752 371 21.2 1227 70.0 1 0.1 0 0.0
Putrajaya 353 336 95.2 6 1.7 1 0.3 0 0.0
Kota Kinabalu 958 625 65.2 2 0.2 1 0.1 0 0.0
Selayang 781 351 44.9 0 0.0 0 0.0 0 0.0
Serdang 1168 964 82.5 1 0.1 1 0.1 1 0.1
Sibu 853 665 78.0 1 0.1 0 0.0 0 0.0
Sri Manjung 597 310 51.9 2 0.3 0 0.0 0 0.0
Sultan Ismail 484 452 93.4 0 0.0 0 0.0 0 0.0
Johor Bahru 1,345 9 0.7 0 0.0 0 0.0 0 0.0
Sungai Buloh 592 3 0.5 1 0.2 0 0.0 0 0.0
Sungei Petani 882 800 90.7 1 0.1 0 0.0 0 0.0
Taiping 1,082 1,080 99.8 0 0.0 0 0.0 0 0.0
Tawau 526 426 81.0 12 2.3 0 0.0 0 0.0
Teluk Intan 995 5 0.5 408 41.0 0 0.0 0 0.0
Temerloh 1019 478 46.9 4 0.4 9 0.9 0 0.0
Kuantan 464 360 77.6 0 0.0 0 0.0 0 0.0
Klang 1,251 211 16.9 0 0.0 0 0.0 0 0.0
Seremban 1,521 970 63.8 1 0.1 0 0.0 0 0.0
Kuching 1,975 1018 51.5 2 0.1 0 0.0 0 0.0
Kemaman 71 2 2.8 0 0.0 0 0.0 0 0.0
Sarikei 552 535 96.9 0 0.0 0 0.0 0 0.0
Kulim 261 88 33.7 0 0.0 0 0.0 0 0.0
KK1M Terengganu 35 17 48.6 0 0.0 0 0.0 0 0.0
KK1M Kelantan 183 51 27.9 0 0.0 0 0.0 0 0.0
KK1M Sarawak 824 514 62.4 0 0.0 0 0.0 0 0.0
MAIWP 2,266 1,565 69.1 0 0.0 0 0.0 0 0.0
Number or percentage may be more than total or 100% as patient might have more than one type of local Anaesthesia

78
Table 1.3.7-14: Types of Sedation in Eyes Given Local Anaesthesia by SDP (50 years and above), CSR 2014
Types of sedation
All Local
Anaesthesia
No Oral Intravenous Intramuscular
Alone Sedation Alone Alone
N n % n % n % n %
All Centres 36,107 18,485 51.2 1,755 4.9 26 0.1 1 0.0
Alor Setar 1,728 1,159 67.1 0 0.0 1 0.1 0 0.0
Ampang 879 105 11.9 0 0.0 0 0.0 0 0.0
Batu Pahat 439 330 75.2 3 0.7 0 0.0 0 0.0
Bintulu 341 341 100.0 0 0.0 0 0.0 0 0.0
Bukit Mertajam 929 313 33.7 104 11.2 6 0.6 0 0.0
Sandakan 215 1 0.5 0 0.0 0 0.0 0 0.0
Ipoh 2,163 563 26.0 3 0.1 2 0.1 0 0.0
Kangar 399 0 0.0 0 0.0 0 0.0 0 0.0
Keningau 125 120 96.0 0 0.0 0 0.0 0 0.0
Kota Bharu 254 247 97.2 0 0.0 0 0.0 0 0.0
Kuala Krai 348 217 62.4 1 0.3 0 0.0 0 0.0
Kuala Lumpur 1668 144 8.6 9 0.5 1 0.1 0 0.0
Kuala Pilah 449 161 35.9 20 4.5 0 0.0 0 0.0
Kuala Terengganu 795 590 74.2 3 0.4 2 0.3 0 0.0
Melaka 1,989 1,795 90.2 2 0.1 1 0.1 0 0.0
Miri 906 37 4.1 0 0.0 0 0.0 0 0.0
Muar 667 648 97.2 0 0.0 1 0.1 0 0.0
Pulau Pinang 1,682 357 21.2 1177 70.0 1 0.1 0 0.0
Putrajaya 340 323 95.0 6 1.8 1 0.3 0 0.0
Kota Kinabalu 912 595 65.2 2 0.2 1 0.1 0 0.0
Selayang 721 331 45.9 0 0.0 0 0.0 0 0.0
Serdang 1122 928 82.7 1 0.1 1 0.1 1 0.1
Sibu 811 634 78.2 1 0.1 0 0.0 0 0.0
Sri Manjung 591 308 52.1 2 0.3 0 0.0 0 0.0
Sultan Ismail 467 440 94.2 0 0.0 0 0.0 0 0.0
Johor Bahru 1,269 7 0.6 0 0.0 0 0.0 0 0.0
Sungai Buloh 552 1 0.2 1 0.2 0 0.0 0 0.0
Sungei Petani 835 758 90.8 1 0.1 0 0.0 0 0.0
Taiping 1,050 1,048 99.8 0 0.0 0 0.0 0 0.0
Tawau 487 392 80.5 12 2.5 0 0.0 0 0.0
Teluk Intan 973 5 0.5 400 41.1 0 0.0 0 0.0
Temerloh 989 467 47.2 4 0.4 8 0.8 0 0.0
Kuantan 447 346 77.4 0 0.0 0 0.0 0 0.0
Klang 1,192 201 16.9 0 0.0 0 0.0 0 0.0
Seremban 1,460 929 63.6 1 0.1 0 0.0 0 0.0
Kuching 1,875 974 51.9 2 0.1 0 0.0 0 0.0
Kemaman 66 1 1.5 0 0.0 0 0.0 0 0.0
Sarikei 542 525 96.9 0 0.0 0 0.0 0 0.0
Kulim 250 83 33.2 0 0.0 0 0.0 0 0.0
KK1M Terengganu 35 17 48.6 0 0.0 0 0.0 0 0.0
KK1M Kelantan 177 50 28.2 0 0.0 0 0.0 0 0.0
KK1M Sarawak 799 499 62.5 0 0.0 0 0.0 0 0.0
MAIWP 2,169 1,495 68.9 0 0.0 0 0.0 0 0.0

79
Table 1.3.7-15: Oral Sedation Alone by SDP, CSR 2007-2014
Year 2007 2008 2009 2010 2011 2012 2013 2014
n % n % n % n % n % n % n % n %
All Centres 2387 13.9 2923 14.5 3532 15.5 3171 12.0 2852 10.0 1810 6.0 1391 4.0 1823 4.8
Alor Setar 4 1.1 9 1.0 23 2.4 4 0.3 0 0.0 1 0.1 1 0.1 0 0.0
Ampang 0 0.0 0 0.0 1 0.2 3 0.5 0 0.0 3 0.3 2 0.2 0 0.0
Batu Pahat 0 0.0 1 0.2 3 0.5 1 0.2 1 0.2 1 0.2 4 1.0 4 0.9
Bintulu - - 7 24.1 29 24.4 32 12.5 4 1.2 0 0.0 1 0.3 0 0.0
Bukit Mertajam 204 33.6 356 77.6 466 63.8 308 39.2 185 23.7 107 12.0 66 7.4 108 11.3
Sandakan - - 0 0.0 0 0.0 1 0.5 0 0.0 0 0.0 0 0.0 0 0.0
Ipoh 7 0.5 6 0.4 9 0.4 13 0.6 11 0.7 2 0.1 7 0.3 3 0.1
Kangar 4 1.3 0 0.0 0 0.0 0 0.0 0 0.0 0 0.0 0 0.0 0 0.0
Keningau - - 1 3.3 0 0.0 1 1.4 2 4.5 0 0.0 0 0.0 0 0.0
Kota Bharu 5 0.7 5 0.7 15 1.8 5 0.6 1 0.1 0 0.0 0 0.0 0 0.0
Kuala Krai 3 2.6 11 6.7 0 0.0 0 0.0 0 0.0 0 0.0 0 0.0 1 0.3
Kuala Lumpur NA NA 0 0.0 1 0.1 1 0.1 2 0.1 15 1.2 32 3.2 10 0.6
Kuala Pilah 99 47.4 97 35.1 205 73.0 77 25.8 211 45.3 96 23.0 22 4.7 24 5.2
Kuala Terengganu 16 3.3 2 0.3 72 10.3 104 15.5 15 2.1 23 3.3 2 0.2 3 0.4
Melaka 0 0.0 2 0.1 7 0.5 0 0.0 0 0.0 0 0.0 1 0.1 2 0.1
Miri 0 0.0 0 0.0 0 0.0 1 0.2 3 0.5 0 0.0 0 0.0 0 0.0
Muar 4 1.2 0 0.0 0 0.0 4 0.7 0 0.0 0 0.0 0 0.0 0 0.0
Pulau Pinang 847 85.5 1124 89.2 1018 80.2 1339 75.6 1382 63.8 662 51.6 818 49.7 1227 70.1
Putrajaya 0 0.0 1 0.4 0 0.0 0 0.0 0 0.0 4 1.2 6 1.6 6 1.7
Kota Kinabalu 0 0.0 0 0.0 0 0.0 0 0.0 5 0.8 0 0.0 1 0.1 2 0.2
Selayang 13 0.9 2 0.1 10 0.7 13 0.8 6 0.3 1 0.1 3 0.2 0 0.0
Serdang 2 0.4 0 0.0 0 0.0 3 0.6 0 0.0 0 0.0 5 0.5 1 0.1
Sibu 323 94.2 57 23.1 141 36.7 39 8.7 24 4.8 1 0.1 0 0.0 1 0.1
Sri Manjung 3 2.0 0 0.0 0 0.0 0 0.0 0 0.0 1 0.2 1 0.1 2 0.3
Sultan Ismail 0 0.0 0 0.0 0 0.0 0 0.0 0 0.0 0 0.0 0 0.0 0 0.0
Johor Bahru 188 12.6 212 15.9 57 4.5 4 0.3 0 0.0 0 0.0 0 0.0 0 0.0
Sungai Buloh 1 0.8 1 0.4 4 1.2 0 0.0 1 0.2 0 0.0 0 0.0 1 0.2
Sungei Petani 253 53.0 487 80.9 578 88.8 443 84.7 281 36.4 11 1.4 4 0.5 1 0.1
Taiping 7 3.2 20 6.5 0 0.0 0 0.0 1 0.1 0 0.0 0 0.0 0 0.0
Tawau 0 0.0 0 0.0 0 0.0 0 0.0 0 0.0 0 0.0 3 0.6 12 2.3
Teluk Intan 0 0.0 158 28.0 366 61.2 356 53.7 95 14.7 353 59.7 247 23.0 408 41.0
Temerloh 400 96.9 357 69.2 511 81.5 414 97.6 613 94.3 526 63.1 153 18.0 4 0.4
Kuantan 0 0.0 0 0.0 0 0.0 2 0.4 5 0.8 0 0.0 1 0.2 0 0.0
Klang 1 0.1 2 0.2 0 0.0 0 0.0 0 0.0 0 0.0 1 0.1 0 0.0
Seremban 3 0.3 5 0.6 14 1.2 2 0.1 4 0.3 2 0.1 1 0.1 1 0.1
Kuching 0 0.0 0 0.0 2 0.2 1 0.1 0 0.0 1 0.1 0 0.0 2 0.1
Kemaman
0 0.0 0 0.0
Sarikei
0 0.0 0 0.0
Kulim
- - 0 0.0
KK1M Pahang
9 14.1 - -
KK1M Terengganu
- - 0 0.0
KK1M Kelantan
- - 0 0.0
KK1M Sarawak
0 0.0 0 0.0
MAIWP
0 0.0 0 0.0

80
Table 1.3.7-16: Oral Sedation Alone by SDP (50 years and above), CSR 2007-2014
Year 2007 2008 2009 2010 2011 2012 2013 2014
n % n % n % n % n % n % n % n %
All Centres 2264 13.5 2798 14.8 3355 15.6 3055 12.2 2731 10.1 1748 6.1 1339 4.1 1755 4.9
Alor Setar 4 1.1 9 1.0 23 2.6 4 0.3 0 0.0 1 0.1 1 0.1 0 0.0
Ampang 0 0.0 0 0.0 1 0.3 3 0.5 0 0.0 3 0.4 2 0.2 0 0.0
Batu Pahat 0 0.0 0 0.0 2 0.4 1 0.3 1 0.2 0 0.0 4 1.0 3 0.7
Bintulu - - 7 28.0 25 23.4 31 13.5 4 1.3 0 0.0 1 0.3 0 0.0
Bukit Mertajam 198 32.1 340 78.2 437 63.2 284 38.7 174 23.4 102 12.0 63 7.5 104 11.3
Sandakan - - 0 0.0 0 0.0 1 0.6 0 0.0 0 0.0 0 0.0 0 0.0
Ipoh 6 0.4 6 0.4 9 0.5 13 0.7 9 0.6 2 0.1 6 0.2 3 0.1
Kangar 3 1.0 0 0.0 0 0.0 0 0.0 0 0.0 0 0.0 0 0.0 0 0.0
Keningau - - 1 4.0 0 0.0 1 1.5 2 4.9 0 0.0 0 0.0 0 0.0
Kota Bharu 5 0.7 4 0.6 14 1.8 5 0.6 1 0.1 0 0.0 0 0.0 0 0.0
Kuala Krai 3 2.6 11 7.2 0 0.0 0 0.0 0 0.0 0 0.0 0 0.0 1 0.3
Kuala Lumpur - - 0 0.0 1 0.1 1 0.1 2 0.2 14 1.1 31 3.2 9 0.5
Kuala Pilah 95 47.5 92 35.9 194 72.4 75 26.2 200 44.6 92 22.8 21 4.6 20 4.5
Kuala Terengganu 16 3.4 2 0.3 65 9.9 98 15.7 14 2.0 21 3.1 2 0.2 3 0.4
Melaka 0 0.0 2 0.1 7 0.6 0 0.0 0 0.0 0 0.0 1 0.1 2 0.1
Miri 0 0.0 0 0.0 0 0.0 1 0.2 3 0.5 0 0.0 0 0.0 0 0.0
Muar 4 1.2 0 0.0 0 0.0 4 0.7 0 0.0 0 0.0 0 0.0 0 0.0
Pulau Pinang 809 79.7 1092 89.2 992 80.4 1300 75.9 1331 64.0 648 51.9 789 49.7 1177 70.0
Putrajaya 0 0.0 1 0.4 0 0.0 0 0.0 0 0.0 3 0.9 4 1.1 6 1.8
Kota Kinabalu 0 0.0 0 0.0 0 0.0 0 0.0 5 0.8 0 0.0 1 0.1 2 0.2
Selayang 9 0.7 2 0.2 9 0.7 12 0.8 5 0.3 1 0.1 2 0.2 0 0.0
Serdang 2 0.4 0 0.0 0 0.0 3 0.7 0 0.0 0 0.0 5 0.6 1 0.1
Sibu 307 89.0 53 23.2 131 36.7 36 8.6 23 4.9 1 0.1 0 0.0 1 0.1
Sri Manjung 3 2.1 0 0.0 0 0.0 0 0.0 0 0.0 1 0.2 1 0.1 2 0.3
Sultan Ismail 0 0.0 0 0.0 0 0.0 0 0.0 0 0.0 0 0.0 0 0.0 0 0.0
Johor Bahru 173 12.3 200 16.4 52 4.6 4 0.3 0 0.0 0 0.0 0 0.0 0 0.0
Sungai Buloh 1 0.8 1 0.4 4 1.3 0 0.0 1 0.3 0 0.0 0 0.0 1 0.2
Sungei Petani 237 51.4 456 81.3 546 88.5 421 85.1 265 36.1 11 1.4 3 0.4 1 0.1
Taiping 7 2.8 19 6.4 0 0.0 0 0.0 1 0.1 0 0.0 0 0.0 0 0.0
Tawau 0 0.0 0 0.0 0 0.0 0 0.0 0 0.0 0 0.0 3 0.7 12 2.5
Teluk Intan 0 0.0 153 28.5 346 60.5 347 54.5 92 14.7 342 59.6 242 23.2 400 41.1
Temerloh 379 92.4 340 69.2 482 82.0 405 97.6 590 94.6 503 63.2 145 17.9 4 0.4
Kuantan 0 0.0 0 0.0 0 0.0 2 0.5 5 0.9 0 0.0 1 0.2 0 0.0
Klang 1 0.1 2 0.2 0 0.0 0 0.0 0 0.0 0 0.0 1 0.1 0 0.0
Seremban 2 0.2 5 0.6 13 1.2 2 0.1 3 0.2 2 0.1 1 0.1 1 0.1
Kuching 0 0.0 0 0.0 2 0.3 1 0.1 0 0.0 1 0.1 0 0.0 2 0.1
Kemaman
0 0.0 0 0.0
Sarikei
0 0.0 0 0.0
Kulim
- - 0 0.0
KK1M Pahang
9 15.0 - -
KK1M Terengganu
- - 0 0.0
KK1M Kelantan
- - 0 0.0
KK1M Sarawak
0 0.0 0 0.0
MAIWP
0 0.0 0 0.0

81
Table 1.3.7-17: Intravenous Sedation Alone by SDP, CSR 2007-2014
Year 2007 2008 2009 2010 2011 2012 2013 2014
n % n % n % n % n % n % n % n %
All Centres 72 0.4 37 0.2 35 0.2 22 0.1 27 0.1 36 0.1 31 0.1 36 0.1
Alor Setar 1 0.3 1 0.1 0 0.0 1 0.1 0 0.0 5 0.3 1 0.1 1 0.1
Ampang 0 0.0 0 0.0 0 0.0 1 0.2 0 0.0 0 0.0 0 0.0 0 0.0
Batu Pahat 0 0.0 0 0.0 0 0.0 0 0.0 0 0.0 0 0.0 0 0.0 0 0.0
Bintulu - - 0 0.0 0 0.0 0 0.0 0 0.0 0 0.0 0 0.0 0 0.0
Bukit Mertajam 2 0.3 0 0.0 2 0.3 3 0.4 0 0.0 10 1.3 3 0.3 7 0.8
Sandakan - - 0 0.0 0 0.0 0 0.0 0 0.0 0 0.0 0 0.0 0 0.0
Ipoh 6 0.4 8 0.5 6 0.3 1 0.0 4 0.2 3 0.1 2 0.1 3 0.1
Kangar 0 0.0 0 0.0 0 0.0 0 0.0 0 0.0 0 0.0 0 0.0 0 0.0
Keningau - - 0 0.0 0 0.0 3 4.2 6 13.6 0 0.0 0 0.0 1 0.8
Kota Bharu 5 0.7 2 0.3 6 0.7 2 0.2 0 0.0 0 0.0 1 0.2 0 0.0
Kuala Krai 0 0.0 0 0.0 0 0.0 0 0.0 1 0.4 0 0.0 0 0.0 0 0.0
Kuala Lumpur NA NA 0 0.0 1 0.1 0 0.0 1 0.1 0 0.0 1 0.1 1 0.1
Kuala Pilah 0 0.0 0 0.0 0 0.0 0 0.0 0 0.0 1 0.3 0 0.0 0 0.0
Kuala Terengganu 7 1.4 14 2.0 7 1.0 5 0.7 13 1.8 12 1.7 7 0.7 7 0.8
Melaka 1 0.1 0 0.0 0 0.0 0 0.0 0 0.0 0 0.0 0 0.0 1 0.0
Miri 0 0.0 0 0.0 0 0.0 0 0.0 0 0.0 0 0.0 0 0.0 1 0.1
Muar 0 0.0 0 0.0 0 0.0 0 0.0 0 0.0 0 0.0 0 0.0 1 0.1
Pulau Pinang 3 0.3 4 0.3 0 0.0 0 0.0 0 0.0 2 0.3 1 0.1 1 0.2
Putrajaya 0 0.0 0 0.0 2 0.8 0 0.0 0 0.0 0 0.0 1 0.3 1 0.3
Kota Kinabalu 0 0.0 0 0.0 0 0.0 1 0.2 0 0.0 0 0.0 0 0.0 1 0.1
Selayang 33 2.4 0 0.0 3 0.2 0 0.0 0 0.0 0 0.0 0 0.0 0 0.0
Serdang 0 0.0 0 0.0 0 0.0 0 0.0 0 0.0 0 0.0 2 0.2 1 0.1
Sibu 1 0.3 0 0.0 0 0.0 0 0.0 0 0.0 0 0.0 0 0.0 0 0.0
Sri Manjung 0 0.0 0 0.0 0 0.0 0 0.0 1 0.2 0 0.0 0 0.0 0 0.0
Sultan Ismail 0 0.0 0 0.0 0 0.0 0 0.0 0 0.0 0 0.0 0 0.0 0 0.0
Johor Bahru 0 0.0 0 0.0 4 0.3 0 0.0 0 0.0 0 0.0 0 0.0 0 0.0
Sungai Buloh 0 0.0 0 0.0 0 0.0 0 0.0 0 0.0 0 0.0 0 0.0 0 0.0
Sungei Petani 1 0.2 0 0.0 0 0.0 0 0.0 0 0.0 0 0.0 0 0.0 0 0.0
Taiping 0 0.0 0 0.0 0 0.0 0 0.0 0 0.0 0 0.0 0 0.0 0 0.0
Tawau 0 0.0 1 0.3 0 0.0 0 0.0 0 0.0 0 0.0 0 0.0 0 0.0
Teluk Intan 0 0.0 1 0.2 0 0.0 2 0.3 0 0.0 0 0.0 0 0.0 0 0.0
Temerloh 0 0.0 2 0.4 1 0.2 0 0.0 1 0.2 2 0.6 7 0.8 9 0.9
Kuantan 0 0.0 0 0.0 0 0.0 2 0.4 0 0.0 0 0.0 0 0.0 0 0.0
Klang 11 1.3 3 0.3 2 0.3 0 0.0 0 0.0 1 0.1 0 0.0 0 0.0
Seremban 1 0.1 1 0.1 1 0.1 0 0.0 0 0.0 0 0.0 0 0.0 0 0.0
Kuching 0 0.0 0 0.0 0 0.0 1 0.1 0 0.0 0 0.0 0 0.0 0 0.0
Kemaman
1 2.2 0 0.0
Sarikei
2 0.7 0 0.0
Kulim
- - 0 0.0
KK1M Pahang
1 1.6 - -
KK1M Terengganu
- - 0 0.0
KK1M Kelantan
- - 0 0.0
KK1M Sarawak
0 0.0 0 0.0
MAIWP
1 0.1 0 0.0

82
Table 1.3.7-18: Intravenous Sedation Alone by SDP (50 years and above), CSR 2007-2014
Year 2007 2008 2009 2010 2011 2012 2013 2014
n % n % n % n % n % n % n % n %
All Centres 55 0.3 37 0.2 29 0.1 18 0.1 23 0.1 34 0.1 28 0.1 26 0.1
Alor Setar 0 0.0 1 0.1 0 0.0 1 0.1 0 0.0 4 0.3 1 0.1 1 0.1
Ampang 0 0.0 0 0.0 0 0.0 1 0.2 0 0.0 0 0.0 0 0.0 0 0.0
Batu Pahat 0 0.0 0 0.0 0 0.0 0 0.0 0 0.0 0 0.0 0 0.0 0 0.0
Bintulu - - 0 0.0 0 0.0 0 0.0 0 0.0 0 0.0 0 0.0 0 0.0
Bukit Mertajam 2 0.3 0 0.0 2 0.3 2 0.3 0 0.0 10 1.2 3 0.4 6 0.7
Sandakan - - 0 0.0 0 0.0 0 0.0 0 0.0 0 0.0 0 0.0 0 0.0
Ipoh 4 0.3 8 0.5 6 0.3 1 0.1 3 0.2 3 0.1 2 0.1 2 0.1
Kangar 0 0.0 0 0.0 0 0.0 0 0.0 0 0.0 0 0.0 0 0.0 0 0.0
Keningau - - 0 0.0 0 0.0 3 4.5 5 12.2 0 0.0 0 0.0 0 0.0
Kota Bharu 5 0.7 2 0.3 5 0.6 1 0.1 0 0.0 0 0.0 0 0.0 0 0.0
Kuala Krai 0 0.0 0 0.0 0 0.0 0 0.0 0 0.0 0 0.0 0 0.0 0 0.0
Kuala Lumpur - - 0 0.0 1 0.1 0 0.0 1 0.1 0 0.0 0 0.0 1 0.1
Kuala Pilah 0 0.0 0 0.0 0 0.0 0 0.0 0 0.0 1 0.2 0 0.0 0 0.0
Kuala Terengganu 5 1.1 14 2.1 4 0.6 5 0.8 12 1.8 11 1.6 6 0.7 2 0.3
Melaka 1 0.1 0 0.0 0 0.0 0 0.0 0 0.0 0 0.0 0 0.0 1 0.1
Miri 0 0.0 0 0.0 0 0.0 0 0.0 0 0.0 0 0.0 0 0.0 0 0.0
Muar 0 0.0 0 0.0 0 0.0 0 0.0 0 0.0 0 0.0 0 0.0 1 0.1
Pulau Pinang 3 0.3 4 0.3 0 0.0 0 0.0 0 0.0 2 0.2 1 0.1 1 0.2
Putrajaya 0 0.0 0 0.0 2 0.9 0 0.0 0 0.0 0 0.0 1 0.3 1 0.3
Kota Kinabalu 0 0.0 0 0.0 0 0.0 1 0.2 0 0.0 0 0.0 0 0.0 1 0.1
Selayang 23 1.8 0 0.0 3 0.2 0 0.0 0 0.0 0 0.0 0 0.0 0 0.0
Serdang 0 0.0 0 0.0 0 0.0 0 0.0 0 0.0 0 0.0 2 0.2 1 0.1
Sibu 1 0.3 0 0.0 0 0.0 0 0.0 0 0.0 0 0.0 0 0.0 0 0.0
Sri Manjung 0 0.0 0 0.0 0 0.0 0 0.0 1 0.3 0 0.0 0 0.0 0 0.0
Sultan Ismail 0 0.0 0 0.0 0 0.0 0 0.0 0 0.0 0 0.0 0 0.0 0 0.0
Johor Bahru 0 0.0 0 0.0 3 0.3 0 0.0 0 0.0 0 0.0 0 0.0 0 0.0
Sungai Buloh 0 0.0 0 0.0 0 0.0 0 0.0 0 0.0 0 0.0 0 0.0 0 0.0
Sungei Petani 1 0.2 0 0.0 0 0.0 0 0.0 0 0.0 0 0.0 0 0.0 0 0.0
Taiping 0 0.0 0 0.0 0 0.0 0 0.0 0 0.0 0 0.0 0 0.0 0 0.0
Tawau 0 0.0 1 0.4 0 0.0 0 0.0 0 0.0 0 0.0 0 0.0 0 0.0
Teluk Intan 0 0.0 1 0.2 0 0.0 1 0.2 0 0.0 0 0.0 0 0.0 0 0.0
Temerloh 0 0.0 2 0.4 0 0.0 0 0.0 1 0.2 2 0.3 7 0.9 8 0.8
Kuantan 0 0.0 0 0.0 0 0.0 2 0.5 0 0.0 0 0.0 0 0.0 0 0.0
Klang 9 1.0 3 0.3 2 0.3 0 0.0 0 0.0 1 0.1 0 0.0 0 0.0
Seremban 1 0.1 1 0.1 1 0.1 0 0.0 0 0.0 0 0.0 0 0.0 0 0.0
Kuching 0 0.0 0 0.0 0 0.0 0 0.0 0 0.0 0 0.0 0 0.0 0 0.0
Kemaman
1 2.3 0 0.0
Sarikei
2 0.7 0 0.0
Kulim
- - 0 0.0
KK1M Pahang
1 1.7 - -
KK1M Terengganu
- - 0 0.0
KK1M Kelantan
- - 0 0.0
KK1M Sarawak
0 0.0 0 0.0
MAIWP
1 0.1 0 0.0
1.3.8 Intraocular Lens (IOL)
In 2012 the percentage of eyes with IOL implantation was 98.5%. Out of this proportion, 95.9% had posterior chamber
IOL.
The material and type of IOL used demonstrated a shift from PMMA to Acrylic and from non-foldable to foldable. This
pattern was consistent with the shift from ECCE to Phaco as the preferred method of cataract surgery.

83
Table 1.3.8-1: IOL Implantation, CSR 2007-2014
Year 2007 2008 2009 2010 2011 2012 2013 2014
No of patients
(N) 18426 21496 24438 28506 30611 32473 37150 40532
n % n % n % n % n % n % n % n %
With IOL 17873 97.0 21115 98.2 23982 98.1 27980 98.1 30061 98.2 31991 98.5 36545 98.4 40006 98.7
Without IOL 553 3.0 375 1.7 423 1.7 502 1.8 487 1.6 419 1.3 431 1.2 495 1.2
Not Available - - 6 0.0 33 0.1 24 0.1 63 0.2 63 0.2 174 0.5 31 0.1
IOL Placement
No of IOL 17873 21115 23982 27980 30061 31991 36545 40006
PCIOL 17350 97.1 20342 96.3 23032 96 26932 96.3 28963 96.3 30683 95.9 35194 96.3 38453 96.1
ACIOL 482 2.7 454 2.2 570 2.4 543 1.9 573 1.9 575 1.8 595 1.6 633 1.6
Scleral Fixated
IOL 35 0.2 36 0.2 21 0.1 20 0.1 21 0.1 15 0.0 25 0.1 29 0.1
Others 6 0.0 14 0.1 22 0.1 21 0.1 44 0.1 53 0.2 59 0.2 94 0.2
Not Available
/missing - - 269 1.3 337 1.4 464 1.7 460 1.5 665 2.1 672 1.8 797 2.0
Materials of IOL
No of IOL 17873 21115 23982 27980 30061 31991 36545 40006
1. Acrylic 11955 66.9 15382 72.8 19160 79.9 24270 86.7 26917 89.5 28861 90.2 32798 89.7 37056 92.6
2. PMMA 5547 31.0 5300 25.1 4313 18.0 3259 11.6 2603 8.7 2295 7.2 2083 5.7 1736 4.3
3. Silicone 97 0.5 113 0.5 137 0.6 75 0.3 110 0.4 117 0.4 347 0.9 143 0.4
4. Others 74 0.4 19 0.1 58 0.2 32 0.1 37 0.1 84 0.3 75 0.2 115 0.3
Not Available/
missing 200 1.1 301 1.4 314 1.3 344 1.2 394 1.3 634 2.0 1242 3.4 956 2.4
Types of IOL
No of IOL 17873 21115 23982 27980 30061 31991 36545 40006
1. Foldable 11972 67.0 15320 72.6 19093 79.6 24036 85.9 26553 88.3 29107 91.0 33987 93.0 37536 93.8
2. Non-foldable 5590 31.3 5316 25.2 4280 17.8 3231 11.5 2694 9.0 2345 7.3 1929 5.3 1820 4.5
Not Available/
missing 311 1.7 479 2.3 609 2.5 713 2.5 814 2.7 539 1.7 629 1.7 650 1.6
66.9 72.8
79.9
86.7 89.5 90.2 89.7
92.6
54.4
31.0 25.1
18.0 11.6
8.7 7.2 5.7 4.3 6.0 0.5 0.5 0.6 0.3 0.4 0.4 0.9 0.4 0.1 0.4 0.1 0
10
20
30
40
50
60
70
80
90
100
2004 2007 2008 2009 2010 2011 2012 2013 2014
%
Year
Acrylic
PMMA
Silicone
Others
Figure 1.3.8-1: Intraocular Lens Implantation, CSR 2002-2014

84
Table 1.3.8-2: Distribution of IOL Placement by SDP, CSR 2014
Cataract Surgery With IOL
Posterior Chamber IOL Anterior Chamber IOL Scleral Fixated IOL
N n % n % n %
All Centres 40006 38453 96.1 633 1.6 29 0.1
Alor Setar 2050 1989 97.0 24 1.2 0 0.0
Ampang 944 889 94.2 28 3.0 0 0.0
Batu Pahat 464 446 96.1 17 3.7 0 0.0
Bintulu 372 361 97.0 4 1.1 0 0.0
Bukit Mertajam 997 976 97.9 1 0.1 0 0.0
Sandakan 235 234 99.6 0 0.0 0 0.0
Ipoh 2728 2496 91.5 19 0.7 2 0.1
Kangar 418 383 91.6 27 6.5 0 0.0
Keningau 133 131 98.5 1 0.8 0 0.0
Kota Bharu 283 274 96.8 2 0.7 5 1.8
Kuala Krai 356 344 96.6 8 2.2 0 0.0
Kuala Lumpur 1906 1822 95.6 25 1.3 1 0.1
Kuala Pilah 493 474 96.1 12 2.4 0 0.0
Kuala Terengganu 865 831 96.1 21 2.4 0 0.0
Melaka 2113 2069 97.9 13 0.6 3 0.1
Miri 942 935 99.3 4 0.4 0 0.0
Muar 714 686 96.1 19 2.7 5 0.7
Pulau Pinang 1768 1719 97.2 11 0.6 0 0.0
Putrajaya 365 350 95.9 15 4.1 0 0.0
Kota Kinabalu 1021 970 95.0 34 3.3 3 0.3
Selayang 890 832 93.5 33 3.7 0 0.0
Serdang 1249 1207 96.6 24 1.9 0 0.0
Sibu 859 827 96.3 26 3.0 0 0.0
Sri Manjung 621 616 99.2 2 0.3 0 0.0
Sultan Ismail 604 591 97.8 5 0.8 2 0.3
Johor Bahru 1376 1330 96.7 31 2.3 0 0.0
Sungai Buloh 691 666 96.4 5 0.7 0 0.0
Sungei Petani 1003 963 96.0 16 1.6 0 0.0
Taiping 1228 1213 98.8 13 1.1 1 0.1
Tawau 530 504 95.1 15 2.8 0 0.0
Teluk Intan 1006 977 97.1 14 1.4 2 0.2
Temerloh 1032 1003 97.2 16 1.6 0 0.0
Kuantan 575 536 93.2 9 1.6 0 0.0
Klang 1458 1349 92.5 34 2.3 0 0.0
Seremban 1567 1511 96.4 37 2.4 1 0.1
Kuching 1981 1893 95.6 21 1.1 2 0.1
Kemaman 71 59 83.1 1 1.4 0 0.0
Sarikei 554 551 99.5 3 0.5 0 0.0
Kulim 259 254 98.1 3 1.2 0 0.0
KK1M Terengganu 36 34 94.4 0 0.0 0 0.0
KK1M Kelantan 185 174 94.1 4 2.2 0 0.0
KK1M Sarawak 805 766 95.2 0 0.0 0 0.0
MAIWP 2259 2218 98.2 36 1.6 2 0.1
1.4 Intra-operative Complications
The rate of occurrence of PCR was maintained throughout the years. The more serious complications such as
nucleus drop (or dropped nucleus) and suprachoroidal haemorrhage were not frequent and the trend remained
unchanged.

85
1.4.1 Intra-operative Complications
Table 1.4.1-1: Distribution of Type of Intra-operative Complications, CSR 2007-2014
Year 2007 2008 2009 2010 2011 2012 2013 2014
No. of patients (N) 18380 21496 24438 28506 30611 32473 37150 40532
n % n % n % n % n % n % n % n %
Patient with intra-op complication 1999 10.9 1636 7.6 1645 6.7 1610 5.6 1787 5.8 1702 5.2 1998 5.4 2159 5.3
Types of complications
PCR 764 4.2 798 3.7 858 3.5 840 2.9 936 3.1 870 2.7 1017 2.7 1100 2.7
Vitreous loss 569 3.1 608 2.8 642 2.6 639 2.2 611 2.0 529 1.6 644 1.7 661 1.6
Zonular dehiscence 275 1.5 322 1.5 372 1.5 377 1.3 362 1.2 359 1.1 391 1.0 467 1.2
Drop nucleus 21 0.1 33 0.2 40 0.2 38 0.1 58 0.2 56 0.2 63 0.2 87 0.2
Suprachoroidal haemorrhage 9 0.0 10 0.0 13 0.1 9 0.0 8 0.0 8 0.0 8 0.0 4 0.0
Central corneal oedema 58 0.3 27 0.1 22 0.1 26 0.1 36 0.1 30 0.1 23 0.1 36 0.1
Others 350 1.9 361 1.7 373 1.5 338 1.2 449 1.5 439 1.3 572 1.5 550 1.4
Table 1.4.1-2: Distribution of Type of Intra-operative Complications (Posterior Capsular Rupture) CSR 2007-2014
Year 2007* 2008 2009 2010 2011 2012 2013 2014
No. of patients (N) 18380 21496 24438 28506 30611 32473 37150 40532
n % n % n % n % n % n % n % n %
Patient with intra-op complication 1999 10.9 1636 7.6 1645 6.7 1610 5.6 1787 5.8 1702 5.2 1998 5.4 2159 5.3
Types of complications
PCR and Others 764 4.2 798 3.7 858 3.5 840 2.9 936 3.1 870 2.7 1017 2.7 1100 2.7
PCR Only 347 1.6 403 1.6 402 1.4 485 1.6 481 1.5 547 1.5 588 1.4
*Data from 2007 could not be analyzed due to improperly organized old data.
PCR and Others = including PCR only, and PCR+Others
0
1
1
2
2
3
3
4
4
5
2007 2008 2009 2010 2011 2012 2013 2014
%
Year
PCR
Vitreous loss
Zonular dehiscence
Drop nucleus
Suprachoroidal haemorrhage
Central corneal oedema
Others
Figure 1.4.1-1: Distribution of Specific Type of Intra-operative Complications, CSR 2002-2014
1.4.2 Intra-operative Complications by Type of Cataract Surgery
Similar to previous years, phacoemulsification demonstrated the lowest rate of intra-operative complications in 2014. It
was followed by lens aspiration and ECCE. The percentage of intra-operative complications in phacoemulsification
remained the same, whereas the percentage of complications was higher in 2014 in ECCE compared to the previous
years.

86
Table 1.4.2-1: Intra-operative Complications by Types of Cataract Surgery, CSR 2007-2014
Year 2007 2008 2009 2010
n % n % N n % N n %
Phaco 969 8.1 753 5.1 17717 787 4.4 21810 798 3.7
ECCE 691 12.5 532 9.5 5457 460 8.4 5363 442 8.2
Lens Aspiration 51 15.8 31 9.1 400 38 9.5 451 34 7.5
ICCE 63 44.7 60 46.5 134 64 47.8 143 64 44.8
Phaco → ECCE 225 52.1 240 45.8 573 276 48.2 586 249 42.5
Others - - 16 25.8 74 8 10.8 104 20 19.2
Missing 9 20.0 4 12.1 83 12 14.5 49 3 6.1
Year 2011 2012 2013 2014
N n % N n % N n % N n %
Phaco 23872 927 3.9 26345 930 3.5 31625 1112 3.5 35429 1282 3.6
ECCE 5291 404 7.6 4784 359 7.5 4086 373 9.1 3613 340 9.4
Lens Aspiration 460 29 6.3 444 26 5.9 364 31 8.5 370 23 6.2
ICCE 123 53 43.1 136 58 42.6 173 68 39.3 176 70 39.8
Phaco → ECCE 652 316 48.5 621 300 48.3 769 383 49.8 805 402 49.9
Others 132 21 15.9 110 27 24.5 84 20 23.8 118 37 31.4
Missing 81 37 45.7 33 2 6.1 49 11 22.4 21 5 23.8
0
10
20
30
40
50
60
2007 2008 2009 2010 2011 2012 2013 2014
%
Year
Phaco
ECCE
Lens Aspiration
ICCE
Phaco → ECCE
Others
Figure 1.4.2-1: Intra-operative Complications by Type of Cataract Surgery, CSR 2007-2014

87
Table 1.4.2-2: Types Intra-operative Complications by Types of Cataract Surgery, CSR 2014
All
Surgeries Phaco ECCE
Lens
Aspiration ICCE
Phaco
converted
to ECCE
Others
Number of patients (N) 40532 35429 3613 370 176 805 118
n % n % n % n % n % n % n %
Any intra-op
complication 2159 5.3 1282 3.6 340 9.4 23 6.2 70 39.8 402 49.9 37 31.4
Posterior capsule
rupture 1100 2.7 731 2.1 133 3.7 10 2.7 9 5.1 205 25.5 10 8.5
Vitreous loss 661 1.6 301 0.8 110 3.0 6 1.6 47 26.7 182 22.6 14 11.9
Zonular dehiscence 467 1.2 203 0.6 82 2.3 2 0.5 34 19.3 132 16.4 14 11.9
Nucleus drop (or
dropped nucleus) 87 0.2 72 0.2 0 0.0 0 0.0 0 0.0 13 1.6 2 1.7
Suprachoroidal
haemorrhage 4 0.0 0 0.0 3 0.1 0 0.0 0 0.0 1 0.1 0 0.0
Central corneal
oedema 36 0.1 21 0.1 9 0.2 0 0.0 0 0.0 5 0.6 1 0.8
Others 550 1.4 326 0.9 120 3.3 11 3.0 8 4.5 74 9.2 8 6.8
Table 1.4.2-3: Distribution of the Types Intra-operative Complications by SDP (All Cataract Surgeries), CSR 2014
Hospital No. of
patients
(N)
Any intra-op
complication PCR
Vitreous
loss
Zonular
Dehiscence
Nucleus drp
(or dropped
nucleus)
Suprachoroidal
Haemorrhage
Central
Corneal
Edema
Others
n % n % n % n % n % n % n % n %
All centre 40532 2159 5.3 1100 2.7 661 1.6 467 1.2 87 0.2 4 0.0 36 0.1 550 1.4
Alor Setar 2106 80 3.8 53 2.5 25 1.2 12 0.6 4 0.2 0 0.0 0 0.0 17 0.8
Ampang 946 62 6.6 37 3.9 28 3.0 17 1.8 0 0.0 0 0.0 1 0.1 10 1.1
Batu Pahat 467 37 7.9 22 4.7 18 3.9 7 1.5 2 0.4 0 0.0 0 0.0 2 0.4
Bintulu 374 0 0.0 0 0.0 0 0.0 0 0.0 0 0.0 0 0.0 0 0.0 0 0.0
Bukit Mertajam 998 31 3.1 24 2.4 10 1.0 3 0.3 1 0.1 0 0.0 0 0.0 8 0.8
Ipoh 2759 108 3.9 62 2.2 26 0.9 27 1.0 6 0.2 0 0.0 3 0.1 11 0.4
Johor Bahru 1381 102 7.4 47 3.4 17 1.2 40 2.9 4 0.3 0 0.0 2 0.1 10 0.7
Kangar 426 30 7.0 24 5.6 0 0.0 6 1.4 0 0.0 0 0.0 0 0.0 0 0.0
Kemaman 72 0 0.0 0 0.0 0 0.0 0 0.0 0 0.0 0 0.0 0 0.0 0 0.0
Keningau 133 9 6.8 7 5.3 4 3.0 2 1.5 0 0.0 0 0.0 0 0.0 0 0.0
Klang 1461 64 4.4 13 0.9 3 0.2 17 1.2 1 0.1 0 0.0 2 0.1 31 2.1
Kota Bharu 285 13 4.6 1 0.4 1 0.4 1 0.4 0 0.0 0 0.0 4 1.4 8 2.8
Kota Kinabalu 1040 91 8.8 56 5.4 23 2.2 23 2.2 6 0.6 0 0.0 0 0.0 13 1.3
Kuala Krai 365 40 11.0 27 7.4 19 5.2 7 1.9 2 0.5 1 0.3 0 0.0 8 2.2
Kuala Lumpur 1932 71 3.7 39 2.0 29 1.5 19 1.0 1 0.1 0 0.0 0 0.0 10 0.5
Kuala Pilah 493 15 3.0 5 1.0 4 0.8 1 0.2 1 0.2 0 0.0 1 0.2 8 1.6
Kuala
Terengganu 900 74 8.2 36 4.0 23 2.6 19 2.1 5 0.6 0 0.0 0 0.0 22 2.4
Kuantan 576 31 5.4 21 3.6 2 0.3 2 0.3 0 0.0 0 0.0 5 0.9 3 0.5
Kuching 2068 126 6.1 84 4.1 46 2.2 19 0.9 10 0.5 0 0.0 5 0.2 13 0.6
Kulim 265 10 3.8 3 1.1 1 0.4 1 0.4 1 0.4 0 0.0 0 0.0 6 2.3
Melaka 2139 121 5.7 86 4.0 45 2.1 18 0.8 4 0.2 0 0.0 0 0.0 11 0.5
Miri 949 9 0.9 5 0.5 4 0.4 1 0.1 0 0.0 0 0.0 0 0.0 1 0.1
Muar 729 69 9.5 48 6.6 34 4.7 14 1.9 1 0.1 0 0.0 0 0.0 6 0.8
Pulau Pinang 1791 52 2.9 27 1.5 19 1.1 13 0.7 8 0.4 0 0.0 0 0.0 7 0.4

88
Hospital No. of
patients
(N)
Any intra-op
complication PCR
Vitreous
loss
Zonular
Dehiscence
Nucleus drp
(or dropped
nucleus)
Suprachoroidal
Haemorrhage
Central
Corneal
Edema
Others
n % n % n % n % n % n % n % n %
Putrajaya 367 24 6.5 9 2.5 17 4.6 11 3.0 1 0.3 0 0.0 0 0.0 1 0.3
Sandakan 237 6 2.5 4 1.7 1 0.4 0 0.0 0 0.0 0 0.0 2 0.8 0 0.0
Sarikei 555 12 2.2 9 1.6 1 0.2 0 0.0 0 0.0 0 0.0 0 0.0 2 0.4
Selayang 899 72 8.0 38 4.2 20 2.2 25 2.8 3 0.3 0 0.0 1 0.1 14 1.6
Serdang 1265 99 7.8 51 4.0 55 4.3 31 2.5 3 0.2 1 0.1 0 0.0 24 1.9
Seremban 1585 76 4.8 41 2.6 39 2.5 25 1.6 6 0.4 0 0.0 2 0.1 10 0.6
Sibu 866 39 4.5 9 1.0 11 1.3 11 1.3 2 0.2 0 0.0 2 0.2 10 1.2
Sri Manjung 625 54 8.6 17 2.7 9 1.4 9 1.4 1 0.2 0 0.0 1 0.2 26 4.2
Sultan Ismail 609 27 4.4 16 2.6 8 1.3 0 0.0 1 0.2 1 0.2 0 0.0 10 1.6
Sungai Buloh 693 18 2.6 11 1.6 7 1.0 3 0.4 0 0.0 0 0.0 0 0.0 4 0.6
Sungei Petani 1022 48 4.7 29 2.8 23 2.3 11 1.1 2 0.2 0 0.0 1 0.1 10 1.0
Taiping 1233 27 2.2 16 1.3 16 1.3 13 1.1 0 0.0 0 0.0 0 0.0 2 0.2
Tawau 540 42 7.8 38 7.0 14 2.6 4 0.7 1 0.2 0 0.0 1 0.2 1 0.2
Teluk Intan 1013 24 2.4 10 1.0 7 0.7 10 1.0 0 0.0 0 0.0 1 0.1 4 0.4
Temerloh 1047 233 22.3 18 1.7 14 1.3 18 1.7 1 0.1 0 0.0 1 0.1 209 20.0
KK1M
Terengganu 38 4 10.5 0 0.0 0 0.0 1 2.6 0 0.0 0 0.0 0 0.0 3 7.9
KK1M Kelantan 186 13 7.0 8 4.3 6 3.2 1 0.5 0 0.0 0 0.0 0 0.0 4 2.2
KK1M Sarawak 831 35 4.2 20 2.4 5 0.6 5 0.6 4 0.5 1 0.1 0 0.0 5 0.6
MAIWP 2266 61 2.7 29 1.3 27 1.2 20 0.9 5 0.2 0 0.0 1 0.0 6 0.3
Table 1.4.2-4: Distribution of the Types Intra-operative Complications by SDP (Phaco converted to ECCE), CSR 2014
Hospital
No. of
patients
(N)
Any intra-op
complication
PCR Vitreous loss Zonular
Dehiscence
Nucleus
drop (or
dropped
nucleus)
Suprachoroidal
Haemorrhage
Central
Corneal
Edema
Others
n % n % n % n % n % n % n % n %
All centre 805 402 49.9 205 25.5 182 22.6 132 16.4 13 1.6 1 0.1 5 0.6 74 9.2
Alor Setar 24 7 29.2 3 12.5 5 20.8 3 12.5 0 0.0 0 0.0 0 0.0 0 0.0
Ampang 20 9 45.0 5 25.0 2 10.0 2 10.0 0 0.0 0 0.0 0 0.0 2 10.0
Batu Pahat 38 21 55.3 11 28.9 11 28.9 5 13.2 1 2.6 0 0.0 0 0.0 2 5.3
Bintulu 12 0 0.0 0 0.0 0 0.0 0 0.0 0 0.0 0 0.0 0 0.0 0 0.0
Bukit Mertajam 7 4 57.1 4 57.1 2 28.6 1 14.3 1 14.3 0 0.0 0 0.0 2 28.6
Ipoh 40 18 45.0 4 10.0 5 12.5 9 22.5 0 0.0 0 0.0 2 5.0 2 5.0
Johor Bahru 26 21 80.8 10 38.5 3 11.5 10 38.5 1 3.8 0 0.0 0 0.0 1 3.8
Kangar 6 4 66.7 4 66.7 0 0.0 0 0.0 0 0.0 0 0.0 0 0.0 0 0.0
Kemaman 1 0 0.0 0 0.0 0 0.0 0 0.0 0 0.0 0 0.0 0 0.0 0 0.0
Keningau 3 2 66.7 1 33.3 1 33.3 1 33.3 0 0.0 0 0.0 0 0.0 0 0.0
Klang 17 10 58.8 3 17.6 2 11.8 4 23.5 0 0.0 0 0.0 0 0.0 3 17.6
Kota Bharu 8 0 0.0 0 0.0 0 0.0 0 0.0 0 0.0 0 0.0 0 0.0 0 0.0
Kota Kinabalu 22 13 59.1 7 31.8 2 9.1 7 31.8 0 0.0 0 0.0 0 0.0 1 4.5
Kuala Krai 13 8 61.5 7 53.8 5 38.5 1 7.7 0 0.0 1 7.7 0 0.0 1 7.7
Kuala Lumpur 32 15 46.9 9 28.1 6 18.8 4 12.5 0 0.0 0 0.0 0 0.0 2 6.3
Kuala Pilah 21 7 33.3 4 19.0 4 19.0 1 4.8 1 4.8 0 0.0 0 0.0 2 9.5
Kuala
Terengganu 17 11 64.7 7 41.2 8 47.1 5 29.4 0 0.0 0 0.0 0 0.0 0 0.0
Kuantan 11 0 0.0 0 0.0 0 0.0 0 0.0 0 0.0 0 0.0 0 0.0 0 0.0
Kuching 29 20 69.0 8 27.6 13 44.8 6 20.7 0 0.0 0 0.0 1 3.4 2 6.9
Kulim 2 1 50.0 1 50.0 0 0.0 0 0.0 0 0.0 0 0.0 0 0.0 0 0.0

89
Hospital
No. of
patients
(N)
Any intra-op
complicatio
n
PCR Vitreous
loss
Zonular
Dehiscence
Nucleus
drop (or
dropped
nucleus)
Suprachoroidal
Haemorrhage
Central
Corneal
Edema
Others
n % n % n % n % n % n % n % n %
Melaka 35 17 48.6 13 37.1 7 20.0 3 8.6 0 0.0 0 0.0 0 0.0 2 5.7
Miri 7 1 14.3 1 14.3 0 0.0 0 0.0 0 0.0 0 0.0 0 0.0 0 0.0
Muar 26 19 73.1 12 46.2 13 50.0 5 19.2 1 3.8 0 0.0 0 0.0 2 7.7
Pulau Pinang 24 11 45.8 3 12.5 7 29.2 6 25.0 0 0.0 0 0.0 0 0.0 1 4.2
Putrajaya 21 6 28.6 1 4.8 5 23.8 4 19.0 0 0.0 0 0.0 0 0.0 0 0.0
Sandakan 0 0 0.0 0 0.0 0 0.0 0 0.0 0 0.0 0 0.0 0 0.0 0 0.0
Sarikei 4 0 0.0 0 0.0 0 0.0 0 0.0 0 0.0 0 0.0 0 0.0 0 0.0
Selayang 20 16 80.0 7 35.0 5 25.0 8 40.0 0 0.0 0 0.0 0 0.0 2 10.0
Serdang 42 29 69.0 18 42.9 22 52.4 10 23.8 3 7.1 0 0.0 0 0.0 7 16.7
Seremban 21 14 66.7 8 38.1 11 52.4 5 23.8 1 4.8 0 0.0 1 4.8 1 4.8
Sibu 8 5 62.5 0 0.0 0 0.0 3 37.5 0 0.0 0 0.0 0 0.0 2 25.0
Sri Manjung 1 1 100.0 0 0.0 0 0.0 0 0.0 0 0.0 0 0.0 0 0.0 1 100.0
Sultan Ismail 29 9 31.0 7 24.1 5 17.2 0 0.0 1 3.4 0 0.0 0 0.0 2 6.9
Sungai Buloh 29 5 17.2 3 10.3 2 6.9 2 6.9 0 0.0 0 0.0 0 0.0 0 0.0
Sungei Petani 43 17 39.5 10 23.3 8 18.6 6 14.0 0 0.0 0 0.0 0 0.0 4 9.3
Taiping 7 1 14.3 0 0.0 0 0.0 1 14.3 0 0.0 0 0.0 0 0.0 0 0.0
Tawau 32 15 46.9 15 46.9 3 9.4 0 0.0 1 3.1 0 0.0 0 0.0 0 0.0
Teluk Intan 13 6 46.2 1 7.7 2 15.4 3 23.1 0 0.0 0 0.0 1 7.7 1 7.7
Temerloh 37 30 81.1 5 13.5 6 16.2 8 21.6 0 0.0 0 0.0 0 0.0 24 64.9
KK1M
Terengganu 0 0 0.0 0 0.0 0 0.0 0 0.0 0 0.0 0 0.0 0 0.0 0 0.0
KK1M
Kelantan 9 2 22.2 1 11.1 0 0.0 0 0.0 0 0.0 0 0.0 0 0.0 1 11.1
KK1M
Sarawak 9 6 66.7 2 22.2 1 11.1 2 22.2 0 0.0 0 0.0 0 0.0 2 22.2
MAIWP 39 21 53.8 10 25.6 16 41.0 7 17.9 2 5.1 0 0.0 0 0.0 2 5.1
1.4.3 Intra-operative Complications by Combined Surgery
The percentage of intra-operative complications was higher in combined surgery when compared to cataract surgery
performed alone. PCR and vitreous loss remained the commonest complications encountered.
Table 1.4.3-1: Distribution of Intra-operative Complications by Any Combined Surgery, CSR 2007-2014
Year 2007 2008 2009 2010 2011 2012 2013 2014
Number of combined surgery (N) 891 664 871 1082 1194 1221 1026 1028
n % n % n % n % n % n % n % n %
Any intra-operative complication 131 14.7 89 10.0 113 13.0 121 11.2 222 18.6 240 19.7 149 14.5 175 17.0
Types of complications
PCR 56 6.3 54 6.1 62 7.1 61 5.6 140 11.7 146 12.0 85 8.3 111 10.8
Vitreous loss 41 4.6 40 4.5 51 5.9 53 4.9 101 8.5 123 10.1 75 7.3 83 8.1
Zonular dehiscence 21 2.4 15 1.7 21 2.4 28 2.6 49 4.1 61 5.0 37 3.6 46 4.5
Nucleus drop (or dropped nucleus) 4 0.4 3 0.3 8 0.9 10 0.9 20 1.7 16 1.3 12 1.2 18 1.8
Suprachoroidal haemorrhage 0 0.0 0.0 0.0 4 0.5 1 0.1 2 0.2 2 0.2 0 0.0 1 0.1
Central corneal oedema 7 0.8 3 0.3 1 0.1 2 0.2 0 0.0 2 0.2 1 0.1 2 0.2
Others 30 3.4 14 1.6 21 2.4 24 2.2 29 2.4 38 3.1 25 2.4 22 2.1

90
Table 1.4.3-2: Distribution of Intra-operative Complications by Specific Combined Surgery, CSR 2014
All
Surgeries
Any
Combined
Surgery
Pterygium
Surgery
Filtering
Surgery
Vitreo-Retinal
Surgery
Penetrating
Keratoplasty Others
No. of patients (N) 40532 1028 115 95 532 2 304
n % n % n % n % n % n % n %
Any intra-op
complication 2159 5.3 175 17.0 2 1.7 4 4.2 41 7.7 0 0.0 132 43.4
PCR 1100 2.7 111 10.8 1 0.9 3 3.2 21 3.9 0 0.0 87 28.6
Vitreous loss 661 1.6 83 8.1 2 1.7 1 1.1 5 0.9 0 0.0 75 24.7
Zonular dehiscene 467 1.2 46 4.5 0 0.0 1 1.1 13 2.4 0 0.0 34 11.2
Nucleus drop (or
dropped nucleus) 87 0.2 18 1.8 0 0.0 0 0.0 11 2.1 0 0.0 7 2.3
Suprachoroidal
haemorrhage 4 0.0 1 0.1 0 0.0 0 0.0 0 0.0 0 0.0 1 0.3
Central corneal oedema 36 0.1 2 0.2 0 0.0 0 0.0 0 0.0 0 0.0 2 0.7
Others 550 1.4 22 2.1 0 0.0 0 0.0 7 1.3 0 0.0 17 5.6
Table 1.4.3-3: Distribution of Intra-operative Complications when Combined with Filtering Surgery, CSR 2007-2014
Year 2007 2008 2009 2010 2011 2012 2013 2014
N 131 142 132 121 64 71 114 95
n % n % n % n % n % n % n % n %
Any intra-op complication 24 18.3 9 6.3 16 12.1 8 6.6 5 7.8 3 4.2 8 7.0 4 4.2
Posterior capsule rupture 9 6.9 3 2.1 4 3.0 3 2.5 1 1.6 2 2.8 3 2.6 3 3.2
Vitreous loss 7 5.3 5 3.5 7 5.3 2 1.7 3 4.7 1 1.4 1 0.9 1 1.1
Zonular dehiscence 4 3.1 3 2.1 5 3.8 1 0.8 3 4.7 0 0.0 5 4.4 1 1.1
Nucleus drop (or dropped nucleus) 0 0.0 0 0.0 0 0.0 0 0.0 0 0.0 0 0.0 0 0.0 0 0.0
Suprachoroidal haemorrhage 0 0.0 0 0.0 2 1.5 0 0.0 0 0.0 0 0.0 0 0.0 0 0.0
Central corneal oedema 3 2.3 2 1.4 0 0.0 0 0.0 0 0.0 0 0.0 0 0.0 0 0.0
Others 5 3.8 1 0.7 3 2.3 3 2.5 0 0.0 0 0.0 1 0.9 0 0.0
Table 1.4.3-4: Distribution of Intra-operative Complications when Combined with Vitreoretinal Surgery, CSR 2007-
2014
Year 2007 2008 2009 2010 2011 2012 2013 2014
N 435 237 402 601 672 585 536 532
n % n % n % n % n % n % n % n %
Any intra-op complication 45 10.3 21 8.9 32 8.0 35 5.8 69 10.3 45 7.7 32 6.0 41 7.7
Posterior capsule rupture 18 4.1 17 7.2 18 4.5 22 3.7 41 6.1 23 3.9 16 3.0 21 3.9
Vitreous loss 11 2.5 6 2.5 5 1.2 9 1.5 10 1.5 8 1.4 9 1.7 5 0.9
Zonular dehiscence 6 1.4 1 0.4 2 0.5 5 0.8 13 1.9 6 1.0 4 0.7 13 2.4
Nucleus drop (or dropped nucleus) 3 0.7 2 0.8 6 1.5 6 1.0 15 2.2 7 1.2 6 1.1 11 2.1
Suprachoroidal haemorrhage 0 0.0 0 0.0 2 0.5 0 0.0 2 0.3 1 0.2 0 0.0 0 0.0
Central corneal oedema 3 0.7 0 0.0 0 0.0 0 0.0 0 0.0 0 0.0 1 0.2 0 0.0
Others 12 2.8 3 1.3 5 1.2 4 0.7 10 1.5 15 2.6 5 0.9 7 1.3
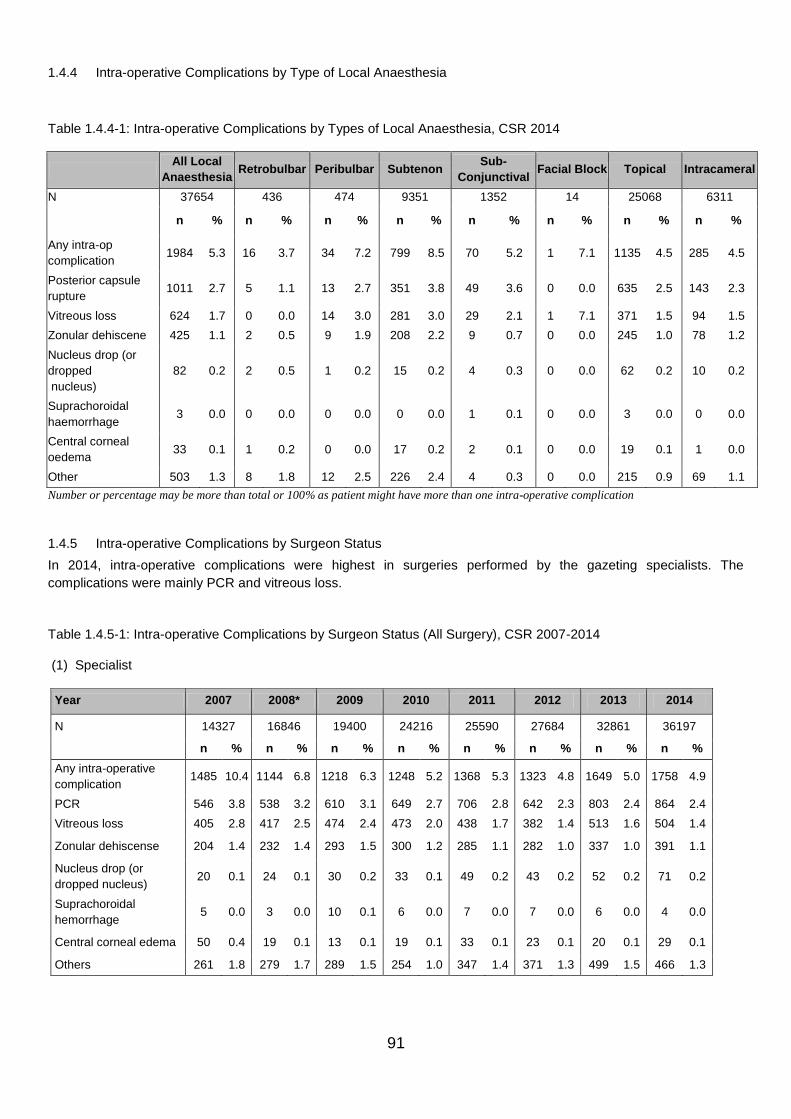
91
1.4.4 Intra-operative Complications by Type of Local Anaesthesia
Table 1.4.4-1: Intra-operative Complications by Types of Local Anaesthesia, CSR 2014
All Local
Anaesthesia Retrobulbar Peribulbar Subtenon
Sub-
Conjunctival Facial Block Topical Intracameral
N 37654 436 474 9351 1352 14 25068 6311
n % n % n % n % n % n % n % n %
Any intra-op
complication 1984 5.3 16 3.7 34 7.2 799 8.5 70 5.2 1 7.1 1135 4.5 285 4.5
Posterior capsule
rupture 1011 2.7 5 1.1 13 2.7 351 3.8 49 3.6 0 0.0 635 2.5 143 2.3
Vitreous loss 624 1.7 0 0.0 14 3.0 281 3.0 29 2.1 1 7.1 371 1.5 94 1.5
Zonular dehiscene 425 1.1 2 0.5 9 1.9 208 2.2 9 0.7 0 0.0 245 1.0 78 1.2
Nucleus drop (or
dropped
nucleus)
82 0.2 2 0.5 1 0.2 15 0.2 4 0.3 0 0.0 62 0.2 10 0.2
Suprachoroidal
haemorrhage 3 0.0 0 0.0 0 0.0 0 0.0 1 0.1 0 0.0 3 0.0 0 0.0
Central corneal
oedema 33 0.1 1 0.2 0 0.0 17 0.2 2 0.1 0 0.0 19 0.1 1 0.0
Other 503 1.3 8 1.8 12 2.5 226 2.4 4 0.3 0 0.0 215 0.9 69 1.1
Number or percentage may be more than total or 100% as patient might have more than one intra-operative complication
1.4.5 Intra-operative Complications by Surgeon Status
In 2014, intra-operative complications were highest in surgeries performed by the gazeting specialists. The
complications were mainly PCR and vitreous loss.
Table 1.4.5-1: Intra-operative Complications by Surgeon Status (All Surgery), CSR 2007-2014
(1) Specialist
Year 2007 2008* 2009 2010 2011 2012 2013 2014
N 14327 16846 19400 24216 25590 27684 32861 36197
n % n % n % n % n % n % n % n %
Any intra-operative
complication 1485 10.4 1144 6.8 1218 6.3 1248 5.2 1368 5.3 1323 4.8 1649 5.0 1758 4.9
PCR 546 3.8 538 3.2 610 3.1 649 2.7 706 2.8 642 2.3 803 2.4 864 2.4
Vitreous loss 405 2.8 417 2.5 474 2.4 473 2.0 438 1.7 382 1.4 513 1.6 504 1.4
Zonular dehiscense 204 1.4 232 1.4 293 1.5 300 1.2 285 1.1 282 1.0 337 1.0 391 1.1
Nucleus drop (or
dropped nucleus) 20 0.1 24 0.1 30 0.2 33 0.1 49 0.2 43 0.2 52 0.2 71 0.2
Suprachoroidal
hemorrhage 5 0.0 3 0.0 10 0.1 6 0.0 7 0.0 7 0.0 6 0.0 4 0.0
Central corneal edema 50 0.4 19 0.1 13 0.1 19 0.1 33 0.1 23 0.1 20 0.1 29 0.1
Others 261 1.8 279 1.7 289 1.5 254 1.0 347 1.4 371 1.3 499 1.5 466 1.3

92
(2) Gazetting Specialist
Year 2007 2008* 2009 2010 2011 2012 2013 2014
N 1276 1399 2053 1405 2487 2411 2014 2034
n % n % n % n % n % n % n % n %
Any intra-operative
complication 175 13.7 167 11.9 171 8.3 98 7.0 182 7.3 190 7.9 147 7.3 208 10.2
PCR 85 6.7 91 6.5 96 4.7 44 3.1 113 4.5 125 5.2 90 4.5 116 5.7
Vitreous loss 54 4.2 76 5.4 73 3.6 35 2.5 84 3.4 72 3.0 45 2.2 72 3.5
Zonular dehiscense 24 1.9 32 2.3 33 1.6 30 2.1 33 1.3 34 1.4 24 1.2 41 2.0
Nucleus drop (or
dropped nucleus) 0 0.0 3 0.2 3 0.1 2 0.1 4 0.2 8 0.3 6 0.3 5 0.2
Suprachoroidal
hemorrhage 1 0.1 1 0.1 2 0.1 1 0.1 0 0.0 0 0.0 1 0.0 0 0.0
Central corneal edema 5 0.4 5 0.4 7 0.3 3 0.2 0 0.0 2 0.1 2 0.1 5 0.2
Others 37 2.9 37 2.9 28 1.4 27 1.9 27 1.1 31 1.3 32 1.6 49 2.4
(3) Medical Officer
Year 2007 2008* 2009 2010 2011 2012 2013 2014
N 2690 2697 2750 2871 2478 2354 2244 2249
n % n % n % n % n % n % n % n %
Any intra-operative
complication 330 12.3 264 9.8 242 8.8 263 9.2 202 8.2 189 8.0 199 8.9 189 8.4
PCR 126 4.7 148 5.5 139 5.1 147 5.1 116 4.7 103 4.4 124 5.5 117 5.2
Vitreous loss 105 3.9 105 3.9 92 3.3 131 4.6 89 3.6 75 3.2 86 3.8 82 3.6
Zonular dehiscense 43 1.6 46 1.7 45 1.6 47 1.6 43 1.7 43 1.8 30 1.3 35 1.6
Nucleus drop (or
dropped nucleus) 1 0.0 4 0.2 7 0.3 3 0.1 5 0.2 5 0.2 5 0.2 11 0.5
Suprachoroidal
hemorrhage 3 0.1 4 0.2 1 0.0 2 0.1 1 0.0 1 0.0 1 0.0 0 0.0
Central corneal edema 2 0.1 3 0.1 2 0.1 4 0.1 3 0.1 5 0.2 1 0.0 2 0.1
Others 51 1.9 51 1.9 56 2.0 56 2.0 42 1.7 37 1.6 38 1.7 34 1.5

93
0
2
4
6
8
10
12
14
16
18
20
20
07
20
08
20
09
20
10
20
11
20
12
20
13
20
14
20
07
20
08
20
09
20
10
20
11
20
12
20
13
20
14
20
07
20
08
20
09
20
10
20
11
20
12
20
13
20
14
Specialist Gazetting Specialist Medical Officer
%
Others
Central corneal edema
Suprachoroidal hemorrhage
Drop nucleus
Zonular dehiscense
Vitreous loss
PCR
Figure 1.4.5-1: Percentage Distribution of Intra-operative Complications by Surgeon Status (All Surgery), CSR 2007-
2014
Table 1.4.5-2: Intra-operative Complications by Surgeon Status (Phaco), CSR 2009-2014
(1) Specialist
Year 2009 2010 2011 2012 2013 2014
N 15206 19797 20963 23291 28774 32417
n % n % n % n % n % n %
Any intra-operative complication 627 4.1 680 3.4 780 3.7 755 3.2 977 3.4 1065 3.3
PCR 354 2.3 408 2.1 453 2.2 413 1.8 534 1.9 575 1.8
Vitreous loss 201 1.3 211 1.1 202 1.0 168 0.7 230 0.8 223 0.7
Zonular dehiscense 118 0.8 113 0.6 116 0.6 121 0.5 160 0.6 179 0.6
Nucleus drop (or dropped nucleus) 24 0.2 26 0.1 37 0.2 29 0.1 42 0.1 57 0.2
Suprachoroidal hemorrhage 3 0.0 3 0.0 1 0.0 4 0.0 2 0.0 0 0.0
Central corneal edema 10 0.1 13 0.1 24 0.1 14 0.1 8 0.0 18 0.1
Others 153 1.0 136 0.7 195 0.9 201 0.9 284 1.0 291 0.9
(2) Gazetting Specialist
Year 2009 2010 2011 2012 2013 2014
N 1422 929 1845 1850 1694 1776
n % n % n % n % n % n %
Any intra-operative complication 86 6.0 39 4.2 86 4.7 102 5.5 74 4.4 132 7.4
PCR 60 4.2 23 2.5 67 3.6 72 3.9 54 3.2 89 5.0
Vitreous loss 36 2.5 10 1.1 35 1.9 31 1.7 21 1.2 41 2.3
Zonular dehiscense 12 0.8 8 0.9 10 0.5 10 0.5 4 0.2 14 0.8
Nucleus drop (or dropped nucleus) 2 0.1 2 0.2 1 0.1 7 0.4 4 0.2 4 0.2
Suprachoroidal hemorrhage 0 0.0 0 0.0 0 0.0 0 0.0 0 0.0 0 0.0
Central corneal edema 3 0.2 2 0.2 0 0.0 2 0.1 1 0.1 3 0.2
Others 12 0.8 9 1.0 9 0.5 17 0.9 17 1.0 28 1.6

94
(3) Medical Officer
Year 2009 2010 2011 2012 2013 2014
N 923 1078 1050 1182 1132 1189
n % n % n % n % n % n %
Any intra-operative complication 64 6.9 79 7.3 61 5.8 73 6.2 61 5.4 83 7.0
PCR 47 5.1 58 5.4 48 4.6 53 4.5 45 4.0 65 5.5
Vitreous loss 27 2.9 41 3.8 33 3.1 27 2.3 28 2.5 35 2.9
Zonular dehiscense 7 0.8 12 1.1 4 0.4 13 1.1 9 0.8 10 0.8
Nucleus drop (or dropped nucleus) 2 0.2 3 0.3 4 0.4 3 0.3 5 0.4 11 0.9
Suprachoroidal hemorrhage 0 0.0 1 0.1 0 0.0 0 0.0 0 0.0 0 0.0
Central corneal edema 2 0.2 4 0.4 0 0.0 3 0.3 0 0.0 0 0.0
Others 12 1.3 8 0.7 9 0.9 5 0.4 4 0.4 7 0.6
0
2
4
6
8
10
12
14
20
09
20
10
20
11
20
12
20
13
20
14
20
09
20
10
20
11
20
12
20
13
20
14
20
09
20
10
20
11
20
12
20
13
20
14
Specialist Gazetting Specialist Medical Officer
%
Others
Central corneal edema
Suprachoroidal hemorrhage
Drop nucleus
Zonular dehiscense
Vitreous loss
PCR
Figure 1.4.5-2: Percentage Distribution of Intra-operative Complications by Surgeon Status (Phaco), CSR 2007-2014

95
1.4.6 Posterior Capsular Rupture (PCR)
Table 1.4.6-1: PCR by SDP, CSR 2007-2014
Hospital 2007 2008 2009 2010 2011 2012 2013 2014
N n % N n % N n % N n % N n % N n % N n % N n %
Alor Setar 652 10 1.5 986 29 3 1110 22 2.0 1527 25 1.6 1939 46 2.4 1835 46 2.5 1758 48 2.7 2106 53 2.5
Ampang 33 0 0 208 3 1 433 14 3.2 627 32 5.1 708 27 3.8 896 40 4.5 983 31 3.2 946 37 3.9
Batu Pahat 550 20 3.6 573 14 2 602 26 4.3 411 15 3.6 554 30 5.4 608 42 6.9 433 22 5.1 467 22 4.7
Bintulu 0 0 0 30 1 3 124 10 8.1 258 7 2.7 332 8 2.4 391 7 1.8 383 1 0.3 374 0 0.0
Bukit Mertajam 697 18 2.6 487 8 2 743 16 2.2 804 22 2.7 803 26 3.2 928 31 3.3 909 21 2.3 998 24 2.4
Ipoh 1556 77 4.9 1723 59 3 2137 48 2.2 2199 32 1.5 1826 56 3.1 2932 65 2.2 3032 88 2.9 2759 62 2.2
Johor Bahru 1520 28 1.8 1376 28 2 1318 57 4.3 1377 30 2.2 1127 29 2.6 1195 32 2.7 1350 42 3.1 1381 47 3.4
Kangar 318 8 2.5 400 3 1 399 11 2.8 400 13 3.3 403 15 3.7 454 13 2.9 466 22 4.7 426 24 5.6
Kemaman - - - - - - - - - - - - - - - - - - 47 0 0.0 72 0 0.0
Keningau 0 0 0 34 1 3 31 1 3.2 76 1 1.3 52 0 0.0 17 0 0.0 15 1 6.7 133 7 5.3
Klang 1040 40 3.8 1217 34 3 904 27 3.0 1007 26 2.6 1061 20 1.9 1411 6 0.4 1612 12 0.7 1461 13 0.9
Kota Bharu 807 38 4.7 739 33 5 911 33 3.6 960 31 3.2 946 40 4.2 545 13 2.4 682 16 2.3 285 1 0.4
Kota Kinabalu 565 20 3.5 351 3 1 433 16 3.7 624 24 3.8 686 46 6.7 763 38 5.0 978 66 6.7 1040 56 5.4
Kuala Krai 125 2 1.6 170 7 4 175 4 2.3 217 3 1.4 240 11 4.6 247 12 4.9 397 14 3.5 365 27 7.4
Kuala Lumpur 0 0 0 40 3 8 1405 35 2.5 1648 46 2.8 1622 19 1.2 1516 24 1.6 1150 15 1.3 1932 39 2.0
Kuala Pilah 201 4 2 282 11 4 290 7 2.4 322 8 2.5 483 10 2.1 429 8 1.9 492 6 1.2 493 5 1.0
Kuala T’ganu 525 34 6.5 726 35 5 743 35 4.7 714 28 3.9 770 34 4.4 765 20 2.6 1014 39 3.8 900 36 4.0
Kuantan 25 1 4 395 20 5 293 5 1.7 615 5 0.8 680 20 2.9 684 7 1.0 619 11 1.8 576 21 3.6
Kuching 998 33 3.3 1011 38 4 893 38 4.3 1207 45 3.7 1131 35 3.1 1657 45 2.7 1721 32 1.9 2068 84 4.1
Kulim - - - - - - - - - - - - - - - - - - - - - 265 3 1.1
Melaka 1518 87 5.7 1681 106 6 1387 84 6.1 1659 76 4.6 1642 61 3.7 1488 52 3.5 1719 83 4.8 2139 86 4.0
Miri 18 2 11 396 7 2 404 5 1.2 577 8 1.4 657 4 0.6 901 1 0.1 915 1 0.1 949 5 0.5
Muar 349 4 1.1 338 14 4 542 29 5.4 617 15 2.4 692 20 2.9 665 26 3.9 717 42 5.9 729 48 6.6
Pulau Pinang 1102 92 8.3 1357 77 6 1374 46 3.3 1876 62 3.3 2186 42 1.9 1330 26 2.0 1696 46 2.7 1791 27 1.5
Putrajaya 199 8 4 256 8 3 251 9 3.6 282 8 2.8 329 11 3.3 355 4 1.1 391 10 2.6 367 9 2.5
Sandakan 0 0 0 137 3 2 158 3 1.9 208 13 6.3 271 8 3.0 265 4 1.5 411 15 3.6 237 4 1.7
Sarikei - - - - - - - - - - - - - - - - - - 286 7 2.4 555 9 1.6
Selayang 1400 47 3.4 1429 56 4 1418 42 3.0 1699 71 4.2 1859 100 5.4 1829 83 4.5 1337 51 3.8 899 38 4.2
Serdang 697 43 6.2 696 36 5 598 32 5.4 520 17 3.3 666 28 4.2 709 20 2.8 1023 43 4.2 1265 51 4.0
Seremban 954 40 4.2 898 40 5 1229 79 6.4 1519 48 3.2 1605 34 2.1 1559 67 4.3 1520 46 3.0 1585 41 2.6
Sibu 380 10 2.6 263 9 3 387 6 1.6 455 12 2.6 505 10 2.0 745 11 1.5 900 17 1.9 866 9 1.0
Sri Manjung 152 10 6.6 350 11 3 327 7 2.1 387 6 1.6 420 10 2.4 466 9 1.9 832 17 2.0 625 17 2.7
Sultan Ismail 100 3 3 180 9 5 185 2 1.1 258 10 3.9 283 7 2.5 279 8 2.9 374 5 1.3 609 16 2.6
Sungai Buloh 165 9 5.5 319 14 4 387 19 4.9 468 22 4.7 450 13 2.9 514 14 2.7 580 22 3.8 693 11 1.6
Sungei Petani 497 23 4.6 633 14 2 684 9 1.3 558 8 1.4 811 35 4.3 845 19 2.2 930 23 2.5 1022 29 2.8
Taiping 278 7 2.5 379 10 3 612 22 3.6 889 19 2.1 953 24 2.5 1118 32 2.9 1284 18 1.4 1233 16 1.3
Tawau 189 5 2.6 317 10 3 298 9 3.0 401 15 3.7 575 16 2.8 648 9 1.4 503 45 8.9 540 38 7.0
Teluk Intan 668 19 2.8 588 16 3 612 22 3.6 690 27 3.9 663 10 1.5 616 15 2.4 1102 20 1.8 1013 10 1.0
Temerloh 443 27 6.1 531 28 5 640 28 4.4 450 10 2.2 681 31 4.6 868 21 2.4 866 15 1.7 1047 18 1.7
KK1M Pahang - - - - - - - - - - - - - - - - - - 64 2 3.1 - - -
KK1M T’gannu - - - - - - - - - - - - - - - - - - - - - 38 0 0.0
KK1M Kelantan - - - - - - - - - - - - - - - - - - - - - 186 8 4.3
KK1M Sarawak - - - - - - - - - - - - - - - - - - 76 0 0.0 831 20 2.4
MAIWP - - - - - - - - - - - - - - - - - - 1583 2 0.1 2266 29 1.3

96
Table 1.4.6-2: PCR by Surgeon Status and SDP (Phaco), CSR 2014
(N=total no. of cases of phaco;n=no. of cases of PCR in phaco)
Hospital 2014
Phaco
By surgeon status:
Specialist Gazetting Specialist Medical Officer
N n % N n % N n % N n %
Alor Setar 1687 33 2.0 1613 29 1.8 72 4 5.6 0 0 0.0
Ampang 809 26 3.2 628 18 2.9 0 0 0.0 181 8 4.4
Batu Pahat 341 6 1.8 341 6 1.8 0 0 0.0 0 0 0.0
Bintulu 353 0 0.0 353 0 0.0 0 0 0.0 0 0 0.0
Bukit Mertajam 749 12 1.6 743 11 1.5 0 0 0.0 6 1 16.7
Ipoh 2566 56 2.2 2503 55 2.2 37 0 0.0 26 1 3.8
Johor Bahru 1303 35 2.7 1287 35 2.7 8 0 0.0 8 0 0.0
Kangar 356 16 4.5 328 13 4.0 12 3 25.0 16 0 0.0
Kemaman 44 0 0.0 44 0 0.0 0 0 0.0 0 0 0.0
Keningau 96 5 5.2 16 1 6.3 0 0 0.0 80 4 5.0
Klang 1351 8 0.6 1283 6 0.5 68 2 2.9 0 0 0.0
Kota Bharu 162 0 0.0 161 0 0.0 0 0 0.0 1 0 0.0
Kota Kinabalu 847 42 5.0 654 32 4.9 180 9 5.0 13 1 7.7
Kuala Krai 292 16 5.5 292 16 5.5 0 0 0.0 0 0 0.0
Kuala Lumpur 1576 18 1.1 1524 17 1.1 46 1 2.2 6 0 0.0
Kuala Pilah 430 0 0.0 409 0 0.0 21 0 0.0 0 0 0.0
Kuala Terengganu 707 19 2.7 614 14 2.3 91 4 4.4 2 1 50.0
Kuantan 421 14 3.3 391 10 2.6 9 1 11.1 21 3 14.3
Kuching 1986 75 3.8 1454 27 1.9 463 41 8.9 69 7 10.1
Kulim 239.0 1.0 0.4 239 1 0.4 0 0 0.0 0 0 0.0
Melaka 1919 70 3.6 1790 52 2.9 4 0 0.0 124 18 14.5
Miri 893 2 0.2 840 2 0.2 53 0 0.0 0 0 0.0
Muar 628 34 5.4 390 20 5.1 238 14 5.9 0 0 0.0
Pulau Pinang 1712 23 1.3 1570 17 1.1 20 0 0.0 122 6 4.9
Putrajaya 289 7 2.4 289 7 2.4 0 0 0.0 0 0 0.0
Sandakan 206 3 1.5 206 3 1.5 0 0 0.0 0 0 0.0
Sarikei 538 9 1.7 537 9 1.7 0 0 0.0 1 0 0.0
Selayang 809 27 3.3 676 19 2.8 19 2 10.5 114 6 5.3
Serdang 1072 25 2.3 1066 24 2.3 0 0 0.0 6 1 16.7
Seremban 1441 23 1.6 1012 15 1.5 68 0 0.0 361 8 2.2
Sibu 826 8 1.0 822 8 1.0 0 0 0.0 4 0 0.0
Sri Manjung 608 16 2.6 607 15 2.5 0 0 0.0 0 0 0.0
Sultan Ismail 496 8 1.6 496 8 1.6 0 0 0.0 0 0 0.0
Sungai Buloh 599 8 1.3 592 8 1.4 2 0 0.0 5 0 0.0
Sungei Petani 743 8 1.1 743 8 1.1 0 0 0.0 0 0 0.0
Taiping 1030 6 0.6 1028 6 0.6 2 0 0.0 0 0 0.0
Tawau 354 17 4.8 354 17 4.8 0 0 0.0 0 0 0.0
Teluk Intan 923 6 0.7 657 2 0.3 263 4 1.5 2 0 0.0
Temerloh 898 8 0.9 832 7 0.8 66 1 1.5 0 0 0.0
KK1M Terengganu 28.0 0.0 0.0 25 0 0.0 3 0 0.0 0 0 0.0
KK1M Kelantan 94.0 4.0 4.3 94 4 4.3 0 0 0.0 0 0 0.0
KK1M Sarawak 812 18 2.2 783 15 1.9 29 3 10.3 0 0 0.0
MAIWP 2196 19 0.9 2131 18 0.8 2 0 0.0 21 0 0.0
*No. of total phaco (N) and total no. of phaco by surgeon status does not tally as surgeon status is missing in some CSR entries.

97
Figure 1.4.6-1: PCR by SDP, Bar Chart (All Surgery), CSR 2014
Figure 1.4.6-2: PCR by SDP, Bar Chart (Phaco), CSR 2014

98
Figure 1.4.6-3: PCR by SDP, Radar Chart (All Surgery), CSR 2014
Figure 1.4.6-4: PCR by SDP, Radar Chart (Phaco), CSR 2014

99
K.Krai (365, 7.4%)
Kangar (426, 5.6%)
Tawau, (540, 7.0%)Muar (729, 6.6%)
K.Kinabalu (1040, 5.4%)
0%
2%
4%
6%
8%
10%
12%
0 500 1000 1500 2000 2500 3000
Ra
te o
f P
CR
(%
)
No. of cataract surgery
Rate of PCR (all surgeries), 2014
Overall rate of PCR (%) = 2.7
95% control limit (2SD)
99% control limit (3SD)
Figure 1.4.6-5: PCR by SDP, Funnel Plot (All Surgery), CSR 2014
K.Krai (292, 5.5%)Muar (628, 5.4%)
K.Kinabalu (847, 5.0%)
Kuching (1986, 3.8%)
0%
2%
4%
6%
8%
10%
12%
0 500 1000 1500 2000 2500 3000
Ra
te o
f P
CR
(%
)
No. of cataract surgery in phacoemulsification
Rate of PCR (in phacoemulsification), 2014
Overall rate of PCR (%) = 2.0
95% control limit (2SD)
99% control limit (3SD)
Figure 1.4.6-6: PCR by SDP, Funnel Plot (Phaco), CSR 2014

100
1.4.7 Posterior Capsular Rupture (PCR) by Type of Cataract Surgery
From the year 2002-2004, the percentage of PCR for phaco was higher than ECCE (figure not displayed). From 2007
onwards, the figures were reversed with ECCE having a higher percentage of PCR than phaco.
Table 1.4.7-1: PCR by Type of Cataract Surgery, CSR 2007-2014
Year 2007 2008 2009 2010
No. of patients 18380 21496 24438 28506
Total PCR 764 790 858 840
N n % N n % N n % N n %
Phaco 11960 393 3.3 14781 432 2.9 17717 471 2.7 21810 489 2.2
ECCE 5524 239 4.3 5627 210 3.7 5457 216 4.0 5363 195 3.6
Lens Aspiration 323 18 5.6 340 17 5.0 400 22 5.5 451 20 4.4
ICCE 141 15 10.6 129 7 5.4 134 8 6.0 143 9 6.3
Phaco converted to ECCE 432 99 22.9 524 124 23.7 573 135 23.6 586 119 20.3
Year 2011 2012 2013 2014
No. of patients 30611 32473 37150 40532
Total PCR 936 870 1017 1100
N n % N n % N n % N n %
Phaco 23872 568 2.4 26345 538 2.0 31625 633 2.0 35429 731 2.1
ECCE 5291 181 3.4 4784 145 3.0 4086 160 3.9 3613 133 3.7
Lens Aspiration 460 11 2.4 444 13 2.9 364 12 3.3 370 10 2.7
ICCE 123 6 4.9 136 6 4.4 173 8 4.6 176 9 5.1
Phaco converted to ECCE 652 162 24.8 621 161 25.9 769 196 25.5 805 205 25.5
0
5
10
15
20
25
30
2007 2008 2009 2010 2011 2012 2013 2014
%
Year
Phaco
ECCE
Lens Aspiration
ICCE
Phaco converted to ECCE
Figure 1.4.7-1: PCR by Type of Cataract Surgery, CSR 2007-2014

101
1.5 Cataract Surgery Outcome
1.5.1 Post-operative Complications Record and Ascertainment
In general, the ascertainment was above 80.0%. With exclusion for 2004, the ascertainment for the visual outcome
appeared to be declining over the years.
Table 1.5.1-1: Distribution of Cataract Surgery with Post-operative Complication Record, CSR 2007-2014
Year 2007 2008 2009 2010 2011 2012 2013 2014
Total number of cataract surgery
registered to CSR 18426 21496 24438 28506 30611 32473 37150 40532
Cataract surgery with post-operative
complication record 17604 20521 21851 26014 28834 30011 34662 37945
Ascertainment on post-operative
complication (%) 95.5 95.5 89.4 91.3 94.2 92.4 93.3 93.6
Cataract surgery with visual outcome
record 15786 19063 20590 24522 27219 28589 34318 37865
Ascertainment on visual outcome (%) 85.7 88.7 84.3 86.0 88.9 88.0 92.4 93.4
1.5.2 Post-operative Infectious Endophthalmitis
The occurrence of post-operative infectious endophthalmitis appeared to be decreasing over the years. It was an
improvement with only 5 cases in 10 000 cataract surgeries performed in MOH hospitals in 2014. The median duration
from the time of surgery to diagnosis of infection for eyes operated in 2007 onwards was 7 days.
Table 1.5.2-1: Post-operative Infectious Endophthalmitis, CSR 2007-2014
Year 2007 2008 2009 2010 2011 2012 2013 2014
Eyes with post-operative complication
records (N) 17604 20521 21851 26014 28834 30011 34662 37945
Eyes with post-operative infectious
endophthalmitis (n) 37 22 19 24 11 13 27 19
Percentage of eyes with post-
operative endophthalmitis (%) 0.21 0.11 0.09 0.09 0.04 0.04 0.08 0.05

102
0.21
0.11
0.09 0.09
0.04 0.04
0.08
0.05
0.00
0.05
0.10
0.15
0.20
0.25
2007 2008 2009 2010 2011 2012 2013 2014
%
Year
Figure 1.5.2-1: Percentage of Post-operative Infectious Endophthalmitis, CSR 2007-2014
0.10.3
0.20.20.20.2
0.10.1
0.10.1
0.10.1
0.10.1
000000000000000000000000000000
0.0 0.1 0.1 0.2 0.2 0.3 0.3 0.4
AllSri Manjung
Kuala LumpurSarikei
Alor SetarJohor Bahru
Kuala TerengganuAmpang
TemerlohTaiping
SerdangKlang
Pulau PinangKuching
Batu PahatBintulu
Bukit MertajamIpoh
KangarKemamanKeningau
Kota BharuKota Kinabalu
Kuala KraiKuala Pilah
KuantanKulim
MelakaMiri
MuarPutrajayaSandakanSelayang
SerembanSibu
Sultan IsmailSungai Buloh
Sungei PetaniTawau
Teluk IntanKK1M Terengganu
KK1M KelantanKK1M Sarawak
MAIWP
Percent
Hos
pita
l
Rate of Post-operative Infectious Endophthalmitis by SDP, 2014
Figure 1.5.2-2: Percentage of Post-operative Infectious Endophthalmitis in Bar Chart, CSR 2014

103
0.0
0.1
0.2
0.3
0.4
0.5All
Alor SetarAmpangBatu Pahat
BintuluBukit Mertajam
Ipoh
Johor Bahru
Kangar
Kemaman
Keningau
Klang
Kota Bharu
Kota Kinabalu
Kuala Krai
Kuala LumpurKuala Pilah
Kuala TerengganuKuantan
KuchingMelakaMiri
MuarPulau PinangPutrajaya
SandakanSarikei
Selayang
Serdang
Seremban
Sibu
Sri Manjung
Sultan Ismail
Sungai Buloh
Sungei Petani
Taiping
TawauTeluk Intan
TemerlohKK1M East Coast
KK1M SarawakMAIWP
2014
Standard (0.2%)
Figure 1.5.2-3: Percentage of Post-operative Infectious Endophthalmitis in Radar Chart, CSR 2014
Table 1.5.2-2: Time from Surgery to Diagnosis, CSR 2007-2014
Year 2007 2008 2009 2010 2011 2012 2013 2014
Number of patients with post-operative infective endophthalmitis
37 22 19 24 11 13 27 19
Time from surgery to diagnosis of infection (day) Days
Min 1 1 1 0 0 2 1 2
Max 92 76 103 141 391 59 162 90
Mean 21.6 20.6 20.4 22.7 43.7 19.9 24.0 18.9
Median 6 13 7 7
Distribution of patients Number of Patients
Less than 3 days 2 5 5 4 2 1 6 2
3-5 days 4 1 1 5 3 2 4 5
6-14 days 8 5 5 4 4 4 8 4
More than 14 days 12 9 7 10 2 5 8 8
Missing 11 2 1 1 0 1 1 0
1.5.3 Unplanned Return to Operating Theatre (OT)
The average percentage was 0.26 or 2.6 cases per 1000 cataract surgeries in 2014. Iris prolapse, wound dehiscence
and high post- operative IOP showed decreasing trend but IOL related problem demonstrated otherwise. The average
time from surgery to return to OT was in the second week post-operatively.

104
Table 1.5.3-1: Unplanned Return to OT, CSR 2007-2014
Year 2007 2008 2009 2010 2011 2012 2013 2014
Patients with outcome
records (N) 17604 20521 21851 26014 28834 30011 34662 37945
n % n % n % n % n % n % n % n %
87 0.50 88 0.43 116 0.53 123 0.47 122 0.42 103 0.34 105 0.30 97 0.26
Table 1.5.3-2: Reasons for Unplanned Return to OT, CSR 2007-2014
Year 2007 2008 2009 2010 2011 2012 2013 2014
Patients with unplanned
return to OT 87 88 116 123 122 103 105 97
n % n % n % n % n % n % n % n %
Iris prolapse 20 23.0 12 13.6 18 15.5 20 16.3 24 19.7 11 10.7 10 9.5 7 7.2
Wound dehiscence 13 14.9 7 8.0 22 19.0 20 16.3 18 14.8 19 18.4 20 19.0 15 15.5
High IOP 5 5.7 2 2.3 9 7.8 3 2.4 4 3.3 6 5.8 2 1.9 3 3.1
IOL related 10 11.5 14 15.9 15 12.9 22 17.9 18 14.8 18 17.5 16 15.2 17 17.5
Infective endophthalmitis 12 13.8 6 6.8 6 5.2 9 7.3 2 1.6 5 4.8 7 6.7 9 9.3
Others 38 43.7 48 54.5 53 45.7 56 45.5 68 55.7 52 50.5 55 52.4 53 54.6
Total percentage may be more than 100% as patient might have multiple reasons for unplanned return to OT.
0
10
20
30
40
50
60
Iris prolapse Wound dehiscence
High IOP IOL related Infective endophthalmitis
Others
%
Type of reason
2007
2008
2009
2010
2011
2012
2013
2014
Figure 1.5.3-1: Reasons for Unplanned Return to Operating Theatre, CSR 2007-2014

105
Table 1.5.3-3: Time from Surgery to Unplanned Return to OT, CSR 2014
Post-operative period (day) N n Median Min Max Mean
Iris prolapse 7 6 27 0 55 26.8
Wound dehiscence 15 14 7 1 34 11.1
High IOP 3 3 4 2 27 11.0
IOL related 17 14 8 0 56 14.6
Infective endophthalmitis 9 9 5 2 41 11.0
Others 53 48 9 0 106 18.3
n = No. of available information
1.5.4 Post-operative Follow Up Period
Most patients were followed up until 7 weeks post-operatively.
Table 1.5.4-1: Median Follow-up Period by Types of Cataract Surgery (Eyes with Unaided Vision in Weeks), CSR
2014
Types of surgery N n Median 25th percentile 75th percentile
All surgeries 36257 36209 7 5 8
Phaco 31996 31996 7 5 8
ECCE 3011 3007 8 6 11
Phaco ECCE 694 691 8 6 11
ICCE 144 144 8 5 11
Lens aspiration 296 296 7 5 9
n = No. of available information
Table 1.5.4-2: Median Follow-up Period by Types of Cataract Surgery (Eyes with Refracted Vision) in Weeks, CSR
2014
Types of surgery N n Median 25th percentile 75th percentile
All surgeries 33532 33494 7 6 9
Phaco 29792 29769 7 6 8
ECCE 2671 2668 8 7 11
Phaco ECCE 623 620 9 6 11
ICCE 124 124 8 6 11
Lens aspiration 234 234 7 6 10
n = No. of available information
1.5.5 Post-operative Visual Acuity (All Eyes)
Only approximately 40-50% of eyes had vision unaided VA 6/12 or better i.e. good VA outcome. This percentage
increased double folds following refraction. This trend remained unchanged throughout the years.

106
Table 1.5.5-1: Post-operative Visual Acuity (All Eyes), CSR 2007-2014
Year 2007 2008 2009 2010
(N=18426) (N=21496) (N=24438) (N=28506)
Unaided Refracted Unaided Refracted Unaided Refracted Unaided Refracted
VA n % n % n % n % n % n % n % n %
6/5 3 0.0 35 0.2 9 0.0 51 0.3 10 0.0 46 0.2 12 0.0 119 0.5
6/6 878 5.6 4409 30.5 1126 5.9 6072 35.2 1100 5.3 6555 34.7 1568 6.4 8362 37.0
6/9 2806 17.8 4961 34.3 3040 15.9 5714 33.1 3649 17.7 6550 34.7 4523 18.4 7369 32.6
6/12 2717 17.2 2100 14.6 3351 17.6 2577 14.9 3837 18.6 2762 14.6 5054 20.6 3332 14.8
6/12 and better 6404 40.6 11505 79.6 7526 39.4 14414 83.5 8596 41.7 15913 84.3 11157 45.5 19182 85.0
6/18 2893 18.3 1055 7.3 3792 19.9 1012 5.9 4052 19.7 1050 5.6 4727 19.3 1131 5.0
<6/12-6/18 2893 18.3 1055 7.3 3792 19.9 1012 5.9 4052 19.7 1050 5.6 4727 19.3 1131 5.0
6/24 2315 14.7 573 4.0 2978 15.6 607 3.5 2958 14.4 616 3.3 3232 13.2 666 2.9
6/36 1687 10.7 444 3.1 2018 10.6 421 2.4 2095 10.2 416 2.2 2211 9.0 497 2.2
6/60 1126 7.1 266 1.9 1300 6.8 261 1.5 1323 6.4 276 1.5 1456 5.9 350 1.6
<6/18-6/60 5128 32.5 1283 9.0 6296 33.0 1289 7.4 6376 31.0 1308 7.0 6899 28.1 1513 6.7
5/60 92 0.6 23 0.2 116 0.6 37 0.2 93 0.5 27 0.1 119 0.5 37 0.2
4/60 87 0.6 35 0.2 97 0.5 30 0.2 103 0.5 31 0.2 112 0.5 31 0.1
3/60 207 1.3 80 0.6 266 1.4 112 0.6 331 1.6 118 0.6 378 1.5 151 0.7
<6/60-3/60 386 2.5 138 1.0 479 2.5 179 1.0 527 2.6 176 0.9 609 2.5 219 1.0
2/60 158 1.0 73 0.5 186 1.0 70 0.4 199 1.0 77 0.4 227 0.9 97 0.4
1/60 155 1.0 76 0.5 159 0.8 60 0.3 168 0.8 66 0.3 196 0.8 93 0.4
CF 300 1.9 121 0.8 295 1.5 85 0.5 315 1.5 127 0.7 345 1.4 147 0.7
HM 253 1.6 149 1.0 230 1.2 84 0.5 269 1.3 126 0.7 280 1.1 155 0.7
PL 75 0.5 46 0.3 53 0.3 22 0.1 58 0.3 31 0.2 47 0.2 24 0.1
NPL 34 0.2 0 0.0 32 0.2 0 0.0 30 0.1 12 0.1 35 0.1 18 0.1
<3/60 975 6.2 465 3.1 955 5.0 321 1.8 1039 5.0 439 2.3 1130 4.6 534 2.4
TOTAL 15786 100.0 14446 100.0 19048 100.0 17215 100.0 20590 100.0 18886 100.0 24522 100.0 22579 100.0
Year 2011 2012 2013 2014
(N=30611) (N=32473) (N=37150) (N=40532)
Unaided Refracted Unaided Refracted Unaided Refracted Unaided Refracted
VA n % n % n % n % n % n % n % n %
6/5 15 0.1 124 0.5 14 0.0 102 0.4 20 0.1 104 0.3 25 0.1 123 0.4
6/6 1776 6.5 9239 37.4 2011 7.0 9732 38.2 2664 8.1 11743 39.2 3165 8.7 13487 40.2
6/9 5040 18.5 8162 33.0 5498 19.2 8254 32.4 7101 21.5 9901 33.0 7765 21.4 10961 32.7
6/12 5499 20.2 3585 14.5 5925 20.7 3723 14.6 7122 21.5 4272 14.3 7870 21.7 4700 14.0
6/12 and better 12330 45.3 21110 85.4 13448 47.0 21811 85.5 16907 51.1 26020 86.8 18825 51.9 29271 87.3
6/18 5209 19.1 1218 4.9 5285 18.5 1327 5.2 5923 17.9 1381 4.6 6638 18.3 1475 4.4
<6/12-6/18 5209 19.1 1218 4.9 5285 18.5 1327 5.2 5923 17.9 1381 4.6 6638 18.3 1475 4.4
6/24 3689 13.6 738 3.0 3728 13.0 746 2.9 4062 12.3 820 2.7 4421 12.2 938 2.8
6/36 2528 9.3 503 2.0 2713 9.5 531 2.1 2592 7.8 552 1.8 2724 7.5 617 1.8
6/60 1558 5.7 388 1.6 1468 5.1 361 1.4 1606 4.9 390 1.3 1701 4.7 425 1.3
<6/18-6/60 7775 28.6 1629 6.6 7909 27.7 1638 6.4 8260 25.0 1762 5.9 8846 24.4 1980 5.9
5/60 111 0.4 28 0.1 130 0.5 38 0.1 135 0.4 33 0.1 122 0.3 33 0.1
4/60 109 0.4 32 0.1 119 0.4 26 0.1 103 0.3 43 0.1 104 0.3 35 0.1
3/60 435 1.6 155 0.6 469 1.6 168 0.7 479 1.4 167 0.6 447 1.2 199 0.6
<6/60-3/60 655 2.4 215 0.9 718 2.5 232 0.9 717 2.2 243 0.8 673 1.9 267 0.8
2/60 249 0.9 113 0.5 257 0.9 94 0.4 291 0.9 124 0.4 303 0.8 131 0.4
1/60 213 0.8 99 0.4 211 0.7 79 0.3 239 0.7 111 0.4 237 0.7 86 0.3
CF 400 1.5 135 0.5 371 1.3 125 0.5 352 1.1 138 0.5 353 1.0 128 0.4
HM 294 1.1 150 0.6 291 1.0 154 0.6 279 0.8 138 0.5 291 0.8 158 0.5
PL 52 0.2 20 0.1 61 0.2 28 0.1 64 0.2 34 0.1 59 0.2 24 0.1
NPL 42 0.2 18 0.1 38 0.1 17 0.1 35 0.1 17 0.1 32 0.1 12 0.0
<3/60 1250 4.6 535 2.2 1229 4.3 497 1.9 1260 3.8 562 1.9 1275 3.5 539 1.6
TOTAL 27219 100.0 24707 100.0 28589 100.0 25505 100.0 33067 100.0 29968 100.0 36257 100.0 33532 100.0
Number and percentage (%) are based on available information.

107
2007 2008
0
5
10
15
20
25
30
35
40
6/5
6/6
6/9
6/12
6/18
6/24
6/36
6/60
5/60
4/60
3/60
2/60
1/60 C
FHM PL
NPL
VA
%
Unaided
Refracted
0
5
10
15
20
25
30
35
40
6/5
6/6
6/9
6/12
6/18
6/24
6/36
6/60
5/60
4/60
3/60
2/60
1/60 C
FHM PL
NPL
VA
%
Unaided
Refracted
2009 2010
0
5
10
15
20
25
30
35
40
6/5
6/6
6/9
6/12
6/18
6/24
6/36
6/60
5/60
4/60
3/60
2/60
1/60 C
FHM PL
NPL
VA
%
Unaided
Refracted
0
5
10
15
20
25
30
35
40
6/5
6/6
6/9
6/12
6/18
6/24
6/36
6/60
5/60
4/60
3/60
2/60
1/60 C
FHM PL
NPL
VA
%
Unaided
Refracted
2011 2012
0
5
10
15
20
25
30
35
40
%
VA
Unaided
Refracted
0
5
10
15
20
25
30
35
40
45
%
VA
Unaided
Refracted

108
2013 2014
0
5
10
15
20
25
30
35
40
45%
VA
Unaided
Refracted
0
5
10
15
20
25
30
35
40
45
%
VA
Unaided
Refracted
Figure 1.5.5-1: Percentage Distribution of Post-operative Unaided and Refracted Visual Acuity, CSR 2007-2014
0
10
20
30
40
50
60
70
2007 2008 2009 2010 2011 2012 2013 2014
%
Year
Unaided VA
6/12 and better
<6/12-6/18
<6/18-6/60
<6/60-3/60
<3/60
Figure 1.5.5-2: Post-operative Unaided Visual Acuity by Visual Category (All Eyes), CSR 2007-2014
0
10
20
30
40
50
60
70
80
90
100
2007 2008 2009 2010 2011 2012 2013 2014
%
Year
Refracted VA
6/12 and better
<6/12-6/18
<6/18-6/60
<6/60-3/60
<3/60
Figure 1.5.5-3: Post-operative Refracted Visual Acuity by Visual Category (All Eyes), CSR 2007-2014

109
1.5.6 Post-operative Visual Acuity (Eyes without Ocular Co-morbidity)
The percentage of eyes with unaided VA 6/12 or better slightly increased but similar to eyes with ocular co-morbidity;
this percentage increased double folds following refraction. This trend remained unchanged throughout the years.
Table 1.5.6-1: Post-operative Visual Acuity (Eyes without Ocular Co-morbidity), CSR 2007-2014
Year 2007 2008 2009 2010
Unaided Refracted Unaided Refracted Unaided Refracted Unaided Refracted
VA n % n % n % n % n % n % n % n %
6/5 3 0.0 25 0.3 2 0.0 23 0.3 8 0.1 37 0.3 7 0.0 83 0.6
6/6 667 6.2 3326 33.5 561 6.2 3061 36.4 802 6.4 4717 40.0 1127 8.0 5640 42.8
6/9 2061 19.3 3574 36.0 1477 16.4 2939 35.0 2595 20.6 4348 36.9 2989 21.1 4550 34.5
6/12 2021 18.9 1473 14.8 1683 18.7 1377 16.4 2585 20.5 1602 13.6 3311 23.4 1842 14.0
6/12 and better 4752 44.4 8398 84.6 3723 41.3 7400 88.1 5990 47.6 10704 90.8 7434 52.6 12115 92.0
6/18 2037 19.1 634 6.4 1882 20.9 411 4.9 2599 20.6 479 4.1 2777 19.6 445 3.4
<6/12-6/18 2037 19.1 634 6.4 1882 20.9 411 4.9 2599 20.6 479 4.1 2777 19.6 445 3.4
6/24 1619 15.1 351 3.5 1518 16.9 254 3.0 1772 14.0 251 2.1 1805 12.8 242 1.8
6/36 1087 10.2 234 2.4 975 10.8 151 1.8 1170 9.3 152 1.3 1113 7.9 139 1.1
6/60 650 6.1 113 1.1 536 6.0 71 0.8 651 5.2 61 0.5 586 4.1 83 0.6
<6/18-6/60 3356 31.4 698 7.0 3029 33.7 476 5.6 3593 28.5 464 3.9 3504 24.8 464 3.5
5/60 52 0.5 8 0.1 52 0.6 10 0.1 38 0.3 8 0.1 50 0.4 11 0.1
4/60 48 0.4 13 0.1 25 0.3 7 0.1 33 0.3 5 0.0 31 0.2 6 0.0
3/60 94 0.9 26 0.3 79 0.9 29 0.3 114 0.9 37 0.3 105 0.7 33 0.3
<6/60-3/60 194 1.8 47 0.5 156 1.8 46 0.5 185 1.5 50 0.4 186 1.3 50 0.4
2/60 62 0.6 25 0.3 54 0.6 16 0.2 60 0.5 15 0.1 56 0.4 16 0.1
1/60 68 0.6 23 0.2 33 0.4 8 0.1 46 0.4 16 0.1 40 0.3 18 0.1
CF 120 1.1 47 0.5 73 0.8 23 0.3 87 0.7 27 0.2 87 0.6 31 0.2
HM 69 0.6 42 0.4 31 0.3 12 0.1 46 0.4 20 0.2 48 0.3 26 0.2
PL 23 0.2 13 0.1 7 0.1 4 0.0 9 0.1 6 0.1 7 0.0 5 0.0
NPL 8 0.1 7 0.1 7 0.1 0 0.0 3 0.0 1 0.0 3 0.0 1 0.0
<3/60 350 3.2 157 1.6 205 2.3 63 0.7 251 2.1 85 0.7 241 1.7 97 0.7
TOTAL 10689 100.0 9934 100.0 8995 100.0 8396 100.0 12618 100.0 11782 100.0 14142 100.0 13171 100.0
Year 2011 2012 2013 2014
Unaided Refracted Unaided Refracted Unaided Refracted Unaided Refracted
VA n % n % n % n % n % n % n % n %
6/5 14 0.1 105 0.7 11 0.1 82 0.5 15 0.1 80 0.4 14 0.1 87 0.4
6/6 1249 7.9 6314 43.3 1422 8.3 6779 44.0 1922 9.9 8110 45.2 2214 10.3 9296 45.5
6/9 3447 21.8 5167 35.4 3845 22.5 5358 34.8 4846 24.9 6281 35.0 5369 24.9 7111 34.8
6/12 3587 22.6 1882 12.9 3870 22.7 2060 13.4 4502 23.1 2273 12.7 5036 23.3 2677 13.1
6/12 and better 8297 52.4 13468 92.4 9148 53.6 14279 92.6 11285 58.0 16744 93.3 12633 58.5 19171 93.8
6/18 3061 19.3 480 3.3 3212 18.8 501 3.3 3508 18.0 508 2.8 4004 18.5 548 2.7
<6/12-6/18 3061 19.3 480 3.3 3212 18.8 501 3.3 3508 18.0 508 2.8 4004 18.5 548 2.7
6/24 2098 13.2 267 1.8 2154 12.6 248 1.6 2235 11.5 288 1.6 2482 11.5 305 1.5
6/36 1253 7.9 132 0.9 1419 8.3 159 1.0 1268 6.5 160 0.9 1284 5.9 164 0.8
6/60 651 4.1 107 0.7 640 3.7 100 0.6 683 3.5 90 0.5 685 3.2 98 0.5
<6/18-6/60 4002 25.3 506 3.5 4213 24.7 507 3.3 4186 21.5 538 3.0 4451 20.6 567 2.8
5/60 40 0.3 5 0.0 41 0.2 4 0.0 41 0.2 7 0.0 38 0.2 11 0.1
4/60 39 0.2 8 0.1 31 0.2 3 0.0 34 0.2 12 0.1 25 0.1 4 0.0
3/60 131 0.8 26 0.2 142 0.8 33 0.2 139 0.7 33 0.2 152 0.7 44 0.2
<6/60-3/60 210 1.3 39 0.3 214 1.3 40 0.3 214 1.1 52 0.3 215 1.0 59 0.3
2/60 71 0.4 22 0.2 78 0.5 18 0.1 72 0.4 23 0.1 83 0.4 20 0.1
1/60 51 0.3 15 0.1 60 0.4 22 0.1 55 0.3 21 0.1 75 0.3 19 0.1
CF 93 0.6 19 0.1 102 0.6 26 0.2 93 0.5 30 0.2 84 0.4 27 0.1
HM 46 0.3 23 0.2 37 0.2 15 0.1 46 0.2 21 0.1 43 0.2 19 0.1
PL 9 0.1 3 0.0 11 0.1 3 0.0 6 0.0 2 0.0 8 0.0 6 0.0
NPL 6 0.0 1 0.0 3 0.0 2 0.0 7 0.0 5 0.0 3 0.0 1 0.0
<3/60 276 1.7 83 0.6 291 1.7 86 0.6 279 1.4 102 0.6 296 1.4 92 0.5
TOTAL 15846 100.0 14576 100.0 17078 100.0 15413 100.0 19472 100.0 17944 100.0 21599 100.0 20437 100.0
Number and percentage (%) are based on available information.

110
0
5
10
15
20
25
30
35
40
45
50
6/5
6/6
6/9
6/1
2
6/1
8
6/2
4
6/3
6
6/6
0
5/6
0
4/6
0
3/6
0
2/6
0
1/6
0
CF
HM PL
NP
L
%
Visual Acuity
2012
Unaided
Refracted

111
0
5
10
15
20
25
30
35
40
45
506
/5
6/6
6/9
6/1
2
6/1
8
6/2
4
6/3
6
6/6
0
5/6
0
4/6
0
3/6
0
2/6
0
1/6
0
CF
HM PL
NP
L
%
Visual Acuity
2012
Unaided
Refracted
0
5
10
15
20
25
30
35
40
45
50
6/5
6/6
6/9
6/1
2
6/1
8
6/2
4
6/3
6
6/6
0
5/6
0
4/6
0
3/6
0
2/6
0
1/6
0
CF
HM PL
NP
L
%
Visual Acuity
2014
Unaided
Refracted
Figure 1.5.6-1: Post-operative Visual Acuity for Eyes Without Ocular Co-morbidity, CSR 2007-2014
0
10
20
30
40
50
60
70
2007 2008 2009 2010 2011 2012 2013 2014
%
Year
Unaided VA
6/12 and better
<6/12-6/18
<6/18-6/60
<6/60-3/60
<3/60
Figure 1.5.6-2: Post-operative Unaided Visual Acuity by Visual Category (No Ocular Co-morbidity), CSR 2007- 2014
0
10
20
30
40
50
60
70
80
90
100
2007 2008 2009 2010 2011 2012 2013 2014
%
Year
Refracted VA
6/12 and better
<6/12-6/18
<6/18-6/60
<6/60-3/60
<3/60
Figure 1.5.6-3: Post-operative Refracted Visual Acuity by Visual Category (No Ocular Co-morbidity), CSR 2007-2014

112
1.5.7 Post-operative Visual Acuity 6/12 or Better in Eyes without Ocular Co-morbidity
The patients who had undergone phacoemulsification showed the highest proportion of achieving good visual
outcome when compared with other surgeries. The percentage demonstrated an increasing trend (from 86.0% in 2007
to 94.8% in 2014). When complication occurred in phacoemulsification which necessitated conversion to ECCE, the
visual outcome became less favorable.
The proportion of eyes with unaided VA 6/12 or better was poor in almost all types of surgery throughout the years.
This percentage increased double folds following refraction. These findings indicated that a large number of patients
required some forms of visual rehabilitation or correction post-operatively.
Table 1.5.7-1: Post-operative Visual Acuity in Eyes without Ocular Co-morbidity by Types of Surgery, CSR 2007-2014
Year
2007 2008 2009
Unaided Refracted Unaided Refracted Unaided Refracted
N n % N n % N n % N n % N n % N n %
All Surgeries 7130 3080 43.0 6632 5551 84.0 8983 3719 41.0 8390 7392 88.0 12618 5990 47.5 11782 10704 90.9
Phaco 4868 2332 48.0 4508 3890 86.0 6419 3017 47.0 5958 5440 91.0 9511 5038 53.0 9001 8397 93.3
ECCE 2033 675 33.0 1910 1520 80.0 2263 629 28.0 2158 1744 81.0 2607 816 31.3 2329 1967 84.5
Phaco → ECCE 158 36 23.0 143 89 62.0 201 40 20.0 184 140 76.0 270 53 19.6 259 200 77.2
Lens Aspiration 62 33 53.0 59 46 78.0 74 29 39.0 66 54 82.0 160 57 35.6 128 89 69.5
ICCE 15 2 13.0 10 4 39.0 24 4 17.0 19 11 58.0 29 7 24.1 25 15 60.0
Year
2010 2011 2012
Unaided Refracted Unaided Refracted Unaided Refracted
N n % N n % N n % N n % N n % N n %
All Surgeries 14142 7434 52.6 13171 12115 92.0 15846 8297 52.4 14576 13468 92.4 17078 9148 53.6 15413 14279 92.6
Phaco 11520 6589 57.2 10818 10151 93.8 13036 7454 57.2 12155 11465 94.3 14540 8439 58.0 13344 12564 94.2
ECCE 2089 672 32.2 1866 1596 85.5 2238 689 30.8 1901 1628 85.6 2044 570 27.9 1633 1373 84.1
Phaco → ECCE 268 67 25.0 253 198 78.3 311 59 19.0 291 210 72.2 261 41 15.7 239 176 73.6
Lens Aspiration 192 86 44.8 168 126 75.0 200 79 39.5 175 131 74.9 163 84 51.5 141 124 87.9
ICCE 28 4 14.3 25 13 52.0 20 3 15.0 19 10 52.6 24 2 8.3 20 13 65.0
Year
2013 2014
Unaided Refracted Unaided Refracted
N n % N n % N n % N n %
All Surgeries 19441 11264 57.9 17915 16716 93.3 21585 12624 58.5 20425 19160 93.8
Phaco 17505 10710 61.2 16159 15275 94.5 19937 12128 60.8 18914 17924 94.8
ECCE 1403 386 27.5 1269 1053 83.0 1139 335 29.4 1051 886 84.3
Phaco → ECCE 306 69 22.5 281 219 77.9 301 81 26.9 283 211 74.6
Lens Aspiration 164 84 51.2 151 129 85.4 145 66 45.5 125 107 85.6
ICCE 38 8 21.1 35 28 80.0 30 8 26.7 28 16 57.1
Number and percentage (%) are based on available information.

113
48.0 47.053.0
57.2 57.2 58.061.2 60.8
86.091.0 93.3 93.8 94.3 94.2 94.5 94.8
33.028.0
31.3 32.2 30.827.9 27.5 29.4
80.0 81.084.5 85.5 85.6 84.1 83.0 84.3
0
10
20
30
40
50
60
70
80
90
100
2007 2008 2009 2010 2011 2012 2013 2014
%
Year
Phaco (Unaided)
Phaco (Refracted)
ECCE (Unaided)
ECCE (Refracted)
Figure 1.5.7-1: Post-operative Visual Acuity 6/12 or Better for Eyes Without Ocular Co-morbidity (ECCE and Phaco),
CSR 2007-2014
Table 1.5.7-2: Post-operative Refracted Visual Acuity in Eyes without Ocular Co-morbidity by Intra-operative
Complications and Types of Surgery, CSR 2014
Types of Cataract Surgery
All Surgeries Lens Aspiration ECCE Phaco Phaco → ECCE ICCE
N n % N n % N n % N n % N n % N n %
20425 19160 93.8 125 107 85.6 1051 886 84.3 18914 17924 94.8 283 211 74.6 28 16 57.1
With intra-op
complications 875 704 80.5 9 7 77.8 99 75 75.8 619 522 84.3 133 93 69.9 6 3 50.0
No intra-op
complications 19550 18456 94.4 116 100 86.2 952 811 85.2 18295 17402 95.1 150 118 78.7 22 13 59.1
Number and percentage (%) are based on available information.
Table 1.5.7-3: Post-operative Refracted Visual Acuity in Eyes without Ocular Co-morbidity by Surgeon Status and
Types of Surgery, CSR 2014
Types of Cataract Surgery
All Surgeries Lens Aspiration ECCE Phaco Phaco → ECCE ICCE
N n % N n % N n % N n % N n % N n %
20425 19160 93.8 125 107 85.6 1051 886 84.3 18914 17924 94.8 283 211 74.6 28 16 57.1
Specialist 18254 17160 94.0 118 100 84.7 651 551 84.6 17201 16304 94.8 243 179 73.7 22 13 59.1
Gazetting Specialist 1165 1078 92.5 5 5 100.0 70 57 81.4 1052 988 93.9 32 25 78.1 3 1 33.3
Medical Officer 966 883 91.4 2 2 100.0 329 277 84.2 623 595 95.5 7 6 85.7 3 2 66.7
Number and percentage (%) are based on available information.
In general, better visual outcomes were observed in ECCE performed by the specialists. Otherwise they are all
comparable.

114
55
60
65
70
75
80
85
90
95
100
2007 2008 2009 2010 2011 2012 2013 2014
%
Year
Phaco
Specialist
Gazetting Specialist
Medical Officer
Figure 1.5.7-2: Post-operative Refracted Visual Acuity 6/12 or Better in Eyes Without Ocular Co-morbidity by Surgeon
Status in Phaco, CSR 2007-2014
55
60
65
70
75
80
85
90
95
100
2007 2008 2009 2010 2011 2012 2013 2014
%
Year
ECCE
Specialist
Gazetting Specialist
Medical Officer
Figure 1.5.7-3: Post-operative Refracted Visual Acuity 6/12 or Better in Eyes Without Ocular Co-morbidity by Surgeon
Status in ECCE, CSR 2007-2014
55
60
65
70
75
80
85
90
95
100
2007 2008 2009 2010 2011 2012 2013 2014
%
Year
Phaco converted to ECCE
Specialist
Gazetting Specialist
Medical Officer
Figure 1.5.7-4: Post-operative Refracted Visual Acuity 6/12 or Better in Eyes Without Ocular Co-morbidity by Surgeon
Status in Phaco Converted to ECCE, CSR 2007-2014

115
Table 1.5.7-4: Post-operative Refracted Visual Acuity in Eyes without Ocular Co-morbidity by SDP and Types of
Surgery, CSR 2014
Hospital
Type of Cataract Surgery
All
Patients All Surgeries Lens Aspiration ECCE Phaco Phaco → ECCE ICCE
N N n % N n % N n % N n % N n % N n %
All centre 20437 20425 19160 93.8 125 107 85.6 1051 886 84.3 18914 17924 94.8 283 211 74.6 28 16 57.1
Alor Setar 1021 1021 925 90.6 9 7 77.8 119 92 77.3 876 818 93.4 12 6 50.0 0 0 0.0
Ampang 463 463 457 98.7 0 0 0.0 16 16 100.0 439 433 98.6 7 7 100.0 0 0 0.0
Batu Pahat 272 272 257 94.5 1 1 100.0 32 27 84.4 224 216 96.4 15 13 86.7 0 0 0.0
Bintulu 253 253 241 95.3 0 0 0.0 3 3 100.0 244 232 95.1 6 6 100.0 0 0 0.0
Bukit Mertajam 369 369 364 98.6 0 0 0.0 37 35 94.6 329 326 99.1 3 3 100.0 0 0 0.0
Ipoh 1636 1636 1517 92.7 5 3 60.0 52 44 84.6 1563 1458 93.3 12 8 66.7 1 1 100.0
Johor Bahru 481 481 436 90.6 3 2 66.7 11 7 63.6 461 424 92.0 4 2 50.0 1 1 100.0
Kangar 129 129 120 93.0 1 1 100.0 3 3 100.0 125 116 92.8 0 0 0.0 0 0 0.0
Kemaman 13 13 13 100.0 0 0 0.0 4 4 100.0 9 9 100.0 0 0 0.0 0 0 0.0
Keningau 78 78 78 100.0 0 0 0.0 17 17 100.0 61 61 100.0 0 0 0.0 0 0 0.0
Klang 973 973 906 93.1 4 4 100.0 42 34 81.0 910 856 94.1 11 9 81.8 3 0 0.0
Kota Bharu 43 43 41 95.3 2 1 50.0 10 9 90.0 31 31 100.0 0 0 0.0 0 0 0.0
Kota Kinabalu 652 651 598 91.9 7 5 71.4 62 54 87.1 559 526 94.1 14 9 64.3 4 2 50.0
Kuala Krai 156 156 150 96.2 2 1 50.0 13 13 100.0 135 130 96.3 6 6 100.0 0 0 0.0
Kuala Lumpur 743 737 676 91.7 3 3 100.0 92 78 84.8 631 587 93.0 11 8 72.7 0 0 0.0
Kuala Pilah 336 336 326 97.0 4 4 100.0 17 16 94.1 301 294 97.7 12 10 83.3 2 2 100.0
Kuala
Terengganu 530 530 492 92.8 12 11 91.7 79 62 78.5 432 412 95.4 5 5 100.0 2 2 100.0
Kuantan 362 362 347 95.9 4 3 75.0 67 61 91.0 284 278 97.9 6 5 83.3 1 0 0.0
Kuching 1054 1054 961 91.2 6 5 83.3 4 2 50.0 1034 948 91.7 9 5 55.6 1 1 100.0
Kulim 145 145 136 93.8 3 1 33.3 6 4 66.7 134 130 97.0 1 1 100.0 1 0 0.0
Melaka 1023 1023 950 92.9 7 7 100.0 37 30 81.1 970 906 93.4 9 7 77.8 0 0 0.0
Miri 614 614 585 95.3 0 0 0.0 19 18 94.7 590 565 95.8 3 2 66.7 2 0 0.0
Muar 318 318 298 93.7 0 0 0.0 18 16 88.9 284 268 94.4 14 13 92.9 2 1 50.0
Pulau Pinang 823 823 781 94.9 2 2 100.0 3 3 100.0 811 771 95.1 4 3 75.0 1 1 100.0
Putrajaya 186 186 178 95.7 4 4 100.0 8 5 62.5 166 162 97.6 8 7 87.5 0 0 0.0
Sandakan 122 122 111 91.0 1 1 100.0 12 8 66.7 109 102 93.6 0 0 0.0 0 0 0.0
Sarikei 268 268 254 94.8 0 0 0.0 1 1 100.0 266 252 94.7 0 0 0.0 1 1 100.0
Selayang 408 408 371 90.9 13 11 84.6 15 13 86.7 371 342 92.2 6 3 50.0 1 0 0.0
Serdang 609 609 548 90.0 8 8 100.0 25 22 88.0 559 507 90.7 17 11 64.7 0 0 0.0
Seremban 707 707 664 93.9 1 1 100.0 19 15 78.9 681 645 94.7 6 3 50.0 0 0 0.0
Sibu 323 323 308 95.4 1 1 100.0 2 2 100.0 320 305 95.3 0 0 0.0 0 0 0.0
Sri Manjung 415 412 397 96.4 0 0 0.0 5 3 60.0 407 394 96.8 0 0 0.0 0 0 0.0
Sultan Ismail 317 317 314 99.1 4 4 100.0 30 29 96.7 273 271 99.3 10 10 100.0 0 0 0.0
Sungai Buloh 411 411 379 92.2 2 1 50.0 18 11 61.1 375 358 95.5 16 9 56.3 0 0 0.0
Sungei Petani 294 294 284 96.6 8 8 100.0 12 9 75.0 267 262 98.1 7 5 71.4 0 0 0.0
Taiping 315 315 314 99.7 0 0 0.0 8 8 100.0 307 306 99.7 0 0 0.0 0 0 0.0
Tawau 84 84 75 89.3 0 0 0.0 19 17 89.5 61 55 90.2 3 2 66.7 1 1 100.0
Teluk Intan 494 492 474 96.3 0 0 0.0 16 14 87.5 471 457 97.0 3 2 66.7 1 0 0.0
Temerloh 775 775 727 93.8 7 6 85.7 56 44 78.6 693 665 96.0 18 11 61.1 1 1 100.0
KK1M
Terengganu 29 29 28 96.6 0 0 0.0 7 6 85.7 22 22 100.0 0 0 0.0 0 0 0.0
KK1M
Kelantan 71 71 67 94.4 0 0 0.0 26 24 92.3 42 40 95.2 2 2 100.0 0 0 0.0
KK1M Sarawak 551 551 494 89.7 0 0 0.0 2 1 50.0 548 493 90.0 1 0 0.0 0 0 0.0
MAIWP 1571 1571 1518 96.6 1 1 100.0 7 6 85.7 1539 1491 96.9 22 18 81.8 2 2 100.0
Number and percentage (%) are based on available information.

116
93.889.39090.090.690.690.991.091.291.791.992.292.792.892.993.093.193.793.893.893.994.494.594.894.995.395.395.395.495.795.996.296.396.496.696.69797.0
98.698.799.199.7100100
0 10 20 30 40 50 60 70 80 90 100
All centreTawau
KK1M SarawakSerdang
Alor SetarJohor Bahru
SelayangSandakan
KuchingKuala LumpurKota KinabaluSungai Buloh
IpohKuala Terengganu
MelakaKangar
KlangMuar
KulimTemerlohSeremban
KK1M KelantanBatu Pahat
SarikeiPulau Pinang
BintuluMiri
Kota BharuSibu
PutrajayaKuantan
Kuala KraiTeluk Intan
Sri ManjungKK1M Terengganu
Sungei PetaniMAIWP
Kuala PilahBukit Mertajam
AmpangSultan Ismail
TaipingKemamanKeningau
Percent
Ho
spit
al
Post-op refracted vision 6/12 or better by SDP - All surgeries
Figure 1.5.7-5: Post-operative Refracted Visual Acuity 6/12 or Better in Eyes Without Ocular Co-morbidity by SDP (All
Surgery), CSR 2014
94.890.0
90.290.7
91.792.0
92.292.8
93.093.393.493.4
93.694.194.1
94.494.794.7
95.195.195.295.395.495.5
95.896.0
96.396.4
96.896.997.097.0
97.697.7
97.998.1
98.699.1
99.399.7100100100100
84 86 88 90 92 94 96 98 100
All centreKK1M Sarawak
TawauSerdangKuching
Johor BahruSelayang
KangarKuala Lumpur
IpohAlor Setar
MelakaSandakan
KlangKota Kinabalu
MuarSeremban
SarikeiPulau Pinang
BintuluKK1M Kelantan
SibuKuala Terengganu
Sungai BulohMiri
TemerlohKuala Krai
Batu PahatSri Manjung
MAIWPKulim
Teluk IntanPutrajaya
Kuala PilahKuantan
Sungei PetaniAmpang
Bukit MertajamSultan Ismail
TaipingKemamanKeningau
Kota BharuKK1M Terengganu
Percent
Hos
pita
l
Post-op refracted vision 6/12 or better by SDP - Phaco
Figure 1.5.7-6: Post-operative Refracted Visual Acuity 6/12 or Better in Eyes Without Ocular Co-morbidity by SDP
(Phaco), CSR 2014

117
84.350.050
60.061.1
62.563.6
66.766.7
75.077.3
78.578.678.9
81.081.1
84.484.684.8868686.787.187.588.088.989.590.091.0
9294.194.694.7
96.7100100100100100100100100100100
0 10 20 30 40 50 60 70 80 90 100
All centreKuching
KK1M SarawakSri Manjung
Sungai BulohPutrajaya
Johor BahruKulim
SandakanSungei Petani
Alor SetarKuala Terengganu
TemerlohSeremban
KlangMelaka
Batu PahatIpoh
Kuala LumpurKK1M Terengganu
MAIWPSelayang
Kota KinabaluTeluk Intan
SerdangMuar
TawauKota Bharu
KuantanKK1M Kelantan
Kuala PilahBukit Mertajam
MiriSultan Ismail
AmpangBintuluKangar
KemamanKeningauKuala Krai
Pulau PinangSarikei
SibuTaiping
Percent
Ho
spit
al
Post-op refracted vision 6/12 or better by SDP - ECCE
Figure 1.5.7-7: Post-operative Refracted Visual Acuity 6/12 or Better in Eyes Without Ocular Co-morbidity by SDP
(ECCE), CSR 2014
1.5.8 Reasons for No Record of Visual Acuity
Table 1.5.8-1: Reasons for No Records of Visual Acuity, CSR 2007-2014
Years 2007 2008 2009 2010 2011 2012 2013 2014
Reasons n % n % n % n % n % n % n % n %
All cases 1428 100.0 1535 100.0 1805 100.0 1659 100.0 2036 100.0 2022 100.0 2333 100.0 2247 100.0
Loss to follow-up 1018 71.3 1230 80.1 1261 69.9 1078 65.0 1362 66.9 1451 71.8 1697 72.7 1698 75.6
Discharged by
doctor 31 2.2 13 0.8 44 2.4 38 2.3 32 1.6 22 1.1 36 1.5 21 0.9
Unable to take vision 47 3.3 26 1.7 30 1.7 33 2.0 27 1.3 33 1.6 26 1.1 15 0.7
Others 269 18.8 194 12.6 222 12.3 210 12.7 186 9.1 281 13.9 260 11.1 238 10.6
Number and percentage (%) are based on available information.
1.5.9 Factors Contributing to Post-operative Refracted Visual Acuity of Worse than 6/12
The main contributing factors for eyes with post-operative refracted VA worse than 6/12 were pre-existing ocular co-
morbidity followed by high astigmatism. High astigmatism, PCO and CMO in particular showed a decreasing trend
consistent with the shift towards phacoemulsification and improvement in other aspect of cataract surgery technique
over the years. Percentages of eyes with preexisting ocular co-morbidity were in an increasing trend.

118
Table 1.5.9-1: Factors Contributing to Post-operative Refracted Visual Acuity of Worse than 6/12 (All Eyes), CSR
2007-2014
Years 2007 2008 2009 2010 2011 2012 2013 2014
Factors n % n % n % n % n % n % n % n %
N (total no. of post-
op refracted vision
worse than 6/12)
2973 3397 3597 3694 3948 4261
Preexisting ocular
co-morbidity 904 28.8 802 28.4 1016 34.2 1364 40.2 1412 39.3 1544 41.8 1571 39.8 1715 40.2
High astigmatism 478 15.2 460 16.3 395 13.3 378 11.1 397 11.0 438 11.9 435 11.0 364 8.5
Posterior capsular
opacity 140 4.5 112 4.0 136 4.6 112 3.3 111 3.1 114 3.1 91 2.3 94 2.2
Cystoid macular
oedema 101 3.2 64 2.3 82 2.8 94 2.8 96 2.7 88 2.4 80 2.0 110 2.6
Endophthalmitis 14 0.4 6 0.2 6 0.2 5 0.1 2 0.1 4 0.1 2 0.1 10 0.2
Corneal
decompensation 28 0.9 31 1.1 61 2.1 33 1.0 36 1.0 42 1.1 50 1.3 84 2.0
Decentered IOL 4 0.1 6 0.2 5 0.2 5 0.1 8 0.2 9 0.2 15 0.4 7 0.2
Retinal detachment 67 2.1 50 1.8 56 1.9 44 1.3 35 1.0 69 1.9 29 0.7 36 0.8
Others 620 19.8 603 21.3 794 26.7 857 25.2 927 25.8 1072 29.0 1111 28.1 1098 25.8
0
5
10
15
20
25
30
35
40
45
2007 2008 2009 2010 2011 2012 2013 2014
%
Year
Preexisting ocular co-morbidity
High astigmatism
Posterior capsular opacity
Cystoid macular oedema
Endophthalmitis
Corneal decompensation
Decentered IOL
Retinal detachment
Figure 1.5.9-1: Factors Contributing to Post-operative Refracted Visual Acuity worse than 6/12 (All Eyes), CSR 2007-
2014

119
Table 1.5.9-2: Factors Contributing to Post-operative Refracted Visual Acuity of Worse than 6/12 (Eyes without Ocular
Co-morbidity), CSR 2007-2014
Years 2007 2008 2009 2010 2011 2012 2013 2014
Factors n % n % n % n % n % n % n % n %
N 1078 1056 1108 1134 1200 1266
Preexisting ocular co-
morbidity (not detected
pre-operatively)
271 17.6 229 16.5 121 11.2 92 8.7 66 6.0 98 8.6 70 5.8 112 8.8
High astigmatism 303 19.7 286 20.6 178 16.5 180 17.0 175 15.8 193 17.0 167 13.9 162 12.8
Posterior capsular opacity 83 5.4 61 4.4 87 8.1 65 6.2 50 4.5 51 4.5 39 3.3 39 3.1
Cystoid macular oedema 52 3.4 26 1.9 32 3.0 42 4.0 38 3.4 38 3.4 29 2.4 45 3.6
Endophthalmitis 9 0.6 4 0.3 4 0.4 2 0.2 1 0.1 2 0.2 0 0.0 4 0.3
Corneal decompensation 15 1.0 13 0.9 36 3.3 21 2.0 18 1.6 18 1.6 18 1.5 36 2.8
Decentered IOL 4 0.3 2 0.1 1 0.1 0 0.0 4 0.4 5 0.4 6 0.5 1 0.1
Retinal detachment 18 1.2 11 0.8 11 1.0 6 0.6 1 0.1 6 0.5 3 0.3 3 0.2
Others 320 20.8 323 23.3 368 34.1 389 36.8 453 40.9 506 44.6 521 43.4 501 39.6
Missing/Unavailable 461 30.0 NA - NA - NA - NA - NA - NA - NA -
1.5.10 Actual or Residual Refractive Power (in Spherical Equivalent)
Target refractive power is the refractive power aimed by the surgeon for a patient while the actual or residual refractive
power or spherical equivalent (SE) is the postoperative refraction results for the same eye. Myopic shift is the shift of
the refraction status (actual refraction) towards more negative value as compared to the targeted refraction pre-
operatively. It can be the results of surgery induced astigmatism or more anterior placement of IOL in the bag. It can
also be due to indentation of eyeball during biometry resulting in shorter axial length.
Data from 2007 to 2009 demonstrated that ECCE produced more myopic shift as compared to phaco. The difference
between the target and actual refraction remained a broad-based distribution curve indicating that a large percentage
of eyes did not achieve the target refraction status post-operatively.
Table 1.5.10-1: Distribution of Target and Actual Refractive Power in ECCE and Phaco, CSR 2007-2014
Target Refraction
All Patient
Years 2007 2008 2009 2010 2011 2012 2013 2014
N 11876 15083 20279 24528 25887 26061 28693 32260
Mean -0.5 -0.1 -0.4 -0.4 -0.4 -0.4 -0.4 -0.4
SD +0.4 +0.4 +0.4 +0.4 +0.3 +0.4 +0.3 +0.3
Median -0.5 -0.5 -0.5 -0.4 -0.4 -0.4 -0.4 -0.4
Min -9.0 -9.9 -9.9 -9.1 -9.1 -8.0 -8.5 -8.1
Max +5.0 +9.5 +5.9 +6.0 +4.8 +9.0 +9.0 +6.0
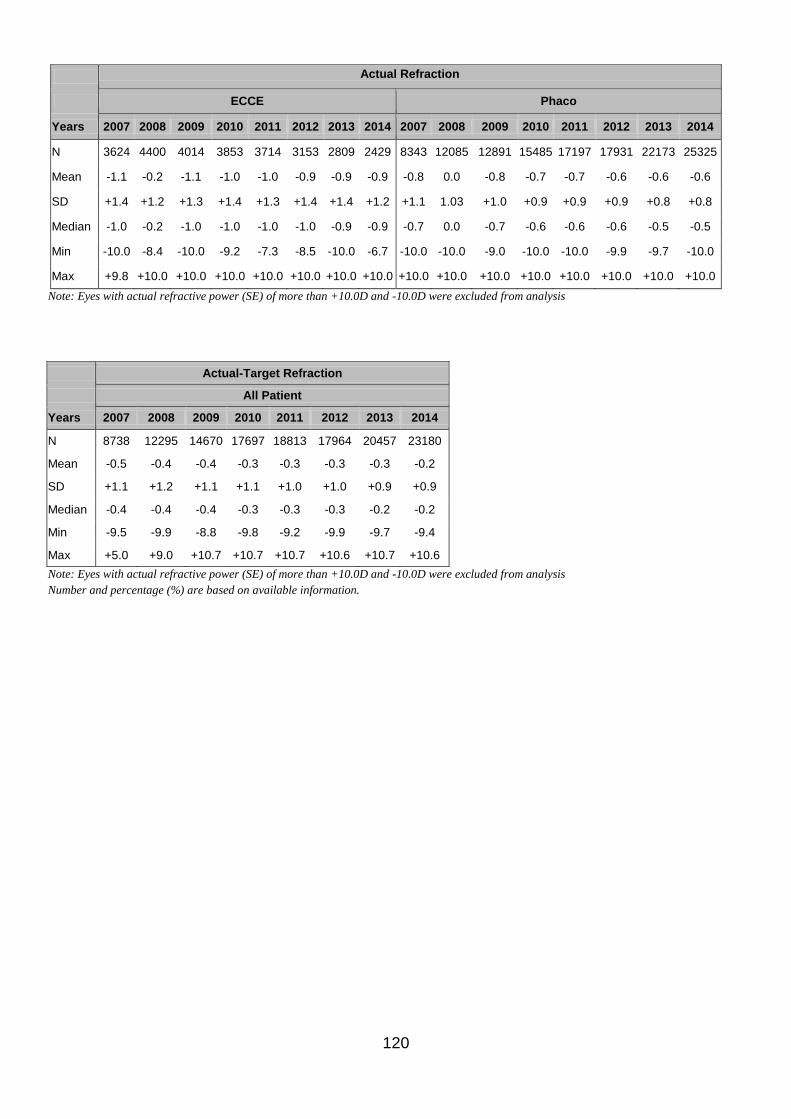
120
Actual Refraction
ECCE Phaco
Years 2007 2008 2009 2010 2011 2012 2013 2014 2007 2008 2009 2010 2011 2012 2013 2014
N 3624 4400 4014 3853 3714 3153 2809 2429 8343 12085 12891 15485 17197 17931 22173 25325
Mean -1.1 -0.2 -1.1 -1.0 -1.0 -0.9 -0.9 -0.9 -0.8 0.0 -0.8 -0.7 -0.7 -0.6 -0.6 -0.6
SD +1.4 +1.2 +1.3 +1.4 +1.3 +1.4 +1.4 +1.2 +1.1 1.03 +1.0 +0.9 +0.9 +0.9 +0.8 +0.8
Median -1.0 -0.2 -1.0 -1.0 -1.0 -1.0 -0.9 -0.9 -0.7 0.0 -0.7 -0.6 -0.6 -0.6 -0.5 -0.5
Min -10.0 -8.4 -10.0 -9.2 -7.3 -8.5 -10.0 -6.7 -10.0 -10.0 -9.0 -10.0 -10.0 -9.9 -9.7 -10.0
Max +9.8 +10.0 +10.0 +10.0 +10.0 +10.0 +10.0 +10.0 +10.0 +10.0 +10.0 +10.0 +10.0 +10.0 +10.0 +10.0
Note: Eyes with actual refractive power (SE) of more than +10.0D and -10.0D were excluded from analysis
Actual-Target Refraction
All Patient
Years 2007 2008 2009 2010 2011 2012 2013 2014
N 8738 12295 14670 17697 18813 17964 20457 23180
Mean -0.5 -0.4 -0.4 -0.3 -0.3 -0.3 -0.3 -0.2
SD +1.1 +1.2 +1.1 +1.1 +1.0 +1.0 +0.9 +0.9
Median -0.4 -0.4 -0.4 -0.3 -0.3 -0.3 -0.2 -0.2
Min -9.5 -9.9 -8.8 -9.8 -9.2 -9.9 -9.7 -9.4
Max +5.0 +9.0 +10.7 +10.7 +10.7 +10.6 +10.7 +10.6
Note: Eyes with actual refractive power (SE) of more than +10.0D and -10.0D were excluded from analysis
Number and percentage (%) are based on available information.

121
Table 1.5.10-2: Distribution of Target and Actual Refractive Power in ECCE and Phaco by Diopter, CSR 2007-2014
Target Refraction
All Patients
Years 2007 2008 2009 2010 2011 2012 2013 2014
Dioptre (D) n % n % n % n % n % n % n % n %
-10.0-<(-9.5) 0 0.0 1 0.0 2 0.0 0 0.0 0 0.0 0 0.0 0 0.0 0 0.0
-9.5-<(-9.0) 4 0.0 1 0.0 1 0.0 2 0.0 1 0.0 0 0.0 0 0.0 0 0.0
-9.0-<(-8.5) 0 0.0 1 0.0 0 0.0 0 0.0 0 0.0 0 0.0 1 0.0 0 0.0
-8.5-<(-8.0) 1 0.0 1 0.0 0 0.0 0 0.0 0 0.0 0 0.0 1 0.0 1 0.0
-8.0-<(-7.5) 2 0.0 3 0.0 1 0.0 1 0.0 0 0.0 1 0.0 0 0.0 1 0.0
-7.5-<(-7.0) 1 0.0 0 0.0 1 0.0 1 0.0 0 0.0 2 0.0 0 0.0 0 0.0
-7.0-<(-6.5) 3 0.0 1 0.0 0 0.0 1 0.0 1 0.0 1 0.0 1 0.0 1 0.0
-6.5-<(-5.0) 1 0.0 2 0.0 7 0.0 4 0.0 10 0.0 10 0.0 9 0.0 10 0.0
-5.0-<(-4.5) 3 0.0 4 0.0 7 0.0 3 0.0 3 0.0 5 0.0 5 0.0 1 0.0
-4.5-<(-4.0) 2 0.0 3 0.0 5 0.0 10 0.0 3 0.0 5 0.0 3 0.0 4 0.0
-4.0-<(-3.5) 7 0.1 8 0.1 11 0.1 5 0.0 11 0.0 5 0.0 1 0.0 5 0.0
-3.5-<(-3.0) 6 0.0 7 0.0 11 0.1 15 0.1 12 0.0 6 0.0 8 0.0 5 0.0
-3.0-<(-2.5) 13 0.1 22 0.1 18 0.1 29 0.1 15 0.1 15 0.1 15 0.1 9 0.0
-2.5-<(-2.0) 29 0.2 21 0.1 29 0.1 33 0.1 26 0.1 38 0.1 35 0.1 27 0.1
-2.0-<(-1.5) 77 0.6 48 0.3 58 0.3 46 0.2 54 0.2 67 0.3 55 0.2 52 0.2
-1.5-<(-1.0) 429 3.5 373 2.5 260 1.3 292 1.2 201 0.8 226 0.9 174 0.6 209 0.6
-1.0-<(-0.5) 4670 37.7 6155 40.9 7972 39.3 7590 30.9 7507 29.0 7190 27.6 6241 21.8 6840 21.2
-0.5-<0.0 6631 53.5 7481 49.7 10604 52.3 15220 62.1 16915 65.3 17421 66.8 21135 73.7 24210 75.0
0.0-<0.5 406 3.3 719 4.8 977 4.8 921 3.8 849 3.3 631 2.4 705 2.5 793 2.5
0.5-<1.0 77 0.6 145 1.0 182 0.9 238 1.0 234 0.9 216 0.8 187 0.7 73 0.2
1.0-<1.5 12 0.1 28 0.2 17 0.1 23 0.1 20 0.1 32 0.1 8 0.0 4 0.0
1.5-<2.0 5 0.0 14 0.1 22 0.1 19 0.1 9 0.0 52 0.2 28 0.1 5 0.0
2.0-<2.5 15 0.1 10 0.1 85 0.4 69 0.3 12 0.0 123 0.5 69 0.2 6 0.0
2.5-<3.0 0 0.0 6 0.0 4 0.0 3 0.0 2 0.0 10 0.0 11 0.0 2 0.0
3.0-<3.5 1 0.0 2 0.0 2 0.0 0 0.0 1 0.0 1 0.0 0 0.0 0 0.0
3.5-<4.0 1 0.0 2 0.0 0 0.0 0 0.0 0 0.0 0 0.0 0 0.0 1 0.0
4.0-<4.5 0 0.0 0 0.0 0 0.0 0 0.0 0 0.0 1 0.0 0 0.0 0 0.0
4.5-<5.0 1 0.0 1 0.0 1 0.0 1 0.0 1 0.0 0 0.0 0 0.0 0 0.0
5.0-<5.5 0 0.0 0 0.0 0 0.0 1 0.0 0 0.0 0 0.0 0 0.0 0 0.0
5.5-<6.0 0 0.0 0 0.0 2 0.0 0 0.0 0 0.0 0 0.0 0 0.0 0 0.0
6.0-<6.5 0 0.0 0 0.0 0 0.0 1 0.0 0 0.0 0 0.0 0 0.0 1 0.0
6.5-<7.0 0 0.0 0 0.0 0 0.0 0 0.0 0 0.0 0 0.0 0 0.0 0 0.0
7.0-<7.5 0 0.0 0 0.0 0 0.0 0 0.0 0 0.0 0 0.0 0 0.0 0 0.0
7.5-<8.0 0 0.0 0 0.0 0 0.0 0 0.0 0 0.0 0 0.0 0 0.0 0 0.0
8.0-<8.5 0 0.0 0 0.0 0 0.0 0 0.0 0 0.0 1 0.0 0 0.0 0 0.0
8.5-<9.0 0 0.0 0 0.0 0 0.0 0 0.0 0 0.0 1 0.0 0 0.0 0 0.0
9.0-<9.5 0 0.0 0 0.0 0 0.0 0 0.0 0 0.0 1 0.0 1 0.0 0 0.0
9.5-<10.0 0 0.0 1 0.0 0 0.0 0 0.0 0 0.0 0 0.0 0 0.0 0 0.0
Number and percentage (%) are based on available information.

122
Actual Refraction
ECCE
Years 2007 2008 2009 2010 2011 2012 2013 2014
Dioptre (D) n % n % n % n % n % n % n % n %
-10.0-<(-9.5) 0 0.0 0 0.0 1 0.0 0 0.0 0 0.0 0 0.0 1 0.0 0 0.0
-9.5-<(-9.0) 0 0.0 1 0.0 1 0.0 1 0.0 0 0.0 0 0.0 0 0.0 0 0.0
-9.0-<(-8.5) 0 0.0 0 0.0 0 0.0 0 0.0 0 0.0 0 0.0 0 0.0 0 0.0
-8.5-<(-8.0) 0 0.0 0 0.0 0 0.0 1 0.0 0 0.0 2 0.1 0 0.0 0 0.0
-8.0-<(-7.5) 0 0.0 0 0.0 3 0.1 1 0.0 0 0.0 0 0.0 1 0.0 0 0.0
-7.5-<(-7.0) 0 0.0 1 0.0 1 0.0 0 0.0 1 0.0 1 0.0 1 0.0 0 0.0
-7.0-<(-6.5) 0 0.0 1 0.0 1 0.0 1 0.0 3 0.1 5 0.2 0 0.0 1 0.0
-6.5-<(-5.0) 0 0.0 3 0.1 10 0.2 10 0.3 16 0.4 4 0.1 2 0.1 6 0.2
-5.0-<(-4.5) 1 0.0 1 0.0 12 0.3 15 0.4 8 0.2 11 0.3 8 0.3 4 0.2
-4.5-<(-4.0) 3 0.1 5 0.1 16 0.4 16 0.4 20 0.5 20 0.6 5 0.2 8 0.3
-4.0-<(-3.5) 8 0.2 7 0.2 52 1.3 42 1.1 30 0.8 26 0.8 27 1.0 21 0.9
-3.5-<(-3.0) 19 0.5 15 0.3 75 1.9 71 1.8 63 1.7 51 1.6 45 1.6 29 1.2
-3.0-<(-2.5) 26 0.6 41 0.9 184 4.6 137 3.6 131 3.5 128 4.1 93 3.3 75 3.1
-2.5-<(-2.0) 65 1.6 76 1.7 323 8.0 256 6.6 236 6.4 204 6.5 164 5.8 152 6.3
-2.0-<(-1.5) 149 3.6 203 4.6 515 12.8 464 12.0 464 12.5 377 12.0 303 10.8 260 10.7
-1.5-<(-1.0) 360 8.7 431 9.7 723 18.0 721 18.7 665 17.9 530 16.8 492 17.5 424 17.5
-1.0-<(-0.5) 722 17.5 763 17.2 771 19.2 817 21.2 776 20.9 667 21.2 636 22.6 547 22.5
-0.5-<0.0 956 23.2 956 21.6 657 16.4 616 16.0 640 17.2 544 17.3 485 17.3 443 18.2
0.0-<0.5 860 20.8 983 22.2 391 9.7 375 9.7 372 10.0 297 9.4 296 10.5 264 10.9
0.5-<1.0 444 10.8 460 10.4 147 3.7 157 4.1 146 3.9 144 4.6 136 4.8 110 4.5
1.0-<1.5 236 5.7 228 5.1 54 1.3 77 2.0 66 1.8 65 2.1 46 1.6 39 1.6
1.5-<2.0 129 3.1 98 2.2 31 0.8 26 0.7 30 0.8 33 1.0 21 0.7 20 0.8
2.0-<2.5 50 1.2 48 1.1 18 0.4 13 0.3 17 0.5 9 0.3 10 0.4 9 0.4
2.5-<3.0 24 0.6 22 0.5 5 0.1 6 0.2 3 0.1 6 0.2 4 0.1 2 0.1
3.0-<3.5 15 0.4 16 0.4 1 0.0 5 0.1 4 0.1 4 0.1 3 0.1 2 0.1
3.5-<4.0 10 0.2 8 0.2 2 0.0 1 0.0 0 0.0 3 0.1 2 0.1 2 0.1
4.0-<4.5 3 0.1 3 0.1 0 0.0 2 0.1 0 0.0 3 0.1 3 0.1 2 0.1
4.5-<5.0 3 0.1 2 0.0 1 0.0 1 0.0 1 0.0 2 0.1 0 0.0 0 0.0
5.0-<5.5 3 0.1 2 0.0 1 0.0 1 0.0 1 0.0 0 0.0 2 0.1 2 0.1
5.5-<6.0 2 0.0 1 0.0 1 0.0 0 0.0 0 0.0 0 0.0 2 0.1 1 0.0
6.0-<6.5 1 0.0 0 0.0 0 0.0 0 0.0 2 0.1 1 0.0 2 0.1 0 0.0
6.5-<7.0 2 0.0 1 0.0 0 0.0 2 0.1 2 0.1 1 0.0 0 0.0 0 0.0
7.0-<7.5 1 0.0 3 0.1 1 0.0 0 0.0 0 0.0 3 0.1 0 0.0 0 0.0
7.5-<8.0 2 0.0 1 0.0 2 0.0 1 0.0 1 0.0 1 0.0 1 0.0 0 0.0
8.0-<8.5 1 0.0 3 0.1 1 0.0 1 0.0 2 0.1 1 0.0 1 0.0 0 0.0
8.5-<9.0 5 0.1 1 0.0 0 0.0 1 0.0 3 0.1 0 0.0 1 0.0 2 0.1
9.0-<9.5 1 0.0 8 0.2 3 0.1 4 0.1 5 0.1 3 0.1 3 0.1 2 0.1
9.5-<10.0 5 0.1 2 0.0 10 0.2 11 0.3 6 0.2 7 0.2 13 0.5 2 0.1
Eyes with actual refractive power (SE) of more than +10.0D and -10.0D were excluded from analysis.
Number and percentage (%) are based on available information.

123
Actual Refraction
Phaco
Years 2007 2008 2009 2010 2011 2012 2013 2014
Dioptre (D) n % n % n % n % n % n % n % n %
-10.0-<(-9.5) 0 0.0 1 0.0 0 0.0 2 0.0 1 0.0 1 0.0 1 0.0 4 0.0
-9.5-<(-9.0) 0 0.0 7 0.1 0 0.0 1 0.0 2 0.0 2 0.0 0 0.0 0 0.0
-9.0-<(-8.5) 0 0.0 1 0.0 2 0.0 0 0.0 0 0.0 0 0.0 1 0.0 1 0.0
-8.5-<(-8.0) 0 0.0 2 0.0 0 0.0 0 0.0 1 0.0 1 0.0 2 0.0 2 0.0
-8.0-<(-7.5) 0 0.0 3 0.0 0 0.0 0 0.0 1 0.0 2 0.0 4 0.0 1 0.0
-7.5-<(-7.0) 1 0.0 11 0.1 0 0.0 3 0.0 1 0.0 2 0.0 1 0.0 3 0.0
-7.0-<(-6.5) 0 0.0 6 0.0 3 0.0 3 0.0 2 0.0 2 0.0 2 0.0 2 0.0
-6.5-<(-5.0) 1 0.0 16 0.1 24 0.2 22 0.1 11 0.1 21 0.1 27 0.1 21 0.1
-5.0-<(-4.5) 1 0.0 15 0.1 14 0.1 13 0.1 11 0.1 13 0.1 11 0.0 8 0.0
-4.5-<(-4.0) 3 0.0 15 0.1 14 0.1 17 0.1 19 0.1 21 0.1 15 0.1 16 0.1
-4.0-<(-3.5) 5 0.1 19 0.2 44 0.3 41 0.3 35 0.2 37 0.2 31 0.1 35 0.1
-3.5-<(-3.0) 2 0.0 29 0.2 80 0.6 81 0.5 74 0.4 74 0.4 69 0.3 74 0.3
-3.0-<(-2.5) 7 0.1 58 0.5 212 1.6 190 1.2 163 0.9 164 0.9 169 0.8 172 0.7
-2.5-<(-2.0) 27 0.3 80 0.7 448 3.5 436 2.8 450 2.6 451 2.5 383 1.7 451 1.8
-2.0-<(-1.5) 88 1.0 147 1.2 1067 8.3 1067 6.9 1138 6.6 1100 6.1 1079 4.9 1187 4.7
-1.5-<(-1.0) 277 3.1 393 3.2 2115 16.4 2390 15.4 2701 15.7 2700 15.1 2993 13.5 3280 13.0
-1.0-<(-0.5) 1022 11.4 1370 11.3 3232 25.1 3870 25.0 4461 25.9 4716 26.3 5735 25.9 6776 26.8
-0.5-<0.0 2602 29.1 3152 26.0 3143 24.4 3941 25.5 4570 26.6 4753 26.5 6610 29.8 7865 31.1
0.0-<0.5 2551 28.5 3568 29.5 1680 13.0 2177 14.1 2350 13.7 2562 14.3 3403 15.3 3761 14.9
0.5-<1.0 1273 14.2 1738 14.3 513 4.0 772 5.0 762 4.4 844 4.7 1081 4.9 1130 4.5
1.0-<1.5 546 6.1 780 6.4 168 1.3 265 1.7 249 1.4 277 1.5 317 1.4 320 1.3
1.5-<2.0 268 3.0 367 3.0 66 0.5 99 0.6 90 0.5 85 0.5 123 0.6 98 0.4
2.0-<2.5 117 1.3 160 1.3 21 0.2 38 0.2 42 0.2 44 0.2 44 0.2 47 0.2
2.5-<3.0 59 0.7 56 0.5 10 0.1 14 0.1 17 0.1 17 0.1 18 0.1 19 0.1
3.0-<3.5 28 0.3 32 0.3 8 0.1 10 0.1 13 0.1 11 0.1 11 0.0 9 0.0
3.5-<4.0 17 0.2 23 0.2 4 0.0 5 0.0 4 0.0 7 0.0 4 0.0 8 0.0
4.0-<4.5 12 0.1 12 0.1 3 0.0 5 0.0 2 0.0 6 0.0 11 0.0 7 0.0
4.5-<5.0 11 0.1 4 0.0 2 0.0 2 0.0 4 0.0 1 0.0 6 0.0 3 0.0
5.0-<5.5 3 0.0 1 0.0 2 0.0 4 0.0 4 0.0 1 0.0 3 0.0 2 0.0
5.5-<6.0 1 0.0 3 0.0 1 0.0 1 0.0 2 0.0 1 0.0 1 0.0 2 0.0
6.0-<6.5 4 0.0 2 0.0 2 0.0 3 0.0 1 0.0 2 0.0 1 0.0 2 0.0
6.5-<7.0 4 0.0 1 0.0 2 0.0 2 0.0 1 0.0 1 0.0 4 0.0 2 0.0
7.0-<7.5 0 0.0 1 0.0 0 0.0 2 0.0 2 0.0 2 0.0 4 0.0 0 0.0
7.5-<8.0 2 0.0 3 0.0 0 0.0 0 0.0 1 0.0 2 0.0 3 0.0 0 0.0
8.0-<8.5 3 0.0 1 0.0 1 0.0 1 0.0 0 0.0 0 0.0 2 0.0 3 0.0
8.5-<9.0 0 0.0 0 0.0 2 0.0 1 0.0 1 0.0 1 0.0 1 0.0 4 0.0
9.0-<9.5 0 0.0 0 0.0 2 0.0 0 0.0 6 0.0 1 0.0 2 0.0 5 0.0
9.5-<10.0 4 0.0 6 0.0 6 0.0 7 0.0 5 0.0 6 0.0 1 0.0 5 0.0
Eyes with actual refractive power (SE) of more than +10.0D and -10.0D were excluded from analysis.
Number and percentage (%) are based on available information.

124
0
5
10
15
20
25
30
35
-10
.0-<
(-9
.5)
-9.5
-<(-
9.0
)
-9.0
-<(-
8.5
)
-8.5
-<(-
8.0
)
-8.0
-<(-
7.5
)
-7.5
-<(-
7.0
)
-7.0
-<(-
6.5
)
-6.5
-<(-
5.0
)
-5.0
-<(-
4.5
)
-4.5
-<(-
4.0
)
-4.0
-<(-
3.5
)
-3.5
-<(-
3.0
)
-3.0
-<(-
2.5
)
-2.5
-<(-
2.0
)
-2.0
-<(-
1.5
)
-1.5
-<(-
1.0
)
-1.0
-<(-
0.5
)
-0.5
-<0
.0
0.0
-<0
.5
0.5
-<1
.0
1.0
-<1
.5
1.5
-<2
.0
2.0
-<2
.5
2.5
-<3
.0
3.0
-<3
.5
3.5
-<4
.0
4.0
-<4
.5
4.5
-<5
.0
5.0
-<5
.5
5.5
-<6
.0
6.0
-<6
.5
6.5
-<7
.0
7.0
-<7
.5
7.5
-<8
.0
8.0
-<8
.5
8.5
-<9
.0
9.0
-<9
.5
9.5
-<1
0.0
%
D
ECCE (2007)
ECCE (2008)
ECCE (2009)
ECCE (2010)
ECCE (2011)
ECCE (2012)
ECCE (2013)
ECCE (2014)
Figure 1.5.10-1: Percentage Distribution of Actual Refractive Power (ECCE), CSR 2007-2014
0
5
10
15
20
25
30
35
-10
.0-<
(-9
.5)
-9.5
-<(-
9.0
)
-9.0
-<(-
8.5
)
-8.5
-<(-
8.0
)
-8.0
-<(-
7.5
)
-7.5
-<(-
7.0
)
-7.0
-<(-
6.5
)
-6.5
-<(-
5.0
)
-5.0
-<(-
4.5
)
-4.5
-<(-
4.0
)
-4.0
-<(-
3.5
)
-3.5
-<(-
3.0
)
-3.0
-<(-
2.5
)
-2.5
-<(-
2.0
)
-2.0
-<(-
1.5
)
-1.5
-<(-
1.0
)
-1.0
-<(-
0.5
)
-0.5
-<0
.0
0.0
-<0
.5
0.5
-<1
.0
1.0
-<1
.5
1.5
-<2
.0
2.0
-<2
.5
2.5
-<3
.0
3.0
-<3
.5
3.5
-<4
.0
4.0
-<4
.5
4.5
-<5
.0
5.0
-<5
.5
5.5
-<6
.0
6.0
-<6
.5
6.5
-<7
.0
7.0
-<7
.5
7.5
-<8
.0
8.0
-<8
.5
8.5
-<9
.0
9.0
-<9
.5
9.5
-<1
0.0
%
D
Phaco (2007)
Phaco (2008)
Phaco (2009)
Phaco (2010)
Phaco (2011)
Phaco (2012)
Phaco (2013)
Phaco (2014)
Figure 1.5.10-2: Percentage Distribution of Actual Refractive Power (Phaco), CSR 2007-2014

125
Table 1.5.10-3: Difference Between Target and Actual Refractive Power by Diopter in Phaco, CSR 2007-2014
Target Refraction
Years 2007 2008 2009 2010 2011 2012 2013 2014
Power (D) n % n % n % n % n % n % n % n %
N 7975 100.0 10660 100.0 14976 100.0 18938 100.0 20321 100.0 21328 100.0 24306 100.0 28256 100.0
-5.0-<(-4.5) 2 0.0 4 0.0 7 0.0 2 0.0 2 0.0 5 0.0 4 0.0 1 0.0
-4.5-<(-4.0) 1 0.0 3 0.0 5 0.0 9 0.0 2 0.0 4 0.0 3 0.0 4 0.0
-4.0-<(-3.5) 5 0.1 7 0.1 7 0.0 5 0.0 8 0.0 5 0.0 1 0.0 4 0.0
-3.5-<(-3.0) 5 0.1 6 0.1 9 0.1 12 0.1 10 0.0 4 0.0 8 0.0 3 0.0
-3.0-<(-2.5) 10 0.1 20 0.2 14 0.1 23 0.1 12 0.1 13 0.1 14 0.1 8 0.0
-2.5-<(-2.0) 18 0.2 16 0.2 19 0.1 27 0.1 19 0.1 30 0.1 30 0.1 23 0.1
-2.0-<(-1.5) 51 0.6 35 0.3 44 0.3 32 0.2 38 0.2 49 0.2 43 0.2 44 0.2
-1.5-<(-1.0) 239 3.0 288 2.7 184 1.2 195 1.0 158 0.8 164 0.8 149 0.6 180 0.6
-1.0-<(-0.5) 2473 31.0 4065 38.1 5602 37.4 5672 30.0 5567 27.4 5709 26.8 5031 20.7 5642 20.0
-0.5-<0.0 4512 56.6 5498 51.6 8201 54.8 12144 64.1 13864 68.2 14653 68.7 18302 75.3 21641 76.6
0.0-<0.5 583 7.3 563 5.3 663 4.4 601 3.2 470 2.3 345 1.6 461 1.9 635 2.2
0.5-<1.0 45 0.6 107 1.0 129 0.9 147 0.8 143 0.7 160 0.8 144 0.6 52 0.2
1.0-<1.5 6 0.1 23 0.2 9 0.1 9 0.0 7 0.0 16 0.1 5 0.0 3 0.0
1.5-<2.0 2 0.0 7 0.1 11 0.1 7 0.0 1 0.0 43 0.2 23 0.1 2 0.0
2.0-<2.5 9 0.1 6 0.1 63 0.4 42 0.2 10 0.0 106 0.5 65 0.3 3 0.0
2.5-<3.0 1 0.0 4 0.0 2 0.0 1 0.0 2 0.0 6 0.0 10 0.0 0 0.0
3.0-<3.5 1 0.0 0 0.0 0 0.0 0 0.0 0 0.0 1 0.0 0 0.0 0 0.0
3.5-<4.0 0 0.0 1 0.0 0 0.0 0 0.0 0 0.0 0 0.0 0 0.0 0 0.0
4.0-<4.5 2 0.0 0 0.0 0 0.0 0 0.0 0 0.0 0 0.0 0 0.0 0 0.0
4.5-<5.0 0 0.0 1 0.0 0 0.0 0 0.0 1 0.0 0 0.0 0 0.0 0 0.0
5.0-<5.5 1 0.0 0 0.0 0 0.0 0 0.0 0 0.0 0 0.0 0 0.0 0 0.0
Number and percentage (%) are based on available information.
Actual Refraction
Years 2007 2008 2009 2010 2011 2012 2013 2014
Power (D) n % n % n % n % n % n % n % n %
N 8342 100.0 12154 100.0 12891 100.0 15485 100.0 17197 100.0 17931 100.0 22173 100.0 25325 100.0
-5.0-<(-4.5) 15 0.2 13 0.1 14 0.1 13 0.1 11 0.1 13 0.1 11 0.0 8 0.0
-4.5-<(-4.0) 30 0.4 19 0.2 14 0.1 17 0.1 19 0.1 21 0.1 15 0.1 16 0.1
-4.0-<(-3.5) 49 0.6 17 0.1 44 0.3 41 0.3 35 0.2 37 0.2 31 0.1 35 0.1
-3.5-<(-3.0) 97 1.2 20 0.2 80 0.6 81 0.5 74 0.4 74 0.4 69 0.3 74 0.3
-3.0-<(-2.5) 200 2.4 55 0.5 212 1.6 190 1.2 163 0.9 164 0.9 169 0.8 172 0.7
-2.5-<(-2.0) 405 4.9 85 0.7 448 3.5 436 2.8 450 2.6 451 2.5 383 1.7 451 1.8
-2.0-<(-1.5) 746 8.9 164 1.3 1067 8.3 1067 6.9 1138 6.6 1100 6.1 1079 4.9 1187 4.7
-1.5-<(-1.0) 1382 16.6 423 3.5 2115 16.4 2390 15.4 2701 15.7 2700 15.1 2993 13.5 3280 13.0
-1.0-<(-0.5) 1771 21.2 1408 11.6 3232 25.1 3870 25.0 4461 25.9 4716 26.3 5735 25.9 6776 26.8
-0.5-<0.0 1884 22.6 3167 26.1 3143 24.4 3941 25.5 4570 26.6 4753 26.5 6610 29.8 7865 31.1
0.0-<0.5 1069 12.8 3534 29.1 1680 13.0 2177 14.1 2350 13.7 2562 14.3 3403 15.3 3761 14.9
0.5-<1.0 399 4.8 1740 14.3 513 4.0 772 5.0 762 4.4 844 4.7 1081 4.9 1130 4.5
1.0-<1.5 142 1.7 786 6.5 168 1.3 265 1.7 249 1.4 277 1.5 317 1.4 320 1.3
1.5-<2.0 55 0.7 365 3.0 66 0.5 99 0.6 90 0.5 85 0.5 123 0.6 98 0.4
2.0-<2.5 14 0.2 156 1.3 21 0.2 38 0.2 42 0.2 44 0.2 44 0.2 47 0.2
2.5-<3.0 15 0.2 55 0.5 10 0.1 14 0.1 17 0.1 17 0.1 18 0.1 19 0.1
3.0-<3.5 13 0.2 30 0.2 8 0.1 10 0.1 13 0.1 11 0.1 11 0.0 9 0.0
3.5-<4.0 4 0.0 22 0.2 4 0.0 5 0.0 4 0.0 7 0.0 4 0.0 8 0.0
4.0-<4.5 3 0.0 10 0.1 3 0.0 5 0.0 2 0.0 6 0.0 11 0.0 7 0.0
4.5-<5.0 4 0.0 4 0.0 2 0.0 2 0.0 4 0.0 1 0.0 6 0.0 3 0.0
5.0-<5.5 1 0.0 1 0.0 2 0.0 4 0.0 4 0.0 1 0.0 3 0.0 2 0.0
Eyes with actual refractive power (SE) of more than +10.0D and -10.0D were excluded from analysis.
Number and percentage (%) are based on available information.

126
Difference between Target and Actual Refraction
Years 2007 2008 2009 2010 2011 2012 2013 2014
Power (D) n % n % n % n % n % n % n % n %
N 5782 100 8803 100 10842 100.0 13653 100.0 14906 100.0 14738 100.0 17438 100.0 20484 100.0
-5.0-<(-4.5) 12 0.2 12 0.1 5 0.0 5 0.0 7 0.0 8 0.1 8 0.0 5 0.0
-4.5-<(-4.0) 14 0.2 19 0.2 8 0.1 7 0.1 10 0.1 9 0.1 12 0.1 10 0.0
-4.0-<(-3.5) 28 0.5 18 0.2 24 0.2 28 0.2 14 0.1 18 0.1 10 0.1 16 0.1
-3.5-<(-3.0) 43 0.7 51 0.6 52 0.5 37 0.3 32 0.2 38 0.3 37 0.2 35 0.2
-3.0-<(-2.5) 93 1.6 103 1.2 95 0.9 110 0.8 81 0.5 100 0.7 92 0.5 84 0.4
-2.5-<(-2.0) 176 3.0 245 2.8 243 2.2 198 1.5 192 1.3 204 1.4 184 1.1 223 1.1
-2.0-<(-1.5) 311 5.4 541 6.1 475 4.4 520 3.8 532 3.6 533 3.6 473 2.7 568 2.8
-1.5-<(-1.0) 595 10.3 1052 12.0 1149 10.6 1294 9.5 1391 9.3 1300 8.8 1366 7.8 1534 7.5
-1.0-<(-0.5) 994 17.2 1984 22.5 2151 19.8 2685 19.7 3081 20.7 3005 20.4 3424 19.6 3847 18.8
-0.5-<0.0 1367 23.6 2278 25.9 2877 26.5 3712 27.2 4411 29.6 4269 29.0 5382 30.9 6538 31.9
0.0-<0.5 1179 20.4 1434 16.3 2246 20.7 3054 22.4 3276 22.0 3258 22.1 4129 23.7 4974 24.3
0.5-<1.0 573 9.9 558 6.3 977 9.0 1312 9.6 1250 8.4 1341 9.1 1545 8.9 1813 8.9
1.0-<1.5 225 3.9 214 2.4 310 2.9 398 2.9 399 2.7 401 2.7 484 2.8 506 2.5
1.5-<2.0 73 1.3 97 1.1 125 1.2 156 1.1 99 0.7 144 1.0 167 1.0 168 0.8
2.0-<2.5 32 0.6 46 0.5 43 0.4 56 0.4 61 0.4 45 0.3 46 0.3 58 0.3
2.5-<3.0 14 0.2 26 0.3 14 0.1 20 0.1 19 0.1 19 0.1 22 0.1 29 0.1
3.0-<3.5 13 0.2 15 0.2 5 0.0 10 0.1 12 0.1 10 0.1 6 0.0 12 0.1
3.5-<4.0 8 0.1 15 0.2 8 0.1 10 0.1 4 0.0 6 0.0 7 0.0 6 0.0
4.0-<4.5 3 0.0 12 0.1 3 0.0 4 0.0 3 0.0 2 0.0 4 0.0 6 0.0
4.5-<5.0 3 0.0 12 0.1 2 0.0 3 0.0 0 0.0 2 0.0 7 0.0 6 0.0
5.0-<5.5 9 0.2 9 0.1 1 0.0 2 0.0 1 0.0 0 0.0 2 0.0 3 0.0
NOTE: Formula of
Number and percentage (%) are based on available information.
Eyes with actual refractive power (SE) of more than +10.0D and -10.0D were excluded from analysis.
0
5
10
15
20
25
30
35
-5-<
(-4.
5)
-4.5
-<(-
4)
-4-<
(-3.
5)
-3.5
-<(-
3)
-3-<
(-2.
5)
-2.5
-<(-
2)
-2-<
(-1.
5)
-1.5
-<(-
1)
-1-<
(-0.
5)
-0.5
-<0
0-<0
.5
0.5-
<1
1-<1
.5
1.5-
<2
2-<2
.5
2.5-
<3
3-<3
.5
3.5-
<4
4-<4
.5
4.5-
<5
5-<5
.5
%
D
2007
2008
2009
2010
2011
2012
2013
2014
Figure 1.5.10-3: Difference in Target and Actual Refractive Power (Phaco), CSR 2007-2014

127
Table 1.5.10-4: Difference Between Target and Actual Refractive Power within ±1.0D by SDP in Phaco and ECCE,
CSR 2014
Hospital
All By Phacoemulsification By ECCE
No. of
patient with
available
difference
Difference between
Target and Actual
Refraction within
±1.0D
No. of
patient
with
available
difference
Difference
between Target
and Actual
Refraction within
±1.0D
No. of
patient
with
available
difference
Difference
between Target
and Actual
Refraction within
±1.0D
N n % N n % N n %
All centre 23180 18931 81.7 20484 17172 83.8 2022 1327 65.6
Alor Setar 1501 1062 70.8 1214 915 75.4 243 124 51.0
Ampang 514 398 77.4 448 348 77.7 50 37 74.0
Batu Pahat 153 119 77.8 103 88 85.4 33 23 69.7
Bukit Mertajam 742 595 80.2 562 457 81.3 174 134 77.0
Ipoh 1774 1530 86.2 1654 1441 87.1 87 68 78.2
Johor Bahru 705 577 81.8 667 552 82.8 17 9 52.9
Kangar 299 245 81.9 253 214 84.6 35 23 65.7
Kemaman 14 9 64.3 9 7 77.8 5 2 40.0
Keningau 58 48 82.8 43 38 88.4 14 10 71.4
Klang 46 37 80.4 46 37 80.4 0 0 0.0
Kota Bharu 25 17 68.0 13 11 84.6 10 6 60.0
Kota Kinabalu 505 394 78.0 423 346 81.8 64 37 57.8
Kuala Krai 211 177 83.9 175 155 88.6 26 16 61.5
Kuala Lumpur 691 587 84.9 593 517 87.2 79 57 72.2
Kuala Pilah 66 41 62.1 58 37 63.8 5 3 60.0
Kuala Terengganu 656 567 86.4 522 472 90.4 108 78 72.2
Kuantan 455 404 88.8 349 318 91.1 90 74 82.2
Kuching 1359 1112 81.8 1326 1093 82.4 5 3 60.0
Kulim 215 186 86.5 196 173 88.3 12 7 58.3
Melaka 1327 1127 84.9 1200 1039 86.6 94 63 67.0
Miri 410 384 93.7 388 366 94.3 20 17 85.0
Muar 577 454 78.7 513 420 81.9 35 18 51.4
Pulau Pinang 1467 1202 81.9 1418 1172 82.7 22 14 63.6
Putrajaya 289 251 86.9 233 211 90.6 35 21 60.0
Sarikei 53 49 92.5 51 48 94.1 2 1 50.0
Selayang 518 441 85.1 476 414 87.0 19 12 63.2
Serdang 1000 771 77.1 860 681 79.2 89 58 65.2
Seremban 1089 860 79.0 997 807 80.9 69 38 55.1
Sibu 644 561 87.1 618 541 87.5 9 8 88.9
Sri Manjung 444 393 88.5 433 388 89.6 6 3 50.0
Sultan Ismail 564 438 77.7 460 368 80.0 67 43 64.2
Sungai Buloh 11 11 100.0 11 11 100.0 0 0 0.0
Sungei Petani 704 573 81.4 516 447 86.6 136 92 67.6
Taiping 1107 979 88.4 929 855 92.0 170 118 69.4
Tawau 166 104 62.7 119 78 65.5 39 24 61.5
Teluk Intan 740 606 81.9 681 568 83.4 46 29 63.0
Temerloh 774 605 78.2 671 554 82.6 72 35 48.6
KK1M Terengganu 22 16 72.7 15 13 86.7 7 3 42.9
KK1M Kelantan 62 47 75.8 41 35 85.4 18 11 61.1
KK1M Sarawak 565 339 60.0 558 334 59.9 4 4 100.0
MAIWP 658 615 93.5 642 603 93.9 6 4 66.7
NOTE: Formula of Actual Refraction,
Result is based on available info of target and actual refraction.
Eyes with actual refractive power (SE) of more than +10.0D and -10.0D were excluded from analysis.

128
Table 1.5.10-5:Post-operative Visual Acuity and Week of Outcome Notification, CSR 2014
Post op week
Unaided VA*
6/12 and better <6/12-6/18 <6/18-6/60 <6/60-3/60 <3/60
n % n % n % n % n %
1 week 805 4.3 374 5.6 632 7.1 47 7.0 146 11.5
2–4 weeks 857 4.6 395 6.0 553 6.3 43 6.4 139 10.9
5–12 weeks 16494 87.6 5628 84.8 7232 81.8 539 80.1 913 71.6
13–20 weeks 565 3.0 200 3.0 368 4.2 41 6.1 71 5.6
21–30 weeks 49 0.3 27 0.4 35 0.4 3 0.4 2 0.2
31–60 weeks 20 0.1 10 0.2 14 0.2 0 0.0 1 0.1
>60 weeks 4 0.0 0 0.0 1 0.0 0 0.0 0 0.0
(Missing) 31 0.2 4 0.1 11 0.1 0 0.0 3 0.2
Total 18825
6638
8846
673 1275
*Missing of unaided VA = 4275 cases
Post op week
Refracted VA*
6/12 and better <6/12-6/18 <6/18-6/60 <6/60-3/60 <3/60
n % n % n % n % n %
1 week 379 2.0 28 0.4 33 0.4 4 0.6 33 2.6
2–4 weeks 1327 7.0 85 1.3 135 1.5 22 3.3 42 3.3
5–12 weeks 26393 140.2 1299 19.6 1702 19.2 232 34.5 435 34.1
13–20 weeks 1010 5.4 54 0.8 95 1.1 8 1.2 26 2.0
21–30 weeks 94 0.5 5 0.1 10 0.1 1 0.1 0 0.0
31–60 weeks 37 0.2 2 0.0 3 0.0 0 0.0 1 0.1
>60 weeks 5 0.0 0 0.0 0 0.0 0 0.0 0 0.0
(Missing) 26 0.1 2 0.0 2 0.0 0 0.0 2 0.2
Total 29271
1475
1980
267 539
*Missing of refracted VA = 7000 cases

129
CHAPTER 2
KLINIK KATARAK 1MALAYSIA 2014
Contributing Editors
Mohamad Aziz Salowi
Tassha Hilda Adnan
Nadiah Sa’at

130
CHAPTER 2: KLINIK KATARAK 1MALAYSIA (MOBILE AND TRANSIT)
Klinik Katarak 1Malaysia (KK1M) is the outreach arm of the MOH cataract surgical services. The services include
KK1M mobile, transit and static. KK1M mobile and transit are catagorised under each state and named after the
hospital where the surgery is performed. KK1M Static is specifically Pusat Perubatan Katarak Majlis Agama Islam
Wilayah Persekutuan-Hospital Selayang (PPKM-HS) (refer to report below).
2.1 Stock and Flow
The number of SDP varies depending on location and period of service. In general, the operational KK1M mobile are
KK1M Sarawak and KK1M Eastern Zone (consists of KK1M Kelantan, KK1M Terengganu and KK1M Pahang). KK1M
transit which is not using the bus, can be organised in any hospital throughout the country
2.1.1 Stock and Flow
2.1.1-1: Stock and Flow, CSR 2013-2014
Year 2013 2014
No. of SDP 2 4
Total no. of cataract surgery registered to CSR
140 1055
n % n %
Cataract surgery with visual outcome records
98 70.0 863 81.8
2.2 Characteristics of Patients
2.2.2 Demography
2.2.2-1: Age Distribution, CSR 2013-2014
The mean age for patients presenting for cataract surgery in KK1M was older than those presenting in a hospital
setting.
Year 2013 2014
Total number of cataract surgery 140 1055
Age
Mean (years) 67.4 68.6
Median (years) 69 69
Minimum (years) 47 34
Maximum (years) 89 95
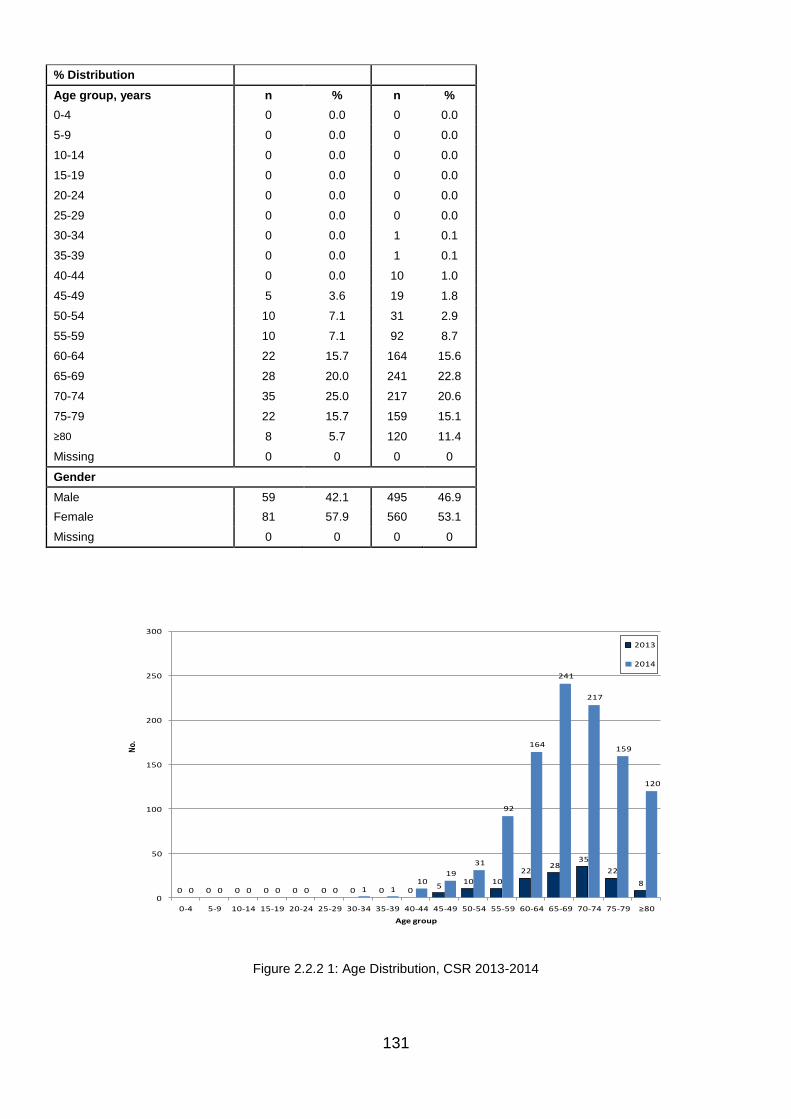
131
% Distribution
Age group, years n % n %
0-4 0 0.0 0 0.0
5-9 0 0.0 0 0.0
10-14 0 0.0 0 0.0
15-19 0 0.0 0 0.0
20-24 0 0.0 0 0.0
25-29 0 0.0 0 0.0
30-34 0 0.0 1 0.1
35-39 0 0.0 1 0.1
40-44 0 0.0 10 1.0
45-49 5 3.6 19 1.8
50-54 10 7.1 31 2.9
55-59 10 7.1 92 8.7
60-64 22 15.7 164 15.6
65-69 28 20.0 241 22.8
70-74 35 25.0 217 20.6
75-79 22 15.7 159 15.1
≥80 8 5.7 120 11.4
Missing 0 0 0 0
Gender
Male 59 42.1 495 46.9
Female 81 57.9 560 53.1
Missing 0 0 0 0
0 0 0 0 0 0 0 0 05
10 10
2228
35
22
80 0 0 0 0 0 1 1
1019
31
92
164
241
217
159
120
0
50
100
150
200
250
300
0-4 5-9 10-14 15-19 20-24 25-29 30-34 35-39 40-44 45-49 50-54 55-59 60-64 65-69 70-74 75-79 ≥80
No.
Age group
2013
2014
Figure 2.2.2 1: Age Distribution, CSR 2013-2014

132
2.2.1 Systemic Co-Morbidity
Table 2.2.1-1: Distribution of Systemic Co-morbidity, CSR 2013-2014
Year 2013 2014
No of patients (N) 140 1055
Percentage of patients with any systemic co-morbidity 65.7 57.3
Percentage of patients with specific systemic co-morbidity
n % n %
1. Hypertension 72 51.4 500 47.4
2. Diabetes Mellitus 45 32.1 259 24.5
3. Ischaemic Heart Disease 2 1.4 11 1.0
4. Renal Failure 0 0.0 6 0.6
5. Cerebrovascular accident 1 0.7 3 0.3
6. COAD/Asthma 2 1.4 24 2.3
7. Others 12 8.6 55 5.2
51.447.4
32.1
24.5
1.4 1.00.0 0.60
10
20
30
40
50
60
70
2013 2014
%
Year
HPT
DM
IHD
Renal Failure
Figure 2.2.1-1: Percentage of Patients with Specific Systemic Co-morbidity, CSR 2013-2014

133
2.2.2 Causes of Cataract
Table 2.2.2-1: Causes of Cataract, CSR 2013-2014
Year 2013 2014
No of patients (N) 140 1055
n % n %
Primary cataract 139 99.3 1043 98.9
Secondary cataract 1 0.7 3 0.3
Missing value 0 0.0 9 0.9
Primary Cataract (N) 139 1043
n % n %
Senile/age related 136 97.8 1039 99.6
Congenital 0 0.0 0 0.0
Development 0 0.0 0 0.0
Others 3 2.2 4 0.4
Secondary Cataract (N) 1 3
n % n %
Trauma 1 100.0 3 100.0
Drug induced 0 0.0 0 0.0
Surgery induced 0 0.0 0 0.0
Others 0 0.0 0 0.0
2.2.3 First of Second Eye Surgery
The percentage of patients presented for the second eye surgeries is 19.4% (as compared to total MOH 35.2% in
2014). This is expected as KK1M is operational in rural setting
Table 2.2.3-1: First or Fellow Eye Surgery, CSR 2013-2014
Year 2013 2014
No of patients (N) 140 1055
n % n %
First eye surgery 132 94.3 850 80.6
Fellow eye surgery 8 5.7 205 19.4
Missing 0 0.0 0 0.0
Patients who had second surgery in the same year 2 1.4 58 5.5
Period of time between first and fellow eye surgery (months)
N 8 205
Mean 36.7 75.9
SD 21.8 68.6
Median 43.0 50.1
Patients who had cataract surgery before 620 205
n % n %
Eyes with intra-operative complications during surgery in the first eye 0 0.0 2 1.0

134
2.2.4 Past Ocular Surgery of the Operated Eye
Table 2.2.4-1: Past Ocular Surgery of the Operated Eye, CSR 2013-2014
Year 2013 2014
No. of patients 104 1055
No. of eyes with past ocular surgery record (N) 129 1042
n % n %
Patients with no past ocular surgery 129 100.0 1037 99.5
Vitreoretinal surgery 0 0.0 1 0.1
Pterygium excision 0 0.0 3 0.3
Filtering surgery 0 0.0 0 0.0
Penetrating keratoplasty 0 0.0 0 0.0
Others 0 0.0 1 0.1
0.0
0.1
0.0
0.3
0.0
0.1
0.0
0.1
0.1
0.2
0.2
0.3
0.3
0.4
2013 2014
%
Year
Vitreoretinal surgery
Pterygium excision
Others
Figure 2.2.4-1:Distribition of Past Ocular Surgery of the Operated Eye, CSR 2013-2014

135
2.2.5 Pre-existing Ocular Co-morbidity
Table 2.2.5-1:Distribution of Pre-existing Ocular Co-morbidity, CSR 2013-2014
Year 2013 2014
No of patients (N) 140 1055
n % n %
Patients with any ocular co-morbidity 47 33.6 256 24.3
Patients with specific ocular co-morbidity
Anterior segment
1. Glaucoma 2 1.4 9 0.9
2. Pterygium involving the cornea 4 2.9 17 1.6
3. Pseudoexfoliation 1 0.7 3 0.3
4. Corneal opacity 0 0.0 2 0.2
5. Chronic uveitis 0 0.0 0 0.0
Len related complication
1. Phacomorphic 0 0.0 0 0.0
2. Phacolytic 0 0.0 0 0.0
3. Subluxated/Disclosed 0 0.0 0 0.0
Posterior segment
1. Diabetic Retinopathy: Non Proliferative 1 0.7 9 0.9
2. Diabetic Retinopathy: Proliferative 0 0.0 0 0.0
3. Diabetic Retinopathy: CSME* 0 0.0 1 0.1
4. Diabetic Retinopathy: Vitreous haemorrhage 0 0.0 0 0.0
5. ARMD 3 2.1 4 0.4
6. Other macular disease (includes hole or scar) 0 0.0 2 0.2
7. Optic nerve disease, any type 0 0.0 0 0.0
8. Retinal detachment 0 0.0 0 0.0
9. Cannot be assessed 34 24.3 204 19.3
Miscellaneous
1. Amblyopia 0 0.0 1 0.1
2. Significant previous eye trauma 0 0.0 1 0.1
3. Pre-existing non glaucoma field defect 0 0.0 0 0.0
4. Others 8 5.7 11 1.0
*CSME=Clinically Significant Macular Oedema Number or percentage may be more than total or 100% as patients might have more than one ocular co-morbidity

136
6.5
0.9
1.4
0.9
0.0 0.00.0
0.2
0.4
0.6
0.8
1.0
1.2
1.4
1.6
2013 2014
%
Year
DR Glaucoma Phacomorphic/ Phacolytic
Figure 2.2.5-1:Distribution of Eyes with Specific Ocular Co-morbidity, CSR 2013-2014
2.2.6 Pre-operative Vision
Most patients presented with blindness, vision <3/60 (59.2% in 2014) as compared to total MOH (43.2% at same level of vision)
Table 2.2.6-1:Distribution of Pre-Operative Vision, CSR 2013-2014
Year 2013 2014
No. of patients (N) 140 1055 n % n % Patients with unaided VA 136 97.1 1048 99.3 Patients with refracted VA 29 20.7 56 5.3 Patients with no refraction 108 77.1 992 94.0
6/12 and better Unaided 3 2.2 16 1.5
Refracted 1 3.4 6 10.7
<6/12 - 6/18 Unaided 1 0.7 42 4.0 Refracted 5 17.2 12 21.4
<6/18 - 6/60 Unaided 46 33.8 325 31.0
Refracted 13 44.8 16 28.6
<6/60 - 3/60 Unaided 5 3.7 45 4.3
Refracted 3 10.3 1 1.8
<3/60 Unaided 81 59.6 620 59.2
Refracted 7 24.1 21 37.5
Unaided VA for patient with no refraction
n 108 992 6/12 and better 2 1.9 14 1.4 <6/12 - 6/18 0 0.0 35 3.5 <6/18 - 6/60 30 27.8 303 30.5 <6/60 - 3/60 3 2.8 44 4.4 <3/60 73 67.6 596 60.1

137
0
5
10
15
20
25
30
6/56/6
6/96/12
6/186/24
6/366/60
5/604/60
3/602/60
1/60CF
HMPL
NPL
%
Visual Acuity
2013
Unaided
Refracted
Figure 2.2.6-1:Distribution of Pre-Operative Vision (Unaided/presenting and refracted), CSR 2013
0
5
10
15
20
25
30
35
6/56/6
6/96/12
6/186/24
6/366/60
5/604/60
3/602/60
1/60CF
HMPL
NPL
%
Visual Acuity
2014
Unaided
Refracted
Figure 2.2.6-2:Distribution of Pre-Operative Vision (Unaided/presenting and refracted), CSR 2014

138
2.2 1.50.74.0
33.831.0
3.7 4.3
59.6 59.2
0
10
20
30
40
50
60
70
2013 2014
%
Year
6/12 and better<6/12 - 6/18
<6/18 - 6/60
<6/60 - 3/60
<3/60
Figure 2.2.6-3:Distribution of Pre-Operative Vision (Unaided/presenting), CSR 2013-2014
3.4
10.7
17.221.4
44.8
28.6
10.3
1.8
24.1
37.5
0
10
20
30
40
50
60
70
2013 2014
%
Year
6/12 and better
<6/12 - 6/19
<6/18 - 6/61
<6/60 - 3/61
<3/60
Figure 2.2.6-4:Distribution of Pre-Operative Vision (Refracted), CSR 2013-2014
2.2.7 Target Refractive Power
Table 2.2.7-1:Distribution of Target Refractive Power, CSR 2013-2014
Year 2013 2014
Operated eye ( N) 139 894 Mean -0.3 -0.3 SD 0.2 0.2 Median -0.3 -0.2 Minimum -0.8 -1.6 Maximum 0.0 0.5

139
Table 2.2.7-2:Distribution of Target Refractive Power, CSR 2013-2014
Year 2013 2014
Target refractive power (Dioptres) Operated eye Operated eye
N=139 N=894
n % n %
-10-<(-9.5) 0 0 0 0
-9.5-<(-9) 0 0 0 0
-9-<(-8.5) 0 0 0 0
-8.5-<(-8) 0 0 0 0
-8-<(-7.5) 0 0 0 0
-7.5-<(-7) 0 0 0 0
-7-<(-6.5) 0 0 0 0
-6.5-<(-5) 0 0.0 0 0
-5-<(-4.5) 0 0 0 0
-4.5-<(-4) 0 0 0 0
-4-<(-3.5) 0 0 0 0
-3.5-<(-3) 0 0 0 0
-3-<(-2.5) 0 0 0 0
-2.5-<(-2) 0 0 0 0
-2-<(-1.5) 0 0.0 1 0.1
-1.5-<(-1) 0 0.0 0 0.0
-1-<(-0.5) 18 13.0 67 7.5
-0.5-<0 120 86.3 822 92.0
0-<0.5 1 0.7 3 0.3
0.5-<1 0 0 1 0.1
1-<1.5 0 0 0 0
1.5-<2 0 0 0 0
2-<2.5 0 0 0 0
2.5-<3 0 0 0 0
3-<3.5 0 0 0 0
3.5-<4 0 0 0 0
4-<4.5 0 0 0 0
4.5-<5 0 0 0 0
5-<5.5 0 0 0 0
5.5-<6 0 0 0 0
6-<6.5 0 0 0 0
6.5-<7 0 0 0 0
7-<7.5 0 0 0 0
7.5-<8 0 0 0 0
8-<8.5 0 0 0 0
8.5-<9 0 0 0 0
9-<9.5 0 0 0 0
9.5-10 0 0 0 0
Values outside the +10D and -10D were excluded from analysis as they would skew the mean.

140
2.3 Cataract Surgical Practices
2.3.1 Number of Cataract Surgery Registered to CSR by State
Table 2.3.1-1:Number of Cataract Surgery Registered to CSR by State, CSR 2013-2014
State 2013 2014
Pahang 64 - Kelantan - 186
Terengganu - 38
Sarawak 76 831
2.3.2 Surgeon Status
Table 2.3.2-1:Surgeon Status, CSR 2013-2014
Year 2013 2014
No. of patients (N) 140 1055
n % n %
Specialist 135 96.43 1016 96.3
Gazetting Specialist 5 3.57 35 3.32
Medical Officer 0 0 4 0.38
Missing/NA 0 0 0 0
2.3.3 Duration of Surgery
Table 2.3.3-1:Duration of Surgery by Types of Cataract Surgery in minutes, CSR 2013-2014
Year 2013* 2014*
Median (25th percentile-75th percentile) Median (25th percentile-75th percentile)
All eyes 25 (19-35) 20 (17-30)
Phaco 22 (18-30) 20 (16-25)
ECCE 55 (42-70) 35 (30-47)
Phaco → ECCE 50 (38-52) 41 (35-58)
ICCE 50 - 32 -
Lens Aspiration - - - -
Data entered with extreme values i.e. more than 3 hours and less than 15 minutes were not analyzed as it would skew the data

141
2.3.4 Distribution of Cataract Surgery Performed Under Day Care Setting
Table 2.3.4-1:Distribution of Cataract Surgery Performed Under Day Care Setting, CSR 2013-2014
Year 2013 2014
Number of SDPs 2 4
Total number of cataract surgery registered to CSR 140 1055
Number of surgery excluding children and combined surgery 137 1031
n % n %
Number and % of day care surgery excluding children and combined surgery 76 55.5 1003 97.3
2.3.5 Distribution of Types of Cataract Surgery
Table 2.3.5-1Distribution of Types of Cataract Surgery, CSR 2013-2014
Year 2013 2014
No of patients (N) 140 1055
n % n %
Phacoemulsification 121 86.4 934 88.5
ECCE 12 8.6 100 9.5
Lens Aspiration 0 0.0 0 0.0
Phaco converted to ECCE 6 4.3 18 1.7
ICCE 1 0.7 1 0.1
Table 2.3.5-2:Distribution of Types of Cataract Surgery by SDP, CSR 2013-2014
Type of Cataract Surgery
2013 All Surgeries Phaco ECCE Lens
Aspiration
Phaco Converted to
ECCE ICCE
N % n % n % n % n % n %
All Centres 140 100.0 121 86.4 12 8.6 0 0.0 6 4.3 1 0.7
KK1M Pahang 64 100.0 47 73.4 11 17.2 0 0.0 5 7.8 1 1.6
KK1M Sarawak 76 100.0 74 97.4 1 1.3 0 0.0 1 1.3 0 0.0
Type of Cataract Surgery
2014 All Surgeries Phaco ECCE Lens
Aspiration
Phaco Converted to
ECCE ICCE
N % n % n % n % n % n %
All Centres 1055 100.0 934 88.5 100 9.5 0 0.0 18 1.7 1 0.1
KK1M Terengganu 38 100.0 28 84.2 10 15.8 0 0.0 0 0.0 0 0.0
KK1M Kelantan 186 100.0 94 50.5 82 44.1 0 0.0 9 4.8 0 0.0
KK1M Sarawak 831 100.0 812 97.2 8 1.4 0 0.0 9 1.1 1 0.1

142
Table 2.3.5-3:Distribution of Phacoemulsification by SDP, CSR 2013-2014
Years 2013 2014
n % n %
All Centres 121 86.4 934 94.2
KK1M Pahang 47 73.4 - -
KK1M Terengganu - - 28 84.2
KK1M Kelantan - - 94 50.5
KK1M Sarawak 74 97.4 812 97.2
Table 2.3.5-4:Distribution of ECCE by SDP, CSR 2013-2014
Years 2013 2014
n % n %
All Centres 12 8.6 100 3.6
KK1M Pahang 11 17.2 - -
KK1M Terengganu - - 10 15.8
KK1M Kelantan - - 82 44.1
KK1M Sarawak 1 1.3 8 1.4
2.3.6 Anaesthesia in Cataract Surgery
Table 2.3.6-1:Types of Anaesthesia, CSR 2013-2014
Year 2013 2014
No of patients (N) 140 1055
n % n %
General Anesthesia 0 0.0 4 0.4
Local Anesthesia 139 99.3 1042 98.8
Type of local anasthesia
Subtenon 52 37.4 153 14.7
Topical 90 64.7 879 84.4
Peribulbar 0 0.0 0 0.0
Retrobulbar 3 2.2 0 0.0
Intracameral 3 2.2 5 0.5
Subconjunctival 0 0.0 2 0.2
Facial block 0 0.0 0 0.0
Others NA NA NA NA
Combined local anaesthesia 13 9.4 6 0.6
Types of sedation for patients under local anaesthesia
No sedation 39 28.1 582 55.9
Oral sedation alone 9 6.5 0 0.0
Intravenous alone 1 0.7 0 0.0
Intravenous plus oral 0 0.0 0 0.0
Intramuscular alone 17 12.2 0 0.0

143
Table 2.3.6-2:Types of Anaesthesia in Patients 50 years and above, CSR 2013-2014
Year 2013 2014
No of patients (N) 135 1024
n % n %
General Anesthesia 0 0.0 4 0.4
Local Anesthesia 134 99.3 1011 98.7
Type of local anasthesia
Subtenon 49 36.6 148 14.6
Topical 89 66.4 855 84.6
Peribulbar 0 0.0 0 0.0
Retrobulbar 2 1.5 0 0.0
Intracameral 3 2.2 5 0.5
Subconjunctival 0 0.0 2 0.2
Facial block 0 0.0 0 0.0
Others NA NA NA NA
Combined local anaesthesia 13 9.7 6 0.6
Types of sedation for patients under local anaesthesia
No sedation 38 28.4 566 56.0
Oral sedation alone 9 6.7 0 0.0
Intravenous alone 1 0.7 0 0.0
Intravenous plus oral 0 0.0 0 0.0
Intramuscular alone 16 11.9 0 0.0
37.4
14.7
64.7
84.4
2.2 0.50.0 0.2
9.4
0.60
10
20
30
40
50
60
70
80
90
100
2013 2014
%
Year
Subtenon
Topical
Intracameral
Subconjunctival
Combined local anaesthesia
Figure 2.3.6-1:Types of Anaesthesia, CSR 2013-2014

144
2.3.7 Intraocular Lens Implantation
Table 2.3.7-1:Intraocular Lens Implantation, CSR 2013-2014
Year 2013 2014
No of patients (N) 140 1055
n % n %
With IOL 139 99.3 1026 97.3
Without IOL 1 0.7 29 2.7
Not Available 0 0.0 0 0.0
IOL Placement
No of IOL 139 1026
PCIOL 131 94.2 974 94.9
ACIOL 4 2.9 4 0.4
Scleral Fixated IOL 0 0.0 0 0.0
Others 0 0.0 3 0.3
Not Available /missing 4 2.9 45 4.4
Materials of IOL
No of IOL 139 1026
1. Acrylic 123 88.5 987 96.2
2. PMMA 16 11.5 23 2.2
3. Silicone 0 0.0 1 0.1
4. Others 0 0.0 0 0.0
Not Available/ missing 0 0.0 15 1.5
Types of IOL
No of IOL 139 1026
1. Foldable 121 87.1 1008 98.2
2. Non-foldable 18 12.9 14 1.4
Not Available/ missing 0 0.0 4 0.4
0
20
40
60
80
100
120
2013 2014
%
Year
Acrylic
PMMA
Silicone
Others
Figure 2.3.7-1:Intraocular Lens Implantation, CSR 2013-2014

145
Table 2.3.7-2:Distribution of IOL Placement, CSR 2013-2014
Cataract Surgery With IOL
2013 2014
Posterior Chamber
IOL
Anterior Chamber
IOL
Scleral Fixated
IOL
Posterior Chamber
IOL
Anterior Chamber
IOL
Scleral Fixated
IOL
N n % n % n % N n % n % n %
All Centres 139 131 94.2 4 2.9 0 0.0 1026 974 94.9 4 0.4 0 0.0
KK1M Pahang 64 58 90.6 3 4.7 0 0.0 - - - - - - -
KK1M Terengganu - - - - - - - 36 34 94.4 0 0.0 0 0.0
KK1M Kelantan - - - - - - - 185 174 94.1 4 2.2 0 0.0
KK1M Sarawak 75 73 97.3 1 1.3 0 0.0 805 766 95.2 0 0.0 0 0.0
2.4 Intra-operative Complications
2.4.1 Intra-operative Complications
Table 2.4.1-1:Distribution of Type of Intra-operative Complications, CSR 2013-2014
Year 2013 2014
No. of patients (N) 140 1055
n % n %
Patient with intra-op complication 10 7.1 52 4.93
Types of complications
PCR 2 1.4 28 2.7
Vitreous loss 3 2.1 11 1.0
Zonular dehiscence 2 1.4 7 0.7
Drop nucleus 0 0.0 4 0.4
Suprachoroidal haemorrhage 0 0.0 1 0.1
Central corneal oedema 0 0.0 0 0.0
Others 6 4.3 12 1.1
Table 2.4.1-2:Distribution of Type of Intra-operative Complications – Posterior Capsule Rupture, CSR 2013-2014
Year 2013 2014
No. of patients (N) 140 1055
n % n %
Patient with intra-op complication 10 7.1 52 4.9
Types of complications
PCR and Others 1 0.7 7 0.7
PCR Only 1 0.7 21 2.0

146
1.4
2.7
2.1
1.0
1.4
0.7
0.0
0.4
0.0 0.10.00.0
4.3
1.1
0.0
0.5
1.0
1.5
2.0
2.5
3.0
3.5
4.0
4.5
2013 2014
%
Year
PCR
Vitreous loss
Zonular dehiscence
Drop nucleus
Suprachoroidal haemorrhage
Central corneal oedema
Others
Figure 2.4.1-1:Distribution of Specific Type of Intra-operative Complications, CSR 2013-2014
Table 2.4.1-3:Distribution of Types of Intra-operative Complications, CSR 2013-2014
Year No. of patients
(N)
Any intra-op complication
PCR Vitreous
loss Zonular
Dehiscence
Nucleus drop (or dropped nucleus)
Suprachoroidal Haemorrhage
Central Corneal Edema
Others
n % n % n % n % n % n % n % n %
2013
KK1M Pahang
64 10 15.6 2 3.1 3 4.7 2 3.1 0 0.0 0 0.0 0 0.0 6 9.4
KK1M Sarawak
76 0 0.0 0 0.0 0 0.0 0 0.0 0 0.0 0 0.0 0 0.0 0 0.0
2014
KK1M Terengganu
38 4 10.5 0 0.0 0 0.0 1 2.6 0 0.0 0 0.0 0 0.0 3 7.9
KK1M Kelantan
186 13 7.0 8 4.3 6 3.2 1 0.5 0 0.0 0 0.0 0 0.0 4 2.2
KK1M Sarawak
831 35 4.2 20 2.4 5 0.6 5 0.6 4 0.5 1 0.1 0 0.0 5 0.6
2.4.2 PCR
Table 2.4.2-1:PCR, CSR 2013-2014
Hospital 2013 2014
N n % N n %
KK1M Pahang 64 2 3.1 - - -
KK1M Terengganu - - - 38 0 0.0
KK1M Kelantan - - - 186 8 4.3
KK1M Sarawak 76 0 0.0 831 20 2.4

147
Figure 2.4.2-1:PCR (all surgeries) (National standard set at <3.0%), CSR 2013-2014
Figure 2.4.2-2:PCR (Phaco only) (National standard set at <3.0%), CSR 2013-2014
1.429
3.125
0.000
0.00 1.00 2.00 3.00 4.00 5.00
All
KK1M Pahang
KK1M Sarawak
Percent
Hosp
ital
Rate of PCR by SDP, 2013
2.654
4.301
2.407
0.000
0.00 1.00 2.00 3.00 4.00 5.00
All
KK1M Kelantan
KK1M Sarawak
KK1M Terengganu
Percent
Hosp
ital
Rate of PCR by SDP, 2014
0.826
2.128
0.000
0.00 1.00 2.00 3.00 4.00 5.00
All
KK1M Pahang
KK1M Sarawak
Percent
Hosp
ital
Rate of PCR by SDP (Phaco), 2013
2.355
4.255
2.217
0.000
0.00 1.00 2.00 3.00 4.00 5.00
All
KK1M Kelantan
KK1M Sarawak
KK1M Terengganu
Percent
Hosp
ital
Rate of PCR by SDP (Phaco), 2014

148
2.4.3 PCR by Type of Cataract Surgery
Table 2.4.3-1:PCR by Type of Cataract Surgery, CSR 2013-2014
Year 2013 2014
No. of patients 140 1055
Total PCR 2 28
N n % N n %
Phaco 121 1 0.8 934 22 2.4
ECCE 12 0 0.0 100 3 3.0
Lens Aspiration 0 0 0.0 0 0 0.0
ICCE 1 0 0.0 1 0 0.0
Phaco converted to ECCE 6 1 16.7 18 3 16.7
2.5 Cataract Surgery Outcome
2.5.1 Post-operative Complications Record and Ascertainment
Table 2.5.1-1:Distribution of Cataract Surgery with Post-operative Complication Record, CSR 2013-2014
Year 2013 2014
Total number of cataract surgery registered to CSR 140 1055
Cataract surgery with post-operative complication record 115 981
Ascertainment on post-operative complication (%) (82.1) (93.0)
Cataract surgery with visual outcome record 98 863
Ascertainment on visual outcome (%) (70.0) (81.8)
2.5.2 Post-operative Infectious Endophthalmitis
Table 2.5.2-1:Post-operative Infectious Endophthalmitis, CSR 2013-2014
Year 2013 2014
Eyes with post-operative complication records (N) 115 981
Eyes with post-operative infectious endophthalmitis (n) 0 0
Percentage of eyes with post-operative endophthalmitis (%) 0.0 0.0
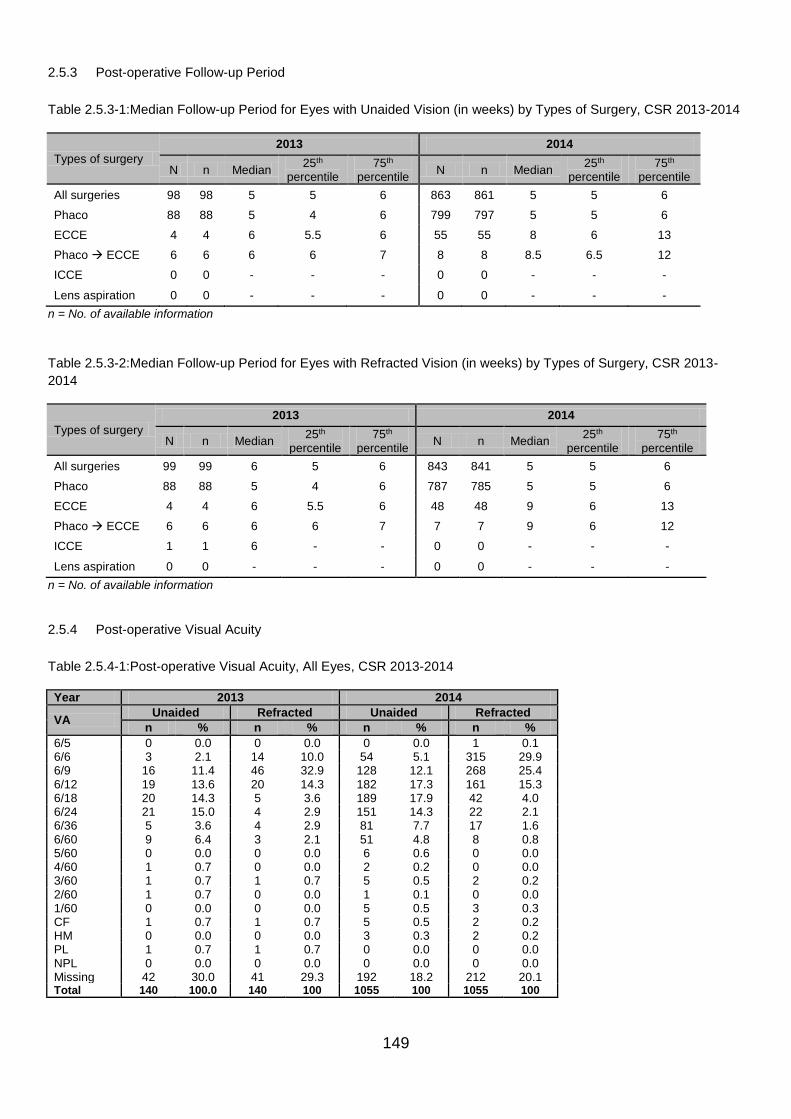
149
2.5.3 Post-operative Follow-up Period
Table 2.5.3-1:Median Follow-up Period for Eyes with Unaided Vision (in weeks) by Types of Surgery, CSR 2013-2014
Types of surgery
2013 2014
N n Median 25th
percentile 75th
percentile N n Median
25th percentile
75th percentile
All surgeries 98 98 5 5 6 863 861 5 5 6
Phaco 88 88 5 4 6 799 797 5 5 6
ECCE 4 4 6 5.5 6 55 55 8 6 13
Phaco ECCE 6 6 6 6 7 8 8 8.5 6.5 12
ICCE 0 0 - - - 0 0 - - -
Lens aspiration 0 0 - - - 0 0 - - -
n = No. of available information
Table 2.5.3-2:Median Follow-up Period for Eyes with Refracted Vision (in weeks) by Types of Surgery, CSR 2013-
2014
Types of surgery
2013 2014
N n Median 25th
percentile 75th
percentile N n Median
25th percentile
75th percentile
All surgeries 99 99 6 5 6 843 841 5 5 6
Phaco 88 88 5 4 6 787 785 5 5 6
ECCE 4 4 6 5.5 6 48 48 9 6 13
Phaco ECCE 6 6 6 6 7 7 7 9 6 12
ICCE 1 1 6 - - 0 0 - - -
Lens aspiration 0 0 - - - 0 0 - - -
n = No. of available information
2.5.4 Post-operative Visual Acuity
Table 2.5.4-1:Post-operative Visual Acuity, All Eyes, CSR 2013-2014
Year 2013 2014
VA Unaided Refracted Unaided Refracted
n % n % n % n %
6/5 0 0.0 0 0.0 0 0.0 1 0.1 6/6 3 2.1 14 10.0 54 5.1 315 29.9 6/9 16 11.4 46 32.9 128 12.1 268 25.4 6/12 19 13.6 20 14.3 182 17.3 161 15.3 6/18 20 14.3 5 3.6 189 17.9 42 4.0 6/24 21 15.0 4 2.9 151 14.3 22 2.1 6/36 5 3.6 4 2.9 81 7.7 17 1.6 6/60 9 6.4 3 2.1 51 4.8 8 0.8 5/60 0 0.0 0 0.0 6 0.6 0 0.0 4/60 1 0.7 0 0.0 2 0.2 0 0.0 3/60 1 0.7 1 0.7 5 0.5 2 0.2 2/60 1 0.7 0 0.0 1 0.1 0 0.0 1/60 0 0.0 0 0.0 5 0.5 3 0.3 CF 1 0.7 1 0.7 5 0.5 2 0.2 HM 0 0.0 0 0.0 3 0.3 2 0.2 PL 1 0.7 1 0.7 0 0.0 0 0.0 NPL 0 0.0 0 0.0 0 0.0 0 0.0 Missing 42 30.0 41 29.3 192 18.2 212 20.1 Total 140 100.0 140 100 1055 100 1055 100

150
0
5
10
15
20
25
30
35
%
VA
2013
Unaided
Refracted
0
5
10
15
20
25
30
35
%
VA
2014
Unaided
Refracted
Figure 2.5.4-1:Distribution of Post-operative Unaided and Refracted Visual Acuity, All Eyes, CSR 2013-2014
Table 2.5.4-2:Post-Operative Visual Acuity for Eyes without Ocular Co-morbidity, CSR 2013-2014
Year 2013 2014
Unaided Refracted Unaided Refracted
VA n % n % n % n %
6/5 0 0.0 0 0.0 0 0.0 1 0.2 6/6 3 4.6 12 18.5 45 6.7 254 39.0 6/9 11 16.9 33 50.8 105 15.7 212 32.6 6/12 17 26.2 11 16.9 158 23.7 122 18.7 6/18 15 23.1 3 4.6 142 21.3 27 4.1 6/24 10 15.4 1 1.5 117 17.5 17 2.6 6/36 2 3.1 3 4.6 52 7.8 6 0.9 6/60 6 9.2 2 3.1 32 4.8 6 0.9 5/60 0 0.0 0 0.0 3 0.4 0 0.0 4/60 1 1.5 0 0.0 1 0.1 0 0.0 3/60 0 0.0 0 0.0 2 0.3 1 0.2 2/60 0 0.0 0 0.0 1 0.1 0 0.0 1/60 0 0.0 0 0.0 3 0.4 2 0.3 CF 0 0.0 0 0.0 4 0.6 2 0.3 HM 0 0.0 0 0.0 2 0.3 1 0.2 PL 0 0.0 0 0.0 0 0.0 0 0.0 NPL 0 0.0 0 0.0 0 0.0 0 0.0 Total 65 100 65 100 667 100 651 100

151
0
10
20
30
40
50
60
6/5
6/6
6/9
6/12
6/18
6/24
6/36
6/60
5/60
4/60
3/60
2/60
1/60 CF HM PL
NPL
%
Visual Acuity
2013
Unaided
Refracted
0
5
10
15
20
25
30
35
40
45
6/5
6/6
6/9
6/12
6/18
6/24
6/36
6/60
5/60
4/60
3/60
2/60
1/60 CF HM PL
NPL
%
Visual Acuity
2014
Unaided
Refracted
Figure 2.5.4-2:Post-Operative Visual Acuity for Eyes without Ocular Co-morbidity, CSR 2013-2014
2.5.5 Post-operative Visual Acuity 6/12 or Better Among Eyes without Ocular Co-morbidity
Table 2.5.5-1:Post-operative Visual Acuity 6/12 or Better for Eyes without Ocular Co-morbidities by Types of Surgery,
CSR 2013-2014
2013 2014
Unaided Refracted Unaided Refracted
N n % N n % N n % N n %
All Surgeries 65 31 47.7 65 56 86.2 667 308 46.2 651 589 90.5 Phaco 60 30 50.0 60 54 90.0 622 292 46.9 612 555 90.7 ECCE 2 1 50.0 2 1 50.0 40 13 32.5 35 31 88.6 Phaco → ECCE 3 0 0.0 3 1 33.3 4 2 50.0 3 2 66.67 Lens Aspiration 0 0 0.0 0 0 0.0 0 0 0.0 0 0 0.0 ICCE 0 0 0.0 0 0 0.0 0 0 0.0 0 0 0.0

152
50.046.9
90.0 90.7
50.0
32.5
50.0
88.6
0
10
20
30
40
50
60
70
80
90
100
2013 2014
%
Year
Phaco (Unaided)
Phaco (Refracted)
ECCE (Unaided)
ECCE (Refracted)
Figure 2.5.5-1:Figure 2.5.5 1:Post-operative Visual Acuity 6/12 or Better for Eyes without Ocular Co-morbidities by ECCE and Phaco, CSR 2013-2014
Table 2.5.5-2:Post-operative Refracted Visual Acuity 6/12 or Better in Eyes without Ocular Co-morbidities by
Complications and Types of Surgery, CSR 2013-2014
2013
Types of Cataract Surgery
All Surgeries Lens
Aspiration ECCE Phaco Phaco → ECCE ICCE
N n % N n % N n % N n % N n % N n %
With intra-op complications
5 2 40.0 0 0 0.0 0 0 0.0 3 2 66.7 2 0 0.0 0 0 0.0
No intra-op complications
60 54 90.0 0 0 0.0 2 1 50.0 57 52 91.2 1 1 100.0 0 0 0.0
2014
Types of Cataract Surgery
All Surgeries Lens
Aspiration ECCE Phaco Phaco → ECCE ICCE
N n % N n % N n % N n % N n % N n %
With intra-op complications
21 17 81.0 0 0 0.0 4 4 100.0 15 12 80.0 2 1 50.0 0 0 0.0
No intra-op complications
630 572 90.8 0 0 0.0 31 27 87.1 597 543 91.0 1 1 100.0 0 0 0.0
2.5.6 Factors Contributing to Post-operative Refracted Visual Acuity of Worse than 6/12
Table 2.5.6-1:Factors Contributing to Post-operative Refracted VA of Worse than 6/12 in All Eyes, CSR 2013-2014
Year 2013 2014
Factors n % n %
N (total no. of post-op refracted vision worse than 6/12) 19 98 Preexisting ocular co-morbidity 3 15.8 12 12.2
High astigmatism 5 26.3 15 15.3
Posterior capsular opacity 0 0.0 1 1.0
Cystoid macular oedema 0 0.0 0 0.0
Endophthalmitis 0 0.0 0 0.0
Corneal decompensation 0 0.0 0 0.0
Decentered IOL 1 5.3 0 0.0
Retinal detachment 0 0.0 1 1.0
Others 11 57.9 28 28.6

153
Table 2.5.6-2:Factors Contributing to Post-operative Refracted VA of Worse than 6/12 in Eyes without Preexisting
Ocular co-morbidity, CSR 2013-2014
2013 2014
Factors n % n %
N 9 62
Preexisting ocular co-morbidity (not detected pre-operatively) 0 0.0 6 9.7
High astigmatism 2 22.2 5 8.1
Posterior capsular opacity 0 0.0 1 1.6
Cystoid macular oedema 0 0.0 0 0.0
Endophthalmitis 0 0.0 0 0.0
Corneal decompensation 0 0.0 0 0.0
Decentered IOL 1 11.1 0 0.0
Retinal detachment 0 0.0 0 0.0
Others 5 55.6 20 32.3
2.5.7 Actual or Residual Refractive Power (in Spherical Equivalent)
Table 2.5.7-1:Distribution of Target and Actual Refractive Power in ECCE and Phaco, CSR 2013-2014
Target
Refraction Actual-Target
Refraction Actual Refraction
All Patient All Patient ECCE Phaco
2013 2014 2013 2014 2013 2014 2013 2014
N 139 894 86 649 4 41 76 705
Mean -0.3 -0.3 -0.4 -0.8 -0.4 -1.2 -0.7 -1.0
SD 0.2 0.2 0.9 1.0 1.4 1.1 0.9 0.9
Median -0.3 -0.2 -0.5 -0.7 -0.4 -1.3 -0.8 -0.9
Minimum -0.8 -1.6 -3.2 -4.5 -2.0 -4.0 -3.3 -5.4
Maximum 0.0 0.5 1.8 3.3 0.0 0.8 1.6 3.0
Note: Eyes with actual refractive power (SE) of more than +10.0D and -10.0D were excluded from analysis
Table 2.5.7-2:Percentage Distribution of Target and Actual Refractive Power in ECCE and Phaco, CSR 2013-2014
Target Refraction Actual Refraction
All Patients ECCE Phaco
2013 2014 2013 2014 2013 2014
Dioptre (D) n % n % n % n % n % n %
-10.0-<(-9.5) 0 0.0 0 0.0 0 0.0 0 0.0 0 0.0 0 0.0
-9.5-<(-9.0) 0 0.0 0 0.0 0 0.0 0 0.0 0 0.0 0 0.0
-9.0-<(-8.5) 0 0.0 0 0.0 0 0.0 0 0.0 0 0.0 0 0.0
-8.5-<(-8.0) 0 0.0 0 0.0 0 0.0 0 0.0 0 0.0 0 0.0
-8.0-<(-7.5) 0 0.0 0 0.0 0 0.0 0 0.0 0 0.0 0 0.0
-7.5-<(-7.0) 0 0.0 0 0.0 0 0.0 0 0.0 0 0.0 0 0.0
-7.0-<(-6.5) 0 0.0 0 0.0 0 0.0 0 0.0 0 0.0 0 0.0
-6.5-<(-5.0) 0 0.0 0 0.0 0 0.0 0 0.0 0 0.0 1 0.1
-5.0-<(-4.5) 0 0.0 0 0.0 0 0.0 0 0.0 0 0.0 0 0.0
-4.5-<(-4.0) 0 0.0 0 0.0 0 0.0 0 0.0 0 0.0 2 0.3
-4.0-<(-3.5) 0 0.0 0 0.0 0 0.0 2 4.9 0 0.0 5 0.7
-3.5-<(-3.0) 0 0.0 0 0.0 0 0.0 1 2.4 1 1.3 8 1.1
-3.0-<(-2.5) 0 0.0 0 0.0 0 0.0 1 2.4 1 1.3 25 3.5
-2.5-<(-2.0) 0 0.0 0 0.0 0 0.0 3 7.3 3 3.9 46 6.5
-2.0-<(-1.5) 0 0.0 1 0.1 1 25.0 7 17.1 5 6.6 72 10.2
-1.5-<(-1.0) 0 0.0 0 0.0 1 25.0 8 19.5 12 15.8 120 17.0

154
Target Refraction Actual Refraction
All Patients ECCE Phaco
2013 2014 2013 2014 2013 2014
-1.0-<(-0.5) 18 12.9 67 7.5 1 25.0 7 17.1 21 27.6 179 25.4
-0.5-<0.0 120 86.3 822 91.9 0 0.0 4 9.8 16 21.1 126 17.9
0.0-<0.5 1 0.7 3 0.3 0 0.0 7 17.1 7 9.2 80 11.3
0.5-<1.0 0 0.0 1 0.1 0 0.0 1 2.4 6 7.9 32 4.5
1.0-<1.5 0 0.0 0 0.0 1 25.0 0 0.0 2 2.6 6 0.9
1.5-<2.0 0 0.0 0 0.0 0 0.0 0 0.0 2 2.6 1 0.1
2.0-<2.5 0 0.0 0 0.0 0 0.0 0 0.0 0 0.0 0 0.0
2.5-<3.0 0 0.0 0 0.0 0 0.0 0 0.0 0 0.0 1 0.1
3.0-<3.5 0 0.0 0 0.0 0 0.0 0 0.0 0 0.0 1 0.1
3.5-<4.0 0 0.0 0 0.0 0 0.0 0 0.0 0 0.0 0 0.0
4.0-<4.5 0 0.0 0 0.0 0 0.0 0 0.0 0 0.0 0 0.0
4.5-<5.0 0 0.0 0 0.0 0 0.0 0 0.0 0 0.0 0 0.0
5.0-<5.5 0 0.0 0 0.0 0 0.0 0 0.0 0 0.0 0 0.0
5.5-<6.0 0 0.0 0 0.0 0 0.0 0 0.0 0 0.0 0 0.0
6.0-<6.5 0 0.0 0 0.0 0 0.0 0 0.0 0 0.0 0 0.0
6.5-<7.0 0 0.0 0 0.0 0 0.0 0 0.0 0 0.0 0 0.0
7.0-<7.5 0 0.0 0 0.0 0 0.0 0 0.0 0 0.0 0 0.0
7.5-<8.0 0 0.0 0 0.0 0 0.0 0 0.0 0 0.0 0 0.0
8.0-<8.5 0 0.0 0 0.0 0 0.0 0 0.0 0 0.0 0 0.0
8.5-<9.0 0 0.0 0 0.0 0 0.0 0 0.0 0 0.0 0 0.0
9.0-<9.5 0 0.0 0 0.0 0 0.0 0 0.0 0 0.0 0 0.0
9.5-<10.0 0 0.0 0 0.0 0 0.0 0 0.0 0 0.0 0 0.0
Eyes with actual refractive power (SE) of more than +10.0D and -10.0D were excluded from analysis
0
5
10
15
20
25
30
-10
.0-<
(-9
.5)
-9.5
-<(-
9.0
)
-9.0
-<(-
8.5
)
-8.5
-<(-
8.0
)
-8.0
-<(-
7.5
)
-7.5
-<(-
7.0
)
-7.0
-<(-
6.5
)
-6.5
-<(-
5.0
)
-5.0
-<(-
4.5
)
-4.5
-<(-
4.0
)
-4.0
-<(-
3.5
)
-3.5
-<(-
3.0
)
-3.0
-<(-
2.5
)
-2.5
-<(-
2.0
)
-2.0
-<(-
1.5
)
-1.5
-<(-
1.0
)
-1.0
-<(-
0.5
)
-0.5
-<0
.0
0.0
-<0
.5
0.5
-<1
.0
1.0
-<1
.5
1.5
-<2
.0
2.0
-<2
.5
2.5
-<3
.0
3.0
-<3
.5
3.5
-<4
.0
4.0
-<4
.5
4.5
-<5
.0
5.0
-<5
.5
5.5
-<6
.0
6.0
-<6
.5
6.5
-<7
.0
7.0
-<7
.5
7.5
-<8
.0
8.0
-<8
.5
8.5
-<9
.0
9.0
-<9
.5
9.5
-<1
0.0
%
D
ECCE (2013)
ECCE (2014)
Phaco (2013)
Phaco (2014)
Figure 2.5.7-1:Distribution of Actual Refractive Power in ECCE and Phaco, CSR 2013-2014

155
Table 2.5.7-3:Difference in Target and Actual Refractive Power for Patients who had Phacoemulsification Only, CSR
2013-2014
Target Refraction Actual Refraction Difference between Target
and Actual Refraction
2013 2014 2013 2014 2013 2014
Power (D) n % n % n % n % n % n %
N 120 100 807 100 76 100 705 100 75 100 614 100
-5.0-<(-4.5) 0 0.0 0 0.0 0 0.0 0 0.0 0 0.0 0 0.0
-4.5-<(-4.0) 0 0.0 0 0.0 0 0.0 2 0.3 0 0.0 1 0.2
-4.0-<(-3.5) 0 0.0 0 0.0 0 0.0 5 0.7 0 0.0 5 0.8
-3.5-<(-3.0) 0 0.0 0 0.0 1 1.3 8 1.1 1 1.3 5 0.8
-3.0-<(-2.5) 0 0.0 0 0.0 1 1.3 25 3.5 1 1.3 16 2.6
-2.5-<(-2.0) 0 0.0 0 0.0 3 3.9 46 6.5 2 2.7 36 5.9
-2.0-<(-1.5) 0 0.0 0 0.0 5 6.6 72 10.2 4 5.3 72 11.7
-1.5-<(-1.0) 0 0.0 0 0.0 12 15.8 120 17.0 8 10.7 87 14.2
-1.0-<(-0.5) 9 7.5 40 5.0 21 27.6 179 25.4 20 26.7 140 22.8
-0.5-<0.0 110 91.7 764 94.7 16 21.1 126 17.9 15 20.0 133 21.7
0.0-<0.5 1 0.8 3 0.4 7 9.2 80 11.3 13 17.3 67 10.9
0.5-<1.0 0 0.0 0 0.0 6 7.9 32 4.5 7 9.3 42 6.8
1.0-<1.5 0 0.0 0 0.0 2 2.6 6 0.9 1 1.3 8 1.3
1.5-<2.0 0 0.0 0 0.0 2 2.6 1 0.1 3 4.0 0 0.0
2.0-<2.5 0 0.0 0 0.0 0 0.0 0 0.0 0 0.0 0 0.0
2.5-<3.0 0 0.0 0 0.0 0 0.0 1 0.1 0 0.0 1 0.2
3.0-<3.5 0 0.0 0 0.0 0 0.0 1 0.1 0 0.0 1 0.2
3.5-<4.0 0 0.0 0 0.0 0 0.0 0 0.0 0 0.0 0 0.0
4.0-<4.5 0 0.0 0 0.0 0 0.0 0 0.0 0 0.0 0 0.0
4.5-<5.0 0 0.0 0 0.0 0 0.0 0 0.0 0 0.0 0 0.0
5.0-<5.5 0 0.0 0 0.0 0 0.0 0 0.0 0 0.0 0 0.0
NOTE: Formula of
0.0
5.0
10.0
15.0
20.0
25.0
30.0
-5.0
-<(-
4.5
)
-4.5
-<(-
4.0
)
-4.0
-<(-
3.5
)
-3.5
-<(-
3.0
)
-3.0
-<(-
2.5
)
-2.5
-<(-
2.0
)
-2.0
-<(-
1.5
)
-1.5
-<(-
1.0
)
-1.0
-<(-
0.5
)
-0.5
-<0
.0
0.0
-<0
.5
0.5
-<1
.0
1.0
-<1
.5
1.5
-<2
.0
2.0
-<2
.5
2.5
-<3
.0
3.0
-<3
.5
3.5
-<4
.0
4.0
-<4
.5
4.5
-<5
.0
5.0
-<5
.5
%
D
2013
2014
Figure 2.5.7-2:Difference in Target and Actual Refractive Power for Patients who had Phacoemulsification Only, CSR
2013-2014

156
Table 2.5.7-4:Percentage of Difference in Target and Actual Refractive Power within ±1.0D by SDP, CSR 2013-2014
2013
All By Phacoemulsification By ECCE
No. of patient
with refracted
VA
Difference between Target
and Actual Refraction within
±1.0D
No. of patient
with refracted
VA
Difference between Target
and Actual Refraction within
±1.0D
No. of patient
with refracted
VA
Difference between Target
and Actual Refraction within
±1.0D
N n % N n % N n %
All Centres 86 61 70.9 75 55 73.3 4 1 25.0
KK1M Pahang 34 24 70.6 25 19 76.0 3 1 33.3
KK1M Sarawak 52 37 71.2 50 36 72.0 1 0 0.0
2014
All By Phacoemulsification By ECCE
No. of patient
with refracted
VA
Difference between Target
and Actual Refraction within
±1.0D
No. of patient
with refracted
VA
Difference between Target
and Actual Refraction within
±1.0D
No. of patient
with refracted
VA
Difference between Target
and Actual Refraction within
±1.0D
N n % N n % N n %
All Centres 649 402 61.9 614 382 62.2 29 18 62.1
KK1M Terengganu
22 16 72.7 15 13 86.7 7 3 42.9
KK1M Kelantan 62 47 75.8 41 35 85.4 18 11 61.1
KK1M Sarawak 565 339 60.0 558 334 59.9 4 4 100.0
NOTE: Formula of Actual Refraction,
Result is based on available info of target and actual refraction.
Target/Planned refractive power = Section pre-clerking
Actual refractive power, SE = Section post-op visual acuity measurement (SE=SP+(CY/2))
Denominator = patient with refraction = if info available in refracted vision Section post-op visual acuity measurement

157
CHAPTER 3
MAIWP-HOSPITAL SELAYANG
Contributing Editors
Nor Fariza Ngah
Mohamad Aziz Salowi
Tassha Hilda Adnan
Nadiah Sa’at

158
CHAPTER 3: MAIWP-HOSPITAL SELAYANG (PPKM-HS)
PPKM-HS forms the “static” portion of the KK1M Strategy to address issue of cataract blindness within an urban
population. It is a dedicated center for cataract surgery, has two fully functioning operating theatres and includes all
other cataract care pathways under one roof. It opens for clinic and surgery sessions daily from Monday to Friday.
Consistent with its aim to maximise output at the same time produce high quality with good outcome surgery, the
scheduled surgical cases are low risks/less complicated cases and performed by fully certified surgeons. Its location
at the commercial shoplot facilitates population access to the center. Cataract surgery data are entered into the local
Eye Clinic Management System (ECMS) which synchronises with NED database at regular intervals.
3.1 Stock and Flow
PPKM-HS receives feeder from hospitals within Central Zone (Selangor, Wilayah Persekutuan and Negeri Sembilan)
and beyond. The number of patients increased from 1506 in 2013 to 2256 in 2014.
3.1.1 Stock and Flow
Table 3.1.1-1:Stock and Flow, CSR 2013-2014
Year 2013 2014
Total no. of cataract surgery registered to CSR
1506 2266
n % n %
Cataract surgery with visual outcome records
1441 95.7 2183 96.3
3.2 Characteristics of Patients
Although PPKM-HS is part of the Cataract Free Zone Project - KK1M strategy to address cataract blindness issue in the country, the mean presenting age of the patients was younger, similar to mean presenting age for MOH. This could be due to its location in the urban area.
3.2.1 Patient Demography
Table 3.2.1-1:Age and Gender Distributions, CSR 2013-2014
Year 2013 2014
Total number of cataract surgery 1506 2266
Age
Mean (years) 65.3 65.2
Median (years) 66 66
Minimum (year) 19 1
Maximum (years) 93 98

159
% Distribution
Age group, years n % n %
0-4 0 0.0 1 0.0
5-9 0 0.0 0 0.0
10-14 0 0.0 0 0.0
15-19 1 0.1 0 0.0
20-24 3 0.2 1 0.0
25-29 0 0.0 0 0.0
30-34 1 0.1 4 0.2
35-39 4 0.3 3 0.1
40-44 17 1.1 23 1.0
45-49 36 2.4 65 2.5
50-54 108 7.2 134 5.0
55-59 177 11.8 317 12.3
60-64 294 19.5 430 17.9
65-69 343 22.8 541 23.6
70-74 320 21.3 435 19.6
75-79 156 10.4 261 12.7
≥80 46 3.1 51 5.2
Missing 0 0 0 0
Gender
Male 684 45.4 1077 47.5
Female 822 54.6 1189 52.5
Missing 0 0 0 0
0 0 0 1 3 0 1 417
36
108
177
294
343
320
156
46
1 0 0 0 1 0 4 323
65
134
317
430
541
435
261
51
0
100
200
300
400
500
600
0-4 5-9 10-14 15-19 20-24 25-29 30-34 35-39 40-44 45-49 50-54 55-59 60-64 65-69 70-74 75-79 ≥80
No
.
Age group
2013
2014
Figure 3.2.1-1:Age Distribution, CSR 2013-2014

160
3.2.2 Systemic co-morbidity
Similar to profile of patients in total, Hypertension and Diabetis Mellitus formed the major medical illness of patients
presenting for cataract surgery in PPKM-HS
Table 3.2.2-1:Distribution of Systemic Co-Morbidity, CSR 2013-2014
Year 2013 2014
No of patients (N) 1506 2266
Percentage of patients with any systemic co-morbidity 81.9 77.3
Percentage of patients with specific systemic co-morbidity
n % n %
1. Hypertension 984 62.2 1405 62.0
2. Diabetes Mellitus 679 42.9 1042 46.0
3. Ischaemic Heart Disease 76 4.8 110 4.9
4. Renal Failure 13 0.8 35 1.5
5. Cerebrovascular accident 21 1.3 16 0.7
6. COAD/Asthma 66 4.2 87 3.8
7. Others 525 33.2 974 43.0
Number or percentage may be more than total or 100% as patients might have more than one systemic co-morbidity
62.2 62.0
42.946.0
4.8 4.90.8 1.50
10
20
30
40
50
60
70
2013 2014
%
Year
HPT
DM
IHD
Renal Failure
Figure 3.2.2-1: Percentage of Patients with Specific Systemic Co-morbidity, CSR 2013-2014

161
3.2.3 Causes of cataract
Table 3.2.3-1:Causes of Cataract, CSR 2013-2014
Year 2013 2014
No of patients (N) 1506 2266
n % n %
Primary cataract 1214 80.6 1722 76.0
Secondary cataract 9 0.6 8 0.4
Missing value 583 18.8 536 23.7
Primary Cataract (N) 1067 1467
n % n %
Senile/age related 1064 99.7 1463 99.7
Congenital 0 0.0 0 0.0
Development 0 0.0 0 0.0
Others 3 0.3 4 0.3
Secondary Cataract (N) 5 2
n % n %
Trauma 1 20.0 0 0.0
Drug induced 1 20.0 1 50.0
Surgery induced 2 40.0 0 0.0
Others 1 20.0 1 50.0
3.2.4 First or Second Eye Surgery
The percentage of patients who had surgery in the fellow eye is higher than the figure for all MOH (35.2% in 2014). This is an evidence to suggest that PPKM-HS concept has potential to be used to increase access to patients requiring surgery. Table 3.2.4-1:First or Fellow Eye Surgery, CSR 2013-2014
Year 2013 2014
No of patients (N) 1506 2266
n % n %
First eye surgery 894 59.4 1212 53.5
Fellow eye surgery 612 40.6 913 40.3
Missing 0 0.0 141 6.2
Patients who had second surgery in the same year 0 0.0 449 19.8
Period of time between first and fellow eye surgery (months)
N 611 913
Mean 17.3 13.9
SD 27.3 27.2
Median 6.8 4.3
Patients who had cataract surgery before 612 913
n % n %
Eyes with intra-operative complications during surgery in the first eye 36 5.9 33 3.6

162
3.2.5 Past Ocular Surgery of the Operated Eye
Most patients did not have any past ocular surgery on the operated eye. Table 3.2.5-1:Past Ocular Surgery of the Operated Eye, CSR 2013-2014
Year 2013 2014
No. of patients 1506 2266
No. of eyes with past ocular surgery record (N) 1424 2031
n % n %
Patients with no past ocular surgery 1362 95.6 1986 97.8
Vitreoretinal surgery 33 2.3 26 1.3
Pterygium excision 10 0.7 20 1.0
Filtering surgery 0 0.0 0 0.0
Penetrating keratoplasty 0 0.0 0 0.0
Others 22 1.5 20 1.0
Number or percentage may be more than total or 100% as patients might have more than one past ocular surgery
2.3
1.3
0.7
1.0
1.5
1.0
0.0
0.5
1.0
1.5
2.0
2.5
2013 2014
%
Year
Vitreoretinal surgery
Pterygium excision
Others
Figure 3.2.5-1:Distribution of Past Ocular Surgery of the Operated Eye, CSR 2013-2014
3.2.6 Pre-existing Ocular Co-morbidity
Consistent with the concept of maximizing surgical output by surgery on low risk cases, only 16% of the operated patients had pre-existing ocular co-morbidity on the operated eye. (as compared to 40% in total MOH and 24% in KK1M mobile and transit)
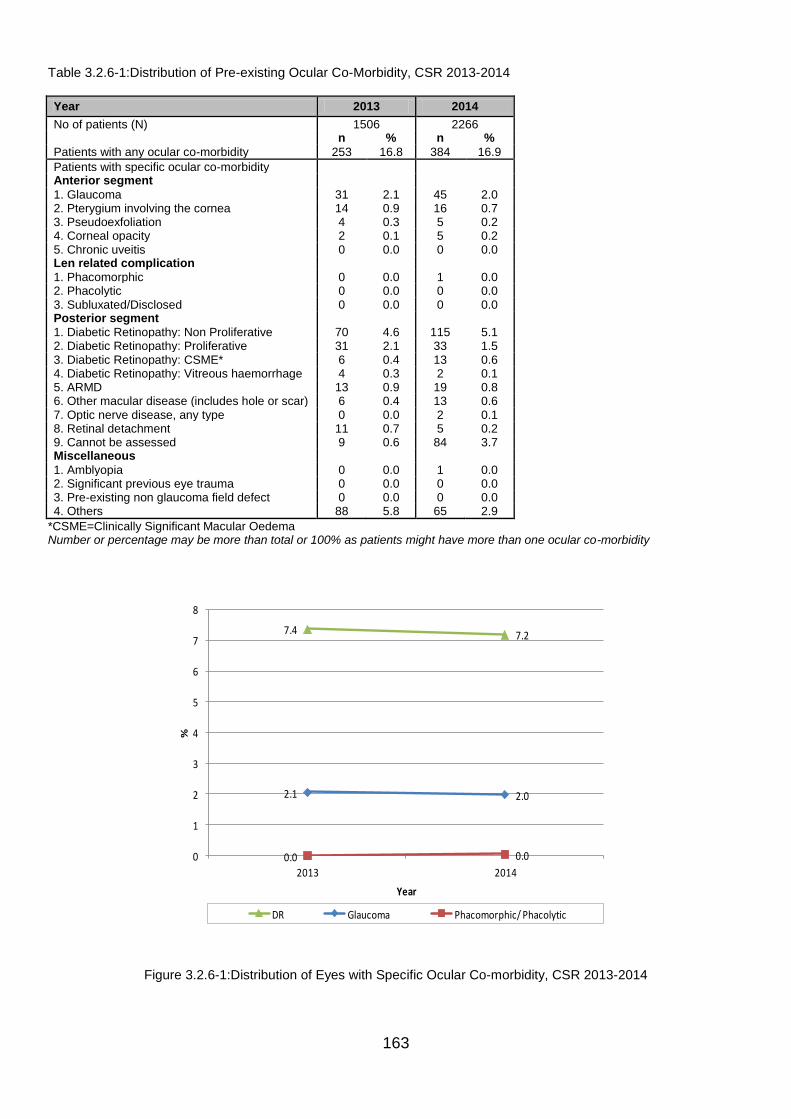
163
Table 3.2.6-1:Distribution of Pre-existing Ocular Co-Morbidity, CSR 2013-2014
Year 2013 2014
No of patients (N) 1506 2266 n % n %
Patients with any ocular co-morbidity 253 16.8 384 16.9
Patients with specific ocular co-morbidity Anterior segment
1. Glaucoma 31 2.1 45 2.0 2. Pterygium involving the cornea 14 0.9 16 0.7 3. Pseudoexfoliation 4 0.3 5 0.2 4. Corneal opacity 2 0.1 5 0.2 5. Chronic uveitis 0 0.0 0 0.0 Len related complication
1. Phacomorphic 0 0.0 1 0.0 2. Phacolytic 0 0.0 0 0.0 3. Subluxated/Disclosed 0 0.0 0 0.0 Posterior segment
1. Diabetic Retinopathy: Non Proliferative 70 4.6 115 5.1 2. Diabetic Retinopathy: Proliferative 31 2.1 33 1.5 3. Diabetic Retinopathy: CSME* 6 0.4 13 0.6 4. Diabetic Retinopathy: Vitreous haemorrhage 4 0.3 2 0.1 5. ARMD 13 0.9 19 0.8 6. Other macular disease (includes hole or scar) 6 0.4 13 0.6 7. Optic nerve disease, any type 0 0.0 2 0.1 8. Retinal detachment 11 0.7 5 0.2 9. Cannot be assessed 9 0.6 84 3.7 Miscellaneous
1. Amblyopia 0 0.0 1 0.0 2. Significant previous eye trauma 0 0.0 0 0.0 3. Pre-existing non glaucoma field defect 0 0.0 0 0.0 4. Others 88 5.8 65 2.9
*CSME=Clinically Significant Macular Oedema Number or percentage may be more than total or 100% as patients might have more than one ocular co-morbidity
7.4 7.2
2.1 2.0
0.0 0.00
1
2
3
4
5
6
7
8
2013 2014
%
Year
DR Glaucoma Phacomorphic/ Phacolytic
Figure 3.2.6-1:Distribution of Eyes with Specific Ocular Co-morbidity, CSR 2013-2014

164
3.2.7 Pre-operative Vision
Most patients presented at moderate visual impairment (40.9% at <6/18 - 6/60 in 2014) unlike figure for total MOH (43.2% at <3/60 in 2014)
Table 3.2.7-1:Distribution of Pre-Operative Vision, CSR 2013-2014
Year 2013 2014
No. of patients (N) 1506 2266
n % n %
Patients with unaided VA 1148 76.2 1662 73.3
Patients with refracted VA 6 0.4 10 0.4
Patients with no refraction 1191 79.1 1652 72.9
6/12 and better Unaided 58 5.1 79 4.8
Refracted 2 33.3 0 0.0
<6/12 - 6/18 Unaided 91 7.9 156 9.4
Refracted 0 0.0 2 20.0
<6/18 - 6/60 Unaided 506 44.1 680 40.9
Refracted 4 66.7 3 30.0
<6/60 - 3/60 Unaided 135 11.8 194 11.7
Refracted 0 0.0 0 0.0
<3/60 Unaided 358 31.2 553 33.3
Refracted 0 0.0 5 50.0
Unaided VA for patient with no refraction
n 1145 1652
6/12 and better 58 5.1 79 4.8
<6/12 - 6/18 91 7.9 154 9.3
<6/18 - 6/60 503 43.9 677 41.0
<6/60 - 3/60 135 11.8 194 11.7
<3/60 358 31.3 548 33.2
0
5
10
15
20
25
30
35
6/56/6
6/96/12
6/186/24
6/366/60
5/604/60
3/602/60
1/60CF
HMPL
NPL
%
Visual Acuity
2013
Unaided
Refracted
Figure 3.2.7-1:Distribution of Pre-Operative Vision (Unaided/presenting and refracted), CSR 2013
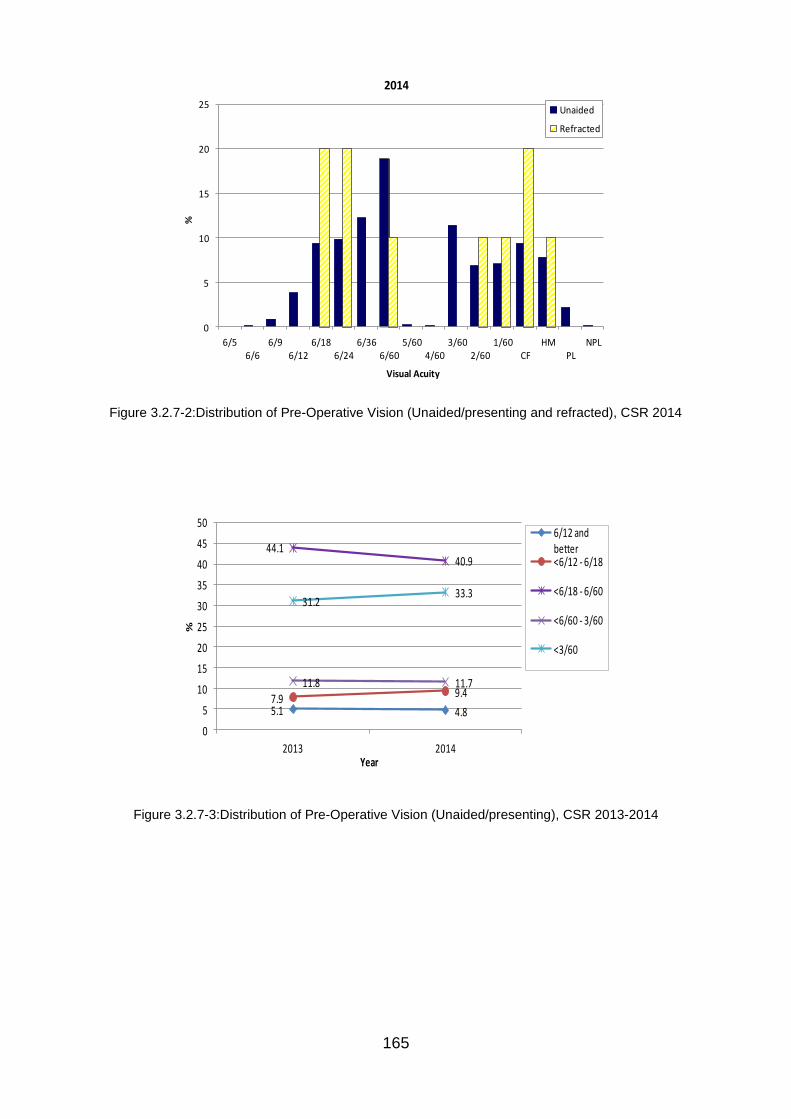
165
0
5
10
15
20
25
6/56/6
6/96/12
6/186/24
6/366/60
5/604/60
3/602/60
1/60CF
HMPL
NPL
%
Visual Acuity
2014
Unaided
Refracted
Figure 3.2.7-2:Distribution of Pre-Operative Vision (Unaided/presenting and refracted), CSR 2014
5.1 4.87.9 9.4
44.140.9
11.8 11.7
31.233.3
0
5
10
15
20
25
30
35
40
45
50
2013 2014
%
Year
6/12 and better<6/12 - 6/18
<6/18 - 6/60
<6/60 - 3/60
<3/60
Figure 3.2.7-3:Distribution of Pre-Operative Vision (Unaided/presenting), CSR 2013-2014

166
33.3
0.00.0
20.0
66.7
30.0
0.0 0.00.0
50.0
0
10
20
30
40
50
60
70
2013 2014
%
Year
6/12 and better
<6/12 - 6/19
<6/18 - 6/61
<6/60 - 3/61
<3/60
Figure 3.2.7-4:Distribution of Pre-Operative Vision (Refracted), CSR 2013-2014
3.2.8 Target Refractive Power
Table 3.2.8-1:Distribution of Target Refractive Power, CSR 2013-2014
Year 2013 2014
Operated eye ( N) 985 859
Mean -0.3 -0.3
SD 0.4 0.1
Median -0.3 -0.3
Minimum -6.2 -1.3
Maximum 0.01 0.20
Table 3.2.8-2:Distribution of Target Refractive Power, CSR 2013-2014
Year 2013 2014
Target refractive power (Dioptres) Operated eye Operated eye
N=985 N=859
n % n %
-10-<(-9.5) 0 0.0 0 0.0 -9.5-<(-9) 0 0.0 0 0.0 -9-<(-8.5) 0 0.0 0 0.0 -8.5-<(-8) 0 0.0 0 0.0 -8-<(-7.5) 0 0.0 0 0.0 -7.5-<(-7) 0 0.0 0 0.0 -7-<(-6.5) 0 0.0 0 0.0 -6.5-<(-5) 4 0.4 0 0.0 -5-<(-4.5) 0 0.0 0 0.0 -4.5-<(-4) 0 0.0 0 0.0 -4-<(-3.5) 0 0.0 0 0.0 -3.5-<(-3) 0 0.0 0 0.0 -3-<(-2.5) 0 0.0 0 0.0 -2.5-<(-2) 0 0.0 0 0.0 -2-<(-1.5) 1 0.1 0 0.0

167
Year 2013 2014
Target refractive power (Dioptres) Operated eye Operated eye
N=985 N=859
-1.5-<(-1) 1 0.1 3 0.4 -1-<(-0.5) 42 4.3 53 6.2 -0.5-<0 936 95.0 802 93.4 0-<0.5 1 0.1 1 0.1 0.5-<1 0 0.0 0 0.0 1-<1.5 0 0.0 0 0.0 1.5-<2 0 0.0 0 0.0 2-<2.5 0 0.0 0 0.0 2.5-<3 0 0.0 0 0.0 3-<3.5 0 0.0 0 0.0 3.5-<4 0 0.0 0 0.0 4-<4.5 0 0.0 0 0.0 4.5-<5 0 0.0 0 0.0 5-<5.5 0 0.0 0 0.0 5.5-<6 0 0.0 0 0.0 6-<6.5 0 0.0 0 0.0 6.5-<7 0 0.0 0 0.0 7-<7.5 0 0.0 0 0.0 7.5-<8 0 0.0 0 0.0 8-<8.5 0 0.0 0 0.0 8.5-<9 0 0.0 0 0.0 9-<9.5 0 0.0 0 0.0 9.5-10 0 0.0 0 0.0
Values outside the +10D and -10D were excluded from analysis as they would skew the mean.
3.3 Cataract Surgical Practices
3.3.1 Surgeon Status
Table 3.3.1-1:Surgeon Status, CSR 2013-2014
Year 2013 2014
No. of patients (N) 1506 2266
n % n %
Specialist 1488 98.8 2197 97.0
Gazetting Specialist 7 0.5 2 0.1
Medical Officer 11 0.7 23 1.0
Missing/NA 0 0 44 1.9
3.3.2 Duration of Surgery
Table 3.3.2-1:Duration of Surgery by Types of Cataract Surgery in minutes, CSR 2013-2014
Year 2013 2014
Median (25th percentile, 75th percentile) Median (25th percentile, 75th percentile)
All eyes 22 (18-30) 20 (17-25)
Phaco 22 (18-29) 20 (17-24)
ECCE 40 (32-49) 38 (34-45)
Phaco → ECCE 56.5 (45-67) 56.5 (47.5-71)
ICCE 45 (30-60) 64 (52.5-69)
Lens Aspiration 27.5 (21-34) 20.5 (17-23)
Data entered with extreme values i.e. more than 3 hours and less than 15 minutes were not analyzed as it would skew the data

168
3.3.3 Distribution of Types of Cataract Surgery
Table 3.3.3-1:Distribution of Types of Cataract Surgery, CSR 2013-2014
Year 2013 2014
No of patients (N) 1506 2266
n % n %
Phacoemulsification 1432 95.1 2196 96.9
ECCE 37 2.5 18 0.8
Lens Aspiration 3 0.2 5 0.2
Phaco converted to ECCE 25 1.7 39 1.7
ICCE 2 0.1 4 0.2
3.3.4 Anaesthesia in Cataract Surgery
The practice is consistent in all MOH premises
Table 3.3.4-1:Types of Anaesthesia, CSR 2013-2014
Year 2013 2014
No of patients (N) 1506 2266
n % n %
General Anesthesia 0 0.0 0 0.0
Local Anesthesia 1506 100.0 2266 100.0
Type of local anasthesia Subtenon 166 11.0 123 5.4
Topical 1282 85.1 2171 95.8
Peribulbar 0 0.0 0 0.0
Retrobulbar 0 0.0 6 0.3
Intracameral 287 19.1 494 21.8
Subconjunctival 25 1.7 12 0.5
Facial block 0 0.0 0 0.0
Combined local anaesthesia 309 20.5 584 25.8
Types of sedation for patients under local anaesthesia
No sedation 1305 86.7 1565 69.1
Oral sedation alone 0 0.0 0 0.0
Intravenous alone 1 0.1 0 0.0
Intravenous plus oral 1 0.1 0 0.0
Intramuscular alone 0 0.0 0 0.0

169
11.0
5.4
85.1
95.8
19.121.8
1.7 0.5
20.5 25.8
0
10
20
30
40
50
60
70
80
90
100
2013 2014
%
Year
Subtenon
Topical
Intracameral
Subconjunctival
Combined local anaesthesia
Figure 3.3.4-1:Types of Anaesthesia, CSR 2013-2014
3.3.5 Intraocular Lens Implantation
Table 3.3.5-1:Intraocular Lens Implantation, CSR 2013-2014
Year 2013 2014
No of patients (N) 1506 2266
n % n %
With IOL 1499 99.5 2256 99.6
Without IOL 7 0.5 7 0.3
Not Available 0 0.0 0 0.0
IOL Placement
No of IOL 1499 2259
PCIOL 1472 98.2 2218 98.2
ACIOL 24 1.6 36 1.6
Scleral Fixated IOL 0 0.0 2 0.1
Others 3 0.2 3 0.1
Not Available /missing 0 0.0 0 0.0
Materials of IOL
No of IOL 1499 2259
1. Acrylic 1396 93.1 2109 93.4
2. PMMA 23 1.5 26 1.2
3. Silicone 39 2.6 86 3.8
4. Others 9 0.6 12 0.5
Not Available/ missing 32 2.1 26 1.2
Types of IOL No of IOL 1499 2259
1. Foldable 1453 96.9 2210 97.8
2. Non-foldable 21 1.4 25 1.1
Not Available/ missing 25 1.7 24 1.1

170
Table 3.3.5-2:Distribution of IOL Placement, CSR 2013-2014
Cataract Surgery With IOL
Posterior Chamber IOL
Anterior Chamber IOL
Scleral Fixated IOL
N n % n % n %
2013 1506 1472 97.7 24 1.6 0 0.0
2014 2259 2218 98.2 36 1.6 2 0.1
3.4 Intra-operative Complications
3.4.1 Intra-operative Complications by Years
The percentages of PCR were not accurate as the ECMS had duplicates of data fields in its data entry form (PCR and Posterior Capsular Rupture). This results in wrong synchronization to NED. This problem has been rectified for data entry 2015 onward. Table 3.4.1-1:Distribution of Type of Intra-operative Complications, CSR 2013-2014
Year 2013 2014
No. of patients (N) 1506 2266
n % n %
Patient with intra-op complication 53 3.5 61 2.69
Types of complications
PCR 2 0.1 29 1.3
Vitreous loss 22 1.5 27 1.2
Zonular dehiscence 11 0.8 20 0.9
Drop nucleus 7 0.4 5 0.2
Suprachoroidal haemorrhage 0 0.0 0 0.0
Central corneal oedema 1 0.1 1 0.0
Others 40 2.7 6 0.3
PCR is inaccurate due to data collection error
Table 3.4.1-2:Distribution of Type of Intra-operative Complications – Posterior Capsule Rupture, CSR 2013-2014
Year 2013 2014
No. of patients (N) 1506 2266
n % n %
Patient with intra-op complication 52 3.5 61 2.7
Types of complications
PCR and Others 2 0.1 15 0.7
PCR Only 0 0.0 14 0.6

171
0.1
1.3
1.5
1.2
0.70.9
0.5
0.2
0.0 0.00.1
0.0
2.7
0.3
0.0
0.5
1.0
1.5
2.0
2.5
3.0
2013 2014
%
Year
PCR
Vitreous loss
Zonular dehiscence
Drop nucleus
Suprachoroidal haemorrhage
Central corneal oedema
Others
Figure 3.4.1-1:Distribution of Specific Type of Intra-operative Complications, CSE 2013-2014
Table 3.4.1-3:Distribution of Types of Intra-operative Complications, CSR 2013-2014
MAIWP No. of patients
(N)
Any intra-op complication
PCR Vitreous
loss Zonular
Dehiscence
Nucleus drop (or dropped
nucleus)
Suprachoroidal Haemorrhage
Central Corneal Edema
Others
n % n % n % n % n % n % n % n %
2013 1506 52 3.5 0 0.0 22 1.5 11 0.7 7 0.5 0 0.0 1 0.1 40 2.7
2014 2266 61 2.7 29 1.3 27 1.2 20 0.9 5 0.2 0 0.0 1 0.0 6 0.3
3.4.2 PCR
0.133
1.280
0.00 1.00 2.00 3.00 4.00 5.00
2013
2014
Percent
Ye
ar
Rate of PCR
Figure 3.4.2-1:PCR (all surgeries) (National standard set at <3.0%), CSR 2013-2014

172
Figure 3.4.2-2:PCR (Phaco only) (National standard set at <3.0%), CSR 2013-2014
3.4.3 PCR by Type of Cataract Surgery
Table 3.4.3-1:PCR by Type of Cataract Surgery, CSR 2013-2014
Year 2013 2014
No. of patients 1506 2266
Total PCR 2 29
N n % N n %
Phaco 1432 1 0.1 2196 19 0.9
ECCE 37 1 2.7 18 0 0.0
Lens Aspiration 3 0 0.0 5 0 0.0
ICCE 2 0 0.0 4 0 0.0
Phaco converted to ECCE 25 0 0.0 39 10 25.6
3.5 Cataract Surgery Outcome
3.5.1 Post-operative Complications Record and Ascertainment
Table 3.5.1-1:Distribution of Cataract Surgery with Post-operative Complication Record, CSR 2013-2014
Year 2013 2014
Total number of cataract surgery registered to CSR 1506 2266
Cataract surgery with post-operative complication record 1500 2251
Ascertainment on post-operative complication (%) 99.6 99.3
Cataract surgery with visual outcome record 1441 2183
Ascertainment on visual outcome (%) 95.7 96.3
0.1
0.9
0.00 1.00 2.00 3.00 4.00 5.00
2013
2014
Percent
Ye
ar
Rate of PCR (Phaco),

173
3.5.2 Post-operative Infectious Endophthalmitis
Table 3.5.2-1:Post-operative Infectious Endophthalmitis, CSR 2013-2014
Year 2013 2014
Eyes with post-operative complication records (N) 1506 2251
Eyes with post-operative infectious endophthalmitis (n) 0 0
Percentage of eyes with post-operative endophthalmitis (%) 0.0 0.0
3.5.3 Post-operative Follow-up Period
Table 3.5.3-1:Median Follow-up Period for Eyes with Unaided Vision (in weeks) by Types of Surgery, CSR 2013-2014
Types of surgery
2013 2014
N n Median 25th
percentile 75th
percentile N n Median
25th percentile
75th percentile
All surgeries 1445 1443 9 6 12 2189 2187 7 6 10
Phaco 1377 1375 9 6 12 2122 2120 7 6 11
ECCE 35 35 12 7 17 18 18 11.5 10 13
Phaco ECCE 23 23 17 11 21 37 37 11 7 12
ICCE 1 1 11 - - 3 3 10 1 14
Lens aspiration 3 3 12 6 12 5 5 7 3 7
n = No. of available information
Table 3.5.3-2:Median Follow-up Period for Eyes with Refracted Vision (in weeks) by Types of Surgery, CSR 2013-
2014
Types of surgery
2013 2014
N n Median 25th
percentile 75th
percentile N n Median
25th percentile
75th percentile
All surgeries 1377 1375 10 6 12 2048 2048 8 7 11
Phaco 1318 1316 10 6 12 1989 1989 7 7 11
ECCE 29 29 12 8 15 18 18 11.5 10 13
Phaco ECCE 21 21 17 12 21 33 33 11 10 13
ICCE 2 2 13.5 11 16 2 2 12 10 14
Lens aspiration 3 3 12 6 12 2 2 8 7 9
n = No. of available information

174
3.5.4 Post-operative Visual Acuity
Table 3.5.4-1:Post-operative Visual Acuity, All Eyes, CSR 2013-2014
Year 2013 2014
VA Unaided Refracted Unaided Refracted
n % n % n % n %
6/5 1 0.1 1 0.1 1 0.0 1 0.0
6/6 210 13.9 938 62.3 396 17.5 1339 59.1
6/9 448 29.8 267 17.7 710 31.3 469 20.7
6/12 212 14.1 65 4.3 342 15.1 113 5.0
6/18 222 14.7 38 2.5 254 11.2 40 1.8
6/24 81 5.4 21 1.4 126 5.6 25 1.1
6/36 89 5.9 11 0.7 128 5.6 20 0.9
6/60 81 5.4 18 1.2 91 4.0 20 0.9
5/60 0 0.0 0 0.0 0 0.0 0 0.0
4/60 0 0.0 0 0.0 0 0.0 0 0.0
3/60 37 2.5 8 0.5 52 2.3 10 0.4
2/60 15 1.0 1 0.1 28 1.2 1 0.0
1/60 7 0.5 2 0.1 20 0.9 1 0.0
CF 30 2.0 5 0.3 25 1.1 5 0.2
HM 11 0.7 2 0.1 10 0.4 4 0.2
PL 1 0.1 0 0.0 2 0.1 0 0.0
NPL 0 0.0 0 0.0 4 0.2 0 0.0
Missing 61 4.05 129 8.57 77 3.4 218 9.6
Total 1506 100.0 1506 100 2266 100 2266 100.0
0
10
20
30
40
50
60
70
%
VA
2013
Unaided
Refracted
Figure 3.5.4-1:Distribution of Post-operative Unaided and Refracted Visual Acuity, All Eyes, CSR 2013

175
0
10
20
30
40
50
60
70
%
VA
2014
Unaided
Refracted
Figure 3.5.4-2:Distribution of Post-operative Unaided and Refracted Visual Acuity, All Eyes, CSR 2014
Table 3.5.4-2:Post-Operative Visual Acuity for Eyes without Ocular Co-morbidity, CSR 2013-2014
Year 2013 2014
Unaided Refracted Unaided Refracted
VA n % n % n % n %
6/5 1 0.1 1 0.1 0 0.0 0 0
6/6 188 15.6 834 72.5 337 20.1 1,125 71.6
6/9 384 31.9 213 18.5 564 33.6 328 20.9
6/12 179 14.9 47 4.1 268 16.0 65 4.1
6/18 178 14.8 19 1.7 172 10.2 23 1.5
6/24 65 5.4 12 1.0 88 5.2 13 0.8
6/36 69 5.7 7 0.6 89 5.3 9 0.6
6/60 63 5.2 10 0.9 65 3.9 2 0.1
5/60 0 0.0 0 0.0 0 0.0 0 0.0
4/60 0 0.0 0 0.0 0 0.0 0 0
3/60 25 2.1 3 0.3 38 2.3 3 0.2
2/60 12 1.0 1 0.1 21 1.3 0 0
1/60 6 0.5 0 0.0 16 1.0 0 0.0
CF 26 2.2 3 0.3 13 0.8 2 0.1
HM 8 0.7 1 0.1 7 0.4 1 0.1
PL 0 0.0 0 0.0 0 0.0 0 0
NPL 0 0.0 0 0.0 2 0.1 0 0
Total 1204 100 1151 100 1680 100 1571 100
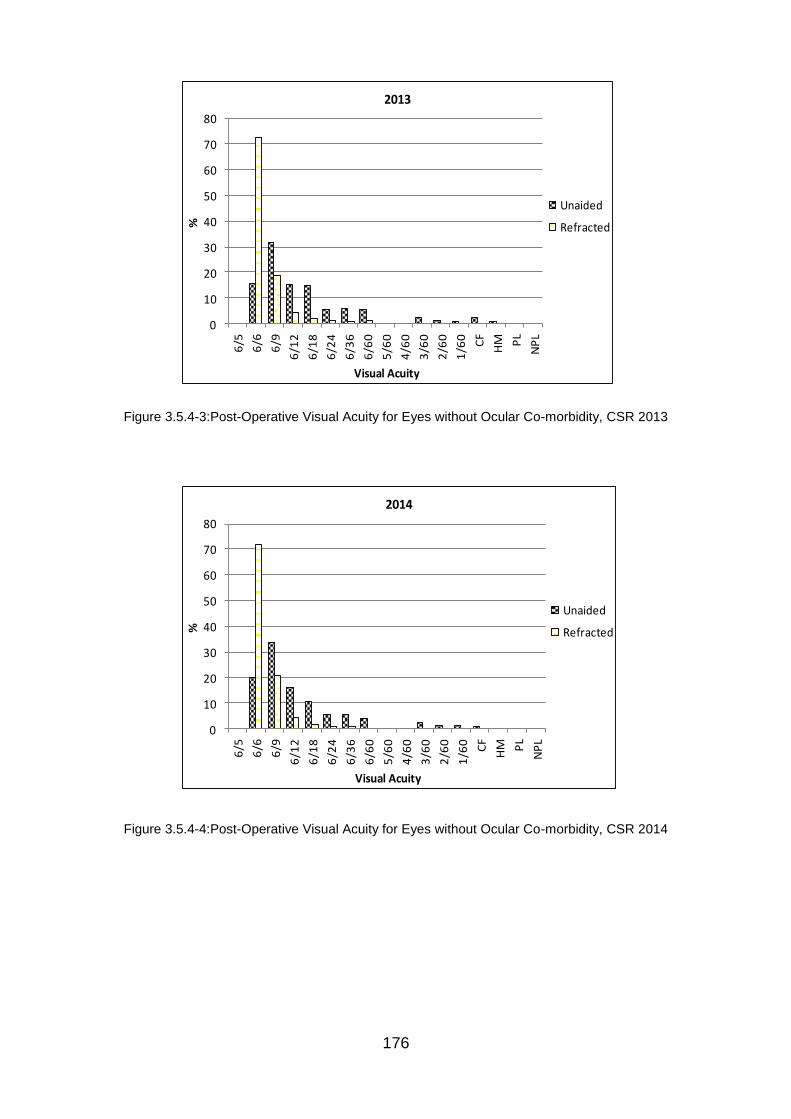
176
Figure 3.5.4-3:Post-Operative Visual Acuity for Eyes without Ocular Co-morbidity, CSR 2013
Figure 3.5.4-4:Post-Operative Visual Acuity for Eyes without Ocular Co-morbidity, CSR 2014
0
10
20
30
40
50
60
70
80
6/5
6/6
6/9
6/1
2
6/1
8
6/2
4
6/3
6
6/6
0
5/6
0
4/6
0
3/6
0
2/6
0
1/6
0 CF
HM PL
NP
L
%
Visual Acuity
2013
Unaided
Refracted
0
10
20
30
40
50
60
70
80
6/5
6/6
6/9
6/1
2
6/1
8
6/2
4
6/3
6
6/6
0
5/6
0
4/6
0
3/6
0
2/6
0
1/6
0 CF
HM PL
NP
L
%
Visual Acuity
2014
Unaided
Refracted

177
3.5.5 Post-operative Visual Acuity 6/12 or Better Among Eyes without Ocular Co-morbidity
Table 3.5.5-1:Post-operative Visual Acuity 6/12 or Better for Eyes without Ocular Co-morbidities by Types of Surgery,
CSR 2013-2014
2013 2014
Unaided Refracted Unaided Refracted
N n % N n % N n % N n %
All Surgeries 1204 752 62.5 1151 1095 95.1 1680 1169 69.6 1571 1518 96.6
Phaco 1147 729 63.6 1101 1057 96.0 1645 1154 70.2 1539 1491 96.9
ECCE 30 11 36.7 26 19 73.1 7 4 57.1 7 6 85.7
Phaco → ECCE 20 9 45.0 18 14 77.8 24 9 37.5 22 18 81.8
Lens Aspiration 2 0 0.0 2 2 100.0 2 2 100.0 1 1 100.0
ICCE 1 1 100.0 1 0 0.0 2 0 0.0 2 2 100.0
63.670.2
96.0 96.9
36.7
57.1
73.1
85.7
0
10
20
30
40
50
60
70
80
90
100
2013 2014
%
Year
Phaco (Unaided)
Phaco (Refracted)
ECCE (Unaided)
ECCE (Refracted)
Figure 3.5.5-1:Post-operative Visual Acuity 6/12 or Better for Eyes without Ocular Co-morbidities by ECCE and
Phaco, CSR 2013-2014
Table 3.5.5-2:Post-operative Refracted Visual Acuity 6/12 or Better in Eyes without Ocular Co-morbidities by
Complications and Types of Surgery, CSR 2013-2014
2013
Types of Cataract Surgery
All Surgeries Lens Aspiration ECCE Phaco Phaco → ECCE ICCE
N n % N n % N n % N n % N n % N n %
With intra-op complications
24 17 70.8 0 0 0 2 1 50 13 11 84.6 8 4 50 0 0 0
No intra-op complications
1127 1078 95.7 2 2 100 24 18 75 1088 1046 96.1 10 10 100 1 0 0

178
2014
Types of Cataract Surgery
All Surgeries Lens Aspiration ECCE Phaco Phaco → ECCE ICCE
N n % N n % N n % N n % N n % N n %
With intra-op complications
36 28 77.8 0 0 0 0 0 0.0 23 19 82.6 12 8 66.7 1 1 100
No intra-op complications
1535 1490 97.1 1 1 100 7 6 85.7 1516 1472 97.1 10 10 100.0 1 1 100
3.5.7 Factors Contributing to Post-operative Refracted Visual Acuity of Worse than 6/12
Table 3.5.7-1:Factors Contributing to Post-operative Refracted VA of Worse than 6/12 in All Eyes, CSR 2013-2014
Year 2013 2014
Factors n % n %
N (total no. of post-op refracted vision worse than 6/12) 106 126
Preexisting ocular co-morbidity 0 0.0 28 22.2
High astigmatism 0 0.0 2 1.6
Posterior capsular opacity 0 0.0 0 0.0
Cystoid macular oedema 0 0.0 3 2.4
Endophthalmitis 0 0.0 0 0
Corneal decompensation 0 0.0 0 0
Decentered IOL 0 0.0 0 0
Retinal detachment 0 0.0 1 0.8
Others 2 1.6 6 4.8
Table 3.5.7-2:Factors Contributing to Post-operative Refracted VA of Worse than 6/12 in Eyes without Preexisting
Ocular co-morbidity, CSR 2013-2014
2013 2014
Factors n % n %
N 56 53
Preexisting ocular co-morbidity (not detected pre-operatively) 0 0.0 6 11.3
High astigmatism 0 0.0 1 1.9
Posterior capsular opacity 0 0.0 0 0.0
Cystoid macular oedema 0 0.0 2 3.8
Endophthalmitis 0 0.0 0 0.0
Corneal decompensation 0 0.0 0 0.0
Decentered IOL 0 0.0 0 0.0
Retinal detachment 0 0.0 0 0.0
Others 2 3.6 4 7.5

179
3.5.8 Actual or Residual Refractive Power (Spherical Equivalent)
Table 3.5.8-1:Distribution of Target and Actual Refractive Power in ECCE and Phaco, CSR 2013-2014
Target Refraction Actual-Target
Refraction Actual Refraction
All Patient All Patient ECCE Phaco
2013 2014 2013 2014 2013 2014 2013 2014
N 990 862 870 658 29 18 1270 1693 Mean -0.3 -0.3 -0.1 -0.1 -0.4 -0.3 -0.5 -0.5 SD 0.4 0.1 0.7 0.7 0.9 0.9 0.7 0.6 Median -0.3 -0.3 -0.1 -0.1 -0.5 -0.3 -0.5 -0.5 Minimum -6.2 -1.3 -7.8 -4.0 -1.8 -2.8 -9 -5.8 Maximum 0.4 0.3 8.3 9.1 2.8 1.8 3.8 8.8
Note: Eyes with actual refractive power (SE) of more than +10.0D and -10.0D were excluded from analysis
Table 3.5.8-2:Percentage Distribution of Target and Actual Refractive Power in ECCE and Phaco, CSR 2013-2014
Target Refraction Actual Refraction
All Patients ECCE Phaco
2013 2014 2013 2014 2013 2014
Dioptre (D) n % n % n % n % n % n %
-10.0-<(-9.5) 0 0.0 0 0.0 0 0.0 0 0.0 0 0.0 0 0.0
-9.5-<(-9.0) 0 0.0 0 0.0 0 0.0 0 0.0 1 0.1 0 0.0
-9.0-<(-8.5) 0 0.0 0 0.0 0 0.0 0 0.0 0 0.0 0 0.0
-8.5-<(-8.0) 0 0.0 0 0.0 0 0.0 0 0.0 0 0.0 0 0.0
-8.0-<(-7.5) 0 0.0 0 0.0 0 0.0 0 0.0 1 0.1 0 0.0
-7.5-<(-7.0) 0 0.0 0 0.0 0 0.0 0 0.0 0 0.0 0 0.0
-7.0-<(-6.5) 0 0.0 0 0.0 0 0.0 0 0.0 0 0.0 0 0.0
-6.5-<(-5.0) 4 0.4 0 0.0 0 0.0 0 0.0 2 0.2 1 0.1
-5.0-<(-4.5) 0 0.0 0 0.0 0 0.0 0 0.0 0 0.0 0 0.0
-4.5-<(-4.0) 0 0.0 0 0.0 0 0.0 0 0.0 0 0.0 1 0.1
-4.0-<(-3.5) 0 0.0 0 0.0 0 0.0 0 0.0 1 0.1 0 0.0
-3.5-<(-3.0) 0 0.0 0 0.0 0 0.0 0 0.0 1 0.1 3 0.2
-3.0-<(-2.5) 0 0.0 0 0.0 0 0.0 1 5.6 4 0.3 3 0.2
-2.5-<(-2.0) 0 0.0 0 0.0 0 0.0 0 0.0 5 0.4 4 0.2
-2.0-<(-1.5) 1 0.1 0 0.0 2 6.9 0 0.0 19 1.5 29 1.7
-1.5-<(-1.0) 1 0.1 3 0.3 4 13.8 1 5.6 104 8.2 145 8.6
-1.0-<(-0.5) 42 4.2 53 6.1 8 27.6 4 22.2 339 26.7 474 28.0
-0.5-<0.0 936 94.5 802 93.0 6 20.7 4 22.2 522 41.1 683 40.3
0.0-<0.5 6 0.6 4 0.5 3 10.3 6 33.3 209 16.5 275 16.2
0.5-<1.0 0 0.0 0 0.0 4 13.8 1 5.6 46 3.6 55 3.2
1.0-<1.5 0 0.0 0 0.0 1 3.4 0 0.0 9 0.7 14 0.8
1.5-<2.0 0 0.0 0 0.0 0 0.0 1 5.6 4 0.3 4 0.2
2.0-<2.5 0 0.0 0 0.0 0 0.0 0 0.0 1 0.1 0 0.0
2.5-<3.0 0 0.0 0 0.0 1 3.4 0 0.0 0 0.0 0 0.0
3.0-<3.5 0 0.0 0 0.0 0 0.0 0 0.0 1 0.1 0 0.0
3.5-<4.0 0 0.0 0 0.0 0 0.0 0 0.0 1 0.1 0 0.0
4.0-<4.5 0 0.0 0 0.0 0 0.0 0 0.0 0 0.0 0 0.0
4.5-<5.0 0 0.0 0 0.0 0 0.0 0 0.0 0 0.0 0 0.0
5.0-<5.5 0 0.0 0 0.0 0 0.0 0 0.0 0 0.0 0 0.0
5.5-<6.0 0 0.0 0 0.0 0 0.0 0 0.0 0 0.0 0 0.0
6.0-<6.5 0 0.0 0 0.0 0 0.0 0 0.0 0 0.0 0 0.0
6.5-<7.0 0 0.0 0 0.0 0 0.0 0 0.0 0 0.0 0 0.0
7.0-<7.5 0 0.0 0 0.0 0 0.0 0 0.0 0 0.0 0 0.0
7.5-<8.0 0 0.0 0 0.0 0 0.0 0 0.0 0 0.0 0 0.0
8.0-<8.5 0 0.0 0 0.0 0 0.0 0 0.0 0 0.0 1 0.1
8.5-<9.0 0 0.0 0 0.0 0 0.0 0 0.0 0 0.0 1 0.1
9.0-<9.5 0 0.0 0 0.0 0 0.0 0 0.0 0 0.0 0 0.0
9.5-<10.0 0 0.0 0 0.0 0 0.0 0 0.0 0 0.0 0 0.0
Eyes with actual refractive power (SE) of more than +10.0D and -10.0D were excluded from analysis

180
0
5
10
15
20
25
30
35
40
45
-10
.0-<
(-9
.5)
-9.5
-<(-
9.0
)
-9.0
-<(-
8.5
)
-8.5
-<(-
8.0
)
-8.0
-<(-
7.5
)
-7.5
-<(-
7.0
)
-7.0
-<(-
6.5
)
-6.5
-<(-
5.0
)
-5.0
-<(-
4.5
)
-4.5
-<(-
4.0
)
-4.0
-<(-
3.5
)
-3.5
-<(-
3.0
)
-3.0
-<(-
2.5
)
-2.5
-<(-
2.0
)
-2.0
-<(-
1.5
)
-1.5
-<(-
1.0
)
-1.0
-<(-
0.5
)
-0.5
-<0
.0
0.0
-<0
.5
0.5
-<1
.0
1.0
-<1
.5
1.5
-<2
.0
2.0
-<2
.5
2.5
-<3
.0
3.0
-<3
.5
3.5
-<4
.0
4.0
-<4
.5
4.5
-<5
.0
5.0
-<5
.5
5.5
-<6
.0
6.0
-<6
.5
6.5
-<7
.0
7.0
-<7
.5
7.5
-<8
.0
8.0
-<8
.5
8.5
-<9
.0
9.0
-<9
.5
9.5
-<1
0.0
%
D
ECCE (2013)
ECCE (2014)
Phaco (2013)
Phaco (2014)
Figure 3.5.8-1:Distribution of Actual Refractive Power in ECCE and Phaco, CSR 2013-2014
Table 3.5.8-3:Difference in Target and Actual Refractive Power for Patients who had Phacoemulsification Only, CSR
2013-2014
Target Refraction Actual Refraction Difference between Target
and Actual Refraction
2013 2014 2013 2014 2013 2014
Power (D) n % n % n % n % n % n %
N 936 100 841 100 1270 100 1693 100 829 100 642 100
-5.0-<(-4.5) 0 0.0 0 0.0 0 0.0 0 0.0 0 0.0 0 0.0
-4.5-<(-4.0) 0 0.0 0 0.0 0 0.0 1 0.1 0 0.0 1 0.2
-4.0-<(-3.5) 0 0.0 0 0.0 1 0.1 0 0.0 0 0.0 0 0.0
-3.5-<(-3.0) 0 0.0 0 0.0 1 0.1 11 0.6 0 0.0 1 0.2
-3.0-<(-2.5) 0 0.0 0 0.0 4 0.3 28 1.7 1 0.1 1 0.2
-2.5-<(-2.0) 0 0.0 0 0.0 5 0.4 50 3.0 6 0.7 1 0.2
-2.0-<(-1.5) 1 0.1 0 0.0 19 1.5 101 6.0 9 1.1 5 0.8
-1.5-<(-1.0) 1 0.1 3 0.4 104 8.2 265 15.7 25 3.0 14 2.2
-1.0-<(-0.5) 39 4.2 50 5.9 339 26.7 653 38.6 145 17.5 103 16.0
-0.5-<0.0 885 94.6 784 93.2 522 41.1 809 47.8 301 36.3 256 39.9
0.0-<0.5 6 0.6 4 0.5 209 16.5 355 21.0 259 31.2 194 30.2
0.5-<1.0 0 0.0 0 0.0 46 3.6 87 5.1 56 6.8 50 7.8
1.0-<1.5 0 0.0 0 0.0 9 0.7 20 1.2 18 2.2 13 2.0
1.5-<2.0 0 0.0 0 0.0 4 0.3 5 0.3 4 0.5 0 0.0
2.0-<2.5 0 0.0 0 0.0 1 0.1 0 0.0 3 0.4 1 0.2
2.5-<3.0 0 0.0 0 0.0 0 0.0 1 0.1 0 0.0 0 0.0
3.0-<3.5 0 0.0 0 0.0 1 0.1 1 0.1 0 0.0 0 0.0
3.5-<4.0 0 0.0 0 0.0 1 0.1 0 0.0 0 0.0 0 0.0
4.0-<4.5 0 0.0 0 0.0 0 0.0 0 0.0 1 0.1 0 0.0
4.5-<5.0 0 0.0 0 0.0 0 0.0 0 0.0 0 0.0 0 0.0
5.0-<5.5 0 0.0 0 0.0 0 0.0 0 0.0 1 0.1 0 0.0
NOTE: Formula of

181
0.0
5.0
10.0
15.0
20.0
25.0
30.0
35.0
40.0
45.0
-5.0
-<(-
4.5
)
-4.5
-<(-
4.0
)
-4.0
-<(-
3.5
)
-3.5
-<(-
3.0
)
-3.0
-<(-
2.5
)
-2.5
-<(-
2.0
)
-2.0
-<(-
1.5
)
-1.5
-<(-
1.0
)
-1.0
-<(-
0.5
)
-0.5
-<0
.0
0.0
-<0
.5
0.5
-<1
.0
1.0
-<1
.5
1.5
-<2
.0
2.0
-<2
.5
2.5
-<3
.0
3.0
-<3
.5
3.5
-<4
.0
4.0
-<4
.5
4.5
-<5
.0
5.0
-<5
.5
%
D
2013
2014
Figure 3.5.8-2:Difference in Target and Actual Refractive Power for Patients who had Phacoemulsification Only, CSR
2013-2014
Table 3.5.8-4:Difference in Target and Actual Refractive Power within ±1.0D, CSR 2013-2014
Year
All By Phacoemulsification By ECCE
No. of patient
with refracted
VA
Difference between Target
and Actual Refraction within
±1.0D
No. of patient
with refracted
VA
Difference between Target and Actual Refraction within
±1.0D
No. of patient
with refracted
VA
Difference between Target
and Actual Refraction within
±1.0D
N n % N n % N n %
2013 870 792 91.0 829 761 91.8 19 15 78.9
2014 658 615 93.5 642 603 93.9 6 4 66.7
NOTE: Formula of Actual Refraction,
Result is based on available info of target and actual refraction.
Target/Planned refractive power = Section pre-clerking
Actual refractive power, SE = Section post-op visual acuity measurement (SE=SP+(CY/2))
Denominator = patient with refraction = if info available in refracted vision Section post-op visual acuity measurement

182
CHAPTER 4
RETINOBLASTOMA REGISTRY 2014
Contributing Editors
Jamalia Rahmat
Tassha Hilda Adnan
Nadiah Sa’at

183
CHAPTER 4: RETINOBLASTOMA REGISTRY Retinoblastoma is the most common intraocular childhood malignancy in children, with a reported incidence ranging from 1 in 15,000 to 1 in 18,000 live births. The retinoblastoma (RB) registry tracks all the patients diagnosed with Retinoblastoma since 2004 that were seen in 3 major RB treatment centers in the country; namely Hospital Kuala Lumpur (covering Peninsular Malaysia), Hospital Queen Elizabeth (Sabah) and Hospital Umum Kuching (Sarawak).
4.1 Stock and Flow
4.1.1 Stock and Flow
There are total of 170 patients registered, of which 17 patients were diagnosed in 2014.
Table 4.1.1-1: Stock and Flow
2004 2005 2006 2007 2008 2009 2010 2011 2012 2013 2014 Total
Hospital Kuala Lumpur 8 10 12 19 11 13 11 5 10 25 13 137
Hospital Queen Elizabeth, Kota Kinabalu
0 0 0 0 1 0 7 2 4 3 3 20
Hospital Umum Kuching, Sarawak 1 0 0 2 2 6 1 0 0 0 1 13
Total 9 10 12 21 14 19 19 7 14 28 17 170
4.2 Patient Demography
4.2.1 Age, Gender and Ethnics
The mean age at presentation was 2.2 years. The youngest age was 27 days and the oldest was 13 years. About a
third (31.8%) of these patients was in the age group of 13 to 24 months and 24.7% were less than 12 months at
presentation.
There were slightly more boys (55.9%) than girls affected, and the majority were of Malay ethnicity (57.7%), followed by Chinese (15.3%) and Indians (7.1%).
Table 4.2.1-1:Distribution of Patients by Age
Age, years n=170
Mean (SD)
Median (IQR)
Min, max
2.2 (1.8)
1.9 (1.7)
0.1, 13.0
Age group No. %
<12 months 42 24.7
13–24 months 54 31.8
25–36 months 39 22.9
37–48 months 21 12.4
49–60 months 5 2.9
>60 months 9 5.3
Total 170 100.0

184
Table 4.2.1-2:Distribution of Patients by Gender
Gender No. %
Male 95 55.9
Female 75 44.1
Table 4.2.1-3:Distribution of Patients by Ethnics
Ethnicity No. %
Malay 98 57.7
Chinese 26 15.3
Indian 12 7.1
Orang Asli 1 0.6
Melanau 1 0.6
Kadazan/ Murut/Bajau 8 4.7
Iban 3 1.8
Other 17 10.0
Missing 4 2.4
4.3 Ocular History and Presentation
4.3.1 Ocular History and Presentation
The most common presentation was leukocoria(81.8%) followed by strabismus. Table 4.3.1-1:Clinical Presentation
Presentation No. %
Leukocoria 139 81.8
Strabismus 26 15.3
Proptosis 13 7.6
Others 20 11.8
(Number or percentage may be more than total or 100% as patients might have more than one clinical presentation.)
The mean duration of disease from onset of symptoms to presentation was 4.4 months with the majority (80.2%) within 1 to 6 months. Table 4.3.1-2:Duration of Disease at the Time of Presentation
Months (n available=136)
Mean (SD) 4.4 (5.8)
Median (IQR) 2.0 (4.5)
Min, max 0, 36
No. %
<1 month 2 1.5
1–6 months 109 80.2
7–12 months 18 13.2
>12 months 7 5.2

185
Of the 170 patients, 110(64.7%) had unilateral disease whereas 60 patients (35.3%) had both eyes affected. A total of 230 eyes were affected. Only 2 patient had positive family history of retinoblastoma. Table 4.3.1-3:Eyes Affected
No. of patients % by no. of eyes
Right eye affected only 51 22.2
Left eye affected only 59 25.7
Both eyes affected 60 52.2
Total eyes 230 100.0
Family history No. %
Yes 2 1.2
No 151 88.8
Missing 17 10.0
0
20
40
60
80
100
120
<1 month 1–6 months 7–12 months >12 months
No.
Figure 4.3.1-1:Onset of Disease
4.4 Investigation and Classification
4.4.1 Investigation and Classification
The presence of calcified mass was detected in 68.7% of CT scan imaging. In patients who had MRI done, 10.0% showed presence of mass but only 8.3% had calcification. There was extraocular extension detected through imaging in 23 eyes, 10% and 2.6% through CT scan and MRI respectively. Majority of them were extension into the optic pathway.

186
Table 4.4.1-1:Type of imaging done at diagnosis, by no. of eyes (n=230)
No. of eyes
MRI scan
Yes No/NA/Missing
No. (%) No. (%)
CT scan Yes 20 (8.7) 160 (69.6)
No/NA/Missing 11 (4.8) 39 (17.0)
Table 4.4.1-2:Type of imaging done at diagnosis by patient (n=170)
No. of eyes
MRI scan
Yes No/NA/Missing
No. (%) No. (%)
CT scan Yes 14 (8.2) 120 (70.6)
No/NA/Missing 7 (4.1) 29 (17.1)
NA=Not available
Table 4.4.1-3:Presence of mass, by CT scan
Table 4.4.1-4:Presence of mass, by MRI scan
No. % No. %
Yes 158 68.7 Yes 23 10.0
No 22 9.6 No 8 3.5
No CT scan/ NA/ missing 50 21.7 No MRI scan/ NA/ missing 199 86.5
Table 4.4.1-5:Presence of calcification, by CT scan
Table 4.4.1-6:Presence of calcification, by MRI scan
No. % No. %
Yes 160 69.6 Yes 19 8.3
No 20 8.7 No 12 5.2
No CT scan/ NA/ missing 50 21.7 No MRI scan/ NA/ missing 199 86.5
Table 4.4.1-7:Presence of extraocular extension, by CT scan
Table 4.4.1-8:Presence of extraocular extension, by MRI scan
No. % No. %
Yes 23 10.0 Yes 6 2.6
No 157 68.3 No 25 10.9
No CT scan/ NA/ missing 50 21.7 No MRI scan/ NA/ missing 199 86.5
Table 4.4.1-9:Type of extraocular extension, by CT scan
Table 4.4.1-10:Type of extraocular extension, by MRI scan
No. %
(n=23)
No. %
(n=6)
Optic pathway 21 91.3 Optic pathway 4 66.7
Orbit and adnexa 8 34.8 Orbit and adnexa 1 16.7
Intracranial 7 30.4 Intracranial 0 0.0
Number or percentage may be more than total or 100% as patients might have more than one type of extraocular extension

187
More than half (54.8%) of the patients presented with Group E Retinoblastoma (based on International Intraocular Retinoblastoma Classification- IIRC) Table 4.4.1-11:Classification of Retinoblastoma
Right eye Left eye Total
No. % No. % No. %
Group A 6 5.4 4 3.4 10 4.3
Group B 6 5.4 10 8.4 16 7.0
Group C 8 7.2 6 5.0 14 6.1
Group D 19 17.1 12 10.1 31 13.5
Group E 53 47.8 73 61.3 126 54.8
Not available/Missing 19 17.1 14 11.8 33 14.3
Total eyes 111 100.0 119 100.0 230 100.0
0 20 40 60 80 100 120 140
Group E
Group D
Group C
Group B
Group A
No.
Figure 4.4.1-1:Disease Staging (IIRC)
4.5 Management and Outcome
4.5.1 Management and Outcome
60.6% of patients had systemic chemotherapy with a mean of 7 cycles (maximum 15 chemotherapy cycles). Of those with bilateral disease, 10 patients had ocular (7 subtenon and 3 intravitreal injection) chemotherapy together with the systemic chemotherapy. 82 out of 110 eyes (74.5%) with unilateral RB were enucleated with 41.8% of them showed histopathological extension outside the eyeball. Of the bilateral RB, 40.0% were enucleated. 9 patients had external beam radiotherapy.

188
Table 4.5.1-1:Table 3.5.1: Chemotherapy by patient
Unilateral (N=110)
Bilateral (N=60)
All (N=170)
No. % No. % No. %
Had chemotherapy 57 51.8 46 76.7 103 60.6 Did not have chemotherapy 33 30.0 6 10.0 39 22.9
No. % (n=57) No. % (n=46) No. %
(n=103)
Systemic chemotherapy 55 96.5 45 97.8 100 97.1 Subtenon injection 0 0.0 7 15.2 7 6.8 Intraviteal injection* 0 0.0 3 6.5 3 2.9
Mean cycles given 6.5 7.6 6.9
Median cycles given 6 6 6
Minimum cycle 2 4 2
Maximum cycle 13 15 15
*All patients in the subgroup had systemic chemotherapy as well.
Table 4.5.1-2:Table 3.5.2: Treatment method by no. of eyes
Unilateral Bilateral
Right
(n=51)
Left
(n=59)
All
(n=110)
Right
(n=60)
Left
(n=60)
All
(n=120)
No. % No. % No. % No. % No. % No. %
Enucleation 39 76.5 43 72.9 82 74.5 22 36.7 26 43.3 48 40.0 HPE result: Intraocular (no extraocular extension)
16 31.4 13 22.0 29 26.4 5 8.3 0 0.0 5 4.2
With extraocular extension
19 37.3 27 45.8 46 41.8 13 21.7 1 1.7 14 11.7
Missing 4 7.8 3 5.1 7 6.4 4 6.7 25 41.7 29 24.2 Focal therapy 2 3.9 8 13.6 10 9.1 27 45.0 20 33.3 47 39.2
Laser only 1 2.0 4 6.8 5 4.5 11 18.3 12 20.0 23 19.2 Cryotherapy only 0 0.0 0 0.0 0 0.0 1 1.7 1 1.7 2 1.7 Laser & cryotherapy 1 2.0 4 6.8 5 4.5 15 25.0 7 11.7 22 18.3
Radiotherapy 1* 2.0 2 3.4 3 2.7 6 10.0 0 0.0 6 5.0
External beam radiation (EBRT)
0 0.0 2 3.4 2 1.8 6 10.0 0 0.0 6 5.0
Plaque radiotherapy 0 0.0 0 0.0 0 0.0 0 0.0 0 0.0 0 0.0 Intensity modulated radiotherapy (IMRT)
0 0.0 0 0.0 0 0.0 0 0.0 0 0.0 0 0.0
*Missing 1 case on subgroup of radiotherapy.
Table 4.5.1-3:Table 3.5.3: Treatment method for all patients with chemotherapy
Unilateral Bilateral
Right eye
Left eye All
(n=57) Both eyes
Either one eye
All (n=46)
n n No. % n n No. %
Enucleation 24 26 50 87.7 4 35 39 84.8 Laser therapy 2 7 9 15.8 4 33 37 80.4

189
Table 4.5.1-4:Table 3.5.4: Outcome and complications, by no. of eyes
Unilateral Bilateral
Right (n=51)
Left (n=59)
All (n=110)
Right (n=60)
Left (n=60)
All (n=120)
No. % No. % No. % No. % No. % No. %
Remission Complete 16 31.4 20 33.9 36 32.7 6 10.0 8 13.3 14 11.7 Partial regression 0 0.0 3 5.1 3 2.7 15 25.0 11 18.3 26 21.7 No regression 0 0.0 2 3.4 2 1.8 0 0.0 1 1.7 1 0.8 NA/Missing 35 68.6 34 57.6 69 62.7 39 65.0 40 66.7 79 65.8
Recurrence 0 0.0 4 6.8 4 3.6 9 15.0 7 11.7 16 13.3 Duration from first time treatment (in months)
n 0 4 4 8 7 15
Mean (SD) - 12.0 (7.4) 12.0 (7.4) 18.9 (8.0) 12.7 (12.4) 16.0 (10.4)
Median (IQR) - 11.0 (12.0) 11.0 (12.0) 22.0 (11.0) 7.0 (19.0) 17.0 (19.0)
Min, max - 5, 21 5, 21 5, 28 4, 36 4, 36
Complication 3 5.9 6* 10.2 9 8.2 10 16.7 3 5.0 13 10.8
Socket /prosthesis related
2 3.9 3 5.1 5 4.5 4 6.7 1 1.7 5 4.2
Disease related 1 2.0 2 3.4 3 2.7 6 10.0 2 3.3 8 6.7
*Missing 1 case on subgroup of complication.
Table 4.5.1-5:Table 3.5.5: Outcome by patient
Unilateral (n=110)
Bilateral (n=60)
All (n=170)
No. % No. % No. %
Lost to follow-up 12 10.9 5 8.3 17 10.0 Status by 1 year:
Alive 53 48.2 30 50.0 83 48.8 Death 6 5.4 1 1.7 7 4.1 Unknown/Missing 51 46.4 29 48.3 80 47.1
4 eyes of the unilateral RB and 16 eyes in bilateral RB had recurrences. The earliest recurrence was noted at 5 months from diagnosis and the latest was at 36 months. 17 patients defaulted treatment and were lost to follow-up. Death was reported in 7 patients. Comment Since 2004, there were 170 patients registered in the RB registry with 230 affected eyes. In 2014, 13 new patients were registered. Data from the RB registry showed that there is no change in the spectrum of presenting symptoms which were similar to those reported elsewhere. Leukocoria was the most common presentation followed by strabismus. Late presentation was still a problem. Majority of patients presented with advanced stage Group E which necessitate enucleation. 74.5 % of unilateral RB were enucleated. In bilateral RB, 40% of the patients had at least 1 eye enucleated. About 10% of eyes showed extraocular extension on CT scan imaging, involving mainly the optic pathway. HPE of the enucleated eyes showed 45.8% of unilaterally affected eye, and 11.7% of the bilaterally affected, had histopathological evidence of extraocular extension. Chemoreduction is the mainstay of treatment especially in bilateral RB. Apart from systemic chemotherapy, periocular and intraocular chemotherapy are also used as treatment especially in bilateral RB. 9 patients needed external beam radiation due to the advanced stage of the disease. 13.3% of bilateral RB and 3.6% of unilateral RB reported recurrence of the disease with the mean duration of 16months after the initial treatment. About 10% of patients were lost to follow up, whereas death was reported in 7 patients. As with other cancers, early detection of retinoblastoma and appropriate treatment can improve outcome.