Embed Size (px)
Citation preview
American Journal of Industrial Medicine 6:427-440 (1984)
The Accuracy of Self-Reported Regulatory Data: The Case of Coal Mine Dust
Leslie I. Boden, PhD, and Morris Gold, AB
~~
Coal-mine owiiers are required to measure miner exposures to respirable dust so that compliance with Federal health regulations can be monitored. This study analyzes the problem of possible underreporting of dust exposures. Using two statistical approaches. data for three mining occupations in 54 large underground coal mines during 1976-1978 are examined for evidence of underreporting. First, regression estimates compare dust concentrations reported by coalmine owners with those reported by governnient health inspectors. Then, the statistical distribution of concentrations reported by coal-mine owncrs are examined for the size and nature of their deviation from log-normality. Both approaches suggest widespread underreporting.
Key words: occupational health regulation, coal-mine regulation, coal-dust exposure, accuracy of exposure data, regulation, coal-rnine health, Mine Safety and Health Adrniiiistratioii
INTRODUCTION
In order to perform their regulatory functions, agencies must collect information to guidc them in issuing permits, setting standards, and enforcing existing regulations. Data may be gathered by the staff of the regulatory agency, from independent researchers, from regulated firms, or from individuals or firms affected by the regulated activity (eg, complaints about alleged air pollution or initiation of lcgal action by injured consumers). Scvcral conditions may lead regulators to gather information primarily from regulated parties:
(1) The agencies rarely have resources to collect sufficient data themselves. (2) The regulaled firms often have the most complete knowledge about their
own operations, and can assemble information at a rclatively low cost. (3) Legal rights of firms to privacy and the wish to protect trade secrets often
mean that it is difficult for a third party to gather needed information. Because of these factors, regulators wishing to maximize the net social benefit
of their programs may use the less costly information generated by regulated firms. Relevant, unbiased, and accurate information can be of great value to regulators.
However, incentives to provide such information are often weak or perverse. Firms
Occupational Hcalth Program (L.B.) and Department of Biostatistics (M.G.). Harvard School (11 Public Health. Address reprint requests to Leslie I . Boden, PhD. Occupational Hcalth Program. Harvard School of Public Health. 665 Huntington Avcnue. Boston, MA 02115. Accepted for publication July 18. 1984.
GI 1Y84 Alan R. Liss, Inc.
428 Boden and Gold
may attempt to reduce the costs of regulation by providing biased information to the regulator; or they may simply provide inaccurate data because they do not wish to expend the resources necessary to collect better data.
This paper examines the accuracy of self-reported regulatory data in one setting, the coal-mine dust control program of the Mine Safety and Health Administration (MSHA). In this context, we describe the problem, present a model of biased reporting, and examine reported dust exposures for evidence on their accuracy.
BACKGROUND
Since the passage of the 1969 Coal Mine Health and Safety Act, the Federal Government has been regulating the exposure of miners to coal dust. Since December 30, 1972, the exposure limit for respirable dust has been 2.0 mg/m3. Coal-mine operators are required to collect samples at stated frequencies, and to send the samples to MSHA.
If the average of ten consecutive dust measurements is 2.1 mg/m3 or greater, then MSHA issues a citation (“notice”), assesses a civil penalty, and requires a reduction in the dust level. As soon as the notice is received, the operator must begin dust sampling on the section in violation until the mean exposure falls below the statutory limit. If the section does not come into compliance, or regularly has excessive dust levels, MSHA may stop production on that section until satisfied that the pattern of excessive dust exposures has ceased. MSHA typically issues 50 to 100 such closure orders annually. This self-monitoring system is the basis of much of the MSHA dust control program. It also provides data which can be used to evaluate the success of this program [Parobeck and Jankowski, 19791.
Some observers of the MSHA dust program have raised questions both about the accuracy of sampling methods used and about the good faith of operators and miners in carrying out this sampling [Courtney, 1974; Sharp, 19781. There have been three major court cases in which employees of large coal companies were accused of willfully providing MSHA with incorrect (low) sampling data.
THEORY
Economic theory suggests that the mine operator contemplating a dust-reporting method looks for one that maximizes net benefts [Allingham and Sandmo, 1972; Kwerel, 19771. This includes a strategy for how to measure and report dust levels and the level of underreporting to achieve. Underreporting reduces the costs imposed by MSHA following discovery of dust levels in excess of 2.0 mg/rn3. These include penalties for violations, the costs of repeated measurements until dust levels fall, the costs of additional dust control measures, and possible section closures for repeated violations. These costs fall as underreporting increases. If MSHA discovers that reported dust levels are being falsified, the mine operator can be assessed high penalties. In addition, MSHA, knowing that violation levels are higher than reported, will demand increased expenditures on dust control. Of course, there are nonecon- omic reasons for both accurate and inaccurate reporting, eg, respect or disrespect for MSHA regulations. However, economic motivation is still expected to have a major role in determining operator behavior.
The Accuracy of Coal Dust Exposure Data 429
Because there is no MSHA program to detect underreporting, the probability of detection and therefore the cost of underreporting generally are very low. Only when there is a great deal of underreporting will the probability of detection rise. This implies that underreporting will occur to the level at which either its marginal impact on MSHA enforcement costs is low, or until the underreporting is so flagrant that the probability of its being detected becomes substantial. Reported exposures will be biased measures of the true concentration of dust in the coal-mine environment. If regulators accept the reported concentrations at face value, they may choose policies that appear to maximize the net benefts of regulation without actually doing SO.
The focus of the rest of this paper is the use of statistical methods to determine whether coal-dust sampling data appear to be underreported. We begin by discussing several methods for determining whether coal-dust sampling is questionable and then apply those methods to the data at hand.
The data come from a randomly selected sample of 54 mines, chosen from 535 large underground coal mines in the United States. For each of these 54 mines, records of all coal-dust measurements for the years 1976 through 1978 were assem- bled. In addition to information necessary to calculate dust concentrations, we know the occupation of the miners sampled, the number of tons of coal produced in the sampled section during the sampling shift, the mining method used, and the number of producing sections in the mine. We also know whether the sample was submitted by an operator or taken by an inspector as part of periodical MSHA health inspections.
From the research data set, all records for the occupations “continuous miner- operator, ’’ “cutter-operator, ’’ and “roof-bolter” were drawn. These specific occupa- tions were studied separately because they are known to be highly exposed occupa- tions. The continuous miner-operator sample has 21,197 observations, of which 260 or 1.2% were inspector samples. The cutter-operator sample had 6,478 samples, of which 106 or 1.8% were inspector samples. Similarly, there were 5,158 roof-bolter samples, of which 381 (7.4%) were inspector samples.
Concentrations are not observed directly, but are calculated from the mass of dust collected on a filter, the flow rate of the air passing over the filter? and the sample collection time. Because the flow rate and collection time are standardized, and since the weight of the dust is rounded to the nearest 0.1 mg, calculated concentrations are not continuous, but occur in increments of 0.14 mg/m3. These data are used in the analysis which follows.
METHODS FOR DETECTING INVALID SAMPLING
In this section, we discuss two methods that are used to detect inaccurate samples. The first method uses regression analysis to compare coal-dust concentra- tions in samples taken by coal-mine operators with samples taken by MSHA inspec- tors. The second method uses the shape of the distribution of coal-dust samples for specific occupations as a standard for detecting biased sampling.
Regression Estimates of Concentrations Reported by Operators and Inspectors
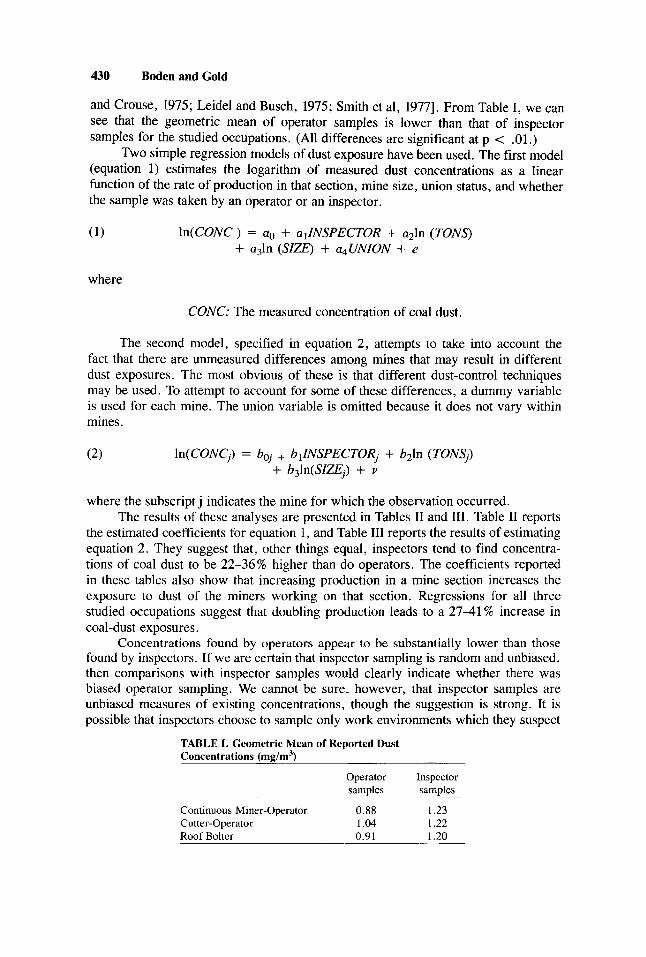
The question addressed in this section is whether, in comparable circumstances, the distributions of operator and inspector samples have the same geometric mean. One expects dust concentrations in a coal mine to be distributed log-normally [Leidel
430 Boden and Gold
and Crouse, 1975; Leidel and Busch, 1975; Smith et al, 19771. From Table I, we can see that the geometric mean of operator samples is lower than that of inspector samples for the studied occupations. (All differences are significant at p < .01.)
Two simple regression models of dust exposure have been used. The first model (equation 1) estimates the logarithm of measured dust concentrations as a linear function of the rate of production in that section, mine size, union status, and whether the sample was taken by an operator or an inspector.
(1) ln(C0NC) = a0 + alINSPECTOR + a21n (TONS) + a31n (SIZE) + qUNION + e
where
CONC: The measured concentration of coal dust.
The second model, specified in equation 2 , attempts to take into account the fact that there are unmeasured differences among mines that may result in different dust exposures. The most obvious of these is that different dust-control techniques may be used. To attempt to account for some of these differences, a dummy variable is used for each mine. The union variable is omitted because it does not vary within mines.
(2) ln(CONCj) = boj + blINSPECTORj + b21n (TONSj) + b31n(SIZEj) + v
where the subscript j indicates the mine for which the observation occurred. The results of these analyses are presented in Tables I1 and 111. Table I1 reports
the estimated coefficients for equation 1, and Table III reports the results of estimating equation 2. They suggest that, other things equal, inspectors tcnd to find concentra- tions of coal dust to be 22-36% higher than do operators. The coefficients reported in these tables also show that increasing production in a mine section increases the exposure to dust of the miners working on that section. Regressions for all three studied occupations suggest that doubling production leads to a 2 7 4 1 % increase in coal-dust exposures.
Concentrations found by operators appear to be substantially lower than those found by inspcctors. If we are certain that inspector sampling is random and unbiased, then comparisons with inspector samples would clearly indicate whether there was biased operator sampling. We cannot be sure, however, that inspector samples are unbiased measures of existing concentrations, though the suggestion is strong. It is possible that inspectors choose to sample only work environments which they suspect
TABLE I. Geometric Mean of Reported Dust Concentrations (mg/m3)
Operator Inspector ~~ samples samples
Continuous Miner-Operator 0.88 I .23
Roof Bolter 0.91 1.20 Cutter-Operator 1 0 4 1.22
The Accuracy of Coal Dust Exposure Data 431
TABLE 11. Reported Dust Concentrations for Three High- Exposure Occupations --
Continuous Cutter- Roof miner-operator operator bolter
Intercept -2.06' -1.641b -1.62' (.081) (.185) (. 150)
Inspector sample 0.29Xb 0.200" 0. 306b (.066) (.OYY) (.055)
Log (toris per shift) 0.307h 0.271b 0.239b
Log I size) 0.014' -0. 122' 0. 15Ib
Union dummy 0.277b ,275' - .054b
(.013) ( .030) (.022)
(.013) (0.21) (.025)
(.044) (.039) (. 062)
"Significant at p < .0S. bSignificant at p < . O I .
TABLE 111. Heported Dust Concentrations for Three High- Exposure Occupations (Estimated With Mine Dummies)
Continuous Cutter- Roof miner-operator operator bolter
Inspcctor sample 0.368" 0.31 I " 0.255" (.064) ( .096) (.054)
Log (tons per shift) 0.320a 0.406" 0.297"
Log (size) -0.020 0.042 0. I07 (.027) (.053) (.059)
~ _ _ ~
(.020) (.055) (.044)
"Significant at p < .01.
are more hazardous, in which case the mean of their samples will overestimate the exposure of coal miners. MSHA officials have informed us that inspectors are instructed to sample in representative locations, not in unusually dusty ones. This supports the interpretation of the mean difference between inspector and operator samples as a good measure of the validity of operator samples.
One methodological difficulty with the analysis in this section is that while we expect the distribution of dust exposures to be log-normal, the observed distribution is not log-normal, appearing bimodal in most mines. This will invalidate whatever tests of significance we make using the regression results. An improved analysis would use the shape of the observed distribution in making inferences. This leads to the second method of comparison.
Examining the Statistical Distribution of Operator Samples
The second approach examines the actual distributions of reported exposure and compares them with the log-normal family of distributions. Let us assume that there are no important changes in dust control or relevant physical conditions in a mine over a period of observation. Then we would expect repeated measurements of dust exposure for a given occupation in that mine to exhibit a log-normal distribution [Leidel and Crouse, 1975; Leidel and Busch, 1975; Smith et al, 19771. If exposure conditions changcd over time, then the mean and variance of the distribution would be modeled as a function of these conditions.
432 Boden and Gold
If conditions have changed little over the 3 yr of this study, we can test the null hypothesis that reporting is accurate by testing for log-normality the distribution of exposures for specific occupations within mines. If a log-normal distribution fits reported dust measurements very poorly, then the hypothesis of accurate reporting is not supported. Moreover, we specify an alternative against which to test the null hypothesis of log-normality, that the frequency of unusually low samples for an occupation within a mine is larger than the frequency that would have been reported were accurate samples taken. This hypothesis was suggested by direct examination of reported distributions, as well as by a paper by Sharp [Sharp, 19781. Sharp noted that samples taken at the surface or in intake air shafts generally show levels of respirable dust between 0.1 and 0.3 mg/m3. He noted that exposures “as low as that of fresh, outside air (0.1-0.2 mg/m3)” are very unlikely for miners who work underground, especially in the highest-exposure jobs [Sharp, 1978, p 171.
One alternative hypothesis to that of accurate reporting is: A proportion of operator samples is taken in a clean area of the mine, or for a very short period of time. These samples replace those from the log-normal distribution of “true” reported dust levels. The samples to be replaced are chosen independent of the dust levels that would have been reported.
We test the null hypothesis by fitting two distributions to the reported data: a log-normal distribution with parameters (piju$ and a distribution of samples reported to be 0.1 or 0.2 mg/m3.
(3) In (x) - N(pij ,utj) with probability cq
and x E [0,.3] with probability 1 - crv
where aij is the proportion of the reported concentrations for mine i and occupation j in the log-normal distribution. The null hypothesis is aij = 1, i.e., that the distribution of operator samples is described as well by a log-normal distribution as it is by the sum of two distributions.
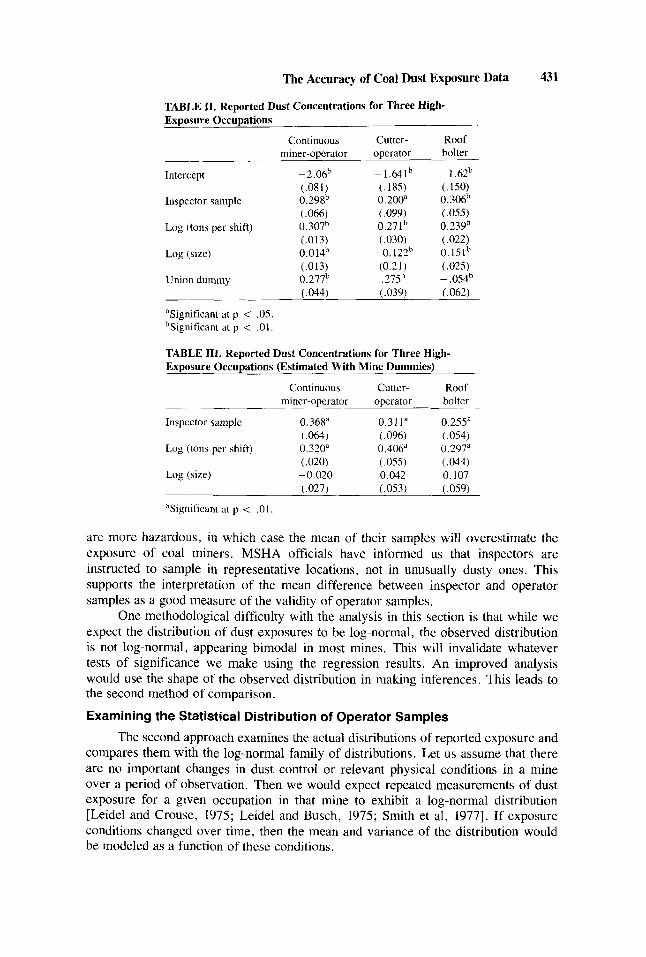
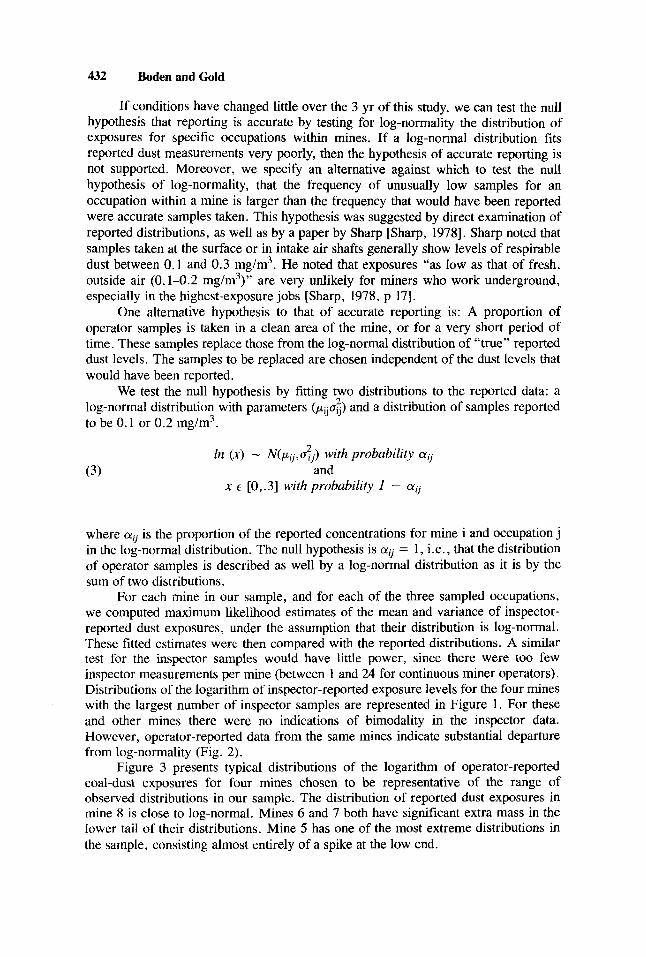
For each mine in our sample, and for each of the three sampled occupations, we computed maximum likelihood estimates of the mean and variance of inspector- reported dust exposures, under the assumption that their distribution is log-normal. These fitted estimates werc then compared with the reported distributions. A similar test for the inspector samples would have little power, since there were too few inspector measurements per mine (between 1 and 24 for continuous miner operators). Distributions of the logarithm of inspector-reported exposure levels for the four mines with the largest number of inspector samples are represented in Figure 1. For these and other mines there were no indications of bimodality in the inspector data. However, operator-reported data from the same mines indicate substantial departure from log-normality (Fig. 2).
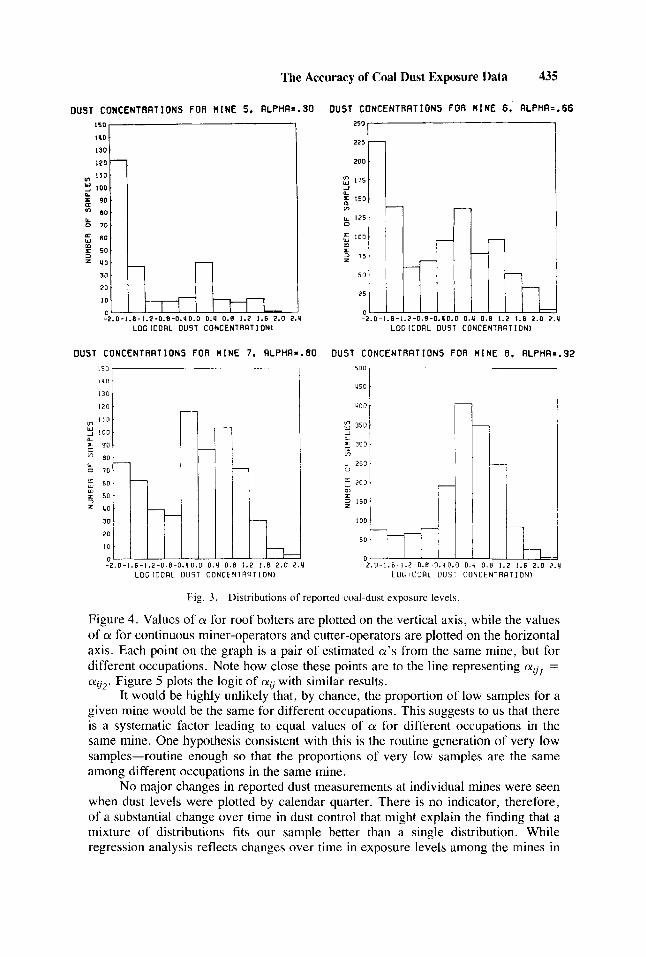
Figure 3 presents typical distributions of the logarithm of operator-reported coal-dust exposures for four mines chosen to be representative of the range of observed distributions in our sample. The distribution of reported dust exposures in mine 8 is close to log-normal. Mines 6 and 7 both have significant extra mass in the lower tail of their distributions. Mine 5 has one of the most extreme distributions in the sample, consisting almost entirely of a spike at the low end.
The Accuracy of Coal Dust Exposure Data 433
INSPECTOR SRHPLES FOR NINE 1
!I-------' 8 i
INSPECTOR SRMPLES FOR MINE 2 10
7 1
-2.0-1.6-1.2-0.8-o.uo.0 0.4 0.e 1.2 1.6 2.0 2 . 9 LOG i C O R L UUST CONCENTRRTIONI
INSPECTOR SRMPLES FOR MINE 3
71
It; ~
- 2 . 0 - 1 . 6 - 1 . Z - 0 . 8 - O . V Q . 0 0 . Y 0.8 1.2 1.6 2.0 2.q LOG l C O R L 'JUST C O N r E N l R R T I O N l
-2.0-1.~-1.2-0.~-0.u0.~ 0.9 0.e 1.2 1.6 2.0 2.v L O G ( C O A L DUST C O N C E N T R A T I O N 1
INSPECTOR SRMPLES FOR MINE 4
1
i I / I I /
01 . .A -2 .D-1 .6-1 .2-0 .8-O.UO.0 0.U 0 . 0 1.2 !.6 Z.0 2.Y
L O G I C O R L OUST C O N C E N T R R T I O N I
Fig. 1. Distributionb of inspector coal-dust samples.
The goodness-of-fit of the log-normal model to the discrete data was evaluated by producing hn expected number of observations over 20 intervals spanning the entire range of observable concentrations, based on the sample size and the fitted log- normal distribution (Fig. 4). The continuous estimated distribution was discretized by evaluating the probability of being in the 20 intervals. A chi-squared test with 19 degrees of freedom was applied to the observed and expected quantities. The values of the chi-squared goodness-of-fit statistic for mines 5-8 are 176.5, 296.0, 154.4, and 463.5. These are consistent with the values for the other mines in the study.'
When these same samples of coal-dust concentrations were used to produce maximum likelihood estimates of pil, a,, and aij in equation 3 above, most fitted
'The size of the chi-squared statistic does not indicate the relative size of the mass at the low end of the distribution. A distribution with 100% of its mass at the low end may have a lower chi-squared statistic than another distribution with 50% of its mass at the low end. Note also that mines 4 and 8 are the same.
434 Boden and Gold
DUST CONCENTRATIONS FOR MINE 1, RLPHR=.8U
U50
n
OUST CONCENTRRTIONS FOR MINE 3, RLPHR=.71
160
-2.0- la i -1 .2 -0 .8 -0.4 0 1
D . Y 0 . 0 1 L 1.6 2.0 2
LOG l C O R L DUST C O N C E N T R R T I D N I
DUST CONCENTRRTIONS FOR MINE 2. ALPm=.83
300 - w" 210
0
m f
60
30
-2.0-1.6-1.2-0.8-0.YO. LOG f C O R L D U S T
0.U 0.8 1.2 1.6 2.0 2.q C O N C E N T R R T I O N )
DUST CONCENTRRTIONS FOR H I N E U. RLPHR=.92
-2.0-1.6-1.2-0.8-0.90.0 0.9 0.8 1.2 1.6 2.0 2 L O C l C O R L D U S T C O N C E N T R R T I O N )
Fig. 2. Distributions of reported coal-dust exposure levels.
distributions had estimates of aii in the range 0.70-0.85. The null hypothesis that the observed dust levels are not drawn from the mixture of distributions described in equation 3 cannot be rejected. However, a chi-squared goodness-of-fit test analogous to the one above produced significantly improved results, indicating that the new model fits the data better than the old one. Improvements in the chi-squared statistic for mines 5-8 are 147.6, 226.2, 96.2, and 403.5, distributed with 1 degree of freedom. Maximum likelihood estimates were also computed replacing the log-normal distribution in equation 2 with a gamma distribution, to see if the results were sensitive to the choice of the log-normal distribution. They were essentially unchanged.
On examination, the values of aij for different occupations within the same mine were found to be almost equal, ie,
where the mean and standard error of E are both small relative to the mean of aUl. While we propose no formal test of equation 4, we have plotted the values of a on
The Accuracy of Coal Dust Exposure Data 435
OUST CONCENTRRTIONS FOR MINE 5, RLPHRe.30 OUST CONCENTRATIONS FOR MINE 6. ALPHR=.66
120
250 I
-2.0-1.6-1.2-0.8-0.UO.D 0.9 0 .0 1.2 1.6 2.0 2.U -2.0-1.6- L O G l C O R L DUST CONCENTRRTlONl L(
n
i F-0.0-0.UD.D l C O R L OUST 0.9 0 . B 1.2 1.6 2.0 2 CONCENTRATION1
u
DUST CONCENTRRTIONS FOR MINE 7. RLPHA=.80 OUST CONCENTRATIONS FOR MINE 8 . RLPHR=.gP
L O G l C O R L D U S T C O N C E N T R A T I O N )
200
'oDk 50
-2.0-1.~-1.z-0.~-u.v0.0 0 . 4 o L O G l C O R L D U 5 T C O N C E N T R R T I D N )
Fig. 3 . Distributions of reported coal-dust exposurc levels
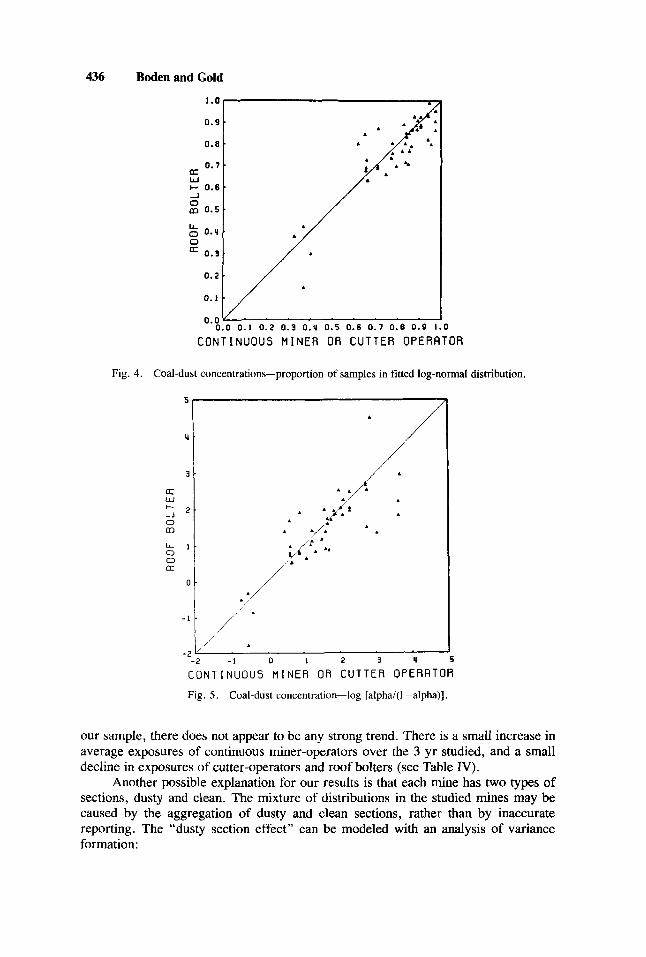
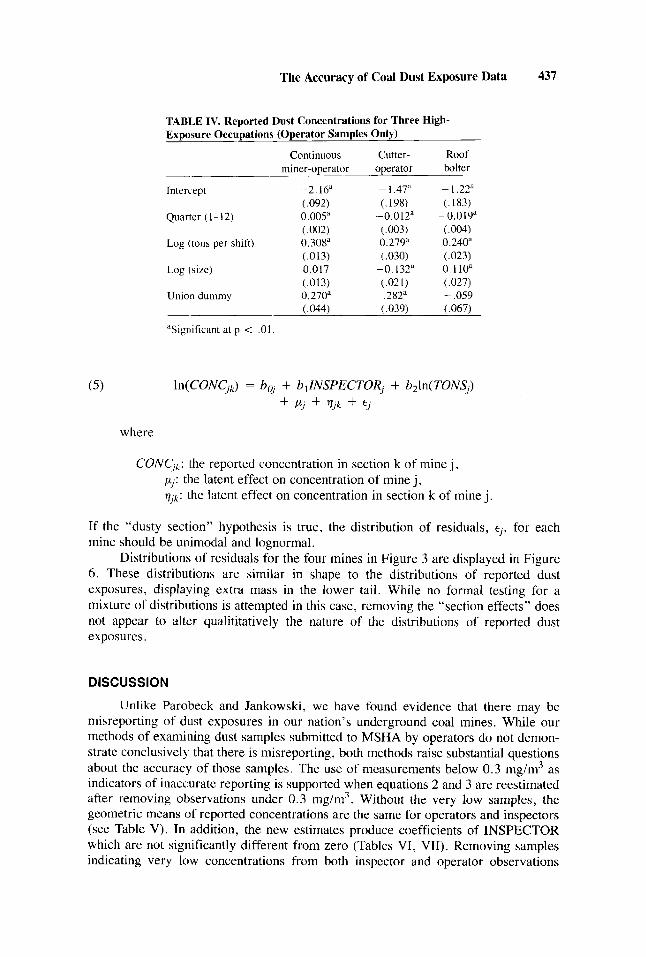
Figure 4. Values of a for roof bolters are plotted on the vertical axis, while the values of a for continuous miner-operators and cutter-operators are plotted on the horizontal axis. Each point on the graph is a pair of estimated a's from the same mine, but for different occupations. Note how close these points are to the line representing oru, = aU2. Figure 5 plots the logit of aij with similar results.
It would be highly unlikely that, by chance, the proportion of low samples for a given mine would be the same for different occupations. This suggests to us that there is a systematic factor leading to equal values of or for different occupations in the same mine. One hypothesis consistent with this is the routine generation of very low samples-routine enough so that the proportions of very low samples are the same among different occupations in the same mine.
No major changes in reported dust measurements at individual mines were seen when dust levels were plotted by calendar quarter. There is no indicator, therefore, of a substantial change over time in dust control that might explain the finding that a mixture of distributions fits our sample better than a single distribution. While regression analysis reflects changes over time in exposure levels among the mines in
436 Boden and Gold
0 . O V . ’ . ’ . . . . 0 . 0 0.1 0.2 0 . 3 0.4 0.5 0.6 0.7 0 . 8 0.9 1.0
CONTINUOUS M I N E R O R CUTTER OPERFlTOR
Fig. 4. Coal-dust concentrations-proportion of samples in fitted log-normal distribution.
5
u
3
e w + - 2 -J 0 m
k 1 0 0 a
0
- 1
- 2
A/’
i
- 1 0 I 1 3 u 5
CONTINUOUS M I N E R O R CUTTER OPERATOR
Fig. 5. Coal-dust concentration-log [alpha/(l -alpha)].
our sample, there does not appear to be any strong trend. There is a small increase in average exposures of continuous miner-operators over the 3 yr studied, and a small decline in exposures of cutter-operators and roof bolters (see Table N).
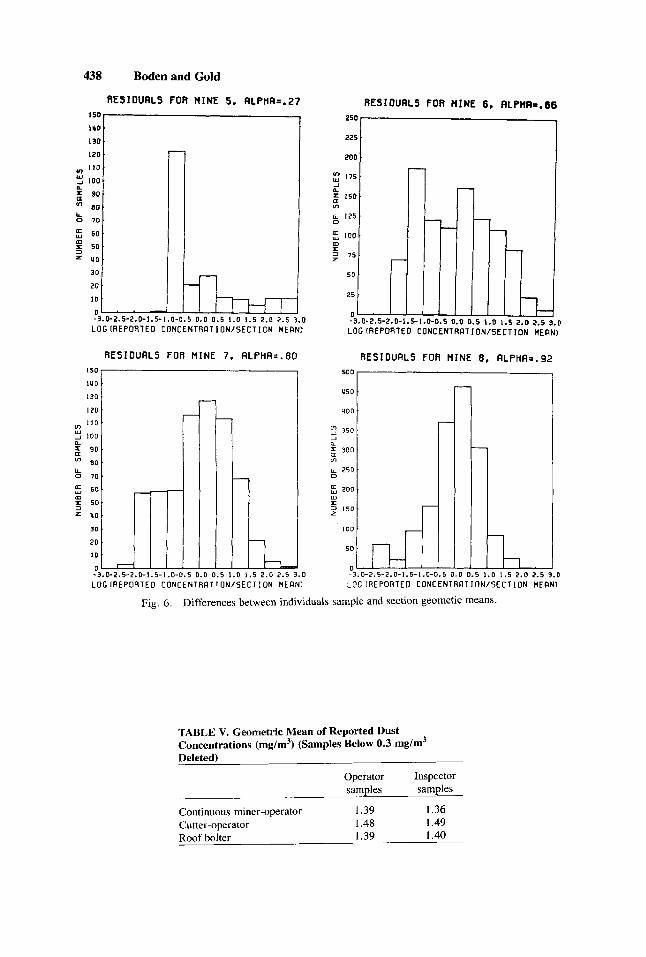
Another possible explanation for our results is that each mine has two types of sections, dusty and clean. The mixture of distributions in the studied mines may be caused by the aggregation of dusty and clean sections, rather than by inaccurate reporting. The “dusty section effect” can be modeled with an analysis of variance formation:
The Accuracy of Coal Dust Exposure Data 437
TABLE IV. Reported Dust Concentrations for Three High- Exposure Occupations (Operator Samples Only)
Continuous Cutter- Roof miner-operator operator bolter
Intercept -2.16" - 1.47" - I .22"
(.002) (.003) (.OW)
(.092) (.I%) {. 183) Quarter (1-12) 0.005" -0.012' -0.019a
Log 1 tons per shift) 0,308" 0.279" 0,240" (.013) (.030) (.023)
Log (size) 0.017 -0.132" 0.110" (.013) (.02 1) (.027)
Union dummy 0.270" .282" - ,059 ( ,044) (.039) (.067)
aSignificant at p < .01,
where
coNcJk: the reported concentration in section k of mine j , pJ: the latent effect on concentration of mine j , q J k : {he latent effect on concentration in section k of mine j .
If the "dusty section" hypothesis is true, the distribution of residuals, er, for each mine should be unimodal and lognormal.
Distributions of residuals for the four mines in Figure 3 are displayed in Figure 6 . These distributions are similar in shape to the distributions of reported dust exposures, displaying extra mass in the lower tail. While no formal testing for a mixture of distributions is attempted in this case, removing the "section effects" does not appear to alter qualititatively the nature of the distributions of reported dust exposures.
DISCUSSION
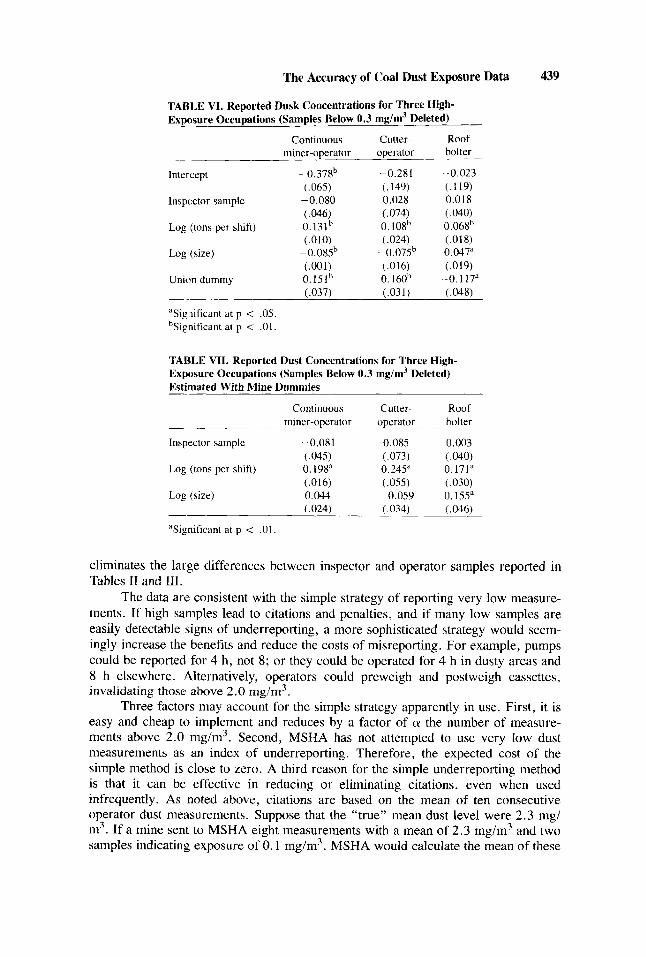
Unlike Parobeck and Jankowski, we have found evidence that there may be misreporting of dust exposures in our nation's underground coal mines. While our methods of examining dust samples submitted to MSHA by operators do not demon- strate conclusively that there is misreporting, both methods raise substantial questions about the accuracy of those samples. The use of measurements below 0 . 3 mg/m3 as indicators of inaccurate reporting is supported when equations 2 and 3 are reestimated after removing observations under 0.3 n1g/m3. Without the very low samples, the geometric means of reported concentrations are the same for operators and inspectors (see Table V). In addition, the new estimates produce coefficients of INSPECTOR which are not significantly different from zero (Tables VI, VII). Removing samples indicating very low concentrations from both inspector and operator observations
438 Boden and Gold
lii= 1.0 1.5 2.D 2.5 $.@
I U D
130
120
v) I10
2 90
B 7 0 .
w L -1 1 0 0 .
80
fi 60. m s 50 1 = uo
30
'
'
'
'
LOGIREPORTED C O N C E N T R A T I O N I S E C T I O N MEDN)
RESIDUALS FOR M I N E 7. ALPHA=.80
I U D '
I30
120 '
vI 1 1 0 ' W 1 1 0 0 '
U 0 7 0 '
6 0 . m
= uo 30
20
I0 '
-3.0-2.5-2.0-1.5-1.0-0.5 0.0 0 - II, i 1.0 1.5 2.0 2.5
LOGIREPORTEO CONCENTRATTON/SECTION MERNl
RESIDURLS FOR HlNE 6. RLPHR1.86
250 I
I - 175
-3.0-2.5-2.0-1.5-1.0-0.5 0.0 LOG(REP0RTED CONCENTRRTION/SECTION MERNI
RESIDUALS FOR MINE 8, ALPHR=.92
200
?n4f 50
-3.0-2.5-2.0-1.5-1 .O- , o LOG lREPORTED C O N C E N T R ~ T I O N / S E C T I O N MEAN)
Fig. 6 . Differences between individuals sample and section geometic means.
TABLE V. Genmetric Mean of Reported Dust Concentrations (mg/m3) (Samples Below 0.3 mg/m3 Deleted)
Operator Inspector samples samples
Continuous miner-operator I .39 1.36 Cutter-operator 1.48 1.49 Roof bolter 1.39 I .40
The Accuracy of Coal Dust Exposure Data 439
TABLE VI. Reported Dusk Concentrations fur Three High- Exposure Occupations (Samples Below 0.3 mg/m3 Deleted)
Continuous Cutter- Roof miner-operator operator bolter -
-~
Intercept - 0.37Sb -0.281 --0.023
Inspector sample -0.080 0.028 0.018
(.010) ( .024) (.018)
(.065) (. 149) (.119)
(.046b ( ,074) (.040) Log (tons per shift) 0.131 0. 10Sb 0.06gh
Log (size) -O.OKjb --0.07Sb 0.047“ (.001) (.016) (.019)
Union dummy 0.1SIh 0.160b -0.117a -~ (.037) (.031) (.OW
“Significant at p < .05. hSignificant at p < .OI .
TABLE VII. Reported Dust concentrations for Three High- Exposure Occupations (Samples Below 0.3 mg/m3 Deleted) Estimated With Mine Dummies
Continuous rniner-operator
Inspector sample -0.081 ( 0 4 3
Log (tons per shift) 0 198= ( 016)
Log (size) 0044 024)
aSignificant at p < 01
~~~
Cutter- operator
0.085 (.073) 0.245” (.OSS) -0.059 (.034) ~ _ _ ~
eliminates the large differences between inspector and operator samples reported in Tables IT and 111.
The data are consistent with the simple strategy of reporting very low measurc- ments. If high samples lead to citations and penalties, and if many low samples are easily detectable signs of underreporting, a more sophisticated strategy would seem- ingly increase the benefits and reduce the costs of misreporting. For example, pumps could be reported for 4 h, not 8; or they could be operated for 4 h in dusty areas and 8 h elsewhere. .c\lternatively, operators could preweigh and postweigh cassettes, invalidating those above 2.0 mg/m3.
Three factors may account for the simple strategy apparently in use. First, it is easy and cheap to implement and reduces by a factor of a the number of measure- ments above 2.0 mg/m3. Second, MSHA has not attempted to use very low dust measurements as an index of underreporting. Therefore, the expected cost of the simple method is close to zero. A third reason for the simple underreporting method is that it can be effective in reducing or eliminating citations, even when used infrequently. As noted above, citations are based on the mean of ten consecutive operator dust measurements. Suppose that the “true” mean dust level were 2.3 mg/ m3. If a mine sent to MSHA eight measurements with a mean of 2 . 3 mg/m3 and two samples indicating exposure of 0.1 mghn’, MSHA would calculate the mean of these
440 BodenandGold
samples, or 1.86 mg/m3, and the mine would neither be penalized nor ordered to reduce dust levels.
MSHA, like other regulatory programs, provides incentives for inaccurate reporting, but does not structure information-gathering to reduce the effects of misreporting. In this case and others, good public policy suggests that regulators recognize the problem of information quality and design data collection to maximize its net benefits.
REFERENCES
Allingham MG, Sandmo A (1972): Income tax evasion: A theoretical analysis: J Public Economics.
Courtney WG (1974): Review of current MSHA dust enforcement for coal mining operations. Memo- randum to Director, Bureau of Mines.
Kwerel E (1977): To tell the truth: Imperfect information and optimal pollution control. Rev Econ Stud. 44: 595-602.
Leidel NA, Busch KA (1975): Statistical methods for the determination of non-compliance with OCCU-
pational health standards. Cincinnati: National Institute for Occupational Safety and Health. Leidel NA, Crouse W (1975): Exposure measurement. action level, and environmental variability.
Cincinnati: National Institute for Occupational Safety and Health. Mine Safety and Health Administration (1980): Miner participation in respirable dust sampling proce-
dures. Federal Register. 45(9). Parobeck PS, Jankowski RA (1970): Assessment of the respirable dust levels in the nation’s underground
and surface coal mining operations. Am Ind Hyg Assoc J . 40:910-915. Sharp G (1978): Dust monitoring and control in the underground coal mines of eastern Kentucky.
Department of Anthropology. University of Kentucky (Unpublished). Smith TJ, Peters JM, Reading JC, Castle CH (1977): Pulmonary impairment from chronic exposure to
sulphur dioxide in a smelter. Am Rev Respir Dis. 116:31-39.
1:323-338.