Embed Size (px)
Citation preview

The African Export Import Bank(Established pursuant to the Agreement for the Establishment of the African Export-Import Bank, signed in
Abidjan, Côte D’Ivoire, 8 May 1993)
This document (the “Registration Document”) has been approved by the United Kingdom Financial Conduct Authority(the “FCA”), as competent authority under Regulation (EU) 2017/1129 (the “Prospectus Regulation”). The FCA onlyapproves this Registration Document as meeting the standards of completeness, comprehensibility and consistency imposedby the Prospectus Regulation. Such approval should not be considered as an endorsement of the issuer that is the subject ofthis Registration Document. This document is a Registration Document relating to the Bank prepared in accordance withthe Prospectus Regulation Rules (the “Prospectus Regulation Rules”) of the FCA made under section 73A of the FinancialServices and Markets Act 2000 (“FSMA”).This Registration Document may be combined with a securities note and summary to form a prospectus in accordance withthe Prospectus Regulation Rules. A prospectus is required before an issuer can offer transferable securities to the public orrequest the admission of transferable securities to trading on a regulated market. However, this Registration Document,where not combined with the securities note and summary to form a prospectus, does not constitute an offer or invitation tosell or issue, or a solicitation of an offer or invitation to purchase or subscribe for, any securities in the Bank in anyjurisdiction, nor shall this Registration Document alone (or any part of it), or the fact of its distribution, form the basis of,or be relied upon in connection with, or act as any inducement to enter into, any contract or commitment whatsoever withrespect to any offer or otherwise. This Registration Document should be read and construed with any amendment orsupplement hereto, and for a particular issue of securities in conjunction with any applicable prospectus for the purposes ofthe Prospectus Regulation.No representation or warranty, express or implied, is made and no responsibility or liability is accepted by any person otherthan the Bank, as to the accuracy, completeness, verification or sufficiency of the information contained herein, and nothingin this Registration Document may be relied upon as a promise or representation in this respect, as to the past or future. Noperson is or has been authorised to give any information or to make any representation not contained in or not consistentwith this Registration Document and, if given or made, such information or representation must not be relied upon ashaving been authorised by the Bank. Without limitation, the contents of the website of the Bank do not form part of thisRegistration Document and information contained therein should not be relied upon by any person. The delivery of thisRegistration Document shall not, under any circumstances, create any implication that there has been no change in thebusiness or affairs of the Bank since the date of this Registration Document or that the information contained herein iscorrect as of any time subsequent to its date.
The date of this Registration Document is 9 October 2019.
Important Notice
The distribution of this Registration Document in certain jurisdictions may be restricted by law. Other than in the UnitedKingdom, no action has been taken or will be taken to permit the possession or distribution of this Registration Documentin any jurisdiction where action for that purpose may be required or where doing so is restricted by law. In the UnitedStates or to U.S. persons (“U.S. Persons”), as defined in Regulation S (“Regulation S”) of the U.S. Securities Act of 1933,as amended (the “Securities Act”)) (wherever located), you may not distribute this Registration Document or make copiesof it without the Bank’s prior written consent other than to people you have retained to advise you in connection with thisRegistration Document, or persons reasonably believed by the Bank to be qualified institutional buyers (“QIBs”), as definedin Rule 144A (“Rule 144A”) under the U.S. Securities Act of 1933, as amended (the “Securities Act”), that are alsoqualified purchasers (“QPs”) as defined in section 2(a)(51) of the U.S. Investment Company Act of 1940, as amended (the“Investment Company Act”). Accordingly, neither this Registration Document nor any advertisement nor any offeringmaterial may be distributed or published in any jurisdiction, other than in the United Kingdom, except under circumstancesthat will result in compliance with any applicable laws and regulations. Persons into whose possession this RegistrationDocument comes should inform themselves about and observe any such restrictions. Any failure to comply with suchrestrictions may constitute a violation of the securities laws of any such jurisdiction.Any securities referred to in this Registration Document have not been, and will not be, registered under the Securities Actor with any securities regulatory authority of any state of the United States, and may not be offered or sold (i) within theUnited States, except to persons reasonably believed to be QIBs that are also QPs by certain U.S. selling agents of theManagers in reliance on Rule 144A under the Securities Act or pursuant to another exemption from, or in a transaction notsubject to, the registration requirements under the Securities Act or (ii) outside the United States except to institutionalinvestors that are not U.S. Persons in “offshore transactions” as defined in, and in reliance on Rule 903 or 904 ofRegulation S. Any securities referred to in this Registration Document have not been and will not be registered under theapplicable securities law of Canada, Australia, South Africa or Japan and, subject to certain exceptions, may not be offeredor sold within Canada, Australia, South Africa or Japan or to any national, resident or citizen of Canada, Australia, SouthAfrica or Japan.

TABLE OF CONTENTS
RISK FACTORS . . . . . . . . . . . . . . . . . . . . . . . . . . . . . . . . . . . . . . . . . . . . . . . . . . . . . . . 2
IMPORTANT INFORMATION ABOUT THIS REGISTRATION DOCUMENT . . . . . . . . . . . . . . . 14
PRESENTATION OF FINANCIAL AND OTHER INFORMATION . . . . . . . . . . . . . . . . . . . . . . 16
DIVIDEND POLICY . . . . . . . . . . . . . . . . . . . . . . . . . . . . . . . . . . . . . . . . . . . . . . . . . . . . 18
MACROECONOMIC ENVIRONMENT . . . . . . . . . . . . . . . . . . . . . . . . . . . . . . . . . . . . . . . . 19
BUSINESS . . . . . . . . . . . . . . . . . . . . . . . . . . . . . . . . . . . . . . . . . . . . . . . . . . . . . . . . . . . 22
SELECTED FINANCIAL AND OTHER INFORMATION . . . . . . . . . . . . . . . . . . . . . . . . . . . . . 50
OPERATING AND FINANCIAL REVIEW . . . . . . . . . . . . . . . . . . . . . . . . . . . . . . . . . . . . . . 55
SELECTED STATISTICAL INFORMATION . . . . . . . . . . . . . . . . . . . . . . . . . . . . . . . . . . . . . 88
RISK MANAGEMENT . . . . . . . . . . . . . . . . . . . . . . . . . . . . . . . . . . . . . . . . . . . . . . . . . . . 96
MANAGEMENT OF THE BANK AND CORPORATE GOVERNANCE . . . . . . . . . . . . . . . . . . . 111
SHAREHOLDERS AND DESCRIPTION OF SHARE CAPITAL . . . . . . . . . . . . . . . . . . . . . . . . 122
RELATED PARTY TRANSACTIONS . . . . . . . . . . . . . . . . . . . . . . . . . . . . . . . . . . . . . . . . . 136
MATERIAL CONTRACTS . . . . . . . . . . . . . . . . . . . . . . . . . . . . . . . . . . . . . . . . . . . . . . . . . 137
GENERAL INFORMATION . . . . . . . . . . . . . . . . . . . . . . . . . . . . . . . . . . . . . . . . . . . . . . . . 138
GLOSSARY OF TERMS AND DEFINITIONS . . . . . . . . . . . . . . . . . . . . . . . . . . . . . . . . . . . . 139
INDEX TO SPECIAL PURPOSE FINANCIAL STATEMENTS . . . . . . . . . . . . . . . . . . . . . . . . . F-1
1

RISK FACTORS
The risks highlighted below could have a material adverse effect on the Bank’s business, financial condition,results of operations or prospects. Prospective investors should note that the risks described below are not theonly risks the Bank faces. The Bank has only described the risks it believes to be material. There may beadditional risks that the Bank currently considers immaterial or of which it is currently unaware, and any ofthese risks could have the effects set forth above.
The Bank has classified the risks set out below into the following categories:
• risks relating to the Bank’s constitution and structure;
• risks relating to the Bank’s financial position, in terms of composition and exposures;
• risks relating to the Bank’s operations; and
• risks relating to the Bank’s focus on Africa, including economic and political risks.
1. Risks relating to the Bank’s constitution and structure
As a supranational institution, the Bank is not subject to regulatory supervision, including with regard tocapital adequacy, liquidity and corporate governance
The Establishment Agreement has the status of a treaty under public international law, and the Bank is acreation of, and subject to, public international law. The Bank’s existence, powers, privileges, immunities,liabilities and operations are subject to, and governed by, the Establishment Agreement. The Bank is not subjectto regulation by any state. In this respect, under Article IX of the Establishment Agreement, the Bank enjoysfreedom from restrictions, regulations, supervision or controls, moratoria and other legislative, executive,administrative, fiscal and monetary restrictions of any nature in the Participating States. In addition, theEstablishment Agreement accords the President, Vice-Presidents, directors, officers and employees of the Bankand consultants and experts performing missions for the Bank a number of privileges, immunities andexemptions in the Participating States. For more information, see “Shareholders and Description of ShareCapital—Legal Status of the Bank”.
The capital adequacy position of the Bank is controlled and closely monitored by the Board, and is disclosed inthe audited special purpose financial statements of the Bank. The Bank has established a capital managementpolicy (the “Capital Management Policy”) that is based on the maintenance of a capital adequacy ratio that isin line with the recommendations of the Basel Committee on Banking Supervision (the “Basel Committee”),as amended from time to time. In particular, the Bank currently applies standards from the Basel II frameworkand intends to apply standards from the Basel III framework at some point during 2020 and thereafter.
However, the Bank is not subject to capital requirements by a regulatory body such as a central bank orequivalent institution and there can be no assurance that the Bank will continue to maintain its CapitalManagement Policy or to comply with it or that its Capital Management Policy will continue to be in line withthe recommended actions of the Basel Committee or any other internationally recognised capital adequacystandards. Non-compliance with the recommendations of the Basel Committee and its current liquidityframework could have a material adverse effect on the Bank’s access to external financing as well as to itsbusiness, financial position, results of operations and prospects.
In addition, the Bank is not subject to any corporate governance laws or rules normally applicable to nationalcorporations. Accordingly, the corporate governance standards adhered to by the Bank as enshrined in thecharter of the Bank (the “Charter”) may differ from those generally applicable to corporations organised underthe laws of any particular jurisdiction, such as the United States, the United Kingdom, EU countries or otherjurisdictions, and might be deemed inadequate by international investors.
As at the date of this Registration Document, the Bank’s subscribed share capital comprised in its Class A,Class B, and Class C Shares is two-fifths paid up. Any failure to successfully call the remaining instalmentson such Shares without raising other capital may have a material adverse effect on the Bank’s ability togrow in the medium term
As part of the Bank’s current strategic plan, entitled “Impact 2021: Transforming Africa” (the “StrategicPlan”), the Bank has set a target to raise U.S.$1.0 billion of additional equity by 2021. As at 31 December2018, U.S.$838.0 million had been raised (including warrants).
The Bank’s share capital is divided into four classes (Class A Shares, Class B Shares, Class C Shares and ClassD Shares). Class D Shares must be fully paid at the time of subscription, whereas the Class A Shares, Class
2

B Shares and Class C Shares are paid 40% on subscription with the balance remaining as callable capital. Inrespect of these Shares, 40% has been paid in full by the Bank’s shareholders, amounting in aggregate toU.S.$506.3 million (excluding share premium of U.S.$764.8 million) out of the overall nominal subscribedcapital of U.S.$1,162.1 million as at 31 December 2018.
The Class A, Class B and Class C Shareholders are obliged by the Charter of the Bank to pay the remaining60% (amounting to an additional U.S.$873 million (including share premium) as at 31 December 2018) whencalled by the Board of Directors. If the Bank called for such capital and the call was not honoured, this couldhave an adverse impact on the Bank’s ability to grow, particularly if the Bank were unable to obtain funds fromother sources.
With respect to the Bank’s callable capital, the majority of the Shareholders have below investment grade creditratings or no credit ratings at all. In order to manage the risk of Shareholders not honouring the remaining calls,the Bank has put in place a mid-term credit risk mitigation instrument to cover the Shareholders of the Bankwhich are not investment-grade rated, comprising primarily the Bank’s Class A and some Class B shareholders,representing U.S.$621.0 million of capital insured as at 31 December 2018. The instrument addresses ascenario in which a call on capital would not be honoured by the relevant Shareholders (i.e. in the event that acall on the uncalled portion of the equity is made and a Shareholder covered by the insurance defaults on theirpayment commitment, the insurer would make the payment due by the defaulting Shareholder). However, anymaterial failure to obtain additional equity funding through capital calls on existing Shareholders could have anadverse impact on the Bank’s expected growth targets, particularly if it is unable to raise capital throughalternative means.
Any future unavailability of capital markets and loan financing could have a material adverse effect on thegrowth of the Bank’s business
The Bank has historically obtained financing for the growth of its loan portfolio from syndicated and bilateralloans (including from Development Finance Institutions (“DFIs”) such as the International Finance Corporation(“IFC”) and the African Development Bank (“AfDB”)) and, since 2009, through the international issuance ofEurobonds under its GMTN Programme (including the U.S.$750.0 million issuance under the GMTNProgramme on 23 September 2019), Shareholder calls (the Bank had U.S.$873.0 million in uncalled equitycapital as at 31 December 2018) and Share issuances. As at 31 December 2018, the Bank hadU.S.$162.0 million of equity capital yet to be raised under the target set out in the Strategic Plan, and theBank had obligations to retire outstanding warrants in the amount of U.S.$166.8 million as at 30 June 2019.However, if further bond issuances or other methods of capital markets financing are not possible on termsacceptable to the Bank and both syndicated and bilateral loan financing are unavailable, this may inhibit theBank’s ability to meet its growth targets and could trigger downgrades to the Bank’s credit ratings. A creditrating downgrade would likely increase the Bank’s funding costs and reduce its access to the debt capitalmarkets, which could impair the Bank’s ability to obtain funding to grow its operations at meaningful levels inthe medium term, any of which could have a material adverse effect on the Bank’s business, financialcondition, results of operations and prospects.
Changes to the Charter in relation to Share Class composition or director appointment rights could result ina change in corporate governance
The Charter provides for a balanced governance structure, in terms of the distribution of shareholdings amongAfrican states, African banking institutions, the African Development Bank and other private sector and publicsector organisations and their representation on the Board of Directors. Since the Bank was only establishedrelatively recently compared to major development banks, certain transitional measures and changes to theBank’s governance structure have been required in the past and could be required in the future as theorganisation grows and develops, which could give rise to changes in the relative proportions of each class ofthe Bank’s share capital and in the rights to appoint members of the Board of Directors. For example:
• prior to the amendment of the Charter at the reconvened Third Extraordinary General Meeting on8 December 2012 (the “Third EGM”), the Charter required that the Bank’s authorised share capital, whenfully subscribed, was to be distributed proportionally among the three categories of shareholders as 35%for Class A Shareholders, 40% for Class B Shareholders and 25% for Class C Shareholders;
• at the Third EGM, the Charter was amended to provide for a new category of Class D Shares, and theproportionate distributions were also amended such that a minimum of 35% of the authorised share capitalis now to be held by Class A Shareholders, and up to 65% of the authorised share capital can be held by
3

Class B, C and D Shareholders. Notably, Class D Shares can be held by any person, which couldpotentially include African states and others who are also eligible to hold Class A Shares; and
• Article 14 of the Charter states that the Class A, Class B and Class C Shares may be transferred onlyamong holders of Shares of the respective class or to any third party who is eligible to become a holder ofsuch class of Shares pursuant to Article 7 of the Charter. Class D Shares may be freely transferred withoutrestriction to any person. Article 14 also contains a number of transitional provisions that have appliedsince the first issue of Class D Shares, including: (i) holders of Class B and Class C Shares may apply toconvert their shareholdings to Class D Shares, and (ii) Class B Shares that are 100% beneficially andlegally owned by an African State may be converted to Class A Shares.
Changes to shareholdings by the conversion of Class B Shares or Class C Shares into Class D Sharescould ultimately result in a change in the composition of the Board of Directors. In addition, there is norestriction on the number of Shares that may be held by any one individual shareholder or group ofShareholders, which could potentially lead to a concentration of ownership of the Bank. As at the date ofthis Registration Document, a concentration of ownership of the Bank would not of itself result in anability to appoint or remove a majority of the Board of Directors. However, if the Bank’s corporategovernance structure and established practices were changed, whether by virtue of amendments to theCharter, further capital raises, ownership changes or otherwise, such that a concentration in control of theBank could result in an ability of any person or group of persons acting together to appoint or remove amajority of the Board of Directors, this may in turn have a material adverse effect on the investmentpolicies and the lending activities of the Bank and, consequently, the Bank’s business, financial condition,results of operations and prospects.
2. Risks relating to the Bank’s financial position, in terms of composition and exposures
The Bank’s loans are geographically highly concentrated in Africa, with 73.9% being from West and NorthAfrica as at 31 December 2018
While the Bank exists to facilitate, promote and expand intra- and extra-African trade, its lending activities arecurrently concentrated in a relatively small number of countries in Africa, with borrowings in Nigeria andEgypt alone accounting for 54.8% of the Bank’s outstanding gross loans (loans and advances at amortised costand FVTPL) as at 31 December 2018. As at 31 December 2018, 48.7% of the Bank’s outstanding gross loansand advances were to borrowers in West Africa and 25.2% were to borrowers in North Africa. Of the WestAfrican borrower gross exposure, as at 31 December 2018, Nigerian borrowers accounted for 33.2% of theBank’s gross loans exposure, in comparison to 36.5% as at 31 December 2017 and 31.7% as at 31 December2016. Furthermore, as at 31 December 2018, of the Bank’s 20 largest borrowers by outstanding amount (whichaccounted for 63.9% of the Bank’s total gross loan portfolio), four were based in Nigeria (with a total grossoutstanding amount of U.S.$2,166.4 million, or 19.0%, of the Bank’s total outstanding loans) and six werebased in Egypt (with a total gross outstanding amount of U.S.$2,093.2 million, or 18.4%, of the Bank’s totalgross outstanding loans).
If economic changes adversely affect the borrowers and/or countries representing the major exposures of theBank, the Bank could experience potential difficulties in loan repayment and collection, as well as credit lossesarising from these loans, which in turn could have a material adverse effect on its business, financial condition,results of operations and prospects.
African financial institutions are borrowers of a significant proportion of the Bank’s loan portfolio
The Bank’s loan portfolio is significantly concentrated, with 49.8% of the Bank’s outstanding loans as at31 December 2018 provided to African financial institutions. Therefore, the Bank’s business may beparticularly subject to changes in economic conditions and systemic risks that affect financial markets. Anynegative shocks to financial markets in Africa that adversely affected these financial institutions couldadversely affect the Bank’s loan portfolio and lead to credit losses. In addition, any increases in regulatoryoversight and requirements imposed by the governments of Participating States on the lending and trade financeactivities of borrowers operating in their financial sectors could have an indirect impact on the Bank’s activitiesand business and have a material adverse effect on its business, financial condition, results of operations andprospects.
4

Changes in the credit quality of the Bank’s borrowers and counterparties could materially adversely affectthe Bank’s financial performance, and the Bank’s credit portfolio may not continue to grow at the same orsimilar rate as in recent years
The Bank’s loan portfolio increased from U.S.$8,545.7 million as at 31 December 2017 toU.S.$11,134.4 million as at 31 December 2018 and to U.S.$11,395.0 million as at 30 June 2019. Noassurance can be given that, in the future, the Bank’s loan portfolio will continue to grow at historic rates.Furthermore, any continuation of historical growth rates in the Bank’s loan portfolio could expose the Bank toincreased credit risk, which, in turn, could have a material adverse effect on the Bank’s business, financialcondition, growth, prospects, cash flows and results of operations if the Bank were to be unable to manage suchincrease in credit risk.
In particular, the Bank’s business is subject to risks related to the credit quality of its customers. As at 30 June2019, loans and advances to customers amounted to 74.1% of the Bank’s total assets. Given the high magnitudeof the exposure to customer credit risk, a deterioration of the credit quality of the Bank’s customers, and afailure by the Bank to correctly identify and manage such changes, could reduce the value of the Bank’s assetsand require increased provisions for bad and doubtful debts, which, in turn, could have a material adverseeffect on the Bank’s business, financial condition, results of operations and prospects.
Local foreign exchange controls or currency devaluations may affect the Bank’s and its borrowers’ ability topay U.S. dollar-denominated obligations
As at 31 December 2018, 88.8% of the Bank’s loans and advances were U.S. dollar-denominated and 11.2%were Euro-denominated. The Bank faces the risk that local country foreign exchange controls could restrict theability of its borrowers, even if they are exporters, to acquire dollars or Euros to repay loans on a timely basis,and/or that significant currency devaluation will occur, which could increase the cost, in local currency terms,to the Bank’s borrowers of acquiring dollars or Euros to repay loans. For example, in 2019, the government ofZimbabwe announced controls on the U.S. dollar, which could restrict the ability of customers in Zimbabwe torepay U.S. dollar-denominated loans to the Bank. Zimbabwe customers accounted for U.S.$714.4 million, or6.3%, of the Bank’s outstanding gross exposure as at 31 December 2018. Furthermore, in 2017, certaincustomers of the Bank in Nigeria would have faced difficulties accessing currency to service their liabilities tothe Bank absent an arrangement with Participating States, including between the Central Bank of Nigeria andthe Bank, whereby the Bank’s customers benefitted from its preferred creditor status and were given priorityaccess to hard currency to enable them to service their liabilities. However, there can be no assurance that sucharrangements, as a result of the Bank’s preferred creditor status or otherwise with Participating States, will beavailable in any similar circumstances in the future.
Any inability of the Bank’s borrowers to acquire dollars or Euros as a result of local foreign exchange controls,currency devaluation, or otherwise could affect their ability to repay their loans, which in turn could have amaterial adverse effect on the Bank’s business, results of operations, financial condition and cash flows.
A decline in the value of collateral or the illiquidity of the collateral securing the Bank’s loans mayadversely affect the credit quality of its loan portfolio
The Bank takes collateral from the majority of borrowers, and as at 31 December 2018, the fair value ofcollateral represented 90% of loans outstanding. Collateral that may be accepted includes assignments ofreceivables, cash collateral, government securities (by way of bonds or guarantees) and pledges over assets.Downturns in the relevant markets or a general deterioration of economic conditions may result in reductions inthe value of collateral securing loans to levels below the amounts of the outstanding principal and accruedinterest on such loans. If collateral values decline, they may not be sufficient to cover uncollectable amounts onthe Bank’s secured loans. A failure to recover the expected value of collateral may expose the Bank to losses,which could, in turn, have a material adverse effect on the Bank’s business, financial condition, results ofoperations and prospects.
The Bank’s allowances for credit losses could prove inadequate to cover credit losses related to its loans andcontingencies
Determining the appropriate level of allowances for credit losses necessarily requires the Board’s andmanagement’s judgement, including assumptions and estimates made in the context of changing political andeconomic conditions in the regions and sectors to which the Bank lends. In particular, on 1 January 2018, theBank implemented IFRS 9. IFRS 9 replaced the “incurred credit loss” model used under IAS 39 with an“expected credit loss” model. The changes from incurred to expected credit losses requires professional
5
judgement over various factors used in the calculation of expected credit losses, such as how macroeconomicscenarios affect the calculation. The application of the IFRS 9 impairment requirements could increasevolatility in profit and loss of the Bank. In addition, the Bank’s allowances for credit losses may not beadequate to cover losses in its credit portfolio, which, in turn, could have a material adverse effect on theBank’s business, financial condition, growth, prospects, cash flows and results of operations.
The Bank is exposed to liquidity risk
The Bank has historically obtained financing for the growth of its loan portfolio from syndicated and bilateralloans (including from DFIs such as the IFC and the AfDB) and, since 2009, through the international issuanceof Eurobonds under its GMTN Programme (including the U.S.$750.0 million issuance under the GMTNProgramme on 23 September 2019), shareholder calls (the Bank had U.S.$873.0 million in uncalled equitycapital as at 31 December 2018) and Share issuances. However, the maturity profile associated with a majorityof the loans from these funding sources is shorter than the maturity of its assets (typically loans). Therefore,unanticipated decreases in CENDEP deposits or other funding sources may result in liquidity gaps that theBank may not be able to cover without incurring additional expenses, if at all. The liquidity gap may affect theability of the Bank to continue the targeted growth of its business effectively in the medium term. Any inabilityto meet liquidity needs in these circumstances could adversely impact the evaluation of the Bank’screditworthiness by counterparties and rating agencies, which could significantly limit its ability to grow itsoperations and have a material adverse effect on the Bank’s business, financial condition, results of operationsand prospects.
3. Risks relating to the Bank’s operations
The Bank is exposed to operational risks, including the risk of fraud by employees and third parties, failureto obtain proper internal authorisations, failure to properly document transactions, equipment failures, dataprotection and cybersecurity breaches, and errors by employees
The Bank is exposed to operational risks, including the risk of fraud by employees and third parties, failure toobtain proper internal authorisations, failure to properly document transactions, equipment failures, dataprotection and cybersecurity breaches, and errors by employees. In particular, the Bank’s business depends onprocessing numerous complex transactions, and the recording and processing of these transactions arepotentially exposed to the risk of human and technological errors, including miscalculations, or a breakdown ininternal controls relating to the due authorisation of transactions. Given the volume of transactions processed bythe Bank, errors may be repeated or compounded before they are discovered and rectified, and no assurancecan be given that risk assessments made in advance will adequately estimate the costs of these errors.Moreover, the secure transmission of confidential information about customers and transactions is a critical partof the Bank’s business, and its measures for keeping such information secure from external threats could proveinadequate. Although the Bank has put in place a system of internal controls that is designed to address theforegoing risks, there can be no assurance that operational problems or other errors will not occur, and that thefailure to prevent these risks will not have a material adverse effect on the Bank’s business, financial condition,results of operations and prospects.
Any delays to, or failure to implement, business initiatives that the Bank may undertake could prevent theBank from realising the anticipated revenues and benefits of the initiatives, divert the attention of itsmanagement, cause additional expenses, or cause other negative repercussions for the Bank
Part of the Bank’s strategy is to diversify income sources through business initiatives such as those set out inthe Bank’s Strategic Plan covering the period from 2017 to 2021 that, in some cases, involve partnerships orstrategic alliances with specialists, and initiatives such as expanding into new markets, targeting new clientsand developing new products and services (please see also “Business—Strategic Planning”). These initiativesmay not be fully implemented within the time frame which the Bank expects, or at all. In addition, even if suchinitiatives are fully implemented, they may not generate revenues as expected or could result in an increase incosts and expenses in excess of budget and/or credit risks arising from new markets. Any delays in reachingagreement with strategic partners, or otherwise implementing the Bank’s strategic initiatives, could divert theattention of the Bank’s management, result in additional expense, prevent the Bank from pursuing otherinitiatives or, ultimately, prevent the Bank from realising the anticipated benefits of the initiatives, which couldadversely affect the Bank’s business, financial condition, results of operations and prospects.
6

Increased risk perception in countries in Africa where the Bank has large credit exposure could have anadverse impact on the Bank’s credit ratings, funding activities and funding costs
There is no guarantee that the Bank will not be subject to negative changes in its credit ratings (see “GeneralInformation”). In particular, increased risk perception in any country in Africa where the Bank has largeexposures (as is the case with, for example, the Bank’s exposure to Nigeria, which accounted for 33.2% of theBank’s total loans outstanding as at 31 December 2018) could trigger downgrades to the Bank’s credit ratings.A credit rating downgrade would likely increase the Bank’s funding costs and could reduce its access to thecapital markets, whether debt or equity. In that case, the Bank’s ability to obtain the necessary funding to carryon its financing activities in Africa at meaningful levels could be adversely affected, which in turn could have amaterial adverse effect on the Bank’s business, financial condition, results of operations and prospects.
The Bank is exposed to market risks, including interest rate and currency risk, and its efforts to managesuch risks may not be successful
Market risk generally represents the risk that the value of assets and liabilities will be adversely affected bychanges in market conditions. Market risk is inherent in the financial transactions associated with many of theBank’s operations and activities, including loans, deposits, short-term borrowings and long-term debt. The Bankseeks to manage some of its market risk through the use of derivatives such as currency and interest ratehedging and swaps. Fluctuations in interest and currency exchange rates, changes in the implied volatility ofinterest rates and changes in foreign exchange rates have a direct impact on the Bank’s profitability.Accordingly, depending on the instruments or activities impacted, market risks can adversely affect the Bank’sbusiness, financial condition, results of operations and prospects.
The Bank is exposed to risks resulting from mismatches between the interest rates on its interest-bearingliabilities and interest-earning assets. To the extent that the Bank’s assets may re-price more frequently than itsliabilities, if interest rates fall, the Bank’s interest expense will decrease more slowly than its interest income,which could negatively affect its net interest margin. For example, the Bank lends and borrows at floating rates,resulting in a natural hedge. However, borrowings done through the GMTN Programme are at a fixed interestrate. In order to hedge against interest rate movements, the Bank enters into interest rate swaps. As at31 December 2018, U.S.$1.28 billion in bonds were hedged, U.S.$3.0 billion in total bonds were outstandingand hedged bonds represented 42.3% of the total bond portfolio.
More generally, the Bank has entered into various hedging transactions to help manage the risk of changes incommodity prices and currency fluctuations with respect to loans made to its borrowers. The Bank’s actualhedging decisions are determined in light of the facts and circumstances existing at the time of the hedge andmay differ from time to time. In some cases, the Bank may not elect or have the ability to implement suchhedges or, if the Bank does implement them, they may not achieve the desired effect. They may also exposethe Bank to the risk that its counterparties to hedging contracts will default on their obligations. Furthermore,although hedging transactions may limit to some degree the Bank’s risk from fluctuations in commodity prices,currency exchange and interest rates, the Bank potentially forgoes benefits that might result from suchfluctuations. At the date of this Registration Document, the Bank hedged 100% of its actual net currencyexposure, in line with its current policy, and as noted above, the Bank is substantially hedged against its currentinterest rate risk. However, there can be no assurance that the Bank’s hedging activities will operate as intendedand protect it against losses resulting from adverse interest rate, currency or commodity price fluctuations. Anyfailure to do so could have a material adverse effect on the Bank’s business, financial condition, results ofoperations and prospects.
Although the Bank seeks to adhere to internationally recognised sanctions, the Bank has relationships withstates which have citizens or entities that are subject to international sanctions
As a supranational financial institution focused on developing trade from and within Africa, the Bank hasrelationships (including shareholder and business) with a number of African states that are subject to one ormore international sanctions regimes, in particular, the Democratic Republic of the Congo, the Republic ofSudan, South Sudan and the Republic of Zimbabwe. As at the date of this Registration Document, none ofthese states is the subject of comprehensive sanctions under any applicable sanctions regime, although certainindividuals, entities and sectors within these states are subject to sanctions. As at 30 June 2019, the Bank’soperational exposure to each of these countries (as a percentage of gross outstanding loans and advances), byvirtue of its lending activities in those countries, was as follows:
Democratic Republic of the Congo: 0.0%
Republic of Sudan: 3.2%
7

South Sudan: 0.5%
Zimbabwe: 9.7%.
None of the loans in the totals above were granted to parties in violation of any international sanctions regimes.In this respect, it should be noted that loans granted to the Republic of Sudan have historically beendenominated in Euro, rather than U.S. Dollars, since the Republic of Sudan had previously been subject tocomprehensive sanctions in the United States. Nevertheless, in each of the foregoing cases, the Bank intendseither to reduce its exposures or to cap its exposure to acceptable limits.
Certain persons located in, or in some other way connected with, the Republic of Zimbabwe and the Republicof Sudan are subject to sanctions administered by the Office of Foreign Assets Control of the U.S. Departmentof the Treasury (“OFAC”). In addition, sanctions administered by the EU prohibit the provision of (i) financingor financial assistance related to military activities, including loans for the sale, supply, transfer or export ofarms or for the provision of related technical assistance (such as maintenance) to any person, entity or body inthe Republic of Sudan or South Sudan (EU Regulation 131/2004 as amended by 1215/2011) and (ii) technicalassistance, financing or financial assistance related to military activities, or towards the purchase of equipmentwhich could be used for internal repression in Zimbabwe (EU Regulation (314/2004) and UK StatutoryInstrument, “The Zimbabwe (Financial Sanctions) Regulations 2009” (No. 847)). Furthermore, a UnitedNations-administered embargo prohibits the trading of arms and rough diamonds in, to or with Côte d’Ivoire.OFAC also maintains sanctions against certain persons and entities in Côte d’Ivoire, the Democratic Republicof the Congo and Liberia.
The sanctions regimes referred to above do not prevent the Bank from transacting with entities and persons thatare not themselves subject to sanctions or embargoes, although the Bank seeks to adhere to sanctions andembargoes imposed and administered by the African Union, United Nations Security Council, the EuropeanUnion, OFAC, Her Majesty’s Treasury and other relevant internationally recognised sanctions authorities.However, given the extent of the Bank’s involvement in financing transactions throughout Africa, there can beno assurance that the Bank will not be subject to investigation in connection with the sanctions or embargoesdescribed above or other sanctions and embargoes that may be applicable either presently or in the future. Ifany such investigation occurred and resulted in the Bank being found to have breached any sanctions orembargoes, this could adversely affect the Bank’s business, financial condition, results of operations andprospects. Please see also “Risk Management—Anti-Money Laundering, “Know-Your-Customer” Checks andSanctions Compliance—Sanctions Compliance”.
The loss of key employees may have an adverse effect on the Bank’s business
The Bank’s growth strategy is dependent on the efforts and abilities of its senior management. The Bank’soperations depend, in part, upon the continued services of certain long-term, key employees with the relevantskills to operate a multilateral financial institution. In the Bank’s experience, in cases of turnover of its keyemployees, replacement costs can be significant given the need to find employees with the relevant skills andexperience, particularly given the pan-African nature of the Bank’s operations and that to replace one existingemployee with the requisite product knowledge, skills and languages could require the Bank having to hiremultiple new employees to yield the same skill set, which would, inter alia, increase its employment costs.Despite having a succession plan in place for its existing key employees, if the Bank loses the services of anyof its existing key personnel without timely and suitable replacements, or is unable to attract and retain newpersonnel with suitable experience, the Bank’s business, financial condition, results of operations and prospectsmay be materially and adversely affected.
4. Risks relating to the Bank’s focus on Africa
The Bank’s lending activities are concentrated in Africa, which is a reflection of its core mission. Accordingly,investors should pay careful attention to the risk factors, both economic and political, associated with investingin Africa.
Emerging markets such as those in Africa are subject to greater risks than more developed markets
African markets are subject to greater risk than more developed markets. These risks include economic andfinancial market instability as well as, in some cases, significant legal and political risks. In addition, in anumber of African countries, structural reforms are still needed in many sectors, including agriculture, energyand transport.
8

Economic instability in African countries in the past and in other emerging market countries has beenmanifested in many ways, including but not limited to:
(i) general economic and business conditions;
(ii) high interest rates;
(iii) exchange rate fluctuations and instability;
(iv) high levels of inflation;
(v) exchange controls;
(vi) industrial action;
(vii) commodity price fluctuations;
(viii) slowdown in the economic and business activity of key clients;
(ix) wage and price controls;
(x) sudden changes in economic or tax policies;
(xi) imposition of trade barriers;
(xii) changes in investor confidence; and
(xiii) perceived or actual security issues and political instability.
The occurrence of any of these factors could have a material adverse effect on the Bank’s business, financialcondition, growth, prospects, cash flows and results of operations.
Turmoil in emerging markets and broader market conditions, even outside Africa, can adversely affectAfrican economies
Any significant financial turmoil in one emerging market country has a tendency to adversely affect prices incapital markets of other emerging market countries, as investors may seek to move their money to more stable,developed markets. As has happened in the past, financial problems or an increase in the perceived risksassociated with investing in emerging economies could dampen foreign investment across Africa and adverselyaffect the wider African economy.
The availability of credit to entities operating within emerging markets is also significantly influenced by thelevel of investor confidence in such markets as a whole and, as such, any factors that affect investor confidence(for example, a decrease in credit ratings or state or central bank intervention) could affect the price oravailability of funding for entities within any of these markets. Thus, even if the wider African economyremains stable (as a whole), financial turmoil in any emerging market country or region (African or otherwise)could have a material adverse effect on the Bank’s business, financial condition, results of operations andprospects.
In particular, the economies of some countries in Africa have periodically experienced significant volatility,which has been characterised, in some cases, by political uncertainty, slow growth or recession, declininginvestment, government and private sector debt defaults and restructurings, significant inflation and currencydevaluation. Entities located in, or doing business with, countries in emerging markets may be particularlysusceptible to disruptions in the capital markets and the reduced availability of credit or the increased cost ofdebt, which could result in them experiencing financial difficulty.
In addition, African economies are often overly dependent on commodity exports, and decreased demand fromChina for natural resources has had and may continue to have a significant downward effect on the prices ofthese commodities from African countries, whose economies are heavily dependent on the export of theseresources. See also “—The Bank may be adversely affected by a continued depression of or further falls incommodity prices, in particular oil prices, in the international markets and the effect of such declines onAfrican economic growth”.
As a result, African economies are highly susceptible to global economic changes, including in oil prices,U.S. dollar interest rates, the U.S. dollar exchange rate relative to local currencies, U.S. global trade policies(particularly with China) and slower economic growth in developed countries, any of which could have asignificant adverse effect on the economic condition of countries in Africa.
9

The Bank may be adversely affected by general conditions in the international financial markets and theireffects on African financial markets
The global financial crisis placed significant pressure on African banking systems as (i) access to foreigncurrency was restricted (a situation aggravated by downward pressure on exchange rates of local currencies tothe U.S. Dollar) and (ii) deterioration in the real economic sector threatened the quality of the assets of banks,resulting in dysfunctionality across the banking sector. The restoration of credit flow both to and within Africaand the continued return of financial markets to functionality represent critical elements for the ongoingrecovery from the global financial crisis. Any subsequent global financial crises would have an adverse impacton the Bank’s results of operations and profitability.
Ongoing, synchronised and above-trend growth in world economic activity is the main contributor towardsdemand for emerging market assets. Growth in Europe and the United States has been above average in recentyears, and growth in emerging markets generally continues to improve. Several major central banks havesignalled a firm intention to normalise monetary policy over time. Should major central banks reduce theirbalance sheets or increase interest rates faster than currently anticipated by international financial markets,foreign capital inflow into African economies could be jeopardised. A sudden reduction in foreign capitalinflow could weaken local currencies and economic growth across the continent, increase bond yields andresult in higher local interest rates, which may adversely impact the Bank’s operations and profitability.
The Bank may be adversely affected by a continued depression of or further falls in commodity prices, inparticular oil prices, in the international markets and the effect of such declines on African economicgrowth
The economies of many countries in Africa are highly sensitive to commodity prices, particularly oil prices. Oilprices have fluctuated widely in the past ten years. However, recently markets have experienced a prolongedperiod of low prices. From early 2011 to mid-2014, monthly average oil prices fluctuated between U.S.$93 andU.S.$118 of Brent crude oil (having peaked in July 2008, when monthly average oil prices reached anU.S.$133 per barrel). Oil prices began to decline sharply in the second half of 2014, a trend that continuedthrough to mid-January 2016, when daily prices were less than U.S.$30 per barrel. Oil prices increased to anaverage of U.S.$53 per barrel in 2017, and rose again to an average of U.S.$68 per barrel in 20181. Accordingto the World Bank, oil prices are anticipated to average U.S.$66 per barrel in 2019 and U.S.$65 per barrel in20202.
Oil prices can be affected by relatively minor changes in the supply of and the demand for oil, and a number ofadditional factors that are beyond an exporting African country’s control. These factors include, but are notlimited to, political conditions in the Middle East and other regions, internal and political decisions of theOrganisation of the Petroleum Exporting Countries (“OPEC”) and other oil producing regions and nations,weather conditions, government regulations, transport costs, the price and availability of alternative fuels andoverall international demand. Low oil prices can have a significant negative impact on the economies of oilexporters in Africa. For example, according to the World Bank, the GDP of Nigeria, which is highly dependenton oil exports, grew in 2014 by 6.3%, however, after the decline in oil prices, it only grew by 2.7% in 2015and fell by an estimated 1.6% during 20163.
Falling prices for other commodities can also impact many countries in the region. Commodity markets weregenerally weaker in 2018, with prices over 13% lower compared with their close in 20174. Global demand forraw materials has been weak, and demand from large developing countries has decreased as growth has slowed.In particular, low commodity prices for gold, cocoa, tea and platinum, among other commodities, had anegative effect on many African currencies in 2015, which led African nations such as Ghana, Uganda, Angolaand Tanzania to experience sharp falls in the values of their currencies. Despite limited recovery during 2016,2017 and 2018 in prices of key commodities of export interest to Africa, most commodity-dependenteconomies struggled to recover. Since a third of the world’s mineral reserves and a tenth of global oil reservesare located in Africa, many countries are extremely dependent on commodity export revenues. Sustained lowcommodity prices could slow growth and negatively impact African economies and companies operating inthose economies. This in turn could have a significant adverse impact on the Bank’s credit portfolio, includingincreased loan loss provisions and, as a result, on the Bank’s growth, asset quality, prospects, profitability andfinancial condition.
1 World Bank Commodity Markets Outlook, April 20192 World Bank Commodity Markets Outlook, April 20193 World Bank Global Economic Prospects—June 2017; World Bank Global Economic Prospects—January 20184 Bloomberg Commodity (BCOM) index, 2018
10

A worsening of the political climate (including significant changes to social conditions and foreign policies)in any of the states with which the Bank has relationships may have a material adverse effect on the Bank’sfinancial condition and/or results of operations
Political factors which could adversely affect the Bank’s business, financial condition, cash flows, results ofoperations and prospects include:
• regional political instability, including government or military regime change, riots or other forms of civildisturbance violence or strife, including through acts of terrorism, guerrilla activities and insurrection;
• military strikes or the outbreak of war or other hostilities involving nations in the region;
• any material curtailment of the industrial and economic infrastructure development that is currentlyunderway across Africa;
• government intervention, including expropriation or nationalisation of assets or increased levels ofprotectionism;
• increased government regulations, or adverse governmental activities, with respect to price, import andexport controls, the environment, customs and immigration, capital transfers, foreign exchange andcurrency controls, labour policies and land and water use, foreign ownership, legal structures and tax laws;
• cancellation of contractual rights;
• trade barriers;
• difficulties in staffing and managing operations;
• lack of well-developed legal systems which could make it difficult for the Bank to enforce its intellectualproperty and contractual rights;
• security and safety of employees;
• restrictions on the right to convert or repatriate currency or export assets;
• greater risk of uncollectible accounts and longer collection cycles;
• indigenisation and empowerment programmes;
• logistical and communications challenges;
• corruption; and
• arbitrary, inconsistent or unlawful government action.
Many of the countries with which the Bank has relationships are in various stages of developing the institutionsand legal and regulatory systems that are characteristic of established democracies. However, institutions inthese countries may not yet be as firmly established as they are in countries in more established democracies.Many of these countries are also in the process of transitioning to a market economy and, as a result, areexperiencing changes in their economies and their government policies that can affect the Bank’s investmentsin those countries. Moreover, the procedural safeguards of the new legal and regulatory regimes in thosecountries are still being developed and, therefore, existing laws and regulations may be applied inconsistently.In some circumstances, it may not be possible to obtain the legal remedies provided under those laws andregulations in a timely manner.
The introduction of barriers to global trade, including tariffs, could impact global demand for African goodsand commodities, and weaken global risk appetite more generally. For example, the recent imposition of tariffsby U.S. President Donald Trump on certain foreign exports of steel and aluminium may have a negative impacton these commodity sectors in African economies, as well as more broadly. Trade barriers affecting Africaneconomies may ultimately have an adverse impact on the Bank’s operations and credit portfolio.
In recent years, many African countries have been subject to increasing numbers of terrorist attacks, includingbut not limited to high profile incidents in Nigeria, Kenya, Tunisia, Egypt and Mali, and many Africancountries suffer from a high prevalence of violent crime, militant activity and political unrest. An increase inthe number of terrorist attacks or violent crimes, or the occurrence of a large-scale terrorist attack in Africacould have a negative impact on African economies and therefore the Bank’s financial condition and business.Islamist extremism is increasingly seen as posing a threat in certain parts of Africa. Extremist groups reportedto be operating in Africa include ISIS, al Qaeda in the Islamic Maghreb, Al Shabaab in eastern Africa andBoko Haram in western Africa. The activities of these groups could disrupt trade, decrease economic
11

confidence and deter international investment which could in turn have a material adverse effect on the Bank’sbusiness, financial condition, cash flows, results of operations and prospects.
In addition, certain regions of Africa may suffer from geopolitical conflict. A number of African states haveunresolved political differences both internally, with surrounding countries and/or internationally. In particular,since January 2011, there have been varying degrees of political instability and public protests within certainNorthern African countries, including Egypt, where the Bank’s headquarters are located, as well as Libya andTunisia. Lingering political tensions have not, in the Bank’s experience, adversely affected the Bank’s decision-making capabilities or the functioning of its operational portfolio to date. However, it is possible that in thefuture such events could have an adverse impact on the political stability and economy of the relevant Africancountries and consequently on the Bank’s results of operations and financial condition. In addition, weaknessesrelating to certain African legal systems and legislation create an uncertain environment for investment andbusiness activity, which could have a material adverse effect on the Bank’s business, financial condition, resultsof operations and prospects.
As the political, economic and legal environments remain subject to continuous development, investors in thesecountries and regions face uncertainty as to the security of their investments. Any unexpected changes in thepolitical or economic conditions in these or neighbouring countries or others in the region may have a materialadverse effect on the Bank’s business, financial condition, cash flows, results of operations and prospects.
Despite the immunities and privileges afforded to the Bank in the Establishment Agreement, the BranchAgreements and the Headquarters Agreement, there can be no guarantee that the Bank’s assets andoperations will not be affected by government intervention or that Participating States will honour theBank’s preferred creditor status
Under the Establishment Agreement, each Participating State has agreed to waive, and refrain from imposing,any administrative, financial or other regulatory restrictions that are likely to hinder in any manner the smoothfunctioning of the Bank or impair its operations. Accordingly, the Bank’s property, assets, operations andactivities are free from restrictions, regulations, supervision or controls, moratoria and other legislative,executive, administrative, fiscal and monetary restrictions of any nature. In addition, Article VIII of theEstablishment Agreement states that “the property and assets of the Bank wherever located and by whomsoeverheld shall be immune from: (a) search, requisition, expropriation, confiscation, nationalisation and all otherforms of seizure, taking or foreclosure by executive or legislative action; and (b) seizure, attachment orexecution before the delivery of final judgment or award against the Bank” and that, without prejudice to suchimmunity, the property and assets of the Bank shall be subject to due legal processes and judicial action takenby ordinary courts of competent jurisdiction.
In relation to tax, Article XIV of the Establishment Agreement exempts the Bank and its property, assets,income, operations and transactions from all taxation and customs duties in each of the Participating States inwhich it operates. In addition, Article VII of the Headquarters Agreement between the Bank and the ArabRepublic of Egypt dated 31 August 1994 (the “Headquarters Agreement”) states that the Bank’s headquartersare inviolable, and that no officer or official of Egypt may enter the headquarters without the consent of thePresident of the Bank. In addition, the Bank has entered into branch agreements (the “Branch Agreements”)with the Participating States of Côte d’Ivoire, Nigeria and Zimbabwe, where its branches are located, whichalso contain material protections for the Bank in line with the Establishment Agreement.
As at the date of this Registration Document, the Bank has not been subject to any violation of the foregoingprovisions. However, there can be no guarantee that such privileges and immunities will continue indefinitely,that a Participating State would not seek to tax the Bank, that such privileges and immunities will not bealtered, or that changes to the government of any Participating State or other factors, such as political unrest,will not adversely affect the privileges and immunities granted to the Bank. Any alteration, suspension orviolation of the Bank’s immunities and privileges and/or unlawful or arbitrary government action in someAfrican states could disrupt the Bank’s operations and have a material adverse effect on the Bank’s business,financial condition, results of operations and prospects.
These accommodations referred to above have allowed the Bank to enjoy a preferred creditor status in theParticipating States and reduced the effect of country risk and moratorium risk on the Bank. Other elements ofpreferred creditor status, including (but not limited to) preferential access to foreign currency in the event of acountry foreign exchange crisis and priority of payment in the event of government shortfalls, are not containedin a treaty, law or contract but reflect the relevance of the Bank to the Participating States and that theParticipating States will likely place priority on honouring commitments (including debt repayments) to theBank over other private or official creditors during times of debt distress. Accordingly, the Bank believes that
12

its exposure to the Participating States subjects it to less risk than its commercial loans. However, there can beno assurance that, during a time of debt distress, the Participating States would always give the Bank priority.Any failure by the Participating States to honour their commitments to the Bank in full at the time that theycome due, and in the absence of realisable security taken by the Bank under the affected transactions, couldhave a material adverse effect on the Bank’s business, financial condition, results of operations and prospects.
There can be no guarantee that the business, operations and financial results of the Bank will not in thefuture be adversely affected by any significant recurrence of unrest in Egypt and other MENA states, or anyspread thereof to other African states where the Bank operates
The majority of the Bank’s business is, and will continue to be, concentrated in African countries outside of theMENA region which, as at the date of this Registration Document, have been unaffected by the various on-going economic and political developments in or affecting the MENA region. This is due to the fact that theBank predominantly conducts its business in its member states and, as at the date of this RegistrationDocument, the only MENA states which are members of the Bank are Egypt, Tunisia and Morocco.
The 2011 revolution in Egypt, which led to the overthrow of former President Hosni Mubarak, did at the timedirectly impact the Bank, by forcing the closure of its Cairo headquarters for five days. However, the Bank didnot experience any material disruption to its operations as a result of this closure, due to having back-upfacilities in the Abuja Branch to which the Bank was able to transfer its headquarter operations and criticalpersonnel. The Bank anticipates that this would again be the case in the event of any recurrence of significantpolitical unrest within Egypt in the future.
Nevertheless, it is not possible to predict the occurrence of events or circumstances such as war, hostilities orpolitical unrest or their impact, and no assurance can be given that the Bank would be able to sustain its currentprofit levels if adverse political events or circumstances were to occur in any of the African states in which ithas significant operations or exposure.
The Bank operates in jurisdictions with risks relating to fraud, bribery, money laundering and corruption
The Bank operates in a number of jurisdictions that have from time to time experienced high levels of fraud,bribery, money laundering and corruption. For example, certain jurisdictions have been allocated low scores onTransparency International’s “Corruption Perceptions Index”. Doing business in developing countries bringswith it inherent risks associated with enforcement of the Bank’s legal and contractual rights and third partyobligations, fraud, bribery, money laundering and corruption.
The Bank has policies and procedures in place and codes of conduct and other safeguards designed to preventthe occurrence of fraud, bribery, money laundering and corruption. See “Risk Management—Anti-MoneyLaundering, “Know-Your-Customer” Checks and Sanctions Compliance—Sanctions Compliance”. Theseinclude policies and procedures designed to assist the Bank in identifying potential investments that areassociated with Politically Exposed Persons (“PEPs”) which are then subjected to heightened scrutiny andadditional due diligence. However, it may not be possible for the Bank to detect or prevent every instance offraud, bribery, money laundering or corruption in every jurisdiction in which it does business or where itsemployees or agents are located. The Bank may therefore be subject to civil and criminal penalties and toreputational damage, any of which could have a material adverse effect on the Bank’s business, financialcondition, results of operations and prospects.
13

IMPORTANT INFORMATION ABOUT THIS REGISTRATION DOCUMENT
No person is or has been authorised to give any information or to make any representation not contained in ornot consistent with this Registration Document and, if given or made, such information or representation mustnot be relied upon as having been authorised by the Bank. No representation or warranty, express or implied, ismade and no responsibility or liability is accepted by any person other than the Bank as to the accuracy,completeness, verification or sufficiency of the information contained herein, and nothing contained in thisRegistration Document may be relied upon as a promise or representation in this respect, as to the past, presentor future. The delivery of this Registration Document shall not, under any circumstances, create any implicationthat there has been no change in the business or affairs of the Bank since the date of this RegistrationDocument or that the information contained herein is correct as of any time subsequent to its date.
A copy of this Registration Document has been filed with, and approved by, the FCA and has been madeavailable to the public in accordance with the Prospectus Regulation Rules. This Registration Document maybe combined with a securities note and summary to form a prospectus in accordance with the ProspectusRegulation Rules. A prospectus is required before an issuer can offer transferable securities to the public orrequest the admission of transferable securities to trading on a regulated market. However, this RegistrationDocument, where not combined with the securities note and summary to form a prospectus, does not constitutean offer or invitation to sell or issue, or a solicitation of an offer or invitation to purchase or subscribe for, anysecurities in the Bank in any jurisdiction, nor shall this Registration Document alone (or any part of it), or thefact of its distribution, form the basis of, or be relied upon in connection with, or act as any inducement toenter into, any contract or commitment whatsoever with respect to any offer or otherwise. The contents of thisRegistration Document are not to be construed as legal, business or tax advice. This Registration Document isnot intended to provide the basis of any credit or other evaluation and should not be considered as arecommendation by any of the Bank, any of the Bank’s advisers or any of their affiliates or representativesregarding the securities of the Bank.
RESPONSIBILITY STATEMENT
The Bank accepts responsibility for the information given in this Registration Document and, to the best of theBank’s knowledge, the information contained in this Registration Document is in accordance with the facts andthis Registration Document makes no omission likely to affect its import.
STATUS OF THE BANK UNDER THE VOLCKER RULE
The Bank is a “covered fund” for purposes of the final rule adopted by the Board of Governors of the FederalReserve System, the Office of the Comptroller of the Currency, the Federal Deposit Insurance Corporation, theSEC and the Commodity Futures Trading Commission, to implement section 13 of the Bank Holding CompanyAct of 1956, as amended, which was added by Section 619 of the Dodd-Frank Wall Street Reform andConsumer Protection Act (the “Volcker Rule”); and the DRs are “ownership interests”, as defined under theVolcker Rule. The Volcker Rule generally prohibits “banking entities” (which is broadly defined to includeU.S. banks and bank holding companies and many non-U.S. banking entities, together with their respectivesubsidiaries and other affiliates) from (i) engaging in proprietary trading, (ii) acquiring or retaining an“ownership interest” in or sponsoring a “covered fund” and (iii) entering into certain relationships with anysuch funds. Any prospective investor, including a U.S. or foreign bank or a subsidiary or other affiliate thereof,should consult its own legal advisers regarding the matters described above and other effects of the VolckerRule.
ENFORCEABILITY OF JUDGMENTS
The Bank is a supranational financial institution organised under an Establishment Agreement, which wasregistered with the United Nations as an international treaty in October 1995. In addition, none of the Board ofDirectors and members of the Bank’s Senior Management is a resident of the United States, and all or asubstantial portion of the assets of the Bank and such persons are located outside the United States. As a result,it may not be possible for investors to effect service of process within the United States upon the Bank or suchpersons or to enforce against any of them in the United States courts judgments obtained in United Statescourts, including judgments predicated upon the civil liability provisions of the securities laws of the UnitedStates or any State or territory within the United States.
14

CAUTIONARY NOTE REGARDING FORWARD-LOOKING STATEMENTS
This Registration Document includes forward-looking statements. The words “anticipate”, “believe”, “expect”,“plan”, “intend”, “targets”, “aims”, “estimate”, “project”, “will”, “would”, “may”, “could”, “continue” andsimilar expressions are intended to identify forward-looking statements. All statements other than statements ofhistorical fact included in this Registration Document, including, without limitation, those regarding the Bank’sfinancial position, business strategy, management plans and objectives for future operations, are forward-looking statements. These forward-looking statements involve known and unknown risks, uncertainties andother factors, which may cause the Bank’s actual results, performance or achievements, or industry results, tobe materially different from those expressed or implied by these forward-looking statements. These forward-looking statements are based on numerous assumptions regarding the Bank’s present and future businessstrategies and the environment in which the Bank expects to operate in the future. Important factors that couldcause the Bank’s actual results, performance or achievements to differ materially from those in the forward-looking statements include, among other factors referenced in this Registration Document:
• political, economic and legal risks and uncertainties in the countries where the Bank operates,
• general economic conditions and slowdown in the economic and business activity of key clients,
• changes in the competitive markets in which the Bank operates,
• disruption or increased costs of financing,
• regulatory changes or costs of compliance with current and future environmental regulations in thejurisdictions where the Bank operates,
• availability and costs of financing,
• exchange rate fluctuations,
• the creditworthiness of the Bank’s customers,
• litigation the Bank may be involved in from time to time,
• trade restrictions or other changes to economic policy in countries in which the Bank operates,
• the Bank’s debt service obligations,
• risks associated with the Bank’s capital structure,
• the Bank’s ability to raise future financing, and
• force majeure and other unforeseeable events.
Additional factors that could cause actual results, performance or achievements to differ materially include, butare not limited to, those discussed under “Risk Factors” and “Operating and Financial Review”. Forward-looking statements speak only as of the date of this Registration Document and the Bank expressly disclaimsany obligation or undertaking to publicly update or revise any forward-looking statements in this RegistrationDocument to reflect any change in the Bank’s expectations or any change in events, conditions orcircumstances on which these forward-looking statements are based unless required to do so by applicable law,the Prospectus Regulation Rules, the Listing Rules, the Disclosure Guidance and Transparency Rules of theFCA or EU Market Abuse Regulation (EU) 596/2014. Given the uncertainties of forward-looking statements,the Bank cannot assure you that projected results or events will be achieved and the Bank cautions you not toplace undue reliance on these statements.
15
PRESENTATION OF FINANCIAL AND OTHER INFORMATION
Presentation of Financial Information
The financial information of the Bank set out in this Registration Document as at and for the years ended31 December 2016, 2017 and 2018 has, unless otherwise stated, been derived from the special purpose auditedfinancial statements of the Bank as at and for the years ended 31 December 2016 and 31 December 2017 (the“2016-2017 Special Purpose Financial Statements”) and as at and for the years ended 31 December 2017 and31 December 2018 (the “2017-2018 Special Purpose Financial Statements”, and together with the 2016-2017Special Purpose Financial Statements, the “Annual Special Purpose Financial Statements”). The AnnualSpecial Purpose Financial Statements were prepared in accordance with IFRS as issued by the InternationalAccounting Standards Board (“IFRS”). The selected condensed interim special purpose financial informationof the Bank set out in this Registration Document as at and for the six months ended 30 June 2018 and 30 June2019 has, unless otherwise stated, been derived from the unaudited condensed interim special purpose financialstatements of the Bank as at and for the six months ended 30 June 2018 and 30 June 2019 prepared inaccordance with the International Accounting Standard 34, Interim Financial Reporting (“IAS 34”) (the“Condensed Interim Special Purpose Financial Statements” and, together with the Annual Special PurposeFinancial Statements, the “Special Purpose Financial Statements”). The Special Purpose FinancialStatements, together with the related reports, are set forth on pages F-2 to F-145 in this Registration Document.
With effect from 1 January 2018, the Bank adopted IFRS 9, Financial Instruments (“IFRS 9”) and IFRS 15,Revenue from Contracts with Customers (“IFRS 15”). The Bank has determined that the adoption of IFRS 15did not have a material impact on the Special Purpose Financial Statements. The impact of the adoption ofIFRS 9 as at 31 December 2017 was reflected in the retained earnings as at 1 January 2018 as allowed as a firsttime implementation in accordance with IFRS. Any adjustment to account for changes between IAS 39,Financial Instruments: Recognition and Measurement (“IAS 39”) and IFRS 9 at the transition date wererecognised in the opening retained earnings and other reserves of the 2017-2018 Special Purpose FinancialStatements. The 2016-2017 Special Purpose Financial Statements have not been restated to reflect the changesfrom the application of IFRS 9. The 2016-2017 Special Purpose Financial Statements applied IAS 18, Revenue(“IAS 18”) and IAS 39, which were the accounting standards in effect at the time of preparation of the 2016-2017 Special Purpose Financial Statements. Therefore, due to the adoption of IFRS 9 and IFRS 15, the 2017-2018 Special Purpose Financial Statements are not directly comparable with the 2016-2017 Special PurposeFinancial Statements.
The Bank has applied IFRS 16 from its mandatory adoption date of 1 January 2019. The Bank has applied it ina practical expedient manner on initial application. Where the lease term is less than 12 months or leases are oflow value items, the Bank has elected to use the short-term lease exemption. The Bank’s activities as a lessor /lessee are not material.
Independent Auditors
As at the date of this Registration Document, the auditors of the Bank are KPMG Hazem Hassan of SmartVillage—Building 105, Km 28 Cairo Alex Desert road, Giza, Egypt (certified Public Accountants and amember of the International Federation of Accountants) (“KPMG”).
The Annual Special Purpose Financial Statements included in this Registration Document have been audited byKPMG, independent auditors, as stated in their reports appearing herein and which include emphasis of matterparagraph drawing attention to the basis of preparation of the Special Purpose Financial Statements andrestriction of use of the report.
With respect to the Condensed Interim Special Purpose Financial Statements, KPMG reported that they appliedlimited procedures in accordance with professional standards for a review of such information. However, theirseparate report, included herein, states that they did not audit and they do not express an opinion on thatinterim financial information. Accordingly, the degree of reliance on their report on such information should berestricted in light of the limited nature of the review procedures applied. See also “—Review of CondensedInterim Special Purpose Financial Statements”.
Currency
Throughout this Registration Document, unless stated otherwise, the following definitions are used:
• “€”, “EUR” or “euro” means the lawful currency for the time being of the member states of the EuropeanUnion that adopted the single currency in accordance with the Treaty of Rome establishing the EuropeanEconomic Community, as amended;
16
• “U.S.$”, “U.S. Dollar” or “dollar” means the lawful currency for the time being of the United States ofAmerica, its territories and possessions;
• “£”, “GBP” or “Sterling” means the lawful currency of the United Kingdom; and
• “LE” or “livre égyptienne” means the lawful currency of the Arab Republic of Egypt.
Rounding
Some numerical figures included in this Registration Document have been subject to rounding adjustments.Accordingly, numerical figures shown as totals in certain tables may not be an arithmetic aggregation of thefigures that preceded them. Unless otherwise specified, all percentages have been rounded to the nearest one-tenth of one per cent.
Information Derived from Third Parties
The Bank has derived certain information and statistics in this Registration Document from third parties,including from the World Bank, Statistics South Africa, the Bank of England and the Organisation forEconomic Co-operation and Development. Such information is contained in this Registration Document underthe headings “Presentation of Financial and Other Information”, “Risk Factors”, “Business” and “Operatingand Financial Review”. Where third-party information, data or statistics are set out, their source has beenidentified, they have been accurately reproduced, and, as far as the Bank is aware and is able to ascertain fromrelevant available information published by the aforementioned sources, no facts have been omitted whichwould render the reproduced information, data and statistics inaccurate or misleading.
Investors should keep in mind that none of the Bank or the Managers have independently verified informationobtained from third-party sources. Furthermore, measures of the financial or operating performance of theBank’s competitors used in evaluating the Bank’s comparative position may have been calculated in a differentmanner to the corresponding measures employed by the Bank.
Moreover, the Bank has relied on official statistics and other data published by central banks, governments andnon-governmental agencies in Africa, which may be substantially less complete or researched and,consequently, less reliable than those published by comparable bodies in other developed jurisdictions.Official data in most of these economies mainly reflects the state of the formal economy and may notadequately gauge the potential of the informal economy. In addition, some or all of the entities in Africa mayhave official data collection methods that are different from those used by comparable bodies in otherjurisdictions. There can be no assurance that these statistics are as accurate or as reliable as those published bymore developed countries and that discussions of matters relating to the Bank’s operations may therefore besubject to uncertainty due to concerns about the completeness or the reliability of available official and publicinformation.
17
DIVIDEND POLICY
Dividend Policy
Shareholder remuneration is one of the priorities of the Board of Directors, in order to ensure adequate returnson shareholder investment. The Bank considers this remuneration to be a fundamental element in cultivatingshareholder loyalty and creating a shareholder body that is committed to long-term investment in the Bank.Based on the foregoing, the dividend policy aims to set out the basic criteria and principles governingresolutions on shareholder remuneration that the Board of Directors will submit to the shareholders for approvalin General Meeting and, where applicable, resolutions on interim dividends will be approved by the Board ofDirectors.
Furthermore, in order to secure a sustainable capital and liquidity generation model, the Bank’s Board ofDirectors’ resolutions on distribution of dividends will respect the principles of proportionality of paid-upcapital, transparency and sustainability. The resolutions will also promote equal treatment of shareholdersholding the same status, while also ensuring that the dividend agreed is reasonable in light of the Bank’searnings for the year, its solvency ratios, its business activity and the total remuneration received by the Bank’sshareholders. The shareholders in General Meeting are entrusted with approving the distribution of dividendsagainst profits for the year or against unrestricted reserves, if (i) equity is not, or, as a result of the distribution,does not fall below the Bank’s capital and, in any case, remains within the capital adequacy ratios applicable tothe Bank as a credit institution; and (ii) the amount of available reserves is not lower than the amount ofresearch and development expenses recognised on the Bank’s balance sheet.
Unless the prevailing economic, financial or business circumstances justify a modification of this guideline, theBank will allocate between 20% and 26% of its profit to cash remuneration for shareholders in the mediumterm. Investors will receive their dividend proportionally to the percentage of their shares paid.
Dividends Paid
In respect of 2018, the Bank paid a dividend of U.S.$69.0 million, which amounted to U.S.$2,527 per ClassD Share or U.S.$0.252 per DR (2017: U.S.$57.5 million, which amounted to U.S.$2,255 per Class D Share orU.S.$0.2255 per DR; 2016: U.S.$38.0 million (no Class D Shares or DRs in issue)). The Special PurposeFinancial Statements do not reflect the dividend paid in respect of 2018, which will be accounted for as anappropriation of retained earnings for the year ending 31 December 2019.
18
MACROECONOMIC ENVIRONMENT
Consistent with global output developments, the rate of real GDP growth in Africa is estimated to haveamounted to 3.4% in 2018 compared with 3.5% in 2017 and 2.9% in 2016. The continent’s growth has beenspurred by a number of factors, including:
• Africa’s increasingly more diversified sources of growth, including: (i) a growing middle-class that isdriving increasing domestic demand and investment and (ii) an improving business and macroeconomicenvironment;
• strong private investment including cross-border investment and growing infrastructure investment insupport of structural transformation;
• a deepening process of regional and continental integration which is driving intra-African trade and, in theprocess, expanding regional markets and sustaining faster growth recovery in investments, especiallyamong non-resource—intensive economies;
• diversification of Africa’s export destinations and increasing Africa-South trade (i.e. Africa’s trade withdeveloping countries) that mitigates exposure to global volatility;
• continued expansion in service sectors, including telecommunications, banking and housing andconstruction;
• continued improvement in the quality of governance and institutions, as well as in the investment climate;
• growth in migrant remittances to Africa, which now exceed official development aid provided to thecontinent and are supporting stabilisation of consumption as well as investment; and
• improvement in commodity terms of trade, which is strengthening external balances in highly-dependentnatural resource countries and mitigating the risk of macroeconomic challenges.
In a generally favourable global economic environment of synchronised global growth acceleration andstrengthening commodity prices and global demand, the output expansion across the continent during theperiod under review was largely driven by investments in large-scale projects in energy, telecommunications,transport, construction and tourism infrastructure, especially in net oil-importing countries, some of whichposted impressive rates of economic growth, and strengthening commodity prices in a region where net oil-exporting economies account for a sizable share of aggregate GDP. This growth has also been supported byongoing efforts to reduce over-dependence on natural resources and commodities by expanding value additionand export diversification.
Notwithstanding the decelerating global growth in a challenging global economic environment, the real GDPgrowth of African economies expanded by 3.4% in 2018, compared with 3.5% in 2017. Africa emerged as thesecond fastest growing region in the world, highlighting the continued resilience of its economies to negativeshocks and global volatility. The strengthening economic performance is a reflection of increasing investmentand public and private consumption spurred by softening inflation and expanding urban populations, and anincreasingly favourable domestic environment of strengthening economic recovery, both in large and hard-hitnatural resource-dependent economies. Additionally, the commitment to macroeconomic stability, which hasbecome the anchor of economic growth within the region, is increasingly mainstreamed in policymaking, with agrowing number of countries undertaking difficult economic reforms to improve the business environment,raise fiscal buffers, and boost private investment.
Furthermore, the resilience of African economies on a rather volatile global growth trajectory is also areflection of increasing diversification of trading partners in a changing global economic and trade landscape,where South-South trade has become a key driver of global trade and growth. The deepening trade ties betweenChina and Africa enabled the latter to sustain robust economic growth in the aftermath of the 2008—2009global financial crisis, when numerous European countries, which for decades had been Africa’s main tradingpartners, were going through a protracted cycle of deflation—the consequence of lingering fiscal and sovereigndebt crises.
Economic growth varied widely across countries and across the continent’s five sub-regions. East Africaremained the second-fastest-growing sub-region in the continent, with estimated real GDP growth of 4.0% in2018, up from 3.9% in 2017. Growth in the sub-region was broad-based, with many countries, includingDjibouti, Ethiopia, Kenya, Rwanda, Tanzania, and Uganda, growing at an average of approximately 5.0% realGDP growth in 2018. Across the sub-region, infrastructure investment and construction remain the key driversof growth. At the same time, continued expansion of services, including information and communicationstechnology, has been key to the economic fortunes of several countries in the sub-region, while expanding
19

manufacturing output in Kenya, Tanzania, and Rwanda has been another growth enhancer, boosting trade andaccelerating the process of export diversification. However, in several countries, notably Burundi and Comoros,growth remained weak due to political uncertainty, while in South Sudan, ongoing socio-political conflictsundermined growth prospects.
West Africa, including Nigeria, Senegal, Ghana and Côte d’Ivoire, was the fastest-growing sub-region withinthe continent during the periods under review. The recovery in Nigeria, the largest economy in the sub-regionand one of the largest across the continent, lifted overall economic expansion, with the sub-region achieving aGDP growth rate of 5.0% in 2018, compared to 5.4% in 2017. The recovery also reflected the broad-basednature of economic expansion across the sub-region, where growth has been driven by both resource- and non-resource intensive economies. The sub-region has some of the fastest growing economies in the world,including Côte d’Ivoire, Ghana and Senegal, all of which achieved an average economic growth rate above5.5% in 2018. These countries were among the strongest drivers of economic growth within the sub-region andacross the continent.
North Africa, including Egypt, Morocco, Algeria and Tunisia, was the third-fastest-growing sub-region withinthe continent in 2018. It achieved a GDP growth rate of 3.2%, consistent with the performance in 2017.Egypt’s economy, the largest in the sub-region and one of the most diversified across the whole continent,provided a major boost, with a GDP growth rate of 5.3% in 2018. Other major contributors to output expansionin the sub-region included Libya, where the recovery in oil production sustained economic expansion, with thecountry posting a GDP growth rate of 17.9% in 2018. Though much lower, economic growth in othercountries, most notably Morocco and Tunisia, positively contributed to overall growth in the sub-region. InMorocco, agricultural production and extractive industries drove GDP growth to 3.0% in 2018, while Tunisiaachieved a GDP growth rate of 2.5%, up from 2.0% in 2017.
Southern Africa, South Africa, Mauritius, Botswana, Zimbabwe, Namibia and Madagascar emerged as thefourth-fastest-growing sub-region within the continent during the periods under review. Though still largelybelow potential, GDP growth reached 2.3% in 2018. The weak growth performance achieved by the sub-regionis largely due to the weak growth in South Africa—the largest economy in the sub-region and mostsophisticated economy across the continent. After slipping into a recession in the second half of 2018, theSouth African economy achieved an overall GDP growth rate of 0.8% in 2018, down from 1.4% in 2017.While challenges faced by other countries in the sub-region—most notably Zimbabwe, where GDP growthdecelerated to 0.9% in 2018 from 4.7% in 2017, and Eswatini, with 0.2% GDP growth in 2018—dented growthprospects in the sub-region, the strong growth performance in Mauritius and Botswana set the sub-region on anaccelerated growth trajectory during 2018.
Central Africa, including Angola, Chad, Republic of Congo, Equatorial Guinea, and Gabon, remained thelagging sub-region within the continent, posting an economic growth rate of just 1.84% in 2018, albeit up from0.59% in 2017. Nevertheless, a recovery—largely due to improving commodity terms of trade in a sub-regionwhere the majority of countries are net oil-exporters—set the sub-region on an accelerated growth trajectory.The slow recovery in oil prices in 2018 provided a boost to a number of countries, including Angola, Chad,Republic of Congo, Equatorial Guinea, and Gabon, where oil exports account for more than 80% of aggregateforeign exchange earnings. However, in addition to vulnerabilities to adverse commodity terms-of-trade shocks,a few countries within the sub-region, most notably Chad and Cameroon, have been mired in conflict andinsecurity, which could derail the process of economic recovery.
Commodity markets were generally weaker in 2018, with prices, according to the Bloomberg Commodity(BCOM) index, ending the year more than 13% lower than at the close of 2017. Still, commodities enjoyedbouts of strength, particularly during the first half of the year, principally due to the rally in oil markets asgeopolitical tensions raised concerns over possible supply disruptions, causing the BCOM Index to peak at 91.5in May 2018, 5% above its level at the start of the year. Outside these price-supportive events, the backdrop forcommodity markets in 2018 was generally sluggish as high inventories, combined with weakerdemand—within the context of rising trade tensions and higher interest rates—led to a severe decline in theBCOM index, which closed the year at its lowest point since January 2016.
In energy markets, unprecedented cooperation among oil producing countries—OPEC and its allies—to reducesupplies in the market, coupled with supply disruptions and falling US inventories, was supportive of prices inthe early part of the year. However, expanded output from Libya, the suspension of strike action by Nigerianoil workers, and continuing output from US shale producers created downward pressure on prices. As such, oilprices plummeted in the fourth quarter of the year, with Brent oil ending the year 24% lower compared withprices at the end of December 2017.
20

The decline in oil prices was also attributable to expectations of weaker global demand, with both OPEC andthe International Energy Agency lowering their 2019 forecasts for oil demand on account of the trade warbetween the United States and China as well as tighter monetary policy and the synchronised growthdeceleration in some advanced and developing market economies. In addition, the US decision to grant waiversto eight countries to continue importing oil from Iran helped ease supply constraints, as did forecasts for highernon-OPEC supply, particularly from US shale. In Africa, higher output, as a result of an increase in the numberof oil and gas rigs, further compounded concerns of oversupply in the global market.
The value of intra-African trade posted strong growth in 2018, rising by 19.5% to U.S.$156 billion, partly dueto an increase in the prices of commodity exports traded within the region, but also on account of consistentand resilient demand for manufactured goods from leading industrialised economies, such as South Africa andEgypt. In the midst of an overall increase in intra-African trade, important variations persist.
The continued expansion of intra-African trade is the result of the firm commitment by African governmentsand policymakers who have made regional integration and intra-African trade strategic priorities, especiallyfollowing the adoption of the African Union’s Action Plan for Boosting Intra-African Trade (BIAT) and theAction Plan for Accelerated Industrial Development in Africa (AIDA) under the African Union long-termdevelopment strategy: Agenda 2063. More recently the commitment towards deepening the process ofeconomic integration was illustrated by the signing of the agreement establishing the African Continental FreeTrade Area (AfCFTA) in the first quarter of 2018. More than rationalising existing Africa’s regional tradearrangements to deepen economic integration and draw on economies of scale and development of regionalvalue chains to accelerate the process of structural transformation of African economies, the AfCFTA willultimately emerge as the largest free trade area created since the formation of the World Trade Organization(WTO). It will bring together 55 African countries with a combined population of 1.2 billion people and acombined gross domestic product (GDP) in excess of U.S.$2.5 trillion.
Across Africa, average inflation declined from 11.2% in 2017 to 8.9% in 2018. However, the decelerating rateof inflation across the continent masks important variations across countries. Double-digit inflation rates wereevident in several countries, both large and small, and especially in conflict-affected countries. In particular,among the large economies, Angola recorded an inflation rate of 19.6% in 2018, while Sudan recorded 63.3%.Rates approaching hyper-inflation were seen in conflict-affected countries, such as South Sudan, whereinflation reached 83.5% in 2018.
Inflationary pressures decelerated in North Africa, where average rates of inflation decreased to 10.0% in 2018from 11% in 2017. These developments reflect the improving inflationary outlook in a number of largeeconomies, most notably Egypt, where the rate of inflation fell to 20.9% in 2018, down from 23.5% in 2017.The inflationary outlook will also depend on developments in Sudan, where inflationary pressures have been onthe rise, prompting public protests.
Inflationary pressures eased in Southern Africa, falling from 7.9% in 2017 to 6.5% in 2018. Price levels withinthe sub-region were influenced by a general price reduction in Angola (from 29.8% to 19.6%) andMozambique (15.1% to 3.9%). The average rate of inflation in West Africa increased to 6.0% in 2018,marginally up from about 5.6% in 2017, driven mainly by inflationary pressures from Ghana (9.8%) andNigeria (12.1%).
The average rate of inflation in East Africa fell to an estimated 14.7% in 2018, compared with 22.1% in 2017,driven by easing inflationary pressures in Kenya—the sub-region’s largest economy—where inflation declinedfrom 8% in 2017 to 4.7% in 2018. The average rate of inflation in Central Africa increased to an estimated6.4% in 2018, up from 6.9% in 2017.
For further information, see “Risk Factors—Risks relating the Bank’s focus on Africa”.
21
BUSINESS
Overview
Afreximbank is a supranational financial institution whose purpose is to facilitate, promote and expand intra-and extra-African trade. The Bank was established under the Establishment Agreement between 25 Africanstates and three multilateral institutions, made in Abidjan, Côte d’Ivoire on 8 May 1993. Since then, a further26 African states and two multilateral institutions have acceded to the Establishment Agreement (states thathave signed or subsequently acceded to the Establishment Agreement are referred to herein as “ParticipatingStates”), as a result of which there are now 51 Participating States. Pursuant to the Establishment Agreement,the Bank is an international institution with full legal personality under the laws of each of the ParticipatingStates. The Bank operates in accordance with the provisions of the Charter, which derives its legal force fromthe Establishment Agreement.
The Bank’s specific functions include: extending credit to eligible African exporters by providing pre- andpost-shipment finance; extending indirect credit to African exporters and importers of African goods throughthe intermediary of banks and other African financial institutions; leveraging external financing throughsyndication; promoting and financing trade between African states and other developing states; acting asintermediary between African exporters and African and non-African importers through the issuance of lettersof credit, guarantees and other trade documents in support of export-import transactions; promoting andproviding insurance and guarantee services covering commercial and non-commercial risks associated withAfrican exports; providing capital to African exporters through equity investments; and carrying out marketresearch and providing auxiliary services aimed at expanding the international trade of African countries andboosting African exports.
The Bank’s vision is to be the trade finance bank for Africa, and its mission is to stimulate the consistentexpansion, diversification and development of African trade, particularly intra-African trade, while operating asa best-in-class, profit-oriented, socially responsible financial institution and a centre of excellence in Africantrade matters. The Bank aims in time to increase the number of Participating States to include all 55 sovereignAfrican nations.
Afreximbank’s role as a public-private partnership with a special development mandate has shaped its businessmodel since inception, enabling the Bank to operate commercially while also benefitting from strong riskmitigation buffers and sovereign support / protection. While the Bank pursues policy objectives of expandingand diversifying African trade finance, it effectively operates as a commercial, profit-oriented organisation.Notwithstanding the number of governments and central banks that are members of the Bank, the Charter ofthe Bank provides that, when the authorised share capital of the Bank is fully subscribed, up to 65% of theBank’s share capital can be offered and held by (i) national financial institutions, (ii) international financialinstitutions and economic organisations, (iii) non-regional financial institutions and non-African privateinvestors and (iv) any person who does not fall under the aforementioned categories. As at the date of thisRegistration Document, the authorised share capital of the Bank is not fully subscribed.
The Bank’s management believes that Afreximbank is the preferred partner in major syndicated tradefinancings in Africa. For example, during the year ended 31 December 2018, the Bank was the mandated leador co-lead arranger of 19 syndicated transactions totalling U.S.$9.56 billion. The Bank’s participation in thosesyndicated deals amounted to U.S.$2.76 billion and, for every U.S.$1.00 of funding committed by the Bank,the Bank’s estimates show that it was able to attract approximately U.S.$3.50 of financiers commitments insyndicated transactions to support trade and bankable trade-related projects in Africa. The Bank is in a positionto act as lender of record, thereby enabling private banking partners to avoid stamp duties and to mitigatecountry risk in Africa. Moreover, the Bank has demonstrated its ability to pioneer products across the continentin line with government policies, for example to promote local content for Africa’s extractive industries, tofacilitate migrant remittances, and to design and implement specific country programmes, such as the CountryAssistance Programme in Zimbabwe, the Republic of Sudan and Côte d’Ivoire to support the economicrecovery plans in those countries and their import of essential goods and development of key trade-relatedinfrastructures.
For the year ended 31 December 2018, the Bank’s profit for the year was U.S.$275.9 million(2017: U.S.$220.5 million). As at 31 December 2018, the Bank’s total assets were U.S.$ 13,419.4 million(31 December 2017: U.S.$11,913.5 million). As at 31 December 2018, the Bank’s CET1 ratio was 23.9%(31 December 2017: 25.5%). For the year ended 31 December 2018, the Bank’s cost to income ratio was17.9% (31 December 2017: 17.9%).
22

Strengths
Strong secular growth drivers compounded by the booming African population and trade dynamics
The Bank’s business is focused on the African market, where it covers 51 of the 55 countries in Africa. TheAfrican economy is supported by rapid urbanisation, a growing middle class, private consumption drivengrowth as well as increasing inflows of foreign direct investments, and has demonstrated strong real GDPgrowth, which reached 3.4% in 2018, according to the IMF. Africa’s population of 1.2 billion in 2018 isexpected to reach 2.0 billion by 2050, based on the 2019 UN Population Division Report. The United Nationshas projected that the population of sub-Saharan Africa will double by 2050, a 99% increase.
The following table presents real and nominal GDP growth by geography in Africa for the year ended31 December 2018:
For the Year Ended 31 December 2018Real GDP growth Nominal GDP
(%) (U.S.$bn)West Africa . . . . . . . . . . . . . . . . . . . . . . . . . . . . . . . . . . . . . . . 5.0 641East Africa . . . . . . . . . . . . . . . . . . . . . . . . . . . . . . . . . . . . . . . 4.0 233North Africa . . . . . . . . . . . . . . . . . . . . . . . . . . . . . . . . . . . . . . 3.2 539Southern Africa . . . . . . . . . . . . . . . . . . . . . . . . . . . . . . . . . . . . 2.3 629Central Africa . . . . . . . . . . . . . . . . . . . . . . . . . . . . . . . . . . . . . 1.8 129Africa total . . . . . . . . . . . . . . . . . . . . . . . . . . . . . . . . . . . . . . . 3.4 2,171
Growth within Africa is concentrated in the West, East and North regions, with Southern and Central Africaexperiencing GDP growth of less than 3% in 2018. The Bank believes that it is well positioned to benefit fromthis growth, as 83% of the loans and advances to customers were to borrowers from the West, East and Northregions as at 31 December 2018.
In addition, the African continent has strong potential to increase its trade flows in line with its populationgrowth, having contributed 3% of global trade in 2017, based on Africa Trade Report 2019. One of the keydrivers of Africa’s trade growth is envisaged to be intra-African trade. According to the IMF Direction of TradeStatistics, in 2018, intra-African trade improved to approximately 16% of total African trade; however, theshare is still far below the levels of other major trade alliances. Intra-African trade is expected to be furthersupported by the creation of the African Continental Free Trade Area (AfCFTA), effective since May 2019, thelargest free trade area created since the formation of the World Trade Organization (WTO).
The African Development Bank estimated that there is a U.S.$110 billion annual shortage of trade financing inAfrica, and the Bank believes it is well positioned to capitalise on this substantial growth opportunity.
Supranational status with a low-risk proposition supported by special privileges and immunities
Under the Establishment Agreement, each Participating State has agreed to waive, and refrain from imposing,any administrative, financial or other regulatory restrictions that are likely to hinder in any manner the smoothfunctioning of the Bank or impact its operations. As a result, the Bank’s property, assets, operations andactivities are free from restrictions, regulations, supervision or controls, moratoria and other legislative,executive, administrative, fiscal and monetary restrictions of any nature in Participating States.
The Bank is also exempt from all taxation and custom duties, and the Bank believes that it benefits frompreferred creditor status, which has been demonstrated in certain situations where certain Participating Stateshave prioritised payments to the Bank and provided access to currency exchange for the Bank’s borrowers. Formore information, see “Regulation and Status”.
Well-established public-private partnership model with strong international strategic alliances
The dual nature of the Bank as a for-profit organisation with a development agenda benefits its shareholders.The public mandate of the Bank has allowed it to build strong relationships with the Participating States andobtain preferential access to a wide range of transactions, enabling the Bank to focus on the most lucrativeopportunities in a return-conscious and commercial manner. As of the date of this Registration Document, theBank has approximately U.S.$40 billion of potential bankable projects or transactions in its current pipeline,including the deals under review based on received applications, with a stated goal to disburse U.S.$25 billionof financing over the 2017—2021 period, in line with its Strategic Plan (see “Strategic Planning”).
23

Furthermore, the Bank’s strong connections with the Participating States have allowed it to achieve healthyprofits and assets growth even in challenging macroeconomic environments, including, for example, in 2015and 2016, when a collapse of commodity prices caused a slowdown of economic activity in Africa and adecline in real GDP growth to 2.9% and 2.8%, respectively, compared to 3.9% in 2014.The Bank’s total assetsin 2014, 2015 and 2016 were U.S.$5.19 billion, U.S.$7.13 billion and U.S.$11.73 billion, respectively, showingan asset growth of 37.4% in 2015 and 64.5% in 2016. During this period, the Bank set up a new program, theCounter-Cyclical Trade Liquidity Facility (“COTRALF”), a two-year emergency facility provided to membercountries and aimed at supporting their liquidity. U.S.$9.5 billion of the program was utilised by theParticipating States in total, with all borrowed amounts repaid without any non-performing exposures created.
The Bank constantly explores ways to cooperate with other development and commercial banks to supportAfrican trade. In addition to risk sharing and co-financing, the strategic partnerships have provided theopportunity for knowledge sharing and technology transfers, both essential for growth and in transitioningtowards a knowledge economy (see “Strategic Partnerships”).
Innovative and diverse products suite offering access to new sources of revenues
The Bank’s offering is divided into three broad categories: credit, risk-bearing and fee income products. Coreproducts that the Bank offers to support trade finance transactions include direct financing, syndication,guarantees, insurance and advisory services (see “The Bank’s Programmes and Facilities”). Beyond the Bank’straditional products, the Bank has been innovative in its product initiatives and has consistently created newofferings to satisfy specific client needs. The table below sets forth selected examples of the new productscreated by the Bank:
Initiative type Initiative name Description
Emergency liquidity lines Countercyclical TradeLiquidity Facility
• Large scale facilities implemented between 2015-2017• Response to 2014 crash of the commodity cycle• Resulted in 10 new countries joining the Bank as a
Participating State
Payments Pan-African Paymentand SettlementSystem
• Designed to formalise cross-border trade, address paymentchallenges and reduce costs of completing trade
• To start implementation in test regions in the fourth quarterof 2019
Private Equity Fund For ExportDevelopment
• Co-invest into trade-focused companies across all marketsegments
• Includes start-ups, SMEs and mature companies
Guarantees AfreximbankGuarantee Program
• Products range from short term-trade guarantees and workingcapital solutions to bond facilities for export and trade
• Caters to mid-cap entities and SMEs
Funding Central BankDeposit/Investmentprogramme
• Aims to harness Africa’s FX reserves and support thecontinent’s trade and economic development
Due Diligence MANSA • Centralised African customer due diligence repositoryplatform
• First digital customer due diligence platform in Africa• Provides relevant information for the due diligence process
of potential business partners to African organisations fora fee
Trade Information Trade InformationPortal
• Provision of data of trade, financial sector, commoditymarket and country reports, aimed at bridging the trade andmarket information gap in Africa
Highly efficient operations driven by a lean wholesale banking model and the use of trade financeintermediaries
The Bank exhibits a high level of operating efficiency compared to its peers driven by its mainly branchlesswholesale banking proposition and nimble operations. For example, the Bank’s cost-to-income ratio reached17.9% in 2018, which positions the Bank favourably compared (i) to a median 53.3% cost-to-income ratio ofselected listed corporate pan-African banks (Absa, Nedbank, CIB, Banque Centrale Populaire, BMCE,Guaranty Trust Bank, Zenith Bank, Equity Bank, Banque Marocaine pour le Commerce et l’Industrie, CreditAgricole Egypt, Ecobank Transnational, BIAT, United Bank for Africa and Standard Chartered Ghana), and(ii) to a median 37.8% cost-to-income ratio of selected LSE listed emerging market banks (NLB, Halyk Bank,
24

Bank of Georgia, TBC and Atlas Mara) and a 38.3% cost-to-income ratio of Bladex, the only listeddevelopment finance institution (NYSE: BLX).
Strong and liquid balance sheet profile with a robust capital position
The Bank’s prudent approach to risk management is an integral part of the Bank’s organisation and culture. TheBank’s consistent focus on risk management has resulted in low levels of loan losses and generally high assetquality. As at 31 December 2018, the Bank’s non-performing loan ratio, defined as impaired loans over grossloans and advances (loans and advances at amortised cost and fair value through profit or loss), was 2.95%. Asat 31 December 2018, the Bank had a comfortable liquidity position with relatively long-term liabilitiescovered by shorter-term assets, in particular cash and trade finance loans. As at 31 December 2018, the Bankhad U.S.$9.38 billion of assets maturing within 12 months and U.S.$4.85 billion of liabilities (due to banks,debt securities and deposits and customers accounts) maturing within one year.
The Bank is well capitalised, with a CET1 ratio of 24% calculated under Basel II and a capital adequacy ratioof 25% as at 31 December 2018, significantly above its internal target capital adequacy ratio of 20%. As anadditional buffer, as at 31 December 2018, the Bank had U.S.$873 million of callable capital, which could becalled in the event of capital shortages. The Bank credit-enhanced U.S.$621 million of its callable capital as at31 December 2018 with insurers rated at least “A” and plans to increase the amounts insured as more Africansovereigns become its shareholders. The basic terms of this insurance provide that in the event a call on theuncalled portion of the equity is made, and a shareholder covered by the insurance defaults on their paymentcommitment, the insurer would make the payment due by the defaulting shareholder.
Consistent track record of earnings supporting tax-free dividends
The Bank’s low-risk balance sheet growth coupled with a rigorous focus on cost and efficiency has led toconsistently solid financial performance, with a compound annual growth rate of 24.5% in operating incomefrom 2014 to 2018 and return on average equity surpassing 11% each year from 2014 to 2018.
The Bank’s robust financial performance has allowed a growing dividend over the same period, maintaining anaverage annual payout ratio of 24% since 2014.
High standards of corporate governance and experienced management team
The Bank has a strong governance structure in place, which is overseen by its Board of Directors. The Board ofDirectors consists of 12 members, four of whom represent the Class A shareholders, four of whom representthe Class B shareholders, two of whom represent the Class C shareholders and two of whom are IndependentDirectors. All board members have equal voting power and decisions are made by simple majority. To ensurethat individual countries cannot influence the decisions of the Bank, none of the directors of any class may beof the same nationality. All board members are technically independent of their nominating institutions as theycease to represent the institution when elected and represent the class of shareholders as a whole. In addition,there are two independent directors who do not represent any class of shareholders.
The Bank’s senior management team is highly experienced in banking and trade finance activities with aproven track record and deep knowledge of the institution and the continent. The management team hassuccessfully delivered on the strategy, evidenced by consistent generation of net profit in each year sinceinception. Dr. Benedict Oramah, the President, has been with the Bank for over 25 years. The three EVPs shareon average 19 years tenure at the Bank, with 27 years of overall average experience in the banking sector. Formore information on the background and qualifications of each of the members of the management team andBoard of Directors, see “—Senior Management of the Bank” and “—Board of Directors”.
Strategy
The Bank’s strategy is focused on four main pillars:
• Intra-African Trade: the Bank aims to promote and finance intra-African trade as well as coordinate thekey players in intra-African trade;
• Industrialisation and Export Development: the Bank seeks to promote investments in infrastructuredevelopments, finance and support activities that improve efficiency and quality in production andfacilitate trading through financing and supporting institutions that provide market access;
25

• Trade Finance Leadership: the Bank’s focus is on bridging the gap created by reduced activities orlimitation of international banks, expanding existing trade finance products as well as innovate andfocusing on improving the capacity of Africans in the area of trade finance; and
• Financial Soundness and Performance: the Bank aims to ensure it attains the requisite size and financialsoundness to be able to meaningfully impact African trade, focus on equity mobilisation, ensure equitycapital is efficiently utilised through capital management and focus on liability management.
For more information, see “—Strategic Planning”.
History of Afreximbank
In June 1987, the African Development Bank’s (“AfDB”) annual meeting adopted a resolution authorising astudy (the “Study”) by its management into the establishment of an African Export-Import Bank. The Studywas launched in October 1987 under the auspices of the AfDB and financed by the United NationsDevelopment Programme. Part of the rationale for initiating the Study was the noted difficulties faced byDevelopment Finance Institutions (“DFIs”) during the global economic crises of the 1980s and the consensusthat a multilateral institution was required that brought together both states and public and private internationalfinancial institutions to promote and develop African trade finance through commercial approaches.
On completion of the Study, the AfDB’s board of directors approved the participation of the AfDB in theequity capital of Afreximbank and authorised its management to initiate formal consultations with prospectiveshareholders. The first consultative meeting of such potential shareholders took place in Cairo in January 1993.On that occasion the Bank’s authorised share capital was fixed at U.S.$500 million with approximatelyU.S.$100 million subscribed by the initial shareholders. The Bank’s authorised share capital has since beenincreased twice and, as at the date of this Registration Document, was U.S.$5.0 billion, of whichU.S.$1,187.96 million (nominal value) is subscribed (please see also “Shareholders and Description of ShareCapital—Share Ownership and Capital”).
The Bank’s operations were officially launched in September 1994. The Establishment Agreement wasregistered with the United Nations as an international treaty in October 1995. The Bank’s first branch officeopened in Harare, Zimbabwe in November 1996 and the Bank subsequently opened branch offices in Abuja,Nigeria (2003) and in Abidjan, Cote d’Ivoire (2015). The Bank is also in the process of establishing an EastAfrican branch office.
Strategic Planning
Since its inception, the Bank has used its strategic plans to advance its medium- to long-term corporate goals.
The Bank’s current strategic plan (the “Strategic Plan”), referred to as “Impact 2021: Africa Transformed”,was launched in December 2016 and covers the 2017 to 2021 period.
During that five-year period, the Bank expects to expand intra-African trade financing by growing its intra-African trade portfolio to U.S.$3 billion by the end of 2021. As at 31 December 2018, the Bank’s intra-Africantrade portfolio was U.S.$2.76 billion.
The Strategic Plan includes both corporate and macro objectives, in line with the Bank’s mission. The fourprimary pillars of the Bank as set out in the Strategic Plan are:
(a) Intra-African Trade;
(b) Industrialisation and Export Development;
(c) Trade Finance Leadership; and
(d) Financial Soundness and Performance.
26

The following table shows the primary pillars of the Strategic Plan and the related core targets for 2021, asadopted in 2016:
Intra-African Trade Industrialisation andExport Development
Trade FinanceLeadership
Financial Soundnessand Performance
• Promote and financeintra-African trade
• Catalyse: Promoteinvestments ininfrastructuredevelopments
• Produce: Finance andsupport activities thatimprove efficiency andquality in production
• Trade: Facilitate tradingthrough financing andsupporting institutionsthat provide marketaccess
• Interventions to bridgethe gap created byreduced activities orlimitations ofinternational banks
• Financial: Expandexisting trade financeproducts as well asinnovate
• Non-financial: Focus onimproving the capacity ofAfricans in the area oftrade finance
• Ensure the requisite sizeand financial soundnessto be able tomeaningfully impactAfrican trade
• Improve financialperformance,profitability,efficiency etc.
• Capital management toensure equity capital isefficiently utilised
• Liability managementstrategy
Coretargets by
2021
Increase intra-African tradeby >50%
Development ofindustrial parks / special
economic zones
Finance 1.4% of Africa’stotal trade annually U.S.$3.5bn capitalisation
Intra-African trade share oftotal >22%
Afreximbank GuaranteeProgramme
Finance 1% of Africa’smanufactured exports U.S.$1bn of fresh equity
Intra-African trade portfolio>USD3bn Set up FEDA(1) CAR within 20% to 30%
Finance >5% of total intra-African trade
10% CAGR of financing ofmanufactured exports Cost to income ratio <30%
32% CAGR of LoC(2) forindustrialisation and export
development
(1) Fund for Export Development in Africa
(2) Lines of credit
Intra-African Trade
Under the Strategic Plan, the Bank intends to aggressively promote and finance Intra-African Trade (defined as“trade in goods and services between or among African countries and the flow of goods and services betweenAfrica and the African diaspora”). The strategy for Intra-African Trade is based around three core themesidentified as “Create”, “Connect” and “Deliver”, with “Measure” as an ancillary theme (collectively referred toas “CCDm”).
The philosophy behind CCDm is that building solid export manufacturing capacities as well as domestic andcontinental supply chains would facilitate increased flow of goods and services across borders in Africa. Theancillary theme “Measure” introduces monitoring and measurement mechanisms. CCDm is intended, therefore,to bring together key players in Intra-African trade, such as farmers, processors, manufacturers, tradableservices providers, traders, financiers, logistics providers and policy makers. Under the Intra-African Tradepillar, the Bank intends to focus on facilitating the emergence and expansion of export trading companies,harmonising trading standards across Africa and implementing an Intra-African Trade Platform.
As at 30 June 2019, the Bank increased the share of its loan portfolio relating to intra-African trade to 25%,facilitated the Inaugural Intra-African Trade Fair in 2018 and commenced construction of a Testing, Inspectionand Certification Centre.
27

The following table shows the Bank’s position as at 31 December 2018 in relation to the Intra-African Tradetarget set at 31 December 2016 for 2021:
Intra-African Trade
Target set at 31 December 2016 As at 31 December 2018
Increase intra-African trade by >50% Macro objective to be assessed at the end of the 2021
Intra-African trade share of total >22% Increased the share of its loan portfolio related tointra-Africa trade to 25%
Intra-African trade portfolio >USD3bn Bank’s intra-African trade portfolio was U.S.$1.97 billion
Finance >5% of total intra-African trade Bank’s share of total intra-African trade was 1.2%
Industrialisation and Export Development
This is a critical component of the Strategic Plan, which is again framed around three themes: “Catalyse”(acting as a catalyst for industrialisation and export development in Africa by facilitating “soft” and “hard”infrastructure development), “Produce” (financing and supporting activities that improve efficiency and qualityin the production of goods and services) and “Trade” (facilitating trading of produced goods and services byfinancing and supporting institutions that provide market access) (together, “CPT”). Under the CPT framework,the Bank intends to act as a catalyst for industrialisation and export development in Africa by directlyaddressing the constraints to industrialisation by facilitating the production of value-added exports and serviceswhile ensuring that those produced goods and services are exported.
The Industrialisation and Export Development pillar will focus on supporting the development of the agro-processing, light manufacturing, and tradable service sectors.
As at 30 June 2019, the Bank provided over U.S.$1.1 billion in financing to support six manufacturing projects,disbursed U.S.$327 million to projects related to trade-enabling infrastructure and supported the construction oftwo industrial parks.
The following table shows the Bank’s position as at 31 December 2018 in relation to the Industrialisation andExport Development target set at 31 December 2016 for 2021:
Industrialisation and Export Development
Target set at 31 December 2016 As at 31 December 2018
Development ofindustrial parks / special economic zones
Supporting construction of two industrial parks /special economic zones
Afreximbank Guarantee Programme Afreximbank Guarantee Programme was established
Set up FEDA FEDA was established
10% CAGR of financing of manufactured exports 23% CAGR of financing of manufactured exports
32% CAGR of LoC for industrialisation and export development 51% CAGR of LoC for industrialisation and export development
Trade Finance Leadership
As part of the Strategic Plan, the Bank plans to extend its leadership in trade finance by expanding itsintervention in some of the critical trade finance products it already offers (including its Bank Trade ServicesCapacity) and by creating new products and initiatives. In particular, the Bank expects to expand its tradeservices offering to fill gaps created as a result of reduced activities by international banks in Africa due tohigh compliance costs and economic uncertainties. For example, on 19 October 2018, the Bank re-launched thePan-African Private Sector Trade and Investment Committee (“PAFTRAC”), which was established to serve asan advocacy platform to support the implementation of the African Continental Free Trade Area (AfCFTA) andto enhance the role of the African private sector in formulating trade and investment policy, including tradenegotiations.
This covers non-financial areas (such as research and knowledge management, trade information, and capacityin trade matters and policy advocacy) as well as financial areas (such as trade services and correspondentbanking, trade finance, specialised products, guarantees and syndications).
As at 30 June 2019, the Bank has disbursed U.S.$3.7 billion (Strategic Plan target: U.S.$2.3 billion), leveragedU.S.$3.50 in external financing for every U.S.$1.00 (Strategic Plan target: U.S.$2.00 to U.S.$1.00) and added64 relationships with correspondent banks and trade services in African countries.
28
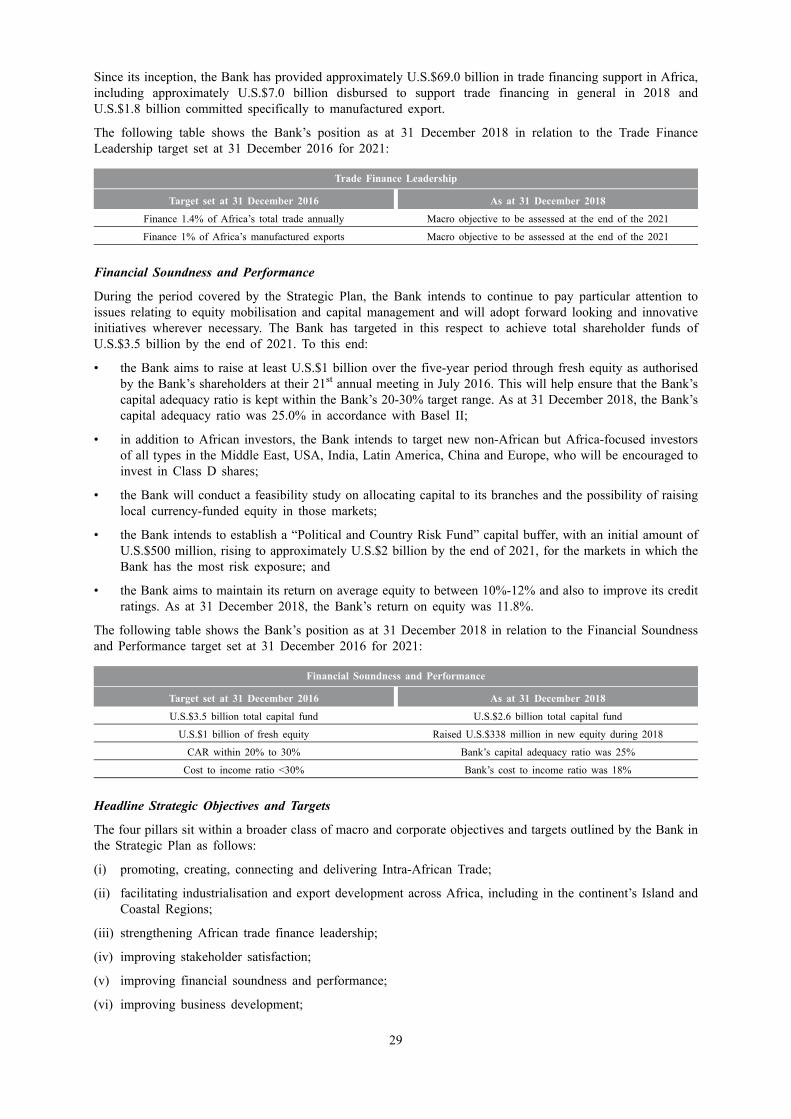
Since its inception, the Bank has provided approximately U.S.$69.0 billion in trade financing support in Africa,including approximately U.S.$7.0 billion disbursed to support trade financing in general in 2018 andU.S.$1.8 billion committed specifically to manufactured export.
The following table shows the Bank’s position as at 31 December 2018 in relation to the Trade FinanceLeadership target set at 31 December 2016 for 2021:
Trade Finance Leadership
Target set at 31 December 2016 As at 31 December 2018
Finance 1.4% of Africa’s total trade annually Macro objective to be assessed at the end of the 2021
Finance 1% of Africa’s manufactured exports Macro objective to be assessed at the end of the 2021
Financial Soundness and Performance
During the period covered by the Strategic Plan, the Bank intends to continue to pay particular attention toissues relating to equity mobilisation and capital management and will adopt forward looking and innovativeinitiatives wherever necessary. The Bank has targeted in this respect to achieve total shareholder funds ofU.S.$3.5 billion by the end of 2021. To this end:
• the Bank aims to raise at least U.S.$1 billion over the five-year period through fresh equity as authorisedby the Bank’s shareholders at their 21st annual meeting in July 2016. This will help ensure that the Bank’scapital adequacy ratio is kept within the Bank’s 20-30% target range. As at 31 December 2018, the Bank’scapital adequacy ratio was 25.0% in accordance with Basel II;
• in addition to African investors, the Bank intends to target new non-African but Africa-focused investorsof all types in the Middle East, USA, India, Latin America, China and Europe, who will be encouraged toinvest in Class D shares;
• the Bank will conduct a feasibility study on allocating capital to its branches and the possibility of raisinglocal currency-funded equity in those markets;
• the Bank intends to establish a “Political and Country Risk Fund” capital buffer, with an initial amount ofU.S.$500 million, rising to approximately U.S.$2 billion by the end of 2021, for the markets in which theBank has the most risk exposure; and
• the Bank aims to maintain its return on average equity to between 10%-12% and also to improve its creditratings. As at 31 December 2018, the Bank’s return on equity was 11.8%.
The following table shows the Bank’s position as at 31 December 2018 in relation to the Financial Soundnessand Performance target set at 31 December 2016 for 2021:
Financial Soundness and Performance
Target set at 31 December 2016 As at 31 December 2018
U.S.$3.5 billion total capital fund U.S.$2.6 billion total capital fund
U.S.$1 billion of fresh equity Raised U.S.$338 million in new equity during 2018
CAR within 20% to 30% Bank’s capital adequacy ratio was 25%
Cost to income ratio <30% Bank’s cost to income ratio was 18%
Headline Strategic Objectives and Targets
The four pillars sit within a broader class of macro and corporate objectives and targets outlined by the Bank inthe Strategic Plan as follows:
(i) promoting, creating, connecting and delivering Intra-African Trade;
(ii) facilitating industrialisation and export development across Africa, including in the continent’s Island andCoastal Regions;
(iii) strengthening African trade finance leadership;
(iv) improving stakeholder satisfaction;
(v) improving financial soundness and performance;
(vi) improving business development;
29

(vii) improving stakeholder engagement;
(viii)improving operating efficiency;
(ix) strengthening enterprise risk management; and
(x) improving organisational structure and capacity.
Macro Objectives and Targets
As part of the Strategic Plan, the Bank aims to contribute towards:
• an increase in Africa’s share of global trade by;
• financing 1.4% of Africa’s total trade; and
• increasing international finance flows into Africa from current levels by 10% through the Bank’sleveraging role;
• an increase in Africa’s overall share of global trade by financing at least 5% of total Intra-African trade;
• increasing intra-African trade by more than 50% with share of intra-African trade in total African trade atmore than 22%;
• increasing Africa’s share of global manufactured exports by;
• financing 1% of Africa’s manufactured exports; and
• creating 3,000 hectares of Industrial Parks and Special Economic Zones distributed across all of thecontinent’s sub-regions, to deal with the infrastructure constraints facing industrialisation and exportdevelopment.
The Bank intends to measure the above listed macro objectives at the end of 2021.
Corporate Objectives and Targets
As part of the Strategic Plan, the Bank aims to:
• expand intra-African trade financing by growing the Bank’s intra-African trade portfolio to U.S.$4 billion;
• finance at least 5% of total intra-African trade;
• disburse U.S.$25 billion of financing on a revolving basis in 2017—2021;
• raise a minimum of U.S.$3 billion in financial resources from the African diaspora for the continent’sdevelopment;
• support the development and implementation of Industrial Parks and Special Economic Zones in aminimum of five countries;
• establish the Fund for Export Development;
• grow the financing of manufactured exports and services by 10% per annum from 2016 levels;
• become a correspondent bank in a minimum of five African countries by 2018, adding no less than threerelationships per annum thereafter for the remaining part of the period cover by the Strategic Plan. As at31 December, the Bank added 64 relationships with correspondent banks and trade services in Africancountries;
• increase the Bank’s existing capitalisation to U.S.$3.5 billion. As at 31 December 2018, the total capitalfund was U.S.$2.6 billion;
• maintain a Capital Adequacy Ratio between 20% and 30%. As at 31 December 2018, the Bank’s CapitalAdequacy Ratio was 25%; and
• maintain a Cost-to-Income Ratio below 30%. As at 31 December 2018, the Bank’s Cost-to-Income Ratiowas 17.9%.
30
As part of the Strategic Plan, the Bank also set specific targets for the year ended 31 December 2018 as set outin the table below:
Target for year ended 31 December2018 As at 31 December 2018 Medium-term
guidance
Non-performing loans as a percentage ofloan portfolio <3%
The Bank’s non-performing loans as apercentage of loan portfolio was 3.0% 3.0%—4.0%
Net interest margin >3% The Bank’s net interest margin was 3.5% 3.0%—3.5%
Cost to income ratio <30% The Bank’s cost to income ratio was 17.9% 20%—30%
Return on average equity between 10%and 12%
The Bank’s return on average equitywas 11.8% 10%—12%
Dividend payout ratio at least 25% The Bank’s dividend payout ratio was 25% 20%—26%
Capital adequacy ratio >20% The Bank’s capital adequacy ratio was 25% >20%
Loan book of U.S.$9.0 billion andU.S.$10.0 billion
The Bank’s loans and advances to customerswas U.S.$11.1 billion 10%—15%
Strategic Partnerships
Over the years, the Bank has leveraged its strategic partnerships and alliances to sustain and expand thefinancing of African trade in support of growth and economic development. In addition to risk sharing and co-financing, the partnerships have provided the opportunity for knowledge sharing and technology transfersessential for growth in the transition towards a knowledge economy. A number of key strategic partners thathave supported the Bank’s mission of promoting African trade include:
Trade Finance Programme with the African Development Bank
The Bank continues to benefit from a very productive relationship with AfDB. AfDB continues to support thebusiness of the Bank in the form of lines of credit in aggregate of U.S.$700 million. The successfulcollaboration between the Bank and AfDB resulted in the approval of an additional U.S.$250 million riskparticipation in trade finance transactions originated by the Bank. AfDB has also increased its equityparticipation in the Bank by an additional U.S.$30 million. The Bank is also working on collaborative areas topromote industrialisation and intra-Africa trade, research, capacity building and policy advocacy, and acustomer due diligence repository platform. Moreover, in December 2018, the Bank signed a memorandum ofunderstanding with AfDB and other guarantee institutions to attract international finance investments to Africa.
US Exim Bank
The Bank has collaborated with US Exim Bank and U.S. Department of Agriculture (“USDA”) on severaloccasions to promote trade between the United States and Africa. This includes equipment financing, trade andcommodity financing. For instance, the Bank worked with US Exim Bank and other financial institutions suchas Citibank and J.P. Morgan to support the acquisition of aircraft for Kenya Airways for an amount of overU.S.$1 billion. The Bank has been an active partner with the USDA under the GSM 102 programme, whichcontributed to financing trade and commodity-based transactions of over U.S.$1 billion as at February 2018.
KfW Development Bank
The Bank has benefited from its successful relationship with the KFW Group over the last 10 years, involvingDEG, KfW Development Bank as well as KFW IPEX, in the following manner:
• DEG—The Bank has embarked in co-financing projects with DEG in certain transactions in membercountries of the Bank, where DEG acted as the European DFI co-ordinator
• KfW Development Bank—they have offered financing support, including technical assistance, and lines ofcredit in excess of U.S.$500 million to the Bank. These were in support of the Bank’s Africa CocoaInitiative (“AFRICOIN”), trade finance activities, as well as renewable energy transactions;
• KfW IPEX—they have offered the Bank U.S.$100 million credit lines and the Bank is currently workingwith them on several ECA backed transactions.
Arab Bank for Economic Development in Africa
Pursuant to the strong efforts to boost Afro-Arab co-operation to serve their respective mandates of facilitatingand financing African trade and economic development, the Bank and the Arab Bank for Development in
31

Africa (“BADEA”) signed a memorandum of understanding in April 2016 to co-operate in, among others, thefollowing areas:
• financing private sector operations in Africa, either through lines of credit, co-financing, syndication ofloans, risk participation or through any other appropriate mode of co-operation;
• financing trade operations in the form of exports and imports between Arab and African countries eligiblefor assistance and through lines of credit to Afreximbank, co-financing, syndication of loans, riskparticipation or through any other appropriate mode of co-operation;
• undertaking joint promotional efforts for private sector development finance and trade finance betweenArab and African countries as well as policy formulation;
• project evaluation and development;
• exchanging knowledge, information and experience; and
• provision of technical assistance to the beneficiary countries and institutions within the scope of theirobjectives and purposes.
In furtherance of the relationship, BADEA provided the Bank with a U.S.$50 million facility to support theexport of goods from Arab countries to African member countries. This line of credit has been approved buthas not been drawn. The Bank has also established a new U.S.$75 million facility for the same purpose.
Made in Africa Initiative
A co-operation agreement was signed between the Bank and the Made in Africa Initiative during the 23rd
Annual General Meeting of Shareholders of Afreximbank held in Seychelles in July 2016 to develop andoperate industrial and agro-processing parks to increase value addition on the African continent. Through thisagreement, the Bank and the Made in Africa Initiative facilitate investment flows into Africa by working withAfrican governments to create, develop, and improve the “soft” and “hard” infrastructure required forindustrialisation.
In 2017, the Made in Africa Initiative introduced the Financial Centre for South-South Cooperation, which isworking with the Bank through its newly established Fund for Export Development in Africa (FEDA) toestablish a joint fund to co-finance eligible industrialisation and trade-enabling projects in Africa.
In 2018, the Bank appointed the Made in Africa Initiative to develop the feasibility study and business plan aswell as investment promotion strategy for establishing and operating the Abidjan PK-24 Industrial Park. Thisfeasibility study recommended the implementation of the project within the framework of a public-privatepartnership, the preferred development model under the memorandum of understanding and the frameworkagreement between the Government of Côte d’Ivoire and the Bank.
In 2019, the Bank shifted its focus towards implementation of the business plan for the development of theAbidjan PK-24 Industrial Park.
Export Credit Insurance Corporation (ECIC)
The Bank is strategically developing its relationship with various export credit agencies, including ECIC, whichresulted in ECIC taking up a shareholding in the Bank in 2017. As part of the relationship, the Bank signed amemorandum of understanding with ECIC in March 2018, to promote trade between South Africa and the restof the continent. The two institutions established a U.S.$1 billion programme in 2018 called SouthAfrica—Africa Trade and Investment Promotion Programme (SATIPP), to support the trade and exportdevelopment objectives of the institutions, especially in the area of intra-African trade. This line of credit hasbeen approved but has not been drawn. In March 2018, the Bank entered into a memorandum of understandingwith ECIC to provide export credit and foreign investment insurance to its clients to enable South Africancompanies to offer their services and products on the international market and make equity investments inforeign entities. As a result of this partnership, the two institutions have created a deal pipeline of potentialtransactions with amounts that may be financed of approximately U.S.$1.5 billion.
China-Africa Development Fund (CADFUND)
The Bank executed a memorandum of understanding (“MOU”) with China-Africa Development Fund(CADFUND) in September 2017 to promote industrialisation and to enhance the export development potentialof African countries. Through this MOU, the Bank and CADFUND intend to work with African Governmentsto support the development of Industrial Parks and Export Processing Zones across the continent.
32
United Nations Industrial Development Organization
In December 2018, the Bank signed a joint declaration with United Nations Industrial DevelopmentOrganization (UNIDO). The objective is to contribute to the achievement of the UNIDO’s 2030 Agenda forSustainable Development and Inclusive and Sustainable Industrial Development initiative. The areas of co-operation include:
• Facilitation of exports in Africa of value-added products by adding manufacturing value to agriculturalcommodities;
• Promotion of trade linkages and market penetration for African products and integration in internationalvalue chains by developing SMEs readiness to export in accordance to international standards andrequirements;
• Increase the access of small-scale industrial enterprises to financial services;
• Upgrade industrial eco efficiency, increase resource efficiency and greater adoption of clean andenvironmentally sound technologies and industrial processes;
• Promote innovative solutions for job creation and sustainable investment; and
• Exchange knowledge and mainstream efforts to expand the application of successful projects and modelsof industrial development to a wider segment of benefiting countries and sectors.
African Union (AU)
The Bank executed a memorandum of understanding with the African Union (“AU”) in March 2018 to supportintra-African trade and to establish free trade areas for the continent. The following areas of collaboration wereagreed:
• intra-African trade and investment promotion and support;
• trade finance;
• trade information;
• trade facilitation;
• industrial development support;
• private sector promotion and development, in particular, micro, small and medium size enterprises, womena and young entrepreneurs finance; and
• capacity building in the areas of trade, investment, mining and industry.
Indonesia Eximbank
In April 2018, Afreximbank and Indonesia Eximbank entered into an agreement to commit up toU.S.$100 million to promote trade between Indonesia and African states. Under the terms of the agreement,Afreximbank will support the import of capital equipment and services from Indonesia through an overseasfinancing arrangement, with Indonesia Eximbank providing direct financing to African buyers of Indonesiangoods and services on the back of a guarantee provided by Afreximbank.
Indonesia Eximbank will also provide financing support to Indonesian buyers of African goods, withAfreximbank acting as the bank of the African exporters. In addition, Indonesia Eximbank will support short-term trade transactions originating from African buyers of Indonesian products, including through the provisionof confirmation lines to the African banks on the back of a trade confirmation guarantee facility provided byAfreximbank.
Exim Bank of India
The long standing relationship between the Bank and Exim Bank of India has enabled the two institutions tocollaborate in a number of areas including: (i) research; (ii) capacity-building initiatives and staff exchangearrangement; and (iii) exploration of areas for co-financing and risk sharing, with a view to promoting co-operation between leading developing economies to facilitate trade and investment flows. In 2019, the twoinstitutions produced their first joint research report assessing the dynamics of trade and investment betweenAfrica and India. Exim Bank of India has also provided a line of credit to the Bank for an amount ofU.S.$ 125 million to support trade and trade enabling activities between India and Africa.
33

Export-Import Bank of China
The Bank has intensified efforts to diversify its sources of funding by increasingly mobilising funds under itsExport Credit Agency (“ECA”) Loans Facilitation Programme. In July 2011, the Bank signed aU.S.$100 million Trade and Project Financing Facility with Export-Import Bank of China (“Exim China”).Under this facility, U.S.$20 million was used by the Bank to fund short-term trade finance activities andU.S.$80 million was channelled into medium term project finance on-lending to its clients in support ofacquisition of a variety of Chinese goods and services from a broad range of sectors including: industry andagro-industry, telecommunications, energy and environmental protection, transportation, water supply, andsanitation. Moreover, in July 2016, the Bank and Exim China signed a U.S.$1 billion China AfricaIndustrialisation Programme (“CAIP”) to help accelerate Africa’s industrialisation and enhance trade betweenthe continent and China. Industrial Parks projects are currently being developed in Cote d’Ivoire, Nigeria andother African countries to ensure optimal utilisation of the CAIP.
Ecobank Transnational Incorporated
In February 2017, Ecobank Transnational Incorporated (“Ecobank”) and the Bank signed a memorandum ofunderstanding to:
• create a U.S.$500 million programme dedicated to financing trade amongst Afreximbank member stateswhere Ecobank is permitted to conduct banking business;
• co-operate in financing trade operations in the form of exports and imports between various Africancountries where Ecobank has a presence;
• undertake joint promotional efforts targeting Africa’s private sector to increase intra-Africa trade flows;
• co-operate in structuring appropriate financing instruments for intra-Africa trade transactions;
• exchange knowledge, information and experience in intra-African trade matters; and
• provide technical assistance to African private sector entities, in particular, small and medium-sizedentities (SMEs) and local corporates involved in intra-African trade.
Other Avenues of Cooperation
The Bank maintains business relationships with a wide range of Trade Finance Intermediaries (“TFIs”), spreadacross more than 30 countries and growing from 59 in 2017 to 64 in 2018. The Bank has increased its focus onbusiness development. During the year ended 31 December 2018, the Bank continued to meet with delegationsfrom major African and non-African institutions seeking to develop business relationships with the Bank. TheBank has also witnessed considerable growth in the number of African countries benefiting from its productsand services, increasing to 49 in 2018 from 29 in 2017.
In addition, between December 2018 and February 2019, the Bank signed memoranda of understanding withthe following entities:
• Co-Guarantee Platform and African Development Bank, to establish a mutually beneficial framework forcooperation and collaboration in order to provide affordable guarantees and other risk mitigation productsin relation to eligible projects in Africa;
• Banque de Développement des Etats de l’Afrique Centrale, to provide a broad framework for cooperationand to facilitate collaboration between the two institutions in harmonising their efforts for the promotion oftrade and economic development;
• Attijariwafa Bank, for the promotion of intra-African trade;
• Arab Organization for Industrialization, to cooperate in matters relating to trade and trade-related projectsfacilitation and the enhancement of intra-African trade;
• Nigerian Export-Import Bank and Nigerian Export Promotion Council, to provide a framework ofcooperation and to facilitate collaboration between them and harmonise their efforts for the promotion oftrade, trade-related projects and economic development; and
• Maghreb Bank for Investment and Foreign Trade, to facilitate collaboration in harmonising their efforts forthe promotion of trade.
34
Competition
The Bank’s management believes that the key markets in which Afreximbank operates have made significantprogress in terms of regulating their banking sectors, capitalisation requirements and limiting banks’ exposureto distressed assets. Such markets were also successful in diversifying their trade links, as evidenced by theshare of African trade with developing countries rising by approximately 13% year-on-year to U.S.$332 billionin 2018 from 2017, according to the IMF Direction of Trade Statistics, as well as the Bank’s own research,with China becoming Africa’s single largest trade partner. Accordingly, the Bank believes that the long-termprospects for many African economies are positive.
Afreximbank operates in a competitive market. Other market participants are international institutions, Africaninstitutions and certain country-specific schemes, as detailed below:
International Institutions
Multilateral institutions such as the World Bank Group (including the International Bank for Reconstructionand Development, the International Finance Corporation (“IFC”), the Multilateral Investment GuaranteeAgency and the International Development Association) and the European Investment Bank (the “EIB”)concentrate their activities principally on long-term government development projects and policy reform. TheIFC and the EIB also support private projects, but these projects need not be export generating.
Official creditors (such as non-African governments and non-African government-owned organisations) alsoprovide financial support to African countries with bilateral financing. They use a number of financinginstruments, of which the most relevant is financing being provided by national export credit agencies(“ECAs”) to support exports by the relevant nations into Africa. This form of bilateral financing necessarilycomplements Afreximbank’s activities. Further, the Bank has designed an ECA Loans Facilitation programme(see ”—The Bank’s Programmes and Facilities”) under which the Bank works with various ECAs in a mutuallybeneficial manner.
International commercial banks have concentrated their operations in Africa in the areas of pre- and post-exportcredit and letters of credit confirmations. They are usually short term (less than 360 days) and concentrated onSouth Africa, a few North African countries and selected sectors in Angola, Cameroon, Côte d’Ivoire andNigeria, among others. Afreximbank will continue to co-operate with international commercial banks as well ashelp African corporates to facilitate their access to international capital markets.
African Institutions
Multilateral financial institutions operating in Africa include AfDB, the Trade and Development Bank(formerly PTA Bank), the Arab Bank for Economic Development in Africa (“BADEA”), the East AfricanDevelopment Bank (“EAfDB”) and the African Finance Corporation (the “AFC”).
The AfDB operates in a similar way to the World Bank, funding development projects typically on a long-termbasis. However, AfDB and Afreximbank currently complement each other in implementing export-basedprivate sector projects. BADEA, which is owned by Arab States including the United Arab Emirates, theKingdom of Bahrain and the Kingdom of Saudi Arabia, also provides financing to African governments for thedevelopment of public infrastructure projects.
EAfDB was conceived as a development finance institution with a mandate to provide long term funding togovernments in the East African Development Community.
The Trade and Development Bank provides development and trade financing to member countries of theCommon Market for Eastern and Southern Africa.
The AFC bridges Africa’s infrastructure investment gap through the provision of debt and equity finance,project development, technical and financial advisory services.
The regional coverage of all of the above is not complete and Afreximbank has supported their activities byproviding trade finance lines to institutions or sectors not covered by the above institutions.
Country-Specific Schemes
Very few African countries have institutional arrangements for export credit support. The only countriesproviding full coverage for export credit support are Egypt, South Africa, Tunisia and Zimbabwe, whereaspartial coverage is offered by Côte d’Ivoire, Morocco, Nigeria and Swaziland. In addition, two Africancountries, namely Ghana and Zambia, have recently decided to create their own export-import agencies with a
35

view to promoting their international trade through the provision of trade and project financing. The GhanaExport Import Bank started operations in December 2016 while Zambia continues work on establishing itsexport-import bank.
However, in many African countries economic reforms have seen similar initiatives abolished. As aconsequence, export and trade financing, where available at all, is left to commercial banks that demandsubstantial fees for their services and provide only limited support.
Regulation and Status
Under the Establishment Agreement, each Participating State has agreed to waive, and refrain from imposing,any administrative, financial or other regulatory restrictions that are likely to hinder in any manner the smoothfunctioning of the Bank or impair its operations. Accordingly, the Bank’s property, assets, operations andactivities are free from restrictions, regulations, supervision or controls, moratoria and other legislative,executive, administrative, fiscal and monetary restrictions of any nature.
These accommodations have also allowed the Bank to enjoy a preferred creditor status in the ParticipatingStates and reduced the effect of country risk and moratorium risk on the Bank. While analogous privileges andimmunities are generally enjoyed by most multilateral institutions, it is also generally accepted that otherelements of preferred creditor status, including (but not limited to) preferential access to foreign currency in theevent of a country foreign exchange crisis and priority of payment in the event of government shortfalls, reflectthe relevance of the Bank to the country, as a result of which the Bank benefits from them as a matter ofconduct. This conduct in turn reflects incentives which countries face to place priority on loan repayments tomultilateral lending institutions. Such incentives include:
• committed loans that have yet to be disbursed;
• a willingness to initiate new loans when others will not;
• the availability of loans on generally more favourable terms; and
• technical assistance in addition to straight funding.
In the context of the Bank, all these incentives apply. The Bank believes it enjoys an extensive pipeline oftransactions in all countries where it already has exposures and therefore strong incentives exist to ensurerepayments are met so as not to jeopardise these transactions. The Bank has also shown a commitment tosupport its member states in circumstances where other multilateral institutions have disengaged. It is primarilyfor this reason that in Zimbabwe, the Bank has continued to have its obligations paid by the state when othermultilaterals have seen an effective moratorium of their repayments. The Bank is able to provide funding atfavourable cost through its ability to shield borrowers in member states from the country risk premium theywould otherwise have to pay if they were accessing the international markets directly. The Bank has alsoprovided technical assistance such as in the case of Cameroon where it provided structuring advice, whichhelped to unlock the potential of the banana industry, which is considered critical to the economy of Cameroon.Such factors lead to a strong political incentive for the member states to ensure that the Bank does in practiceenjoy preferred creditor treatment, even if, in line with the Bank’s mandate, the facilities may be provided tothe private sector. Specific examples of this include:
Senegal (2007). The Bank was involved in the financing of the Senegalese State Oil refinery in parallel with anumber of leading European banks. The state-owned body experienced financial difficulty due to fundingshortfalls from the Senegalese government. The state-owned body repaid the Bank due to its preferred creditorstatus, but entered into a restructuring arrangement with other creditors.
Kenya (2008). The Bank purchased under its forfaiting facility certain promissory notes issued by thegovernment of Kenya to a supplier of some motor vehicles. When a change in Government occurred, thegovernment of Kenya suspended payments of the series of promissory notes including those purchased by theBank. The Bank successfully negotiated with the Kenyan government to ensure that the promissory notes heldby the Bank were redeemed, while others were not.
The Republic of Sudan (2014-5). Despite experiencing significant hard currency shortages, the Central Bank ofSudan prioritised repayment of facilities owed to the Bank.
Zimbabwe (2016). The Zimbabwe Asset Management Company took over three facilities owed to the Bankhaving a combined value of U.S.$30.2 million which had fallen behind on repayments. This action by theZimbabwean authorities reflects the preferential treatment which the Bank enjoys in its member states arisingfrom its good relations with the authorities as well as its relevance in those economies.
36

Egypt (2017). During the foreign currency exchange crisis that was experienced in Egypt in 2017, the CentralBank of Egypt made provision for certain financial institutions to have access to U.S. dollar denominated fundsfor the purposes of enabling the relevant financial institutions to repay loans owed to the Bank.
Nigeria (2017). The Central Bank of Nigeria entered into an arrangement with the Bank whereby the Bank’scustomers who were having difficulty accessing hard currency to service their liabilities to the Bank were givenpriority access to hard currency to enable them to service their liabilities.
The Bank’s Programmes and Facilities
Scope and Eligibility
Eligible Entities and Countries
The Bank’s credit facilities are available to (i) Shareholders, (ii) non-Shareholders who are domiciled inParticipating States and (iii) non-Shareholders in non-Participating States to the extent that such financing willbe used to pay for imports from a Participating State (together referred to as “Eligible Entities” or “EligibleCountries”, as the case may be).
Eligible Goods
The Bank finances transactions in all traded goods and services (“Eligible Goods”) except armaments,ammunition and other military equipment, psychotropic drugs or narcotics, pornographic and obscene materials,and all items for which international trade is prohibited for environmental reasons or by internationalconventions.
Forms of business or activities prohibited for environmental and sustainability reasons include:
• trade in wildlife or wildlife products regulated under the Convention on International Trade in EndangeredSpecies of Wild Fauna and Flora;
• production or use of or trade in hazardous materials such as radioactive materials;
• production or use of or trade in, unbounded asbestos fibres, products containing PCBs and chemicalssubject to international phase-outs or bans;
• production of or trade in pharmaceuticals, pesticides, herbicides subject to international phase-outs orbans;
• production of or trade in ozone depleting substances subject to international phase-out; and
• drift net fishing in the marine environment using nets in excess of 2.5km length.
Eligible Transactions
The following transactions (“Eligible Transactions”) are eligible for financing by the Bank:
• all Eligible Goods imported into Participating States;
• all Eligible Goods exported from Participating States, that is, export-generating imports, including rawmaterials, equipment, spare parts, infrastructure goods and equipment, and other essential items;
• intra-African trade in Eligible Goods;
• trade in Eligible Goods between African states and other developing states; and
• all Eligible Goods imported by non-Participating States from Participating States.
Maturities
Short-term trade financing will normally not exceed a maturity of 360 days. Medium term loans or facilitiescan be provided for up to seven years.
Environmental Evaluation
It is Bank policy that all projects proposed for financing are subject to environmental and social appraisal. Thisappraisal is integrated into the overall management of the project. Together with guidelines on financial,technical and economic appraisal, the environmental and social appraisal seeks to support the Bank in
37

managing its overall business risks while ensuring a positive developmental impact. The key process steps inthe Bank’s environmental and social appraisal are:
• verification in relation to the Bank’s list of projects and goods not considered Eligible Goods or EligibleTransactions (the “Exclusion List”);
• risk categorisation, involving the mandatory assignment of each transaction to a defined risk category, withthe highest-risk transactions subject to benchmarking against IFC performance standards and therequirement of an annual monitoring report from the client;
• environmental and social due diligence, the depth of which is determined by the transaction’s riskcategory;
• contract negotiation; and
• monitoring.
The Equator Principles are a credit risk management framework for determining, assessing and managingenvironmental and social risk in project finance transactions. As at the date of this Registration Document, theBank has not yet signed the Equator Principles, although under the Bank’s Environmental and SocialManagement (“ESM”) System, the Bank seeks to benchmark its policy against the International FinanceCorporation (“IFC”) performance standards upon which the Equator Principles have been developed.
The Bank respects the trade policies of Eligible Countries and, accordingly, in addition to the above, the Bankhas country-specific lists containing items which are prohibited for international trade in Eligible Countries andare therefore ineligible for finance from the Bank.
Product Overview
Afreximbank’s programmes and facilities have historically been organised around two principal schemes: theAfrican Trade Expansion and Diversification Scheme and the Export Development Scheme. On 2014,Afreximbank also introduced a programme aimed at African central banks (see ”—Afreximbank Central BankDeposit/Investment Programme”).
The following table shows Afreximbank’s loan approvals by product category as at 31 December 2018,31 December 2017 and 31 December 2016:
31 December 2018 31 December 2017 31 December 2016(U.S.$ million) (%) (U.S.$ million) (%) (U.S.$ million) (%)
(1) African Trade Expansion and Diversification Scheme(a) Dual Recourse ProgrammesNote Purchase Programme . . . . . . . . . . . . . . . . . . . . . . . . . 26.2 0.2 75.0 0.9 — —Receivables Purchase/Discounting Programme . . . . . . . . . . . . 297.0 2.0 29.3 0.4 — —(b) Non-Dual Recourse ProgrammesSyndications Programme(1) . . . . . . . . . . . . . . . . . . . . . . . . 2,542.6 20.5 2,243.0 28.3 1,968.7 16.4Line of Credit Programme(2) . . . . . . . . . . . . . . . . . . . . . . . 6,350.0 51.2 4,030.7 50.8 8,008.0 66.6Direct Financing Programme . . . . . . . . . . . . . . . . . . . . . . . 2,436.7 19.6 1,320.4 16.7 1,934.5 16.1Future-Flow Pre Financing Programme . . . . . . . . . . . . . . . . . 0 0 0 0 50.0 0.4(2) Export Development SchemeProject Related Financing Programme . . . . . . . . . . . . . . . . . 288.6 2.3 25 0.3 70.0 0.6Export Development Programme . . . . . . . . . . . . . . . . . . . . . 471.2 3.8 107.0 1.4Asset-Backed Lending Programme . . . . . . . . . . . . . . . . . . . . 0 0 100.0 1.3 — —
Total(3) . . . . . . . . . . . . . . . . . . . . . . . . . . . . . . . . . . . . . 12,412.3 100 7,930.41 100 12,031.2 100
Memorandum ItemCountry Programme(3) . . . . . . . . . . . . . . . . . . . . . . . . . . . 1,191.3 9.6 883.4 11.1 366.0 3.0
(1) Includes co-financing and sub-participation.
(2) This includes COTRALF, which the Bank is winding down (see ” —Counter-cyclical Trade Liquidity Facility”).
(3) This programme is not included for the purpose of calculating the totals because they represent the total amount syndicated underthat Scheme. The Bank’s share of any such syndications is reflected in the other programmes above.
African Trade Expansion and Diversification Scheme (“ATED Scheme”)
The ATED Scheme covers both exports and imports and comprises programmes and facilities designed toaddress both market and product diversification problems facing Africa. It is intended to remove bottlenecks tothe trading of products already produced or near production and able to be sold. Facilities under the ATEDScheme are organised under non-dual recourse programmes (“NDR Programmes”). Historically, the Bank also
38

offered two dual recourse programmes (“DR Programmes”), but as at the date of this Registration Documentno longer offers new facilities under its previous DR Programmes.
Dual Recourse Programmes
• Note Purchase Programme
Through the Note Purchase Programme, the Bank provides financing to corporates via the purchase ofpromissory notes or similar instruments issued or accepted by them and avalised or guaranteed by anacceptable bank or other corporates. The Bank approved U.S.$26.22 million under the Note PurchaseProgramme in 2018. Loans outstanding under the programme stood at U.S.$336.15 million as at31 December 2018, representing 3.02% of the total portfolio.
• Receivables Purchase/Discounting Programme
The Receivables Purchase/Discounting Programme comprises a suite of facilities involving the purchase ofspecific or groups of receivables from the sale of goods and services to foreign or domestic buyers with orwithout recourse to the seller. The facilities offered under this programme include forfaiting, invoice/receivables discounting, factoring and receivables management, and joint bill discounting/financing andrefinancing. Outstanding loans under this programme amounted to U.S.$162.22 million as at 31 December2018, an increase of 65% from the U.S.$98.2 million recorded as at 31 December 2017. The programmeaccounted for just 1.46% of the Bank’s loans portfolio for the year ended 31 December 2018.
Non-Dual Recourse Programmes
NDR Programmes are operated with direct recourse to one obligor. Such transactions are executed withestablished corporates and banks and/or, where the applicable legal regime allows, proper perfection ofsecurity. The Bank offers the following facilities as NDR Programmes:
• Syndications Programme
This is one of Afreximbank’s programmes, accounting for 15.56% (on a post-syndication basis) of loansoutstanding as at 31 December 2018 (compared with 33.8% (on a post-syndication basis) of loansoutstanding as at 31 December 2017). The average yield for this programme was 5.7%, 5.3%, 4.6% for theyears ended 31 December 2018, 2017 and 2016, respectively. This is a risk-sharing programme thatAfreximbank uses to leverage trade and project financing into Africa. Through this programme,Afreximbank arranges or joins a syndicate or club of reputable international and/or African banks toprovide financing to African entities in trade and/or project-related activities. Through this mechanism, thecommercial risks in the transaction are shared between Afreximbank and the other syndicate participants.Due to its supranational and preferred creditor status, Afreximbank can act as lender of record and inviteinternational banks to join. Such international banks are incentivised by the fact that they do not have topay stamp duties that would otherwise be due owing to Afreximbank’s tax-exempt status, and joiningAfreximbank may also mitigate their country risk. The tenor of financing available under this programmeis typically up to seven years.
The syndicates Afreximbank participates in must be ones that provide those facilities that fall withinAfreximbank’s mandate, and may cover broad areas of export, import and project-related financing.
The main beneficiaries of this programme are central banks, commercial banks, finance companies, exporthouses, and African and non-African corporates engaged in Eligible Transactions.
Loans approved under this programme increased to U.S.$2,542 million for the year ended 31 December2018 from U.S.$2,243 million for the year ended 31 December 2017, an increase of 13.36%. As such, theBank’s Syndication Programme remains one of its most utilised programmes with 19 syndicated deals in2018 as against 11 in 2017. Total loans outstanding under the Syndication Programme decreased fromU.S.$2.86 billion as at 31 December 2017 to U.S.$1.73 billion as at 31 December 2018.
As at 30 June 2019, the Bank shifted the activities that were historically carried out under this programmeto its other programmes, including the Lines of Credit Programme and the Direct Financing Programme.
• Line of Credit Programme (“LOCP”)
This programme accounted for 47.3% of Afreximbank’s outstanding loans for the year ended31 December 2018 (with an average yield of 4.0%) and 43.18% of Afreximbank’s outstanding loansfor the year ended 31 December 2017 (with an average yield of 4.7%). The average yield for the yearended 31 December 2016 was 2.3%.
39

Through the LOCP, the Bank provides funded and unfunded credit lines to creditworthy African and non-African banks active in Africa trade finance. The LOCP provides loan and guarantee facilities to small andmedium-sized trading entities whose balance sheet size and trade turnover would not normally qualifythem for the Bank’s direct lending. The facilities provided under the LOCP include the Trade Finance(Export-Import) Facility, the Pre- and Post-Export Financing Facility, the Letter of Credit Confirmationand Refinancing Facility, the Reimbursement Guarantee Facility, and the Countercyclical Trade LiquidityFacility introduced by the Bank in December 2015 to enable the Bank’s member countries to bettermanage the impact of negative commodity price shocks.
Total approvals under the LOCP increased from U.S.$4.03 billion in 2017 to U.S.$6.35 billion in 2018, a57.5% increase. The LOCP accounted for over 51.0% of total approvals in 2018. Outstanding loans underthe LOCP reached U.S.$5.25 billion in 2018, up from U.S.$3.66 billion in 2017, a 43.4% increase. Theshare of lines of credit in the Bank’s outstanding loans stood at 47.3% in 2018, up from 43.2% in theprevious year. The LOCP accounted for 33%, or U.S.$264.0 million, of operating income (net interest andsimilar income, net fee and commission income and other operating income) in 2018.
Under the LOCP, the Bank provides a:
(i) pre- and post-export financing facility, through which the Bank provides export financing for up to75% and 80% of the underlying sales contract for pre-export and post-export transactionsrespectively;
(ii) letter of credit confirmations and refinancing facility, through which the Bank confirms and/orrefinances sight and usage letters of credit covering eligible items;
(iii) export credit guarantee facility, through which the Bank provides a credit guarantee in support ofexporting corporates to enable them to obtain competitively priced export finance facilities. The Bankmay also provide guarantees in support of African banks seeking export finance lines of credit frominternational banks. The Bank may guarantee up to 100% of the credit exposure to the guaranteedentity;
(iv) reimbursement guarantee facility, which is designed to both help African banks to issue letters ofcredit without the need for cash collateral and at reasonable cost, and to help African banks to acceptletters of credit issued by banks they are not familiar with. It therefore facilitates intra-African tradeand trade with other countries such as Brazil, Russia, India and China; and
(v) correspondent banking/African letter of credit facility, through which the Bank (a) offerscorrespondent banking services to African banks, and (b) offers a dedicated letter of creditconfirmation facility for promotion of intra-African trade.
• Direct Financing Programme
This programme accounted for 23.1% of loans outstanding as at 31 December 2018. Under thisprogramme, Afreximbank’s credit policies allow it to provide pre- and post-export financing directly tocorporates with balance sheet size of at least U.S.$2 million and an annual trade turnover of at leastU.S.$10 million. The financing provided is usually short-term and trade related. Lending under theprogramme is limited to a maximum of 75 to 80% of the value of the underlying sales contract for pre-and post-export transactions respectively, 70% of the underlying sales contract for import financing (letterof credit issuance), and 100% for the Bank’s export credit guarantee. The average yield for thisprogramme was 4.6%, 5.6%, 5.7% for the years ended 31 December 2018, 2017 and 2016, respectively.
Loans outstanding under this programme totalled U.S.$2,571 million as at 31 December 2018,(representing a 256.1% increase compared with 31 December 2017). The Direct Financing Programmerepresents the third largest programme in terms of the value of loans approved during 2018, withapprovals amounting to U.S.$2,436.7 million in 2018, up by 86.5% from U.S.$1,320.4 million in 2017,accounting for 19.6% of total approvals for the year ended 31 December 2018.
• Special Risks Programme
Under this programme, Afreximbank guarantees international and African banks with credit exposures toAfrican borrowers against certain country risk events. Coverage can be up to 100% of a lender’s exposureand typically covers exchange control regulation, moratorium on debt payment, and changes in lawaffecting the timing, currency or manner of debt repayment. Those utilising this programme can benefitfrom the various exemptions and preferred creditor status enjoyed by Afreximbank. There were no newapprovals in the years ended 31 December 2018 or 31 December 2017. Facilities under this programme
40
are demand-driven and in 2018 and 2017 there were no facilities requested under this programme. Twotypes of facilities are provided under this programme: (i) a Country Risk Guarantee Facility, under whichAfreximbank guarantees international and African banks with credit exposures to Africa against certaincountry risk events; and (ii) an Investment Guarantee Facility, under which Afreximbank offers InvestmentGuarantees to cover foreign direct investment inflows into Africa. As at 31 December 2018, there wasU.S.$61.9 million in outstanding loan guarantees under this programme, compared to U.S.$110.0 millionrecorded as at 31 December 2017. The decrease in outstanding loans as at 31 December 2018 was a resultof no transactions being approved under this programme in 2018.
• Financial Future-Flow Pre-Financing Programme
This programme accounted for 2.5% of Afreximbank’s gross loan portfolio for the year ended31 December 2018, compared with 4.3% of Afreximbank’s gross loan portfolio for the year ended31 December 2017. Financial future-flow transactions refer to future-flow debt offerings that rely uponreceivables other than those generated from the export of physical goods. Such receivables may includecredit card or cheques, migrant remittances, royalties arising from Bilateral Air Services Agreements(BASA), and over flight fees. Afreximbank uses this instrument in financing projects (e.g. airports, hotels,toll roads) that do not themselves have sufficient receivables to support any borrowing. Financingavailable under this programme is typically short- to mid-term. As at 31 December 2018, total loansoutstanding under this programme stood at U.S.$278.28 million, a decrease of 24.19% compared to31 December 2017 where total loans outstanding under this programme stood at U.S.$367.1 million. Thetotal loans outstanding under this programme decreased because there were no new approvals in 2018.
Export Development Scheme (“ED Scheme”)
Programmes and facilities under the ED Scheme (which is broad in scope) are targeted at creating exports andimproving export competitiveness. Such programmes ideally have tenors not exceeding seven years from theloan signature date, as provided under the Bank’s internal policies. The following programmes are operatedunder this scheme.
• Export Development Finance (“EDF”) Programme
This programme was launched on 1 July 2002. Under this programme, the Bank combines credit, riskbearing, twinning services (i.e. advisory services that both facilitate the acquisition of the latesttechnologies and assist in finding markets), market access and advisory services geared towards creatingnon-commodity export products for sale to a broad range of export markets. One of the aims of thisprogramme is to facilitate non-commodity export production (in order to diversify Africa’s exports awayfrom commodities), especially export manufacturing, targeted at exploiting certain bilateral andmultilateral market access opportunities open to Africa, for example, the African Growth andOpportunity Act of the U.S. Government, the European Union/Africa, Caribbean and Pacific Accordsas well as similar initiatives involving Africa and India, and Africa and China, amongst other initiatives.As at 31 December 2018, the Bank approved U.S.$475.15 million under the Programme.
• Project-Related Financing Programme
The purpose of this programme is to develop Africa’s export manufacturing capacity by supporting theimport of necessary equipment needed by African export manufacturers. Through this programme, theBank provides limited recourse financing in support of export projects, including mining, manufacturing,and related projects, and infrastructure projects that facilitate exports or that generate trade infrastructureservices, such as power, ports and telecommunications. As at 31 December 2018, there wasU.S.$246.67 million in loans outstanding under this programme, an increase of 25.25% compared to31 December 2017, when the figure was U.S.$196.9 million.
• Asset-Backed Lending Programme
As a result of privatisation and policy objectives in many African countries to increase indigenousparticipation in their various economies, there is a growing demand by African entrepreneurs for financingto enable them to take advantage of these opportunities. Through this programme, the Bank supportsAfrican content promotion in Africa’s oil, gas and other mining sectors, maritime transport, railways andairline industries, and takes collateral in the form of the assets used in such sectors, for example the rigsused by oil extraction companies. As at 31 December 2018, there was U.S.$164.14 million in loansoutstanding under this programme, compared with loans totalling U.S.$138.8 million as at 31 December2017 and loans totalling U.S.$41.4 million as at 31 December 2016.
41

Country Programme
Given the fragility of some African economies, sudden changes in the global economy have the potential toseverely and disproportionately weaken such countries. In 2001, the Bank introduced a Country Programme toaddress this need. The programme assists the Participating States facing difficulties such as war, naturaldisasters and severe economic instability, that are not amenable to solutions offered individually by the Bank’sother products. The Bank combines advisory services, guarantees, technical assistance and financing insupporting certain Participating States under the programme.
As at 31 December 2018, the Bank had three Country Assistance Programmes of U.S.$1.3 billion inoperation—one in Zimbabwe in the amount of U.S.$400 million which was put in place in 2007, one for theRepublic of Sudan in the amount equivalent to U.S.$350 million which was put in place in 2012, and one inCôte d’Ivoire in the amount of U.S.$550 million, which was put in place in 2013. The Bank is in discussionswith Cabo Verde and Burundi in respect of establishing Country Programmes to support the economic recoveryplans in those countries, and also to support imports of essential goods and development of key trade-relatedinfrastructure. In 2018, the Bank approved loans totalling U.S.$1,191.34 million under this programme,compared with U.S.$883.4 million in 2017. There were outstanding loans under this programme totallingU.S.$1,381.55 million as at 31 December 2018, compared with loans totalling U.S.$1,176.6 million as at31 December 2017, an increase of 17.42%.
Supplier and Buyer Credits Programme
This programme supports African manufacturers and importers of engineering equipment and capital goods,and promoters of turnkey projects. The Bank’s Supplier Credit Facility permits African exporters of goods andequipment to give credit to their buyers for a period ranging from six months to seven years. The exporter isfinanced by the Bank against appropriate guarantees.
Under the Bank’s Buyer Credit Facility, the exporter of the goods and equipment is paid while the Bankreceives payment in due course from the buyer of the exported goods and equipment.
Guarantee Programme Related to Obtaining Large Contracts
In order to assist African engineering, infrastructure management and operating companies (such as telecomand power operators, hotel operators, port managers and specialised project companies) in achieving near-equalfooting with their competitors in bidding for African businesses, the Bank intends to provide guaranteefacilities to qualifying beneficiaries. This programme is not currently operational due to the Bank currentlybuilding capacity and expertise in some of the other ED Scheme programmes. However, the Bank intends thatthis programme will become operational by the end of 2021.
Guarantee Programme in Support of African Government Commitments to Project Promoters
This programme aims to provide for investment to rebuild and modernise decaying infrastructure in Africancountries. The costs of such investments are expected to run into billions of U.S. dollars, far in excess of whatmany African economies can afford. One of the Bank’s activities is the promotion and dissemination of public-private partnerships, implemented on the basis of “Build-Operate-Transfer” (“BOT”) schemes and variantsthereof. To attract foreign partners to invest in such projects normally requires governments to make certaincommitments that may be financial, fiscal or legal. The Bank intends that this programme will be a source offinancial support and will become operational by the end of 2021.
Afreximbank Guarantee Programme
In November 2017, the Bank launched the Afreximbank Guarantee Programme (“AFGAP”), a major newprogramme that aims to unlock capital and increase leveraged financing offered into Africa. The Programme isintended to play a major role in de-risking African transactions to make them more attractive to African andinternational investors and financiers. It offers a wide range of credit enhancement solutions to African clientsas part of the Bank’s Exim-plus strategy that was developed by the Bank to position itself as a comprehensivetrade facilitation and financing centre in Africa. Some of the key programmes and facilities under AFGAP,include the Afreximbank LC Confirmation Guarantee; the Country Risk Guarantee Facility; the Letter ofGuarantee Facility; the Note Purchase Cover; the Buyer/Supplier Credit Guarantee; the Project FinanceGuarantee; the Investment Guarantee; the ECA Plus Guarantee; the Sovereign Obligations Guarantee; BondingFacilities; the Construction Completion Guarantee; and the Trade Contract Availability Guarantee Facility.
42

Loans Facilitation Programme
Under the Export Credit Agency (“ECA”) Loans Facilitation Programme, the Bank selectively works withother ECAs to promote the acquisition of essential goods, especially capital goods by African institutions.
Through this programme, the Bank provides guarantees to enable ECAs to finance eligible imports into Africa.The Bank may also take lines of credit from ECAs for direct distribution to its clients for importation of goodsfrom the country of origin of the creditor ECA. Under the programme, the Bank also grants lines of credit toECAs to support Africa’s exports to the country of origin of the ECAs.
Investment Banking Programme
Under this programme, the Bank provides various services including advisory, underwriting, valuation,securitisation, brokerage and arrangement services. This programme allows the Bank to promote thedevelopment of entrepreneurship in Africa and also helps to develop the African capital markets. In 2018, 43mandates were signed in relation to arranged or co-arranged deals under this Programme. The Bank hasprovided advice relating to the implementation of government policies, project financings and structuring oftransactions.
Trade Information Programme
The Bank’s Planning and Business Development Department provides African banks, exporters and foreigninvestors with relevant information on African economies, commodities and markets.
Afreximbank Central Bank Deposit/Investment Programme (“CENDEP”)
In 2015, the Bank introduced its new Central Bank Deposit/Investment programme, which is a deposit productthat aims to harness Africa’s external reserves and support the continent’s trade and economic developmentefforts by mobilising part of the foreign exchange reserves of African central banks to fund viable trade andproject ventures in Africa while providing favourable returns on their deposits. The core objectives of CENDEPare to:
(i) expand export finance capacity in countries that participate in CENDEP;
(ii) enable the Bank to provide term loans in support of value-added exports in countries which are CENDEPdepositors;
(iii) help finance essential imports to countries that participate in CENDEP; and
(iv) contribute to on-going efforts to improve regional trade and integrate African economies by supportingintra-African trade flows.
Under this programme, the Bank, in partnership with a range of African central banks, African Governmentsand African governmental agencies, has introduced three specialised financial products:
• the Time Deposit Account (“TDA”), which targets African central banks with reserve holdings in excessof their short-term external payment obligations falling due within one year and/or external reserves overand above what is needed to fund four to eight months of imports;
• the National Export Support Account (“NESA”), which is a special account to be held by African centralbanks with surplus external reserves over and above their country’s short term external financingrequirements for the sole purpose of pre-financing national exports into other African countries. Althoughthe Bank remains the prime obligor under the transaction, the expectation is that the national economy ofthe deposit-making central bank should benefit from increased foreign exchange earnings as a result ofincreased exports and a better return on its NESA held with the Bank. Transactions under NESA usuallyhave tenors of more than 180 days from contract signing to the payment date; and
• the Afreximbank Investment Account (“AIA”), which is a form of negotiable certificate of deposit withmaturities of between one to three years. With this account, a deposit-making central bank could, on thebasis of its foreign exchange needs, and assessment of possible variation in export earnings, FDI inflows,and remittance receipts, among other considerations, negotiate the terms of the deposit/ investment accountwith a view to arriving at a mutually acceptable terms for the placement.
Further, an African central or reserve bank which places a deposit under CENDEP may be eligible forconsideration for a standby credit facility (“SCF”) from the Bank under the Bank’s COTRALF facility underthe Line of Credit Programme (see “ —Counter-Cyclical Trade Liquidity Facility” below) which is intended to
43
provide a buffer against unanticipated increases in demand for foreign currency occasioned by terms of tradeand/or aid shocks or national emergencies. The size of the SCF is determined after consultation withparticipating central bank and authorities of Participating States.
The Bank raised a total of U.S.$1.8 billion in deposits from African central banks and other African institutionsunder CENDEP during the year ended 31 December 2018. As at the date of this Registration Document, theBank held U.S.$2.57 billion of bank deposits from African central banks and other African institutions underCENDEP. In line with its Strategic Plan, the Bank is targeting the mobilisation of U.S.$10 billion of the totalexternal reserve holdings of African economies, which it estimates to have been approximatelyU.S.$400 billion as at 31 December 2018.
The maturity profile of the CENDEP deposits as at 31 December 2018 were U.S.$776 million for up to onemonth, U.S.$1,230 million for one to three months, U.S.$557 million for three to six months andU.S.$158 million for six to 12 months.
Counter-Cyclical Trade Liquidity Facility (“COTRALF”) (now fully repaid)
In 2015, the Bank introduced its Counter-Cyclical Trade Liquidity Facility, which formed part of the Line ofCredit Programme, to provide foreign currency liquidity in its Participating States to their central banks andeligible commercial banks supported or recommended by their central banks, to enable them to honour urgenttrade payment obligations. Central banks that participate and invest in the Bank’s CENDEP programme weregiven preference under COTRALF.
The main objective of COTRALF was to assist Participating States to manage the adverse effects of economicshocks that have led to, or may lead to, a significant decline in foreign currency earnings over a very shortperiod. Such decline may be commodity price or terrorism induced. The specific objectives were to:
• provide foreign currency liquidity support to central banks of Participating States, by way of direct loans,overdrafts, currency swaps, etc., to ensure that central banks are able to support commercial banks tosatisfy trade payment obligations;
• provide unfunded facilities, by way of guarantees, letters of credit and similar instruments, in support ofcommercial banks in Participating States, as may be agreed with the relevant central bank; and
• with the support of relevant central banks, provide funded facilities to commercial banks in ParticipatingStates to enable them meet their obligations under trade finance payment rights that may have fallen duebut which the banks are unable to meet due to unavailability of foreign exchange from their central banksor usual markets.
Where facilities granted under COTRALF related to financing for imports, such imports must be for essentialgoods and for the productive and export-generative sectors, and should not include luxury goods. Preferencewas given to imports from other African and developing countries or imports that would be processed by alocal manufacturer for export to Africa and other markets.
Loans under COTRALF tended to have above average facility amounts owing to their high quality collateralbacking (including in the form of deposits under CENDEP) and short-term nature. As a result of Africaneconomies having experienced a marked improvement during the course of 2017, and in line with its initialplan, the Bank began to wind-down COTRALF in 2017. A large proportion of COTRALF (aboutU.S.$3.2 billion) was repaid during the period November to December 2017, with the last facility repaid inJune 2018. Total COTRALF utilisation amounted to U.S.$9.5 billion, including rollovers, over the approvedperiod.
The Bank believes that the COTRALF had a significant positive impact on the economies that benefitted fromthe facility. The relevant borrowing countries averted trade debt payment difficulties and COTRALF enabledthe countries to introduce more market-oriented foreign exchange policies and accordingly enhanced therelevance of the Bank, as evidenced by the increase in the number of Participating States who participated inthe two years of the COTRALF programme and the increase in equity contributions from existing ParticipatingStates.
Project Preparation Facility
On 8 November 2018, the Bank launched the Project Preparation Facility (“PPF”) which aims to assist Africangovernments and corporates to prepare and develop projects from concept stage to bankability. The PPF willfast track the supply of bankable projects and thereby help to bridge Africa’s project finance gap. The PPF hasthe objective of not only leveraging off the private sector’s financial resources but also tapping into its
44

technical expertise and fostering closer public-private sector collaboration. The PFF also aims to supporttransactions that seek to implement projects that support export growth and diversification, facilitate theassimilation of African commodities into global value chains, or increase the volume and flow of tradeablegoods and services along Africa’s trade corridors, among others. The facility is now available for use byinterested parties with qualifying projects.
Fund for Export Development (“FEDA”)
The Bank’s board of directors has approved the setting up of FEDA, a fund platform for investment in exportdevelopment. FEDA will be the instrument that is used to develop Industrial Parks and Export ProcessingZones. FEDA will also be used to accelerate foreign direct investment into Africa’s export sector. The majorityof the focus will be on SMEs which represent 90% of business in Africa
FEDA supports fulfilment of two of the Bank’s key strategic pillars under Impact 2021:
• supporting Intra-African trade; and
• industrialisation and export development.
Other Programmes
The Bank established two other programmes: Afreximbank Trade Facilitation Programme (“AFTRAF”) andAfreximbank Pan-African Payment and Settlement System (“PAPSS”). AFTRAF is an uncommitted short-termrevolving trade finance facility that is available to African banks and is aimed to enhance confidence ofcounterparties. PAPSS is designed to formalise cross-border trade, address payment challenges and reduce costsof completing trade. It was established to drive economic and financial integration in Africa. PAPSS is acentralised payment and settlement infrastructure and it is intended that it will define a common framework fortransacting, clearing and settling cross-border transaction, operate independently of domestic payment systemsand allow participants to exchange payments in local currency on a daily basis. Some of the potential benefitsof PAPSS include: the expansion of intra-Africa and investment flows, the attraction of investment capital, thecreation of new business opportunities and employment across Africa, the diversification of trade, the liquidityof cost savings and the reduction in operational costs for central and commercial banks.
45
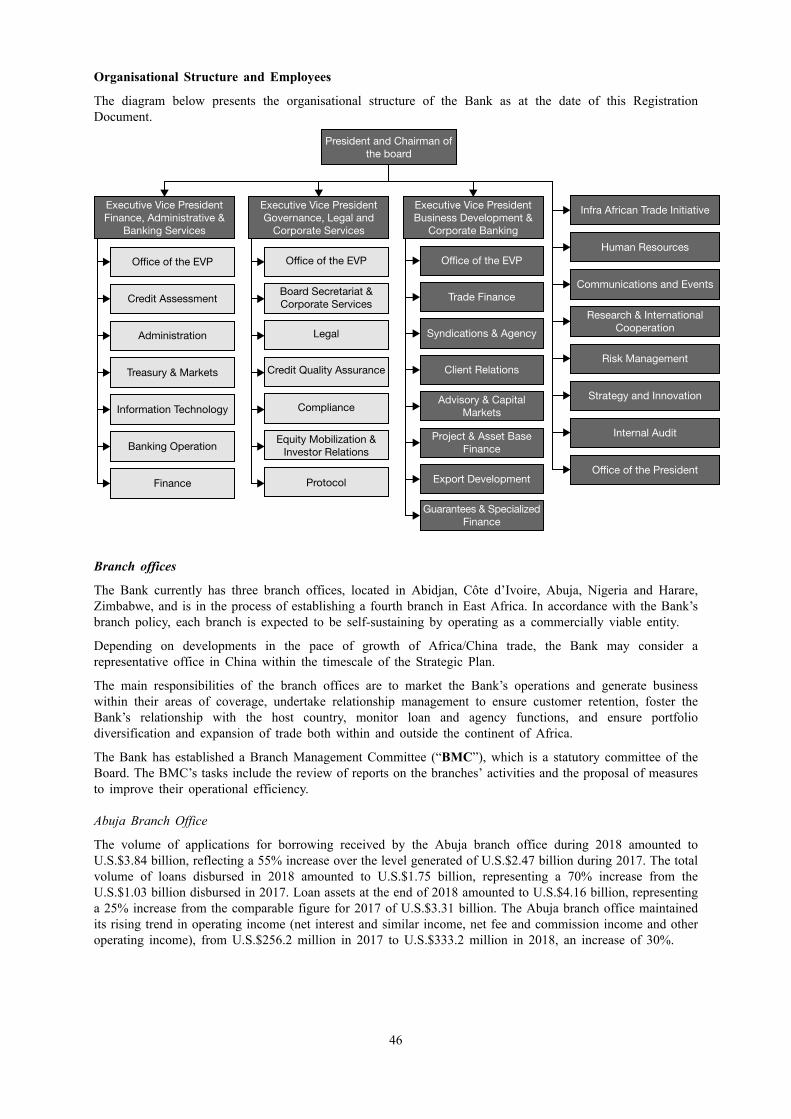
Organisational Structure and Employees
The diagram below presents the organisational structure of the Bank as at the date of this RegistrationDocument.
President and Chairman ofthe board
Executive Vice PresidentFinance, Administrative &
Banking Services
Executive Vice PresidentGovernance, Legal and
Corporate Services
Executive Vice PresidentBusiness Development &
Corporate Banking
Infra African Trade Initiative
Human ResourcesOffice of the EVPOffice of the EVP
Board Secretariat &Corporate Services
Legal
Compliance
Credit Quality Assurance
Equity Mobilization &Investor Relations
ProtocolFinance
Banking Operation
Information Technology
Treasury & Markets
Administration
Credit Assessment
Office of the EVP
Trade Finance
Syndications & Agency
Client Relations
Advisory & CapitalMarkets
Project & Asset BaseFinance
Export Development
Guarantees & SpecializedFinance
Communications and Events
Research & InternationalCooperation
Risk Management
Strategy and Innovation
Internal Audit
Office of the President
Branch offices
The Bank currently has three branch offices, located in Abidjan, Côte d’Ivoire, Abuja, Nigeria and Harare,Zimbabwe, and is in the process of establishing a fourth branch in East Africa. In accordance with the Bank’sbranch policy, each branch is expected to be self-sustaining by operating as a commercially viable entity.
Depending on developments in the pace of growth of Africa/China trade, the Bank may consider arepresentative office in China within the timescale of the Strategic Plan.
The main responsibilities of the branch offices are to market the Bank’s operations and generate businesswithin their areas of coverage, undertake relationship management to ensure customer retention, foster theBank’s relationship with the host country, monitor loan and agency functions, and ensure portfoliodiversification and expansion of trade both within and outside the continent of Africa.
The Bank has established a Branch Management Committee (“BMC”), which is a statutory committee of theBoard. The BMC’s tasks include the review of reports on the branches’ activities and the proposal of measuresto improve their operational efficiency.
Abuja Branch Office
The volume of applications for borrowing received by the Abuja branch office during 2018 amounted toU.S.$3.84 billion, reflecting a 55% increase over the level generated of U.S.$2.47 billion during 2017. The totalvolume of loans disbursed in 2018 amounted to U.S.$1.75 billion, representing a 70% increase from theU.S.$1.03 billion disbursed in 2017. Loan assets at the end of 2018 amounted to U.S.$4.16 billion, representinga 25% increase from the comparable figure for 2017 of U.S.$3.31 billion. The Abuja branch office maintainedits rising trend in operating income (net interest and similar income, net fee and commission income and otheroperating income), from U.S.$256.2 million in 2017 to U.S.$333.2 million in 2018, an increase of 30%.
46

Abidjan Branch Office
The volume of applications for borrowing received by the Abidjan branch office during 2018 amounted toU.S.$2.9 billion, reflecting a 53% increase over the level generated of U.S.$1.9 billion in the year ended31 December 2017. The Executive Committee of the Board of Directors approved transactions amounting toU.S.$698.1 million in 2018. The volume of outstanding loans at the end 2018 amounted to U.S.$1.7 billion.Operating income generated by the branch stood at U.S.$121.0 million in 2018, compared to U.S.$93.7 millionin 2017, representing an increase of 30%.
Harare Branch Office
During 2018, the volume of applications for borrowing received by the Harare branch office increased by 60%year-on-year to U.S.$7.24 billion compared to U.S.$4.54 million in 2017, representing an increase of 59%. Ofthis volume, transactions approved by the Executive Committee of the Board of Directors amounted toU.S.$4.09 billion in 2018, representing an increase of 40% compared to the level of U.S.$2.93 million in 2017.The volume of operational facilities at the end of the review period amounted to U.S.$1.42 billion, representingan increase of 40% compared to U.S.$1.01 billion in 2017. These trends in the business activities of the Hararebranch office translated into operating income (net interest and similar income, net fee and commission incomeand other operating income) attributable to the Branch of U.S.$136.59 million, a 54.1% increase whencompared to U.S.$88.6 million in 2017. The ultimate beneficiaries of the loans are mainly from the followingsectors: financial services, hospitality, power, agro-processing, oil & gas and agriculture.
East Africa Branch Office
On 20 September 2019, the Bank and the Republic of Uganda signed a branch office agreement for the Bank toestablish its East Africa Branch Office (“EABO”) in Kampala, Uganda. Prior to the signing of the agreement,the Bank had stationed employees in the region in order to service business there. The volume of applicationsfor borrowing received by the EABO during 2018 amounted to U.S.$2.7 billion. The Executive Committee ofthe Board of Directors approved transactions amounting to U.S.$761 million for 2018.
Employees
As at 30 June 2019, Afreximbank had a total of 208 full-time employees (compared with 201 as at31 December 2018, 189 as at 31 December 2017, 166 as at 31 December 2016, 146 as at 31 December 2015,127 as at 31 December 2014 and 107 as at 31 December 2013). The Bank targets the number of full-timeemployees to increase to approximately 320 by 31 December 2021.
The Bank has in place a retirement scheme which applies to all permanent staff on a defined contributionstructure. Under this scheme, the Bank contributes 20% of the employee’s monthly basic salary (17% towards apension and 3% towards a post-retirement medical scheme). The employees contribute 10% of their monthlybasic salary (8.5% towards a pension and 1.5% towards a post-retirement medical scheme). In addition,employees can make an individual voluntary contribution over their 10% contribution but the Bank does notmatch this additional voluntary contribution. The Bank also has in place a provident fund scheme whichoperates on a defined contribution basis. This provident fund scheme closed to new employees on 31 December2017.
The Bank also provides its employees with medical and personal accident insurance schemes, for which itcontributes 100% of the cost.
Technology
Afreximbank is engaged in a process of continuous improvement with respect to its information andcommunications technology (“ICT”) systems. The Bank runs Salesforce software for its Customer RelationshipManagement (“CRM”) and business origination processes. It runs SAP Enterprise Resource Planning Software(“SAP ERP”) and Quantum Treasury Management System from FIS/SunGard for its back office operations.The SAP ERP automated the core functions of Finance, Human Capital Management, loans administrationactivities, procurement and account payables. OPTIMIST from FIS automated credit assessment processes. Thebank uses the SWIFT system, a secure financial communication network, for its banking transactions.
In the year ended 31 December 2018, several enhancements were made to the Bank’s ICT systems. Notably,the core banking software was successfully upgraded to improve banking operations. The Bank investedU.S.$7 million on improvements to its ICT systems. It is expected that the capital expenditures between 2019and the end of 2021 will be approximately U.S.$25 million, which will cover both digital business
47

transformation as well as digital business optimisation projects. Operational expenditures are expected to totalU.S.$6 million per year, which will cover the costs of digital solution subscriptions, internet bandwidth,maintenance agreements and other recurring costs.
Future Roadmap
The ICT vision at the Bank is to be the enabler of agile, seamless information technology services and creativesolutions to achieve the vision of the Bank. To this end, the Bank’s ICT Department is targeting an integratedapplication model to provide a high level of automation and data integrity. Accordingly, the Bank’s current andplanned automation initiatives include:
• upgrading the Bank’s Core Banking Application, which seeks to enhance internal efficiency and provideeffective processing management and reporting of the Bank’s programmes and facilities under theStrategic Plan;
• development of a Pan African Payment and Settlement Platform, in order to formalise cross-border tradewhile addressing its challenges in Africa and seeking to reduce its costs;
• creation of a Trade Information Portal, to bridge the information gap in Africa and serve as a single,authoritative reference point for all trade-related information in the African context;
• implementation of a Customer Due Diligence and Anti-Money Laundering System, which would provide asingle source of primary data required for performing customer due diligence checks on counterparties inAfrica and seek to reduce challenges relating to on-boarding customers and business relationships;
• upgrading the Bank’s Treasury Management System; and
• upgrading the Bank’s Unified Communication System.
Data and Technology Infrastructure
The Bank’s ICT infrastructure is comprised of HP Blade servers and an HP 3 Par storage system with aneffective capacity of 26 Terabytes. The network comprises of 210Mbps internet bandwidth capacity in Cairoconnected over a Virtual Private Network to regional offices with full failover redundancy.
The Bank also implemented the Laser Fiche Document Management system to facilitate digitalisation ofdocuments and records management.
The Bank considers that its current ICT infrastructure is robust and scalable for both its current level ofoperations and its future expansion plans.
Information Security Systems
The Bank places a lot of emphasis on the security of its ICT environment, and it has implemented variousinitiatives to minimise the risk of unauthorised access to its systems. The Bank’s local area network (“LAN”) isprotected by a firewall. In addition to other controls like the password policy, remote access policy and physicalaccess policy, the data centre is monitored by CCTV cameras and is equipped with an access control system.As at the date of this Registration Document, the Bank has not experienced any instances of hacking or serioussecurity breaches of its ICT environment.
Disaster Recovery Plan
The Bank’s ICT disaster recovery plan leverages cloud-based disaster recovery secure site on Microsoft’s AzurePlatform. The primary data centre site replicates the disaster recovery site with a recovery time objective of24 hours. The Bank conducts annual disaster recovery simulation to test both its recovery time objective andrecovery point objective. In the year ended 31 December 2018, a fully functional disaster recovery site wassuccessfully tested outside Egypt and separate business continuity management readiness tests were also carriedout from offsite locations.
• Data Backup: Data is backed up on a daily basis and stored at a secure professional offsite vaulting andstorage location
• Contingency Plans: The Bank has equipped its branch office locations with extra computer systems for usein the event of international disaster recovery relocation.
• Service level agreements: The Bank has entered into service level agreements with various IT servicesproviders who provide ICT services 24 hours a day.
48

Management and Organisation Structures
The Bank has a number of governance systems and structures in place with respect to its ICT systems, whichinclude an IT steering committee, which is a committee that meets regularly to provide guidance on any ICTprojects that the Bank is undertaking.
The Bank has also put in place relevant ICT policies and procedures to guide its technology usage andoperation.
Properties, Plant and Equipment
The Bank’s headquarters are located at No. 72 (B) El Maahad El Eshteraky Street, Heliopolis, Cairo 11341,Egypt. The Bank owns the building located at El Maahad El Eshteraky, Plot No. (1, 1A, 10, 11, 12), BlockNo. 72(B), Heliopolis, Cairo, Egypt, which the Bank owns and has let to a number of international financeinstitutions and from which it earns rental income.
Legal Proceedings
There are no governmental, legal or arbitration proceedings (including any such proceedings which are pendingor threatened of which the Bank is aware) during the 12 months preceding the date of this RegistrationDocument which may have, or have had in the recent past, significant effects on the Bank’s financial positionor profitability.
49
SELECTED FINANCIAL AND OTHER INFORMATION
The following tables contain the Bank’s selected historical financial and operating information as at and for theyears ended 31 December 2018, 2017 and 2016 and as at and for the six months ended 30 June 2019 and 2018.The Bank has derived (i) the selected statement of profit or loss data and selected statement of cash flows datafor the years ended 31 December 2018, 2017 and 2016 and for the six months ended 30 June 2018 and 2019,and (ii) selected statement of financial position data as at 31 December 2018, 2017 and 2016 and as at 30 June2019, without adjustments, from the Special Purpose Financial Statements, which are included elsewhere in thisRegistration Document. This section should be read in conjunction with the Special Purpose FinancialStatements included in this Registration Document, as well as “Presentation of Financial and OtherInformation” and “Operating and Financial Review”.
With effect from 1 January 2018, the Bank adopted IFRS 9, Financial Instruments (“IFRS 9”) and IFRS 15,Revenue from Contracts with Customers (“IFRS 15”). The Bank has determined that the adoption of IFRS 15did not have a material impact on the Bank’s special purpose financial statements. The impact of the adoptionof IFRS 9 as at 31 December 2017 was reflected in the retained earnings as at 1 January 2018 as allowed as afirst time implementation in accordance with IFRS. Any adjustment to account for changes between IAS 39,Financial Instruments: Recognition and Measurement (“IAS 39”) and IFRS 9 at the transition date wererecognised in the opening retained earnings and other reserves of the 2017-2018 Special Purpose FinancialStatements. The 2016-2017 Special Purpose Financial Statements have not been restated to reflect the changesfrom the application of IFRS 9. The 2016-2017 Special Purpose Financial Statements applied IAS 18, Revenue(“IAS 18”) and IAS 39, which were the accounting standards in effect at the time of preparation of the 2016-2017 Special Purpose Financial Statements. Therefore, due to the adoption of IFRS 9 and IFRS 15, the 2017-2018 Special Purpose Financial Statements are not directly comparable with the 2016-2017 Special PurposeFinancial Statements.
The Bank has applied IFRS 16 from its mandatory adoption date of 1 January 2019. The Bank has applied it ina practical expedient manner on initial application. Where the lease term is less than 12 months or leases are oflow value items, the Bank has elected to use the short-term lease exemption. The Bank’s activities as a lessor/lessee are not material.
50

Special Purpose Statement of Financial Position Data
As at 30 June As at 31 December2019 2018 2017 2016
(U.S.$’000)AssetsCash and cash equivalents . . . . . . . . . . . . . . . . . 3,605,339 1,918,434 3,214,573 1,269,080Derivative assets held for risk management . . . . . . 6,628 3,684 3,574 8,792Loans and advances to customers . . . . . . . . . . . . . 11,395,028 11,134,424 8,545,716 10,148,202Prepayments and accrued income . . . . . . . . . . . . . 128,432 134,358 82,329 241,556Financial investments at amortised cost . . . . . . . . . 167,785 168,328 — —Financial investments held at maturity . . . . . . . . . . — — 30,268 30,268Other assets . . . . . . . . . . . . . . . . . . . . . . . . . . 18,391 13,988 2,931 3,069Property and equipment . . . . . . . . . . . . . . . . . . . 38,653 39,806 32,838 24,466Intangible Assets . . . . . . . . . . . . . . . . . . . . . . . 10,199 6,348 1,248 814Total Assets . . . . . . . . . . . . . . . . . . . . . . . . . . 15,370,455 13,419,370 11,913,477 11,726,247
LiabilitiesDerivative liabilities held for risk management . . . . 9,289 24,840 21,467 22,018Due to banks . . . . . . . . . . . . . . . . . . . . . . . . . 6,110,050 5,147,944 4,231,374 4,050,912Deposits and customer accounts . . . . . . . . . . . . . . 3,172,183 2,365,385 2,149,356 3,778,493Debt securities in issue . . . . . . . . . . . . . . . . . . . 3,029,399 3,027,717 2,881,622 2,091,114Other liabilities . . . . . . . . . . . . . . . . . . . . . . . . 348,208 293,737 505,624 157,342Total Liabilities . . . . . . . . . . . . . . . . . . . . . . . 12,669,129 10,859,623 9,789,443 10,099,879
Capital FundsShare capital . . . . . . . . . . . . . . . . . . . . . . . . . . 513,096 506,300 470,816 378,488Share premium . . . . . . . . . . . . . . . . . . . . . . . . 786,715 764,790 562,350 355,310Warrants . . . . . . . . . . . . . . . . . . . . . . . . . . . . . 166,756 191,531 91,723 98,716Reserves . . . . . . . . . . . . . . . . . . . . . . . . . . . . . 594,541 594,541 474,733 364,406Retained earnings . . . . . . . . . . . . . . . . . . . . . . . 640,218 502,585 524,412 429,448Total Capital Funds . . . . . . . . . . . . . . . . . . . . 2,701,326 2,559,747 2,124,034 1,626,368Total Liabilities and Capital Funds . . . . . . . . . . 15,370,455 13,419,370 11,913,477 11,726,247
51

Special Purpose Statement of Profit or Loss and Other Comprehensive Income Data
Period ended30 June Year ended 31 December
2019 2018 2018 2017 2016(U.S.$’000)
Interest and similar income using the effectiveinterest method . . . . . . . . . . . . . . . . . . . . . . 473,365 314,809 709,478 606,074 484,012
Interest and similar expense using the effectiveinterest method . . . . . . . . . . . . . . . . . . . . . . (229,440) (139,272) (305,654) (267,749) (210,758)
Net interest and similar income . . . . . . . . . . . 243,925 175,537 403,824 338,325 273,254
Fee and commission income . . . . . . . . . . . . . . . 24,474 28,240 93,717 39,245 36,290Fee and commission expense . . . . . . . . . . . . . . (4,213) (5,201) (10,029) (8,883) (5,855)Net fee and commission income . . . . . . . . . . . 20,261 23,039 83,688 30,362 30,435
Other operating income . . . . . . . . . . . . . . . . . . 482 1,312 2,321 3,439 1,675Personnel expenses . . . . . . . . . . . . . . . . . . . . . (25,354) (21,011) (46,984) (38,758) (32,283)General and administrative expenses . . . . . . . . . . (18,336) (17,775) (36,292) (24,672) (19,325)Depreciation and amortisation expense . . . . . . . . (2,375) (2,131) (4,315) (3,113) (4,483)Exchange adjustments . . . . . . . . . . . . . . . . . . . (330) (1,585) (2,337) (1,641) 2,124Fair value gain/(loss) from derivatives . . . . . . . . 12,530 (15,327) (5,126) (4,718) —Cashflow hedges . . . . . . . . . . . . . . . . . . . . . . — — — (13,476) —Credit losses on financial instruments . . . . . . . . . (93,170) (66,552) (118,877) (65,254) (86,363)Profit for the period . . . . . . . . . . . . . . . . . . . 137,633 75,507 275,902 220,494 165,034
Other comprehensive income . . . . . . . . . . . . .Other comprehensive income to be reclassifiedto profit or loss in subsequent periods
Cashflow hedges . . . . . . . . . . . . . . . . . . . . . . — — — — (33,087)Gains (losses) on revaluation of land and buildings — — 9,491 9,279 (18,650)Total items that will not be reclassified to profitor loss in subsequent periods . . . . . . . . . . . . — — 9,491 9,279 (18,650)
Total other comprehensive income . . . . . . . . . . — — 9,491 9,279 (51,737)Total comprehensive income for end of period/year . . . . . . . . . . . . . . . . . . . . . . . . . . . . . 137,633 75,507 285,393 229,773 113,297
52

Special Purpose Statement of Cash Flows Data
Period ended 30 June Year ended 31 December2019 2018 2018 2017 2016
(U.S.$’000)Cash flows from operating activitiesProfit for the period . . . . . . . . . . . . . . . . . . . . 137,633 75,507 275,902 220,494 165,034Adjustment for non-cash itemDepreciation of property and equipment . . . . . . . . 2,001 2,001 3,818 2,641 3,861Amortisation of intangible assets . . . . . . . . . . . . . 372 130 500 472 622Net interest income . . . . . . . . . . . . . . . . . . . . . — — (403,824) (338,325) (273,254)Impairment on loans and advances . . . . . . . . . . . . — — 117,257 63,397 82,747Impairment loss on investment securities . . . . . . . . — — 1,130 598 1,074Impairment on accrued income . . . . . . . . . . . . . . — — 123 1,259 2,542Leave pay expense . . . . . . . . . . . . . . . . . . . . . . — — 367 206 306Fair value loss on derivative instruments . . . . . . . . (12,530) 15,327 5,126 18,194 —Gain on disposal of property and equipment . . . . . . — — — — (7)Expected credit losses provisions on financialinstruments . . . . . . . . . . . . . . . . . . . . . . . . . 93,170 66,552
Changes inMoney market placements (maturity more than3 years) . . . . . . . . . . . . . . . . . . . . . . . . . . . — — 2,244,638 (2,094,442) (150,196)
Prepayments and accrued income . . . . . . . . . . . . . 13,100 (68,526) (52,152) (54,624) (28,959)Derivative instruments . . . . . . . . . . . . . . . . . . . . (5,965) 586 (1,863) (52) 3,163Other assets . . . . . . . . . . . . . . . . . . . . . . . . . . (4,403) (809) (11,057) (460) (1,083)Other liabilities . . . . . . . . . . . . . . . . . . . . . . . . 63,343 (292,914) (217,342) 346,892 22,026Deposits and customer accounts . . . . . . . . . . . . . . 806,798 (601,518) 216,029 (1,629,137) 2,470,350Loans and advances to customers . . . . . . . . . . . . (366,325) (454,805) (2,680,869) 1,754,862 (4,199,901)
727,194 (1,258,469) (502,217) (1,708,025) (1,901,675)
Interest received . . . . . . . . . . . . . . . . . . . . . . . . — — 537,860 559,979 411,773Interest paid . . . . . . . . . . . . . . . . . . . . . . . . . . — — (279,635) (224,835) (178,182)Net cash inflows / (outflows) used in operatingactivities . . . . . . . . . . . . . . . . . . . . . . . . . . . 727,196 (1,258,469) (243,992) (1,372,881) (1,668,084)
Cash flows from investing activitiesPurchases and additions to property and equipment . (847) (863) (7,112) (2,640) (2,472)Proceeds from sale of property and equipment . . . . — — — — 7Purchases of intangible assets . . . . . . . . . . . . . . . (4,224) — — — —Purchase of treasury bills . . . . . . . . . . . . . . . . . . — — (139,190) — —Net cash outflow from investing activities . . . . . . (5,071) (863) (146,302) (2,640) (2,465)
Cash flows from financing activitiesNet cash from capital subscriptions and sharepremium . . . . . . . . . . . . . . . . . . . . . . . . . . . 28,721 125,427 209,462 283,790 204,205
Proceeds from issue of warrants . . . . . . . . . . . . . — — 191,531 191,582 98,716Retirement of warrants . . . . . . . . . . . . . . . . . . . (24,775) (49,227) (91,723) (198,575) (46,316)Dividends paid . . . . . . . . . . . . . . . . . . . . . . . . (2,952) (2,872) (33,143) (21,195) (20,254)Proceeds from borrowed funds and debt securities . . 3,202,593 1,458,598 3,305,466 9,339,015 7,226,436Repayment of borrowed funds and debt securities . . (2,238,806) (1,761,944) (2,242,800) (8,368,045) (5,497,446)Net increase in due to banks and debt securities . . . 963,787 303,346 — — —Net cash inflow from financing activities . . . . . . 964,781 376,674 1,338,793 1,226,572 1,965,341Net increase (decrease) in cash and cashequivalents . . . . . . . . . . . . . . . . . . . . . . . . . 1,686,904 (882,658) 948,499 (148,949) 294,792
Cash and cash equivalents at 1 January . . . . . . . 1,918,435 3,214,573 969,935 1,118,884 824,092Cash and cash equivalents at end of period/year . 3,605,339 2,331,915 1,918,434 969,935 1,118,884
Represented in:Cash and Cash Equivalents as represented in thestatement of financial position . . . . . . . . . . . . . 3,605,339 2,331,915 1,918,434 3,214,573 1,269,080
Money market placements—maturity more than3 months . . . . . . . . . . . . . . . . . . . . . . . . . . . — — — (2,244,638) (150,196)
Cash and cash equivalents at for end of period/year . . . . . . . . . . . . . . . . . . . . . . . . . . . . . . 3,605,339 2,331,915 1,918,434 969,935 1,118,884
53

Selected Financial Ratios and Other Information
As at and for thePeriod ended 30 June
As at and for theYear ended 31 December
2019 2018 2018 2017 2016
Net interest margin(1) . . . . . . . . . . . . . . . . . . . . . . . . . 3.3% 3.2% 3.5% 2.6% 2.7%Cost/income ratio(2) . . . . . . . . . . . . . . . . . . . . . . . . . . 17.4% 20.5% 17.9% 17.9% 18.4%Cost of risk(3) . . . . . . . . . . . . . . . . . . . . . . . . . . . . . . 1.6% 1.4% 1.0% 0.7% 0.8%Return on average equity(4) . . . . . . . . . . . . . . . . . . . . . 10.5% 7.1% 11.8% 11.8% 11.4%Return on average assets(5) . . . . . . . . . . . . . . . . . . . . . . 1.9% 1.3% 2.2% 1.9% 1.8%Operating expenses/average total assets(6) . . . . . . . . . . . . . 0.32% 0.33% 0.7% 0.6% 0.6%Non-performing loans as a percentage of loan portfolio(7) . . 3.0% 3.8% 3.0% 2.4% 2.4%Allowance for impairment as a percentage of loanportfolio(8) . . . . . . . . . . . . . . . . . . . . . . . . . . . . . . . 3.2% 4.1% 2.4% 2.1% 1.6%
Liquid assets as a percentage of total assets(9) . . . . . . . . . 23.46% 20.5% 14.3% 27.0% 10.8%Liquid assets as a percentage of total liabilities(10) . . . . . . . 28.5% 25.3% 17.7% 32.8% 12.6%Non-performing loans coverage ratio(11) . . . . . . . . . . . . . . 127.0% 116.0% 132.0% 144.0% 133.0%Dividend payout ratio(12) . . . . . . . . . . . . . . . . . . . . . . . — — 25.0% 26.1% 23.0%Gross loans and advances CAGR(13) . . . . . . . . . . . . . . . . 20%(14)
(1) Net interest margin is defined as net interest income over annual average interest-bearing assets. Net interest margin for the yearsended 31 December 2014 and 2015 was 3.9% and 3.6%, respectively.
(2) Cost/income ratio is defined as operating expenses (personnel expenses, general and administrations expenses, and depreciationand amortisation expenses) over operating income (net interest and similar income, net fee and commission income and otheroperating income).
(3) Cost of risk is defined as credit losses on financial instruments over gross loans and advances (loans and advances at amortisedcost and fair value through profit or loss). Cost of risk for the years ended 31 December 2014 and 2015 was 1.4% and 1.2%,respectively. When calculated as credit losses over average net loans, cost of risk amounted to 1.2% in the year ended31 December 2018 and 1.0% in the year ended 31 December 2016.
(4) Return on annual average equity is defined as profit for the year over annual average capital funds. Return on average equity forthe years ended 31 December 2014 and 2015 was 13.5% and 11.42%, respectively. Figures for the periods ended 30 June 2019and 30 June 2018 are presented on an annualised basis.
(5) Return on average assets is defined as profit for the year over annual average total assets. Figures for the periods ended 30 June2019 and 30 June 2018 are presented on an annualised basis.
(6) Operating expenses/annual average total assets is defined as operating expenses (personnel expenses, general and administrationsexpenses and depreciation and amortisation expenses) over annual average assets.
(7) Non-performing loans as a percentage of loan portfolio is defined as impaired loans over total gross loans and advances (loansand advances at amortised cost and fair value through profit or loss). Non-performing loans as a percentage of the loan portfoliofor the years ended 31 December 2014 and 2015 were 3.8% and 2.8%, respectively.
(8) Allowance for impairment as a percentage of loan portfolio is defined as allowance of impairment as presented in the balancesheet over gross loan and advances (loans and advances at amortised cost and fair value through profit or loss).
(9) Liquid assets as a percentage of total assets is defined as cash and cash equivalents divided by total assets.
(10) Liquid assets as a percentage of total liabilities is defined as cash and cash equivalents divided by total liabilities.
(11) Non-performing loans coverage ratio is defined as accumulated provisions (specific provision IAS 39 / stage 3 IFRS 9) plus valueof collateral, divided by impaired loans. Non-performing loans coverage ratio for the years ended 31 December 2014 and 2015was 134% and 137%, respectively.
(12) Dividend payout ratio is defined as dividends distributed from net income divided by net income. Dividend payout ratio for theyears ended 31 December 2014 and 2015 was 23.0% and 23.0%, respectively.
(13) Gross loans and advances CAGR is defined as compound annual growth rate of gross loans and advances (loans and advances atamortised cost and fair value through profit or loss).
(14) This percentage represents the gross loans and advances (loans and advances at amortised cost and fair value through profit orloss) CAGR for 1 January 2015 to 30 June 2019.
54

OPERATING AND FINANCIAL REVIEW
The following discussion of the financial condition and results of operations of the Bank as at and for the yearsended 31 December 2016, 2017 and 2018 and as at and for the six months ended 30 June 2018 and 2019should be read in conjunction with the Special Purpose Financial Statements and the information relating to theBank’s business included elsewhere in this Registration Document. This review contains forward-lookingstatements that involve risks and uncertainties. The Bank’s actual results could differ materially from thoseincluded in these forward-looking statements as a result of certain factors. See “Risk Factors” and “ImportantInformation about this Registration Document—Forward-Looking Statements” for a discussion of importantfactors that could cause the Bank’s actual results to differ materially from the forward-looking statementscontained herein.
With effect from 1 January 2018, the Bank adopted IFRS 9, Financial Instruments (“IFRS 9”) and IFRS 15,Revenue from Contracts with Customers (“IFRS 15”). The Bank has determined that the adoption of IFRS 15did not have a material impact on the Bank’s special purpose financial statements. The impact of the adoptionof IFRS 9 as at 31 December 2017 was reflected in the retained earnings as at 1 January 2018 as allowed as afirst time implementation in accordance with IFRS. Any adjustment to account for changes between IAS 39,Financial Instruments: Recognition and Measurement (“IAS 39”) and IFRS 9 at the transition date wererecognised in the opening retained earnings and other reserves of the 2017-2018 Special Purpose FinancialStatements. The 2016-2017 Special Purpose Financial Statements have not been restated to reflect the changesfrom the application of IFRS 9. The 2016-2017 Special Purpose Financial Statements applied IAS 18, Revenue(“IAS 18”) and IAS 39, which were the accounting standards in effect at the time of preparation of the 2016-2017 Special Purpose Financial Statements. Therefore, due to the adoption of IFRS 9 and IFRS 15, the 2017-2018 Special Purpose Financial Statements are not directly comparable with the 2016-2017 Special PurposeFinancial Statements.
The Bank has applied IFRS 16 from its mandatory adoption date of 1 January 2019. The Bank has applied it ina practical expedient manner on initial application. Where the lease term is less than 12 months or leases are oflow value items, the Bank has elected to use the short-term lease exemption. The Bank’s activities as a lessor/lessee are not material.
Overview
Afreximbank is a supranational financial institution whose purpose is to facilitate, promote and expand intra-and extra-African trade. The Bank’s specific functions include: extending credit to eligible African exporters byproviding pre- and post-shipment finance; extending indirect credit to African exporters and importers ofAfrican goods through the intermediary of banks and other African financial institutions; promoting andfinancing trade between African states and other developing states; acting as intermediary between Africanexporters and African and non-African importers through the issuance of letters of credit, guarantees and othertrade documents in support of export-import transactions; promoting and providing insurance and guaranteeservices covering commercial and non-commercial risks associated with African exports; carrying out marketresearch; and providing auxiliary services aimed at expanding the international trade of African countries andboosting African exports. Substantially all of the Bank’s operating income (net interest and similar income, netfee and commission income and other operating income) is derived from these functions. The Bank has nosubsidiaries.
For the year ended 31 December 2018, the net interest and similar income represented U.S.$403.8 million, or82.4%, of the Bank’s operating income (net interest and similar income, net fee and commission income andother operating income), whereas net fee and commission income represented U.S.$93.7 million, or 17.1%.
Further, the Bank operates throughout Africa but the majority of its loans have been to entities located in WestAfrica, principally Nigeria, and to entities located in Egypt in North Africa. For the year ended 31 December2018, the Bank’s loans to entities in West Africa represented U.S.$5.5 billion, or 48.7%, of the Bank’s totalloans and entities in North Africa represented U.S.$2.9 billion, or 25.2%, of the Bank’s total loans.
For the year ended 31 December 2018, the Bank’s profit for the year was U.S.$275.9 million(2017: U.S.$220.5 million). As at 31 December 2018, the Bank’s total assets were U.S.$13,419.4 million(31 December 2017: U.S.$11,913.5 million).
Key Factors Affecting Results of Operations
The results of operations of the Bank are affected by a variety of factors. Set out below is a discussion of themost significant factors that have affected its results in the periods presented and which the Bank expects will
55

affect its results in the future. Factors other than those set forth below could also have a significant impact onthe results of operations and financial condition in the future. See “Risk Factors”.
Interest Rate Fluctuations
Changes in interest rates affect the Bank’s net interest income, net interest margin and overall results ofoperations. The Bank’s ability to increase net interest income and net interest margin is influenced by themargins the Bank can generate on its lending activities. Margins are, in turn, driven by the rates which theBank charges on its lending relative to its cost of funding. In the periods under review, net interest income andsimilar income increased to U.S.$403.8 million in the year ended 31 December 2018, from U.S.$338.3 millionin the year ended 31 December 2017 and U.S.$273.3 million in the year ended 31 December 2016, while netinterest margin increased to 3.5% in the year ended 31 December 2018 from 2.6% in the year ended31 December 2017 and 2.7% in the year ended 31 December 2016. The Bank’s lending book is priced offLIBOR, and as at 31 December 2018, 87% of the Bank’s loan portfolio was tied to LIBOR plus a margin. Theincreases were primarily driven by an increase in the size of the Bank’s loan portfolio and the interest ratescharged on its lending, which reflect an increase in LIBOR, offset in part by corresponding increases in the costof funding. The net interest margin decreased between 2016 and 2017 due to the growth in COTRALFtransactions which were largely secured by cash collateral. Due to the high-quality security/collateral, thepricing for COTRALF transactions was lower than that of other facilities, which had an impact on the netinterest margin during that period.
Interest rates are sensitive to many factors beyond the Bank’s control, including the policies of central banksand adverse African and international economic and political conditions. Furthermore, the Bank’s intentions toexpand and diversify its funding sources by continuing to access international capital markets may increasethese risks. The Bank closely monitors interest rate movements and seeks to limit its exposure by managing theinterest rate and maturity structure of the assets and liabilities carried on its balance sheet, occasionally throughthe use of interest rate swaps. See also “Risk Factors—Risks relating to the Bank’s operations—The Bank isexposed to market risks, including interest rate and currency risk, and its efforts to manage such risks may notbe successful”.
The Bank is exposed to risks resulting from mismatches between the interest rates on its interest-bearingliabilities and interest-earning assets. To the extent that the Bank’s assets may re-price more frequently than itsliabilities, if interest rates fall, the Bank’s interest expense will decrease more slowly than its interest income,which could negatively affect interest margins. As a measure to manage liquidity risk, the Bank matchesfloating rate liabilities to fund floating rate assets. Fixed rate liabilities are also matched with fixed rate assets.In cases where the fixed rate liabilities cannot be matched to fixed rate assets, the liability is swapped fromfixed rate to floating rate using interest rate swap derivatives. In addition, some of the agreements relating tothe Bank’s liabilities permit the Bank to submit LIBOR interest selection notices (for interest rate periods of 1,3 or 6 months), in order to select an interest rate that ensures it is matched against LIBOR interest applied onthe assets. See also “Risk Factors—Risks relating to the Bank’s financial position, in terms of composition andexposures”.
Although global financial conditions remained largely accommodative on the path of normalisation of monetarypolicy, which saw four interest rate hikes in the United States during 2018, sustaining financial marketperformance proved more challenging—especially after the year-end rout in equity and credit markets. After aboost to asset prices during the early part of 2018, largely fuelled by U.S. tax stimulus and improving investorsentiment, decelerating global growth—which also became less synchronised in 2018—weighed on financialmarkets in the latter part of the year. Reversals in capital flows from developing economies in a context ofrising U.S. interest rates and increasingly attractive U.S. assets weakened local currencies in some emergingand developing markets. In addition, concerns arising from uncertainty regarding the United Kingdom’s exitfrom the European Union persisted, while ongoing geopolitical tensions in some parts of the world intensified,heightening uncertainty and global volatility, which took its toll on equity prices. Overall, financial marketsstruggled, with most major stock indices ending the year down.
The pace of interest rate hikes, which started in December 2015 and accelerated in 2017 and 2018, with theU.S. Federal Reserve lifting short-term interest rates seven times over a 24-months period, was reversed withthe U.S. Federal Reserve cutting interests in July 2019 for the first time in over a decade. A benign inflationoutlook and signs of slowing economic growth both in the United States and globally have raised questions onthe approach to U.S. monetary policy, with the U.S Federal Reserve indicating it is taking a more patientapproach. At the same time, the interest rate trajectory is increasingly dictated by the process of monetarypolicy convergence on both sides of the Atlantic as well as U.S. trade. Still, the U.S. interest rate trajectory islikely to be shaped by other macroeconomic factors, most notably the fiscal incidence of the U.S. tax bill, the
56

trade balance and interest payments on incurring external debt. The markets are expecting further cuts in 2019and due to concerns that trade tensions with China and the economic slowdown in other countries couldadversely affect the U.S. economy. Likewise, even though the European Central Bank ended its QE programmeat the end of December 2018, it recently indicated that it may need to cut interest rates or purchase assets ifinflation continues to lag its target range, reflecting the fact that countries within the monetary zone are stillbattling with growth volatility and deceleration, including in Germany, the largest economy. If this trendcontinues, it could result in a reduction of cost of funds for the Bank, a development which could have apositive impact on its clients as borrowings may become cheaper.
For further information on the Bank’s interest rate risk management, see “Risk Management—Interest Rate RiskManagement”.
Foreign Exchange Fluctuations
The Bank’s working currency is the U.S. dollar. Increases and decreases in the value of the dollar versus othercurrencies affect the Bank’s results of operations. To the extent that the Bank has liabilities that are notdenominated in the same currency as related assets, exchange rate fluctuations have in some cases caused theBank’s liabilities to increase as a percentage of total assets. Both assets and liabilities that are denominated incurrency other than U.S. dollars are converted into U.S. dollars or Euro at the spot rates of the days on whichthey are recorded.
Changes in the Bank’s Assets and Liabilities
The Bank has historically held and currently holds significant amounts of assets comprising investmentsecurities. Given the mandate of the Bank of promoting trade finance in its member countries, the Bank hasfocused on increasing its lending volumes over the years. The Bank generates the majority of its interestincome from loans and advances to borrowers in Nigeria and Egypt. The average interest rate margin on theBank’s loans and advances was 3.46% for the year ended 31 December 2018, 2.64% for the year ended31 December 2017 and 2.72% for the year ended 31 December 2016.
The Bank introduced two new programmes during 2015, namely the COTRALF and CENDEP, each describedin greater detail in “Business—The Bank’s Programmes and Facilities”. CENDEP attracts deposits from centralbanks of the Bank’s Participating States. The COTRALF, which concluded in 2017, facilitated lending to theBank’s Participating States to cover short term funding needs, which could be collateralised by deposits fromtheir central banks under CENDEP. Any uncollateralised net exposure was designed to be minimal and in anyevent was not to exceed 20% of the size of the relevant deposit. For example, as at 31 December 2017, theBank had outstanding loans totalling U.S.$1.5 billion to two African central banks under the COTRALF andheld collateral against such loans in the form of U.S.$1.5 billion in deposits from the same two African centralbanks under CENDEP and local currency cash deposits, giving a net exposure of zero; there were no similarexposures as at 31 December 2018. By their nature, deposits under CENDEP may be short term and/orsignificant in size, which can lead to fluctuations in the Bank’s reported total assets and total liabilities as atany given reporting date.
The Bank’s cost of funding (i.e. the weighted average cost of funds) also increased (by 29.0% year-on-year)from 2017 to 2018 due to the effect of increasing benchmark rates (LIBOR) during the period. The averageinterest rate on the Bank’s interest bearing liabilities was 3.9% for the year ended 31 December 2018, 3.0% forthe year ended 31 December 2017 and 2.4% for the year ended 31 December 2016.
The following table sets forth the Bank’s cost of funding for the years ended 31 December 2018, 2017 and2016.
For the Year Ended 31 December2018 2017 2016
(U.S.$’000)Due to banks . . . . . . . . . . . . . . . . . . . . . . . . . . . . . . . . . . . . . . . . . 2.2% 2.6% 2.9%Debt securities in issue . . . . . . . . . . . . . . . . . . . . . . . . . . . . . . . . . . . 4.4% 3.8% 4.0%Shareholder and customer deposits . . . . . . . . . . . . . . . . . . . . . . . . . . . 0.8% 2.2% 1.3%Total . . . . . . . . . . . . . . . . . . . . . . . . . . . . . . . . . . . . . . . . . . . . . . 2.1% 2.9% 2.9%
Collateral Quality and IFRS 9
Loans and advances are secured by collateral whose fair value represents about 90% of the loans outstanding.The main types of collateral include cash (23.71%), pledges over assets (16.8%) and the assignment of trade
57

receivables and contracts held offshore in OECD countries (16.60%). Provisions have increased by the adoptionof IFRS 9 because IFRS 9 has two key components: (i) provisions are now made on a “forward-looking” basisas opposed to being made on the basis of acts of default and (ii) more financial instruments (such as off-balance sheets items, commitments, securities and investments) are now subject to provisioning. In this respect,provisions (credit losses on financial instruments in the Bank’s statement of profit or loss and othercomprehensive income) amounted to U.S.$118.9 million for the year ended 31 December 2018, as compared toU.S.$65.3 million for the year ended 31 December 2017 and U.S.$86.4 million for the year ended 31 December2016.
Economic and Political Environment in Africa
See “Macroeconomic Environment”.
Recent Developments
On 23 September 2019, the Bank issued U.S.$750 million 3.994% Bonds due September 2029, which are listedon the Global Exchange Market of Euronext Dublin.
Over the medium term, the Bank is targeting the non-performing loans as a percentage of the loan portfolioratio to trend towards 3.0% to 4.0%, with loan growth trending toward 10% to 15%. The Bank is targeting anet interest margin to trend towards 3.0% to 3.5% and a cost to income ratio of 20% to 30%, all over themedium term. In addition, the Bank’s target is to achieve a return on equity of 10% to 12% in the mediumterm, with a dividend payout ratio between 20% and 26% over the medium term. The Bank is also targeting acapital adequacy ratio above 20% in the medium term.
Trading during the year to date has been in line with management expectations and reaffirmed management’sconfidence in the Bank’s medium term guidance.
Explanation of Key Line Items
Interest and Similar Income
Interest and similar income includes loans and advances, interest on derivative contracts, interest on moneymarket investments and interest on investments amortised cost (held to maturity in 2017).
Interest and Similar Expense
Interest and similar expense includes due to banks, debt securities in issue and shareholder and customerdeposits.
Fees and Commission Income
Fees and commissions income includes advisory fees, commission on letters of credit, guarantee fees andstructuring fees.
Fees and Commission Expense
Fees and commission expense includes bond issue fees, legal and agency fees and other fees paid, whichincludes insurance charges in connection with callable capital and other charges such as expenses relating toguarantee transactions.
Operating Income
Operating income includes rental income and other income.
Operating Expense
Operating expenses includes personnel expenses, general and administrative expenses and depreciation andamortisation expense.
Credit Losses on Financial Instruments
Credit losses on financial instruments include loans and advances, money market placements, deposit withother banks, investment securities at amortised cost, financial guarantee contracts, letters of credits, loancommitments, prepayments and accrued income and other assets.
58

Total Assets
Total assets include cash and cash equivalents, derivative assets held for risk management, loans and advancesto customers, prepayments and accrued income, financial investments at amortised cost, other assets, propertyand equipment and intangible assets.
Total Liabilities
Total liabilities include derivative liabilities held for risk management, due to banks, deposits and customeraccounts, debt securities in issue and other liabilities.
Loans and Advances to Customers
Loans and advances to customers includes financial institutions support, direct intra- and extra-African tradeand syndications.
Capital Funds
Capital funds include share capital, share premium, warrants, reserves and retained earnings.
59
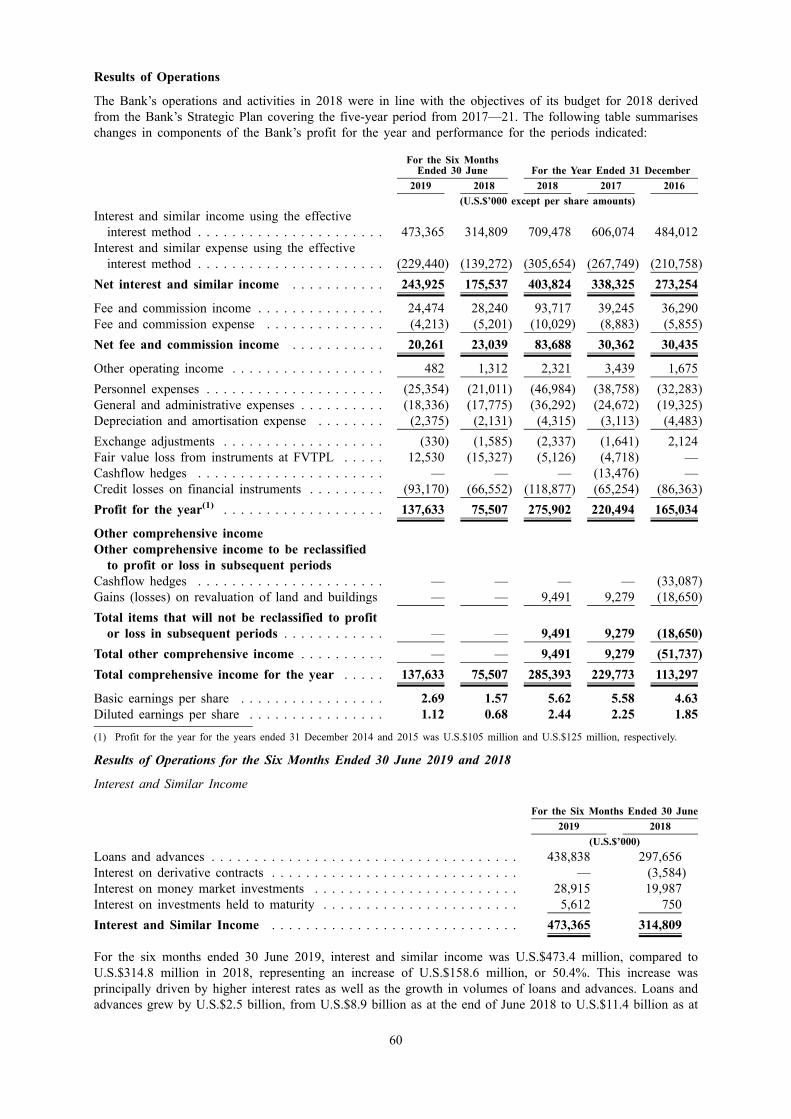
Results of Operations
The Bank’s operations and activities in 2018 were in line with the objectives of its budget for 2018 derivedfrom the Bank’s Strategic Plan covering the five-year period from 2017—21. The following table summariseschanges in components of the Bank’s profit for the year and performance for the periods indicated:
For the Six MonthsEnded 30 June For the Year Ended 31 December
2019 2018 2018 2017 2016(U.S.$’000 except per share amounts)
Interest and similar income using the effectiveinterest method . . . . . . . . . . . . . . . . . . . . . . 473,365 314,809 709,478 606,074 484,012
Interest and similar expense using the effectiveinterest method . . . . . . . . . . . . . . . . . . . . . . (229,440) (139,272) (305,654) (267,749) (210,758)
Net interest and similar income . . . . . . . . . . . 243,925 175,537 403,824 338,325 273,254
Fee and commission income . . . . . . . . . . . . . . . 24,474 28,240 93,717 39,245 36,290Fee and commission expense . . . . . . . . . . . . . . (4,213) (5,201) (10,029) (8,883) (5,855)Net fee and commission income . . . . . . . . . . . 20,261 23,039 83,688 30,362 30,435
Other operating income . . . . . . . . . . . . . . . . . . 482 1,312 2,321 3,439 1,675Personnel expenses . . . . . . . . . . . . . . . . . . . . . (25,354) (21,011) (46,984) (38,758) (32,283)General and administrative expenses . . . . . . . . . . (18,336) (17,775) (36,292) (24,672) (19,325)Depreciation and amortisation expense . . . . . . . . (2,375) (2,131) (4,315) (3,113) (4,483)Exchange adjustments . . . . . . . . . . . . . . . . . . . (330) (1,585) (2,337) (1,641) 2,124Fair value loss from instruments at FVTPL . . . . . 12,530 (15,327) (5,126) (4,718) —Cashflow hedges . . . . . . . . . . . . . . . . . . . . . . — — — (13,476) —Credit losses on financial instruments . . . . . . . . . (93,170) (66,552) (118,877) (65,254) (86,363)Profit for the year(1) . . . . . . . . . . . . . . . . . . . 137,633 75,507 275,902 220,494 165,034
Other comprehensive incomeOther comprehensive income to be reclassifiedto profit or loss in subsequent periods
Cashflow hedges . . . . . . . . . . . . . . . . . . . . . . — — — — (33,087)Gains (losses) on revaluation of land and buildings — — 9,491 9,279 (18,650)Total items that will not be reclassified to profitor loss in subsequent periods . . . . . . . . . . . . — — 9,491 9,279 (18,650)
Total other comprehensive income . . . . . . . . . . — — 9,491 9,279 (51,737)Total comprehensive income for the year . . . . . 137,633 75,507 285,393 229,773 113,297
Basic earnings per share . . . . . . . . . . . . . . . . . 2.69 1.57 5.62 5.58 4.63Diluted earnings per share . . . . . . . . . . . . . . . . 1.12 0.68 2.44 2.25 1.85(1) Profit for the year for the years ended 31 December 2014 and 2015 was U.S.$105 million and U.S.$125 million, respectively.
Results of Operations for the Six Months Ended 30 June 2019 and 2018
Interest and Similar Income
For the Six Months Ended 30 June2019 2018
(U.S.$’000)Loans and advances . . . . . . . . . . . . . . . . . . . . . . . . . . . . . . . . . . . . 438,838 297,656Interest on derivative contracts . . . . . . . . . . . . . . . . . . . . . . . . . . . . . — (3,584)Interest on money market investments . . . . . . . . . . . . . . . . . . . . . . . . 28,915 19,987Interest on investments held to maturity . . . . . . . . . . . . . . . . . . . . . . . 5,612 750Interest and Similar Income . . . . . . . . . . . . . . . . . . . . . . . . . . . . . 473,365 314,809
For the six months ended 30 June 2019, interest and similar income was U.S.$473.4 million, compared toU.S.$314.8 million in 2018, representing an increase of U.S.$158.6 million, or 50.4%. This increase wasprincipally driven by higher interest rates as well as the growth in volumes of loans and advances. Loans andadvances grew by U.S.$2.5 billion, from U.S.$8.9 billion as at the end of June 2018 to U.S.$11.4 billion as at
60
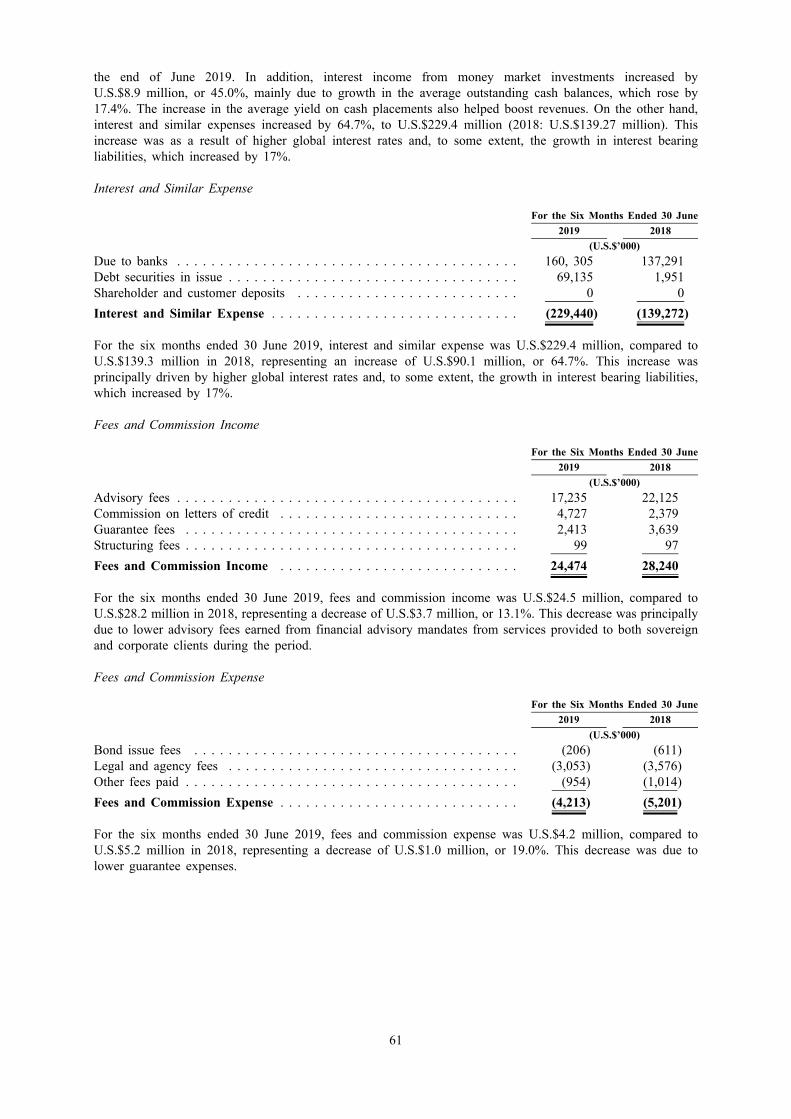
the end of June 2019. In addition, interest income from money market investments increased byU.S.$8.9 million, or 45.0%, mainly due to growth in the average outstanding cash balances, which rose by17.4%. The increase in the average yield on cash placements also helped boost revenues. On the other hand,interest and similar expenses increased by 64.7%, to U.S.$229.4 million (2018: U.S.$139.27 million). Thisincrease was as a result of higher global interest rates and, to some extent, the growth in interest bearingliabilities, which increased by 17%.
Interest and Similar Expense
For the Six Months Ended 30 June2019 2018
(U.S.$’000)Due to banks . . . . . . . . . . . . . . . . . . . . . . . . . . . . . . . . . . . . . . . . 160, 305 137,291Debt securities in issue . . . . . . . . . . . . . . . . . . . . . . . . . . . . . . . . . . 69,135 1,951Shareholder and customer deposits . . . . . . . . . . . . . . . . . . . . . . . . . . 0 0Interest and Similar Expense . . . . . . . . . . . . . . . . . . . . . . . . . . . . . (229,440) (139,272)
For the six months ended 30 June 2019, interest and similar expense was U.S.$229.4 million, compared toU.S.$139.3 million in 2018, representing an increase of U.S.$90.1 million, or 64.7%. This increase wasprincipally driven by higher global interest rates and, to some extent, the growth in interest bearing liabilities,which increased by 17%.
Fees and Commission Income
For the Six Months Ended 30 June2019 2018
(U.S.$’000)Advisory fees . . . . . . . . . . . . . . . . . . . . . . . . . . . . . . . . . . . . . . . . 17,235 22,125Commission on letters of credit . . . . . . . . . . . . . . . . . . . . . . . . . . . . 4,727 2,379Guarantee fees . . . . . . . . . . . . . . . . . . . . . . . . . . . . . . . . . . . . . . . 2,413 3,639Structuring fees . . . . . . . . . . . . . . . . . . . . . . . . . . . . . . . . . . . . . . . 99 97Fees and Commission Income . . . . . . . . . . . . . . . . . . . . . . . . . . . . 24,474 28,240
For the six months ended 30 June 2019, fees and commission income was U.S.$24.5 million, compared toU.S.$28.2 million in 2018, representing a decrease of U.S.$3.7 million, or 13.1%. This decrease was principallydue to lower advisory fees earned from financial advisory mandates from services provided to both sovereignand corporate clients during the period.
Fees and Commission Expense
For the Six Months Ended 30 June2019 2018
(U.S.$’000)Bond issue fees . . . . . . . . . . . . . . . . . . . . . . . . . . . . . . . . . . . . . . (206) (611)Legal and agency fees . . . . . . . . . . . . . . . . . . . . . . . . . . . . . . . . . . (3,053) (3,576)Other fees paid . . . . . . . . . . . . . . . . . . . . . . . . . . . . . . . . . . . . . . . (954) (1,014)Fees and Commission Expense . . . . . . . . . . . . . . . . . . . . . . . . . . . . (4,213) (5,201)
For the six months ended 30 June 2019, fees and commission expense was U.S.$4.2 million, compared toU.S.$5.2 million in 2018, representing a decrease of U.S.$1.0 million, or 19.0%. This decrease was due tolower guarantee expenses.
61

Operating Expenses
The following table shows a breakdown of the components of the Bank’s total operating expenses for theperiods indicated:
For the Six Months Ended 30 June2019 2018
(U.S.$’000)Personnel expenses . . . . . . . . . . . . . . . . . . . . . . . . . . . . . . . . . . . . (25,354) (21,011)General and administrative expenses . . . . . . . . . . . . . . . . . . . . . . . . . (18,336) (17,775)Depreciation and amortisation expense . . . . . . . . . . . . . . . . . . . . . . . . (2,375) (2,131)Operating expenses . . . . . . . . . . . . . . . . . . . . . . . . . . . . . . . . . . . (46,065) (40,917)
For the six months ended 30 June 2019, operating expenses were U.S.$46.1 million, compared toU.S.$40.9 million in 2018, representing an increase of U.S.$5.2 million, or 12.7%. This increase was mainlydriven by personnel expenses given the Bank’s expansion in operation, as general and administrative expensesonly rose slightly by 3.2%. Depreciation and amortisation expenses increased by 11.4% mainly due to theacquisition of new information and technology related software and equipment, in line with the Bank’s strategicdrive to enhance automation of its processes and activities.
Exchange Adjustments
For the six months ended 30 June 2019, exchange adjustments were negative U.S.$0.3 million, compared to anegative adjustment of U.S.$1.6 million in 2018, representing a decrease of U.S.$1.3 million. These exchangeadjustments were occasioned by lower net exposure.
Credit Losses on Financial Instruments
For the six months ended 30 June 2019, the credit losses on financial instruments were U.S.$93.2 million,compared to U.S.$66.6 million in 2018, representing an increase of U.S.$26.6 million. This increase wasprincipally driven by an increase in the volume of the loan portfolio along with an increase in the credit risk ofsome customers.
Results of Operations for the Years Ended 31 December 2018, 2017 and 2016
Net Interest and Similar Income
For the year ended 31 December 2018, the Bank’s net interest and similar income was U.S.$403.8 million,representing an increase of U.S.$65.5 million, or 19.4%, compared to the year ended 31 December 2017. Thisincrease was principally driven by an increase in income attributable to loans and advances to customers, aswell as interest on money market investments.
For the year ended 31 December 2017, the Bank’s net interest income and similar was U.S.$338.3 million,representing an increase of U.S.$65.1 million, or 23.8%, compared to the year ended 31 December 2016. Thisincrease was principally driven by an increase in income attributable to loans and advances to customers aswell as interest on money market investments.
Interest and Similar Income
For the Year Ended 31 December2018 2017 2016
(U.S.$’000)Loans and advances . . . . . . . . . . . . . . . . . . . . . . . . . . . . . . . . . . . . 675,600 577,516 468,960Interest on derivative contracts . . . . . . . . . . . . . . . . . . . . . . . . . . . . . . (10,650) 4,359 10,439Interest on money market investments . . . . . . . . . . . . . . . . . . . . . . . . . 40,488 22,686 3,726Interest on investments amortised cost (held to maturity in 2017) . . . . . . . 4,042 1,513 887Interest and Similar Income . . . . . . . . . . . . . . . . . . . . . . . . . . . . . . 709,478 606,074 484,012
For the year ended 31 December 2018, interest and similar income was U.S.$709.5 million, compared toU.S.$606.1 million in 2017, representing an increase of U.S.$103.4 million, or 17.1%. This increase wasprincipally driven by higher interest rates during the year, triggered by the rise in the Libor rate, and a 31%increase in the size of the gross loan portfolio and the interest earned on such assets.
62

For the year ended 31 December 2017, interest and similar income was U.S.$606.1 million, compared toU.S.$484.0 million in 2016, representing an increase of U.S.$122.1 million, or 25.2%. This increase wasprincipally driven by higher interest rates during the year.
Interest and Similar Expense
For the Year Ended 31 December2018 2017 2016
(U.S.$’000)Due to banks . . . . . . . . . . . . . . . . . . . . . . . . . . . . . . . . . . . . . . . (151,274) (110,638) (87,540)Debt securities in issue . . . . . . . . . . . . . . . . . . . . . . . . . . . . . . . . . (122,542) (109,318) (91,936)Shareholder and customer deposits . . . . . . . . . . . . . . . . . . . . . . . . . . (31,838) (47,793) (31,282)Interest and Similar Expense . . . . . . . . . . . . . . . . . . . . . . . . . . . . (305,654) (267,749) (210,758)
For the year ended 31 December 2018, interest and similar expense was U.S.$305.7 million, compared toU.S.$267.7 million in 2017, representing an increase of U.S.$37.9 million, or 14.2%. This increase wasprincipally due to the growth in interest-bearing liabilities and the increase in LIBOR rates.
For the year ended 31 December 2017, interest and similar expense was U.S.$267.7 million, compared toU.S.$210.8 million in 2016, representing an increase of U.S.$57.0 million, or 27.0%. This increase wasprincipally driven by growth in average interest-bearing liabilities and the cost of borrowing.
Fees and Commission Income
For the Year Ended 31 December2018 2017 2016
(U.S.$’000)Advisory fees . . . . . . . . . . . . . . . . . . . . . . . . . . . . . . . . . . . . . . . . . 79,201 21,307 26,822Commission on letters of credit . . . . . . . . . . . . . . . . . . . . . . . . . . . . . 7,762 8,511 2,833Guarantee fees . . . . . . . . . . . . . . . . . . . . . . . . . . . . . . . . . . . . . . . . 5,965 9,368 6,629Structuring fees . . . . . . . . . . . . . . . . . . . . . . . . . . . . . . . . . . . . . . . 789 59 6Fees and Commission Income . . . . . . . . . . . . . . . . . . . . . . . . . . . . . 93,717 39,245 36,290
For the year ended 31 December 2018, fees and commission income was U.S.$93.7 million, compared toU.S.$39.2 million in 2017, representing an increase of U.S.$54.5 million, or 139.0%. This increase wasprincipally due to higher net interest income arising from growth in loan assets and significant growth in feeincome from advisory mandates on off-balance sheet activities such as guarantees.
For the year ended 31 December 2017, fees and commission income was U.S.$39.2 million, compared toU.S.$36.3 million in 2016, representing an increase of U.S.$3.0 million, or 8.1%. This increase was principallydue to an increase in guarantee fees by 41% and commission from letters of credit confirmation by 200%reflecting good progress in the Bank’s strategy in its use of guarantees for capital management and leveragingpurposes.
Fees and Commission Expense
For the Year Ended 31 December2018 2017 2016
(U.S.$’000)Bond issue fees . . . . . . . . . . . . . . . . . . . . . . . . . . . . . . . . . . . . . . . (827) (1,147) (1,951)Legal and agency fees . . . . . . . . . . . . . . . . . . . . . . . . . . . . . . . . . . . (642) (700) (1,064)Other fees paid . . . . . . . . . . . . . . . . . . . . . . . . . . . . . . . . . . . . . . . . (8,560) (7,036) (2,840)Fees and Commission Expense . . . . . . . . . . . . . . . . . . . . . . . . . . . . . (10,029) (8,883) (5,855)
For the year ended 31 December 2018, fees and commission expense was U.S.$10.0 million, compared toU.S.$8.9 million in 2017, representing an increase of U.S.$1.1 million, or 12.4%. This increase was due to thegrowth of interest-bearing liabilities and the increase in credit enhancement costs.
For the year ended 31 December 2017, fees and commission expense was U.S.$8.9 million, compared toU.S.$5.9 million in 2016, representing an increase of U.S.$3.0 million, or 51.7%. This increase was due to an
63

increase in other fees paid, such as insurance charges in connection with callable capital and other charges suchas expenses relating to guarantee transactions.
Operating Expenses
The following table shows a breakdown of the components of the Bank’s total operating expenses for theperiods indicated:
For the Year Ended 31 December2018 2017 2016
(U.S.$’000)Personnel expenses . . . . . . . . . . . . . . . . . . . . . . . . . . . . . . . . . . . . . (46,984) (38,758) (32,283)General and administrative expenses . . . . . . . . . . . . . . . . . . . . . . . . . . (36,292) (24,672) (19,325)Depreciation and amortisation expense . . . . . . . . . . . . . . . . . . . . . . . . . (4,315) (3,113) (4,483)Operating expenses . . . . . . . . . . . . . . . . . . . . . . . . . . . . . . . . . . . . (87,591) (66,543) (56,091)
For the year ended 31 December 2018, operating expenses were U.S.$87.6 million, compared toU.S.$66.5 million in 2017, representing an increase of U.S.$21.0 million, or 31.6%. This increase during2018 was mainly driven by the significant growth in professional staff recruitment which in turn increased staffcosts by 21%. In addition, general and administrative expenses increased by 47% in support of the variousstrategic initiatives that the Bank was pursuing.
For the year ended 31 December 2017, operating expenses were U.S.$66.5 million, compared toU.S.$56.1 million in 2016, representing an increase of U.S.$10.5 million, or 18.6%. This increase during2017 was mainly driven by the significant growth in professional staff recruitment in support of the re-organisation exercise embarked upon under the Bank’s Strategic Plan. In addition, there was a 28% increase ingeneral and administrative expenses in support of the various strategic initiatives that the Bank was pursuing.
Credit Losses on Financial Instruments
For the year ended 31 December 2018, the credit losses on financial instruments were U.S.$118.9 million,compared to U.S.$65.3 million in 2017, representing an increase of U.S.$53.6 million. This increase wasprincipally driven by the adoption of IFRS 9 effective 1 January 2018, as the loss provisioning for financialassets is done on a forward-looking basis as opposed to the time of default.
For the year ended 31 December 2017, the credit losses on financial instruments were U.S.$65.3 million,compared to U.S.$86.4 million in 2016, representing a decrease of U.S.$21.1 million. This decrease wasprincipally driven by lower specific impairment allowance on non-performing loans as a result of improvedquality of the Bank’s loan assets in 2017.
For further details on how the Bank determines the provisions, see “Risk Management—Asset quality andimpairment—Provisioning”.
Changes in Cash Flows
The following table shows a breakdown of the components of the Bank’s cash flows for the periods indicated:
Period ended 30 June Year ended 31 December2019 2018 2018 2017 2016
(U.S.$’000)Net cash inflows / (outflows) fromoperating activities . . . . . . . . . . . . . . . 727,196 (1,258,469) (243,992) (1,372,881) (1,668,084)
Net cash outflows used in investingactivities . . . . . . . . . . . . . . . . . . . . . (5,071) (863) (146,302) (2,640) (2,465)
Net cash inflow from financing activities . . 964,781 376,674 1,338,793 1,226,572 1,965,341Net increase/(decrease) in cash and cashequivalents . . . . . . . . . . . . . . . . . . . 1,686,904 (882,658) 948,499 (148,949) 294,792
Cash and cash equivalents at 1 January . . . 1,918,435 3,214,573 969,935 1,118,884 824,092Cash and cash equivalents at period end 3,605,339 2,331,915 1,918,434 969,935 1,118,884
64

Net Cash Inflow / (Outflow) from Operating Activities
As at 30 June 2019, net cash inflow from operating activities amounted to U.S.$727.2 million, compared to anet cash outflow used in operating activities of U.S.$1,258.5 million as at 30 June 2018. This represented anincrease in net cash inflow from operating activities of U.S.$1,985.7 million, or 157.8%, principally due togrowth in deposits and customers accounts by U.S.$1,408.3 million.
As at 31 December 2018, net cash outflow used in operating activities amounted to U.S.$244.0 million,compared to U.S.$1,372.9 million as at 31 December 2017. This represented a decrease in net cash outflowused in operating activities of U.S.$1,128.9 million, or 82.2%, principally given that the Bank repaidU.S.$1.85 billion in deposits to customers in 2017.
As at 31 December 2017, net cash outflow used in operating activities amounted to U.S.$1,372.9 million,compared to U.S.$1,668.1 million as at 31 December 2016. This represented a decrease in net cash outflowused in operating activities of U.S.$295.2 million, or 17.7%, principally due to the decrease in loans andadvances to customers. This effect was primarily offset by the increase in money market instruments and theincrease in deposits and customer accounts.
Net Cash Outflow Used in Investing Activities
As at 30 June 2019, net cash outflow used in investing activities amounted to U.S.$5.1 million, compared toU.S.$0.9 million as at 30 June 2018. This represented an increase in net cash outflow used in investingactivities of U.S.$4.2 million, or 487.8%, principally due to the acquisition of new information and technologyrelated software and equipment, in line with the Bank’s strategic drive to enhance automation of its processesand activities.
As at 31 December 2018, net cash outflow used in investing activities amounted to U.S.$146.3 million,compared to U.S.$2.6 million as at 31 December 2017. This represented an increase in net cash outflow used ininvesting activities of U.S.$143.7 million, or 5441.7%, principally due to the purchase of treasury bills ofU.S.$139 million.
As at 31 December 2017, net cash outflow used in investing activities amounted to U.S.$2.6 million, comparedto U.S.$2.5 million as at 31 December 2016. This represented an increase in net cash outflow used in investingactivities of U.S.$0.2 million, or 7.1%, principally due to the purchase of property and equipment.
Net Cash Inflow from Financial Activities
As at 30 June 2019, net cash inflow from financial activities amounted to U.S.$964.8 million, compared toU.S.$376.7 million as at 30 June 2018. This represented an increase in net cash inflow from financial activitiesof U.S.$588.1 million, or 156.1%, principally due to an increase in borrowings in order to enhance liquidity tosupport expected business growth.
As at 31 December 2018, net cash inflow from financial activities amounted to U.S.$1,338.8 million, comparedto U.S.$1,226.6 million as at 31 December 2017. This represented an increase in net cash inflow from financialactivities of U.S.$112.2 million, or 9.1%, principally due to issuance of warrants.
As at 31 December 2017, net cash inflow from financial activities amounted to U.S.$1,226.6 million, comparedto U.S.$1,965.3 million as at 31 December 2016. This represented a decrease in net cash inflow from financialactivities of U.S.$738.8 million, or 37.6%, principally due to a decrease in amounts due to banks and debtsecurities.
65

Changes in Financial Condition
The following table shows a breakdown of the components of the Bank’s special purpose statement of financialposition for the periods indicated:
As at 30 June As at 31 December2019 2018 2017 2016
(U.S.$’000)AssetsCash and cash equivalents . . . . . . . . . . . . . . . . . 3,605,339 1,918,434 3,214,573 1,269,080Derivative assets held for risk management . . . . . . 6,628 3,684 3,574 8,792Loans and advances to customers . . . . . . . . . . . . . 11,395,028 11,134,424 8,545,716 10,148,202Prepayments and accrued income . . . . . . . . . . . . . 128,432 134,358 82,329 241,556Financial investments at amortised cost . . . . . . . . . 167,785 168,328 — —Financial investments held at maturity . . . . . . . . . . — — 30,268 30,268Other assets . . . . . . . . . . . . . . . . . . . . . . . . . . 18,391 13,988 2,931 3,069Property and equipment . . . . . . . . . . . . . . . . . . . 38,653 39,806 32,838 24,466Intangible Assets . . . . . . . . . . . . . . . . . . . . . . . 10,199 6,348 1,248 814Total Assets(1) . . . . . . . . . . . . . . . . . . . . . . . . . 15,370,455 13,419,370 11,913,477 11,726,247
LiabilitiesDerivative liabilities held for risk management . . . . 9,289 24,840 21,467 22,018Due to banks . . . . . . . . . . . . . . . . . . . . . . . . . 6,110,050 5,147,944 4,231,374 4,050,912Deposits and customer accounts . . . . . . . . . . . . . . 3,172,183 2,365,385 2,149,356 3,778,493Debt securities in issue . . . . . . . . . . . . . . . . . . . 3,029,399 3,027,717 2,881,622 2,091,114Other liabilities . . . . . . . . . . . . . . . . . . . . . . . . 348,208 293,737 505,624 157,342Total Liabilities . . . . . . . . . . . . . . . . . . . . . . . 12,669,129 10,859,623 9,789,443 10,099,879
Capital FundsShare capital . . . . . . . . . . . . . . . . . . . . . . . . . . 513,096 506,300 470,816 378,488Share premium . . . . . . . . . . . . . . . . . . . . . . . . 786,715 764,790 562,350 355,310Warrants . . . . . . . . . . . . . . . . . . . . . . . . . . . . . 166,756 191,531 91,723 98,716Reserves . . . . . . . . . . . . . . . . . . . . . . . . . . . . . 594,541 594,541 474,733 364,406Retained earnings . . . . . . . . . . . . . . . . . . . . . . . 640,218 502,585 524,412 429,448Total Capital Funds(2) . . . . . . . . . . . . . . . . . . . 2,701,326 2,559,747 2,124,034 1,626,368Total Liabilities and Capital Funds . . . . . . . . . . 15,370,455 13,419,370 11,913,477 11,726,247
(1) Total assets for the years ended 31 December 2010, 2011, 2012, 2013, 2014 and 2015 were U.S.$1.9 billion, U.S.$2.9 billion,U.S.$3.7 billion, U.S.$4.4 billion, U.S.$5.2 billion and U.S.$7.1 billion, respectively.
(2) Total capital funds for the years ended 31 December 2010, 2011, 2012, 2013, 2014 and 2015 were U.S.$457 million,U.S.$512 million, U.S.$612 million, U.S.$707 million, U.S.$919 million and U.S.$1.3 billion, respectively.
30 June 2019 vs. 31 December 2018
As at 30 June 2019, total assets amounted to U.S.$15.4 billion, compared to U.S.$13.4 billion as at31 December 2018. This represented an increase in total assets of U.S.$2.0 billion, or 14.5%, principally due toan increase in cash and cash equivalents of U.S.$1.7 billion. This increase was principally due to the need tomeet planned business commitments at the end of June 2019, reflecting the success achieved in generatingdeposits from Africa.
The increase in total assets as at 30 June 2019 was accompanied by U.S.$1.8 billion, or 16.7%, increase in totalliabilities, due principally to increases of U.S.$ 0.96 billion and U.S.$ 0.81 billion in due to banks and customerdeposit accounts, respectively.
As at 30 June 2019, the Bank’s liquidity (i.e. cash and cash equivalents, derivatives and loans with a residualmaturity of less than three months) amounted to U.S.$5.3 billion, compared to U.S.$5.7 billion as at31 December 2018. This decrease was caused by a decline in loans with a residual maturity of less than threemonths.
As at 30 June 2019, loans and advances to customers amounted to U.S.$11.4 billion, compared toU.S.$11.1 billion as at 31 December 2018. This represented an increase in loans and advances to customers ofU.S.$0.3 billion, or 2.34%, principally due to an increase in geographical diversification of the loan book,adding two more countries by the end of June 2019.
66
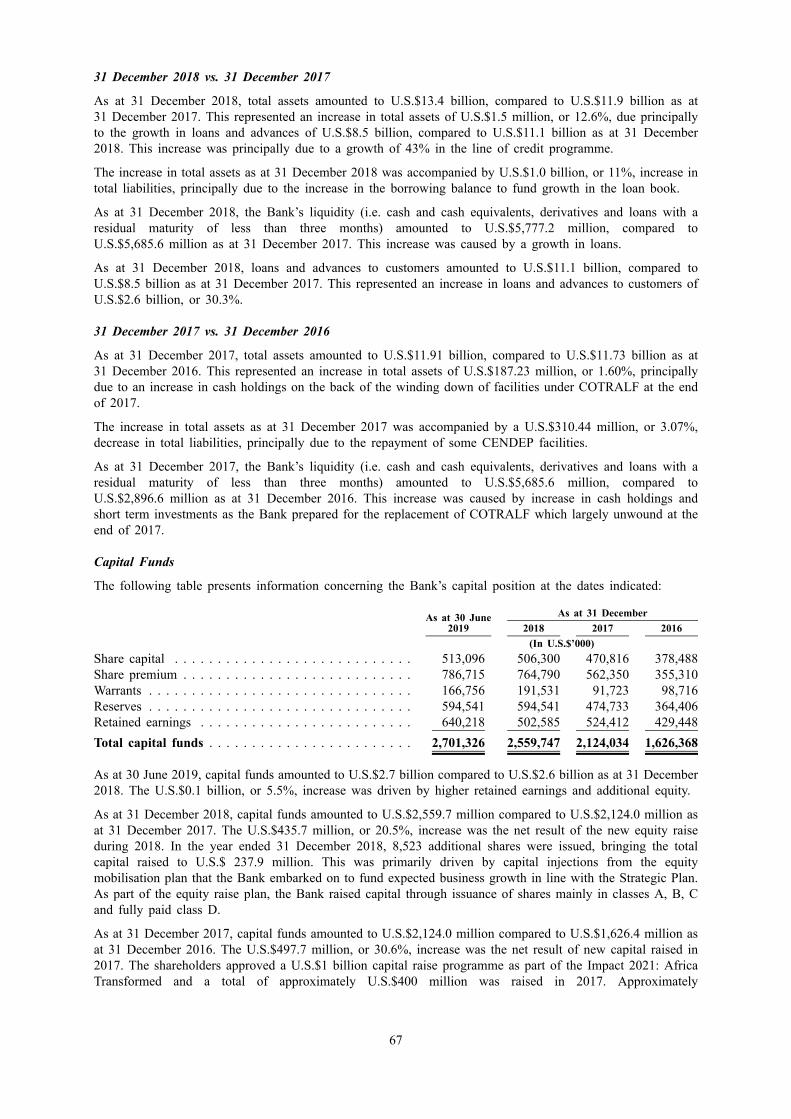
31 December 2018 vs. 31 December 2017
As at 31 December 2018, total assets amounted to U.S.$13.4 billion, compared to U.S.$11.9 billion as at31 December 2017. This represented an increase in total assets of U.S.$1.5 million, or 12.6%, due principallyto the growth in loans and advances of U.S.$8.5 billion, compared to U.S.$11.1 billion as at 31 December2018. This increase was principally due to a growth of 43% in the line of credit programme.
The increase in total assets as at 31 December 2018 was accompanied by U.S.$1.0 billion, or 11%, increase intotal liabilities, principally due to the increase in the borrowing balance to fund growth in the loan book.
As at 31 December 2018, the Bank’s liquidity (i.e. cash and cash equivalents, derivatives and loans with aresidual maturity of less than three months) amounted to U.S.$5,777.2 million, compared toU.S.$5,685.6 million as at 31 December 2017. This increase was caused by a growth in loans.
As at 31 December 2018, loans and advances to customers amounted to U.S.$11.1 billion, compared toU.S.$8.5 billion as at 31 December 2017. This represented an increase in loans and advances to customers ofU.S.$2.6 billion, or 30.3%.
31 December 2017 vs. 31 December 2016
As at 31 December 2017, total assets amounted to U.S.$11.91 billion, compared to U.S.$11.73 billion as at31 December 2016. This represented an increase in total assets of U.S.$187.23 million, or 1.60%, principallydue to an increase in cash holdings on the back of the winding down of facilities under COTRALF at the endof 2017.
The increase in total assets as at 31 December 2017 was accompanied by a U.S.$310.44 million, or 3.07%,decrease in total liabilities, principally due to the repayment of some CENDEP facilities.
As at 31 December 2017, the Bank’s liquidity (i.e. cash and cash equivalents, derivatives and loans with aresidual maturity of less than three months) amounted to U.S.$5,685.6 million, compared toU.S.$2,896.6 million as at 31 December 2016. This increase was caused by increase in cash holdings andshort term investments as the Bank prepared for the replacement of COTRALF which largely unwound at theend of 2017.
Capital Funds
The following table presents information concerning the Bank’s capital position at the dates indicated:
As at 30 June As at 31 December2019 2018 2017 2016
(In U.S.$’000)Share capital . . . . . . . . . . . . . . . . . . . . . . . . . . . . 513,096 506,300 470,816 378,488Share premium . . . . . . . . . . . . . . . . . . . . . . . . . . . 786,715 764,790 562,350 355,310Warrants . . . . . . . . . . . . . . . . . . . . . . . . . . . . . . . 166,756 191,531 91,723 98,716Reserves . . . . . . . . . . . . . . . . . . . . . . . . . . . . . . . 594,541 594,541 474,733 364,406Retained earnings . . . . . . . . . . . . . . . . . . . . . . . . . 640,218 502,585 524,412 429,448Total capital funds . . . . . . . . . . . . . . . . . . . . . . . . 2,701,326 2,559,747 2,124,034 1,626,368
As at 30 June 2019, capital funds amounted to U.S.$2.7 billion compared to U.S.$2.6 billion as at 31 December2018. The U.S.$0.1 billion, or 5.5%, increase was driven by higher retained earnings and additional equity.
As at 31 December 2018, capital funds amounted to U.S.$2,559.7 million compared to U.S.$2,124.0 million asat 31 December 2017. The U.S.$435.7 million, or 20.5%, increase was the net result of the new equity raiseduring 2018. In the year ended 31 December 2018, 8,523 additional shares were issued, bringing the totalcapital raised to U.S.$ 237.9 million. This was primarily driven by capital injections from the equitymobilisation plan that the Bank embarked on to fund expected business growth in line with the Strategic Plan.As part of the equity raise plan, the Bank raised capital through issuance of shares mainly in classes A, B, Cand fully paid class D.
As at 31 December 2017, capital funds amounted to U.S.$2,124.0 million compared to U.S.$1,626.4 million asat 31 December 2016. The U.S.$497.7 million, or 30.6%, increase was the net result of new capital raised in2017. The shareholders approved a U.S.$1 billion capital raise programme as part of the Impact 2021: AfricaTransformed and a total of approximately U.S.$400 million was raised in 2017. Approximately
67

U.S.$300 million of this was raised through Depositary Receipts that were listed on the Stock Exchange ofMauritius.
In September 2017, the Bank conducted a landmark Depositary Receipt (“DR”) issuance on the StockExchange of Mauritius Ltd (“SEM”). The Bank issued up to 6,977 fully paid-up Class D Shares in the form of69,770,000 DRs. Each Class D Share is represented by 10,000 DRs. The DRs were offered only to certaintargeted investors by way of private placement. The DRs were issued by SBM Securities Ltd as depositary forthe Class D Shares.
The general reserve is set up in accordance with Article 31 of the Bank’s Charter in order to cover generalbanking risks, including future losses and other unforeseeable risks or contingencies.
Afreximbank is not subject to capital requirements by a regulatory body such as a central bank or equivalentinstitution. However, the Bank has established a Capital Management Policy (“CMP”) that is based on themaintenance of certain capital adequacy ratios in line with the recommendations of the Basel Committee onBanking Supervision (the “Basel Committee”) as amended from time to time (including the papers entitled“International Convergence of Capital Measurement and Capital Standards” dated July 1988 as amended fromtime to time (the “Basel Paper”), the paper entitled “International Convergence of Capital Measurement andCapital Standards: A Revised Framework” dated June 2004, as amended from time to time (the “Basel IIPaper”), and the papers entitled “A global regulatory framework for more resilient banks and banking systems”dated June 2011 as amended from time to time and “International framework for liquidity risk measurement,standards and monitoring” dated January 2013 as amended from time to time (together, the “Basel IIIPapers”), each prepared by the Basel Committee). For a further description, see ” —CapitalAdequacy—Capital Management”.
Funding
The Bank’s source of funding has been mainly unchanged in the last three years. During the year ended31 December 2018, the Bank raised U.S.$4.2 billion across diverse sources. Approximately 43% was raisedunder the CENDEP programme, 11% from the euro-syndicated loans market, 16% from bonds issued under theGMTN Programme, 8% from bilateral lines of credit, 22% from export credit agencies and developmentfinance institutions and money market lines.
During the year ended 31 December 2017, the Bank raised approximately U.S.$4.8 billion across diversesources. Approximately 45% was raised under the CENDEP programme, 27% from the euro-syndicated loansmarket, 17% from bonds issued under the GMTN Programme, 8% from bilateral lines of credit, 3% fromexport credit agencies and development finance institutions, and a further 1% through money market lines.
During the year ended 31 December 2016, the Bank raised approximately U.S.$6.5 billion across diversesources. Approximately 49.6% was raised under the CENDEP programme, 18.1% from the euro-syndicatedloans market, 13.8% from bonds issued under the GMTN Programme, 13% from bilateral lines of credit, 3.9%from export credit agencies and development finance institutions, and a further 1.6% through money marketlines.
As at 31 December 2018, Afreximbank funded its total assets with bank lines of credit (32%), debt securities inissue (23%), capital funds (19%), customer accounts and deposits (3%), CENDEP deposits (21%), and othersources (2%) (other sources include accruals, prepaid income, dividends payable and hedging payables).
68

The following table shows the Bank’s funding distribution as at 31 December 2018, 31 December 2017 and31 December 2016.
Funding sources as at31 December
201831 December
201731 December
2016(in percentages)
Capital funds . . . . . . . . . . . . . . . . . . . . . . . . . . . . . . . . . . . 19.1 17.8 13.9Customer accounts and deposits(1) . . . . . . . . . . . . . . . . . . . . . 2.7 3.4 1.3Bank lines of credit . . . . . . . . . . . . . . . . . . . . . . . . . . . . . . 32.0 29.1 32.3CENDEP deposits . . . . . . . . . . . . . . . . . . . . . . . . . . . . . . . 21.2 21.1 33.2Debt securities in issue . . . . . . . . . . . . . . . . . . . . . . . . . . . . 22.6 24.2 17.8Other(2) . . . . . . . . . . . . . . . . . . . . . . . . . . . . . . . . . . . . . . 2.4 4.4 1.5Total . . . . . . . . . . . . . . . . . . . . . . . . . . . . . . . . . . . . . . . . 100 100 100
(1) Excludes deposits under CENDEP.
(2) Prepaid income, dividends payable, hedging payables and other liabilities which include accruals
Afreximbank estimates that planned future growth in loan assets will be funded by way of (i) new capital fundsreceived via the New GCI (in relation to which see “Share Capital and Ownership—General Capital Increase”below) and also (ii) a projected overall increase in borrowing volumes (excluding deposits under the Bank’sCENDEP programme) of around 40% on average in the next 24 months, to reach approximatelyU.S.$12 billion in 2020.
In addition to scheduled capital increases, the Bank’s management anticipates a need to increase funds raised inthe international capital markets and to maintain funding through borrowing from multilateral and otherfinancial institutions.
The following table outlines the debt securities in issue of Afreximbank for the years ended 31 December 2018,31 December 2017 and 31 December 2016.
Amount outstanding for the period1 January to 31 December
2018 2017 2016(U.S.$’000)
Syndicated loans / Club loans . . . . . . . . . . . . . . . . . . . . . . . . . . . 2,505,005 2,524,650 2,006,945Bilateral loans . . . . . . . . . . . . . . . . . . . . . . . . . . . . . . . . . . . . . 524,293 967,527 1,688,014Bonds . . . . . . . . . . . . . . . . . . . . . . . . . . . . . . . . . . . . . . . . . . 3,027,717 2,881,622 2,091,114
The following table outlines the residual maturity of Afreximbank’s bank loans as at 31 December 2018,31 December 2017 and 31 December 2016.
Amount outstanding as at31 December
201831 December
201731 December
2016(U.S.$’000)
Syndicated loans / Club loansUp to one year . . . . . . . . . . . . . . . . . . . . . . . . . . . . . . . . . 880,503 477,541 885,516Between one and three years . . . . . . . . . . . . . . . . . . . . . . . . 1,623,838 1,797,109 871,429Three years and more . . . . . . . . . . . . . . . . . . . . . . . . . . . . . — 250,000 250,000Bilateral loansUp to one year . . . . . . . . . . . . . . . . . . . . . . . . . . . . . . . . . 122,858 516,656 806,589Between one and three years . . . . . . . . . . . . . . . . . . . . . . . . 401,435 187,291 464,627Three years and more . . . . . . . . . . . . . . . . . . . . . . . . . . . . . — 263,581 416,798BondsUp to one year . . . . . . . . . . . . . . . . . . . . . . . . . . . . . . . . . — 500,000 —Between one and three years . . . . . . . . . . . . . . . . . . . . . . . . 700,000 700,000 1,200,000Three years and more . . . . . . . . . . . . . . . . . . . . . . . . . . . . . 2,327,717 1,681,622 900,000Total . . . . . . . . . . . . . . . . . . . . . . . . . . . . . . . . . . . . . . . . 4,433,177 6,373,800 5,794,959
Afreximbank’s average cost of borrowing for the last 5 years was 3.56% (all-in), and excluding bonds, thesame figure was 2.86%.
69

Syndicated Loans
The Bank first entered the loan market with a one year facility in 2000. Since then, the Bank has sought todevelop and extend the maturity profile of its syndicated facilities, through either a combination of one yearfacilities with extension options or dual tranche facilities with a mixture of one, two and three year maturities.Since 2000, the Bank has raised an aggregate amount of more than U.S.$7.5 billion. As at the date of thisRegistration Document, the Bank has never defaulted on any principal or interest repayment under itsborrowings.
During the 2008—2009 global financial crisis, the Bank was able to continue to attract financing despitedifficult market conditions. For example, in October 2008, the Bank signed a dual-tranche syndicated term loanof U.S.$65 million and a revolving credit facility of EUR31 million involving a syndicate of eight IFIs for18 months with a 12 month extension option. Subsequently, in July 2009, the Bank signed a dual-tranchesyndicated loan facility amounting in aggregate to U.S.$318 million with 33 international banks.
Since then, the Bank has continued to successfully attract further syndicated facilities and set forth below arethe Bank’s outstanding syndicated loan transactions:
• In September 2016, the Bank closed a U.S.$300 million five year syndicated loan transaction, supportedby China Exim Bank, in which 16 banks from Taiwan Province of China and from Mainland Chinaparticipated. The closing of the targeted syndication evidenced the Bank’s successful fundingdiversification strategy aimed at expanding its liability book by instrument type, geographical region,and tenor. This facility is still outstanding.
• In November 2016, the Bank closed a U.S.$761 million and €105 million dual tenor (two and three years,respectively) Dual Currency Syndicated Term Loan Facility, following strong support from corerelationship banks and a highly successful general syndication phase. The facility was supported by 26lenders from the Middle East, Europe, and the Asia-Pacific region. The two-year tranche matured in 2018and the three-year tranche will mature in November 2019.
• In May 2017, the Bank closed a U.S.$633 million and €500 million dual tenor (two and three years,respectively) Dual Currency Syndicated Term Loan Facility, following strong support from corerelationship banks and a highly successful general syndication phase. The facility attracted aggregatecommitments amounting to the equivalent of U.S.$1.36 billion, which was scaled-back to a final facilitysize equivalent to U.S.$1.16 billion. The facility was supported by 35 lenders from the Middle East,Europe, Africa and the Asia-Pacific region. The two-year tranche matured in May 2019 and the three-yeartranche will mature in May 2020.
• In 2018, the Bank closed 19 syndicated transactions with a total value (including participation of otherbanks) of U.S.$9.56 billion, amounting to U.S.$1.73 billion of outstanding loans under the SyndicationProgramme.
Bilateral Loans
On 4 July 2019, the Bank entered into a term loan facility agreement with Société Générale for an approvedlimit of €100 million, which has been fully drawn down as of the date of this Registration Document.
70

Funding Lines of Credit
As at the date of this Registration Document, the Bank had outstanding bilateral facilities and outstandingfunding lines with DFIs and ECAs. As at 31 December 2018, these included:
CountryTenor(yrs) Date1
ApprovedLimit
Drawdownunderthe
Facility
Limitcommitted
tospecific
transactionsunder
processing
Limitavailable
fordrawdown
(U.S.$ millions)Export Credit AgenciesExport-Import Bank of China . . . . . . China 7 09/2016 800 800 — —U.S. Department of Agriculture(GSM-102) . . . . . . . . . . . . . . . . U.S. 2 01/2018 270 127 — 143
Belarus Facility . . . . . . . . . . . . . . . Belarus Up to 7 06/2017 150 — — 150Export-Import Bank of Korea . . . . . . Korea — 05/2018 200 — — 200Export-Import Bank of India . . . . . . India 7 02/2018 125 125 — —Development Finance Institutions . .African Development Bank2 . . . . . . . Multilateral 4 07/2017 300 300 — —KFW IPEX . . . . . . . . . . . . . . . . . Germany 1 06/2018 56 56 — —KFW Renewable Energy . . . . . . . . . Germany 15 05/2017 150 60 — 90USAID / SCB . . . . . . . . . . . . . . . . USA 8 10/2017 60 60 — —EIB . . . . . . . . . . . . . . . . . . . . . . Multilateral 7 10/2017 122 86 — 37China Development Bank (CDB) . . . . China 10 09/2018 500 — — 500International Trade FinanceCorporation (ITFC) . . . . . . . . . . . Multilateral 2 12/2017 60 60 — —
Agence Française deDéveloppement (AFD) . . . . . . . . . France 7 07/2018 230 200 30 —
Nordic Investment Bank (NIB) . . . . . Multilateral 10 09/2018 120 — — 120International Financial TradeCorporation (IFTC) . . . . . . . . . . . Multilateral 2 12/2017 100 100 — —
BADEA . . . . . . . . . . . . . . . . . . . . Multilateral 3 12/2018 75 — — 75
Total . . . . . . . . . . . . . . . . . . . . . . 3,318 1,974 30 1,315
Notes
1 This is the date upon which the facility was signed—tenor runs from the date of drawdown, which can be later.
2 In May 2014, the AfDB approved a trade finance package totalling U.S.$280 million for Afreximbank to expand its risk-bearingcapacity and provide medium term funds for financing trade transactions and projects across Africa, consisting of aU.S.$30 million equity investment, a U.S.$150 million line of credit and a U.S.$100 million unfunded risk participationagreement.
Tenor(months) Amount
Utilised /committed Headroom
(U.S.$ (unless other currency is stated) millions)Money Market linesUncommittedHSBC . . . . . . . . . . . . . . . . . . . . . . . . . . . . . . . . . . . . . . 3 10 10 10Commerzbank . . . . . . . . . . . . . . . . . . . . . . . . . . . . . . . . . 12 € 30 37 37Landesbank Baden-Württemberg . . . . . . . . . . . . . . . . . . . . . 6 € 10 12 12British Arab Commercial Bank . . . . . . . . . . . . . . . . . . . . . . 3 30 30 30Trade Finance Lines . . . . . . . . . . . . . . . . . . . . . . . . . . . .Sumitomo Mitsui Banking Corporation (“SMBC”) . . . . . . . . . 12 184 184 184HSBC . . . . . . . . . . . . . . . . . . . . . . . . . . . . . . . . . . . . . . 12 25 25 25Rand Merchant Bank . . . . . . . . . . . . . . . . . . . . . . . . . . . . 24 100 100 100Barclays Bank . . . . . . . . . . . . . . . . . . . . . . . . . . . . . . . . 12 25 25 25
Issuance of Debt Securities
On 27 October 2009, Afreximbank established its GMTN Programme. As at the date of this RegistrationDocument, the following issues under the GMTN Programme are outstanding:
• Series 11 U.S.$900 million 4.00% bonds due 24 May 2021, which were issued in two tranches inMay 2016 and September 2016, and are listed on the Global Exchange Market of Euronext Dublin;
• Series 12 U.S.$750 million 4.125% bonds due 20 June 2024, which were issued in June 2017, and arelisted on the Global Exchange Market of Euronext Dublin;
71

• Series 15 U.S.$500 million 5.250% bonds due 11 October 2023, which were issued in October 2018, andare listed on the Global Exchange Market of Euronext Dublin; and
• Series 16 U.S.$750 million 3.994% bonds due 21 September 2029, which were issued in September 2019,and are listed on the Global Exchange Market of Euronext Dublin.
Deposits
As at 31 December 2018, Afreximbank’s deposits accounted for 22.0% of Afreximbank’s total liabilities,(compared with 22.0% and 37.4% respectively as at 31 December 2017 and 31 December 2016) of whichAfreximbank’s top 20 depositors accounted for 21%. Deposit accounts held with Afreximbank are principallyaccounts used as a structural element in trade finance transactions. Most deposit accounts are held withAfreximbank until the client’s borrowing or outstanding amounts are fully paid. The deposits may be used toretire the loans. Customers who deposited funds in customer accounts were sovereigns, corporates and financialinstitutions.
The table below shows the deposits and customer accounts held with the Bank as at 31 December 2018,31 December 2017 and 31 December 2016.
Deposits and customer accounts as at31 December
201831 December
201731 December
2016(U.S.$’000)
Shareholders’ deposit for shares . . . . . . . . . . . . . . . . . . . . . . . 9,307 9,151 8,866Deposit accounts . . . . . . . . . . . . . . . . . . . . . . . . . . . . . . . . 195,932 57,134 25,942Customer accounts . . . . . . . . . . . . . . . . . . . . . . . . . . . . . . . 2,160,146 2,083,071 3,743,685Total . . . . . . . . . . . . . . . . . . . . . . . . . . . . . . . . . . . . . . . . 2,365,385 2,149,356 3,778,493
Contingency Planning and Future Funding Activities
In order to avert liquidity gaps the Bank has secured a number of alternative sources of liquidity as contingencymeasures and to support future lending activity. These are summarised as follows:
Credit lines. During 2018 the Bank focussed on establishing lines of credit and/or export credit guaranteefacilities with export credit agencies (“ECAs”) and development finance institutions (“DFIs”) to support itsgrowing volume of transactions. In this regard, during the year ended 31 December 2018, the Bank securedcredit lines of U.S.$924 million from ECAs and DFIs.
Undrawn lines. As at 31 December 2018, Afreximbank had uncommitted, and committed but undrawn, linesfrom ECAs, DFIs and banks of U.S.$2.5 billion, U.S.$1.3 billion of which are committed and the remainingU.S.$1.2 billion was uncommitted.
Syndicated borrowing. Afreximbank also seeks to maintain an active syndicated borrowing programme despitethe challenging market conditions in the international loan markets. In September 2016, the Bank closed aU.S.$300 million five-year syndicated loan transaction, supported by China Exim Bank, in which 16 banksfrom Taiwan Province of China and from Mainland China participated. In November 2016, the Bank enteredinto a U.S.$761 million and €105 million dual tenor (two and three years, respectively) Dual CurrencySyndicated Term Loan Facility, supported by 26 lenders from the Middle East, Europe, and the Asia-Pacificregion. In September 2018, the Bank closed a U.S.$160 million Korea-focused club deal. The facility, whichwas the first to be arranged for the Bank in the Korean market, helped the Bank to diversify its sources offunding by geography, instrument and investor base. Despite it being a debut facility for the Bank in thismarket, the facility, which targeted to raise U.S.$150 million was oversubscribed to U.S.$160 Million with fourbanks joining. In November 2018, the Bank closed another club deal with six banks for U.S.$290 million,which focused on the Middle East. This was the second time a facility of this nature was arranged for the Bankin the Middle East, following one that was concluded in 2014. The banks in the Middle East showed theirconfidence in the Bank as they extended the tenor of the facility to three years as compared to the previoustwo-year transaction. In December 2018, the Bank closed a U.S.$500 million guaranteed syndicated loanfacility focused on Asia and supported by China Exim Bank, in which 12 banks participated. Please see also”—Funding—Syndicated Loans”.
Liquidity
The share of liquid financial assets (i.e. those with a residual maturity of less than three months) of the Bank’stotal financial assets increased from 25.0% as at 31 December 2016 to 46.9% as at 31 December 2017 and
72

decreased to 43.1% as at 31 December 2018. Over the same period, the share of liquid assets as a percentage ofthe Bank’s borrowings largely remained stable at 69% as at 31 December 2016, 61.4% as at 31 December 2017and 55.0% as at 31 December 2018. The Bank’s liquidity coverage ratio (defined as trade loans with a tenor ofless than one year (discounted 40%), plus cash and cash equivalents, divided by total liabilities due to lendersand depositors) as at 31 December 2018 was 133%, compared to 120% as at 31 December 2017 and 173% asat 31 December 2018.
The Bank pursues a conservative treasury policy that is actively implemented by the Bank’s TreasuryDepartment. The Bank’s loan book and borrowings are both based on variable interest rates. Apart from a shortaverage maturity, these portfolios are well diversified across financial institutions (who act as intermediaries)and corporate sectors. Please see also “Risk Management—Liquidity and Investment Policy”.
Capital Adequacy
Capital Management
Afreximbank is not subject to capital requirements by a regulatory body such as a central bank or equivalentinstitution. However, the Bank has established a Capital Management Policy (“CMP”) that is based on themaintenance of a capital adequacy ratio that is in line with the recommendations of the Basel Paper, the BaselII Paper and the Basel III Papers. Please see also “Risk Factors—Risks relating to the Bank’s constitution andstructure—As a supranational institution, the Bank is not subject to regulatory supervision, including withregard to capital adequacy and corporate governance”.
Capital adequacy is reviewed regularly by the Bank’s management using techniques based on the guidelinesdeveloped by the Basel Committee. With effect from 1 January 2009, the Bank complies with the provisions ofthe Basel II framework in respect of capital. The Bank’s capital is divided into two tiers. Tier 1 capital includesshare capital, share premium, share warrants, retained earnings and general reserves created by appropriationsof retained earnings. Tier 2 capital consists of collective impairment allowances and asset revaluation reserve.The objective of Afreximbank’s CMP is to maintain a set minimum ratio of total capital to risk-weighted assetsof at least 3% above the Basel minimum requirement (8%), but in any case no lower than 20%. For thepurposes of calculating this ratio, the risk weighted assets are measured by means of a hierarchy of seven riskweights classified according to its nature and reflecting an estimate of credit, market and other risks associatedwith each asset and counterparty. A similar treatment is adopted for off-statement of financial positionexposure.
73

A summary of the Bank’s statutory capital and the total risk-weighted assets is set forth in the table below.
30 June2019
31 December2018
31 December2017
31 December2016
(U.S. $’000)Tier 1 CapitalShare capital . . . . . . . . . . . . . . . . . . . . . . . . . . . . 513,096 506,300 470,816 378,488Share premium . . . . . . . . . . . . . . . . . . . . . . . . . . . 786,715 764,790 562,350 355,310Warrants(1) . . . . . . . . . . . . . . . . . . . . . . . . . . . . . . 166,756 191,532 91,723 98,716General reserve . . . . . . . . . . . . . . . . . . . . . . . . . . . 551,228 551,228 447,762 366,282Retained earnings . . . . . . . . . . . . . . . . . . . . . . . . . 640,218 502,585 524,412 429,448Total Tier 1 Capital . . . . . . . . . . . . . . . . . . . . . . . 2,658,013 2,516,435 2,097,063 1,628,244
Tier 2 CapitalAsset revaluation reserve . . . . . . . . . . . . . . . . . . . . . 12,741 12,741 9,395 5,220Collective impairment allowance . . . . . . . . . . . . . . . . 153,945 107,898 28,356 23,045Total Tier 2 Capital . . . . . . . . . . . . . . . . . . . . . . . 166,686 120,639 37,751 28,265Total capital base . . . . . . . . . . . . . . . . . . . . . . . . . 2,824,699 2,637,074 2,134,814 1,656,509
Risk-weighted assetsOn-statement of financial position . . . . . . . . . . . . . . . 10,073,200 9,023,048 7,261,266 6,291,657Off-statement of financial position: . . . . . . . . . . . . . .Credit risk . . . . . . . . . . . . . . . . . . . . . . . . . . . . . . 1,476,289 784,148 427,131 514,139Operational risk . . . . . . . . . . . . . . . . . . . . . . . . . . 729,572 729,572 568,056 462,977Market risk . . . . . . . . . . . . . . . . . . . . . . . . . . . . . 36,511 774 763 11,450Total risk-weighted assets . . . . . . . . . . . . . . . . . . . 12,315,572 10,537,542 8,257,216 7,280,223Basel capital adequacy ratio (Total capital base/Totalrisk weighted assets)(2) . . . . . . . . . . . . . . . . . . . . 22.9% 25.0% 25.9% 22.8%
Common Equity Tier 1 Ratio (“CET1 Ratio”)(3) . . . . 21.6% 23.9% 25.5% 22.4%
(1) Convertible into Class D Shares of the Bank.
(2) Capital adequacy ratio for the years ended 31 December 2010, 2011, 2012, 2013, 2014 and 2015 were 24%, 22%, 21%, 20%,21% and 26%, respectively.
(3) CET1 ratio is defined as CET1 capital over total risk-weighted assets calculated under Basel II.
74

The ratio of statutory capital to risk-weighted assets increased from 22.8% as at 31 December 2016 to 25.9% asat 31 December 2017 and decreased to 25.0% as at 31 December 2018. This overall increase was primarily dueto capital injections from the equity mobilisation plan that the Bank embarked on to fund expected businessgrowth in line with its Strategic Plan, which more than offset the accelerated growth in the Bank’s loanportfolio over the period.
Afreximbank’s management believes that the paid-up capital of U.S.$506.3 million, plus retained earnings andreserves, makes Afreximbank a well-capitalised bank, with a robust total capital adequacy ratio of 23% as at30 June 2019 in accordance with Basel II.
Return on Average Assets and Return on Average Equity
The Bank had a return on average total assets of 2.2% for the year ended 31 December 2018, as compared to areturn of 1.9% for the year ended 31 December 2017 and a return of 1.8% for the year ended 31 December2016.
The Bank had a return on average equity of 11.8% for the year ended 31 December 2018 and 31 December2017, as compared to a return of 11.4% for the year ended 31 December 2016. This figure remains ahead of theBank’s strategic minimum target of 10.0%.
The increase in the earnings ratios was due to higher growth in net income and was in line with set targets.
Reserves
The Bank maintains a general reserve in accordance with the Bank’s Charter in order to cover general bankingrisks, including future losses and other unforeseeable risks or contingencies. As at 31 December 2018,Afreximbank’s general reserve totalled U.S.$594.5 million, compared with U.S.$474.7 million as at31 December 2017 and U.S.$364.4 million as at 31 December 2016.
Qualitative and Quantitative Disclosure about Market Risk
Liquidity Risk
Liquidity risk concerns the ability of the Bank to fulfil its financial obligations as they become due. Themanagement of the liquidity risk is focused on the timing of the cash in-flows and out-flows as well as in theadequacy of the available cash, credit lines and high liquidity investments. The Bank manages its liquidity riskby preparing dynamic cash flow forecasts covering all expected cash flows from assets and liabilities andtaking appropriate advance actions.
75

The table below sets forth the Bank’s assets and liabilities with corresponding maturity profile as at31 December 2018.
Up to1 month 1-3 months
3-12months 1-5 years
Over5 years
2018Total
(U.S.$’000)Financial AssetsCash and due from banks(1) . . . 612,858 — — — — 612,858Deposits with other banks . . . . 1,114,770 190,857 — — — 1,305,627Hedging Derivatives . . . . . . . . 577 1,588 1,520 — — 3,685Loans and advances tocustomers (HTM) . . . . . . . . 3,085,274 739,476 3,537,763 3,546,332 366,788 11,275,633
Loans and advances tocustomers (FV) . . . . . . . . . . 16,151 16,151 64,603 32,302 — 129,207
Total Financial Assets . . . . . . 4,829,630 948,072 3,603,886 3,578,634 366,788 13,327,010Financial LiabilitiesDue to Banks . . . . . . . . . . . . 180,920 614,540 1,259,902 2,581,117 514,855 5,151,334Debt securities in issue . . . . . . — — 700,224 1,589,142 751,755 3,041,121Hedging Derivatives . . . . . . . . — — — 24,840 — 24,840Deposits and customer accounts . 1,145,539 400,014 500,047 — — 2,045,600Total Financial Liabilities . . . . 1,326,459 1,014,554 2,460,173 4,195,099 1,266,610 10,262,894Net liquidity gap . . . . . . . . . . 3,503,172 (66,482) 1,143,713 (616,464) (899,822) 3,064,115Cumulative liquidity gap . . . . 3,503,172 3,436,689 4,580,402 3,963,938 3,064,115
(1) Petty cash and cash held in banks.
(2) Principal plus interest.
The table below sets forth the Bank’s assets and liabilities with corresponding maturity profile as at31 December 2017.
Up to1 month 1-3 months
3-12months 1-5 years
Over5 years
2017Total
(U.S.$’000)Financial AssetsCash and due from banks(1) . . . 790,445 — — — — 790,445Deposits with other banks . . . . 2,152,584 — 200,592 — — 2,353,176Hedging Derivatives . . . . . . . — — — 2,766 — 2,766Loans and advances(2) . . . . . . 1,373,877 1,368,728 4,263,787 1,920,358 54,602 8,981,352Total Financial Assets . . . . . . 4,316,906 1,368,728 4,464,379 1,923,124 54,602 12,127,739Financial LiabilitiesDue to Banks . . . . . . . . . . . . 125,966 421,314 1,208,211 2,593,474 68,937 4,417,902Debt securities in issue . . . . . . — — 508,648 1,824,962 946,917 3,280,527Hedging Derivatives . . . . . . . — — 135 22,892 — 23,027Deposits and customer accounts 881,235 400,827 502,097 — — 1,784,159Total Financial Liabilities . . . 1,007,201 822,141 2,219,091 4,441,328 1,015,854 9,505,615Net liquidity gap . . . . . . . . . 3,309,705 546,587 2,245,288 (2,518,204) (961,252) 2,622,124Cumulative liquidity gap . . . . 3,309,705 3,856,292 6,101,580 3,583,376 2,622,124 —
(1) Petty cash and cash held in banks.
(2) Principal plus interest.
76

The table below sets forth the Bank’s assets and liabilities with corresponding maturity profile as at31 December 2016.
Up to1 month 1-3 months
3-12months 1-5 years
Over5 years
2016Total
(U.S.$’000)Financial AssetsCash and due from banks(1) . . . 618,846 — — — — 618,846Deposits with other banks . . . . 650,235 — — — — 650,235Hedging Derivatives . . . . . . . — — 1,320 7,472 — 8,792Loans and advances(2) . . . . . . 1,292,167 335,401 5,561,745 3,056,551 77,606 10,323,470Total Financial Assets . . . . . . 2,561,248 335,401 5,563,065 3,064,023 77,606 11,601,343Financial LiabilitiesDue to Banks . . . . . . . . . . . . 89,694 338,640 1,636,757 1,926,054 228,884 4,220,029Debt securities in issue . . . . . . — — — 2,125,112 — 2,125,112Hedging Derivatives . . . . . . . 1,071 — — 20,947 — 22,018Deposits and customer accounts 113,616 — 3,163,100 507,167 — 3,783,883Total Financial Liabilities . . . 204,382 338,640 4,799,857 4,579,280 228,884 10,151,043Net liquidity gap . . . . . . . . . 2,356,867 (3,239) 763,208 (1,515,257) (151,278) 1,450,301Cumulative liquidity gap . . . . 2,356,867 2,353,628 3,116,836 1,601,579 1,450,300 —
(1) Petty cash and cash held in banks.
(2) Principal plus interest.
The net liquidity gap for the year ended 31 December 2018 is most pronounced for liabilities having a term ofover five years. However, for the years ended 31 December 2017 and 31 December 2016, the negative netliquidity gap was more pronounced for liabilities having a term of between one and five years at negativeU.S.$616.4 million for the year ended 31 December 2018 compared with U.S.$2,518.2 million for the yearended 31 December 2017 and negative U.S.$1,515.26 million for the year ended 31 December 2016. Forliabilities having a term of between 3-12 months, the net liquidity gap was positive U.S.$1,143.7 million as at31 December 2018 compared with positive U.S.$2,245.29 million as at 31 December 2017 andU.S.$763.21 million as at 31 December 2016. The decreased average maturity of the Bank’s loan portfoliowas largely as a result of the increase in lending to eligible African central banks under the COTRALFprogramme during 2016 and 2017, which loans had tenors of between 6 months to 1 year.
Derivative Financial Instruments and Hedge Accounting
The Bank makes use of derivative instruments to manage its exposures to interest rate, foreign currency andcredit risks, including exposures arising from highly probable forecast transactions and firm commitments. Inorder to manage particular risks, the Bank applies hedge accounting for transactions which meet specifiedcriteria.
At inception of the hedge relationship, the Bank formally documents the relationship between the hedged itemand the hedging instrument, including the nature of the risk, the risk management objective and strategy forundertaking the hedge and the method that will he used to assess the effectiveness of the hedging relationshipat inception and on an on-going basis.
At each hedge effectiveness assessment date, a hedge relationship must be expected to be highly effective on aprospective basis and demonstrate that it was effective (retrospective effectiveness) for the designated period inorder to qualify for hedge accounting. A formal assessment is undertaken by comparing the hedginginstrument’s effectiveness in offsetting the changes in fair value or cash flows attributable to the hedged risk inthe hedged item, both at inception and at each quarter end on an on-going basis. A hedge is expected to behighly effective if the changes in fair value or cash flows attributable to the hedged risk during the period forwhich the hedge is designated were offset by the hedging instrument in a range of 80% to 125% and wereexpected to achieve such offset in future periods. For situations where the hedged item is a forecast transaction,the Bank also assesses whether the transaction is highly probable and presents an exposure to variations in cashflows that could ultimately affect the income statement.
77

Foreign Exchange Exposure
The Bank’s lead currency is the U.S. dollar. As at 31 December 2018, 89.5% of its financial assets (consistingof cash and cash equivalents, derivative assets held for risk management and loans and advances to customersand totalling U.S.$11.8 billion) and 87.3% of its financial liabilities (consisting of due to banks, deposits andcustomer accounts, other liabilities and derivatives for risk management and totalling U.S.$9.5 billion) aredenominated in U.S. dollars, and payment of shareholder capital contributions are made in U.S. dollars. As at31 December 2018, the Bank had U.S.$56.1 million outstanding under foreign exchange derivative contracts ascompared to U.S.$55.0 million as at 31 December 2017 and U.S.$157.4 million as at 31 December 2016. TheBank considers its foreign currency mismatch to be minimal. As of 31 December 2018, the Bank’s non-U.S. dollar currency exposure was U.S.$1.4 billion, represented by U.S.$1.3 billion, or 96%, in Euro andU.S.$0.1 billion, or 4% in other currencies. Please see also “Risk Factors—Risks relating to the Bank’sfinancial position, in terms of composition and exposures—Local foreign exchange controls or currencydevaluation may affect the Bank’s (and the Bank’s borrowers’) ability to pay U.S. dollar-denominatedobligations” and “Risk Management—Interest rate risk management”.
For the year ended 31 December 2018, if foreign exchange rates at that date had been 10% lower with all othervariables held constant, profit and reserves for the year would have been U.S.$0.3 million(2017: U.S.$17.6 million) lower, arising mainly as a result of more financial liabilities than financial assetsin Euro. If foreign exchange rates had been 10% higher, with all other variables held constant, profit wouldhave been U.S.$0.3 million (2017: U.S.$17.6 million) higher, arising mainly as a result of higher increase inrevaluation of financial assets than financial liabilities in Euro.
Interest Rate Exposure
The following table shows the Bank’s exposure to interest rate risks as at 31 December 2018:
Up to3 Months
3-6months
6-12months
Over1 year
Non-interestbearing
2018Total
(U.S.$’000)Financial AssetsCash and due from banks . . . . 612,757 — — — 101 —Deposits with other banks . . . . 1,305,626 — — — — —Loans and advances tocustomers at amortised cost . 7,934,160 1,942,411 — — — 1,528,270
Loans and advances tocustomers (FVTPL) . . . . . . 129,783 — — — — —
Other assets . . . . . . . . . . . . . — — — — 13,988 —Financial investments—held tomaturity . . . . . . . . . . . . . . — — — — — 168,328
Total Financial Assets . . . . . . 9,982,326 1,942,411 — — 14,089 1,696,598Financial LiabilitiesDue to banks . . . . . . . . . . . . 181,167 336,000 559,525 2,808,056 — 1,263,197Debt securities in issue . . . . . — — 575,000 886,500 — 1,566,217Deposits and customer accounts 320,904 — — — — 2,044,481Other liabilities . . . . . . . . . . . — — — — 113,805 —Total Financial Liabilities . . . 502,071 336,000 1,134,525 3,694,556 113,805 4,873,895Total interest repricing gap . . 9,480,255 1,606,411 (1,134,525) (3,694,556) — —
78

The following table shows the Bank’s exposure to interest rate risks as at 31 December 2017.
Up to3 Months
3-6months
6-12months
Over1 year
Non-interestbearing
Fixedrate
2017Total
(U.S.$’000)Financial AssetsCash and due from banks . 861,307 — — — 90 — 861,397Deposits with other banks 2,152,584 200,592 — — — — 2,353,176Loans and advances tocustomers . . . . . . . . . 1,354,182 1,831,709 1,495,325 1,871,432 — 1,957,895 8,510,543
Prepayment and accruedincome . . . . . . . . . . . — — — — 239,329 — 239,329
Other assets . . . . . . . . . — — — — 2,931 — 2,931Financialinvestments—held tomaturity . . . . . . . . . . — — — — — 30,628 30,629
Total Financial Assets . . 4,368,073 2,032,301 1,495,325 1,871,432 242,350 1,988,163 11,998,004Financial LiabilitiesDue to banks . . . . . . . . . 72,313 100,000 466,000 1,702,601 — 1,890,460 4,231,374Debt securities in issue . . — 400,000 — 1,275,000 — 1,206,622 2,881,622Deposits and customeraccounts . . . . . . . . . . 386,517 — — — — 1,762,839 2,149,356
Other liabilities . . . . . . . — — — — 85,713 — 85,713Total Financial Liabilities 458,830 500,000 466,000 2,977,601 85,713 4,859,921 9,348,065Total interestrepricing gap . . . . . . . 3,909,243 1,532,301 1,029,325 (1,106,169) — — —
The following table shows the Bank’s exposure to interest rate risks as at 31 December 2016.
Up to3 Months
3-6months
6-12months
Over1 year
Non-interestbearing
Fixedrate
2016Total
(U.S.$’000)Financial AssetsCash and due from banks 618,770 — — — 75 — 618,845Deposits with other banks 650,235 — — — — — 650,235Loans and advances tocustomers . . . . . . . . . 9,293,445 268,712 313,560 — — 439,903 10,315,620
Prepayment and accruedincome . . . . . . . . . . — — — — 198,316 — 198,316
Other assets . . . . . . . . . — — — — 3,069 — 3,069Financialinvestments—held tomaturity . . . . . . . . . . — — — — — 30,268 30,268
Total Financial Assets . 10,562,450 268,712 313,560 — 201,460 470,171 11,816,353Financial LiabilitiesDue to banks . . . . . . . . 1,580,803 410,310 107,811 — — 1,951,988 4,050,912Debt securities in issue . 1,736,000 — — — — 355,114 2,091,114Deposits and customeraccounts . . . . . . . . . 148,425 — — — — 3,630,068 3778,493
Other liabilities . . . . . . . — — — — 71,507 — 71,507Total FinancialLiabilities . . . . . . . . 3,465,228 410,310 107,811 — 71,507 5,937,170 9,992,026
Total interestrepricing gap . . . . . . 7,097,222 (141,598) 205,749 — 129,953 5,466,999 1,824,327
At 31 December 2018, if interest rates at that date had been 90 basis points lower with all other variables heldconstant, profit and reserves for the year would have been U.S.$37.2 million (2017: U.S.$29.0 million) lower,arising mainly as a result of the lower decrease in interest income on loans than the decrease in interest expenseon borrowings. If interest rates had been 90 basis points higher, with all other variables held constant, profit
79

would have been U.S.$37.2 million (2017: U.S.$29.0 million) higher, arising mainly as a result of higherincrease in interest income on loans than the increase in interest expense on borrowing. The sensitivity waslower in 2018 than in 2017 due to the increase in interest rate-sensitive assets and liabilities.
Please see also “Risk Management—Interest rate risk management”.
Contingent Liabilities
In the normal course of business, the Bank makes contractual commitments on behalf of its customers and, inorder to meet the financing needs of its customers, is a party to financial instruments with off-balance sheetrisk. Such commitments comprise principally loans or credit lines, whereby the Bank agrees to make paymentsfor customers’ accounts under certain conditions or in the event of default by a customer. In return for suchpayments, the Bank receives a counter-indemnity from the customer, as well as (to a lesser extent),documentary credits for imports and exports, finance leases (under similar stand-by terms) and commitmentswith respect to recourse risks arising from discounted bills. These services are normally provided on a fee-paying basis. The Bank considers that the credit risk associated with these transactions is minimal on thegrounds that the Bank deals exclusively with creditworthy counterparties. Creditworthiness is assessed using acredit risk grading system, which is based on assessment of financial factors, non-financial factors andtransaction specific risk factors, to assign a risk grade.
The following table sets forth an analysis of the Bank’s contingent liabilities for the six months ended 30 June2019 and as at 31 December 2018, 2017 and 2016:
For the six monthsended 30 June
2019
As at31 December
2018 2017 2016(U.S.$’000)
Letters of credit . . . . . . . . . . . . . . . . . . . . . . . . . . . 1,351,630 421,559 319,939 245,070Guarantees . . . . . . . . . . . . . . . . . . . . . . . . . . . . . . 1,281,227 436,466 376,680 500,375Total . . . . . . . . . . . . . . . . . . . . . . . . . . . . . . . . . . 2,632,857 858,025 696,619 745,445
For the six months ended 30 June 2019, contingent liabilities increased by U.S.$1,774.9 million, or 206.9%, toU.S.$2,632.9 million. The increase from 31 December 2018 to 30 June 2019 was primarily due to the increasein the overall volume of letters of credit and guarantees issued over the period.
As at 31 December 2018, contingent liabilities increased by U.S.$0.2 million, or 23.2%, to U.S.$858.0 million,after having decreased by U.S.$0.04 million, or 6.5% from U.S.$696.6 million as at 31 December 2017, whichincreased by U.S.$0.1 million, or 15.1% from U.S.$745.4 million as at 31 December 2016. The year-on-yearincrease from 31 December 2017 to 31 December 2018 was primarily due to the increase in the overall volumeof letters of credit and guarantees issued over the period.
As at 31 December 2017, contingent liabilities decreased by U.S.$48.83 million, or 6.5%, toU.S.$696.62 million, after having decreased in 2016 by U.S.$48.83 million, or 6.5% fromU.S.$745.45 million as at 31 December 2016, which increased by U.S.$231.28 million, or 44.5% fromU.S.$514.17 million as at 31 December 2015. The year-on-year decrease from 31 December 2016 to31 December 2017 was primarily due to a decrease in guarantees, as some facilities had expired.
See also ”—Funding—Contingency Planning and Future Funding Activities”.
Bilateral borrowing. The Bank has continued to increase the amount of its bilateral borrowing. During 2018,the Bank raised U.S.$355 million through bilateral lines comprising U.S.$255 million in term loans andU.S.$100 million in revolving credit facilities. The bilateral lines outstanding as at 30 June 2019 wereU.S.$1,281 million, of which the uncommitted, and committed but undrawn, bilateral lines, money market linesand trade finance lines amount to U.S.$700 million. On 4 July 2019, the Bank entered into a term loan facilityagreement with Société Générale for an approved limit of €100 million, which has been fully drawn down as ofthe date of this Registration Document. Please see also ”—Funding—Bilateral Loans”.
Short-term assets. As at 31 December 2018, the Bank’s loans to borrowers had an average maturity of19 months.
80

Asset sales. As part of the Bank’s strategy of leveraging international funding to Africa, syndication and assetsales have become a part of the regular business of the Bank.
Liquid assets. According to the Bank’s liquidity policy, the liquid funds5 that must be held wereU.S.$1,233 million as at 31 December 2018, U.S.$1,505 million as at 31 December 2017 andU.S.$1,172.6 million as at 31 December 2016. The actual cash (and cash equivalents) held wasU.S.$1,918.4 million as at 31 December 2018, U.S.$3,214.6 million as at 31 December 2017 andU.S.$1,269.1 million as at 31 December 2016. By the end of 2019, around 66% and 100% of the lending andtreasury asset portfolios, respectively, are maturing, demonstrating the strong liquidity of the asset portfolio.
Callable Capital. The Bank’s shares are 43.6% paid, representing an aggregate amount of U.S.$506.3 million(excluding share premium) out of overall subscribed capital of U.S.$1,162.1 million as at 31 December 2018.The shareholders are obliged by the Charter to pay an additional U.S.$873 million in the event of need whencalled by the Board. The Bank’s Board has not, as at the date of this Registration Document, made any call forthe callable portion of the Bank’s capital.
Off-Balance Sheet Transactions
The Bank enters into off-balance sheet arrangements in the normal course of its business to facilitate itsbusiness and objectives. These arrangements, which may involve elements of credits in excess of amountsrecognised on the balance sheet, primarily include:
(i) credit agreements signed and pending disbursement;
(ii) letters of credit; and
(iii) financial guarantee of contracts.
For further details of these arrangements, see Note 7 of the Annual Special Purpose Financial Statements.
The amount of the Bank’s off-balance sheet obligations increased in the year ended 31 December 2018,standing at U.S.$545.2 million as compared to U.S.$321.2 million as at 31 December 2017, an increase ofU.S.$224.0 million or 68.8%, and U.S.$453.5 million as at 31 December 2016. From 31 December 2017 to31 December 2018, this was predominantly due to the increase in the overall volume of letters of credit andguarantees issued over the period. Please see also “Business—The Bank’s Programmes and Facilities—ProductOverview—Non-Dual Recourse Programmes—Guarantee Programme Related to Obtaining Large Contracts”.
Critical Accounting Policies
General
The Special Purpose Financial Statements have been prepared under the historical cost convention, except forland and buildings and derivative financial instruments that have been measured at fair value, and are presentedin U.S. dollars in accordance with the Charter and in conformity with IFRS. The preparation of financialstatements complying with IFRS requires the use of critical accounting estimates and also requires the Bank’smanagement to use subjective judgment, often as a result of the need to make estimates of matters that areinherently uncertain. The Bank’s management bases its estimates on historical experience and on various otherassumptions that it believes to be reasonable under the circumstances. Actual results may differ from theestimates.
Some of the figures as of and for the year ended 31 December 2016 set out in the 2016-2017 Special PurposeFinancial Statements have been reclassified as compared to such figures set out in the Bank’s audited financialstatements as of and for the year ended 31 December 2016. Such reclassification has been made so as to makethe affected 2016 figures consistent with the classifications applied in preparing the 2016-2017 Special PurposeFinancial Statements. These reclassifications were as follows: (i) Adjustment to the statement of comprehensiveincome: reclassifying U.S.$306,000 from impairment in other assets and accrued income to personnel expenses,which is related to a provision for leave pay; and (ii) Adjustment to the statement of financialposition: reclassifying intangible assets amounting to U.S.$814,000 from plant property and equipment tointangible assets; reclassifying U.S.$142,000 from debt securities in issue to prepayments and accrued income,which is related to prepayment for a bond issuance cost.
5 Liquid funds are defined as per Afreximbank’s RMPP as (i) loan commitments with disbursements scheduled within one week andthose with approvals but no clear disbursement schedule; (ii) administrative and capital expenditure payable within two monthsaccording to budget, (iii) plus repayment of debt and/or financial charges falling due within three months, and (iv) a reasonable marginto cover underestimates of the above plus provisions for contingencies.
81

Impairment Losses on Loans and Advancements
The Bank reviews its loan portfolio regularly to assess whether a provision for impairment should be recordedin the statement of comprehensive income. In particular, considerable judgment by management is required inthe estimation of the amount and timing of future cash flows when determining the level of provisions required.Such estimates are necessarily subjective based on assumptions about several factors involving varying degreesof judgment and uncertainty. Consequently, actual results may differ resulting in future changes to suchprovisions.
The Bank’s policy requires the review of individual financial assets, facilities and commitments at leastquarterly, or more regularly when individual circumstances require. Impairment allowances on individuallyassessed accounts are determined by an evaluation of the impairment at the reporting date on a case-by-casebasis, and are applied to all individually significant accounts. The assessment normally encompasses collateralheld (including re-confirmation of its enforceability) and the anticipated receipts for that individual account.
Fair Value of Financial Instruments
The fair value of financial instruments where no active market exists or where quoted prices are not otherwiseavailable are determined by using valuation techniques. In these cases, the fair values are estimated fromobservable data in respect of similar financial instruments. Where market observable inputs are not available,they are estimated based on appropriate assumptions.
Estimated fair value is the amount at which an instrument could be exchanged in a current transaction betweenwilling parties other than as part of an enforced or liquidation sale. The fair values of financial instruments notrecognised on the statement of financial position are the same figures appearing as contingent liabilities andcommitments.
Financial instruments not measured at fair value
Loans and Advances
Loans and advances are net of charges for impairment. The estimated fair value of loans and advancesrepresents the discounted amount of estimated future cash flows expected to be received. Expected cash flowsare discounted at current market rates to determine fair value.
Debt Securities in Issue
The aggregate fair prices are calculated based on quoted prices. For those notes where quoted market prices arenot available, a discounted cash flow model is used.
Financial instruments measured at fair value
Derivative Financial Instruments
The Bank enters into interest rate swaps and foreign exchange forward contracts to hedge its exposure tochanges in the fair value and cash flows attributable to changes in market interest and exchange rates on itsassets and liabilities. Swaps are contractual agreements between two parties to exchange streams of paymentsover time based on specified notional amounts, in relation to movements in a specified underlying index suchas an interest rate, foreign currency rate or equity index.
Fair Value Hierarchy
IFRS 13 specifies a hierarchy of valuation techniques based on whether the inputs to those valuation techniquesare observable or unobservable. Observable inputs reflect market data obtained from independent sources;unobservable inputs reflect the Bank’s market assumptions. These two types of inputs have created thefollowing fair value hierarchy:
• Level 1—Quoted prices (unadjusted) in active markets for identical assets or liabilities. This level includeslisted equity securities and debt instruments on exchanges (e.g. London Stock Exchange, Frankfurt StockExchange, New York Stock Exchange) and exchange traded derivatives such as futures (e.g. NASDAQ,S&P 500).
• Level 2—Inputs other than quoted prices included within Level 1 that are observable for the asset orliability, either directly (that is, as prices) or indirectly (that is, derived from prices). This level includes
82

the majority of OTC derivative contracts, traded loans and issued structured debt. The sources of inputparameters like LIBOR yield curve or counter party risk is Reuters.
• Level 3—Inputs for the asset or liability that are not based on observable market data (unobservableinputs). This level includes equity instruments and debt instruments with significant unobservablecomponents. This hierarchy requires the use of observable market data when available. The Bankconsiders relevant and observable market prices in its valuations where possible.
Total gains or losses for the period are included in profit or loss as well as total gains relating to financialinstruments designated at fair value depending on the category of the related asset/liability.
Measurement of ECL
ECL is a probability-weighted estimate of credit losses. They are measured as follows:
• financial assets that are not credit-impaired at the reporting date: as the present value of all cash shortfalls(i.e. the difference between the cash flows due to the entity in accordance with the contract and the cashflows that the Bank expects to receive);
• financial assets that are credit-impaired at the reporting date: as the difference between the gross carryingamount and the present value of estimated future cash flows;
• undrawn loan commitments: as the present value of the difference between the contractual cash flows thatare due to the Bank if the commitment is drawn down and the cash flows that the Bank expects toreceive; and
• financial guarantee contracts: the expected payments to reimburse the holder less any amounts that theBank expects to recover from the holder, the debtor or any other party.
IFRS 9 introduces a three-stage model for impairment based on changes in credit risk since initial recognition.The three-stage model is described below;
Stage 1—Financial instruments that have not had a significant increase in credit risk since initial recognition orthat have low credit risk at the reporting date. The financial instruments in stage 1 have their ECL measured atexpected credit losses on a 12 month basis.
Stage 2—Financial instruments that have had a significant increase in credit risk since initial recognition(unless they have low credit risk at the reporting date) but that do not have objective evidence of impairment.The financial instruments in stage 2 have their ECL measured based on expected credit losses on a lifetimebasis.
Stage 3—Financial assets that have objective evidence of impairment at the reporting date and those purchasedor originated credit impaired. Financial instruments in this stage are considered non-performing. The financialinstruments in stage 3 have their ECL measured based on expected credit losses on a lifetime basis.
Defaults
Under IFRS 9, the Bank will consider a financial asset to be in default when:
• the borrower is unlikely to pay its credit obligations to the Bank in full, without recourse by the Bank toactions such as realizing security (if any is held); or
• the borrower is more than 90 days past due on any material credit obligation to the Bank.
Overdrafts are considered past due once the customer has breached an advised limit or been advised of a limitthat is smaller than the current amount outstanding.
In assessing whether a borrower is in default, the Bank will consider indicators that are:
• qualitative: e.g. breach of covenants that are deemed as default events;
• quantitative: e.g. 90 days overdue status and non-payment of another obligation of the same issuer to theBank; and
• based on internally and external objective evidence of impairment. Inputs into the assessment of whether afinancial instrument is in default and their significance may vary over time to reflect changes incircumstances.
83

Significant increase in credit risk
The Bank has established a framework that consider qualitative, quantitative, and ‘backstop’ (30 days past duepresumption) indicators to determine whether the credit risk on a particular financial instrument has increasedsignificantly since initial recognition. The framework aligns with the Bank’s internal credit risk managementprocess.
The criteria for determining whether credit risk has increased significantly will vary by portfolio and willinclude backstop based on delinquency.
In determining whether the credit risk (i.e. risk of default) on a financial instrument has increased significantlysince initial recognition, the Bank will consider reasonable and supportable information that is relevant andavailable without undue cost or effort, including both quantitative and qualitative information and analysisbased on the Bank’s historical experience, expert credit assessment and forward-looking information.
The Bank will primarily assess whether a significant increase in credit risk has occurred for an exposure in linewith its staging criteria by comparing:
• the risk of default on the exposure as at the reporting date; and
• the risk of default on the exposure as at the date of initial recognition
From a quantitative point, the Bank uses changes in internal ratings of financial assets to assess significantincrease/decrease in credit risk. Evidence of SICR depends on rating at initial recognition and the extent ofmovement (number of notches downgrade/upgrade) as at reporting date.
The Bank applies different notch movements across each rating grade as evidence of SICR. Generally, obligorswith higher credit ratings would require more notches downgrade to evidence SICR, when compared withobligors with lower credit ratings.
Similarly, the Bank shall monitor changes in external ratings of financial instruments to assess SICR. Evidenceof SICR depends on rating at initial recognition and the extent of movement (number of notches downgrade) asat the relevant reporting date.
The Bank also uses the backstop indicator otherwise known as “30 days past due presumption” to assesssignificant increases in credit risk. Evidence of SICR shall depend on the number of days for which contractualpayments are past due.
From a qualitative perspective, the Bank considers a wide range of qualitative criteria for staging purposes bothindividually and collectively taking account of IFRS 9 recommendations and a range of other factors. The Bankconsiders significant changes in internal price indicators of credit risk, significant changes in external marketindicators of credit risk for a particular financial instrument or similar financial instruments with the sameexpected life, actual or expected significant changes in the operating results of the borrower, expectation offorbearance or restructuring due to financial difficulties, among others.
Individual collective assessment of significant increase in credit risk
The objective of the impairment requirements in IFRS 9 is to recognise lifetime expected credit losses for allfinancial instruments for which there has been a significant increase in credit risk since initialrecognition—whether assessed on an individual or collective basis. For some instruments, a significantincrease in credit risk may be evident on an individual instrument basis before the financial instrument becomespast due. In these cases, an assessment of whether there has been a significant increase in credit risk is carriedout on an individual basis.
For some other instruments, a significant increase in credit risk may not be evident on an individual instrumentbasis before the financial instrument becomes past due. For example, this could be the case when there is littleor no updated information that is routinely obtained and monitored on an individual instrument until a customerbreaches the contractual terms—e.g. for many retail loans. In these cases, an assessment of whether there hasbeen a significant increase in credit risk on an individual basis would not faithfully represent changes in creditrisk since initial recognition, and so if more forward-looking information is available on a collective basis, anentity makes the assessment on a collective basis.
To assess significant increases in credit risk on a collective basis, the Bank group financial instruments on thebasis of shared credit risk characteristics, which may include any of the following criteria:
• instrument type;
84

• credit risk ratings;
• collateral type;
• date of origination;
• remaining term to maturity;
• industry;
• geographical location of the borrower;
• the value of collateral relative to the financial asset if it has an impact on the PD—e.g. loan-to-value; and
• ratios for non-recourse loans in some jurisdictions.
The Bank may change the grouping of financial instruments for collective assessment over time as newinformation becomes available.
Restructured financial assets
The contractual terms of a loan may be modified for a number of reasons, including changing marketconditions, customer retention and other factors not related to a current or potential credit deterioration of thecustomer. An existing loan whose terms have been modified may be derecognised and the renegotiated loanrecognised as a new loan at fair value.
Under IFRS 9, when the terms of a financial asset are modified and the modification does not result inderecognition, the determination of whether the asset’s credit risk has increased significantly reflectscomparison of:
• the risk of default at the reporting date based on the modified terms; and
• the risk of default based on data on initial recognition and the original contractual terms.
If the terms of a financial asset are renegotiated or modified or an existing financial asset is derecognised andreplaced with a new one due to financial difficulties of the borrower, then the modified asset is considered tobe a new financial asset. Accordingly, the date of modification is treated as the date of initial recognition forthe purpose of impairment calculation. The determination of whether the asset’s credit risk has increasedsignificantly reflects comparison of:
• the risk of default at the reporting date based on the modified terms; and
• the risk of default based on data on initial recognition and the original contractual terms.
However, in some unusual circumstances following a modification that results in derecognition of the originalfinancial asset, there may be evidence that the modified financial asset is credit-impaired at initial recognition,and thus, the financial asset should be recognised as an originated credit-impaired financial asset. This mightoccur, for example, in a situation in which there was a substantial modification of a distressed asset thatresulted in the derecognition of the original financial asset. In such a case, the Bank treats the new assetsresulting from the modification as credit- impaired on the modification date (initial recognition).
Recently-Issued Accounting Standards
IFRS 9 “Financial Instruments”
IFRS 9 sets out requirements for recognising and measuring financial assets, financial liabilities and somecontracts to buy or sell non-financial items. This standard replaces IAS 39 Financial Instruments: Recognitionand Measurement. The requirements of IFRS 9 represent a significant change from IAS 39. The new standardbrings fundamental changes to the accounting for financial assets and to certain aspects of the accounting forfinancial liabilities.
As a result of the adoption of IFRS 9, the Bank has adopted consequential amendments to IAS 1 Presentationof Financial Statements, which require separate presentation in the statement of profit or loss and OCI ofinterest revenue calculated using the effective interest method. Previously, the Bank disclosed this amount inthe notes to the Special Purpose Financial Statements.
In particular, the Bank renamed ’Financial investment—held to maturity used in 2017’ to ’Financial investmentat amortised cost’ on its statement of financial position as at 1 January 2018 to reflect the measurementcategory for IFRS 9. Furthermore, the Bank has adopted consequential amendments to IFRS 7 Financial
85

Instruments: Disclosures that are applied to disclosures in 2018, but have not been applied to the comparativeinformation.
Classification and Measurement of financial assets—IFRS 9 contains three principal classification categoriesfor financial assets: measured at amortised cost, fair value through other comprehensive income (FVOCI) andfair value through profit or loss (FVTPL). IFRS 9 classification is generally based on the business model inwhich a financial asset is managed and its contractual cash flows. The standard eliminates the previous IAS 39categories of held-to-maturity, loans and receivables, and available-for-sale. Under IFRS 9, derivativesembedded in contracts where the host is a financial asset in the scope of the standard are never bifurcated.Instead, the whole hybrid instrument is assessed for classification. See the “Transition to IFRS” on note 36 ofthe 2017-2018 Special Purpose Financial Statements for an explanation of how the Bank classifies financialassets under IFRS 9.
IFRS 9 largely retains the existing requirements in IAS 39 for the classification of financial liabilities withminor changes with no significant impact on the financial liabilities of the Bank.
Expected Credit Loss Model—Impairment of financial instruments—IFRS 9 replaces the ‘incurred loss’ modelin IAS 39 with an ‘expected credit loss’ model. The new impairment model also applies to certain loancommitments and financial guarantee contracts but not to equity investments. Under IFRS 9, credit losses arerecognised earlier than under IAS 39. See the “Transition to IFRS” in note 36 of the 2017-2018 SpecialPurpose Financial Statements for an explanation of how the Bank applies the impairment requirements ofIFRS 9.
IFRS 15 “Revenue from Contracts with Customers”
IFRS 15 establishes a comprehensive framework for determining whether, how much and when revenue isrecognised. It replaced IAS 18 Revenue, IAS 11 Construction Contracts and related interpretations. The Bankinitially applied IFRS 15 on 1 January 2018 retrospectively in accordance with IAS 8. The timing or amount ofthe Bank’s fee and commission income from contracts with customers was not impacted by the adoption ofIFRS 15. The impact of IFRS 15 was limited to the new disclosure requirements.
Amendments to IFRS 10 “Consolidated Financial Statements” and IAS 28 “Investments in Associates andJoint Ventures”—Sale or Contribution of Assets between an Investor and its Associate or Joint Venture andfurther amendments (effective date was deferred indefinitely until the research project on the equity methodhas been concluded)
The amendments address a conflict between the requirements of IAS 28 and IFRS 10 and clarify that in atransaction involving an associate or joint venture the extent of gain or loss recognition depends on whether theassets sold or contributed constitute a business. These improvements have no impact on the Bank’s financialposition or performance.
IFRS 16 “Leases” issued by IASB on 13 January 2016. (The new standard is effective for annual periodsbeginning on or after 1 January 2019)
IFRS 16 was issued in January 2016 and it replaces IAS 17 Leases, IFRIC 4 Determining whether anArrangement contains a Lease, SIC-15 Operating Leases-Incentives and SIC-27 Evaluating the Substance ofTransactions Involving the Legal Form of a Lease. IFRS 16 sets out the principles for the recognition,measurement, presentation and disclosure of leases and requires lessees to account for all leases under a singleon-balance sheet model similar to the accounting for finance leases under IAS 17. The standard includes tworecognition exemptions for lessees—leases of ’low-value’ assets (e.g., personal computers) and short-termleases (i.e., leases with a lease term of 12 months or less). At the commencement date of a lease, a lessee willrecognise a liability to make lease payments (i.e., the lease liability) and an asset representing the right to usethe underlying asset during the lease term (i.e., the right-of-use asset). Lessees will be required to separatelyrecognise the interest expense on the lease liability and the depreciation expense on the right-of-use asset.
Lessees will be also required to re-measure the lease liability upon the occurrence of certain events (e.g., achange in the lease term, a change in future lease payments resulting from a change in an index or rate used todetermine those payments). The lessee will generally recognise the amount of the re-measurement of the leaseliability as an adjustment to the right-of-use asset.
Lessor accounting under IFRS 16 is substantially unchanged from today’s accounting under IAS 17. Lessorswill continue to classify all leases using the same classification principle as in IAS 17 and distinguish betweentwo types of leases: operating and finance leases.
86

IFRS 16 also requires lessees and lessors to make more extensive disclosures than under IAS 17.
IFRS 16 is effective for annual periods beginning on or after 1 January 2019. Early application is permitted,but not before an entity applies IFRS 15. A lessee can choose to apply the standard using either a fullretrospective or a modified retrospective approach. The standard’s transition provisions permit certain reliefs.
The Bank has applied IFRS 16 from its mandatory adoption date of 1 January 2019. The Bank has applied it ina practical expedient manner on initial application. Where the lease term is less than 12 months or leases are oflow value items, the Bank has elected to use the short-term lease exemption. The Bank’s activities as a lessor/lessee are not material.
87

SELECTED STATISTICAL INFORMATION
The following tables present certain of the Bank’s selected statistical information for the periods indicated. Thestatistical information and discussion and analysis presented below for the years ended 31 December 2016,2017 and 2018 is presented solely for the convenience of the reader for analytical purposes and on the basis ofIndustry Guide 3 under the Securities Act (Statistical Disclosure by Bank Holding Companies) (“Guide 3”).Limitations in the Bank’s existing financial reporting system prevent it from generating certain informationpursuant to Guide 3. This section should be read in conjunction with the Special Purpose Financial Statementsincluded in this Registration Document, as well as “Presentation of Financial and Other Information” and“Operating and Financial Review”.
Average Balance Sheet and Interest Rate Data
The following tables provide an analysis of the average balances of assets and liabilities of the Bank for theyears ended 31 December 2016, 2017 and 2018. For the purposes of the following tables, the average iscalculated on the basis of a simple average of monthly closing balances for each relevant year.
Average Assets and Liabilities
The following tables set out, for the years ended 31 December 2016, 2017 and 2018: (i) the average balancesfor all major assets and liabilities of the Bank; (ii) the average interest income received on each interest-bearingasset and the average interest expense paid for each interest-bearing liability; and (iii) the collective averageyield for all interest-bearing assets and the collective average rate paid for all interest-bearing liabilities.
For the year ended 31 December2018 2017 2016
Averageamountfor theyear(1)
Interestincome/expense
Averageyield/ratepaid
Averageamountfor theyear
Interestincome/expense
Averageyield/ratepaid
Averageamountfor theyear
Interestincome/expense
Averageyield/ratepaid
(U.S.$ ‘000, except percentages)Interest-earningassets
Total interest-earning assets . . 12,505,871 709,478 5.67% 11,511,166 606,074 5.27% 9,166,479 484,012 5.28%
Other assets . . . . . 160,552 — — 308,696 — — 263,413 — —Total assets . . . . . 12,666,423 — — 11,819,862 — — 9,429,892 — —
Interest-bearingliabilities
Customer accounts . 2,257,371 31,838 1.41% 2,963,924 47,793 1.61% 2,543,318 31,282 1.23%Debt securitiesissued . . . . . . . 2,954,669 122,542 4.15% 2,486,368 109,318 4.40% 1,912,693 91,936 4.81%
Due to banks . . . . 4,689,659 151,274 3.23% 4,141,143 110,638 2.67% 3,364,838 87,540 2.60%Total interest-bearingliabilities . . . . . 9,901,699 305,654 3.09% 9,591,435 267,749 2.79% 7,820,849 210,758 2.69%
Other liabilities . . . 422,834 353,226 162,504Total liabilities . . . 10,324,533 305,654 2.96% 9,944,661 267,749 2.69% 7,983,353 210,758 2.64%
Net interest income — 403,824 — — 338,325 — — 273,254 —Net interest margin — — 3.46% — — 2.64% — — 2.7%
Changes in Interest Income and Interest Expense
The following table sets out, for the years ended 31 December 2016, 2017 and 2018, changes in interestincome/expense due to changes in volume and interest rates for the principal components of interest-earningassets and interest-bearing liabilities set out in the tables above.
88

2018/2017 2017/2016Change ininterestincome /expense
Change involume
Change inrates
Change ininterestincome /expense
Change involume
Change inrates
(U.S.$ ‘000)Total interest-earning assets . . . . . . 103,404 994,705 0.41% 122,062 2,344,688 -0.01%
Total interest-bearing liabilities . . . . 37,905 310,264 0.30% 56,991 1,770,658 0.10%
Total net change . . . . . . . . . . . . . 65,499 684,441 0.11% 65,071 574,030 -0.12%
Loan Portfolio
The Bank’s mandate is to finance, promote and expand intra- and extra-African trade. The Bank employs threeprincipal delivery channels: extending direct credit to eligible African exporters providing pre- and post-shipment finance; extending direct and indirect credit to the African business community through local Africanintermediaries comprising banks and other African institutions; and promoting and financing intra-African tradeand supporting the development of trade finance in all African member states.
As such, the Bank deals with a variety of major banks and its loans and advances are structured and spreadamong a number of major industries, customers and geographical areas. In addition, the Bank has proceduresand policies in place to limit the amount of credit exposure to any counterparty and country (see “CreditPolicies and Procedures—Lending limits and exposures” below). The Bank reviews, on a regular basis, thecredit limits of counterparties and countries and takes action accordingly to ensure that exposure limits are notexceeded.
The Bank analyses credit requests from Eligible Entities or Eligible Countries in the light of credit risk criteria(as to which, see “Risk Management”), including economic and market conditions. The Bank maintains aconsistent lending policy and applies the same credit criteria to all types of potential borrowers in evaluatingcreditworthiness.
The following table shows the Bank’s credit exposure at the respective carrying amounts, categorised byindustry sector, as at 31 December 2018, 31 December 2017 and 31 December 2016:
31 December 2018 31 December 2017 31 December 2016(U.S.$’000) (%) (U.S.$’000) (%) (U.S.$’000) (%)
Industry SectorAgriculture . . . . . . . . . . . . . . . . . . . . . . . . 225,151 2.0 222,032 2.5 254,580 2.5Agro-processing . . . . . . . . . . . . . . . . . . . . 402,755 3.5 165,306 1.9 — —Financial Services . . . . . . . . . . . . . . . . . . . 5,674,340 49.8 4,968,172 56.9 7,065,183 68.5Government . . . . . . . . . . . . . . . . . . . . . . . 629,692 5.5 260,549 3.0 177,755 1.7Hospitality (Hotels, Resorts, etc.) . . . . . . . . . 172,323 1.5 287,928 3.3 91,514 0.9Manufacturing . . . . . . . . . . . . . . . . . . . . . . 317,595 2.8 352,363 4.0 146,582 1.4Metals and Minerals . . . . . . . . . . . . . . . . . . 115,660 1.0 27,803 0.3 175,851 1.7Oil and Gas . . . . . . . . . . . . . . . . . . . . . . . 2,122,734 18.6 1,114,942 12.8 951,514 9.2Other . . . . . . . . . . . . . . . . . . . . . . . . . . . 42,967 0.3 40,104 0.5 196,451 1.9Power . . . . . . . . . . . . . . . . . . . . . . . . . . . 634,007 5.6 603,190 6.9 682,455 6.6Telecommunication . . . . . . . . . . . . . . . . . . 795,330 7.0 328,014 3.8 275,039 2.7Transportation . . . . . . . . . . . . . . . . . . . . . . 272,287 2.4 355,911 4.1 298,696 2.9Total . . . . . . . . . . . . . . . . . . . . . . . . . . . 11,404,841 100 8,726,314 100 10,315,620 100
The change in composition of the loan portfolio by industry sector changes over time based on the compositionof transactions carried out. TFIs (African finance institutions which the Bank lends to through lines of credit orwhich the Bank co-lends to as final borrowers in Participating States) have historically been one of the Bank’skey focus sectors and therefore typically account for a large proportion of the loans outstanding, being 49.8%as at 31 December 2018, 56.9% as at 31 December 2017 and 68.5% as at 31 December 2016.
89

Loans by Region and Product Category
The following table shows the per-region distribution of loans outstanding with a maturity profile of one yearor more.
31 December 2018 31 December 2017 31 December 2016(U.S.$’000) (%) (U.S.$’000) (%) (U.S.$’000) (%)
Region . . . . . . . . . . . . . . . . . . . . . . . . . .West Africa . . . . . . . . . . . . . . . . . . . . . . . 5,548,560 48.7 4,329,704 49.5 4,509,508 43.7North Africa . . . . . . . . . . . . . . . . . . . . . . . 2,879,597 25.2 1,969,195 22.6 4,364,785 42.3East Africa . . . . . . . . . . . . . . . . . . . . . . . 1,089,106 9.5 774,360 8.9 441,939 4.3Central Africa . . . . . . . . . . . . . . . . . . . . . . 575,225 5.0 650,335 7.5 137,290 1.3Southern Africa . . . . . . . . . . . . . . . . . . . . . 1,312,353 11.6 1,002,722 11.5 753,702 7.3Regional(1) . . . . . . . . . . . . . . . . . . . . . . . . — — — — 108,396 1.1Total . . . . . . . . . . . . . . . . . . . . . . . . . . . 11,404,841 100 8,726,316 100 10,315,620 100
Note:(1) “Regional” refers to entities operating within several countries in two or more regions.
Historically, the majority of Afreximbank’s loans have been to entities located in West Africa, principallyNigeria, and this remains the position as at 31 December 2018. The Bank’s management believes that thegeographical concentration of its loan portfolio is comparable with that of other multilateral organisations andDFIs operating throughout Africa. The geographical concentration on Nigeria reflects (i) the size of theNigerian economy relative to others in West Africa and across the continent, and, accordingly, the largeramount of a typical transaction with a Nigerian entity compared with an entity operating in a smaller economy,and (ii) the dominance of Nigeria in terms of African trade patterns as a whole. Despite the historicalgeographical concentration on Nigeria, the Bank has sought to diversify the geographical spread of its loanportfolio, for example, by focusing on countries such as Mali and Mauritius, and the proportion of the Bank’sloan portfolio that is made up of Nigerian entities has decreased from 36.5% as at 31 December 2017 to 33.2%as at 31 December 2018. Nevertheless, as at 31 December 2018, the largest share of the Bank’s loans was madeof loans to entities located in West Africa. Please see also “Risk Factors—Risks relating to the Bank’s financialposition, in terms of composition and exposures—The Bank’s loans are geographically highly concentrated”.
90

The following table shows the distribution of Afreximbank’s loans outstanding by product category as at31 December 2018, 31 December 2017 and 31 December 2016.
31 December 2018 31 December 2017 31 December 2016(U.S.$million) (%)
(U.S.$million) (%)
(U.S.$million) (%)
Type of Programme . . . . . . . . . . . . . . . . . . . . .(1) African Trade Expansion and Diversification
Scheme(a) Dual Recourse ProgrammesNote Purchase Programme . . . . . . . . . . . . . . . . . 336.2 3.0 249.3 2.9 159.8 1.5Receivables Purchase/Discounting Programme . . . . . 162.2 1.5 98.24 1.2 127.1 1.2(b) Non-Dual Recourse ProgrammesSyndication Programme(1) . . . . . . . . . . . . . . . . . . 1,729.7 15.6 2,862.3 33.8 3,073.3 29.8Line of Credit Programme(2) . . . . . . . . . . . . . . . . 5250.7 47.3 3,662.1 43.2 5,808.7 56.3Direct Financing Programme . . . . . . . . . . . . . . . . 2,571.9 23.1 722.3 8.5 569.5 5.5Special Risks Programme(3) . . . . . . . . . . . . . . . . 61.9 0.6 110.0 1.3 110.0 1.1Future-Flow Pre-Financing Programme . . . . . . . . . 278.3 2.5 367.1 4.3 303.7 2.9(2) Export Development SchemeProject-Related Financing Programme . . . . . . . . . . 246.7 2.2 196.9 2.3 122.1 1.2Asset-Backed Lending Programme . . . . . . . . . . . . 164.1 1.5 138.8 1.6 41.4 0.4Export Development Programme . . . . . . . . . . . . . 311.6 2.8 73.5 0.9 — —Country Programme(4) . . . . . . . . . . . . . . . . . . . . 1,318.6 12.4 1,176.6 13.8 1,070.1 10.4Total(4) . . . . . . . . . . . . . . . . . . . . . . . . . . . . . 11,113.2 100 8,480.5 100 10,315.6 100
(1) Includes co-financing and sub-participation(2) This includes COTRALF(3) Contingent liabilities(4) This programme is not included for the purpose of calculating the totals because they represent the total amount syndicated under
that Scheme. The Bank’s share of any such syndications is reflected in the other programmes above.
The following table shows certain other information regarding the Bank’s 20 largest borrowers as at31 December 2018:
Position Country Client sector Outstanding adjusted exposure(1)Net exposure aftermitigation(2)(3)
(U.S.$ million)1 Nigeria(4) Financial services — —2 Nigeria Oil and gas 635.0 222.33 Egypt Financial services 500.0 35.04 Zimbabwe Financial services 380.8 105.05 Egypt Financial services 400.0 400.06 Mauritius Agriculture 256.9 64.17 Egypt Financial services 350.0 —8 Sudan Financial services 305.1 78.09 Congo Government 302.7 75.710 Ghana Financial services 300.0 105.011 Malawi Financial services 250.0 17.512 Gabon Government 91.8 91.813 Nigeria Telecommunications 245.4 82.314 Egypt Financial services 250.0 —15 Egypt Financial services 250.0 —16 Egypt Oil and gas 209.5 209.517 Nigeria Financial services 229.0 57.218 Mauritius Telecommunications 206.3 60.019 Angola Power 110.7 38.720 Congo Oil and gas 186.0 46.5Total 5,459.2 1,688.6
Percentage of total Loan Portfolio 49.1% —
(1) Adjusted exposure is the total loan amount outstanding minus the insured amount minus cash
91
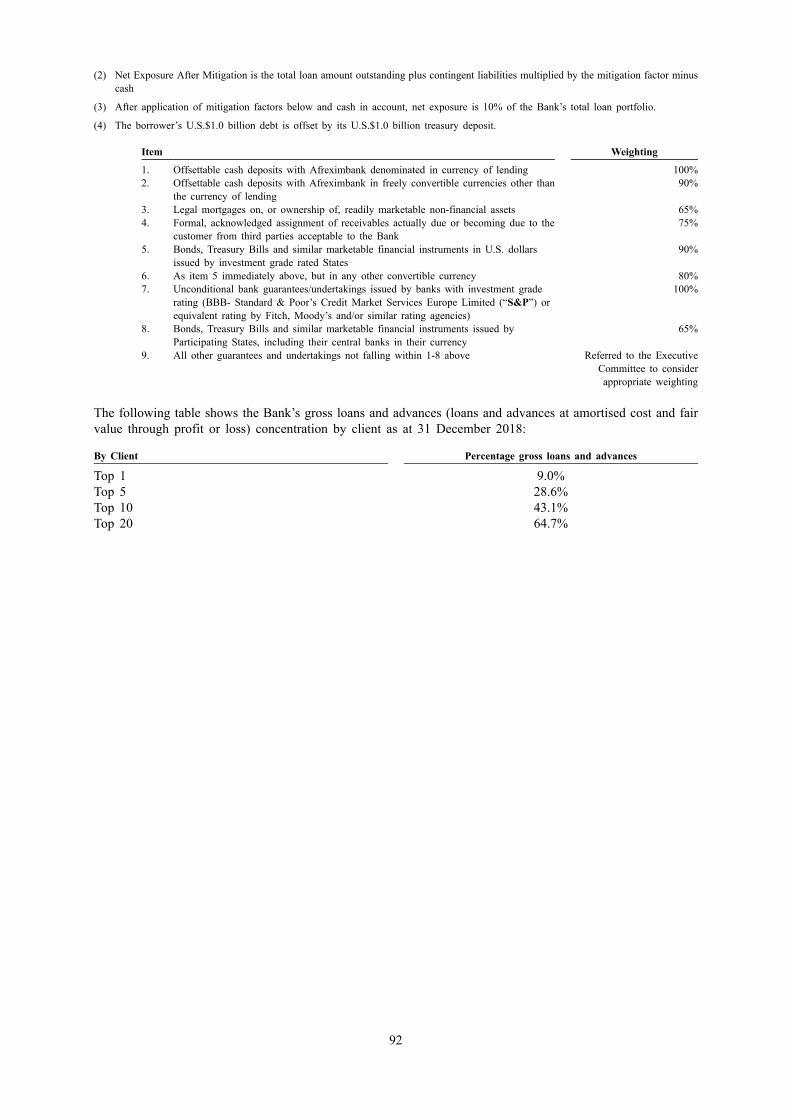
(2) Net Exposure After Mitigation is the total loan amount outstanding plus contingent liabilities multiplied by the mitigation factor minuscash
(3) After application of mitigation factors below and cash in account, net exposure is 10% of the Bank’s total loan portfolio.
(4) The borrower’s U.S.$1.0 billion debt is offset by its U.S.$1.0 billion treasury deposit.
Item Weighting
1. Offsettable cash deposits with Afreximbank denominated in currency of lending 100%2. Offsettable cash deposits with Afreximbank in freely convertible currencies other than
the currency of lending90%
3. Legal mortgages on, or ownership of, readily marketable non-financial assets 65%4. Formal, acknowledged assignment of receivables actually due or becoming due to the
customer from third parties acceptable to the Bank75%
5. Bonds, Treasury Bills and similar marketable financial instruments in U.S. dollarsissued by investment grade rated States
90%
6. As item 5 immediately above, but in any other convertible currency 80%7. Unconditional bank guarantees/undertakings issued by banks with investment grade
rating (BBB- Standard & Poor’s Credit Market Services Europe Limited (“S&P”) orequivalent rating by Fitch, Moody’s and/or similar rating agencies)
100%
8. Bonds, Treasury Bills and similar marketable financial instruments issued byParticipating States, including their central banks in their currency
65%
9. All other guarantees and undertakings not falling within 1-8 above Referred to the ExecutiveCommittee to considerappropriate weighting
The following table shows the Bank’s gross loans and advances (loans and advances at amortised cost and fairvalue through profit or loss) concentration by client as at 31 December 2018:
By Client Percentage gross loans and advances
Top 1 9.0%Top 5 28.6%Top 10 43.1%Top 20 64.7%
92

Total Exposure
The table below sets forth the distribution of current total gross and net exposures as at 31 December 2018.The net exposure takes into consideration the mitigation factors set out in the tables above.
Country
Grossexposure
outstanding
Net exposureoutstanding
(aftermitigation)
(U.S.$ million)Egypt . . . . . . . . . . . . . . . . . . . . . . . . . . . . . . . . . . . . . . . . . . . . . . . . . 2,465.62 1,011Nigeria . . . . . . . . . . . . . . . . . . . . . . . . . . . . . . . . . . . . . . . . . . . . . . . . 3,781.61 796Zimbabwe . . . . . . . . . . . . . . . . . . . . . . . . . . . . . . . . . . . . . . . . . . . . . . 714.83 146Ghana . . . . . . . . . . . . . . . . . . . . . . . . . . . . . . . . . . . . . . . . . . . . . . . . . 460.90 62South Sudan . . . . . . . . . . . . . . . . . . . . . . . . . . . . . . . . . . . . . . . . . . . . . 65.8 2.2Rwanda . . . . . . . . . . . . . . . . . . . . . . . . . . . . . . . . . . . . . . . . . . . . . . . . 150.8 12.9Gabon . . . . . . . . . . . . . . . . . . . . . . . . . . . . . . . . . . . . . . . . . . . . . . . . . 472.8 196.0Zambia . . . . . . . . . . . . . . . . . . . . . . . . . . . . . . . . . . . . . . . . . . . . . . . . 11.7 0.3Malawi . . . . . . . . . . . . . . . . . . . . . . . . . . . . . . . . . . . . . . . . . . . . . . . . 308.6 6.9Mauritius . . . . . . . . . . . . . . . . . . . . . . . . . . . . . . . . . . . . . . . . . . . . . . . 700.1 133.1Cote d’Ivoire . . . . . . . . . . . . . . . . . . . . . . . . . . . . . . . . . . . . . . . . . . . . 300.2 62.0Kenya . . . . . . . . . . . . . . . . . . . . . . . . . . . . . . . . . . . . . . . . . . . . . . . . . 163.7 36.4Liberia . . . . . . . . . . . . . . . . . . . . . . . . . . . . . . . . . . . . . . . . . . . . . . . . 32.3 24.3Mauritania . . . . . . . . . . . . . . . . . . . . . . . . . . . . . . . . . . . . . . . . . . . . . . 19.3 4.1Cape Verde . . . . . . . . . . . . . . . . . . . . . . . . . . . . . . . . . . . . . . . . . . . . . 39.3 1.4Ethiopia . . . . . . . . . . . . . . . . . . . . . . . . . . . . . . . . . . . . . . . . . . . . . . . . 8.7 1.8Seychelles . . . . . . . . . . . . . . . . . . . . . . . . . . . . . . . . . . . . . . . . . . . . . . 4.5 1.1Angola . . . . . . . . . . . . . . . . . . . . . . . . . . . . . . . . . . . . . . . . . . . . . . . . 215.2 40.0Gambia . . . . . . . . . . . . . . . . . . . . . . . . . . . . . . . . . . . . . . . . . . . . . . . . — —Togo . . . . . . . . . . . . . . . . . . . . . . . . . . . . . . . . . . . . . . . . . . . . . . . . . . 17.1 4.3Canada . . . . . . . . . . . . . . . . . . . . . . . . . . . . . . . . . . . . . . . . . . . . . . . . 6.5 1.6Republic of Congo . . . . . . . . . . . . . . . . . . . . . . . . . . . . . . . . . . . . . . . . . 463.1 77.0Tunisia . . . . . . . . . . . . . . . . . . . . . . . . . . . . . . . . . . . . . . . . . . . . . . . . — —Niger . . . . . . . . . . . . . . . . . . . . . . . . . . . . . . . . . . . . . . . . . . . . . . . . . 0.6 0.2Sierra Leone . . . . . . . . . . . . . . . . . . . . . . . . . . . . . . . . . . . . . . . . . . . . . 4.0 1.8Mali . . . . . . . . . . . . . . . . . . . . . . . . . . . . . . . . . . . . . . . . . . . . . . . . . . 48.1 3.7Senegal . . . . . . . . . . . . . . . . . . . . . . . . . . . . . . . . . . . . . . . . . . . . . . . . 215.5 11.6Cameroon . . . . . . . . . . . . . . . . . . . . . . . . . . . . . . . . . . . . . . . . . . . . . . 16.1 0.9Guinea . . . . . . . . . . . . . . . . . . . . . . . . . . . . . . . . . . . . . . . . . . . . . . . . 109.9 23.9Democratic Republic of Congo . . . . . . . . . . . . . . . . . . . . . . . . . . . . . . . . . 96.0 1.4Sudan . . . . . . . . . . . . . . . . . . . . . . . . . . . . . . . . . . . . . . . . . . . . . . . . . 414.0 97.7Botswana . . . . . . . . . . . . . . . . . . . . . . . . . . . . . . . . . . . . . . . . . . . . . . . 57.6 0.5Sub-Regional . . . . . . . . . . . . . . . . . . . . . . . . . . . . . . . . . . . . . . . . . . . . 40.3 35.2Total . . . . . . . . . . . . . . . . . . . . . . . . . . . . . . . . . . . . . . . . . . . . . . . . . 11,404.8 2,797.4
(1) Borrower incorporated in Canada with operations in Nigeria
Collateral
As at 31 December 2018, of Afreximbank’s loans and advances to customers of U.S.$11.1 billion, 16.8% wassecured by collateral in the form of assignments of receivables, 9.9% was secured by insurance, 23.7% wassecured by cash collateral, 14.5% was government-backed (by bonds or guarantee) and 16.8% was secured by apledge over assets. In respect of 1.4%, a specific provision was set aside, and 9.4% was not secured withcollateral.
As at 31 December 2017, of Afreximbank’s loans and advances to customers of U.S.$8.5 billion, 24.2% wassecured by collateral in the form of assignments of receivables, 3.0% was secured by dual recourse, 25.4% wassecured by cash collateral, 8.7% was government-backed (by bonds or guarantee) and 7.1% was secured by apledge over assets. In respect of 2.02%, a specific provision was set aside, and 16.88% was not secured withcollateral.
As at 31 December 2016, of Afreximbank’s loans and advances to customers of U.S.$10.15 billion, 20% wassecured by collateral in the form of assignments of receivables, 9.28% was secured by dual recourse, 45.69%
93

was secured by cash collateral, 8.54% was government-backed (by bonds or guarantee) and 6.35% was securedby a pledge over assets. In respect of 1.40%, a specific provision was set aside, and 8.29% was not securedwith collateral.
The majority of Afreximbank’s loans are structured trade financings of which, as at 31 December 2018,approximately 42% were secured by collateral located outside of the obligor’s country and in OECD countries.
The following table sets forth the amount and location of collateral supporting outstanding loans due toAfreximbank as at 31 December 2018.
Country of borrower Country of payment riskAmount ofcollateral
(U.S.$ million)Nigeria . . . . . . . . . . . . . . . . . . . . . . . . . UK, USA, European Union (“EU”) 515.81Senegal . . . . . . . . . . . . . . . . . . . . . . . . . Switzerland, EU, US, UK 14.10Congo . . . . . . . . . . . . . . . . . . . . . . . . . . EU 74.60Côte d’Ivoire . . . . . . . . . . . . . . . . . . . . . Switzerland, EU 103.97Guinea . . . . . . . . . . . . . . . . . . . . . . . . . Switzerland, EU, US, UK 20.70Unallocated Limits . . . . . . . . . . . . . . . . . . Switzerland 17.20Ghana . . . . . . . . . . . . . . . . . . . . . . . . . . EU 54.05The Republic of Sudan6 . . . . . . . . . . . . . . EU 63.36Angola . . . . . . . . . . . . . . . . . . . . . . . . . EU 4.17Cape Verde . . . . . . . . . . . . . . . . . . . . . . Switzerland, EU, US, UK 31.36Botswana . . . . . . . . . . . . . . . . . . . . . . . . Switzerland, EU, US, UK 43.20Seychelles . . . . . . . . . . . . . . . . . . . . . . . Switzerland, EU, US, UK 3.55Gabon . . . . . . . . . . . . . . . . . . . . . . . . . . Switzerland, EU, US, UK 40.00Sierra Leone . . . . . . . . . . . . . . . . . . . . . . Switzerland, EU, US, UK 1.05Mali . . . . . . . . . . . . . . . . . . . . . . . . . . . Switzerland, EU, US, UK 4.62Cameroon . . . . . . . . . . . . . . . . . . . . . . . EU 12.84Total . . . . . . . . . . . . . . . . . . . . . . . . . . 1,004.58
Maturity Profile
As at 31 December 2018, Afreximbank’s loan portfolio had an average maturity of 17 months, with 65% ofloans scheduled to mature within one year. Of those loans, 25% were in respect of intra-African trade, 3% werein respect of trade outside of Africa and 72% related to transactions involving both intra-African and extra-African trade, with approximately 90% secured with collateral.
As at 31 December 2017, Afreximbank’s loan portfolio had an average maturity of 17 months, with 63% ofloans scheduled to mature within one year. Of those loans, 8.49% were in respect of intra-African trade, 3.87%were in respect of trade outside of Africa and 87.64% related to transactions involving both intra-African andextra-African trade, with approximately 83% secured with collateral.
As at 31 December 2016, Afreximbank’s loan portfolio had an average maturity of 17 months, with 70% ofloans scheduled to mature within one year. Of those loans, 7.8% were in respect of intra-African trade, 2.8%were in respect of trade outside of Africa and 89.5% related to transactions involving both intra-African andextra-African trade, with approximately 92.98% secured with collateral.
The assets of Afreximbank have predominantly short maturities and are funded with liabilities having longermaturities. While certain deposits have a contractual maturity of less than one month, the actual availability ofthese funds is usually significantly longer. The average maturity of all borrowings for the year ended31 December 2018 was 3.33 years, compared with 1.4 years in the years ended 31 December 2017 and 2016.For the year ended 31 December 2018, the average maturity of lending lines to the Bank was 1.6 years forbilateral loans and 1.2 years for syndicated loans. Afreximbank intends to increase its debt maturity profile inthe near future. The Stage 3 loans (under IFRS 9 provisions) accounted for 6.89% of the net loans andadvances to customers (loans, advances and accrued interest net of cumulative impairment) as at 31 December2018.
6 Although this figure is expressed in dollars for consistency of presentation, all the Bank’s lending to North Sudan is denominated inEuros and operated via a segregated Euro-denominated account held with a third party financial institution.
94

The following table shows the gross and net loans and advances of the Bank as at 31 December 2018, togetherwith residual maturity.
As at 31December
2018(U.S.$ million)
Up to one month . . . . . . . . . . . . . . . . . . . . . . . . . . . . . . . . . . . . . . . . . . . . . . . . . 3,101,425One month to three months . . . . . . . . . . . . . . . . . . . . . . . . . . . . . . . . . . . . . . . . . . 755,627Three months to 12 months . . . . . . . . . . . . . . . . . . . . . . . . . . . . . . . . . . . . . . . . . . 3,602,366One year to two years . . . . . . . . . . . . . . . . . . . . . . . . . . . . . . . . . . . . . . . . . . . . . . 2,096,289Two years to five years . . . . . . . . . . . . . . . . . . . . . . . . . . . . . . . . . . . . . . . . . . . . . 1,482,345Over five years . . . . . . . . . . . . . . . . . . . . . . . . . . . . . . . . . . . . . . . . . . . . . . . . . . 366,789Gross loans and advances (principal amount) . . . . . . . . . . . . . . . . . . . . . . . . . . . . . 11,404,841Allowance for impairment of loans and advances . . . . . . . . . . . . . . . . . . . . . . . . . . . . 270,417Net loans and advances to customers . . . . . . . . . . . . . . . . . . . . . . . . . . . . . . . . . . . 11,134,424
Stage 3—net loans and advances to customers at amortised cost . . . . . . . . . . . . . . . . 767,393
95

RISK MANAGEMENT
Introduction
Although Afreximbank is not regulated by any monetary and/or financial authority and thus constitutes a self-regulated entity (due to the privileges and immunities afforded to it by the Establishment Agreement andHeadquarters Agreement), the Bank strives to comply with all international risk management standards and tooperate in accordance with the best practices in its industry, as stated in the Bank’s Risk Management Policiesand Procedures (the “RMPP”).
Risk management is ultimately the responsibility of the President of the Bank. The Executive Committee andthe Assets and Liabilities Committee of the Board have oversight of the Bank’s risk management processes as adelegated authority from the Board.
To conduct its operations in a manner consistent with its Charter and the aims, objectives and expectations ofits stakeholders, the Board approved the RMPP in September 2008, and which was last updated inDecember 2011. This document incorporates various risk management policies that were operating as stand-alone policies into an integrated document. As at the date of this Registration Document, the Bank has engagedan external consultant to assist the Bank with a comprehensive review and enhancement of the existing RMPP.The Bank expects that the revised RMPP will be approved and implemented in 2019.
During 2018, the Bank maintained its momentum of successfully implementing key initiatives aimed atstrengthening and enhancing the Bank’s risk management framework. Key initiatives in this regardincluded: (i) the comprehensive review and enhancement of the RMPPs, (ii) ensuring compliance with theBank’s approved Risk Appetite Statement, (iii) implementing operational risk management tools, including RiskControl Self Assessments and Key Risk Indicators, (iv) continuing the automation of risk managementprocesses, (v) effectively managing and recovering non-performing facilities and (vi) strengthening the RiskManagement capacity through recruitment of additional staff.
In addition to the RMPP, the key operating documents in respect of risk control at the Bank are Credit Policiesand Procedures (“CPP”), Treasury Policies and Procedures (“TPP”), Information and CommunicationsTechnology Policy and Guidelines (the “ICT Policy and Guidelines”), Environmental and Social ManagementPolicies, Business Continuity Contingency Plan, Customer Due Diligence Policies and Procedures, StaffManual and Accounting Policies.
The RMPP are based on the premise that the Bank can perform its trade and economic developmental rolesusing commercial approaches while operating within its chosen risk tolerance levels.
Credit Policies and Procedures
The Bank exists in order to finance and promote intra- and extra-African trade, and the Bank looks to thewhole continent of Africa for potential avenues to further this central policy objective. The Bank’s StrategicPlan includes the goal of diversifying the Bank’s customer base. However, the Bank operates as a commercialentity and sets minimum thresholds for return on equity and credit quality, the satisfaction of which allows theBank to pursue its other developmental policy objectives.
Afreximbank’s CPP are centred around key parameters, summarised as follows.
Financing Ratios/Tenors
• Trade Finance (pre- and post-export with a maximum maturity of 360 days): up to 75% of the valueof the underlying export contract for pre-export and the Bank provides financing for up to 80% for post-export;
• Project-related finance (maximum maturity of 12 years): the Bank provides financing, on a fullrecourse basis supported by a sovereign and/or acceptable bank guarantee, for up to 100% of the invoicevalue of the equipment or raw material being imported and with a maximum maturity of seven years. Inthe case of limited recourse project financing, the Bank may only finance up to 70% of the projectfinancing cost;
• Letters of Credit: validity must not exceed 360 days, while up to 100% of the invoice value of anyLetters of Credit may be confirmed without explicit security cover as long as the opening bank is seen ascreditworthy;
96

• Export Credit Guarantee and other Guarantees: these can be for up to 90% of the payment obligationintended for guarantee. Tenor related to tenor of financing;
• Forfaiting (maximum maturity of 12 years): the Bank provides financing of up to 100% of the value ofreceivables;
• Factoring (maximum maturity of 360 days): the Bank provides financing of up to 90% of the value ofreceivables;
• Asset-based lending: no more than 65% and 75% of the market and forced sale value of the assetrespectively; and
• Term Financing: up to 7 years for capital-related expenditure (e.g. equipment, spare parts etc.) as well asfor export supply chain activities.
Lending Limits and Exposures
Each year, the Board approves an annual Country Limit of Reference (the “CLR”). The CLR is derived fromthe Bank’s approved budget for the year and the Bank’s guidelines for setting CLRs are included in the RMPP.A maximum of 85% of the CLR is allocated as individual country limits. Such limits are approved based on ascoring system taking into account a country’s economic variables and other qualitative factors. Unlessspecifically approved by the Board, individual country limits should not exceed the Bank’s unimpairedshareholders’ funds.
The remaining 15% of the CLR may be used by the Board to enhance established country limits in order totake account of the economic size and the trade flow of each member country.
The Executive Committee may from time to time approve additional mitigants and their weightings. The Boardmay, after taking due recognition of the utilisation ratio of approvals, authorise management to approvetransactions for each country in excess of the limits for that country, but not more than 2.5 times the limit forthat country.
As at 31 December 2018, the top ten CLRs are set forth in the table below.
Country CLR (U.S.$ million)(1)
Nigeria . . . . . . . . . . . . . . . . . . . . . . . . . . . . . . . . . . . . . . . . . . . . . . . . . . . 2,310South Africa . . . . . . . . . . . . . . . . . . . . . . . . . . . . . . . . . . . . . . . . . . . . . . . . 1,078Egypt . . . . . . . . . . . . . . . . . . . . . . . . . . . . . . . . . . . . . . . . . . . . . . . . . . . . 2,310Morocco . . . . . . . . . . . . . . . . . . . . . . . . . . . . . . . . . . . . . . . . . . . . . . . . . . 740Cote D’Ivoire . . . . . . . . . . . . . . . . . . . . . . . . . . . . . . . . . . . . . . . . . . . . . . . 550Angola . . . . . . . . . . . . . . . . . . . . . . . . . . . . . . . . . . . . . . . . . . . . . . . . . . . 502Tunisia . . . . . . . . . . . . . . . . . . . . . . . . . . . . . . . . . . . . . . . . . . . . . . . . . . . 426Zimbabwe . . . . . . . . . . . . . . . . . . . . . . . . . . . . . . . . . . . . . . . . . . . . . . . . . 400Ghana . . . . . . . . . . . . . . . . . . . . . . . . . . . . . . . . . . . . . . . . . . . . . . . . . . . . 420Kenya . . . . . . . . . . . . . . . . . . . . . . . . . . . . . . . . . . . . . . . . . . . . . . . . . . . . 350Total . . . . . . . . . . . . . . . . . . . . . . . . . . . . . . . . . . . . . . . . . . . . . . . . . . . . . 9,086
Note(1) This figure represents the net position permitted after relevant collateral and security is taken into account, rather than the gross
exposure.
In addition to the country limit, individual transactions may not exceed 15% of the unimpaired capital of theBank, provided that the Bank’s exposure to any one obligor does not exceed 20% of unimpaired capital of theBank. Furthermore, gross commitments are not permitted to exceed 8.3 times the Bank’s paid-up capital. TheBank has a single obligor threshold limit for banking institutions and corporate groups equal to 50% of theBank’s unimpaired capital. The Bank’s exposure limits per country, per sector and per sector in any country are100%, 20%, 60% and 40% of the Bank’s unimpaired capital, respectively. The maximum level of the Bank’smaximum gross commitments is approved by the Board annually.
Lending Authority
The Executive Committee of the Board is responsible for a commitment authority in respect of financing and ofunderwriting guarantee and investment proposals. The Executive Committee is composed of three Directors,who are designated by the Board and are drawn one each from Directors elected, respectively, by Class A,
97

Class B and Class C shareholders, together with such other persons as may be designated from time to time bythe Board and as an additional ex-officio member, the President acting as Chairman. Also, at such time as theClass D shareholders represent a least 10% of the total issued shares of the Bank, an additional Directorrepresenting the Class D shares shall be appointed.
The following table sets forth the credit limit each person or committee may approve.
Credit approval discretion limit Quorum Approval by
Credit committee . . . . Up to U.S.$50m for facilities to newClients/Obligors and up to U.S.$75m forall other facilities within acceptable riskgrades of the Bank including Low,Satisfactory and Moderate risk.
Three voting members Majority
Executive committee . . 20% of unimpaired capital (60% forunderwriting)
Three membersincluding the Chairman
Majority
Board of Directors . . . Exceeding 20% of unimpaired capital(60% for underwriting)
Majority of totalnumber of Directorselected(1)
Majority
President . . . . . . . . . 2% of unimpaired capital(2) — —
(1) Including at least two Directors elected by shareholders from Class A, one from Class B (if such a Director is then in office), onefrom Class C (if such a Director is then in office) and one from Class D (if such a Director is then in office).
(2) This discretionary power has been granted to enhance the speed and efficiency of establishing certain loans of a relatively smallamount.
The Bank’s approval authority has recently been amended. The Board has delegated authority to the President,which the President exercises through the Credit Committee. The new Credit Committee authority is asfollows:
The Credit Committee will consider facilities up to a proposed maximum principal amount of U.S.$50 millionfor facilities to new clients or obligors and up to U.S.$75 million for all other facilities within acceptable riskgrades of the Bank including low, satisfactory and moderate risk. The cumulative value of facilities owed byany client or obligor for any 12 month period shall not exceed the relevant delegated authority.
To the extent possible, decisions of the Credit Committee will be taken by unanimous decision. In instanceswhere the votes cast by the Credit Committee have resulted in a tie, the Chairman would be obliged to cast thedividing vote. The President has the power to veto any transactions the Credit Committee may have approved,as appropriate.
Loan Reviews
All facilities and commitments are reviewed on a quarterly basis. The Bank’s Risk Management Department isresponsible for the scheduling and completion of loan reviews and the submission of reports to the Bank’sExecutive Committee. Loan reviews usually consist of an appraisal of the conduct and profitability of thefacility since the last review, analysis of the borrower’s financial statements, a check of all security and loandocumentation, an assessment of the value and enforceability of any security held by the Bank, and anevaluation of all relevant factors and recommendations regarding any action that may be proposed. Oncompletion of each loan review, the loan may be reclassified according to the Bank’s internal classificationsystem (see below “Loan grading system”).
In addition, the Bank’s Legal Department usually conducts an annual review of all facility documents andcertifies that all security documents are in place and in good order.
Currency of Lending
The Bank may lend in any currency as may from time to time be determined by the management of the Bankto be consistent with the objectives of the Bank provided that there is an appropriate hedge to protect the Bankfrom currency risk. The Treasury Policies and Procedures of the Bank sets out the approved hedging policies,instruments and methodology.
98

Default Interest Rate
The Bank has a policy of charging significant interest rates on facilities in default. The Bank’s default interestrate is approximately 2.0% above the existing rate of interest on the overdue amount.
Loan Grading System
The Bank assesses the probability of default by customers or counterparties using an internal grading systemtailored to the various categories of counterparties. The grading system combines data analysis with creditofficer judgment and is validated, where appropriate, by comparison with externally available information. TheBank’s grading systems reflect the range of default probabilities defined for each rating grade. This means that,in principle, exposures migrate between grades as the assessment of their probability of default changes. Therating grading system is kept under review and upgraded as necessary, and the Bank regularly validates theperformance of the rating and their predictive power with regard to default events. In 2016, the Bank upgradedits loan grading system so that customers of the Bank are segmented into 14 different rating classes (the “NewGrading System”), whereas previously the Bank operated a system with just seven rating classes. Theintroduction of the New Grading System was approved by the Board together with a roadmap forimplementation involving defining the new risk rating model and working with external consultants to automatethe grading process. The New Grading System was implemented in March 2017, and four of the five ratingmodels have been commissioned for Corporates, Financial Institutions, Project Finance and Structured TradeFinance. The Bank is in the process of developing the Sovereign rating model.
For management control purposes, the Bank requires that all facilities have to be allocated to one of thecategories of the grading system, both at the time of initial review and each subsequent review. New facilitieswill not be approved unless they fall within the first six grades as set forth in the table below, save inexceptional circumstances where facilities graded seven and eight may also be approved.
The following table sets forth the 14 steps included in the Bank’s New Grading System:
Bank’sgrade
Descriptionof rating Interpretation
1 Very LowRisk
Credit is of excellent quality and the facility has minimum credit risk. This rating isassigned only when the borrower’s capacity and willingness to meet financialobligations in time is extremely strong. Repayment capacity is unlikely to beadversely affected by foreseeable events. Also included are facilities fully collateralisedby cash in the same currency; or unconditional guarantee by an “A” or better-ratedfinancial institution; or structured transactions where receivables or contracts fromcreditworthy buyers/counterparties rated “A” or better.
2 Low Risk(UpperQuartile)
Credit is of very good quality. Credit risk slightly higher than that of Grade 1borrowers. The borrower’s capacity to meet repayments is very strong and is notsignificantly vulnerable to foreseeable events. Also included are facilities fullycollateralised by cash in the same currency; or unconditional guarantee by aFinancial Institution rated “BBB” or better; or structured transactions wherereceivables or contracts from creditworthy buyers/counterparties rated “BBB” orbetter are legally assigned to the Bank.
3 Low Risk(LowerQuartile)
Credit is of good quality. Credit risk slightly higher than that of Grade 2 borrowers. Theborrower’s capacity to meet repayments is strong and is not significantly vulnerable toforeseeable events. Also included are facilities fully collateralised by unconditionalguarantee(s) issued by Financial Institutions rated “BBB-” or better; or structuredtransactions where receivables or contracts from creditworthy buyers/counterpartiesrated “BBB-” or better are legally assigned to the Bank.
4 SatisfactoryRisk(UpperQuartile)
Credit is of good quality. The borrower’s capacity to meet repayments is strong andmay include a structure where receivables or contracts from creditworthy buyers/counterparties rated “BBB-” or better are legally assigned to the Bank. However, thereare elements present, however minor, which may suggest susceptibility to impairmentsometime in the future. This category is more susceptible to adverse effects of changesin circumstances and economic conditions than obligations in higher rated categories.Full security cover for which complete documentation for enforcement is in place.
99

Bank’sgrade
Descriptionof rating Interpretation
5 SatisfactoryRisk
Credit is of fair quality. Although there are elements which may suggest susceptibilityto impairment sometime in the future, the borrower’s capacity to meet repayments isconsidered to be fairly strong and may include a structure where receivables orcontracts from creditworthy buyers/counterparties rated “BBB-” or better are legallyassigned to the Bank. Facilities in this category are more susceptible to adverse effectsof changes in circumstances and economic conditions than obligations in higher ratedcategories. Full security cover for which complete documentation for enforcement is inplace.
6 SatisfactoryRisk(LowerQuartile)
Credit is of fair quality but the credit risk slightly higher than that of Grade 5borrowers. There are elements which may suggest susceptibility to impairmentsometime in the future. However, the borrower’s capacity to meet repayments isconsidered to be satisfactory and may include a structure where receivables or contractsfrom creditworthy buyers/counterparties rated “BB-” or better are legally assigned tothe Bank. Facilities in this category are more susceptible to adverse effects of changesin circumstances and economic conditions than obligations in higher rated categories.Full security cover for which complete documentation for enforcement is in place.
7 ModerateRisk(UpperQuartile)
Credit is associated with medium quality borrowers with acceptable security andcertainty of timely repayments. A structure where receivables or contracts fromcreditworthy buyers/counterparties rated “BBB-” or better are legally assigned to theBank may be in place. Although capability and willingness of the borrower areadequate, certain protective elements may be lacking or may be characteristicallyunreliable over any greater length of time. Adverse economic conditions or changingcircumstances are more likely to lead to a weakened capacity of the borrower to meetloan repayments.
8 ModerateRisk(LowerQuartile)
Credit risk slightly higher than that of Grade 7 borrowers. The credit is associated withmedium quality obligors, acceptable security and certainty of timely loan repayments.Although capability and willingness of the borrower are adequate, certain protectiveelements such as a robust transaction structure may be lacking or may becharacteristically unreliable over any greater length of time. Adverse economicconditions or changing circumstances are more likely to lead to a weakened capacity ofthe borrower to meet loan repayments but this capacity to repay as measured by keyloan repayment indicators remains acceptable.
9 Watch List(UpperQuartile)
Facilities in this category are not adversely classified but are associated with vulnerablecredit quality, hence they deserve management’s close attention and require closemonitoring. Although the borrower currently has the capacity and willingness to meetloan repayments, repayments over any longer period of time may be uncertain. Capacityfor continued payment is contingent upon a sustained and secure transaction structure,favourable business, financial and economic conditions but remains satisfactory.
10 Watch List(LowerQuartile)
Credit is associated with poor borrower standing and elements of uncertainty withrespect to full repayment. Facility is presently vulnerable to non-payment, andborrower’s capability to repay is dependent upon maintenance and sustainability ofsecure transaction structures, favourable business, financial, and economic conditions.High risk factors are present and negative variations of business, financial andeconomic conditions of any scope mean real risk of default. No provisions arenecessary at this stage and interest is to be recognised in accordance with accountingstandards adopted by the Bank.
11 Sub-standard(LowerQuartile)
Credit is associated with poor borrower standing and elements of uncertainty withrespect to full repayment. Repayments are still continuing but the facility is currentlyvulnerable to non-payment, and borrower’s capability to repay is dependent uponfavourable business, financial, and economic conditions. Very high risk factors arepresent and negative variations of the transaction structure, business, financial andeconomic conditions of any scope mean real risk of default. No provisions arenecessary at this stage and interest is to be recognised in line with accounting standardsadopted by the Bank.
100

Bank’sgrade
Descriptionof rating Interpretation
12 Doubtfuland Bad(UpperQuartile)
Facilities in this category have been classified as impaired. Although in default,borrower is still making repayments, albeit inconsistently. Inherent weaknesses makefull collection or realisation of security highly questionable and improbable based onthe basis of existing facts, conditions and values. Because of the high probability ofloss, non-accrual accounting treatment and provisioning is required for doubtful and badfacilities.
13 Doubtfuland Bad(LowerQuartile)
Facilities in this category have been classified as impaired. Default is imminent orinevitable or borrower is in standstill—full repayment is considered unlikely. Borroweris in, or is likely to enter into some form of statutory administration/curatorship/liquidation and/or the Bank may find it necessary to enforce security to obtainrepayment of debt. Because of the high probability of loss, non-accrual accountingtreatment and full or partial provision of principal, interest or both may requireprovisioning.
14 Default/Loss
Facilities in this category are considered uncollectible or of such little value that theircontinuance as bankable assets is not warranted. Although there may be salvage value,it may not be practical or desirable to defer writing off the loan even though partialrecovery may be effected in the future. Borrower may have entered into bankruptcyfilings, administration, curatorship, receivership, liquidation or other form of winding-up procedure.
Asset Quality and Impairment
The Bank believes that its asset quality is linked to the composition of its client base, the importance thatAfrican governments and borrowers attach to maintaining continued access to trade financing, the Bank’spreferred creditor status, and the Bank’s strict adherence to commercial criteria in its credit activities. The Bankhas developed knowledge of, and relationships with, its client base throughout its 25 years of operations, whichallows it to continue to further enhance its risk management processes.
Impaired Assets and Contingencies
The Bank’s policy requires the review of individual financial assets, facilities and commitments at leastquarterly or more regularly when individual circumstances require. Impairment allowances on individuallyassessed accounts are determined by an evaluation of the impairment at reporting date on a case-by-case basis,and are applied to all individually significant accounts. The assessment normally encompasses collateral held(including re-confirmation of its enforceability) and the anticipated receipts for that individual account.
The Bank’s impaired assets consist principally of impaired loans. Loans and advances that are less than 90 dayspast due are not considered impaired, unless other information is available to indicate the contrary. Loans andadvances are identified as impaired where:
(i) any principal or interest payment is over 90 days past due;
(ii) there is evidence of a breach of covenant;
(iii) any bankruptcy proceeding is initiated against the borrower;
(iv) there is a significant deterioration in the value of collateral; or
(v) the Bank’s management determines that there is reasonable doubt regarding the ultimate collectability ofprincipal or interest.
In a challenging macroeconomic environment as at 31 December 2016, Afreximbank’s impaired loans were2.38% of total loans outstanding. This was below the Bank’s target for 2016 that impaired loans should notexceed 2.5% of total loans outstanding. Despite the growing loan book and efforts being made by the Bank todeal with impaired loans, the impaired loans stood at 2.5% as at 31 December 2017 and 2.95% as at31 December 2018. The Bank operates a robust procedure for identifying impaired loans (see “Asset qualityand impairment—Allowance for loan losses”) and has in place mechanisms for provisioning (see “Asset qualityand impairment—Provisioning”) and collection (see “Asset quality and impairment—Collections Policy”below), which the Bank’s management considers adequate to ensure the Bank’s impairment losses remain low.
101

The following table sets forth information regarding the Bank’s impaired loans as at 31 December 2018,31 December 2017 and 31 December 2016.
31 December2018
31 December2017
31 December2016
(U.S.$’000, except percentages)Impaired loans . . . . . . . . . . . . . . . . . . . . . . . . . . . . . . . . . . 336,946 212,902 245,210Allocation from the allowance for loan losses(1) . . . . . . . . . . . . 162,520 152,244 144,373Impaired loans as a percentage of total loans(2) . . . . . . . . . . . . . 2.95% 2.5% 2.38%Impaired loans as a percentage of total assets . . . . . . . . . . . . . . 2.51% 1.79% 2.1%
Note:(1) This represents the individually impaired loans. The collective impairment provision was U.S.$107,898 million for the year ended
31 December 2018, U.S.$28.4 million for the year ended 31 December 2017 and U.S.$23.0 million for the year ended31 December 2016.
(2) As at 31 December 2017, the Bank’s total loans included U.S.$1.5 billion of loans made under the Bank’s COTRALFprogramme.
The following table shows the Bank’s loan impairment provision by reference to the total amount of impairedloans as at each of 31 December 2018, 31 December 2017 and 31 December 2016.
31 December 2018 31 December 2017 31 December 2016Loansand
advancesImpairmentprovision
Loansand
advancesImpairmentprovision
Loansand
advancesImpairmentprovision
(%) (U.S.$’000) (%) (%) (U.S.$’000) (%) (%) (U.S.$’000) (%)Low risk . . . . . . . 11.1 9 0.0 1.9 4,154 2.3 44.5 10,213 6.1Satisfactory risk . . . 21.9 13.066 0.0 60.1 7,766 4.0 28.2 6,529 3.9Fair risk . . . . . . . . 33.9 17,785 7.4 18.1 7,766 4.0 8.6 2,009 1.2Watch list . . . . . . . 8.9 16,990 0.0 13.4 3,431 1.9 9.1 2,176 1.3Sub-standard risk . . 17.2 102,822 42.8 4.7 3,431 1.9 7.2 2,118 1.3Doubtful . . . . . . . . 6.8 119,746 49.8 1.8 152,244 84.3 2.4 144,373 86.2Total . . . . . . . . . . 100 270,417 100 100 180,599 100 100 167,418 100
Allowance for Loan Losses
The Bank assesses at each reporting date whether there is objective evidence that a loan is impaired. A loan isimpaired and impairment losses are incurred only if there is objective evidence of impairment as a result of oneor more events that occurred after the initial recognition of the loan (a loss event) and that loss event (or lossevents) has an impact on the estimated future cash flows of the loan that can be reliably estimated.
The estimated period between a loss occurring and its identification is determined by the Bank’s managementfor each loan. In general, the periods used vary between three months and 12 months. In exceptional cases,longer periods are warranted.
The amount of the loss is measured as the difference between the loan and advance carrying amount and thepresent value of estimated future cash flows discounted at the loan and advance effective interest ratedetermined under contract. The carrying amounts of loans and advances are reduced through the use of anallowance account and the amount of the loss is recognised in the income statement.
The methodology and assumptions used for estimating future cash flows are reviewed regularly by the Bank toreduce any differences between loss estimates and actual loss experience.
If, in a subsequent period, the amount of the impairment loss decreases and the decrease can be relatedobjectively to an event occurring after the impairment was recognised, the previously recognised impairmentloss is reversed by adjusting the allowance account. The amount of the reversal is recognised in the incomestatement.
102

The following table sets forth information regarding the components of the Bank’s allowance for loan losses asat 31 December 2018, 31 December 2017 and 31 December 2016.
31 December2018
31 December2017
31 December2016
(U.S.$’000)Components of the allowance for loan lossesAllowance for loan losses: . . . . . . . . . . . . . . . . . . . . . . . . . .Balance at beginning of year(1) . . . . . . . . . . . . . . . . . . . . . . . 304,620 167,418 106,502Impairment charge for the year . . . . . . . . . . . . . . . . . . . . . . . 104,962 63,397 82,747Revaluation effect of provisions of loans in euros . . . . . . . . . . . — 1,757 (1,635)Loans written off during the year as uncollectable . . . . . . . . . . . (139,164) (51,972) (20,196)Repayment of impaired loans during the year . . . . . . . . . . . . . . — — —Balance at the end of the year . . . . . . . . . . . . . . . . . . . . . . 270,418 180,600 167,418
(1) Given the adoption of IFRS 9, the components of the allowance for loan losses were remeasured, adding U.S.$124.02 million tothe balance at the end of 31 December 2017.
The following table sets forth information regarding the regional distribution of the Bank’s allowance for loanlosses allocated by country of exposure as at 31 December 2018, 31 December 2017 and 31 December 2016.
Allowances for loan losses per region as at31 December 2018 31 December 2017 31 December 2016(U.S.$‘000) (%) (U.S.$‘000) (%) (U.S.$‘000) (%)
RegionCentral Africa . . . . . . . . . . . . . . . . . . . . . . . . 22,499 8.3 2,643 1.46 — —East Africa . . . . . . . . . . . . . . . . . . . . . . . . . 5,693 2.1 15,298 8.47 22,683 14North Africa . . . . . . . . . . . . . . . . . . . . . . . . 11,027 4.1 6,581 3.64 — —Regional . . . . . . . . . . . . . . . . . . . . . . . . . . . 114 0.1 220 0.12 — —Southern Africa . . . . . . . . . . . . . . . . . . . . . . 8,017 2.9 3,373 1.87 — —West Africa . . . . . . . . . . . . . . . . . . . . . . . . . 223,068 82.5 152,485 84.44 144,735 86Total . . . . . . . . . . . . . . . . . . . . . . . . . . . . . 270,418 100 180,600 100 167,418 100
The following table sets forth information regarding the regional distribution of the Bank’s loans charged-offagainst the allowance for loan losses, as at 31 December 2018, 31 December 2017 and 31 December 2016.
Per region distribution of loans charged-offagainst allowances for loan losses as at
31 December 2018 31 December 2017 31 December 2016(U.S.$’000) (%) (U.S.$’000) (%) (U.S.$’000) (%)
RegionCentral Africa . . . . . . . . . . . . . . . . . . . . . . . . . 19,856 22 13,892 0.1 (39) (0.0)East Africa . . . . . . . . . . . . . . . . . . . . . . . . . . (9,605) (11) (3,656) 7.7 20,408 24.7North Africa . . . . . . . . . . . . . . . . . . . . . . . . . 4,446 5 3,138 3.5 (1,262) (1.5)Regional . . . . . . . . . . . . . . . . . . . . . . . . . . . . (106) (0.1) (75) 0.1 (33) 0.0Southern Africa . . . . . . . . . . . . . . . . . . . . . . . . 4,644 5 3,278 0.6 (218) (0.3)West Africa . . . . . . . . . . . . . . . . . . . . . . . . . . 70,583 79 46,820 88 63,891 77.2Total . . . . . . . . . . . . . . . . . . . . . . . . . . . . . . 89,818 100 63,397 100 82,747 100
103

The following table sets forth information regarding the sectoral distribution of the Bank’s allowance for loanlosses by industry sector as at 31 December 2018, 31 December 2017 and 31 December 2016.
31 December 2018 31 December 2017 31 December 2016(U.S.$’000) (%) (U.S.$’000) (%) (U.S.$’000) (%)
Industry sectorAgriculture . . . . . . . . . . . . . . . . . . . . . . . . . . 11,677 4.3 1,133 0.6 10,553 6.3Agro-processing . . . . . . . . . . . . . . . . . . . . . . . 2,265 0.8 — — — —Energy . . . . . . . . . . . . . . . . . . . . . . . . . . . . . — — 12,342 6.8 40,239 24Power . . . . . . . . . . . . . . . . . . . . . . . . . . . . . 18,393 6.8 — — — —Oil & Gas . . . . . . . . . . . . . . . . . . . . . . . . . . 106,161 39.3 — — — —Hospitality . . . . . . . . . . . . . . . . . . . . . . . . . . 2,125 0.8 792 0.4 — —Metals and minerals . . . . . . . . . . . . . . . . . . . . 1,226 0.5 483 0.3 20,345 12Transportation . . . . . . . . . . . . . . . . . . . . . . . . 47,315 17.5 43,090 23.9 11,739 7Manufacturing . . . . . . . . . . . . . . . . . . . . . . . . 22,675 8.4 10,127 5.6 22,734 13.5Telecommunication . . . . . . . . . . . . . . . . . . . . . 23,186 8.6 93,211 51.6 49,546 30Government . . . . . . . . . . . . . . . . . . . . . . . . . 3,389 1.3 — — — —Financial institutions . . . . . . . . . . . . . . . . . . . . 32,006 11.8 19,422 10.8 12,262 7.2Total . . . . . . . . . . . . . . . . . . . . . . . . . . . . . . 270,418 100 180,600 100 167,418 100
Collections Policy
The Bank’s collection policies include rapid internal notification of any delinquency and prompt initiation ofremedial and/or recovery efforts, usually involving senior management. Once a default is established in relationto any loan, the loan is categorised either under a Watch List (if less than 90 days past due) or a Past DueObligations (“PDO”) List (if 90 days or more past due). For loans on the PDO List, the PDO Committee isnotified accordingly. The PDO Committee is comprised of the heads of the credit, risk, finance, legal andoperations departments. The PDO Committee meets at least once a month to discuss remediation progress andto determine suitable strategies and action plans that minimise potential credit losses in respect of the Bank’sloans that are on the PDO List. PDO List facilities are transferred to the Risk Management Department, wherethey are managed under a dedicated remedial process.
With the involvement of the PDO Committee, the Risk Management Department coordinates remediation andrecovery efforts in accordance with the Bank’s internal policies. The PDO Committee meets at least once amonth to discuss remediation progress and to determine suitable strategies and action plans that minimisepotential credit losses and maximise recovery. As the date of this Registration Document, the PDO Committeeis in the process of being reconstituted into the Loan Remediation Committee with a broader scope. As at31 December 2018, the Bank’s impaired past due obligations portfolio comprised twelve facilities with a totalvalue of U.S.$337.0 million.
Each quarter, a report on the status of all Watch List and PDO facilities, and actions being taken in respect ofthese, is submitted to the Executive Committee. It is the primary goal of Risk Management Department and thePDO Committee to ensure that all problem facilities are resolved in such a manner that yields the greatestbenefit to the Bank in terms of preservation of capital and pursuit of its trade development goal.
In circumstances where restructuring/rescheduling provides the best means of protecting the interests andrecovery prospects of the Bank, such an approach may be pursued. Restructuring is not deemed to beappropriate merely for avoiding a default. If the financial condition of the Borrower deteriorates beyond thepoint of sustainability, the Bank may resort to other exit options, such as instituting bankruptcy proceedings.
Provisioning
The Bank reviews its loan portfolio regularly to assess whether a provision for impairment should be recordedin the statement of comprehensive income. In particular, considerable judgment by management is required inthe estimation of the amount and timing of future cash flows when determining the level of provisions required.Such estimates are necessarily subjective based on assumptions about several factors involving varying degreesof judgment and uncertainty. Consequently, actual results may differ resulting in future changes to suchprovisions.
The overall size of the Bank’s loan loss provisions are determined by using the International AccountingStandard 39 guidelines as set out below.
104

• Collective Impairment Provision
In addition to specific provisions against individually significant loans and advances, the Bank also makesa collective impairment provision against loans and advances which, although not specifically identified asrequiring specific provisions, have a greater risk of default than when originally granted. This collectiveimpairment is based on any deterioration in the internal grade of the loan since it was granted. The amountof the provision is based on historical loss experience for loans within each grade and is adjusted to reflectcurrent economic changes. These internal gradings take into consideration various factors such as anydeterioration in country risk, industry, identified structural weaknesses or deterioration in cash flows. Thepercentage applied for the collective impairment provisions is 0.5% for which specific provisions have notbeen made.
• Specific Provisions
Specific provisions are made for loans that have been identified as bad or doubtful in order to write themdown to their fair value at the balance sheet date. The basis for the defining and identifying of non-performing loans is the Bank’s New Grading System (see ”—Credit Policies and Procedures—LoanGrading System”). Assets graded 12-14 on the Bank’s New Grading System will be assessed forimpairment so that a provision amount may be recorded. A general guide for classifying a loan orinvestment as non-performing is that principal and/or interest is over 90 days past due, there is evidence ofbreach of a covenant, the initiation of bankruptcy proceedings against the borrower, there is a deteriorationof the value of collateral, or otherwise if the Bank’s management determines that the ultimate collection ofprincipal or interest is doubtful. The assessment of the provision amount is measured as the differencebetween the loan carrying amount and the present value of estimated future cash flows discounted at theloan’s original effective interest rate. The assessment includes collateral held and anticipated receipts forthat individual account.
• Write-offs
If there is no realistic prospect of recovery, a loan or a portion of the loan will be written off against therelated provision for loan impairment. Such loans (or proportions of loans) are written off after all thenecessary procedures have been completed, including obtaining Board of Directors approval, and theamount of loss has been determined. Loans graded 14 on the Bank’s New Grading System are potentialwrite-offs. After the amount of loss has been determined, the write-offs have to be approved by the Board,on the recommendation of the Executive Committee.
The Bank’s management considers that this procedure for determining provisioning allows the Bank to ensurethat it allocates appropriate levels of provisioning.
Treasury Policy
Afreximbank’s Treasury Policy is designed to ensure adequate short and long term funding, to invest surplusfunds in an efficient manner and to enable the Bank’s Treasury Department to identify, monitor and manage theBank’s financial risks, principally interest rate and foreign exchange risks.
Committees
The Executive Committee reviews the Treasury guidelines at least once annually and delegates to the Presidentthe responsibility for the selection, implementation, and monitoring of the various strategies required to meetthe guidelines.
The Bank’s Assets and Liabilities Committee advises senior management on issues connected with the day-to-day treasury operations of the Bank. It is composed of at least four members including the President and theVice President, the head of the Finance Department and other staff deemed appropriate by the President. TheAssets and Liabilities Committee meets on a fortnightly basis or otherwise as often as necessary to review andmonitor the Treasury guidelines and their implementation.
Liquidity and Investment Policy
The objective of the Bank’s Liquidity and Investment Policy is to meet the Bank’s liabilities as they fall due.Liquid funds are defined as loan commitments with a disbursement schedule of less than one week, loancommitments approved but with a still unclear disbursement schedule, capital expenditures in the next twomonths according to the Bank’s budget, repayment of debt or charges falling due and a prudent margin to cover
105

underestimates of the above, which is currently set at U.S.$10 million. All liquid funds are held as interestearning bank deposits in approved depository banks.
The difference between available cash resources minus required liquid funds is available for investments towhich the following investment criteria apply:
Asset quality. Short term investments with a maturity of one year or less must be rated at least A1 by S&P orP-1 by Moody’s. The requirement for long term investments is a rating of at least AA by S&P or Aa3 byMoody’s. The Assets and Liabilities Committee may accept investments that were rated in-house using theBank’s loan grading system if external ratings are not available. All debt will be from issuers domiciled incountries with a sovereign rating of BBB or G7 countries with a higher credit rating.
Maturity. The maximum average maturity of the investment portfolio may not exceed three years. The effectivematurity of any single instrument shall not exceed seven years. Fixed deposits are limited to a maximummaturity of one year.
Concentration and Exposure Limits. Not more than 25% of the portfolio will be invested in any G7 sovereignissue. For all other issues a limit of not more than 15% of the portfolio value will be invested in any onesecurity. Not more than 5% will be invested in liabilities of a single issuer. The maximum term deposit placedwith any one bank will not exceed 15% of the unimpaired capital of the Bank.
The Bank may engage in securities lending and repo agreements, securities borrowing and reverse repos, bothagainst adequate collateral, only if the maturity of each transaction does not exceed 90 days and the cash andsecurities exchanged will be in U.S. dollars.
Funding Policy
The objective of the Bank’s Funding Policy is to provide funds to meet operational needs. The fundingrequirements are derived from the cash flow forecasts and the business plan with a margin for slippage both incash flow and timing.
The Funding Policy also seeks to accommodate the expected asset growth such that the Bank has assets ofapproximately U.S.$20 billion at the end of 2021. The Bank aims to increase and diversify its funding base byusing bilateral credit lines and money market lines, Euroloan syndications and club deals, bond issuances,floating rate notes, commercial paper and term deposits.
In order to access these funds Afreximbank targets specific markets. Markets that were identified under theFunding Policy are the Eurocredit Market, the Export Credit Agencies, banks and investors in the USA andworldwide, multilateral and national financial institutions, and development finance institutions. The Bankintends to use future bond issuances to target specific markets.
Currency Exposure Management
The Bank’s working currency is the U.S. dollar. In cases where a loan disbursement is not U.S. dollardenominated, the Bank is required to purchase or borrow that currency. Afreximbank does not purchase foreigncurrency for proprietary trading purposes. Speculation on future exchange rate movements is prohibited underthe Risk Management Policies and Procedures.
In case of a non-U.S. dollar currency exposure, the Bank seeks to apply a 100% hedging policy, if possible, andthe Bank limits any mismatch to 2%. Afreximbank usually manages the foreign exchange risk from itsfinancing operations by entering into forward foreign exchange contracts with creditworthy counterparties. Asat 31 December 2018, the Bank had U.S.$257.3 million outstanding foreign exchange contracts compared to nooutstanding foreign exchange contracts as at 31 December 2017.
Interest Rate Risk Management
The Bank’s policy on interest rate risk is to minimise exposures by ensuring an appropriate balance of longerterm fixed and short term variable rates. The Bank’s specific policies are (i) for both its assets and liabilities tobe based on variable interest rates, (ii) for all variable rates to be based on LIBOR, and (iii) for re-pricingperiods to be limited to no more than three months. The Bank reviews its exposure on a regular basis. Both theBank’s loan portfolio and funding portfolio generally have interest rate resetting periods of three months.
106

Capital Risk Protection Facility
The Bank has developed the capital risk protection facility (“CARPROOF”) as part of its overall capital andrisk management strategy to ensure robustness of the Bank’s financial soundness. CARPROOF comprises aninsurance policy under which the Bank is compensated when the Bank’s non-performing loans exceed a pre-agreed threshold. CARPROOF aims to respond to exceptional, unexpected events in one or more of the Africanstates in which the Bank operates that could have significant negative effect on the business of the Bank.CARPROOF aims to protect the Bank against perceived high risks in the operating environment of the Bank,such as country risk event resulting in disruption of the business operations funded by the Bank, which couldlead to significant financial losses for the Bank. CARPROOF also aims to serve as a capital cushion(contingent capital) in the event of exceptional unexpected losses. CARPROOF intends to strengthen theBank’s capital and ensure the continued operation of the Bank by accelerating the capital inflows in suchcritical period. As a contingent capital buffer against exceptional losses it would be recognised as “Tier 1capital” at the time of drawdown, giving the Bank time to address other capital raising issues without affectingoperations during such periods.
Operational Risk
Operational risk, as described in the Bank’s Operational Risk Policy (part of the RMPP), is the risk of lossresulting from inadequate or failed internal processes, people and systems and/or from the external and internalenvironment, and also legal risk. The Bank has sought to develop a comprehensive framework for theidentification, measurement, management and monitoring of operational risk inherent in its business.
While operational risk cannot be entirely eliminated, it is managed and mitigated by trying to ensure that thereis appropriate infrastructure, controls, systems, procedures, and trained and competent personnel in place todischarge the various functions of the Bank. An internal and operational risk control culture, including, amongother things a clear allocation of responsibility, segregation of duties, effective internal reporting, businesscontinuity and contingency plans, document retention policy, staff code of conduct and staff rules, and customerdue diligence policies has been implemented as part of the Bank’s implementation of risk management systems(see ”—Enterprise Risk Management systems and RISTRAC”).
The following table shows the repayment risk in the loan portfolio by geography as at 31 December 2018:
Region/Type Percentage of loan portfolio
Central Africa . . . . . . . . . . . . . . . . . . . . . . . . . . . . . . . . . . . . . . . . . . . . 4%East Africa . . . . . . . . . . . . . . . . . . . . . . . . . . . . . . . . . . . . . . . . . . . . . . 6%North Africa . . . . . . . . . . . . . . . . . . . . . . . . . . . . . . . . . . . . . . . . . . . . . 13%Southern Africa . . . . . . . . . . . . . . . . . . . . . . . . . . . . . . . . . . . . . . . . . . . 8%West Africa . . . . . . . . . . . . . . . . . . . . . . . . . . . . . . . . . . . . . . . . . . . . . 27%Cash in OECD . . . . . . . . . . . . . . . . . . . . . . . . . . . . . . . . . . . . . . . . . . . 24%Offshore contracts OECD . . . . . . . . . . . . . . . . . . . . . . . . . . . . . . . . . . . . 10%Insured loans . . . . . . . . . . . . . . . . . . . . . . . . . . . . . . . . . . . . . . . . . . . . 10%
Enterprise Risk Management Systems and RISTRAC
The RMPP incorporates an enterprise risk management framework (“ERM”) in order to identify bothopportunities and risks and to ensure that these are dealt with appropriately. The four key objectives of theERM, as set out in the RMPP, are: (i) achieving the mandate and strategic goals of the Bank, (ii) attainingoperational efficiency, (iii) ensuring reliability and timeliness of reporting of financial and non-financialinformation and (iv) ensuring compliance with applicable laws, conventions, treaties and regulations. The ERMis comprised of eight components: (i) internal environment (that is, the Bank’s attitude to risk and how risksand controls are managed within the Bank), (ii) setting objectives (the Bank’s strategic plan), (iii) eventidentification (being anything that effects the implementation of the Bank’s strategy and achievement of itsobjectives), (iv) risk assessment (to be carried out in conjunction with the strategy planning and budget settingprocesses), (v) risk response (which should form part of the Bank’s strategic plan and budget), (vi) controlactivities (as determined by the Bank’s strategic planning, budgeting, staff manual and accounting policies),(vii) information and communication and (viii) monitoring.
The governance structure in terms of risk management is that the risk management department assists with thecreation, development and monitoring of the Bank’s risk policies and the risk awareness of the Bank’s staff,and also submits a quarterly consolidated risk report to the risk and strategy committee (“RISTRAC”) and halfyearly report to the Board, as well as periodically reporting on the Bank’s risk profile. RISTRAC (comprisingthe President, or in his absence the most senior Executive Vice-President, the Executive Vice Presidents, the
107

Head of Risk Management and the Head of Planning and Strategy) recommends the annual risk appetitestatement to the Board, oversees the Bank’s risk stress tests, monitors the day to day implementation of theRMPP and provides regular updates on best practices in risk management and suggested amendments to theRMPP. RISTRAC meets at least quarterly and submits half yearly reports to the Executive Committee and anannual report to the Board.
The Executive Committee is accountable to the Board for exercising oversight over the Bank’s riskmanagement, risk control and risk assurance as regards finance credit and investment decisions and reviews andrecommends amendments to the Bank’s ERM and RMPP. The Audit and Risk Committee runs a parallel riskfunction by reviewing the effectiveness of the Bank’s internal control policies and practices and ensuringcompliance with both internal policies and the requirements of the financial, accounting and audit standardsadopted by the Bank. The Board provides oversight and approval of the Bank’s risk policies and has overallaccountability for ERM.
Anti-Money Laundering, “Know-Your-Customer” Checks and Sanctions Compliance
Sanctions Compliance
The Bank’s policy is to comply with any sanctions to the extent they are applicable to its operations and/orspecific transactions, including those administered and enforced by the African Union (“AU”), United NationsSecurity Council (“UNSC”), the European Union (“EU”), Office of Foreign Assets Control of theU.S. Department of the Treasury (“OFAC”), Her Majesty’s Treasury (“HMT”) and other relevantinternationally recognised sanctions authorities (collectively, “Sanctions”), as the same are in force fromtime to time. The Bank notes that, as a supranational organisation, it generally complies with the letter andspirit of these restrictions, notwithstanding that the Bank is not under any obligation to comply with sanctionsimposed by specific jurisdictions.
As part of its approach to ensuring that its activities and business are carried out in compliance with Sanctionsand its general commitment to seek to observe international best practices, the Bank has put in place systems,processes and controls, which include, for example, cross-checking against the Specially Designated Nationalsand Blocked Persons List (“SDN list”) maintained by OFAC and other relevant global watchlists. All Bankrelationships are screened against the relevant global watchlists for sanctions risks. Please see also “RiskFactors—Risks relating to the Bank’s operations—The Bank has relationships with states that are subject tointernational sanctions”.
Compliance Unit (AML, KYC and Sanctions)
Afreximbank joined the global efforts directed at fighting money laundering and terrorist financing byestablishing its Compliance Unit. The Compliance Unit’s responsibilities include:
(i) identifying the Compliance risks that the Bank faces and advising on them (identification);
(ii) designing and implementing controls to protect the Bank from those risks (prevention);
(iii) monitoring and reporting on the effectiveness of those controls in the management of the Bank’s exposureto risks (monitoring and detection);
(iv) resolving compliance issues as they occur (resolution);
(v) advising the businesses on the Bank’s Charter, global compliance issues impacting the Bank and controlsthat the Bank has implemented (advisory);
(vi) designing the appropriate and applicable policies and procedures;
(vii) ensuring all relationships established by the Bank are compliant with the Bank’s Anti-Money Launderingand Counter-Terrorist Financing Policy and related procedures;
(viii)training and creating awareness among all staff, Senior Management and the Board of Directors; and
(ix) ensuring that a strong compliance culture is fostered within the organisation.
The systems, processes and controls enable the Bank’s standards to conform to Financial Action Task Force 40Recommendations on Anti-Money Laundering and Countering Terrorist Financing, the Wolfsberg GroupPrinciples established in 1989 (and subsequently amended a number of times, most recently in 2014) by leadinginternational financial institutions (the “Wolfsberg Principles”), and the Basel Customer Due DiligencePrinciples among other international initiatives. The Bank strives to ensure that its policies and procedures
108

conform to standard policies and procedures of international key regulators and industry leaders in AMLregime.
The Compliance Unit is headed by a Director who is supported by two Assistant Managers, an Associate andtwo Administrators. The activities of the Compliance Unit are tabled at the Management Committee onCompliance (“MANCOCO”), which is chaired by the Executive Vice President, Corporate Governance andLegal Services and the membership comprises the Director in charge of the Risk Department, the Director incharge of Legal Services, the Senior Manager in charge of Compliance, the Senior Manager in charge of BoardSecretariat and the Director in charge of Banking Operations. MANCOCO presents quarterly reports to theExecutive Committee of the Board of Directors (“EXCO”). The Compliance Unit is regularly subjected toreview by the Internal Audit function.
As a multilateral financial institution, as well as a good corporate citizen, Afreximbank has developed adocumented AML policy with the related procedures to adequately address potential money laundering andterrorist financing risks. The Compliance Unit is responsible for updating the Bank’s Anti-Money Laundering(“AML”) Policy which was last approved by the Board of Directors during the 92nd meeting of the EXCO inJune 2015.
Furthermore, the Bank has an AML and Know-Your-Customer Handbook (the “Handbook”) which isdistributed to all the members of staff for knowledge sharing and awareness raising. The Handbook isperiodically reviewed to ensure it adequately addresses current global trends and the latest edition of theHandbook was published in March 2016. The Bank has also published a Statement on AML and KYCApproach dated 22 December 2013 and most recently revised in 2018 (the “Statement”). The Statement, whichis available on the Bank’s website, is distributed to all partner financial institutions that have relationships withthe Bank. The Statement describes the Bank’s AML and counter-terrorist financing philosophy. It iscompulsory for all of the Bank’s employees to comply with the requirements of the AML policy and the relatedprocedures at any given time during execution of their duties, hence all employees receive AML training uponjoining the Bank and subsequent follow-up and refresher sessions are held for all staff and all training recordsare maintained by the Bank.
Customer Due Diligence (“CDD”)
Afreximbank’s AML policy makes it mandatory to fully identify, and verify information on, all potentialcustomers. These include partner financial institutions, credit customers, services providers, suppliers,employees, investors and any other third parties that the Bank discretionary engages. The process includes butnot limited to identifying and verifying the legal establishment status, address, shareholding, corporategovernance, sources of funds etc., as the case may be. The Bank will not establish any relationship untilsatisfactory meeting of CDD requirements. The Bank conducts due diligence on sub-borrowers where it deemsthis appropriate; however, it is a mandatory requirement of the Bank that its correspondent banking clientsconduct full CDD on their borrowers and provide the Bank with all required information about such borrower,prior to accessing funds. The Bank declines transactions that involve sub-borrowers for which there isinadequate or unavailable due diligence information.
The Bank’s CDD Procedures (which are also set out in the RMPP and derived from the Bank’s AML Policy)are based on the Financial Action Task Force 40 Recommendations, the Wolfsberg Principles and the BaselInitiatives, and are periodically reviewed taking into consideration any global developments that could impactthe Bank’s activities. Implementation of the CDD procedures is carried out through the administration ofquestionnaires, which the Bank uses to obtain first-hand detailed information about these customers and theirrespective approaches and perceptions on anti-money laundering and counter-terrorism issues.
The Bank’s CDD evaluation of correspondent financial institutions focuses primarily on their approach andpreparedness in addressing money laundering, terrorist financing, other organised cross-border crimes andsanctions risks. The Bank’s AML questionnaire for financial institutions must be completed and returned to theBank with the required supporting documents (including the entity’s constitutional documents, the approvedmandate/board resolution to engage in transactions with Afreximbank, profiles of the institution’s board of
109
directors and key management personnel, latest annual reports covering the activities of borrowers/clientsduring the last three years, information on shareholders and ultimate beneficiary owners, shares in equity in theinstitution, and the physical and operating addresses of the institution (in order to confirm that the prospectiveclient or borrower entity is not a “shell” organisation7 and involvement of other categories of customers e.g.Politically Exposed Persons8). The information gathered assists the Bank in the risk categorisation of clientsand conduct of credible CDD analysis. Where the Bank is in doubt as to the authenticity of the informationreceived, further investigations are conducted, including approaching relevant regulators or governmentagencies. Site visits may be conducted, particularly where there are doubts about or inconsistencies in theinformation obtained that indicate a requirement for enhanced due diligence.
The Bank also maintains an internal watchlists based on results of CDD analysis and information detectedduring customer screening and other trigger events e.g. alerts. All employees of the Bank are obliged to reportany known or suspicious activities and transactions. All customer records and relevant transactions’ audit trailsare retained in the Bank’s archive for at least five years after terminating the relationship.
In the year ended 31 December 2018, MANCOCO reviewed and endorsed 42 customer due diligenceassessments on credit transactions and submitted four quarterly reports to the EXCO.
As part of continuous monitoring, the Bank assesses all relationships on an ongoing basis. This involves bothperiodic and trigger based reviews and updating information to ensure that information on the Bank’scustomers is current, relevant and up-to-date at any given time.
The Bank’s third Annual Customer Due Diligence and Corporate Governance Forum was held at KigaliConvention Centre, Kigali, Rwanda, which was well attended. At the forum, participants were briefed on thestatus of the Bank’s progress towards the implementation of the African Customer Due Diligence RepositoryPlatform (“MANSA”), which is intended to provide subscribers with online access to CDD information onAfrican entities. The Bank’s objective is to reduce the compliance costs that banks face in dealing with Africaninstitutions. MANSA was implemented in 2018.
As at the date of this Registration Document, the Bank has not experienced any incidents of fraud either byclients or by the Bank’s employees.
7 Shell organisations are organisations that operate only by name, that do not conduct business and have no physical presence anywherein the world. The Bank’s policy prohibits establishing any relationships with “shell” companies and institutions.
8 PEPs include (i) current or former senior officials in the executive, legislative, administrative, military, or judicial branch of a foreignor local government (elected or not), (ii) senior officials of a major foreign or local political party; (iii) senior executives of a foreigngovernment-owned commercial enterprise, being a corporation, business or other entity formed by or for the benefit of any suchindividual; (iv) an immediate family member (meaning spouse, parents, siblings, children, and spouse’s parents or siblings) of anyindividual listed in (i) to (iii); or (v) any individual publicly known (or actually known by the relevant financial institution) to be aclose personal or professional associate of any individual listed in (i) to (iii).
110

MANAGEMENT OF THE BANK AND CORPORATE GOVERNANCE
Board of Directors
The Bank’s Board consists of no more than 12 members and meets once every three months, and additionallyas often as the business of the Bank may require, at the headquarters of the Bank or at any other place specifiedin the convening notice. The Charter sets out the required composition of the Board, who are responsible forthe general conduct of the business of the Bank. The Board is made up of 12 directors, of which four directorsrepresent the Class A Shareholders, one of whom shall be nominated by AfDB but is subject to approval by theClass A shareholders as a whole (which director is treated as representing all the Class A shareholders and notjust AfDB) four directors represent the Class B Shareholders, two directors represent the Class C Shareholdersand two directors are independent directors who represent the Shareholders as a whole. All directors arerequired to be independent from any of their nominating entities (albeit they are representative of a particularclass of Shares).
In the event that in the future the quantum of Class D Shares issued represents at least 10% of the total issuedshare capital of the Bank, then the composition of the Board and the various committees of the Board would bealtered to allow Class D Shareholders to be represented. The Board would continue to have 12 members, but atany time where Class D Shares represent at least 10% but less than 20% of the total issued shares of the Bank,Class A Shareholders will be entitled to appoint four directors, Class B Shareholders will be entitled to appointfour directors, Class C Shareholders will be entitled to appoint one director and Class D Shareholders will beentitled to appoint one director. Thereafter, holders of Class D Shares would be entitled to appoint one furtherdirector for every 10% that the Class D Shares incrementally represent of the issued share capital of the Bank,up to a maximum of four directors. Furthermore, Class D Shareholders would also become entitled to appointan additional director, who shall be appointed in place of a director representing the Class B Shareholders, inthe event that: (i) the percentage of issued share capital of the Bank represented by Class B Shares falls below10% and (ii) 50% or more of the number of issued Class B Shares in existence on 8 December 2012 have beenconverted to Class D Shares. Class D Shareholders would also become entitled to appoint a further director,who shall be appointed in place of a director representing the Class C Shareholders, in the event that all of theissued Class C Shares in existence on 8 December 2012 have been converted to Class D Shares. As such, inthe event that Class D Shares are ever issued and all of the foregoing events should occur, ClassD Shareholders could become entitled to appoint up to a maximum of six directors in total.
For a meeting of the Board of Directors to be quorate, the majority of the total number of Directors electedmust be present, and at least two directors representing Class A shareholders, one director representing ClassB Shareholders, one director representing Class C Shareholders, and one director representing Class D (if sucha director is then in office) must be present. Each director has one vote, and decisions will be taken by themajority of directors’ present. In the case of equal division of votes the Chairman of the Board of Directorsshall be entitled to a casting vote.
The shareholders are required to have due regard to high competence in economic, financial and trade mattersrequired for the office. The holders of Class A Shares and the holders of Class B and Class C Shares each voteseparately to elect the directors representing their respective Class. The independent directors are elected by theshareholders voting in General Meeting, with candidates having been nominated by the Board of Directors.Each director is elected for a three-year term and may subsequently be re-elected. However, no director may beof the same nationality as any other existing director.
Subject to the provisions of the Charter, the Board shall have responsibility for the general conduct of thebusiness of the Bank and may exercise all such powers conducive to the attainment of the purpose of the Bankas are not required by the Charter to be exercised by the shareholders in General Meetings or the President.Notwithstanding and in addition to the general powers conferred on it under the Charter, the Board also hasresponsibility for:
• preparing the work of the general meeting;
• submitting to the Shareholders for consideration at each Annual General Meeting the Annual Report of theBank and the annual financial statements, together with the report of the external auditors relating thereto;
• taking decisions concerning particular trade-financing proposals, direct loans, guarantees, investments, theborrowing of funds and other operations of the Bank;
• the establishment, transfer and closing down of any branch offices, representative offices, agencies andsubsidiaries;
• the establishment of subsidiary organs or committees and delegating thereto any of its powers;
111
• approval of the annual budget of the Bank;
• appointment, on the recommendation of the President, of Senior Executive Vice-Presidents and ExecutiveVice-Presidents; and
• upon the recommendation of the President, determination of the organisational structure, staffing level, andsalary scales of the Bank and prescribing staff regulations.
The Board forms sub-committees, which include:
• the Executive Committee, which is composed of three directors, one representing each of Class A, Class Band Class C Shareholders, and any other such person as the Board may designate from time to time. ThePresident is the Chairman of the Executive Committee. The Executive Committee meets as often as thebusiness of the Bank may require to make decisions on matters delegated to it by the Board, such as thoserelating to investment, guarantee and financing operations. The members of the Executive Committee areMr. Victor-Jérôme Nembelessini-Silué, Dr. Denny Kalyalya, Mr. Daniel Hannah and Mr. Anil Dua;
• the Branch Management Committee, which currently comprises of all the members of the ExecutiveCommittee and has oversight over the operations of the Branches;
• the Audit Committee is composed of four directors, one representing each of Class A Shares, ClassB Shares and Class C Shares and one independent director, and any other such persons as the Board maydesignate from time to time. It is empowered by the Board to review, examine and verify the properapplication of the financial, operational and administrative policies and procedures of the Bank. The AuditCommittee meets at least twice a year or as often as its business may require. The members of the AuditCommittee are Mr. Jean-Marie Benoît Mani, Dr. Mahmoud Isa-Dutse, Ms. Xu Yan and Mr. RonaldSibongiseni Ntuli;
• the Remuneration Committee is composed of two directors, one representing the Class A Shares and oneindependent director. The Remuneration Committee exists for the purpose of determining the remunerationof the President and the terms and conditions of his service. The members of the Remuneration Committeeare Mr. Stefan Luis-François Nalletamby and Mr. Ronald Sibongiseni Ntuli; and
• the Strategy and Risk Committee is composed of five directors, currently one from Class A, three fromClass B and one independent director. The purpose of this committee is to provide reasonable assurance tothe Board that all the material risks associated with, and arising from, the Bank’s operations are beingmanaged in a risk efficient manner and assisting the Board in its oversight of the Bank’s strategyformulation and implementation functions. The members of the Strategy and Risk Committee areMr. Gamal Mohamed Abdel-Aziz Negm, Dr. John Panonetsa Mangudya, Mr. Jean-Marie Benoît Mani,Mr. Li Kwong Wing Kee Chong and Mr. Ronald Sibongiseni Ntuli.
The composition of the Executive, Audit and Remuneration Committees will remain as they currently arecomposed until such time as Class D Shares represent at least 10% of the total issued shares of the Bank. As atthe date of this Registration Document, Class D Shares represent 6% of the total issued shares of the Bank.When this threshold is reached the Charter provides that an additional director, representing the ClassD Shareholders, may be appointed to each committee. In such instances as Class B or Class C Shareholderslose the right to appoint a director to the Board, the composition of these committees will also reduceaccordingly.
112

As at the date of this Registration Document, the membership of the Board was as follows:
Name Nationality PositionDate of
appointmentYear in whichTerm expires Age
Class ADr Mahmoud Isa-Dutse . . . . . . . . . . . . Nigeria Director 2016 2019 63Dr Denny Kalyalya . . . . . . . . . . . . . . . Zambia Director 2019 2022 62Mr Stefan Luis-François Nalletamby . . . . French Director 2011 2020 58Mr Gamal Mohamed Abdel-Aziz Negm . . Egypt Director 2013 2019 64Class BDr John Panonetsa Mangudya . . . . . . . . Zimbabwe Director 2019 2022 56Mr Jean-Marie Benoît Mani . . . . . . . . . Cameroon Director 2019 2022 61Mr Victor-Jérôme Nembelessini-Silué . . . Côte d’Ivoire Director 2019 2022 63Mr Li Kwong Wing Kee Chong . . . . . . . Mauritius Director 2017 2020 69Class CMr Daniel Hanna . . . . . . . . . . . . . . . . British Director 2019 2022 41Ms Xu Yan . . . . . . . . . . . . . . . . . . . . China Director 2018 2021 50Independent DirectorsMr Anil Dua . . . . . . . . . . . . . . . . . . . India Director 2019 2022 67Mr Ronald Sibongiseni Ntuli . . . . . . . . . South Africa Director 2019 2022 49Alternate DirectorsMr Aliyu Ahmed (Class A) . . . . . . . . . Nigeria Alternate Director 2017 N/A 56Dr Ashraf Bahie El Din (Class A) . . . . . Egypt Alternate Director 2018 N/A 49Leila Fareh EP Mokaddem (Class A) . . . Tunisia Alternate Director 2016 N/A 59Mr Eric Rwigamba (Class A) . . . . . . . . Rwanda Alternate Director 2016 N/A 45Niang Komata Goumou (Class B) . . . . . Guinea Alternate Director 2016 N/A 65Calixte Nganongo (Class B) . . . . . . . . . Congo Alternate Director 2016 N/A 68Nikita Gusakov (Class C) . . . . . . . . . . . Russian Alternate Director 2018 N/A 38Monhla Hlahla (Independent) . . . . . . . . . South Africa Alternate Director 2016 N/A 55OtherProf Benedict Okey Oramah . . . . . . . . . Nigeria President 2015 12 June 2020 58Dr George Elombi . . . . . . . . . . . . . . . Cameroon Executive Secretary 2009 Ex officio 53
Chairman of the Board
Prof. Benedict Okey Oramah, President
Professor Benedict Oramah was decorated as a Professor of international trade and finance by the AdelekeUniversity, Nigeria, in 2018 and also holds a PhD in Agricultural Economics obtained in 1991. He worked asthe Assistant Manager, Research, for Nigerian Export-Import Bank from 1992 to 1994 before joining the Bankas Chief Analyst in 1994, rising to the position of Senior Director, Planning and Business Developmentdepartment, in 2007. He was appointed to the position of Executive Vice President of the Bank inOctober 2008, a position he held until his appointment as President in June 2015 during the 22nd AnnualGeneral meeting in Lusaka, Zambia and he was inaugurated in September 2015. Prof. Oramah has been aRegular Speaker at UNCTAD’s Annual African Oil & Gas Conference beginning from 1995. He is the authorof the authoritative book on structured trade finance, Foundations of Structured Trade Finance, published 2015,and he has also contributed to several trade finance conferences in London and elsewhere. Prof. Oramah haswritten over 35 articles on a range of African economic and trade related matters, many of which have beenpublished in leading international journals.
Directors representing Class A shareholders
Dr. Mahmoud Isa-Dutse
Dr. Isa-Dutse is currently the Permanent Secretary at the Federal Ministry of Finance, Nigeria. He wasappointed to the Board in July 2016. He holds a B.Sc. (Economics) from the Ahmadu Belo University, Nigeria,an MBA (Finance) from Wharton School, University of Pennsylvania (USA), and a Ph.D., ManchesterBusiness School, Manchester (UK). His working experience in the Nigerian banking industry spanned over20 years and he worked at banks which include Continental Merchant Bank, Guaranty Trust Bank and UnitedBank of Africa Plc. He has also been a non-executive director in Access Bank Plc (2005-2015), NorthernNigeria Flour Mills Plc (1994-2015) and Emerging Africa Infrastructure Fund (2012-2015). He sits on theAudit Committee.
113

Dr. Denny Kalyalya
Dr. Kalyalya is the Governor and Chairman of the Board of Directors, Bank of Zambia, a position he has heldsince February 2015. He is also an Alternate Governor at the IMF (since April 2015), Borrower Representative(17th Mid-Term Review and 18th Replenishment) of the International Development Association, member of theWorld Bank Group (“WBG”) representing Africa Group 1 Constituency (22 African countries) at the WBG(since November 2015), member of the Ministerial Petroleum Committee in the Republic of Zambia (sinceApril 2015), member of the Zambia Revenue Authority (ZRA) Governing Board (since April 2015), member ofthe Anti-Money Laundering Authority (AMLA) (since April 2015), and member of the Zambia PublicProcurement Authority (ZPPA), (since April 2015). He has previously served as Executive Director at theWorld Bank (November 2012—October 2014) and as Alternate Executive Director for the same institution(November 2010—October 2012). He also served as Deputy Governor—Operations at the Bank of Zambia(November 2002—October 2010). He joined Bank of Zambia in 1996 as Advisor—Economics and during1997/1998 was seconded to the IMF as a Special Appointee in the Monetary and Exchange Affairs and AfricanDepartments. He also served as a Lecturer of Economics (1983-1995), Assistant Dean for Post Graduate studiesin the School of Humanities and Social Sciences (1994/5), and Head of the Economics Department (1995) atthe University of Zambia (UNZA).
Mr. Stefan Luis-François Nalletamby
Mr. Nalletamby was appointed to the Board in June 2011. He is the chairman of the Remuneration Committee(a committee of the Board established by the Board to determine the remuneration of the President, and theterms and conditions of his service, and, on the recommendation of the President, consider and approve thesalary scale and benefits of all staff). He holds an MSc in Applied Development Studies from ReadingUniversity (UK), an MBA in International Management from the American Graduate School of InternationalManagement and a Maîtrise des Sciences de Gestion (M.S.G.) from the Université Paris IX Dauphine (France).He currently holds the position of Director, OFSD (Financial Sector Development Operations) at AfDB.
Mr. Gamal Mohamed Abdel-Aziz Negm
Mr. Gamal Negm has been the Deputy Governor of the Central Bank of Egypt in charge of Bank Stability since2011. Prior to this position, he held various positions in senior management of international and local bankinginstitutions where he gained experience in Risk Management, Credit Control, Internal Audit and FinancialControl. He was elected to the Board in June 2013. He is the chairman of the Strategy and Risk Committee, thecommittee responsible for providing oversight on the Bank’s strategy formulation and implementation and riskmanagement.
Directors representing Class B shareholders
Dr. John Panonetsa Mangudya
Dr. John Panonetsa Mangudya was appointed Governor of the Reserve Bank of Zimbabwe with effect from1 May 2014. Previously he was the Group Chief Executive of the Commercial Bank of Zimbabwe HoldingsLimited, with 27 years’ experience in banking and economic matters, including at Afreximbank. He is also theboard chairman of the Industrial Development Corporation of Zimbabwe and the Agricultural MarketingAuthority of Zimbabwe. Dr. Mangudya holds a PhD in Business Administration from the WashingtonInternational University, United States of America. He was elected to the Board in June 2013. He sits on theStrategy and Risk Committee.
Mr. Jean-Marie Benoît Mani
Mr. Jean-Marie Benoît Mani is a graduate in economics and holder of a DEA (major: Management) in the samesubject. He started his career in 1981 as a graduate employee and subsequently as a senior manager of the sub-regional Central Bank of Central African States (“BEAC”) in Yaoundé, Cameroon. From 1997 to 1999 heheaded various branches of BEAC and in 2002 he was appointed as the first Deputy National Director forCameroon. In April 2005, he was made Director of the Douala Branch and on 1 April 2008, he was appointedNational Director of BEAC for Cameroon as a whole. He is the chairman of the Audit Committee and sits onthe Strategy and Risk Committee.
Mr. Victor-Jérôme Nembelessini-Silué
Mr. Victor Nembelessini-Silué is the former Chairman and Chief Executive Officer of Banque Nationaled’Investissement in Côte d’Ivoire. He holds an MBA (Finance) from the University of Hartford, Connecticut,
114

USA. He was elected to the Bank’s Board in August 2004. He sits on the Executive Committee and BranchManagement Committee.
Mr. Li Kwong Wing Kee Chong
Mr. Kee Chong, Economist, is holder of a B.Sc.(Econ) from the London School of Economics and LLM inInternational Tax Law. He started his professional career in 1974 as a Lecturer in Public Finance at theUniversity of Mauritius. Afterwards, he held different positions including Advisor to the Minister of Financeand Chairman of the Stock Exchange Commission. He launched the first Unit Trust and the first Property Fundin Mauritius in 1989. Mr. Kee Chong was also Board member of the State Trading Corporation, the NationalRemuneration Board, the National Economic and Social Council and the University of Mauritius. Mr KeeChong was an external lecturer for the University of Surrey School of Management (UK) and has publishednumerous reports and articles on co-operative banking, project management, development finance, structuraladjustment and fiscal planning issues. In 1992, Mr. Kee Chong started his own private consulting firm andserved as Consultant to the United Nations Economic Commission for Africa (UNECA) and the U.N. IndustrialDevelopment Organization (UNIDO). In 1993, he founded the Mauritius International Trust Co. Ltd (MITCO),one of the first professional firms licensed to provide international tax and investment advisory services inMauritius. He sits on the Board of Directors of several emerging markets funds and Asia Hedge Funds,including Infrastructure and Real Estate Funds in Africa & Asia. He was also a Member of the Parliament ofMauritius (2010-2014). He is the current Chairman of SBM Holdings Limited, Mauritius. He sits on theStrategy and Risk Committee.
Directors representing Class C shareholders
Mr. Daniel Hanna
Mr Hanna is the Global Head of Sustainable Finance for Standard Chartered Bank. He has two decades ofbanking experience in emerging markets, with a particular focus on Africa, Asia, and the Middle East,providing advice to governments, state owned enterprises, development finance institutions on their creditratings, raising equity and debt, restructuring their business activities and investing in emerging markets.Mr Hanna is a member of United Nations Development Programme’s Sustainable Development Goals ImpactSteering Group, the steering group of the Sustainable Development Investment Partnership and the steeringgroup of the City of London’s Sustainable Development Capital Initiative. He has a Masters in BusinessAdministration (Distinction) from London Business School, a Certificate d’Etudes European from Science PoStrasbourg and a BA in economics and politics from Exeter University.
Ms. Xu Yan
Ms. Yan is a Vice-President and General Manager at the International Business department at Export-ImportBank of China (“Exim China”). She has held various positions at Exim China over the last 22 years includingthat of General Manager of the Overseas Institutions Management Department. She holds a Bachelor ofInternational Business and Economics and has completed further training in bank management as well assimultaneous interpretation. She sits on the Audit Committee.
Independent Directors
Mr. Anil Dua
Mr. Anil Dua is the former CEO of Standard Chartered Bank, West Africa. He started his career at StandardChartered Bank in 1976 as Global Head of Project, Export Finance & Structured Trade Finance beforebecoming Regional Head of Origination & Client Coverage Africa. He has gained extensive internationalexperience through his work in India, the United Kingdom, the United States of America and Botswana. Priorto joining Standard Chartered Bank, Anil worked as a lecturer in Economics at Delhi University. Anilgraduated with a degree in Economics from St. Stephens College, Delhi, and has a MA in Economics from theDelhi School of Economics. Mr. Dua was elected to the Bank’s Board in July 2010.
Mr. Ronald Sibongiseni Ntuli
Mr. Ronald Ntuli is the founder and Chairman of Thelo Group, South Africa, an independent investment groupwith interests in the aviation, infrastructure and resources sector. He is the former President of theJohannesburg Chamber of Commerce and Industry and holds an LLB from the University of Edinburgh andjoined the Bank’s Board in July 2010. He sits on the Audit Committee, Strategy and Risk Committee andRemuneration Committee.
115

Alternate Directors
Mr. Aliyu Ahmed
Mr. Ahmed is the Director of the International Economic Relations Department of the Federal Ministry ofFinance, Nigeria, a position he has held since February 2017. Prior to this he served as Senior Advisor to theExecutive Director responsible for Angola, Nigeria and South Africa at the World Bank Headquarters inWashington DC, from March 2011 to February 2017. Previously, he also served both at the InternationalFinance Corporation Headquarters in Washington DC and in the Financial Markets Section, Private EnterprisePartnership for Africa (PEP-Africa) in the Sub-Saharan Office of the International Finance Corporation inJohannesburg, South Africa in 2007. He holds a M.Sc. (Financial Economics) from the University ofStrathclyde, Glasgow, United Kingdom (2002), MBA (Finance) University of Lagos, Nigeria (1989) and B.SCQuantity Surveying, Ahmadu Bello University, Zaria, Nigeria (1986). Mr. Aliyu Ahmed is the alternate ofDr. Mahmoud Isa-Dutse.
Dr. Ashraf Bahie El Din
Dr. Bahie serves as a Head of Off-site Banking Supervision since 2017 for Central Bank of Egypt (CBE) wherehe started as a General Manager. Additionally, Dr. Bahie is a non-executive board member in Arab InvestmentBank (AIBK) in Egypt. He also represents Egypt on Islamic Financial Services Board (IFSB), and representsCBE in different governmental committees. Dr. Bahie has a 28-years career in banking supervision andcorporate finance for different local and International financial institutions in Egypt as well as abroad. Prior tojoining Central Bank of Egypt, he was group head of corporate banking for Bank of Bahrain & Kuwait (BBK)and Egyptian American Bank (EAB). He holds a bachelor’s degree from Cairo University, Master’s andDoctorate’s Degree from Arab Academy for Science, Technology and Maritime Transport. He is a certifiedinstructor in several national and international universities and institutions in Egypt.
Ms. Leila Fareh EP Mokaddem
Ms. Mokaddem is the Resident Representative of the African Development Bank at its Kingdom of MoroccoField Office. She occupied the positions of Regional Resident Representative of the AfDB Regional Office inEgypt, Dakar, Senegal, managing four countries and a portfolio of 40 operations, before being appointed asResident Representative of the AfDB Morocco field office in 2017. Prior to that, she was ResidentRepresentative of the AfDB Field Office in Cairo, Egypt, managing a portfolio worth U.S.$2 billion. Prior tothat she was Head of Financial Institutions Division at the AfDB’s Private Sector Department. Leila Mokaddemwas in charge of African financial institutions financing, private equity, SME banking and Microfinance. Shestructured complex financial solutions in over 35 of the most challenging emerging and developing markets.She executed over U.S.$2.5 billion in financing financial industries ranging from regional developmentfinancial institutions to Trade Finance and Micro-Finance. She has developed innovative financial inclusioninitiatives including the Africa Guarantee Fund, Migration and Development Fund, Initiative for the financingof Growth Oriented Women Enterprises and the Trade Finance Initiative. She is member of the AfDB’sNetwork of Economists. Prior to joining AfDB, Leila was long-term fiscal advisor to the IMF. Ms Mokaddemstarted her carrier at the Ministry Economy of Tunisia and has MBA degrees in International Finance andInternational trade, respectively. She is the alternate of Mr. Stefan Luis-François Nalletamby.
Mr. Eric Rwigamba
Mr. Rwigamba is the Director General of Financial Sector Development at the Rwandan Ministry of Finance.Prior to his current position, he worked as the Technical Manager and Acting Technical Director/CountryManager for the Access to Finance Rwanda Project, a financial inclusion vehicle funded by DFID and theWorld Bank, between September 2011 and June 2013. Mr. Rwigamba was General Manger/Country Managerfor GroFin Rwanda Ltd from July 2008 to August 2011. He also worked as Country Head of Audit andCompliance from June 2005 to June 2008 at Bank of Commerce, Development and Industry, which was lateracquired by Ecobank Rwanda. Prior to joining Bank of Commerce, he worked as Audit Senior and AuditAssistant, between August 2001 and May 2005 at Ernst & Young in Uganda. Mr. Rwigamba has vastexperience in the development and implementation of financial sector policies, strategies, legislation andcorporate business planning. In addition, he has experience in finance and accounting, budgeting and control,SME financing, auditing, investigation and due diligence. He holds an MBA in Finance from OklahomaChristian University (USA) and a Bachelor of Commerce/Finance from Makerere University (Uganda). He iscurrently finalising his ACCA studies.
116
Mr. Niang Komata Goumou
Mr. Niang Komata Goumou is the Vice-Governor of the Central Bank of the Republic of Guinea since 2010.He has over 30 years’ experience in economy, audit and finance, monetary policy and credit at the CentralBank of Guinea where he has served in various positions including Advisor to the Governor, Director ofMonetary Policy and Credit, Director of Internal Audit and Assistant Director of Credit. Mr. Goumou was alsoMinister of Energy and Higher Education between March 2007 and December 2008. He holds a Master’sdegree in Economy and Finance from the University of Conakry (Guinea). He has also participated in trainingin, among other things, financial analysis and development at the CFPB (France), elaboration andimplementation of a privatisation programme in Washington DC. Mr. Goumou is the alternate of Mr. VictorJerome Nembelessini-Silue.
Mr. Calixte Nganongo
Mr. Calixte Nganongo is the Congolese Minister of Finance, Budget and Public Portfolio, He is a graduate inAccounting and Finance from the Jean Moulin University of Lyon III, at Quai Claude Bernard, in France. Hebegan his professional career at the National Social Security Fund (CNSS) from 1990 to 1997. At the creationof the National Oil Company of Congo (SNPC) in 1998, he was appointed Head of the Department of Financeand Accounting before being promoted to the Executive Board, holding the position of Deputy ManagingDirector in charge of Finance and Accounting. He is the alternate of Mr. Jean-Marie Benoît Mani.
Mr. Nikita Gusakov
Mr. Gusakov is current Chief Executive Officer (CEO) of EXIAR, Russia Export Centre (REC) Group, aposition he has held since the September 2018. He is a graduate of the Finance Academy under theGovernment of the Russian Federation, International Economy (2003). Prior to his appointment as CEO,Mr. Gusakov was a Member of the Management Board, Managing Director for Business Development, EXIAR,and prior to that Managing Director for Business Development, EXIAR. He has also been Head of InternationalDebt Capital Markets, Investment Banking Department, VTB Capital (2011-2015), Head of Local DCM,Director, Citigroup (2006—2011) and Debt Capital Market Vice-President, Alfa Bank (2003—2006). He is thealternate of Ms. Xu Yan.
Ms. Monhla Hlahla
Ms. Monhla Hlahla is a South African businesswoman and a director of various companies. She holds a BA(Hons) from Pomona College, where she majored in Economics, and an MA in Urban Planning from theUCLA School of Architecture and Planning, both institutions are based in the USA. Her career has largely beenin infrastructure development (planning to management and operation), starting with her tenure at theDevelopment Bank of Southern Africa (DBSA) in the period 1994-1997 before being seconded as CEO of theMunicipal Infrastructure Investment Unit (“MIIU”). It is during this period that she also served in various rolesto support the City of Johannesburg’s restructuring Program, which established a number of utilities such asJohannesburg Water and City Power. She became the first Chairman of the Johannesburg Water Board ofDirectors. Her tenure as Managing Director of the Airports Company of South Africa (ACSA) for the period1991-2011 resulted in the significant transformation of South Africa’s major airports into world-class facilities.She has received several honours including Businesswomen’s Association’s Businesswoman of the Year andalso that of the Black Business Quarterly, and was named Most Outstanding Woman Manager in a state-ownedenterprise by the International Quality & Productivity Centre. In 2001 and 2002, she was ranked in the Top 12of the Top 300 Business Personalities. In 2002, Prestige Rapport/City Press recognised her as one of SA’sInspirational Women Achievers. In 2014 she was awarded the Chevalier de la Legion d’ Honneur by thePresident of France with Bishop Desmond Tutu and Nadine Gordimer being earlier South African recipients ofthe award. She is the alternate of Mr. Ronald Ntuli.
Executive Secretary to the Board
Dr. George Elombi
Dr. George Elombi holds an LLM degree and a PhD Degree in Law (International Commercial Arbitration)from the University of London. As Executive Secretary to the Board, he oversees the meetings of the ExecutiveBoard and General Meetings of Shareholders as well as related Shareholder matters. He worked as a Lectureron a full time basis with the University of Hull, United Kingdom, before he joined the Bank as Legal Officer inOctober 1996. He was appointed to the position of Deputy Director, Legal Services in 2008, and to the positionof Executive Secretary and Head of Legal Services in January 2009. In addition to being the Executive
117

Secretary to the Board, Dr. Elombi currently holds the position of Executive Vice-President (Governance,Legal & Corporate Services).
The Office of President of the Bank
The President of the Bank is appointed by the Shareholders in a general meeting, on the recommendation of theBoard by a simple majority of the Shareholders and at least 40% of the Class A Shareholders. According to theCharter, the President must be a national of an African state but may not be a national of the African Statewhere the headquarters of the Bank are situated nor a person who has more than one national status any ofwhich is in respect of a non-African State, nor may he or she be of the same nationality as the immediatelypreceding President. The President must also be a person of the highest competence in matters pertaining to theoperations, management and administration of the Bank. The President is the Chief Executive and legalrepresentative of the Bank and conducts, under the general control and direction of the Board, the day-to-daybusiness of the Bank. The President is responsible for the appointment and release of officers and staff of theBank in accordance with regulations adopted by the Board, and fixes the terms of their employment inaccordance with universally recognised principles of sound management and financial policy. Furthermore, theCharter states that the Board shall delegate to the President such approval and commitment authority in respectof financing, guarantee and investment proposals up to such amounts as the Board shall determine from time totime.
The term of office of the President is five years, renewable once for a second term of five years. The currentPresident was elected to his first office at the 2015 Annual General Meeting held in Lusaka, Zambia on 13 June2015.
Remuneration of the Board of Directors and Senior Management
As prescribed in the Charter, unless otherwise decided by Shareholders in General Meeting, members of theBoard of Directors and alternate directors shall serve without remuneration but the Bank shall, in conformitywith regulations adopted by Shareholders in General Meeting, pay them reasonable travel expenses andsubsistence allowance for attending meetings of the Board of Directors and of the committees of the Board ofDirectors, as well as any expenses or remuneration for carrying out any special duties or services outside theirordinary duties. There is no provision under the Charter for providing benefits to members of the Board ofDirectors upon termination of their services. In 2018, total remuneration to the members of the Board ofDirectors and Senior Management (as set out in “—Senior Management of the Bank”) amounted toU.S.$18.15 million.
Senior Management of the Bank
Prof. Benedict O Oramah, President
See biography above under “—Board of Directors”.
Mr. Denys Denya, Executive Vice President—Finance, Administration and Banking Services
Mr. Denya holds Bachelor of Accountancy and MBA degrees from the University of Zimbabwe. He is amember of the Institute of Chartered Accountants of Zimbabwe and of the Institute of Chartered Secretariesand Administrators. Mr. Denya worked with Flexible Packaging Zimbabwe Limited as Group Finance Managerfrom 1991 to 1993 and then moved to TA Holdings as Financial Executive/Company Secretary from 1994 to1996. He moved to First Merchant Bank of Zimbabwe as Relationship Manager until 1997, when he becameFinance Director and Managing Director, a position he retained until 2006. He joined Nedbank Limited asDivisional Managing Director in charge of five Southern African countries from 2006 until April 2010, whenhe joined the Bank.
Dr. George Elombi, Executive Vice-President—Governance, Legal and Corporate Services
Dr. George Elombi holds an LLM degree and a PhD Degree in Law (International Commercial Arbitration)from the University of London. As Executive Secretary to the Board, he oversees the meetings of the ExecutiveBoard and General Meetings of Shareholders as well as related Shareholder matters. He worked as a Lectureron a full time basis with the University of Hull, United Kingdom, before he joined the Bank as Legal Officer inOctober 1996. He was appointed to the position of Deputy Director, Legal Services in 2008, and to the positionof Executive Secretary and Head of Legal Services in January 2009. In addition to being the ExecutiveSecretary to the Board, Dr. Elombi currently holds the position of Executive Vice-President (Governance,Legal & Corporate Services).
118

Mr. Amr Kamel, Executive Vice President—Business Development and Corporate Banking
Mr. Kamel holds a Bachelor of Arts degree majoring in Economics from the American University in Cairo,Egypt in 1985; and an MBA in Financial Management from City University of New York, USA in 2001. Hehas 26 years of banking experience that started immediately after graduation in 1985 during which he workedin four banks namely: Bank of Credit & Commerce from 1985 until 1991; Bank of America from 1991 until1994; Chemical Bank (currently J.P. Morgan Chase) from 1994 until 1995 as Chief Dealer. Mr. Kamel joinedAfrican Export-Import Bank in 1995. His experience spans many banking functions ranging from structuredtrade finance, documentary credits, operations, loan administration and agency, treasury, marketing, andbusiness development. He joined the Bank as a Senior Operations Associate and prior to being appointed asExecutive Vice President in September 2016, he had held the position of Director, Banking Operations sinceJanuary 2011.
Mr. Nyevero Hlupo, Chief Financial Officer
Mr. Hlupo joined the Bank on 13 September 2018 as Chief Financial Officer. He holds a Bachelor ofAccountancy Degree from the University of Zimbabwe and is a Chartered Accountant having trained withCoopers & Lybrand (Zimbabwe). In addition to being a member of the Institute of Chartered Accountants ofZimbabwe CA (Zimbabwe), he is a member of the Institute of Risk Management of South Africa. Mr. Hlupohas extensive experience in Investment and Commercial Banking, accounting, taxation and Credit management.Prior to joining the Bank, he worked as an Independent Financial Consultant involved in establishing Projectsin Angola, South Africa and Zimbabwe. Previously, he worked at Camelsa Chartered Accountants (SouthAfrica) as Chief Operating Officer and as Director Risk Management and Projects. He also worked with TrustMerchant Bank Limited (Zimbabwe) as Finance Director and Managing Director for 12 years. Prior to that, heheld several senior management positions with a number of organisations including Galatis & CompanyChartered Accountants (South Africa), Pivot Capital Partners Director (South Africa), Coca Cola ExportAuthority Central Africa Region (Zimbabwe) and Coopers & Lybrand Associates (Pvt) Ltd (Zimbabwe).
Mr. Elias Kagumya, Chief Risk Officer
Mr. Kagumya holds a Master of Science in Accounting and Finance from Makerere University BusinessSchool, Uganda and a Bachelor of Business Administration in Accounting from the same university. He is aCertified Risk Analyst and a member of the Professional Risk Managers’ International Association (PRMIA).Mr. Kagumya worked for Stanbic Bank in Uganda for 8 years and held various positions including the Head ofRisk, Regional Head of Operational Risk for Personal and Business Banking—Eastern Hub Standard Bank andMarket Risk Analyst. Previous to that, he worked for 6 years with Centenary Rural Development Bank Ltd,Uganda where he held various positions as Senior Accountant and Bank Officer Trainee in the Bank.Mr. Kagumya joined Afreximbank as Director for Risk in September 2015.
Control and Shareholdings
The Bank is not aware of any person who, as at the date of this Registration Document, exercises, or couldexercise, directly or indirectly, control over the Bank.
As at the date of this Registration Document, no members of the Board of Directors or Senior Managementhold Shares or options to acquire any Shares. However, the members of the Board of Directors or SeniorManagement who hold DRs include Prof. Benedict Oramah (27,906 DRs), Mr. Denys Denya (11,627 DRs) andDr. Isa Dutse (161,300 DRs).
Confirmation regarding Directors and Senior Management
As at the date of this Registration Document, and for the 5 years preceding the date of this RegistrationDocument, none of the members of the Board of Directors or Senior Management:
• has had any convictions in relation to fraudulent offences;
• has been a member of the administrative, management or supervisory bodies of any company, or been apartner in any partnership, at the time of or preceding any bankruptcy, receivership or liquidation; or
• has been subject to official public incrimination or sanction by a statutory or regulatory authority(including a professional body) nor has ever been disqualified by a court from acting as a member of theadministrative, management or supervisory bodies of a company or from acting in the management orconduct of the affairs of a company.
119

Conflicts of Interest
There are no conflicts or potential conflicts between the duties of the members of the Board of Directors orSenior Management and their private interests or duties.
Other Directorships
The table below sets forth the companies and partnerships (other than the Bank) in which each member of theBoard of Directors and Senior Management is, or has been, a member of the administrative, management orsupervisory bodies (or partner) at any time in the previous five years and whether he or she is still a member.
Name Company/partnershipPosition stillheld (Y/N)
Class ADr Mahmoud Isa-Dutse . . . . . . . . . . . . . . . . . . Federal Ministry of Finance of Nigeria YDr Denny Kalyalya . . . . . . . . . . . . . . . . . . . . Bank of Zambia YMr Stefan Luis-François Nalletamby . . . . . . . . . African Development Bank YMr Gamal Mohamed Abdel-Aziz Negm . . . . . . . Central Bank of Egypt Y
Class BDr John Panonetsa Mangudya . . . . . . . . . . . . . . Reserve Bank of Zimbabwe YJean-Marie Benoît Mani . . . . . . . . . . . . . . . . . Banque des Etats de l’Afrique Centrale
(BEAC)Y
Mr Victor-Jérôme Nembelessini-Silué . . . . . . . . . Nembel Invest S.A. YMr Li Kwong Wing Kee Chong . . . . . . . . . . . . SBM Group Y
Class CMr Daniel Hanna . . . . . . . . . . . . . . . . . . . . . . Standard Chartered YMs Xu Yan . . . . . . . . . . . . . . . . . . . . . . . . . Export-Import Bank of China Y
Independent DirectorsMr Anil Dua . . . . . . . . . . . . . . . . . . . . . . . . Gateway Management Ltd YMr Ronald Sibongiseni Ntuli . . . . . . . . . . . . . . Thelo Rolling Stock Leasing (Pty) LTD Y
Alternate DirectorsMr Aliyu Ahmed (Class A) . . . . . . . . . . . . . . . Federal Ministry of Finance of Nigeria YDr Ashraf Bahie El Din (Class A) . . . . . . . . . . . Central Bank of Egypt YLeila Fareh EP Mokaddem (Class A) . . . . . . . . . African Development Bank YNiang Komata Goumou (Class B) . . . . . . . . . . . Central Bank of the Republic of Guinea YCalixte Nganongo (Class B) . . . . . . . . . . . . . . . Ministry of Finance of the Republic of
CongoY
Nikita Gusakov (Class C) . . . . . . . . . . . . . . . . Russian Export Center YMonhla Hlahla (Independent) . . . . . . . . . . . . . . Royal Bafokeng Holdings Y
Senior ManagementDr Benedict Okey Oramah . . . . . . . . . . . . . . . . — —Mr Denys Denya . . . . . . . . . . . . . . . . . . . . . . — —Dr George Elombi . . . . . . . . . . . . . . . . . . . . . — —Mr Amr Kamel . . . . . . . . . . . . . . . . . . . . . . . — —Mr Nyevero Hlupo . . . . . . . . . . . . . . . . . . . . . — —Mr Elias Kagumya . . . . . . . . . . . . . . . . . . . . . — —
Corporate Governance
Although Afreximbank is not regulated by any monetary and/or financial authority, the Bank seeks to ensurethat its corporate governance standards conform to best practices for trade finance and multilateral developmentinstitutions.
Code of Ethics and Business Conduct
Members of the Board of Directors, alternate directors and Senior Management are required to observe theBank’s code of ethics and business conduct as adopted by the Board of Directors (the “Code of Ethics”). TheCode of Ethics is intended to focus the Board of Directors as a whole, individual directors and seniormanagement of the Bank on areas of ethical issues and inherent risks, to provide guidance to directors, to help
120

them recognise and deal with ethical issues, provide mechanisms for reporting unethical conduct, and to fosterand promote a culture of honesty and accountability.
The Code of Ethics establishes the following principles applicable to members of the Board of Directors,alternate directors and the Senior Management:
• sets a basic standard of conduct and duties of care and loyalty;
• highlights a focus on the sole responsibility to the Bank and the General Meeting of Shareholders and toensure actions undertaken remain within the powers conferred by the Charter;
• requires the exercise of independent judgment and performance of duties independent of any particularinterest;
• imposes requirements for disclosure and handling of conflicts of interest and for maintenance ofconfidentiality;
• restricts disclosure or use of any material, non-public information relating to the Bank, its strategy orbusiness operations;
• requires fair dealing with the Bank’s customers, suppliers, business partners and employees;
• seeks to protect the Bank’s assets and ensure their efficient use; and
• addresses the use and waiver of privileges and immunities enjoyed by such individuals in the capacity ofexercise of their official duties on behalf of the Bank.
Share Dealing Code
The Bank maintains a code of securities dealing in relation to the Shares and any other securities of the Bankwhich is based on the requirements of the EU Market Abuse Regulation (EU) 596/2014. This code applies tothe Directors and other relevant employees of the Bank.
121

SHAREHOLDERS AND DESCRIPTION OF SHARE CAPITAL
Set out below is a summary of material information concerning the share capital of the Bank, including adescription of certain rights of the holders of ordinary shares and related provisions of the Charter in effect onthe date of this Registration Document.
Share Capital and Ownership
The Bank’s authorised share capital is U.S.$5,000,000,000 divided into 500,000 ordinary shares with a parvalue of U.S.$10,000 each, which are further divided into four classes of shares (see “—Membership—Classesof Shares”). As at 30 June 2019, 154 Shareholders had subscribed for 117,946 ordinary shares, representing23.59% of the Bank’s authorised share capital, with a nominal value of U.S.$1,179.5 million, of which paid-upcapital amounted to U.S.$1,179.5 million and callable capital amounted to U.S.$920 million. As at31 December 2018, 151 Shareholders had subscribed for 116,210 ordinary shares, representing 23.2% of theBank’s authorised share capital (31 December 2017: 107,687 ordinary shares; 31 December 2016: 94,622ordinary shares), with a nominal value of U.S.$1,162.1 million, of which paid-up capital amounted toU.S.$506.3 million and callable capital amounted to U.S.$655.8 million. One of the goals of the Bank is tobroaden the shareholder base by increasing subscription to the Bank’s equity. To this end, the authorised capitalof the Bank was increased from U.S.$750 million to U.S.$5.0 billion at a reconvened third extraordinarygeneral meeting held on 8 December 2012 in Harare, Zimbabwe (the “Third EGM”).
The following table shows the authorised and paid-up share capital of the Bank as at 31 December 2018,31 December 2017 and 31 December 2016.
31 December2018 2017 2016
(U.S.$’000)Authorised capital . . . . . . . . . . . . . . . . . . . . . . . . . . . . . . . . .500,000 ordinary shares of U.S.$10,000 each . . . . . . . . . . . . . . . . . 5,000,000 5,000,000 5,000,000Paid-up share capital . . . . . . . . . . . . . . . . . . . . . . . . . . . . . . .Paid up capital—Class A . . . . . . . . . . . . . . . . . . . . . . . . . . . . . . 270,264 248,868 240,416Paid up capital—Class B . . . . . . . . . . . . . . . . . . . . . . . . . . . . . . 120,700 109,092 98,976Paid up capital—Class C . . . . . . . . . . . . . . . . . . . . . . . . . . . . . . 46,236 46,076 39,096Paid up capital—Class D . . . . . . . . . . . . . . . . . . . . . . . . . . . . . . 69,100 66,780 —
506,300 470,816 378,488
Since 1995, capital contributions to the Bank have included a premium paid on each share purchased (inaddition to the nominal value of U.S.$10,000 per share). The premium is determined at the beginning of eachsubscription and applies to all payments under that subscription. As at 31 December 2018, the Bank’ssubscribed share capital amounted to U.S.$1,271,090,563 including share premium.
General Capital Raising
The Bank’s previous Fourth Strategic Plan contained a commitment by the Bank to raise its equity capital by2016 to enable it grow its business and maintain its current capital adequacy ratio of approximately 20% underthe Basel II and Basel III requirements. At an extraordinary general meeting held on 20 September 2014 inCairo, Egypt, the Shareholders passed a resolution approving a U.S.$500 million general capital increase as amatter of priority for the Bank (the “Previous GCI”). The Previous GCI was formally launched in 2014 andthe Bank’s focus under the Previous GCI was on raising equity investment from existing shareholdersincreasing their current equity stakes. As at 31 December 2018, the Bank’s total capital fund stood atU.S.$2.6 billion, and its callable capital amounted to U.S.$873.0 million of which U.S.$621.0 millionrepresented credit-enhanced capital. The Bank raised an aggregate amount of U.S.$338.0 million in paid-incapital of which U.S.$218.6 million represented callable capital. As at 31 December 2018, the Bank has raiseda total amount of U.S.$838.0 million (including warrants).
At the 23rd Annual General Meeting of the Shareholders held in Mahé, Seychelles in July 2016 (the “2016AGM”), the Shareholders passed a resolution granting the Board unconditional approval to undertake a generalcapital increase under which the Bank plans to raise approximately U.S.$1 billion by the end of the period(2017-2021) covered by the Bank’s new Strategic Plan to enable it to grow its business as set out in theStrategic Plan (see “Business—Strategic Planning—General”) and maintain its capital adequacy ratio ofbetween 20 and 30% as tested in accordance with the Basel II and Basel III requirements (the “New GCI”).The focus of the New GCI is on both (i) raising equity investment from existing African shareholders
122

increasing their current equity stakes and (ii) targeting new African and non-African, but Africa-focused,investors of all types. The New GCI follows on from a previous general capital increase as part of the Bank’sprevious fourth strategic plan, under which, as at 31 December 2018, the Bank had received U.S.$594.0 millionin new capital funds from its Shareholders.
As part of the Previous GCI, the Bank designed an innovative equity-bridge funding structure whereby certaininvestors may from time to time provide bridging financing designed to be eligible for Tier 1 Capital treatmentunder Basel II and Basel III criteria. The Bank plans to continue to use this for the New GCI. Under thisfinancing, which has been drawn down in four tranches to date (in December 2014, December 2015,December 2016 and March 2017), investors purchased bonds backed by equity warrants in the Bank withpurchase proceeds in the amount of U.S.$77.3 million, U.S.$46.3 million, U.S.$98.7 million andU.S.$99.6 million respectively being recognised in the capital and reserves of the Bank. The equity warrantsgive investors the right to convert into Class D Shares. The Bank retains the right (but is not obliged) to retirethe warrants using the proceeds of the New GCI. The first two tranches of equity warrants were retired usingproceeds received as part of the Previous GCI. The third tranche has been refinanced using the fourth tranche,which is the only outstanding tranche as at the date of this Registration Document.
Under the September 2017 DR issuance, the Bank issued 6,977 fully paid-up Class D Shares in the form of69,770,000 DRs. Each Class D Share is represented by 10,000 DRs. The DRs were offered only to certaintargeted investors by way of private placement. The DRs were issued to SBM Securities Ltd as depositary forthe Class D Shares.
Membership
A general meeting (“General Meeting”) of the Shareholders of the Bank has the power to determine theconditions governing eligibility for membership of the Bank.
Classes of Shares
Pursuant to the Charter, as at the date of this Registration Document the Bank has four classes of shares: ClassA Shares, Class B Shares, Class C Shares and Class D Shares (further details of which are provided below).Class D Shares were introduced in the amendments to the Charter approved by the Third EGM. ClassA Shares, Class B Shares and Class C Shares may be transferred only among holders of shares of therespective Class or to any third party who is eligible to become a holder of such class of shares. The ClassD Shares were created with a view to being listed on an investment exchange approved by the Board at theappropriate time and are issued fully paid and freely transferable to any person. Shareholders of each of ClassA, Class B and Class C have rights of pre-emption in respect of all unissued shares of their respective Class,unless the Board otherwise decides or unless new shares are issued for the sole purpose of providing for theinitial subscription of a new shareholder. Holders of Class D shares have rights of pre-emption in respect of allunissued Class D Shares, unless such rights are disapplied by the Board or by the general meeting. Under theCharter, holders of Class B Shares and Class C Shares shall have the option, following the first issue of ClassD Shares, to convert their Class B Shares or Class C Shares, as applicable, into Class D Shares. ClassB Shareholders may also, if such Shareholder meets the applicable eligibility criteria (as detailed below),convert their Class B Shares to Class A Shares provided that such conversion will result in the Shareholderholding at least 100 Class A Shares.
There are eligibility criteria that must be satisfied in order for a person to hold shares of a particular class.These criteria are set out in the Charter as follows:
• Class A Shares: (i) African States or their Designated Institutions; (ii) AfDB; (iii) African continental,regional and sub-regional financial institutions and economic organisations; and (iv) any entity or personwho was a Class B Shareholder which is one hundred percent owned by an African State pursuant toArticle 14(3A) of the Charter (“Class A Shareholders”);
• Class B Shares: African public and private commercial banks, financial institutions and African publicand private investors (“Class B Shareholders”);
• Class C Shares: IFIs and economic organisations, non-African or foreign owned banks and financialinstitutions, and non-African public and private investors (“Class C Shareholders”); and
• Class D Shares: any entity or person, whether or not falling within one of the above classes (“ClassD Shareholders”, and collectively with the Class A Shareholders, the Class B Shareholders and the ClassC Shareholders, the “Shareholders”).
123

For the purpose of the above, “Designated Institution” means the Central Bank or any institution, agency orgovernmental instrumentality designated by the Government of an African State pursuant to paragraph 3 ofArticle 4 of the Establishment Agreement.
The different classes of Shareholders are of equal standing and importance: such classification does notrepresent any ordinal scale, rather they simply connote different types of Shareholder.
Shareholders
As at the date of this Registration Document, there were 50 Class A Shareholders constituting 57.65% of theBank’s paid-up share capital; 89 Class B Shareholders constituting 26.77% of the Bank’s paid-up share capital,comprising African commercial banks, insurance companies and public and private companies and individuals;14 Class C Shareholders constituting 9.76% of the Bank’s paid-up share capital, comprising IFIs, economicorganisations and non-African financial institutions and public and private companies; and one ClassD Shareholder constituting 5.82% of the Bank’s paid-up share capital.
The Charter provides that if the Bank’s shares are fully subscribed, (i) the aggregate number of Class A Sharesshall represent not less than 35% of the issued capital of the Bank and (ii) the aggregate number of ClassB Shares, Class C Shares and Class D Shares shall together represent not more than 65% of the issued capitalof the Bank.
Increases to share capital
Over the last three years, the Bank has benefited from several increases to its subscribed capital.
During the year ended 31 December 2016:
• Djibouti, São Tomé and Príncipe, and the Togolese Republic acceded to the Bank as Participating Statesand, as at the date of this Registration Document, Djibouti and São Tomé and Príncipe are yet to subscribefor Class A Shares in the Bank;
• the Central Bank of Nigeria and Republic of the Congo subscribed as Class A Shareholders; and
• each of Dangote Industries Limited, Seychelles Pension Fund, Econet Global Limited, Atlantic FinancialGroup, Rwanda Social Security Board and Locafrique Establishment de Credit subscribed as ClassB Shareholders.
During the year ended 31 December 2017
• Burundi, South Sudan, Madagascar, Comoros, Eritrea and Central Africa Republic acceded to the Bank asParticipating States and, as at the date of this Registration Document, Comoros and Central AfricaRepublic are at various stages of subscribing for Class A Shares in the Bank. This brings the total numberof Participating States to 51 as at the date of this Registration Document.
• 7 new shareholders joined the Bank, namely Republic of Togo and Republic of the Chad in Class A,Rwanda Social Security Board, MBCA Bank Ltd (Zimbabwe) and the Republic of South Africa throughthe Export Credit Insurance Corporation (ECIC) in Class B, and JSC Russian Export Centre in Class Cand SBM Securities Ltd in Class D. The Class D shares issued to SBM Securities Ltd were issued interms of a structure in which the Class D shares back Depositary Receipts listed on the Stock Exchange ofMauritius Ltd.
During the year ended 31 December 2018, 6 new shareholders joined the Bank, 4 in Class A and 2 in Class B.These new shareholders include the Kingdom of Morocco, the Government of South Sudan, the State ofEritrea, the Republic of Burundi, Aenergia of Angola and Public Investment Corporation (PIC) of South Africa.As a result, the number of the Bank’s shareholders increased to 151 in 2018.
The table below presents the Bank’s top 20 Shareholders, as at the date of this Registration Document.
As at the date of this Registration DocumentShareClass Shareholder Country Shares %
A Central Bank of Egypt Egypt 13,727 11.56A Central Bank of Nigeria Nigeria 7,212 6.07D SBM Securities Ltd(1) Mauritius 6,910 5.82B National Bank of Egypt Egypt 6,654 5.60A Reserve Bank of Zimbabwe Zimbabwe 6,805 5.73A Federal Republic of Nigeria Nigeria 6,197 5.22
124

As at the date of this Registration DocumentShareClass Shareholder Country Shares %
C China Eximbank China 5,151 4.34
A Government of Cote D’Ivoire Cote d’Ivoire 4,600 3.87A African Development Bank Regional 4,519 3.80B Banque du Caire Egypt 4,178 3.52B Banque Misr Egypt 3,993 3.36
A Government of Congo Brazzaville Rep. of Congo 3,058 2.57A Banque Centrale De Tunisie Tunisia 2,500 2.10A Bank of Uganda Uganda 2,489 2.10C Standard Chartered Bank UK 2,448 2.06B Export Credit Insurance Corporation
(ECIC)South Africa 2,327 1.96
A Republique du Cameroun Cameroon 2,223 1.87B Government Employees Pension
Fund (PIC)South Africa 2,216 1.87
C JSC Russian Export Centre Russia 1,822 1.53B Nigerian Export Import Bank Nigeria 1,658 1.40
Total Top 20 90,687 76.35%
(1) Class D Shares issued to SBM Securities Ltd as depositary in relation to the DR listing on the Stock Exchange of Mauritius.
No Shareholder has voting rights that differ from those of other Shareholders, except for some voting rightsreserved for Class A Shareholders, where the approval of two-thirds of Class A Shareholders is required on anydecision which would have the effect of modifying or changing the purpose, functions or the fundamentalstructure of the Bank.
As at 31 December 2018, the total number of Shareholders was as follows:
Shareholders as at 31 December 2018
Class A
African Re Government of MalawiAfrican Development Bank Government of MaliDevelopment Bank of Angola Central Bank of MauritaniaBCEAO Bank of MauritiusGovernment of Benin Government of MauritiusBanque Ouest Africaine de Développement (BOAD) Ministry of Finance MoroccoGovernment of Botswana Central Bank of MozambiqueGovernment of Burkina Faso Government of NamibiaMinistry of Finance Burundi Government of NigerGovernment of Cameroon Central Bank of NigeriaCentral Bank of Cape Verde Government of NigeriaGovernment of Chad Trade Development Bank (former PTA Bank)Government of Côte d’Ivoire Government of RwandaDemocratic Republic of Congo Government of SenegalRepublic of the Congo Central Bank of SeychellesCentral Bank of Egypt Government of South SudanMinistry of Finance Eritrea Bank of Sierra LeoneGovernment of Ethiopia Bank of SudanNational Bank of Ethiopia Bank of TanzaniaBank of The Gambia Government of TogoBank of Ghana Central Bank of TunisiaCentral Bank of Guinea Bank of UgandaGovernment of Guinea Bank of ZambiaGovernment of Kenya Reserve Bank of ZimbabweCentral Bank of Lesotho
125

Shareholders as at 31 December 2018
Class B
Access Bank plc FirstRand International Limited (Guernsey)Aenergia First Bank of NigeriaAfrasia Bank Zimbabwe Limited First City Monument BankAfriland First Bank Cameroon Genesis Investment BankAfriland First Bank Cote d’Ivoire Ghana Reinsurance OrganisationAfriland First Bank Democratic Republic of Congo Government Employees Pension Fund (PIC)Afriland First Bank Guinea Greenland BankAllied Bank Group Orion LimitedArab Investment Bank Guaranty Trust BankAtlantic Financial Group Gulf BankMr. Babajide Rodgers IDB Capital LTDBanque Misr Interfin Banking Corporation LimitedBanque du Caire La Société de Commerce et de Financement de
Guinée (also referred to as Alpha Amadou Diallo)Banque Centrale Populaire du Maroc Locafrique Establishment de CreditBanque Gabonaise de Développement Maubank LtdBanque Mauritanienne pour le Commerce International Mauritius Commercial BankBanque Marocaine du Commerce Exterieur MBCA Bank (now Nedbank (Zimbabwe) Limited)Banque Nationale D’Investissement Meridian Management and InvestmentsBIAO Côte d’Ivoire National Bank of KenyaBrawal Shipping Lines Limited National Insurance CorporationCaisse de Depots et Consignations Nigerian Export—Import Bank (NEXIM)Caisse Nationale de Credit Agricole Morocco Nouvobanq (Seychelles International Mercantile
Banking Corporation)Calag Capital Odogwu GroupChinguitty Bank Pan African Capital plcMartine Helene Coffi-Studer Rwanda Social Security BoardCommercial Bank of Ethiopia SBI (Mauritius) LimitedCBZ Bank Limited Mr. Sefou FagbohounThe Dangote Group Seychelles Pension FundDara-Salam Group Skye Bank PlcDevelopment Bank of Mauritius Société Camerounaise des Industries Agro-
AlimentairesEcobank Benin Standard Bank of South AfricaEcobank Ghana The State Investment Corporation LimitedEcobank Nigeria State Trading CorporationEcobank Togo Sterling BankEconet Global Limited STB Capital Markets LtdETS MCK Guinée Summa Holding Nigeria LtdExport Credit Insurance Corporation (SOC) Ltd The People’s Bank of ZanzibarExport Development Bank of Egypt United Bank for AfricaNational Bank of Egypt Unity Bank PlcEthiopian Insurance Corporation Union Bank of NigeriaFBC Bank Limited Vansco Air FreightFidelity Bank Zenith Bank
Shareholders as at 31 December 2018
Class C
BADEA (the Arab Bank for Economic Development inAfrica)
KBC Bank NV
Banco do Brasil Landesbank Baden-WürttembergCitibank Overseas Investment Corporation Meridian BIAOExport Import Bank of China Orleans Invest Holding LtdExport Import Bank of India Pryor Counts & Co. Inc.HSBC Bank plc Sumitomo Mitsui Banking CorporationJSC Russian Export Centre Standard Chartered Bank
126

Shareholders as at 31 December 2018
Class D
SBM Securities Ltd(1)
(1) SBM Securities Ltd holds the Class D Shares as depositary in relation to the DR listing on the Stock Exchange of Mauritius
Legal Status of the Bank
The Bank was established in 1993 pursuant to the Charter and the Establishment Agreement, which wasentered into between 25 African states and three multilateral institutions, and the Bank commenced operationson 30 September 1994. The Establishment Agreement was registered with the United Nations as aninternational treaty in October 1995 under Article 102 of the United Nations Charter. As at the date of thisRegistration Document, 51 African states are shareholders, have signed or acceded to the EstablishmentAgreement (the “Participating States”).
The Establishment Agreement sets forth, amongst other things, the Bank’s purpose and functions, legal status,scope of membership and the operations in which it may engage, and establishes certain immunities,exemptions, privileges, facilities and concessions of the Bank. The Bank has been established as aninternational institution with full juridical personality under the laws of each of the Participating States and hasthe full legal capacity to carry out its operations.
Annexed to the Establishment Agreement is the Charter, adopted on 27 October 1993 by the first GeneralMeeting of Shareholders of the Bank in Abuja, Nigeria (as amended on 8 May 2000 at the Seventh GeneralMeeting of Shareholders of the Bank in Tunis, Tunisia and further amended in Gaborone, Republic ofBotswana by the Second Extraordinary General Meeting on 5 June 2010, and in Harare, Republic of Zimbabweby the reconvened Third Extraordinary General Meeting on 8 December 2012). The Charter derives its legalforce from the Establishment Agreement. The Establishment Agreement accords the President, Vice-Presidents,directors, officers and employees of the Bank and consultants and experts performing missions for the Bank anumber of privileges, immunities and exemptions in the Participating States, including:
• immunity from legal process with respect to acts performed by them in their official capacity;
• the same immunities from immigration restrictions and alien registration requirements, and, not being localnationals, the same immunities from national service obligations and the same facilities as regardsexchange regulations, as are accorded by each Participating State to representatives, officials andemployees of comparable rank of other states or international organisations; and
• where they are not resident nationals, the same treatment in respect of travelling facilities as is accordedby Participating States to representatives, officials and employees of comparable ranks of other states orinternational organisations.
The Establishment Agreement also provides the President, Vice-Presidents, officers and employees of the Bankwith the following additional privileges, immunities and exemptions in the Participating States:
• immunity from personal arrest or detention, except that this immunity shall not apply to civil liabilityarising from a road traffic accident or to a traffic offence; and
• exemption from any form of direct or indirect taxation on salaries, emoluments, indemnities and pensionpaid by the Bank.
The Headquarters Agreement and Branch Agreements
The Bank has its headquarters in the Arab Republic of Egypt (“Egypt”) subject to the terms of theHeadquarters Agreement. In addition, the Bank has entered into the Branch Agreements with the ParticipatingStates of Côte d’Ivoire, Nigeria and Zimbabwe, where its branches are located. The Establishment Agreementaccords the Bank a number of privileges, immunities and exemptions, and the Headquarters Agreement and theBranch Agreements together facilitate such privileges, immunities and exemptions, providing further detail inconnection with the Bank’s physical presence, including:
• inviolability of its headquarters and branches: no officer or official of the relevant Participating State mayenter the headquarters or branches without the consent of the President of Afreximbank;
• immunity of its headquarters and branches from service of legal process except with the consent of thePresident of Afreximbank;
127

• immunity for its property and assets from search, seizure and similar action before final judgment againstAfreximbank;
• immunity for its directors, officers, employees, shareholder representatives and consultants and expertsperforming missions for Afreximbank for acts performed by them in their official capacities;
• inviolability of its archives;
• freedom from administrative, financial or other regulatory restriction;
• exemption from all taxation and from customs duties in Participating States (except in respect of publicutility services and which are payable by other international organisations); and
• treatment in respect of its official communications that is no less favourable than that accorded by therelevant Participating State to any international organisations or diplomatic missions accredited to therelevant Participating State.
The Headquarters Agreement and the Branch Agreements also provide that, notwithstanding the generality ofthese and other immunities and freedoms, the Bank may freely:
• carry on all forms of banking business and financial services authorised under the Charter;
• purchase, hold and dispose of national currencies;
• purchase, hold and dispose of convertible currencies, securities, bills of exchange, negotiable instrumentsand transfer the same to, from or within the territory of the relevant Participating State;
• open, maintain and operate accounts in the national currency within the territory of the relevantParticipating State;
• open, maintain and operate convertible currency accounts within the territory and outside the territory ofthe relevant Participating State;
• raise funds (including borrowing money as authorised under the Charter) and make loans in convertiblecurrencies; and
• carry out any operations authorised under the Charter.
The Headquarters Agreement and the Branch Agreements provide that the Bank shall co-operate at all timeswith the appropriate relevant Participating State authorities to facilitate the proper administration of justice,secure the observance of police regulations and prevent the occurrence of any abuse of the privileges,immunities and facilities provided for under the Headquarters Agreement and the Branch Agreements, as thecase may be.
The Charter
The Bank operates in accordance with the provisions of the Charter. The following is a brief summary ofcertain material provisions of the Charter. See also “ —Share Capital and Ownership” and “Management of theBank and Corporate Governance”. The Charter includes provisions to the following effect:
Increase in Share Capital
The Bank may increase its authorised share capital as and when the Shareholders, acting on therecommendation of the Board of Directors, deem it advisable. Unless the increase in share capital is solelyto provide for the initial subscription of Shares by a single Shareholder, a decision to increase the authorisedshare capital requires the approval, at a General Meeting, of a majority of votes representing not less than two-thirds of the Bank’s issued share capital, including a majority of at least two-thirds of Class A.
Any increase in the Bank’s authorised share capital must not result in the aggregate number of Class A Sharesin issue representing less than 35% of the Bank’s total issued share capital and the aggregate number of ClassB, C and D Shares in issue representing more than 65% of the Bank’s total issued share capital. If the increasein share capital involves the issuance of any Class D Shares, it will be subject to any limits or terms imposedon the issuance of Class D Shares by the Shareholders at the General Meeting from time to time (see belowunder ” —Unissued and New Shares”).
128

Alteration of Share Capital
The Bank, by a resolution passed at the General Meeting, may:
i. consolidate all or any portion of Shares into shares of a larger denomination than the nominal value ofexisting Shares; or
ii. sub-divide all or any portion of Shares into shares of a smaller denomination than the nominal value ofexisting Shares; or
iii. modify the proportions in which Shares are created, allotted and issued as Class A, B, C or D Shares, suchthat aggregate number of Class A Shares in issue may represent less than 35% of the Bank’s total issuedshare capital and the aggregate number of Class B, C and D Shares in issue represent more than 65% ofthe Bank’s total issued share capital.
Reduction of Share Capital
The Bank may, by a resolution passed by a Requisite Majority at a General Meeting, reduce its share capital tosuch extent, and in any manner, deemed expedient.
Payment for Shares
Shareholders subscribing for Class A, B and/or C Shares will, upon initial subscription, be required to pay 40%of the par value of each Share subscribed for upon allotment, and any applicable share premium.
Subject to any mandatory calls on the relevant Shares (see below under ” —Mandatory Calls on Shares”), theremaining balance in relation to each Share subscribed for shall be paid in such instalments and on such datesas the Board of Directors may determine from time to time.
The Class D Shares must be issued as fully paid.
Calls on Shares
To the extent that the nominal value or the premium at which any Shares were originally subscribed for byShareholders remains outstanding, the Board of Directors can make calls upon Shareholders in respect of suchunpaid amounts. Any proposed call by the Board of Directors requires, if being approved at a meeting of theBoard of Directors, the approval of at least two-thirds of the Directors present and voting at such meeting, or ifbeing approved by a resolution passed by correspondence, the approval of at least two-thirds of the Directors.A call will be deemed to have been made at the time the resolution of the Board of Directors authorising suchcall is passed. The Directors must provide 28 days’ notice to any Shareholder subject to a proposed call andeach such Shareholder shall be liable to pay the amount of the call to the relevant persons, at such time andplace as approved by the Board of Directors.
If a Shareholder fails to make any payment pursuant a call, on the date on which such payment is due, suchShareholder will pay interest on the amount owing at such rate as fixed by the Board of Directors. Interest willaccrue from the date on which the payment falls due until the date on which full payment of all outstandingamounts is made. Any Shareholder subject to a call will not be entitled to receive any dividend or exercise anyright as a Shareholder until it has paid any and all amounts outstanding under such call.
Mandatory Calls on Shares
The Board of Directors is entitled to make mandatory calls on the holders of Class A, B and C Shares if itconsiders it necessary in order to ensure the Bank’s compliance with its capital adequacy ratios. The Board ofDirectors is permitted to differentiate between the classes of Shares when making mandatory calls.
Unissued and New Shares
The Board of Directors is generally and unconditionally authorised to allot and issue all unissued Shares ofeach class, provided that any allotment or issuance of Shares does not result in the aggregate number of ClassA Shares in issue representing less than 35% of the Bank’s total issued share capital and the aggregate numberof Class B, C and D Shares in issue representing more than 65% of the Bank’s total issued share capital.
The Board of Directors has discretion under the Charter as to whether or not Shares are issued on a pre-emptive basis. If Shares are issued pre-emptively, the Shares must, before being issued, be offered to allShareholders holding the same respective class of Shares as those being issued and such offer must providedetails of the Shares being issued, the terms of the issuance and must be open to acceptance for a minimum of
129

90 days. Any Shares not taken up in a pre-emptive offer may be disposed of by the Board of Directors as theysee fit.
Shareholders may impose certain limits and terms on the issue of Class D Shares, provided that such limits andterms are approved by a majority of the Shareholders, including a majority of votes of at least two-thirds of theholders of Class A Shares, either present and voting at a General Meeting or by a resolution bycorrespondence.
Lien and Forfeiture
The Bank has a first and paramount lien over any Share which is not fully paid, whether or not any amountsowing in relation to such Share are presently payable. The Bank also has a first and paramount lien over anyShares (other than fully paid Shares) held by persons owing money to the Bank. Any lien the Bank has oversuch Shares will extend to all dividends payable in relation to each such Share. The Bank is entitled to sell anyShare over which it has a lien, provided that there is an amount presently owing by the holder of the Sharesubject to the lien, or, if the Bank has provided written notice to such Shareholder demanding the payment ofany outstanding amounts by such Shareholder and no payment is made to the Bank within 30 days of suchnotice.
If a Shareholder fails to pay any call or any instalment of a call on the day it becomes due, the Board ofDirectors may, while such amount remains outstanding, serve a notice on such Shareholder requiring paymentof any unpaid amount, together with any interest accrued at the rate as determined by the Board of Directors. Ifthe requirements contained in such notice are not complied with, any Share in respect of which the notice hasbeen given, may be forfeited by a resolution of the Board of Directors to that effect. Any Shareholder whoseShares have been forfeited shall cease to be a Shareholder in respect of the forfeited shares and will remainliable to pay to the Bank all outstanding amounts owed to the Bank at the date of forfeiture.
Special Rights Attaching to Shares
Any Share may be issued with preferred, deferred or other rights or restrictions, whether in relation todividends, voting, return of capital or otherwise, as determined by the Shareholders at a General Meeting fromtime to time.
Variation of Rights
The rights attached to any class of Share may be varied with the consent of three-fourths of the holders anysuch class of Shares, whether by correspondence or at a meeting of the holders of the relevant class of Shares.However, any resolution to vary the rights attaching to either Class B, C or D Shares will require the approvalof at least two-thirds of the holders of the Class A Shares. Any meeting held by the holders of any class ofShares for the purposes of varying the rights attaching to such Shares can only be held if it coincides with aproperly convened General Meeting.
The provisions of the Charter relating to the conduct of General Meetings (see below under ” —Proceedingsand Powers to be Exercised at the General Meeting”) shall apply to any such class meeting, except that:
i. No Shareholder, except for a Class A Shareholder, shall be entitled to receive notice of such meetingunless they hold Shares of the class to which the meeting relates;
ii. The quorum for any such meeting will be the holders of Shares representing at least 60% of the nominalvalue of the issued Shares of the relevant class;
iii. If any such meeting is adjourned due to lack of quorum and no quorum is present within 30 minutes ofadjournment, at least two holders of the relevant class of Shares which hold in aggregate not less than30% of the issued Shares of the relevant class shall be deemed to constitute a quorum;
iv. Any holder of not less than one-tenth of the total voting power of the relevant class of Shares may demanda poll; and
v. On a poll, every holder of the relevant class of Shares will have one vote for every Share of that classwhich they hold.
Transfer of Shares
The Class A, B and C Shares shall be transferable by means of lodging a duly signed and stamped (ifnecessary) instrument of transfer with the Bank, subject to any decision of the Board of Directors to the
130

contrary and to any restrictions and limitations imposed on such Shares in accordance with the provisions ofthe Charter. The instrument of transfer must be executed by or on behalf of the transferee. The transferor willcontinue to be deemed a holder of the Shares being transferred until the name of the transferee is entered intothe Register of Shareholders in respect of such Shares and the transferor will remain jointly and severally liablewith the transferee for meeting any calls on the Shares being transferred. The Board of Directors may declineto accept an instrument of transfer if:
i. The instrument of transfer is not accompanied with the share certificate certifying the Shareholder’sownership of the Shares subject to the instrument of transfer or such other evidence as may be reasonablyrequired by the Board of Directors; or
ii. Evidence is not furnished to the Board of Directors as to the authority of the person(s) signing theinstrument of transfer for the prospective transferor and the transferee of the relevant Shares.
The Board of Directors may also decline to accept an instrument of transfer if it believes that the instrument oftransfer relates to a transfer of Shares relating to an offer by the transferee (or persons connected to it) for theentire issued share capital of the Bank, unless such transfer has first been approved by a majority of at leasttwo-thirds of the Class A Shareholders.
Holders of Class A, B and C Shares may transfer their Shares to holders of the same respective class of Shareor to any other persons eligible to become a holder of that respective class of Share.
Conversion of Shares
Holders of Class B and C Shares may, for six weeks from the date on which the Board of Directors approves alisting of Class D Shares on a stock exchange but prior to the date of such listing, elect to convert their Class Band C Shares to either Class A and/or Class D Shares as follows:
i. Holders, which are not 100% owned by an African State, of Class B Shares may convert all (and not aportion) of their Class B Shares for Class D Shares. To the extent the Class B Shares are fully paid, theconversion will take place on a Share for Share basis. If the Class B Shares are only partly paid up, therelevant conversion rate will be calculated by dividing the amount paid up on the relevant Class B Sharesby the issue price of such Shares;
ii. Holders, which are 100% owned by an African State, of Class B Shares may convert all (and not aportion) of their Class B Shares for either Class A or Class D Shares or a combination thereof. Anyconversion to Class A Shares is only permitted to the extent that the exchange is on a Share for Sharebasis and results in the relevant Shareholder holding a minimum of 100 Class A Shares. The conversionrate applicable to such conversions shall be calculated pro rata to the paid portion of the nominal value ofthe Class B Shares at the time of conversion; and
iii. Holders of Class C Shares may convert all (and not a portion) of their Class C Shares to Class D Shares.To the extent the Class C Shares are fully paid, the conversion will take place on a Share for Share basis.If the Class C Shares are only partially paid up, the relevant conversion rate will be calculated by dividingthe amount paid up on the relevant Class B Shares by the issue price of such Shares.
If any conversion results in the Class B or Class C Shareholders having fractional entitlements to any of theirClass B or Class C Shares, the Board of Directors shall be entitled to sell such Shares and distribute theproceeds of such sale to the relevant Class B and/or Class C Shareholder as appropriate. Any conversion ofClass B or Class C Shares to either Class A or Class D Shares as applicable will take effect 90 days from thedate on which the relevant Shareholder provides notice to the Bank of its intended conversion and thecertificates representing the Class B Shares or Class C Shares subject to the conversion are cancelled and newcertificates representing the new Class A and/or Class D Shares (as applicable) are issued.
General Meetings
The Shareholders shall hold an Annual General Meeting and any other General Meetings which are convenedby the Board of Directors following receipt of a request from the holders of at least one-quarter of the nominalvalue of the Bank’s issued share capital. Each holder of Shares is entitled to have one Representative orappointed proxy at the General Meeting and such Representatives or appointed proxies shall serve as suchwithout remuneration from the Bank. The Chairman of the General Meeting is appointed at the Annual GeneralMeeting by a majority of votes of the Shareholders present and voting at the meeting and shall be selected fromamong the Representatives or appointed proxies of the Class A and Class B Shareholders. The term of office ofthe Chairman shall be for the period until the next Annual General Meeting. The Chairman shall preside over
131

each General Meeting. If the Chairman is not present at the meeting, the Vice-Chairman shall preside over theGeneral Meeting, or failing that, the Representatives or appointed proxies shall appoint the person to act aschairman at the meeting.
Notice of General Meetings
Each Annual General Meeting shall be called by thirty days’ written notice and any General Meeting other thanthe Annual General Meeting may be called by fifteen days’ written notice.
Proceedings and Powers to be Exercised at the General Meeting
The following matters must be exercised by the Shareholders at the General Meeting:
i. Election and removal of Directors and determination of their remuneration;
ii. Upon recommendation of the Board of Directors, the appointment and removal of the President;
iii. Appointment of the Bank’s external auditors and determination of their mandate and remuneration;
iv. Review and approval of the Bank’s external auditors’ report, the annual financial statements and theadoption of the annual report;
v. The transfer of the headquarters of the Bank to any African country;
vi. Determination and authorisation, upon recommendation of the Board of Directors, of the distribution and/or allocation of dividends;
vii. Increase or decrease of the authorised capital of the Bank;
viii. Suspension or termination of the operations of the Bank; and
ix. Consideration of any other matter referred to it by the Board of Directors.
The required quorum for business to be conducted at a General Meeting is the Representatives or appointedproxies representing Shareholders holding not less than 60% of the nominal value of the Bank’s issued sharecapital. If no quorum is present at a General Meeting, the meeting will be adjourned for two hours. If thereremains no quorum at the adjourned meeting, the Representatives and appointed proxies of the Shareholdersrepresenting more than 50% of the Bank’s issued share capital shall be deemed to constitute a quorum. If aquorum is still not present, there will be a further two hour adjournment, the Representatives and appointedproxies of the Shareholders representing more than 30% of the Bank’s issued share capital shall be deemed toconstitute a quorum.
Any resolution or decision by the Shareholders at a General Meeting, or a resolution by correspondence, tomodify or change the purpose, functions or fundamental structure of the Bank requires the approval of, if at aGeneral Meeting, a majority of at least two-thirds of the holders of all issued Shares present or represented atsuch General Meeting, including a majority of votes of at least two-thirds of the holders of Class A Sharespresent or represented and voting at such General Meeting, or if by a resolution by correspondence, a majorityof votes of at least two-thirds of the holders of all issued Shares entitled to be present or represented and voteat a General Meeting, including a majority of at least two-thirds of the holders of Class A Shares entitled to bepresent or represented and vote at a General Meeting (the “Requisite Majority”). The approval of theRequisite Majority is required for decisions relating to the:
i. Legal status of the Bank;
ii. Reorganisation or any change of control of the Bank;
iii. Location of the headquarters and offices of the Bank;
iv. Objects and powers of the Bank;
v. Authorised share capital of the Bank and the allocation of Shares;
vi. Alteration of the share capital of the Bank;
vii. Issuance of Shares;
viii. Creation of special rights attaching to Shares and the variation of such rights;
ix. Transfer of Shares;
132

x. Voluntary bankruptcy, liquidation, dissolution or winding up of the Bank or suspension of the Bank’soperations;
xi. Administration and powers of the General Meeting;
xii. Voting rights of Shareholders, including any changes to the Charter affecting the voting powers of theholders of Class A Shares;
xiii. Composition, powers and duties of the Board of Directors, the Executive Committee and the AuditCommittee; and
xiv. Appointment, powers and duties of the President.
Any other matters before a General Meeting may be decided by a majority of votes of Shareholders present orrepresented at the General Meeting, including the amendment of any provision of the Charter (other than theprovisions relating to the matters listed above).
Votes of Representatives and Representation by Proxy
Subject to any special rights or restrictions attaching to Shares, every Shareholder present or represented at aGeneral Meeting will have one vote for every Share it holds. The Chairman at a General Meeting will not berequired to call a formal vote unless a poll is demanded by any Representatives or appointed proxies whichrepresent not less than one-tenth of the total voting power of all the Shareholders having the right to vote at themeeting. A poll may only be demanded in relation to a specific resolution at or before a General Meeting.Unless a poll is demanded, a declaration by the Chairman that a resolution has been passed in the Bank’s bookof minutes shall be conclusive evidence of the fact. The Chairman of the General Meeting will have a castingvote.
No person, other than a Representative or appointed proxy of a duly registered Shareholder which has paid allsums payable to the Bank in respect of its Shares, shall be entitled to be present at a General Meeting, to voteon any question or be counted in a quorum at a General Meeting. Votes may be given by either aRepresentative or an appointed proxy.
A resolution may also be passed by correspondence and such a resolution shall be as valid and effectual as ifthe same had been passed at a General Meeting.
Dividends and Reserves
Subject to any special rights attaching to any Shares, dividends may only be declared at the Annual GeneralMeeting. Upon recommendation by the Board of Directors, the Shareholders at the General Meeting shall onlyapprove the payment of dividends in relation to amounts paid-up on the relevant Shares. Dividends will only bepaid out of the profits of the Bank and only to the extent that the Board of Directors considers the payment tobe justified in consideration of the financial position of the Bank. No dividends shall bear interest. The Boardof Directors may deduct from any dividend any amount which is payable any amount presently payable by theShareholder to the Bank in relation to a call made by the Bank on any Class A, B or C Shares. The resolutionapproving the payment of a dividend may specify a particular date and time on which such payment is due.
Dividends shall be apportioned and paid pro rata according to the amounts paid up on the Shares entitled todividends during the period which the dividend is paid, unless any such Share benefits from special rightspermitting the Share to be treated as if it were fully paid up for the purposes of receiving dividends.
With the approval a majority of Shareholders at a General Meeting, the Board of Directors may offerShareholders the right to elect to receive an allotment of additional shares of the same class as those which itcurrently holds, rather than cash by way of dividend. In such circumstances, the Board of Directors shall:
i. Set the basis of the relevant Share issue so that the value of the Shares to be issued in lieu of the cashdividend is equal to but not greater than the value of the cash dividend; and
ii. Circulate a notice to the Shareholders informing them of their right of election and providing a form ofelection.
Capitalisation of Profits
The Shareholders at a General Meeting may resolve to capitalise all or part of any amounts standing to thecredit of any of the Bank’s reserve accounts or its profit and loss account or any amount which is otherwiseavailable for distribution. Any amount which is so capitalised must be distributed among the Shareholders who
133

would have been entitled to the amount had it been distributed by way of dividend and in the same proportions,on the condition that the amount distributed to Shareholders will not be paid in cash but rather applied towardspaying up any amounts which are unpaid on any Shares held by the relevant Shareholder, or, paying up in fullunissued Shares or debentures of the Bank to be allotted and distributed as fully paid up amongst theShareholders in the appropriate proportions. If such a resolution is passed at a General Meeting, the Board ofDirectors shall make the necessary appropriations and applications of the undistributed profits in order to giveeffect to the resolution.
Suspension of Operations and Dissolution
The Shareholders at a General Meeting may suspend or terminate the operations of the Bank by a majority ofvotes of at least two-thirds of the holders of the issued share capital of the Bank present or represented at theGeneral Meeting, with such majority including a majority of two-thirds of the holders of the Class A Shares, orby a resolution by correspondence passed by a majority of at least two-thirds of the holders of the issued sharecapital of the Bank, including a majority of two-thirds of the holders of Class A Shares.
Upon termination of the operations of the Bank, the Shareholders at a General Meeting may sanction aliquidator to divide among the Shareholders all or part of the assets of the banks in specie or in kind at suchvalue as the liquidator deems fair in the circumstances. The liquidator may also determine how such divisionwill be carried out as between Shareholders. No distribution to Shareholders will take place until all of theBank’s liabilities to its creditors and employees have been discharged in full.
Indemnification
The Bank shall indemnify the President, the Senior Executive Vice-President, every Executive Vice-Presidentand Director, the External Auditors and any other officer, employee and agent for the time being of the Bankagainst any liability arising out of the exercise of their functions or any costs incurred by them in defendingany civil or criminal proceedings relating to such liability.
Register of Shareholders
The Register of Shareholders may be kept in manual or electronic form and must be maintained at the headoffice of the Bank or such other place as determined by the Board of Directors and shall be open for inspectionby the Shareholders. The Register of Shareholders must maintain a record of every issue or transfer of Shares,as well as any other such particulars as the Board of Directors may decide from time to time.
The Register of Shareholders must also contain the following particulars:
i. The names and postal addresses of Shareholders and the number of Shares held by each Shareholder,distinguishing each Share by its number and the amount paid thereon;
ii. The date on which each person was entered into the register as a Shareholder; and
iii. The details of any Share transfer.
Evidence of Title of Shares
Class D Shares may be held in either certificated or uncertificated form. Any Class D Shares held inuncertificated form shall be recorded in the Register of Shareholders or such other register as maintained by athird party acting as custodian or depositary in relation to such Shares. The Register of Shareholders willdistinguish between Shares held in certificated and uncertificated form.
Class A, B and C Shares must be held in certificated form and a holder of such Shares is entitled to receive oneor multiple share certificate(s) relating to their fully paid Shares. Each certificate shall be issued under the Sealand shall specify the Shares to which it relates and the fact that such Shares are fully paid. Any defaced,destroyed or lost share certificates shall be replaced pursuant to any terms relating to evidence and indemnity,as well as the payment of any fees and expenses, as the Board of Directors may determine from time to time.
Settlement of Disputes Relating to the Charter
Any question of interpretation or application of any provision of the Charter arising between Shareholders orbetween a Shareholder (or a former Shareholder) and the Bank, shall be submitted to the Board of Directors forreview. If the Board of Directors has given a decision in relation to such question, the relevant Shareholdermay require that question to be referred to the Shareholders as a whole at a General Meeting. Any decisiontaken by the Shareholders at such General Meeting shall be final and binding. While the decision of the
134

Shareholders is pending, the Bank may act on the basis of the original decision of the Board of Directors. Thisprocedure applies in lieu of judicial or arbitral procedures for the settlement of disputes and neither the Banknor any Shareholder or former Shareholder may bring an action in court in respect of such dispute, unless suchaction is brought in order to enforce the decision of the Board of Directors or the Shareholders at the GeneralMeeting.
135

RELATED PARTY TRANSACTIONS
The Bank’s principal related parties are Shareholders. The Bank transacts commercial business such as loansand deposits directly with the Shareholders themselves and institutions that are either controlled by theShareholder governments or over which Shareholder governments have significant influence.
Loans to related parties are made at market interest rates and subject to arms’ length commercial negotiationsas to terms.
Other than deposits received from the central banks of Participating States pursuant to the CENDEPprogramme, no deposits were received by Afreximbank from related parties (or repaid by Afreximbank) as at31 December 2018, 31 December 2017 and 31 December 2016.
The table below shows the compensation paid to Afreximbank’s management and Directors during the yearsending 31 December 2018, 31 December 2017 and 31 December 2016.
Year ended 31 December2018 2017 2016
(U.S.$’000)Salaries and short term employee benefits . . . . . . . . . . . . . . . . . . . . . . . . . 13,185 8,522 6,483Other long-term benefits . . . . . . . . . . . . . . . . . . . . . . . . . . . . . . . . . . . . . 3,417 2,287 1,652Post-employment benefits . . . . . . . . . . . . . . . . . . . . . . . . . . . . . . . . . . . . 1,290 554 460Termination benefits . . . . . . . . . . . . . . . . . . . . . . . . . . . . . . . . . . . . . . . 261 200 114Total . . . . . . . . . . . . . . . . . . . . . . . . . . . . . . . . . . . . . . . . . . . . . . . . . 18,153 11,563 8,709
The Bank also provides loans and advances to its staff, including those in management. Such loans andadvances are guaranteed by the staff terminal benefits payable at the time of departure from the Bank. Terminalbenefits are comprised of a provident fund set aside by the Bank, which is made up of the proceeds of monthlycontributions by the Bank of 14% of staff members’ salaries. The staff loans and advances are interest bearingand are granted in accordance with the Bank’s Rules and Regulations. As at 31 December 2018, outstandingbalances on loans and advances to management staff amounted to U.S.$556,000, compared to U.S.$507,000 asat 31 December 2017 and U.S.$225,000 as at 31 December 2016. Other benefits include meeting allowancesfor Directors and staff allowances for children’s education, dependency, home leave and housing.
No loans to related parties were written-off in the financial years ended 31 December 2016, 31 December 2017and 31 December 2018.
Details of Afreximbank’s related party transactions are also disclosed in the notes the Special Purpose FinancialStatements.
136

MATERIAL CONTRACTS
The Bank has not entered into any contract (not being a contract entered into in the ordinary course ofbusiness) (i) within the two years immediately preceding the date of this Registration Document and which is,or may be, material; or (ii) which contains any provision under which the Bank has any obligation orentitlement which is material to the Bank as at the date of this Registration Document.
137

GENERAL INFORMATION
1. Copies of the following documents will be available for inspection for 12 months following the date ofthis Registration Document at the website https://www.afreximbank.com/investor-relations/:
• this Registration Document;
• the Establishment Agreement;
• the Charter; and
• the Special Purpose Financial Statements.
Any information contained on the Bank’s website does not form part of this Registration Document.
The registered office of the Bank is 72 (B) El Maahad El Eshteraky St., Heliopolis, Cairo 11341, Egypt,and its telephone number is +20 22 456 4100. The LEI of the Bank is 21380068LJCDYA42GJ76.
2. There has been no significant change in either the financial performance or the financial position of theBank since 30 June 2019, the end of the last financial period for which financial information has beenpublished, other than (i) on 4 July 2019, the Bank entered into a term loan facility agreement with SociétéGénérale for an approved limit of €100 million, which has been fully drawn down as of the date of thisRegistration Document, and (ii) on 23 September 2019, the Bank issued U.S.$750,000,000 3.994% bondsdue September 2029, which are listed on the Global Exchange Market of Euronext Dublin.
3. The Bank does not have any significant subsidiaries as at the date of this Registration Document.
4. As at the date of this Registration Document, the Bank holds investment grade ratings from two leadinginternational ratings agencies:
• Fitch Ratings Limited (“Fitch”): on 29 October 2018, Fitch re-affirmed its ratings of the Bank at“BBB-” (Long Term Issuer Default Rating) and “F3” (Short Term IDR).
• Moody’s Investors Service (“Moody’s”): on 9 August 2019, Moody’s re-affirmed its ratings of theBank at “Baa1/Prime-2” (long-term and short term foreign currency issuer ratings).
• Global Credit Rating Co. (“GCR”): in November 2018, CGR assigned an investment grade rating tothe Bank, rating the Bank at “BBB+/A2” (long-term and short term international foreign currencyratings).
A credit rating is not a recommendation to buy, sell or hold securities and may be revised or withdrawn bythe relevant rating agency at any time. In general, European regulated investors are restricted from using arating for regulatory purposes if such rating is not issued by a credit rating agency established in theEuropean Union and registered under Regulation (EC) No 1060/2009 of the European Parliament (asamended by Regulation (EU) No 513/2011 and by Regulation (EU) No 462/2013), the “CRARegulation”). Each of Fitch and Moody’s is established in the European Union and registered under theCRA Regulation. GCR is not established in the European Union and is not registered under the CRARegulation.
5. In connection with its DR listing on the SEM in 2017, the Bank disclosed, as required under applicablelegislation, in the listing particulars a financial performance forecast for the five years to 31 December2021 (the “Outstanding Profit Forecast”). The Bank has reviewed the Outstanding Profit Forecast andhas concluded that the Outstanding Profit Forecast is no longer valid, since the Bank’s financial conditionand results of operations as at and for the years ended 31 December 2017 and 31 December 2018 haveoutperformed those in the Outstanding Profit Forecast. The Bank does not intend to update theOutstanding Profit Forecast at this time.
6. For the purpose of compliance with item 1.3 of Annex 1 in Appendix 2 to the Prospectus RegulationRules, KPMG has given and not withdrawn its written consent to the inclusion of its reports contained inthis Registration Document and has authorised the content of such reports.
138

GLOSSARY OF TERMS AND DEFINITIONS
In this Registration Document, unless the context otherwise requires, the following words and expressions havethe following meanings.
“Afreximbank” or the “Bank” . . . The African Export-Import Bank
“Annual Special Purpose FinancialStatements” . . . . . . . . . . . . . . the audited special purpose financial statements of the Bank as at and
for the years ended 31 December 2018, 2017 and 2016
“Board” or “Board of Directors” . . the board of directors of the Bank
“CENDEP” . . . . . . . . . . . . . . . . the Bank’s Central Bank Deposit/Investment Programme
“Charter” . . . . . . . . . . . . . . . . . the charter of the Bank, adopted in Abuja, Republic of Nigeria, inOctober 1993 by the first General Assembly of shareholders of theBank, as amended
“Class A Share” . . . . . . . . . . . . Ordinary “A” shares in the capital of the Bank, each with a nominalvalue of U.S.$10,000 and issued to (i) African States or theirDesignated Institutions, (ii) the African Development Bank,(iii) African continental, regional and sub-regional financialinstitutions and economic organisations; and (iv) any entity orperson who was a holder of Class “B” Shares which is 100%owned by an African state pursuant to Article 14(3A) of the Charter
“Class B Share” . . . . . . . . . . . . Ordinary “B” shares in the capital of the Bank, each with a nominalvalue of U.S.$10,000 and issued to African public and privatecommercial banks, financial institutions and African public andprivate investors
“Class C Share” . . . . . . . . . . . . Ordinary “C” shares in the capital of the Bank, each with a nominalvalue of U.S.$10,000 and issued to (i) international financialinstitutions and economic organisations, and (ii) non-regionalfinancial institutions and non-African private investors
“Class D Share” . . . . . . . . . . . . Ordinary “D” shares in the capital of the Bank, each with a nominalvalue of U.S.$10,000 and issued fully paid to any person and whichrank pari passu in all respects with all other Shares
“Code of Ethics” . . . . . . . . . . . . the Bank’s code of ethics and business conduct as adopted by theBoard of Directors
“Condensed Interim SpecialPurpose Financial Statements” .
the unaudited condensed interim special purpose financial statementsof the Bank as at and for the six months ended 30 June 2019
“Convention” . . . . . . . . . . . . . . . 1958 New York Convention on the Recognition and Enforcement ofForeign Arbitral Awards
“CRA Regulation” . . . . . . . . . . . Regulation (EC) No 1060/2009 of the European Parliament (asamended by Regulation (EU) No 513/2011 and by Regulation (EU)No 462/2013)
“Designated Institution” . . . . . . . the central bank or any institution, agency, or governmentalinstrumentality designated by the Government of an African state
“Director(s)” . . . . . . . . . . . . . . . the director(s) of the Bank
“Disclosure Guidance andTransparency Rules” . . . . . . . . the disclosure guidance and transparency rules made by the FCA
under Part VI of the FSMA
“EEA Member States” . . . . . . . . the member states of the European Economic Area
“EEA Relevant Member State” . . a Member State of the EEA
“Egypt” . . . . . . . . . . . . . . . . . . the Arab Republic of Egypt
139

“Establishment Agreement” . . . . . the Agreement for the Establishment of the African Export-ImportBank dated 8 May 1993
“EUR” or “euro” . . . . . . . . . . . . the lawful currency for the time being of the member states of theEuropean Union that adopted the single currency in accordance withthe Treaty of Rome establishing the European Economic Community,as amended
“European Union” or “EU” . . . . . a political and economic union of 28 member states that are locatedprimarily in Europe
“FCA” . . . . . . . . . . . . . . . . . . . the Financial Conduct Authority of the UK
“Fitch” . . . . . . . . . . . . . . . . . . . Fitch Ratings Limited
“FSMA” . . . . . . . . . . . . . . . . . . the Financial Services and Markets Act 2000 of the UK
“GCR” . . . . . . . . . . . . . . . . . . . Global Credit Rating
“General Meeting” . . . . . . . . . . . the general meeting of shareholders of the Bank
“Headquarters Agreement” . . . . . the headquarters agreement signed in Cairo on 31 August 1994between the Government of Egypt and the Bank
“IFRS” . . . . . . . . . . . . . . . . . . . International Financial Reporting Standards as issued by theInternational Accounting Standards Board
“Investment Company Act” . . . . . the United States Investment Company Act of 1940, as amended, andrelated rules
“KPMG” . . . . . . . . . . . . . . . . . KPMG Hazem Hassan of Smart Village—Building 105, Km 28 CairoAlex Desert road, Giza, Egypt (certified Public Accountants and amember of the International Federation of Accountants)
“Listing Rules” the Listing Rules of the UK Listing Authority
“London Stock Exchange” . . . . . . London Stock Exchange plc
“Moody’s” . . . . . . . . . . . . . . . . . Moody’s Investors Service
“National Financial Institution” . . any African state-owned, privately-owned, or mixed-enterprisebanking or financial services establishment or enterpriseincorporated or otherwise established under the laws of an Africanstate, or owned or controlled directly or indirectly by one or moreAfrican states, African continental, regional or sub-regional financialinstitutions or economic organisations or African private investors,including without limitation export-import banks, insurance companiesand other financial institutions
“Order” . . . . . . . . . . . . . . . . . . the Financial Services and Market Act (Financial Promotion) Order2005, as amended, of the UK
“Outstanding Profit Forecast” . . . a financial performance forecast for the five years to 31 December2021 disclosed by the Bank in the listing particulars in connectionwith its DR listing on the SEM in 2017 as required under applicablelegislation
“Participating States” . . . . . . . . . those African states which are shareholders or have signed or accededto the Establishment Agreement
“Prospectus Regulation” . . . . . . . Regulation (EU) 2017/1129 (and any amendments thereto)
“Prospectus Regulation Rules” . . . the Prospectus Regulation Rules of the FCA made under section 73Aof the FSMA
“QIB” . . . . . . . . . . . . . . . . . . . a “qualified institutional buyer” within the meaning of Rule 144A
“QP” . . . . . . . . . . . . . . . . . . . . a “qualified purchaser” as defined in section 2(a)(51) of theInvestment Company Act
“Register of Shareholders” . . . . . . the register of the Shareholders of the Bank
140

“Registration Document” . . . . . . . this registration document dated 9 October 2019
“Regulation S” . . . . . . . . . . . . . . Regulation S under the Securities Act
“Representative” . . . . . . . . . . . . the person designated as such by any Shareholder for the purposes ofattending and voting at a General Meeting, or voting on resolution bycorresponded in place of a General Meeting, by an instrument inwriting or any form approved by the Board of Directors save that anyShareholder that is a natural person shall be entitled to attend aGeneral Meeting and shall be deemed to be a Representative withoutthe requirement to provide any such instrument
“Requisite Majority” . . . . . . . . . . the majority of at least two-thirds of the holders of all issued Sharespresent or represented at a General Meeting, including a majority ofvotes of at least two-thirds of the holders of Class A Shares present orrepresented and voting at the General Meeting, or a resolution bycorrespondence passed by a majority of votes of at least two-thirds ofthe holders of all issued Shares entitled to be present or representedand vote at a General Meeting, including a majority of at least two-thirds of the holders of Class A Shares entitled to be present orrepresented and vote at a General Meeting
“Rule 144A” . . . . . . . . . . . . . . . Rule 144A under the Securities Act
“Seal” . . . . . . . . . . . . . . . . . . . . the official seal of the Bank
“SEC” . . . . . . . . . . . . . . . . . . . the United States Securities and Exchange Commission
“Securities Act” . . . . . . . . . . . . . the United States Securities Act of 1933, as amended, and the rulesand regulations promulgated thereunder
“Senior Management” . . . . . . . . . the senior management of the Bank as at the date of this RegistrationDocument
“Shareholders” . . . . . . . . . . . . . . means, unless specified otherwise, holder(s) of Share(s)
“Shares” . . . . . . . . . . . . . . . . . . ordinary shares of the Bank, including Class A Shares, ClassB Shares, Class C Shares and Class D Shares and each with a parvalue of U.S.$10,000
“Special Purpose FinancialStatements” . . . . . . . . . . . . . . the Annual Special Purpose Financial Statements and the Condensed
Interim Special Purpose Financial Statements
“Strategic Plan” . . . . . . . . . . . . . the Bank’s current strategic plan, entitled “Impact 2021: AfricaTransformed”
“UK” . . . . . . . . . . . . . . . . . . . . the United Kingdom
“U.S.$”, “U.S. Dollar” or “dollar” . the lawful currency for the time being of the United States
“U.S. Person” . . . . . . . . . . . . . . a U.S. person as defined in Rule 902(k) of Regulation S
“United States” or “U.S.” . . . . . . . the United States of America, its territories, its possessions and allareas subject to its jurisdiction
“Volcker Rule” . . . . . . . . . . . . . section 13 of the Bank Holding Company Act of 1956, as amended,which was added by Section 619 of the Dodd-Frank Wall StreetReform and Consumer Protection Act
141

INDEX TO SPECIAL PURPOSE FINANCIAL STATEMENTS
Condensed interim special purpose financial statements for the six months ended30 June 2019 . . . . . . . . . . . . . . . . . . . . . . . . . . . . . . . . . . . . . . . . . . . . . . . . . . . . F-2
Review Report . . . . . . . . . . . . . . . . . . . . . . . . . . . . . . . . . . . . . . . . . . . . . . . . . . . . . F-3Condensed Interim Special Purpose Statement of Financial Position as at 30 June 2019 . . . . . . F-5Condensed Interim Special Purpose Statement of Profit or Loss and Other Comprehensive Incomefor the six months period ended 30 June 2019 . . . . . . . . . . . . . . . . . . . . . . . . . . . . . . . F-6
Condensed Interim Special Purpose Statement of Changes in Equity for the six months periodended 30 June 2019 . . . . . . . . . . . . . . . . . . . . . . . . . . . . . . . . . . . . . . . . . . . . . . . . F-7
Condensed Interim Special Purpose Statement of Cash Flows for the six months period ended30 June 2019 . . . . . . . . . . . . . . . . . . . . . . . . . . . . . . . . . . . . . . . . . . . . . . . . . . . . F-8
Notes to the Special Purpose Financial Statements . . . . . . . . . . . . . . . . . . . . . . . . . . . . . . F-9
Special purpose financial statements of the African Export-Import Bank for the year ended31 December 2018 and 31 December 2017 . . . . . . . . . . . . . . . . . . . . . . . . . . . . . . . . F-29
Auditors’ Report . . . . . . . . . . . . . . . . . . . . . . . . . . . . . . . . . . . . . . . . . . . . . . . . . . . . F-30Special Purpose Statement of Financial Position as at 31 December 2018 . . . . . . . . . . . . . . . F-36Special Purpose Statement of Profit or Loss and Other Comprehensive Income for the year ended31 December 2018 . . . . . . . . . . . . . . . . . . . . . . . . . . . . . . . . . . . . . . . . . . . . . . . . . F-37
Special Purpose Statement of Changes in Equity for the year ended 31 December 2018 . . . . . . F-38Special Purpose Statement of Cash Flows for the year ended 31 December 2018 . . . . . . . . . . F-39Notes to the Special Purpose Financial Statements . . . . . . . . . . . . . . . . . . . . . . . . . . . . . . F-40
Special purpose financial statements of the African Export-Import Bank for the year ended31 December 2017 and 31 December 2016 . . . . . . . . . . . . . . . . . . . . . . . . . . . . . . . . F-92
Auditors’ Report . . . . . . . . . . . . . . . . . . . . . . . . . . . . . . . . . . . . . . . . . . . . . . . . . . . . F-93Special Purpose Statement of Financial Position as at 31 December 2017 . . . . . . . . . . . . . . . F-98Special Purpose Statement of Profit or Loss and Other Comprehensive Income for the year ended31 December 2017 . . . . . . . . . . . . . . . . . . . . . . . . . . . . . . . . . . . . . . . . . . . . . . . . . F-99
Special Purpose Statement of Changes in Equity for the year ended 31 December 2017 . . . . . . F-100Special Purpose Statement of Cash Flows for the year ended 31 December 2017 . . . . . . . . . . F-101Notes to the Special Purpose Financial Statements . . . . . . . . . . . . . . . . . . . . . . . . . . . . . . F-102
F-1

AFRICAN EXPORT-IMPORT BANK
Condensed interim special purpose financial statementsFor the six-months period ended 30 June 2019
Page 1
F-2
Independent Auditors’ Report on Review of Special Purpose Interim Financial Information
TO THE BOARD OF DIRECTORS OF AFRICAN EXPORT IMPORT BANK
Introduction
We have reviewed the accompanying special purpose condensed statement of financial position of African Export Import Bank (the “Bank”) as at 30 June 2019, the special purpose condensed statements of profit or loss and other comprehensive income, changes in equity and cash flows for the six month period then ended, and notes to the special purpose interim financial information (“the condensed special purpose interim financial information”). Management is responsible for the preparation and presentation of this special purpose condensed interim financial information in accordance with IAS 34, ‘Interim Financial Reporting’. Our responsibility is to express a conclusion on this special purpose condensed interim financial information based on our review.
Scope of Review
We conducted our review in accordance with the International Standard on Review Engagements 2410, “Review of Interim Financial Information Performed by the Independent Auditor of the Entity”. A review of special purpose interim financial information consists of making inquiries, primarily of persons responsible for financial and accounting matters, and applying analytical and other review procedures. A review is substantially less in scope than an audit conducted in accordance with International Standards on Auditing and consequently does not enable us to obtain assurance that we would become aware of all significant matters that might be identified in an audit. Accordingly, we do not express an audit opinion.
Conclusion
Based on our review, nothing has come to our attention that causes us to believe that the accompanying special purpose condensed interim financial information as at 30 June 2019 is not prepared, in all material respects, in accordance with IAS 34, ‘Interim Financial Reporting’.
Emphasis of Matter - Basis of Accounting and Restriction on Use and Distribution
We draw attention to Note 2.1 “Basis of preparation” to the special purpose interim financial information, the special purpose interim financial information are prepared to be included in a registration document for the proposed offering to investors of global depository receipts “GDRs” representing interests in class D shares of the bank for trading in London stock exchange. As a result, the special purpose interim financial information may not be suitable for another purpose.
Our report is intended solely to be included in the GDR registration document. Our conclusion is not modified in respect of this matter.
F-3
Declaration
This report is required by Item 18.2.1 of Annex 1 of Commission Delegated Regulation (EU) 2019/980 (the ‘PR Regulation’). For the purposes of Item 1.2 of Annex 1 to the PR Regulation we are responsible for this report as part of the registration document and declare that, to the best of our knowledge, the information contained in this report is in accordance with the facts and that the report makes no omission likely to affect its import. This declaration is included in the registration document in compliance with Item 1.2 of Annex 1 of the PR Regulation.
………………………………….. KPMG Hazem Hassan Public Accountants & Consultants Smart Village – Building 105, KM 28 Cairo - Alex Desert Road, Giza, Egypt Date: 7 October 2019.
F-4

AFRICAN EXPORT-IMPORT BANKCONDENSED INTERIM SPECIAL PURPOSE STATEMENT OF FINANCIAL POSITIONAS AT 30 JUNE 2019
31 December30 June 2019 2018
Notes US$000 US$000ASSETS
Cash and cash equivalents 14 3 605 339 1 918 434Derivative assets held for risk management 7 6 628 3 684Loans and advances to customers 15 11 395 028 11 134 424Prepayments and accrued income 128 432 134 358Investment securities measured at amortized cost 167 785 168 328Other assets 18 391 13 988Property and equipment 8 38 653 39 806Intangible Assets 9 10 199 6 348
Total assets 15 370 455 13 419 370
LIABILITIES
Derivative liabilities held for risk management 7 9 289 24 840Due to banks 16 6 110 050 5 147 944Deposits and customer accounts 17 3 172 183 2 365 385Debt securities in issue 18 3 029 399 3 027 717Other liabilities 19 348 208 293 737
Total liabilities 12 669 129 10 859 623
CAPITAL FUNDS
Share capital 20 513 096 506 300Share premium 21 786 715 764 790Warrants 22 166 756 191 531Reserves 23 594 541 594 541Retained earnings 640 218 502 585
Total capital funds 2 701 326 2 559 747
Total liabilities and capital funds 15 370 455 13 419 370
The financial statements were approved by the Chairman on behalf of the Board of Directors on 7 October 2019 and signed on its behalf as follows:
Prof. Benedict Okey OramahChairman of the Board of Directors
The above condensed interim special purpose financial statement should be read in conjunction with the accompanying notes
F-5

AFRICAN EXPORT-IMPORT BANK
CONDENSED INTERIM SPECIAL PURPOSE STATEMENT OF PROFIT OR LOSS AND OTHER COMPREHENSIVE INCOMEFOR THE SIX-MONTHS PERIOD ENDED 30 JUNE 2019
30 June 2019 30 June 2018Notes US$000 US$000
Interest income using the effective interest method 24 473 365 314 809Interest expense using the effective interest method 25 ( 229 440) ( 139 272)
Net interest income 243 925 175 537
Fee and commission income 26 24 474 28 240Fee and commission expense 27 ( 4 213) ( 5 201)
Net fee and commission income 20 261 23 039
Other operating income 28 482 1 312Personnel expenses 29 ( 25 354) ( 21 011)General and administrative expenses 30 ( 18 336) ( 17 775)Depreciation and amortisation expense ( 2 375) ( 2 131)Exchange adjustments ( 330) ( 1 585)Fair value gain/(loss) from derivatives 12 530 ( 15 327)Expected credit losses provisions on financial instruments ( 93 170) ( 66 552)
-
PROFIT FOR THE PERIOD 137 633 75 507
TOTAL COMPREHENSIVE INCOME FOR THE PERIOD 137 633 75 507
Earnings per shareBasic earnings per share (expressed in US$000 per share) 31 2.69 1.57
Diluted earnings per share (expressed in US$000 per share) 31 1.12 0.68
The above condensed interim special purpose financial statement should be read in conjunction with the accompanying notes
Page 3
F-6

AFR
ICAN
EXP
OR
T-IM
POR
T B
ANK
CO
ND
ENSE
D S
PEC
IAL
PUR
POSE
STA
TEM
ENT
OF
CH
ANG
ES IN
EQ
UIT
YFO
R T
HE
SIX-
MO
NTH
S PE
RIO
D E
ND
ED 3
0 JU
NE
2019
Proj
ect
Asse
tpr
epar
atio
nG
ener
alre
valu
atio
nfa
cilit
y Fu
ndR
etai
ned
Shar
e ca
pita
lSh
are
prem
ium
War
rant
sre
serv
ere
serv
ere
serv
e ea
rnin
gsTo
tal
US$
000
US$
000
US$
000
US$
000
US$
000
US$
000
US$
000
US$
000
Bala
nce
as a
t 31
Dec
embe
r 201
8 5
06 3
00 7
64 7
90 1
91 5
31 5
51 2
28 2
8 31
3 1
5 00
0 5
02 5
85 2
559
747
Tota
l com
preh
ensi
ve in
com
ePr
ofit
of th
e pe
riod
--
--
--
137
633
137
633
Tran
sact
ions
with
equ
ity o
wne
rs o
f the
Ban
kIs
sued
and
pai
d in
cap
ital d
urin
g 20
19 6
796
21
925
--
--
28
721
War
rant
s re
tirem
ent
--
( 24
775
)-
--
-(
24 7
75)
Bal
ance
at 3
0 Ju
ne 2
019
513
096
786
715
166
756
551
228
28
313
15
000
640
218
2 7
01 3
26
Bala
nce
at 3
1 D
ecem
ber 2
017
470
816
562
350
91
723
447
762
19
471
7 5
00 5
24 4
12 2
124
034
Impa
ct o
f Ado
ptin
g IF
RS
9 at
1 J
anua
ry 2
018
--
--
--
( 12
9 87
8)(
129
878)
Res
tate
d B
alan
ce a
t 1 J
anua
ry 2
018
470
816
562
350
91
723
447
762
19
471
7 5
00 3
94 5
34 1
994
156
Tota
l com
preh
ensi
ve in
com
ePr
ofit
of th
e pe
riod
--
--
--
75
507
75
507
Tran
sact
ions
with
equ
ity o
wne
rs o
f the
Ban
kIs
sued
and
pai
d in
cap
ital d
urin
g 20
18 1
8 19
6 1
07 2
31-
--
125
427
War
rant
s re
tirem
ent
--
( 49
227
)-
--
-(
49 2
27)
Bal
ance
at 3
0 Ju
ne 2
018
* 4
89 0
12 6
69 5
81 4
2 49
6 4
47 7
62 1
9 47
1 7
500
470
041
2 1
45 8
63
The
abov
e co
nden
sed
inte
rim s
peci
al p
urpo
se fi
nanc
ial s
tate
men
t sho
uld
be re
ad in
con
junc
tion
with
the
acco
mpa
nyin
g no
tes
F-7

AFRICAN EXPORT-IMPORT BANK
CONDENSED INTERIM SPECIAL PURPOSE STATEMENT OF CASH FLOWSFOR THE SIX-MONTHS PERIOD ENDED 30 JUNE 2019
30 June 2019 30 June 2018CASH FLOW FROM OPERATING ACTIVITIES Notes US$000 US$000
Profit for the period 137 633 75 507
Adjustment for non-cash items:Depreciation and amortization of intangible assets and property and equipment 2 373 2 131Expected credit Losses provisions on financial instruments 93 170 66 552Fair value adjustment from derivatives ( 12 530) 15 327
220 646 159 517Changes in :Prepayments and accrued income 13 100 ( 68 526)Derivatives instruments ( 5 965) 586Other assets ( 4 403) ( 809)Other liabilities 63 343 ( 292 914)Deposits and customer accounts 806 798 ( 601 518)Loans and advances to customers ( 366 325) ( 454 805)
Net cash inflows/(outflows) from operating activities 727 194 ( 1 258 469)
CASH FLOWS FROM INVESTING ACTIVITIES
Purchases of property and equipment ( 847) ( 863)Purchases of intangible assets ( 4 224) -Net cash outflows from investing activities ( 5 071) ( 863)
CASH FLOWS FROM FINANCING ACTIVITIES
Proceeds from capital subscriptions and share premium 28 721 125 427Retirement of warrants ( 24 775) ( 49 227)Dividends paid ( 2 952) ( 2 872)Proceeds from borrowed funds and debts securities 3 202 593 1 458 598Repayments from borrowed funds and debts securities ( 2 238 806) ( 1 761 944)
Net cash inflows from financing activities 964 781 376 674
Net increase / (decrease) in cash and cash equivalents 1 686 904 ( 882 658)Cash and cash equivalents at 1 January 1 918 435 3 214 573
CASH AND CASH EQUIVALENTS 14 3 605 339 2 331 915
The above condensed interim special purpose financial statement should be read in conjunction with the accompanying notes
Page 4
F-8

AFRICAN EXPORT-IMPORT BANK
NOTES TO THE SPECIAL PURPOSE FINANCIAL STATEMENTSFOR THE SIX-MONTHS PERIOD ENDED 30 JUNE 2019
1 GENERAL INFORMATION
The African Export-Import Bank (“the Bank”), headquartered in Cairo, Egypt, is a supranational institution, established on 8 May 1993.The Bank started lending operations on 30 September 1994. The principal business of the Bank is the finance and facilitation of tradeamong African countries and between Africa and the rest of the world. The Bank is tax exempt in all African member states and assuch its activities are not subject to tax.
2 SUMMARY OF SIGNIFICANT ACCOUNTING POLICIES
The accounting policies applied by the Bank have been approved by the Board of Directors of the Bank and are consistentwith International Financial Reporting Standards (IFRS) promulgated by the International Accounting Standards Board. Themajor accounting policies adopted which are consistent with those used in the previous financial year, except for the adoption for IFRS 16 as explained below,and applied by the Bank are summarized below:
2.1 Basis of preparationThe condensed interim special purpose financial statements for the half year ended 30 June 2019 have been prepared in accordance withInternational Accounting Standard 34, ‘Interim Financial Reporting’. The condensed interim special purpose financial statements have been preparedon a going-concern basis as the directors believe that the Bank will continue in operation for the foreseeable future.
The special purpose financial statements has been prepared to be included in a prospectus for the proposed offer to investors of global depositary receipts "GDRs" representing interests in Class D Shares of the Bank for trading on London Stock Exchange.
The condensed interim special purpose financial statements do not include all the notes of the type normally included in the annual financialstatements. Accordingly, these financial statements should be read in conjunction with the annual report for the year ended 31December 2018 which were prepared in accordance with International Financial Reporting Standards (IFRS).
The condensed interim special purpose financial statements are expressed in United States Dollars (US$). The condensed interim special purpose financial statementshave been prepared under the historical cost convention.
2.1.1 Interest and similar income and expenseFor all financial instruments measured at amortized cost and interest bearing financial instruments classified asavailable-for-sale financial instruments, interest income or expense is recognized at the effective interest rate, which is therate that exactly discounts estimated future cash payments or receipts through the expected life of the financial instrumentor shorter period, where appropriate, to the net carrying Once the recorded value of a financial asset or a group of similarfinancial assets has been reduced due to an impairment loss, interest income continues to be recognized using theoriginal effective interest rate applied to the new carrying amount. amount of the financial asset or financial liability. Thecarrying amount of the financial asset or financial liability is adjusted if the Bank revises its estimates of payments orreceipts. The adjusted carrying amount is calculated based on the original effective interest rate and the change in carryingamount is recognized as interest income or expense.
2.2Fees and commissions are generally recognized on an accrual basis when the service has been provided. Commitmentfees for loans that are likely to be drawn down are deferred (together with related direct costs) and recognized as anadjustment to the effective interest rate on the loan. Fess or a component of fees that are performance linked (e.g.investment banking advisory services including among other things evaluating financing options, debt restructuring, etc.) arerecognized when the performance criteria are fulfilled in accordance with the applicable terms of engagement. Loansyndication fees are recognized as revenue when the syndication has been completed and the Bank has retained no partof the loan package for itself or has retained a part at the same effective interest rate as the other participants.
2.3 Operating expensesOperating expenses are recorded on accrual basis which consists mainly of personnel expenses, general and adminstrative and depreciation expenses.
2.4 Other operating incomeOther operating income consists mainly of rental income which is accounted for on a straight-line basis over the leaseterms on ongoing leases. This also include recoveries from previously written-off facilities.
2.5 Foreign currenciesTransactions in foreign currencies are initially recorded at their respective functional currency spot rate prevailing at the dateof the transaction. At the reporting date, balances of monetary assets and liabilities denominated in foreigncurrencies are translated at the exchange rates ruling at that date. Any gains or losses resulting from the translation arerecognized in profit or loss in the statement of profit or loss and comprehensive income.
Non-monetary items that are measured in terms of historical cost in a foreign currency are translated using the exchangerate as at the date of the initial transaction and are not subsequently restated. Non- monetary items measured at fair valuein a foreign currency are translated using the exchange rates at the date when the fair value was determined. The gain orloss arising on translation of non-monetary items measured at fair value is treated in line with the recognition of gain orloss on change in fair value of the item (i.e. translation differences on items whose fair value gain or loss isrecognized in other comprehensive income or profit or loss are also recognized in other Comprehensive income or profit orloss, respectively).
2.6 Cash and cash equivalentsFor the purposes of the cash flow statement, cash and cash equivalents comprise cash in hand, due from banks, anddeposits with other banks with less than three months’ maturity from the date of acquisition. Due from banks and depositswith other banks are carried at amortized cost as these balances earn interest.
Page 5
F-9

AFRICAN EXPORT-IMPORT BANK
NOTES TO THE SPECIAL PURPOSE FINANCIAL STATEMENTSFOR THE SIX-MONTHS PERIOD ENDED 30 JUNE 2019 (CONTINUED)
2 SUMMARY OF SIGNIFICANT ACCOUNTING POLICIES (continued)
2.7 Financial instruments
Initial recognition and measurementFinancial assets and financial liabilities are recognized when the Bank becomes a party to the contractual provisions of the instrument. The Bank’s financial instruments consist primarily of cash and deposits with banks, loans and advancesto customers, investment securities, other assets, amounts due to banks, derivative financial instruments, debt securitiesin issue, deposit and customer accounts and other liabilities. The Bank borrows funds to meet disbursements in foreigncurrency as part of its matching of assets and liabilities in order to manage foreign currency risks. The proceeds from loansrepayments are used to repay the borrowings.
Financial assets and liabilities, with the exception of loans and advances to customers and balances due to customers,are initially recognised on the trade date. Loans and advances to customers are recognised when funds are transferred tothe customers’ account.
A financial asset or financial liability is initially measured at fair value plus, for an item not at fair value through profit or loss(FVTPL), transaction costs that are directly attributable to its acquisition or issue.
Subsequent measurementA financial asset is classified as subsequently measured at: amortized cost, fair value through other comprehensive income (FVOCI) or FVTPL on the basis of both the Bank's business model for managing the financial asset and the contractual cash flows characteristics of the financial asset.
A debt instrument is measured at amortized cost if it meets both of the following conditions:
principal and interest on the principal amount outstanding.A debt instrument is measured at FVOCI only if it meets both of the following conditions:
selling financial assets; and
principal and interest on the principal amount outstanding
All other financial assets are classified as measured at FVTPL.
On initial recognition of an equity investment that is not held for trading, the Bank may irrevocably elect to presentsubsequent changes in fair value in other comprehensive income (OCI). This election is made on aninvestment-by-investment basis. Amount presented in OCI shall not be subsequently transferred to profit or loss ondisposal or derecognition but the Bank may transfer the cumulative gain or loss to retained earnings or within equity.
In addition, on initial recognition, the Bank may irrevocably designate a financial asset that otherwise meets therequirements to be measured at amortized cost or at FVOCI as at FVTPL if doing so eliminates or significantly reduces anaccounting mismatch that would otherwise arise.
The Bank also designates financial liabilities at fair value through profit or loss when
otherwise be required under the contract.
Business model assessmentThe Bank makes an assessment of the objective of a business model in which an asset is held at a portfolio level becausethis best reflects the way the business is managed and information is provided to management. The informationconsidered includes:
management’s strategy focuses on earning contractual interest revenue, maintaining a particular interest rate profile, matching the duration of the financial assets to the duration of the liabilities that are funding those assets or realizingcash flows through the sale of the assets;
and how those risks are managed;
managed or the contractual cash flows collected; and
future sales activity. However, information about sales activity is not considered in isolation, but as part of an overall assessment of how the Bank’s stated objective for managing the financial assets is achieved and how cashflows are realized.
Financial assets that are held for trading or managed and whose performance is evaluated on a fair value basis aremeasured at FVTPL because they are neither held to collect contractual cash flows nor held both to collect contractual cashflows and to sell financial assets.
Page 6
F-10

AFRICAN EXPORT-IMPORT BANK
NOTES TO THE SPECIAL PURPOSE FINANCIAL STATEMENTSFOR THE SIX-MONTHS PERIOD ENDED 30 JUNE 2019 (CONTINUED)
2 SUMMARY OF SIGNIFICANT ACCOUNTING POLICIES (continued)
2.7 Financial instruments (continued)
Assessment whether contractual cash flows are solely payments of principal and interestFor the purposes of this assessment, ‘principal’ is defined as the fair value of the financial asset on initial recognition.
‘Interest’ is defined as consideration for the time value of money and for the credit risk associated with the principal amountoutstanding during a particular period of time and for other basic lending risks and costs (e.g. liquidity risk andadministrative costs), as well as profit margin.
In assessing whether the contractual cash flows are solely payments of principal and interest, the Bank considers thecontractual terms of the instrument. This includes assessing whether the financial asset contains a contractual term thatcould change the timing or amount of contractual cash flows such that it would not meet this condition. In makingthe assessment, the Bank considers:
Reclassifications
- Financial assetsFinancial assets are not reclassified subsequent to their initial recognition, except in the period after the Bank changes itsbusiness model for managing financial assets.
- Financial liabilitiesFinancial liabilities are not reclassified.
- Financial assetsIf the terms of a financial asset are modified, the Bank evaluates whether the cash flows of the modified asset aresubstantially different. If the cash flows are substantially different, then the contractual rights to cash flows from the originalfinancial asset are deemed to have expired. In this case, the original financial asset is derecognized and a new financialasset is recognized at fair value. Any costs or fees incurred as part of the modification are recognised as part of the gain orloss on derecognition.
If the cash flows of the modified asset are not substantially different, then the modification does not result in derecognitionof the financial asset. In this case, the Bank recalculates the gross carrying amount of the financial asset using the originalEIR and recognizes any difference arising between this recalculated amount and the existing gross carrying amount as amodification gain or loss in profit or loss. Any costs or fees incurred as part of the modification adjust the carrying amount ofthe modified financial asset, and are amortised over the remaining term of the modified financial asset.
- Financial liabilitiesThe Bank derecognized a financial liability when its terms are modified and the cash flows of the modified liability aresubstantially different. In this case, a new financial liability based on the modified terms is recognized at fair value. The difference between the financial liability extinguished and the new financial liability with modified terms is recognizedin profit or loss.
When the cash flows of the modified financial liability are not substantially different, then the modification does not result inderecognition of the financial asset and any difference in recognized in profit or loss (similar to the principle for accountingfor modification of financial asset that do not result in derecognition).
Offset of financial assetsFinancial assets and liabilities are offset and the net amount presented in the statement of financial position when, andonly when, the Bank has currently enforceable a legal right to offset the amounts and intends either to settle on a net basisor to realize the asset and settle the liability simultaneously. The financial assets and liabilities are presented on a grossbasis.
Income and expenses are presented on a net basis only when permitted by accounting standards, or for gains and lossesarising from a Bank of similar transactions such as in the Bank's trading activity.
Derecognition- Financial assetsThe Bank derecognizes a financial asset when the contractual rights to the cash flows from the asset expire, or when ittransfers the rights to receive the contractual cash flows in a transaction in which substantially all the risks and rewards ofownership of the financial assets are transferred or in which the Bank neither transfers nor retains substantially all the risksand rewards of ownership and it does not retain control of the financial asset. Any interest in transferred financial assets that qualify for derecognition that is created or retained by the Bank is recognized as a separate asset or liability inthe statement of financial position.
Page 7
F-11

AFRICAN EXPORT-IMPORT BANK
NOTES TO THE SPECIAL PURPOSE FINANCIAL STATEMENTSFOR THE SIX-MONTHS PERIOD ENDED 30 JUNE 2019 (CONTINUED)
2 SUMMARY OF SIGNIFICANT ACCOUNTING POLICIES (continued)
2.7 Financial instruments (continued)
Reclassifications (continued)
Derecognition (continued)- Financial assets (continued)On derecognition of a financial asset, the difference between the carrying amount of the asset (or the carrying amountallocated to the portion of the asset transferred), and the sum of (i) the consideration received (including any new assetobtained less any new liability assumed) and (ii) any cumulative gain or loss that had been recognized in othercomprehensive income is recognized in profit and loss.
From 1 January 2018 any cumulative gain/loss recognised in OCI in respect of equity investment securities designated asat FVOCI is not recognised in profit or loss on derecognition of such securities. Any interest in transferred financial assetsthat qualify for derecognition that is created or retained by the Bank is recognised as a separate asset or liability.
The Bank enters into transactions whereby it transfers assets recognised on its statement of financial position, but retainseither all or substantially all of the risks and rewards of the transferred assets or a portion of them. In such cases, thetransferred assets are not derecognised. Examples of such transactions are securities lending and sale-and-repurchasetransactions.
When assets are sold to a third party with a concurrent total rate of return swap on the transferred assets, the transaction isaccounted for as a secured financing transaction similar to sale-and-repurchase transactions, because the Bank retainsall or substantially all of the risks and rewards of ownership of such assets.
In transactions in which the Bank neither retains nor transfers substantially all of the risks and rewards of ownership of afinancial asset and it retains control over the asset, the Bank continues to recognise the asset to the extent of its continuinginvolvement, determined by the extent to which it is exposed to changes in the value of the transferred asset.
In certain transactions, the Bank retains the obligation to service the transferred financial asset for a fee. The transferredasset is derecognised if it meets the derecognition criteria. An asset or liability is recognised for the servicing contract if theservicing fee is more than adequate (asset) or is less than adequate (liability) for performing the servicing.
Financial assets transferred to external parties that do not qualify for de-recognition are reclassified in the statement offinancial position to assets pledged as collateral, if the transferee has received the right to sell or re-pledge them in theevent of default from agreed terms. Initial recognition of assets pledged as collateral is at fair value, whilst subsequentlymeasured at amortized cost or fair value as appropriate.
- Financial liabilitiesThe Bank derecognises a financial liability when its contractual obligations are discharged or cancelled, or expire.
Derivative financial instruments and hedge accountingThe Bank makes use of derivative instruments to manage exposures to interest rate, foreign currency and credit risks, including exposures arising from highly probable forecast transactions and firm commitments. In order to manageparticular risks, the Bank applies hedge accounting for transactions which meet specified criteria. However, the Bank hasdiscontinued its hedge accounting from 1 January 2017.
Derivative financial instrumentsThe Bank enters into interest rate swaps , cross currency swaps and foreign exchange forward contracts to hedge itsexposure to changes in the fair value and cash flows attributable to changes in market interest and exchange rates on itsassets and liabilities. Derivatives are initially recognized at fair value at the date the derivative contract is entered into andare subsequently measured at their fair value at the end of each reporting period. The resulting gain or loss is recognizedin profit or loss immediately. A derivative with a positive fair value is recognized as a financial asset; a derivative with anegative fair value is recognized as a financial liability.
ImpairmentThe Bank recognizes loss allowances for expected credit losses (ECL) on the following financial instruments that are notmeasured at FVTPL:
No impairment loss is recognized on equity investments.
The Bank measures loss allowances at an amount equal to lifetime ECL, except for the following, for which they aremeasured as 12-month ECL:
initial recognition.
Loss allowances for other assets and receivables are always measured at an amount equal to lifetime ECL.
Page 8
F-12

AFRICAN EXPORT-IMPORT BANK
NOTES TO THE SPECIAL PURPOSE FINANCIAL STATEMENTSFOR THE SIX-MONTHS PERIOD ENDED 30 JUNE 2019 (CONTINUED)
2 SUMMARY OF SIGNIFICANT ACCOUNTING POLICIES (continued)
2.7 Financial instruments (continued)
Impairment (continued)The Bank considers a debt security to have low credit risk when their credit risk rating is equivalent to the globallyunderstood definition of ‘investment grade’ or it is a sovereign debt issued in the local currency.
12-month ECL are the portion of ECL that result from default events on a financial instrument that are possible within the 12months after the reporting date. Life time ECL are credit losses that result from all possible default event over the expectedlife of a financial instrument.
Measurement of ECLECL are a probability-weighted estimate of credit losses. They are measured as follows:
difference between the cash flows due to the entity in accordance with the contract and the cash flows that the Bank expectsto receive);
the present value of estimated future cash flows;
the Bank if the commitment is drawn down and the cash flows that the Bank expects to receive; and
recover from the holder, the debtor or any other party.
IFRS 9 introduces a three-stage model for impairment based on changes in credit risk since initial recognition. Thethree-stage model is described below;Stage 1 - Financial instruments that have not had a significant increase in credit risk since initial recognition or that havelow credit risk at the reporting date. The financial instruments in stage 1 have their ECL measured at expected credit losseson a 12months basis.
Stage 2 - Financial instruments that have had a significant increase in credit risk since initial recognition (unless they havelow credit risk at the reporting date) but that do not have objective evidence of impairment. The financial instruments instage 2 have their ECL measured based on expected credit losses on a lifetime basis.
Stage 3 - Financial assets that have objective evidence of impairment at the reporting date and those purchased ororiginated credit impaired. Financial instruments in this stage are considered non-performing. The financial instruments instage 3 have their ECL measured based on expected credit losses on a lifetime basis.
DefaultUnder IFRS 9, the Bank will consider a financial asset to be in default when:
realizing security (if any is held); or
smaller than the current amount outstanding.
In assessing whether a borrower is in default, the Bank will consider indicators that are:
instrument is in default and their significance may vary over time to reflect changes in circumstances.
Significant increase in credit riskThe Bank has established a framework that consider qualitative, quantitative, and ‘backstop’ (30 days past duepresumption) indicators to determine whether the credit risk on a particular financial instrument has increased significantlysince initial recognition. The framework aligns with the Bank’s internal credit risk management process. The criteria fordetermining whether credit risk has increased significantly will vary by portfolio and will include backstop based ondelinquency.
In determining whether the credit risk (i.e. risk of default) on a financial instrument has increased significantly since initialrecognition, the Bank will consider reasonable and supportable information that is relevant and available without unduecost or effort, including both quantitative and qualitative information and analysis based on the Bank’s historical experience, expert credit assessment and forward- looking information.
The Bank will primarily assess whether a significant increase in credit risk has occurred for an exposure in line with itsstaging criteria by comparing:
From a quantitative point, the Bank uses changes in internal ratings of financial assets to assess significantincrease/decrease in credit risk. Evidence of SICR depends on rating at initial recognition and the extent of movement(number of notches downgrade/upgrade) as at reporting date.
Page 9
F-13

AFRICAN EXPORT-IMPORT BANK
NOTES TO THE SPECIAL PURPOSE FINANCIAL STATEMENTSFOR THE SIX-MONTHS PERIOD ENDED 30 JUNE 2019 (CONTINUED)
2 SUMMARY OF SIGNIFICANT ACCOUNTING POLICIES (continued)
2.7 Financial instruments (continued)
Significant increase in credit risk (continued)The Bank apply different notch movement across each rating grade as evidence of SICR. Generally, obligors with highercredit rating would require more notches downgrade to evidence SICR, when compared with obligors with lower creditrating.
Similarly, the Bank shall monitor changes in external ratings of financial instruments to assess SICR. Evidence of SICRdepends on rating at initial recognition and the extent of movement (number of notches downgrade) as at reporting date.
The Bank also uses the backstop indicator otherwise known as “30 days past due presumption” to assess significantincrease in credit risk. Evidence of SICR shall depend on the number of days for which contractual payments are past due.
From a qualitative perspective, the Bank shall a wide range of qualitative criteria for staging purposes both individually andcollectively, leveraging on IFRS 9 recommendations and a range of other factors. In this case, the back shall consider,significant changes in internal price indicators of credit risk, significant changes in external market indicators of credit risk fora particular financial instrument or similar financial instruments with the same expected life, actual or expected significantchange in the operating results of the borrower, expectation of forbearance or restructuring due to financial difficulties etc.
Individual or collective assessment of Significant increase in credit riskThe objective of the impairment requirements in IFRS 9 is to recognise lifetime expected credit losses for all financialinstruments for which there has been a significant increase in credit risk since initial recognition – whether assessed onan individual or collective basis. For some instruments, a significant increase in credit risk may be evident on an individualinstrument basis before the financial instrument becomes past due. In these cases, an assessment of whether there hasbeen a significant increase in credit risk is carried out on an individual basis.
For some other instruments, a significant increase in credit risk may not be evident on an individual instrument basisbefore the financial instrument becomes past due. For example, this could be the case when there is little or no updatedinformation that is routinely obtained and monitored on an individual instrument until a customer breaches the contractualterms – e.g. for many retail loans. In these cases, an assessment of whether there has been a significant increase in creditrisk on an individual basis would not faithfully represent changes in credit risk since initial recognition, and so if moreforward-looking information is available on a collective basis, an entity makes the assessment on a collective basis.
To assess significant increases in credit risk on a collective basis, the Bank group financial instruments on the basis ofshared credit risk characteristics, which may include any of the following examples of shared credit risk characteristics:
The Bank may change the grouping of financial instruments for collective assessment over time as new informationbecomes available.
Restructured financial assetsThe contractual terms of a loan may be modified for a number of reasons, including changing market conditions, customerretention and other factors not related to a current or potential credit deterioration of the customer. An existing loan whoseterms have been modified may be derecognized and the renegotiated loan recognized as a new loan at fair value.
Under IFRS 9, when the terms of a financial asset are modified and the modification does not result in derecognition, thedetermination of whether the asset’s credit risk has increased significantly reflects comparison of:
If the terms of a financial asset are renegotiated or modified or an existing financial asset is derecognized and replacedwith a new one due to financial difficulties of the borrower, then the modified asset is considered to be a new financialasset. Accordingly, the date of modification is treated as the date of initial recognition for the purpose of impairmentcalculation. The determination of whether the asset’s credit risk has increased significantly reflects comparison of:
However, in some unusual circumstances following a modification that results in derecognition of the original financialasset, there may be evidence that the modified financial asset is credit-impaired at initial recognition, and thus, the financialasset should be recognized as an originated credit-impaired financial asset. This might occur, for example, in a situation inwhich there was a substantial modification of a distressed asset that resulted in the derecognition of the original financialasset. In such a case, the Bank treats the new assets resulting from the modification as credit- impaired on themodification date (initial recognition).
Page 10
F-14

AFRICAN EXPORT-IMPORT BANK
NOTES TO THE SPECIAL PURPOSE FINANCIAL STATEMENTSFOR THE SIX-MONTHS PERIOD ENDED 30 JUNE 2019 (CONTINUED)
2 SUMMARY OF SIGNIFICANT ACCOUNTING POLICIES (continued)
2.7 Financial instruments (continued)
Credit-impaired financial assetsAt each reporting date, the Bank assesses whether financial assets carried at amortized cost and debt financial assetscarried at FVOCI are credit-impaired. A financial asset is ‘credit-impaired‘ when one or more events that have a detrimentalimpact on the estimated future cash flows of the financial asset have occurred.
Evidence that a financial asset is credit-impaired includes the following observable data:
A loan that has been renegotiated due to a deterioration in the borrower’s condition is usually considered to becredit-impaired unless there is evidence that the risk of not receiving contractual cash flows has reduced significantly andthere are no other indicators of impairment. In addition, a retail loan that is overdue for 90 days or more is consideredimpaired. In making an assessment of whether an investment in sub- national/corporate debt instrument is credit-impaired, the Bank considers the following factors:
reflected in public statements of governments/corporate issuer and availability to use those mechanisms.
Presentation of allowance for ECL in the statement of financial positionLoss allowances for ECL are presented in the statement of financial position as follows:
on the loan commitment component separately from those on the drawn component: the Bank presents a combined lossallowance for both components. The combined amount is presented as a deduction from the gross carrying amount of thedrawn component. Any excess of the loss allowance over the gross amount of the drawn component is presented as aprovision; and
the carrying amount of these assets is their fair value. However, the loss allowance is disclosed and is recognized in thefair value reserve.
Write-offLoans and debt securities are written off (either partially or in full) when there is no realistic prospect of recovery. This isgenerally the case when the Bank determines that the borrower does not have assets or sources of income that couldgenerate sufficient cash flows to repay the amounts subject to the write-off and this is taken as a derecognition event.However, financial assets that are written off are still subject to enforcement activities in order to comply with the Bank’sprocedures for recovery of amounts due.
Financial liabilitiesThe Bank classifies its financial liabilities, other than financial guarantees and loan commitments, as measured atamortised cost or FVTPL (or as derivatives designated as hedging instruments in an effective hedge). The Bank has notdesignated any financial liabilities at fair value through profit or loss.
All financial liabilities are recognized initially at fair value and, in the case of those subsequently measured at amortised,net of directly attributable transaction costs.
Financial guarantees and loan commitmentsFinancial guarantees’ are contracts that require the Bank to make specified payments to reimburse the holder for a lossthat it incurs because a specified debtor fails to make payment when it is due in accordance with the terms of a debtinstrument. ‘Loan commitments’ are firm commitments to provide credit under pre-specified terms and conditions. Suchfinancial guarantees are given to banks, financial institutions and other bodies on behalf of customers to secure loans andother banking facilities.
Financial guarantees issued or commitments to provide a loan at a below-market interest rate are initially measured at fairvalue and the initial fair value is amortised over the life of the guarantee or the commitment. Subsequently, they aremeasured as at the higher of this amortised amount and the amount of loss allowance.
For loan commitments, the Bank recognises loss allowance in line with the ECL impairment requirements. Liabilitiesarising from financial guarantees and loan commitments are included within provisions.
Amortised cost and gross carrying amountThe amortised cost of a financial asset or liability is the amount at which the financial asset or liability is measured at initialrecognition, minus principal repayments, plus or minus the cumulative amortisation using the effective interest method ofany difference between the initial amount recognised and the maturity amount, minus any reduction for impairment.
Page 11
F-15

AFRICAN EXPORT-IMPORT BANK
NOTES TO THE SPECIAL PURPOSE FINANCIAL STATEMENTSFOR THE SIX-MONTHS PERIOD ENDED 30 JUNE 2019 (CONTINUED)
2 SUMMARY OF SIGNIFICANT ACCOUNTING POLICIES (continued)
2.7 Financial instruments (continued)
Financial guarantees and loan commitments (continued)
Change in Cash flowsWhen an entity revises its estimates of payments or receipts (excluding modifications that do not result in derecognitionand changes in estimates of expected credit losses), it shall adjust the gross carrying amount of the financial asset oramortised cost of a financial liability to reflect actual and revised estimated contractual cash flows. The entity recalculatesthe gross carrying amount of the financial asset or amortised cost of the financial liability as the present value of theestimated future contractual cash flows that are discounted at the financial instrument's original EIR (or credit-adjustedeffective interest rate for purchased or originated credit-impaired financial assets) or, when applicable, the revised EIR. Theadjustment is recognised in profit or loss as income or expense.
Calculation of interest income and expenseIn calculating interest income and expense, the effective interest rate is applied to the gross carrying amount of the asset(when the asset is not credit-impaired) or to the amortised cost of the liability. However, for financial assets that havebecome credit- impaired subsequent to initial recognition, interest income is calculated by applying the effective interestrate to the amortised cost of the financial asset. If the asset is no longer credit-impaired, then the calculation of interestincome reverts to the gross basis.
For financial assets that were credit-impaired on initial recognition, interest income is calculated by applying thecredit-adjusted effective interest rate to the amortised cost of the asset. The calculation of interest income does not revert toa gross basis, even if the credit risk of the asset improves.
The calculation of the effective interest rate includes transaction costs and fees and points paid or received that are anintegral part of the effective interest rate. Transaction costs include incremental costs that are directly attributable to theacquisition or issue of a financial asset or financial liability.
PresentationInterest income and expense presented in the statement of profit or loss and OCI include:
Page 12
F-16

AFRICAN EXPORT-IMPORT BANK
NOTES TO THE SPECIAL PURPOSE FINANCIAL STATEMENTSFOR THE SIX-MONTHS PERIOD ENDED 30 JUNE 2019 (CONTINUED)
2.8 Calculation of interest income and expenseIn calculating interest income and expense, the effective interest rate is applied to the gross carrying amount of the asset(when the asset is not credit-impaired) or to the amortized cost of the liability. However, for financial assets that havebecome credit- impaired subsequent to initial recognition, interest income is calculated by applying the effective interestrate to the amortized cost of the financial asset. If the asset is no longer credit-impaired, then the calculation of interestincome reverts to the gross basis.
For financial assets that were credit-impaired on initial recognition, interest income is calculated by applying thecredit-adjusted effective interest rate to the amortized cost of the asset. The calculation of interest income does not revert toa gross basis, even if the credit risk of the asset improves.
The calculation of the effective interest rate includes transaction costs and fees and points paid or received that are anintegral part of the effective interest rate. Transaction costs include incremental costs that are directly attributable to theacquisition or issue of a financial asset or financial liability.
2.9 Property and equipmentMotor vehicles, furniture and equipment, computers and leasehold improvements are stated at cost, excluding the costs ofday-to-day servicing, less accumulated depreciation and accumulated impairment in value. Cost includes expenditure thatis directly attributable to the acquisition of the items. Repair and maintenance costs are recognized in profit or loss asincurred.
Depreciation is calculated on the straight line basis at annual rates estimated to write off the carrying amounts of the
- Buildings 20 years- Motor vehicles 5 years- Furniture and equipment 4 years- Computers 3 years- Leasehold improvements Over the remaining Period of the lease
Motor vehicles, furniture and equipment, computers and leasehold improvements are periodically reviewed for impairment.
Motor vehicles, furniture and equipment, computers and leasehold improvements are de-recognized upon disposal orwhen no future economic benefits are expected to arise from the continued use of the asset. Any gain or loss arising onde-recognition of the asset (calculated as the difference between the net disposal proceeds and the carrying amount of theitem) is included in profit or loss in the year the item is de-recognized.
The assets residual values, useful lives and methods of depreciation are reviewed at each reporting date, and adjustedprospectively if appropriate.
The Headquarters’ land and building are measured at fair value less accumulated depreciation on buildings andimpairment losses recognized at the date of revaluation.
Page 13
F-17

AFRICAN EXPORT-IMPORT BANK
NOTES TO THE SPECIAL PURPOSE FINANCIAL STATEMENTSFOR THE SIX-MONTHS PERIOD ENDED 30 JUNE 2019 (CONTINUED)
2 SUMMARY OF SIGNIFICANT ACCOUNTING POLICIES (continued)
2.9 Property and equipment (continued)Valuations are performed by an independent valuer at the reporting date to ensure that the fair value of a revalued assetdoes not differ materially from its carrying amount.
A revaluation surplus is recorded in other comprehensive income and credited to the asset revaluation reserve in equity.However, to the extent that it reverses a revaluation deficit of the same asset previously recognized in profit or loss, theincrease is recognized in profit or loss. A revaluation deficit is recognized in the profit or loss, except to the extent that itoffsets an existing surplus on the same asset recognized in the asset revaluation reserve. Upon disposal, any revaluationreserve relating to the particular asset being sold is transferred to retained earnings. An annual transfer from the assetrevaluation reserve to retained earnings is made for the difference between depreciation based on the revalued amount ofthe asset and depreciation based on the asset original cost.
2.10 Leases
The Bank has applied the standard from its mandatory adoption date of 1 January 2019 and the Bank has used the followingpractical expedient on initial application:Where the lease term is less than 12 months or leases and of low value items, then The Bank has elected to use the short-term lease exemption; and The Bank activities as a lessor / lessee are not material.
2.11 Employee benefits
i. Defined contribution planThe Bank operates a defined contribution plan approved by the Board of Directors. Contributions are recognized in profit orloss on an accrual basis. The Bank has no further payment obligations once the contributions have been paid.
ii. Other long term benefitsThe Bank's net obligation in respect of long-term employees benefits is the amount of future benefits that the employeehave earned in return for their service in current and prior periods that benefits are recognized in profit or loss on an accrualbasis.
iii. Termination benefitsTermination benefits are expensed at the earlier of when the Bank can no longer withdraw the offer of those benefits andwhen the Bank recognizes cost for a restructuring . If benefits are not expected to be wholly settled within 12 months of thereporting date, then they are discounted
iv. Short term employee benefitsShort tern employee benefits are expensed as the related service is provided. A liability is recognized for the amountexpected to be paid if the Bank has legal or constructive obligation to pay this amount as a result of past service provided bythe employee and the obligation can be estimated reliably.
2.12 ProvisionsProvisions are recognized when the Bank has a present legal or constructive obligation as a result of past events, for whichit is probable that an outflow of economic benefits will be required to settle the obligation and a reliable estimate can bemade of the amount of the obligation. Staff bonuses are recognized in profit or loss as an expense. The estimatedmonetary liability for employees’ accrued annual leave and bonus entitlement at the reporting date is recognized as anexpense accrual.
2.14 Borrowing costsBorrowing costs are recognized as expenses and recorded on accrual basis.
2.15 Debt securities in issueDebt securities in issue are one of the Bank’s sources of debt funding. Debt securities are initially measured at fair valueplus incremental direct transaction costs, and subsequently measured at their amortized cost using effective interestmethod.
2.16 Dividend on ordinary sharesDividend on ordinary shares are recognized as a liability and deducted from equity when they are approved by the Bank’sshareholders. Dividends for the year that are approved after the balance sheet date are disclosed as a non-adjusting eventafter the balance sheet date.
2.17 WarrantsProceeds from the issuance of warrants, net of issue costs, are credited to share warrants account. Share warrantsaccount is non-distributable and will be transferred to share capital and premium accounts upon the exercise of warrants.
3 FINANCIAL INSTRUMENTS AND RISK MANAGEMENT
3.1 Use of financial instrumentsThe Bank’s financial instruments consist primarily of cash and deposits with banks, loans and advances to customers,amounts due to banks and customer deposits. The Bank borrows funds to meet disbursements in foreign currency as partof its matching of assets and liabilities in order to manage foreign currency risks. The proceeds from loans repayments areused to repay the borrowings. The Bank does not speculate in or engage in the trading of derivative financial instruments.
Page 14
F-18

AFRICAN EXPORT-IMPORT BANK
NOTES TO THE SPECIAL PURPOSE FINANCIAL STATEMENTSFOR THE SIX-MONTHS PERIOD ENDED 30 JUNE 2019 (CONTINUED)
3 FINANCIAL INSTRUMENTS AND RISK MANAGEMENT
3.2 Credit riskCredit risk is the risk that a customer or counterparty of the Bank will be unable or unwilling to meet a commitment that it
depos activities undertaken by the Bank.
3.3 Concentration of credit riskThe Bank deals with a variety of major banks and its loans and advances are structured and spread among a number ofmajor industries, customers (dealing with sectors) and geographical areas (comprising group of countries). In addition, theBank has procedures and policies in place to limit the amount of credit exposure to any counterparty and country. The Bankreviews, on a regular basis, the credit limits of counterparties and countries and takes action accordingly to ensure thatexposure limits are not exceeded.
4 FAIR VALUE MEASUREMENT
The Bank measures financial instruments, such as derivatives, and non-financial assets, such as land and buildings, atfair value at each reporting date. Also, fair values of financial instruments measured at amortised cost.Fair value is the price that would be received to sell an asset or paid to transfer a liability in an orderly transactionbetween market participants at the measurement date. The fair value measurement is based on the presumption that thetransaction to sell the asset or transfer the liability takes place either: In the principal market for the asset or liability, or Inthe absence of a principal market, in the most advantageous market for the asset or liability. The principal market or themost advantageous market must be accessible by the Bank.
A fair value measurement of a non-financial asset takes into account a market participant's ability to generate economicbenefits by using the asset in its highest and best use or by selling it to another market participant that would use the assetin its highest and best use.
When one is available, the Bank measures the fair value of an instrument using the quoted price in an active market for thatinstrument. A market is regarded as active if transactions for the asset or liability take place with sufficient frequency andvolume to provide pricing information on an ongoing basis.
If there is no quoted price in an active market, then the Bank uses valuation techniques that maximise the use of relevantobservable inputs and minimise the use of unobservable inputs. The chosen valuation technique incorporates all of thefactors that market participants would take into account in pricing a transaction.
All assets and liabilities for which fair value is measured or disclosed in the financial statements are categorized within thefair value hierarchy, described as follows, based on the lowest level input that is significant to the fair value measurementas a whole:• Level 1 — Quoted (unadjusted) market prices in active markets for identical assets or liabilities• Level 2 — Valuation techniques for which the lowest level input that is significant to the fair value measurement is directlyor indirectly observable• Level 3 — Valuation techniques for which the lowest level input that is significant to the fair value measurement isunobservable Information on the Bank’s fair value hierarchy is provided in note 4.
The best evidence of the fair value of a financial instrument on initial recognition is normally the transaction price - i.e. thefair value of the consideration given or received. If the Bank determines that the fair value on initial recognition differs fromthe transaction price and the fair value is evidenced neither by a quoted price in an active market for an identical asset orliability nor based on a valuation technique for which any unobservable inputs are judged to be insignificant in relation tothe measurement, then the financial instrument is initially measured at fair value, adjusted to defer the difference betweenthe fair value on initial recognition and the transaction price. Subsequently, that difference is recognised in profit or loss onan appropriate basis over the life of the instrument but no later than when the valuation is wholly supported by observablemarket data or the transaction is closed out. If an asset or a liability measured at fair value has a bid price and an ask price,then the Bank measures assets and long positions at a bid price and liabilities and short positions at an ask price.
The fair value of a financial liability with a demand feature (e.g. a demand deposit) is not less than the amount payable ondemand, discounted from the first date on which the amount could be required to be paid.
5 CRITICAL ACCOUNTING ESTIMATES AND JUDGEMENTS IN APPLYING ACCOUNTING POLICIES
The preparation of financial statements involves management estimates and assumptions that may affect the reportedamounts of assets and liabilities within the next financial year. Estimates and judgments are continually evaluated basedon historical experience and other factors, including expectations of future events that are believed to be reasonable underthe circumstances.
The Bank reviews its loan portfolio regularly to assess whether a provision for impairment should be recorded in theincome statement. In particular, considerable judgment by management is required in the estimation of the amount andtiming of future cash flows when determining the level of provisions required. Such estimates are necessarily subjectivebased on assumptions about several factors involving varying degrees of judgment and uncertainty. Consequently, actualresults may differ resulting in future changes to such provisions.
Page 15
F-19

AFRICAN EXPORT-IMPORT BANK
NOTES TO THE SPECIAL PURPOSE FINANCIAL STATEMENTSFOR THE SIX-MONTHS PERIOD ENDED 30 JUNE 2019 (CONTINUED)
31 December30 June 2019 2018
6 CONTINGENT LIABILITIES AND COMMITMENTS US$000 US$000
6.1 Contingent Letters of credit 1 351 630 421 559Guarantees 1 281 227 436 466
2 632 857 858 025
7 DERIVATIVE FINANCIAL INSTUREMENTS
The Bank enters into interest rate swaps and foreign exchange forward contracts to hedgeits exposure to changes in the fair value and cash flows attributable to changes in marketinterest and exchange rates on its assets and liabilities. The table below shows the fairvalues of derivative financial instruments, recorded as assets or liabilities.
Derivative assetsInterest rate swap 5 645 1 520Foreign exchange forward contracts 550 577Cross currency swap 433 1 587
6 628 3 684
Derivative liabilitiesInterest rate swap 8 569 24 840Foreign exchange forward contracts 720 -
9 289 24 840
Swaps are contractual agreements between two parties to exchange streams of paymentsover time based on specified notional amounts, in relation to movements in a specifiedunderlying index such as interest rates, foreign currency rate or equity index.
Interest rate swaps relate to contracts taken out by the Bank with other financial institutions inwhich the Bank either receives or pays a floating rate of interest in return for paying orreceiving, respectively, a fixed rate of interest. The payment flows are usually netted againsteach other, with the difference being paid by one party to the other.
In a foreign exchange swap, the Bank pays a specified amount in one currency and receivesa specified amount in another currency. Foreign exchange swaps are settled gross.
The following shows the notional value of interest rate derivative contracts
Interest rate derivative contractsInterest rate swap 1 275 000 1 275 000
8 PROPERTY AND EQUIPMENT
The table below analyses the details of the Bank's property and equipment.
Furniture Leasehold AssetsMotor and improve- under
Year ended Land Building Vehicles equipment ments construction Total31 December 2018 US$000 US$000 US$000 US$000 US$000 US$000 US$000
CostCost/valuation as at 1 January 2018 5 908 23 161 809 10 218 1 034 875 42 005Additions - 217 84 847 - 364 1 512Capitalisation ofassets underconstruction - - - - ( 217) ( 217)Revaluation 7 506 1 985 - - - - 9 491Transfer* - ( 2 502) - - - - ( 2 502)
Cost/valuation as at31 December 2018 13 414 22 861 893 11 066 1 034 1 022 50 289
Page 16
F-20

AFRICAN EXPORT-IMPORT BANK
NOTES TO THE SPECIAL PURPOSE FINANCIAL STATEMENTSFOR THE SIX-MONTHS PERIOD ENDED 30 JUNE 2019 (CONTINUED)
8 PROPERTY AND EQUIPMENT (continued)
Furniture Leasehold AssetsMotor and improve- under
Year ended Land Building Vehicles equipment ments construction Total31 December 2018 US$000 US$000 US$000 US$000 US$000 US$000 US$000
Accumulated depreciationAccumulateddepreciation as at 1January 2018 - - ( 373) ( 7 763) ( 1 031) - ( 9 167)Charge for the year - ( 2 502) ( 129) ( 1 185) ( 3) - ( 3 818)Disposals - - - - - - -Transfer* - 2 502 - - - - 2 502
Total accumulateddepreciation as at 31December 2018 - - ( 502) ( 8 948) ( 1 034) - ( 10 483)
Net carrying amountas at 31 December2018 13 414 22 861 391 2 118 - 1 022 39 806
Period ended30 June 2019
CostCost/valuation as at 1 January 2019 13 414 22 861 893 11 066 1 034 1 022 50 290Additions - - - 255 - 592 847Disposals - - ( 11) - - ( 11)
Cost/valuation as at30 June 2019 13 414 22 861 893 11 310 1 034 1 614 51 126
Accumulated depreciationAccumulateddepreciation as at 1January 2019 - - ( 502) ( 8 948) ( 1 034) - ( 10 484)Charge for the period - ( 1 300) ( 71) ( 629) - - ( 2 000)Disposals - - - 11 - - 11
Total accumulateddepreciation as at 30June 2019 - ( 1 300) ( 573) ( 9 566) ( 1 034) - ( 12 473)
Net carrying amountas at 30 June 2019 13 414 21 561 320 1 744 ( 0) 1 614 38 653
31 December30 June 2019 2018
9 INTANGIBLE ASSETS US$000 US$000
Cost 1 January 9 535 3 935Additions 1 288 456Software in progress 2 936 5 144
Cost at 30 June / 31 December 13 759 9 535
Accumulated amortizationAs at 1 January ( 3 187) ( 2 687)Amortization charges for the period / year ( 373) ( 500)
As at 30 June / 31 December ( 3 560) ( 3 187)
Net value as 30 June / 31 December 10 199 6 348
Page 17
F-21

AFRICAN EXPORT-IMPORT BANK
NOTES TO THE SPECIAL PURPOSE FINANCIAL STATEMENTSFOR THE SIX-MONTHS PERIOD ENDED 30 JUNE 2019 (CONTINUED)
10 CAPITAL MANAGEMENT
The Bank’s objectives when managing capital, which is a broader concept than the equity on the face of statement of financial position, are:
• To maintain a set minimum ratio of total capital to total risk weighted assets. The Bank’s minimum risk asset ratio is atleast three per cent above minimum ratio prescribed from time to time by the Basel Committee on Banking Supervision;• To safeguard the Bank’s ability to continue as a going concern so that it can continue to provide returns to shareholdersand benefits to other stakeholders; and• To maintain a strong capital position necessary for its long term financial health, and to support the development of itsbusiness.
The Bank is not subject to capital requirements by a regulatory body such as a central bank or equivalent. However,management has established a capital management policy that is based on maintenance of certain capital adequacy ratioin line with Basel Committee requirements.
Capital adequacy is reviewed regularly by management using techniques based on the guidelines developed by Basel
of capital.The Bank’s capital is divided into two tiers:• Tier 1 capital: Share capital, share premium, retained earnings and reserves created by appropriations of retainedearnings and revaluation reserve.• Tier 2 capital: Collective impairment allowances.
The risk-weighted assets is measured by means of a hierarchy of seven risk weights classified according to its nature andreflecting an estimate of credit, market and other risks associated with each asset and counterparty. A similar treatment isadopted for off-statement of financial position exposures.
The table below summarizes the composition of capital and the ratio of the Bank’s capital for the period ended 30 June.31 December
30 June 2019 2018US$000 US$000
Capital adequacyShare capital 513 096 506 300Share premium 786 715 764 790Warrants 166 756 191 531General reserves 551 228 551 228Retained earnings 640 218 502 585
Total Tier 1 capital 2 658 013 2 516 434
Asset revaluation reserve 12 741 12 741Collective impairment allowance 153 945 107 898
Total Tier 2 capital 166 686 120 639
Total capital base 2 824 699 2 637 073
Risk weighted assetsOn-statement of financial position 10 073 200 9 023 048Off-statement of financial position:Credit risk 1 476 289 784 148Operational risk 729 572 729 572Market risk 36 511 774
Total risk weighted assets 12 315 572 10 537 542
Basel capital adequacy ratio (Total capital base/Total risk weighted assets) 23% 25%
11 OPERATING SEGMENTS
The Bank is a multilateral trade finance institution whose products and services are similar in nature, and are structured anddistributed in a fairly uniform manner across borrowers. The Bank's primary reporting format for business segmentsincludes Lending and Treasury operations. Lending activities represent investments in facilities such as loans, letters ofcredit and guarantees, which promote intra and extra African trade. Treasury activities include raising debt finance, investingsurplus liquidity and managing the Bank's foreign exchange and interest rate risks.
Lending Treasury Total Lending Treasury Total31 December 31 December 31 December
30 June 2019 30 June 2019 30 June 2019 2018 2018 2018US$000 US$000 US$000 US$000 US$000 US$000
Statement of profit or loss and other comprehensive incomeInterest income 449,092 24,273 473,365 673,098 36 381 709,478Net fees and commission 21,828 (1,567) 20,261 90,162 (6,474) 83,688Other operating income 516 (34) 482 2,485 (164) 2,321Total segment revenue 471,436 22,672 494,108 765,745 29 743 795,487Less: interest expense (229,440) (229,440) - (305,654) (305,654)Foreign exchange adjustments & Fair value adjustment 13,379 (1,179) 12,200 (8,184) 721 (7,463)Less: personnel and other admin. expenses (45,671) 1,981 (43,690) (86,857) 3 581 (83,276)Less: depreciation and amortization (2,298) (77) (2,375) (4,175) (140) (4,315)Segment income before impairment 436,846 (206,043) 230,803 666,529 ( 271 749) 394,779Less: loan impairment charges (93,170) - (93,170) (118,877) - ( 118 877)Less: provisions - - - - - -Net income for the period / year 343,676 (206,043) 137,633 547,652 ( 271 749) 275 902
Financial PositionSegment assets 13,001,225 2,369,230 15,370,455 11,350,883 2,068,486 13,419,370Capital expenditures - - - - - - Total assets at period / year end 13,001,225 2,369,230 15,370,455 11,350,883 2,068,486 13,419,370Segment liabilities 3,102,203 9,566,926 12,669,129 2,659,120 8,200,501 10,859,623Capital funds - - 2701326 - - 2,559,747Total liabilities and capital funds 3,102,203 9,566,926 15,370,455 11,350,883 2,068,486 13,419,370
The segment income are 100% external, thus there are no inter-segment income. The Bank did not have any transactions with a single customer exceeding 10% of the Bank's total revenue.
Page 18
F-22

AFRICAN EXPORT-IMPORT BANK
NOTES TO THE SPECIAL PURPOSE FINANCIAL STATEMENTSFOR THE SIX-MONTHS PERIOD ENDED 30 JUNE 2019 (CONTINUED)
12 RELATED PARTY TRANSACTIONS
The details of related party transactions are as follows:Key management personnel compensationSalaries and benefits to management personnel
Compensation paid to the Bank's executive officers and directors during the period is as follows: 30 June 2019 30 June 2018US$000 US$000
Salaries and short-term benefits 4,963 6,431Other long-term benefits 2,331 1,640Post-employment benefits 2,547 529Termination benefits 335 117
10,176 8,717
Short -term benefits above include meeting allowances for Board members and staff allowances for children's education, dependency, home leave and housing. Loans and advances to management personnel
30 June 2019 30 June 2018US$000 US$000
Balance as at I January 245 193Loan disbursements during the period 395 345Loan repayments during the period (383) (351)Balance 257 186
13 FAIR VALUE OF FINANCIAL ASSETS AND LIABILITIES
(a) Financial instruments not measured at fair value
(b) Financial instruments measured at fair value disclosed in (note 7)
Fair value hierarchy
There were no transfers during the period
Level 2 31 December30 June 2019 2018
US$000 US$000AssetsInterest rate swap 5,645 1,520Foreign exchange forward contracts 550 577Cross Currency Swap 433 1,587
6,628 3,684 LiabilitiesInterest rate swap (8,569) (24,840)Foreign exchange forward contracts (720) -
(9,289) (24,840)(2,661) (21,156)
Loans and advances to customers at FVTPL 129,783 129,783
(ii) The table below shows the fair values of non-financial assets measured at fair value at year-end.
31 DecemberLevel 3 30 June 2019 2018
US$000 US$000Revalued property and equipmentLand and building 34,975 36,275
The Bank's principal related parties are its shareholders. The Bank transacts commercial business such as loans and deposits directly with the shareholders themselves and institutions which are either controlled by the shareholder governments or over which they have significant influence.
The Bank provides loans and advances to its staff, including those in management. Such loans and advances are guaranteed by the staff terminal benefits payable at the time of departure from the Bank. The staff loans and advances are interest bearing and are granted in accordance with the Bank's policies. The movement in loans and advances to management during the period / year was as follows:
Fair value is the price that would be received to sell an asset or paid to transfer a liability in an ordinary transaction between market participants at the measurement date. The fair values of financial instruments not recognized on the statement of financial position are the same figures appearing as contingent liabilities and commitments.
• Financial Liabilities
• Loans and advances to customers and financial investments at amortised costLoans and advances are net of charges for impairment. The estimated fair value of loans and advances and financial investments represents the discounted amount of estimated future cash flows expected to be received. Expected cash flows are discounted at current market rates to determine fair value.• Debt securities in issueThe aggregate fair values are calculated based on quoted prices. For those notes were quoted market prices are not available, a discounted cash flow model is used.
• Other assets and other liabilities The carrying amounts of these balances approximate their fair values.• Debt securities in issueThe aggregate fair values are calculated based on quoted prices. For those notes were quoted market prices are not available, a discounted cash flow model is used.
IFRS 13 specifies a hierarchy of valuation techniques based on whether the inputs to those valuation techniques are observable or unobservable. Observable inputs reflect market data obtained from independent sources; unobservable inputs reflect the Bank’s market assumptions. These two types of inputs have created the following fair value hierarchy:
• Level 1 – Quoted prices (unadjusted) in active markets for identical assets or liabilities. This level includes listed equity securities and debt instruments on exchanges (for example, London Stock Exchange, Frankfurt Stock Exchange, New York Stock Exchange) and exchange traded derivatives like futures (for example, Nasdaq, S&P 500).
• Level 2 – Inputs other than quoted prices included within Level 1 that are observable for the asset or liability, either directly (that is, as prices) or indirectly (that is, derived from prices). This level includes the majority of the OTC derivative contracts, traded loans and issued structured debt. The source of input parameters like LIBOR yield curve or counterparty credit risk is Bloomberg.
• Level 3 – Inputs for the asset or liability that are not based on observable market data. This level includes equity investments and debt instruments with significant unobservable components. Thishierarchy requires the use of observable market data when available. The Bank considers relevant and observable market prices in its valuations where possible.
(i) The table below shows the fair values of financial assets and liabilities measured at fair value at peirod / year-end.
Page 19
F-23

AFRICAN EXPORT-IMPORT BANK
NOTES TO THE SPECIAL PURPOSE FINANCIAL STATEMENTSFOR THE SIX-MONTHS PERIOD ENDED 30 JUNE 2019 (CONTINUED)
31 DecemberLevel 2 30 June 2019 2018
US$000 US$000Financial assetsLoans and advances 11,787,305 11,420,557
Financial liabilitiesDue to banks 6,526,015 5,498,410Debt securities in issue (gross) 4,045,742 3,016,768
10,571,757 7,385,961
Revalued property and equipment
31 December30 June 2019 2018
US$000 US$000Valuation as at 1 January 36,275 29,069 Addition in the period / year - 217 Total gain / (loss)recorded in other comprehensive income - 9,491 Accumulated depreciation eliminated on revaluation (1,300) (2,502) Valuation as end of period / year 34,975 36,275
Impact on fair value of level 3 non financial assets due to changes in key assumptions
Carrying amount Effect of 10% Carrying amount Effect of 10% US$000 US$000 US$000 US$000
Property and equipment 34,975 3,497 36,275 3,627
31 December30 June 2019 2018
14 CASH AND CASH EQUIVALENTS US$000 US$000
Cash in hand 88 101Deposits with other banks 594 895 612 757Money market placements 3 010 406 1 305 626
Gross 3 605 389 1 918 484Less: allowance for impairment 12 months ECL ( 50) ( 50)
Net cash and cash equivalents 3 605 339 1 918 434
15 LOANS AND ADVANCES TO CUSTOMERS 30 June 2019Loans and advances to customers at amortised cost Stage 1 Stage 2 Stage 3 US$000
Gross amount 8 465 683 2 273 958 901 742 11 641 38312months ECL ( 47 847) - - ( 47 847)Lifetime ECL not credit impaired - ( 164 513) - ( 164 513)Lifetime ECL credit impaired - - ( 163 778) ( 163 778)
Net loans and advances to customers 8 417 836 2 109 445 737 964 11 265 245
31 December2018
US$000Loans and advances to customers at amortised cost Stage 1 Stage 2 Stage 3 Total
Gross amount 8 569 670 1 775 476 929 913 11 275 05912months ECL ( 47 849) - - ( 47 849)Lifetime ECL not credit impaired - ( 60 049) - ( 60 049)Lifetime ECL credit impaired - - ( 162 520) ( 162 520)
Net loans and advances to customers 8 521 821 1 715 427 767 393 11 004 641
31 DecemberLoans and advances to customers at FVTPL 30 June 2019 2018These loans and advances relate to Syndicated loans in which the Bank acted as lead US$000 US$000arranger.
129 783 129 783
129 783 129 783
Total loans and advances to customers 11 395 028 11 134 424
Net loans and advances to customersCurrent 7 407 698 7 208 168Non-current 3 987 330 3 926 256
11 395 028 11 134 424
15.1 ALLOWANCE FOR IMPAIRMENTCredit-impaired financial assetsThe following table sets out a reconciliation of changes in the net carrying amount ofcredit-impaired loans and advances to customers
Credit-impaired loans and advances to customers at 1 January 174 426 150 750Change in allowance for impairment ( 1 258) ( 96 991)Classified as credit-impaired during the period / year 269 795 288 782Transferred to not credit-impaired during the period / year ( 255 552) ( 93 808)Net repayments ( 3 342) ( 74 307)
(iii) The table below shows the assets and liabilities for which fair values are disclosed.
(iv) Movements in level 3 non financial assets measured at fair value
Land and building
Total gains or losses for the period are included in profit or loss as well as total gains relating financial instruments designated at fair value depending on the category of the related asset/ liability.
The following table shows a reconciliation of the opening and closing amounts of level 3 non-financial assets which are recorded at fair value:
The following methods and assumptions were used to estimate the fair values:• The Bank enters into derivative financial instruments with various counterparties, principally financial institutions with investment grade credit ratings. Derivatives valued using valuation techniques with market observable inputs are mainly interest rate swaps and foreign exchange forward contracts. The most frequently applied valuation techniques include forward pricing and swap models, using present value calculations. The models incorporate various inputs including the credit quality of counterparties, foreign exchange spot and forward rates, interest rate curves and forward rate curves. The changes in counterparty credit risk had no material effect on the hedge effectiveness assessment for derivatives designated in hedge relationships and other financial instruments recognized at fair value.
201830 June 201931 December
The significant unobservable valuation input used in obtaining the value of the land and building was annual market rentals of similar properties. The table below shows the impact on the fair value of the land and building assuming that the annual market rentals increase or decrease by 10%. The positive and negative effects are approximately the same.
Page 20
F-24

Credit-impaired loans and advances to customers 184 069 174 426
Page 21
F-25

AFRICAN EXPORT-IMPORT BANK
NOTES TO THE SPECIAL PURPOSE FINANCIAL STATEMENTSFOR THE SIX-MONTHS PERIOD ENDED 30 JUNE 2019 (CONTINUED)
31 December30 June 2019 2018
US$000 US$00016 DUE TO BANKS
Money market placements 1 438 785 614 260Loans from financial institutions 4 671 265 4 533 684
6 110 050 5 147 944Due to banksCurrent 2 743 446 2 055 023Non-current 3 366 604 3 092 921
6 110 050 5 147 945
17 DEPOSITS AND CUSTOMER ACCOUNTS
Shareholders' deposits for shares 9 359 9 307Deposit accounts 751 096 195 932Customer accounts 2 411 728 2 160 146
3 172 183 2 365 385
Deposit and customer's accountsCurrent 3 172 183 2 365 385Non-current - -
3 172 183 2 365 385
In terms of customer group, the deposits and customer accounts above were from sovereigns, enterprises and financialinstitutions. The fair value of the deposits of customer accounts approximate the carrying amount, as they have variableinterest rates.
18 DEBT SECURITIES IN ISSUE
The Bank issued, under the Euro Medium Term Note Programme (EMTN), US$ 3,036.50 million bonds with differentmaturities and coupon rates. Further, the Bank issued under an EMTN Programme, US$186.5 million private placement withfloating rate. Fitch Ratings and Moody's assigned these bonds an investment grade rating BBB-, and Baa2 respectively.
Debt securities at amortised cost:Coupon 30/6/2019 31/12/2018 Date of Date of
(%) US$000 US$000 issuance maturity
Fixed rate debt securities due 2018 3.88 - - Jun 2013 Jun 2018Fixed rate debt securities due 2019 4.75 700 000 700 000 Jul 2014 Jul 2019Fixed rate debt securities due 2021 4.00 900 000 900 000 Oct 2016 May 2021Fixed rate debt securities due 2023 4.00 500 000 500 000 Oct 2018 Oct 2023Fixed rate debt securities due 2024 4.13 750 000 750 000 Jun 2017 Jun 2024Floating rate private placement note due 2021 41 500 41 500 Dec 2014 Mar 2016Floating rate private placement note due 2022 145 000 145 000 Jul 2017 Jul 2021Less: Discount on bond payable ( 7 954) ( 9 873) Jul 2018 Aug 2022Add: Premium on bond payable 853 1 090
3 029 399 3 027 717
31 December30 June 2019 2018
US$000 US$00019 OTHER LIABILITIES AND PROVISIONS
Financial guarantee contracts issued 983 1 645Loan commitments issued 2 215 7 171 Letter of credits 39 343 Other liabilities recognised 344 971 284 578
348 208 293 737
Other liabilities and provisionsCurrent 39 167 38 799Non-current 309 041 254 938
348 208 293 737
20 SHARE CAPITAL
The share capital of the bank is divided into four classes of which A,B and C classes are payable in five equal instalments, ofwhich the first two instalments have been called up. Class D shares are fully paid at time of subscription. Shareholders canuse their dividend entitlement to acquire more shares.
Class A are shares which may only be issued to (a) African states, either directly or indirectly through their central banks orother designated institutions, (b) the African Development Bank, and ( c ) African regional and sub regional institutions;
Class B are shares which may only be issued to African public and private commercial banks, financial institutions andAfrican public and private investors; and
Class C are shares which may only be issued to (a) international financial institutions and economic organisations; (b) nonAfrican or foreign owned banks and financial institutions; and non African public and private investors.
Class D are shares which may be issued in the name of any person.31 December
30 June 2019 2018Authorised capital US$000 US$000500,000 ordinary shares of US$10,000 each 5,000,000 5,000,000
Paid in share capitalPaid in capital -class A 270,688 270,264Paid in capital -class B 127,072 120,700Paid in capital -class C 46,236 46,236Paid in capital -class D 69,100 69,100
513,096 506,300
Page 22
F-26

AFRICAN EXPORT-IMPORT BANK
NOTES TO THE SPECIAL PURPOSE FINANCIAL STATEMENTSFOR THE SIX-MONTHS PERIOD ENDED 30 JUNE 2019 (CONTINUED)
21 SHARE PREMIUMPremiums from the issue of shares are reported in the share premium accountThe movement in share premium account is summarised as follows:
30 June 30 June 31 December 31 December2019 2019 '2018 '2018
No. of shares US$000 No. of shares US$000At January 116,210 764,790 107,687 562,350Paid up from dividends during the period/year 37 520 1,595 22,082Paid up in cash during the period/year 1,699 23,344 6,928 189,852Transaction cost of raising equity - (1,939) - (9,494)At 30 June/31 December 117,946 786,715 116,210 764,790
22 WARRANTS30 June 30 June 31 December 31 December
No. of warrants US$000 No. of warrants US$000At 1 January 5,284 191,532 2,515 91,723Retirement during the period / year (743) (24,776) (2,515) (91,723)Issued during the period / year - - 5,284 191,531At 30 June / 31 December 4,541 166,756 5,284 191,532
23 RESERVES
Nature and purpose of reserves
a. General reserveThe general reserve is set up in accordance with the Bank's policy in order to cover general banking risks, including futurelosses and other unforeseeable risks or contingencies. Each year the Bank transfers 50% . of profit after deduction ofdividends to general reserves
b. Asset revaluation reserveThe revaluation reserve is used to record increases in the fair value of land and building and decreases to the extent thatsuch decrease relates to an increase on the same asset previously recognised in equity. An annual transfer from the assetrevaluation reserve to retained earnings is made for the difference between depreciation based on the revalued amount ofthe asset and depreciation based on the asset original cost. When revalued assets are sold, the portion of the revaluationreserve that relates to those assets is effectively realised and transferred directly to retained earnings.
c. Cash flow hedge reserveThe cash flow hedge reserve represents the cumulative effective portion of gains or losses arising from changes in fair valueof hedging instruments entered into for cash flow hedges. The cumulative gain or loss arising on changes in fair value of thehedging instruments that are recognised and accumulated under the heading of cash flow hedge reserve will bereclassified to profit or loss only when the hedged transaction affects the profit or loss, or included as a basis adjustment tothe non-financial hedged item, consistent with the relevant accounting policy.
d. Project preparation facility Fund reserve The Project Preparation Facility Fund was approved by the Board in December 2018 for the purposes of setting funds asideto be utilized by the Bank during project preparation phase. Project preparation phase will comprise the entire set of activitiesundertaken to progress a project from conceptualization through concept design to financial close. It will entail the provisionof technical and financial support services - such as technical, environmental, market, financial, legal and regulatory,advocacy services that may be required to a point where the project can attract revenue from investors (both debt and equity).The Project Preparation Facility Fund was approved for a total amount of USD15 million to be appropriated from the Bank’sprofits equally over two years from 2017 to 2018. The fund will be operated on a full cost recovery revolving basis and solelydeployed towards project preparation work and related activities.
30 June 2019 30 June 201824 INTEREST AND SIMILAR INCOME US$000 US$000
Loans and advances 438 838 297 656Interest on money market investments 28 915 16 403Interest on investments amortised cost 5 612 750
473 365 314 809
25 INTEREST AND SIMILAR EXPENSE
Due to banks 160 305 137 291Debt securities in issue 69 135 1 981Shareholder and customer deposits - -
229 440 139 272
26 FEES AND COMMISSION INCOME
Advisory fees 17 235 22 125Commission on lines of credits 4 727 2 379Guarantee fees 2 413 3 639Structuring Fees 99 97
24 474 28 240
27 FEES AND COMMISSION EXPENSE
Bond issue fees 206 611Legal and agency fees 3 053 3 576Other fees paid 954 1 014
4 213 5 201
28 OTHER OPERATING INCOME
Rental income 145 413Other income 337 899
482 1 312
Page 23
F-27

AFRICAN EXPORT-IMPORT BANK
NOTES TO THE SPECIAL PURPOSE FINANCIAL STATEMENTSFOR THE SIX-MONTHS PERIOD ENDED 30 JUNE 2019 (CONTINUED)
30 June 2019 30 June 201829 PERSONNEL EXPENSES US$000 US$000
Personnel expenses are made up as follows:Wages and salaries 17 112 13 418Staff provident fund costs 1 785 1 503Other employee benefits 6 457 6 090
25 354 21 011
30 GENERAL AND ADMINISTRATIVE EXPENSE
General and administrative expenses are made up as follows:Operational missions and statutory meetings 6 514 8 759Professional service fees 5 004 4 424Communications 1 488 1 375Other general and administrative expenses 5 330 3 217
18 336 17 775
31 EARNINGS PER SHARE
30 June 2019 30 June 2018US$000 US$000
137 633 75 507
51 206 48 178
122 613 111 766
2.69 1.57
1.12 0.68
Earnings per share are calculated by dividing the net income attributable to equity holders of the Bank by the weightedaverage number of ordinary shares in issue during the year.
Net income attributable to equity holders of the Bank have been calculated on the basis of assuming that all the net incomefor the year is distributed.
Net income attributable to equity holders of the bank
Weighted average number of ordinary shares in issue (basic)
Weighted average number of ordinary shares in issue (diluted)
Basic earnings per share (expressed in US$000 per share)
Diluted earnings per share (expressed in US$000 per share)
32 APPROVAL FOR CONDENSED INTERIM FINANCIAL STATEMENTSThe condensed interim special purpose financial statements were approved by the
33 EVENTS AFTER THE REPORTING PERIODThere were no significant events after the statement of financial position date that have a bearing on the understanding of these financial statements.
Page 24
F-28
Africa Export Import Bank
Special Purpose Financial Statements for the yearended 31 December 2018
F-29

INDEPENDENT AUDITORS’ REPORT
TO THE BOARD OF DIRECTORS OF AFRICAN EXPORT IMPORT BANK
Report on the Special Purpose Financial Statements
Opinion
We have audited the special purpose financial statements of African Export Import Bank (the “Bank”) which comprise the special purpose statements of financial position as at 31 December 2018, the special purpose statements of profit or loss and other comprehensive income, changes in equity and of cash flows for the year then ended, and notes, comprising significant accounting policies and other explanatory information.
In our opinion, the accompanying special purpose financial statements present fairly, in all material respects, the financial position of African Export Import Bank as at 31 December 2018, and its financial performance and its cash flows for the year then ended in accordance with International Financial Reporting Standards (IFRS).
Basis for Opinion
We conducted our audit in accordance with International Standards on Auditing (ISAs). Our responsibilities under those standards are further described in the Auditors' Responsibilities for the Audit of the Special Purpose Financial Statements section of our report. We are independent of the Bank in accordance with International Ethics Standards Board for Accountants Code of Ethics for Professional Accountants (IESBA Code) and we have fulfilled our other ethical responsibilities in accordance with these requirements. We believe that the audit evidence we have obtained is sufficient and appropriate to provide a basis for our opinion.
Emphasis of Matter - Basis of Accounting and Restriction on Use and Distribution
We draw attention to Note 2.1 “Basis of preparation” to the special purpose financial statements, the special purpose financial statements are prepared to be included in a registration document for the proposed offering to investors of global depository receipts “GDRs” representing interests in class D shares of the Bank for trading in London Stock Exchange. As a result, the special purpose financial statements may not be suitable for another purpose. Our report is intended solely to be included in the GDR registration document. Our opinion is not modified in respect of this matter.
Key Audit Matters
Key audit matters are those matters that, in our professional judgment, were of most significance in our audit of the special purpose financial statements of the current period. These matters were addressed in the context of our audit of the special purpose financial statements as a whole, and in forming our opinion thereon, and we do not provide a separate opinion on these matters.
F-30

Key audit matter How our audit addressed the key audit matter
Expected credit losses on financial assets Refer to Note 2.2.1 - Changes in accounting policies - IFRS 9 and IFRS 15, Note 2.2.2. - Financial instruments - Accounting policies applicable after 1 January 2018, Note 3-Financial instruments and risk management, Note 6 - Critical accounting estimates and judgments in applying accounting policies, Note 17 - Loans and advances to customers, Note 20 - Financial investments at amortised cost, Note 16 - Cash and Cash equivalents, Note 18 - Prepayments and accrued income, and note 19 - Other assets.
The Bank adopted IFRS 9 - Financial Instruments (IFRS 9) for the first time in the 2018 reporting period (Previously, IAS 39 - Financial Instruments: Recognition and Measurement was applied). As a result, the accounting policies applicable to financial instruments have been amended accordingly.
Upon transition to IFRS 9, a US$ 130 million adjustment was made to decrease retained earnings, representing 6% of the total equity of the Bank as at 31 December 2018, which is a material portion of the special purpose statement of financial position.
IFRS 9 requires the recognition of expected credit losses (ECLs) on all financial assets and off balance sheet exposures within the scope of its impairment model.
The ECL on loans and advances and investments at amortised cost are measured using a three-stage model which is outlined in Note 2.2.2.
The impairment of financial assets was considered to be a matter of most significance in the current year audit due to the following:
● The first time adoption of IFRS 9 by the Bank.● Judgment applied by management in
determining the ECL, particularly in relation to:
● classifying exposures into therelevant impairment stage (as informed by significant increase
Our audit of the expected credit losses on financial assets included the following procedures: We assessed the appropriateness of accounting policies and evaluated the impairment methodologies applied by the Bank against the requirements of IFRS 9.
We utilised our experts to assess whether the models used by the Bank complied with IFRS 9.
We assessed the design and implementation, and tested the operating effectiveness of controls over the following areas:
● the modelling process, includinggovernance over monitoring of themodels and approval of keyassumptions;
● the classification of financial assets andoff balance sheet exposures into thevarious stages of impairment ; and
● the integrity of data inputs into the ECLmodel.
For a sample of borrowers, we assessed the classification into an impairment stage with reference to the Bank’s criteria for determination of SICR and identification of impaired or default exposures.
For a sample of exposures, we assessed the reasonableness of the credit risk grade applied by management by discussing the credit rating report with management, obtaining an understanding of the assumptions used and comparing these assumptions
F-31

in credit risk (SICR), number of days in arrears and default status);
● determining credit risk grade;
with the financial information and other publicly available information relating to the borrower.
We agreed the inputs used in the model including the exposures at default, the type of product and the effective interest rate to the information in the credit portfolio.
We assessed the judgment applied by management in determining the PD, LGD and EAD against credit ratings, historical performance of exposures, contractual terms and other appropriate data.
● determining the probability ofdefault (PD), loss given default(LGD), and exposure at default(EAD); and
● application of overlays.● Extensive disclosure requirements resulting
from the adoption of IFRS 9 and the relatedincremental disclosures of IFRS 7.
The Bank’s financial assets, both on and off balance sheet, subject to credit risk were US$ 14,814 million, as at 31 December 2018, which represents a material portion of the special purpose statement of financial position.
Furthermore, the total impairment recognised by the Bank on these financial assets amounted to US$ 296 million, for the year ended 31 December 2018.
Where management overlays were used, we assessed these against our understanding of relevant external factors such as the economic environment affecting the Bank’s customers.
We tested the mathematical accuracy of the expected credit losses for a sample of loans.
We assessed the adequacy of disclosures in the special purpose financial statements against the requirements of IFRS 9.
Responsibilities of Management and Those Charged with Governance for the Special Purpose Financial Statements
Management is responsible for the preparation and fair presentation of the special purpose financial statements in accordance with IFRS and for such internal control as management determines is necessary to enable the preparation of special purpose financial statements that are free from material misstatement, whether due to fraud or error.
In preparing the special purpose financial statements, management is responsible for assessing the Bank’s ability to continue as a going concern, disclosing, as applicable, matters related to going concern and using the going concern basis of accounting unless management either intends to liquidate the Bank or to cease operations, or has no realistic alternative but to do so.
Those charged with governance are responsible for overseeing the Bank’s financial reporting processes.
F-32

Auditors’ Responsibilities for the Audit of the Special Purpose Financial Statements
Our objectives are to obtain reasonable assurance about whether the special purpose financial statements as a whole are free from material misstatement, whether due to fraud or error, and to issue an auditors’ report that includes our opinion. Reasonable assurance is a high level of assurance, but is not a guarantee that an audit conducted in accordance with ISAs will always detect a material misstatement when it exists. Misstatements can arise from fraud or error and are considered material if, individually or in the aggregate, they could reasonably be expected to influence the economic decisions of users taken on the basis of these special purpose financial statements. As part of an audit in accordance with ISAs, we exercise professional judgment and maintain professional skepticism throughout the audit. We also:
● Identify and assess the risks of material misstatement of the special purpose financial statements,whether due to fraud or error, design and perform audit procedures responsive to those risks, and obtainaudit evidence that is sufficient and appropriate to provide a basis for our opinion. The risk of notdetecting a material misstatement resulting from fraud is higher than for one resulting from error, asfraud may involve collusion, forgery, intentional omissions, misrepresentations, or the override ofinternal control.
● Obtain an understanding of internal control relevant to the audit in order to design audit procedures thatare appropriate in the circumstances, but not for the purpose of expressing an opinion on theeffectiveness of the Bank’s internal control.
● Evaluate the appropriateness of accounting policies used and the reasonableness of accountingestimates and related disclosures made by management.
● Conclude on the appropriateness of management’s use of the going concern basis of accounting and,based on the audit evidence obtained, whether a material uncertainty exists related to events orconditions that may cast significant doubt on the Bank’s ability to continue as a going concern. If weconclude that a material uncertainty exists, we are required to draw attention in our auditors’ report tothe related disclosures in the special purpose financial statements or, if such disclosures are inadequate,to modify our opinion. Our conclusions are based on the audit evidence obtained up to the date of ourauditors’ report. However, future events or conditions may cause the Bank to cease to continue as agoing concern.
● Evaluate the overall presentation, structure and content of the special purpose financial statements,including the disclosures, and whether the special purpose financial statements represent the underlyingtransactions and events in a manner that achieves fair presentation.
We communicate with those charged with governance regarding, among other matters, the planned scope and timing of the audit and significant audit findings, including any significant deficiencies in internal control that we identify during our audit.
We also provide those charged with governance with a statement that we have complied with relevant ethical requirements regarding independence, and to communicate with them all relationships and other matters that may reasonably be thought to bear on our independence, and where applicable, related safeguards.
F-33

From the matters communicated with those charged with governance, we determine those matters that were of most significance in the audit of the special purpose financial statements of the current year and are therefore the key audit matters. We describe these matters in our auditors’ report unless law or regulation precludes public disclosure about the matter or when, in extremely rare circumstances, we determine that a matter should not be communicated in our report because the adverse consequences of doing so would reasonably be expected to outweigh the public interest benefits of such communication.
Report on Other Legal and Regulatory Requirements
This report is required by Item 18.3.1 of Annex 1 of Commission Delegated Regulation (EU) 2019/980 (the ‘PR Regulation’). For the purposes of Item 1.2 of Annex 1 to the PR Regulation we are responsible for this report as part of the registration document and declare that, to the best of our knowledge, the information contained in this report is in accordance with the facts and that the report makes no omission likely to affect its import. This declaration is included in the registration document in compliance with Item 1.2 of Annex 1 of the PR Regulation.
The engagement partner on the audit resulting in this independent auditors’ report is Abdel Hadi M. Ibrahim.
…………………………………..KPMG Hazem Hassan Public Accountants & Consultants Smart Village – Building 105, KM 28 Cairo - Alex Desert Road, Giza, Egypt
Date: 7 October 2019.
F-34

African Export Import BankIndex to the Special Purpose financial statementsfor the year ended 31 December 2018
Note Note
Special Purpose Statement of financial position 7 Contingent Liabilities, Commitments and Lease Arrangements
Special Purpose Statement of profit or loss and other comprehensive income
7.1.1 Contingent liabilities
Special Purpose Statement of changes in equity 7.1.2 CommitmentsSpecial Purpose Statement of cashflows 7.2 Lease arrangements
7.2.1 Operating lease commitments-Bank as lessee
Notes to the Special Purpose financial statements 7.2.2 Operating lease commitments-Bank as lessor
1 General information 8 Interest and Similar Income2 Summary of significant accounting policies 9 Interest and Similar Expense
2.1 Basis of preparation 10 Fees and Commission Income2.2 Initial application of new amendments to the existing
Standards effective for 1 January 2018.11 Fees and Commission Expense
2.2..1 Change in Accounting Policies - IFRS 9 and IFRS 15 12 Other Operating Income
2.2.2 Financial Instruments - Accounting policies applicable after after 1 January 2018
13 Personnel Expenses
2.2.3 Financial Instruments - Accounting Policies applicable before 1 January 2018 - Comparative period
14 General and Administrative Expense
2.3 Offsetting of financial instruments 15 Earnings Per Share2.4 Cash and cash equivalent 15.1 Weighted average number of ordinary shares in
issue (basic)2.5 Fair value measurement 15.2 Weighted average number of ordinary shares in
issue (diluted)2.6 Debt securities in issue 16 Cash and Cash Equivalents2.7 Fees and Commission income 16.1 Money Market Placements2.8 Other operating income 17 Loans and Advances To Customers2.9 Operating expenses 17.1 Allowance For Impairment On Loans and
Advances and Impairment On Other Assets2.10 Dividends on ordinary shares 17.2 Impairment On Other Assets and Accrued
Income2.11 Foreign currencies 18 Prepayments and Accrued Income2.12 Property and equipment 19 Other Assets2.13 Intangible assets 20 Financial Investments At Amorted Cost (Held
To Maturity In 2017)2.14 Government grants 21 Due To Banks2.15 Earnings per share 21.1 Due To Banks2.16 Employee benefits 22 Debt Securities In Issue2.17 Provisions 23 Property and Equipment (Continued)2.18 Operating leases 24 Intangible Assets2.19 Warrants 25 Deposits and Customer Accounts2.20 New Standards and amendments to existing standards
in issue not yet adopted26 Other Liabilities and Provisions
3 Financial instruments and risk management 26.1 Other Liabilities Recognised Per Ias 373.10 Risk management 27 Share Capital3.20 Risk management structure 28 Share Premium3.30 Credit risk 29 Reserves
3.3.1 Credit Risk Exposure 30 Retained Earnings3.3.2 Amount Arising from Expeceted Credit Loss (ECL) 31 Dividends3.3.3 Allowance for impairment 32 Warrants3.3.4 Concentration risks of loans and advances to
customers with credit risk exposure33 Related Party Transactions
3.4 Market risk 34 Key Management Personnel Compensation3.4.1 Interest rate risk 35 Segment Reporting3.4.2 Foreign exchange risk exposure 35.1 Operating Segments
3.5 Liquidity Risk 36 Transition to IFRS - Financial assets and financial liabilities
3.6 Capital management 37 Taxation4 Fair value of financial assets and liabilities 38 Comparative Figures5 Derivatives held for risk management 39 Events After The Reporting Date6 Critical accounting estimates and judgements in
applying accounting policies40 Reclassification For Comparative Figures
41 Approval Of Financial Statements
F-35

AFRICAN EXPORT-IMPORT BANKSPECIAL PURPOSE STATEMENT OF FINANCIAL POSITIONAS AT 31 DECEMBER 2018
31/12/2018 31/12/2017Note US$000 US$000
ASSETS
Cash and cash equivalents 16 1,918,434 3,214,573 Derivative assets held for risk management 5 3,684 3,574 Loans and advances to customers 17 11,134,424 8,545,716 Prepayments and accrued income 18 134,358 82,329 Financial investments at amortised cost 20 168,328 - Financial investments at held to maturity 20 - 30,268 Other assets 19 13,988 2,931 Property and equipment 23 39,806 32,838 Intangible Assets 24 6,348 1,248 Total assets 13,419,370 11,913,477
LIABILITIES
Derivative liabilities held for risk management 5 24,840 21,467 Due to banks 21 5,147,944 4,231,374 Deposits and customer accounts 25 2,365,385 2,149,356 Debt securities in issue 22 3,027,717 2,881,622 Other liabilities 26 293,737 505,624 Total liabilities 10,859,623 9,789,443
CAPITAL FUNDS
Share capital 27 506,300 470,816 Share premium 28 764,790 562,350 Warrants 32 191,531 91,723 Reserves 29 594,541 474,733 Retained earnings 30 502,585 524,412 Total capital funds 2,559,747 2,124,034
Total liabilities and capital funds 13,419,370 11,913,477
Prof. Benedict Okey OramahChairman of the Board of Directors
The accompanying notes to the financial statements form part of this statement
The financial statements were approved by the Chairman on behalf of the Board of Directors on 7 October 2019 and signed on its behalf as follows:
F-36

AFRICAN EXPORT-IMPORT BANKSPECIAL PURPOSE STATEMENT OF PROFIT OR LOSS AND OTHER COMPREHENSIVE INCOMEFOR THE YEAR ENDED 31 DECEMBER 2018
2018 2017Note US$000 US$000
Interest and similar income using the effective interest method 8 709,478 606,074 Interest and similar expense using the effective interest method 9 (305,654) (267,749)
Net interest and similar income 403,824 338,325
Fee and commission income 10 93,717 39,245 Fee and commission expense 11 (10,029) (8,883) Net fee and commission income 83,688 30,362
Other operating income 12 2,321 3,439 Personnel expenses 13 (46,984) (38,758) General and administrative expenses 14 (36,292) (24,672) Depreciation and amortisation expense 24, 25 (4,315) (3,113) Exchange adjustments (2,337) (1,641) Fair value loss from financial instruments at FVTPL (5,126) (4,718) Cashflow hedges 30 - (13,476) Credit losses on financial instruments 17.1.b (118,877) (65,254)
PROFIT FOR THE YEAR 275,902 220,494
OTHER COMPREHENSIVE INCOMEOther comprehensive income to be reclassified to profit or loss in subsequent periods
Gains on revaluation of land and buildings 24 9,491 9,279
Total items that will not be reclassified to profit or loss in subsequent periods 9,491 9,279
Total other comprehensive income 9,491 9,279
TOTAL COMPREHENSIVE INCOME FOR THE YEAR 285,393 229,773
Earnings per shareBasic earnings per share (expressed in US$000 per share) 15 5.62 5.58 Diluted earnings per share (expressed in US$000 per share) 15 2.44 2.25
The accompanying notes to the financial statements form part of this statement.
2F-37
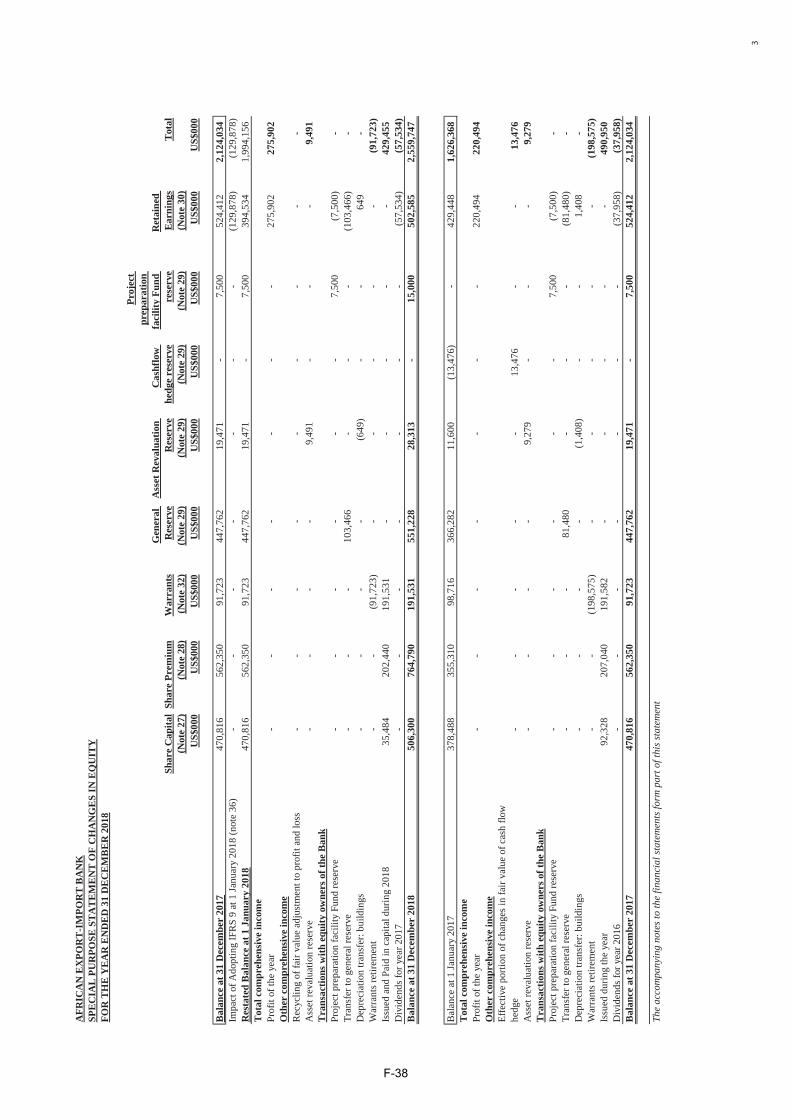
AFR
ICA
N E
XPO
RT
-IM
POR
T B
AN
KSP
EC
IAL
PU
RPO
SE S
TA
TE
ME
NT
OF
CH
AN
GE
S IN
EQ
UIT
YFO
R T
HE
YE
AR
EN
DE
D 3
1 D
EC
EM
BE
R 2
018
Shar
e C
apita
lSh
are
Prem
ium
War
rant
sG
ener
al
Res
erve
Ass
et R
eval
uatio
n R
eser
veC
ashf
low
he
dge
rese
rve
Proj
ect
prep
arat
ion
faci
lity
Fund
re
serv
e R
etai
ned
Ear
ning
sT
otal
(Not
e 27
)(N
ote
28)
(Not
e 32
)(N
ote
29)
(Not
e 29
)(N
ote
29)
(Not
e 29
)(N
ote
30)
US$
000
US$
000
US$
000
US$
000
US$
000
US$
000
US$
000
US$
000
US$
000
Bal
ance
at 3
1 D
ecem
ber
2017
470,
816
562,
350
91,7
2344
7,76
219
,471
-7,
500
524,
412
2,12
4,03
4Im
pact
of A
dopt
ing
IFR
S 9
at 1
Janu
ary
2018
(not
e 36
)-
--
--
--
(129
,878
)(1
29,8
78)
Res
tate
d B
alan
ce a
t 1 J
anua
ry 2
018
470,
816
562,
350
91,7
2344
7,76
219
,471
-7,
500
394,
534
1,99
4,15
6T
otal
com
preh
ensi
ve in
com
ePr
ofit
of th
e ye
ar-
--
--
--
275,
902
275,
902
Oth
er c
ompr
ehen
sive
inco
me
Rec
yclin
g of
fair
valu
e ad
just
men
t to
prof
it an
d lo
ss-
--
--
--
--
Ass
et re
valu
atio
n re
serv
e-
--
-9,
491
--
-9,
491
Tra
nsac
tions
with
equ
ity o
wne
rs o
f the
Ban
kPr
ojec
t pre
para
tion
faci
lity
Fund
rese
rve
--
--
--
7,50
0(7
,500
)-
Tran
sfer
to g
ener
al re
serv
e-
--
103,
466
--
-(1
03,4
66)
-D
epre
ciat
ion
trans
fer:
build
ings
--
--
(649
)-
-64
9-
War
rant
s ret
irem
ent
--
(91,
723)
--
--
-(9
1,72
3)Is
sued
and
Pai
d in
cap
ital d
urin
g 20
1835
,484
202,
440
191,
531
--
--
-42
9,45
5D
ivid
ends
for y
ear 2
017
--
--
--
-(5
7,53
4)(5
7,53
4)B
alan
ce a
t 31
Dec
embe
r 20
1850
6,30
076
4,79
019
1,53
155
1,22
828
,313
-15
,000
502,
585
2,55
9,74
7
Bal
ance
at 1
Janu
ary
2017
378,
488
355,
310
98,7
1636
6,28
211
,600
(13,
476)
-42
9,44
81,
626,
368
Tot
al c
ompr
ehen
sive
inco
me
Prof
it of
the
year
--
--
--
-22
0,49
422
0,49
4O
ther
com
preh
ensi
ve in
com
eEf
fect
ive
porti
on o
f cha
nges
in fa
ir va
lue
of c
ash
flow
he
dge
- -
- -
- 13
,476
-
- 13
,476
A
sset
reva
luat
ion
rese
rve
- -
- -
9,27
9
- -
- 9,
279
T
rans
actio
ns w
ith e
quity
ow
ners
of t
he B
ank
Proj
ect p
repa
ratio
n fa
cilit
y Fu
nd re
serv
e -
- -
- -
- 7,
500
(7
,500
)
- Tr
ansf
er to
gen
eral
rese
rve
- -
- 81
,480
-
- -
(81,
480)
-
Dep
reci
atio
n tra
nsfe
r: bu
ildin
gs-
- -
- (1
,408
)
- -
1,40
8
- W
arra
nts r
etire
men
t-
- (1
98,5
75)
- -
- -
- (1
98,5
75)
Is
sued
dur
ing
the
year
92,3
28
207,
040
19
1,58
2-
- -
- -
490,
950
D
ivid
ends
for y
ear 2
016
- -
- -
- -
- (3
7,95
8)
(37,
958)
B
alan
ce a
t 31
Dec
embe
r 20
1747
0,81
6
562,
350
91
,723
44
7,76
2
19,4
71
- 7,
500
52
4,41
2
2,12
4,03
4
The
acco
mpa
nyin
g no
tes t
o th
e fin
anci
al st
atem
ents
form
par
t of t
his s
tate
men
t
3
F-38
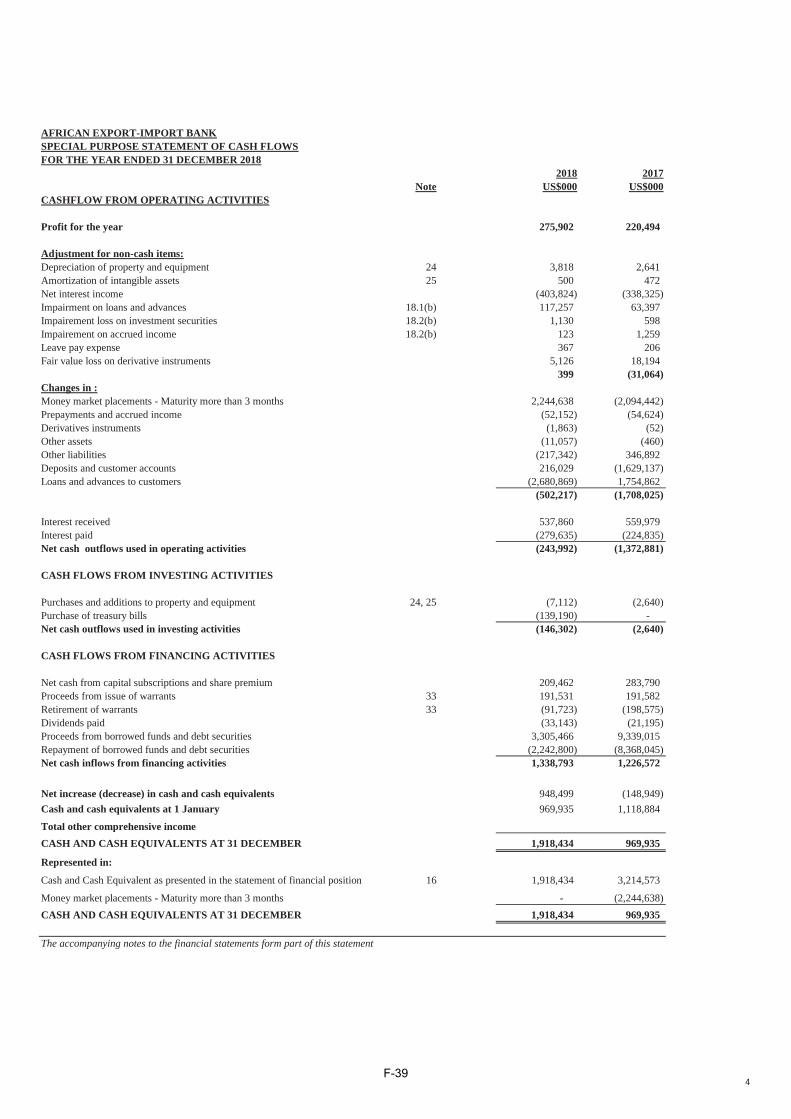
AFRICAN EXPORT-IMPORT BANKSPECIAL PURPOSE STATEMENT OF CASH FLOWSFOR THE YEAR ENDED 31 DECEMBER 2018
2018 2017Note US$000 US$000
CASHFLOW FROM OPERATING ACTIVITIES
Profit for the year 275,902 220,494
Adjustment for non-cash items:Depreciation of property and equipment 24 3,818 2,641Amortization of intangible assets 25 500 472Net interest income (403,824) (338,325)Impairment on loans and advances 18.1(b) 117,257 63,397Impairement loss on investment securities 18.2(b) 1,130 598Impairement on accrued income 18.2(b) 123 1,259Leave pay expense 367 206Fair value loss on derivative instruments 5,126 18,194
399 (31,064)Changes in :Money market placements - Maturity more than 3 months 2,244,638 (2,094,442)Prepayments and accrued income (52,152) (54,624)Derivatives instruments (1,863) (52)Other assets (11,057) (460)Other liabilities (217,342) 346,892Deposits and customer accounts 216,029 (1,629,137)Loans and advances to customers (2,680,869) 1,754,862
(502,217) (1,708,025)
Interest received 537,860 559,979Interest paid (279,635) (224,835)Net cash outflows used in operating activities (243,992) (1,372,881)
CASH FLOWS FROM INVESTING ACTIVITIES
Purchases and additions to property and equipment 24, 25 (7,112) (2,640)Purchase of treasury bills (139,190) -Net cash outflows used in investing activities (146,302) (2,640)
CASH FLOWS FROM FINANCING ACTIVITIES
Net cash from capital subscriptions and share premium 209,462 283,790Proceeds from issue of warrants 33 191,531 191,582Retirement of warrants 33 (91,723) (198,575)Dividends paid (33,143) (21,195)Proceeds from borrowed funds and debt securities 3,305,466 9,339,015Repayment of borrowed funds and debt securities (2,242,800) (8,368,045)Net cash inflows from financing activities 1,338,793 1,226,572
Net increase (decrease) in cash and cash equivalents 948,499 (148,949)Cash and cash equivalents at 1 January 969,935 1,118,884
Total other comprehensive incomeCASH AND CASH EQUIVALENTS AT 31 DECEMBER 1,918,434 969,935
Represented in:
Cash and Cash Equivalent as presented in the statement of financial position 16 1,918,434 3,214,573
Money market placements - Maturity more than 3 months - (2,244,638) CASH AND CASH EQUIVALENTS AT 31 DECEMBER 1,918,434 969,935
The accompanying notes to the financial statements form part of this statement
4F-39

AFRICAN EXPORT-IMPORT BANKNOTES TO THE SPECIAL PURPOSE FINANCIAL STATEMENTSFOR THE YEAR ENDED 31 DECEMBER 2018
1 GENERAL INFORMATION
2 SUMMARY OF SIGNIFICANT ACCOUNTING POLICIES
2.1 Basis of preparation
The special purpose financial statements has been prepared to be included in aprospectus for the proposed offer to investors of global depositary receipts"GDRs" representing interests in Class D Shares of the Bank for trading onLondon Stock Exchange.
2.2 Initial application of new amendments to the existing Standards effective for 1 January 2018.
2.2.1The Bank has adopted IFRS 9 from the effective mandatory application date of 1 January 2018, which resulted in changes in accounting policies and adjustments to previously recognized amounts in the financial statements.Due to the transition method chosen by the Bank in applying IFRS 9, the comparative information throughout these financial statements was not restated to reflect its requirements. Therefore, any adjustment to account for changes between IAS 39 and IFRS 9 at the transition date were recognised in the opening retained earnings and other reserves.Accordingly, the information presented for the comparative period do not reflect IFRS 9 and are not entirely comparable to the information presented for 31 December 2018 under IFRS 9.
The adoption of IFRS 15 did not impact the timing or amount of fee and commission income from contracts with customers and the related assets andliabilities recognised by the Bank. Accordingly, the impact on the comparative information is limited to new disclosure requirements.
The African Export-Import Bank (“the Bank”), headquartered in Cairo, Egypt, is a supranational institution, established on 27 October 1993. The Bankstarted lending operations on 30 September 1994. The principal business of the Bank is the finance and facilitation of trade among African countries andbetween Africa and the rest of the world. The Bank’s headquarters is located at No. 72 (B) El Maahad El Eshteraky Street, Heliopolis, Cairo 11341, Egypt.In addition, the Bank has branches in Abuja (Nigeria), Harare (Zimbabwe), Abidjan (Cote D'Ivoire) and Nairobi (Kenya).
The accounting policies applied by the Bank have been approved by the Board of Directors of the Bank and in accordance with International FinancialReporting Standards (IFRS) promulgated by the International Accounting Standards Board. The major accounting policies adopted, which are consistent withthose used in the previous financial year, except for the amendments to IFRS effective as of 1 January 2018 as disclosed in note 2.1.1 below and applied bythe Bank are summarized below.
The special purpose financial statements of the Bank have been prepared in accordance with International Financial Reporting Standards as issued by theInternational Accounting Standards Board (IASB).
The financial statements are prepared on a historical cost basis except for land and buildings and derivative financial instruments that have been measured atfair value and are presented in US Dollars in accordance with the Bank’s Charter. The functional currency of the Bank is the US Dollar based on the fact thatmost of the activities of the Bank are conducted in US Dollar. The financial statements are presented in US Dollars and all values are rounded to the nearestthousand (US$’000). The Bank has not applied any IFRS before their effective dates.
The preparation of financial statements complying with IFRS requires the use of certain critical accounting estimates. It also requires management toexercise its judgment in the process of applying the Bank’s accounting policies. The areas involving a higher degree of judgment or complexity, or areaswhere assumptions and estimates are significant to the financial statements are disclosed in note 6 below.
Change in Accounting Policies - IFRS 9 and IFRS 15
F-40

AFRICAN EXPORT-IMPORT BANKNOTES TO THE SPECIAL PURPOSE FINANCIAL STATEMENTSFOR THE YEAR ENDED 31 DECEMBER 2018
2.2.2Initial recognition and measurement
IFRS 9 “Financial Instruments” IFRS 9 sets out requirements for recognising and measuring financial assets, financial liabilities and some contracts to buy or sell non-financial items. This standard replaces IAS 39 Financial Instruments: Recognition and Measurement. The requirements of IFRS 9 represent a significant change from IAS 39. The new standard brings fundamental changes to the accounting for financial assets and to certain aspects of the accounting for financial liabilities.
As a result of the adoption of IFRS 9, the Bank has adopted consequential amendments to IAS 1 Presentation of Financial Statements, which require separate presentation in the statement of profit or loss and OCI of interest revenue calculated using the effective interest method. Previously, the Bank disclosed this amount in the notes to the financial statements. Also, the Bank used consistent line items description across current and prior period. In particular, the Bank renamed 'Financial investment - held to maturity used in 2017 to 'Financial investment at amortised cost' on its statement of financial position as at 1 January 2018 to reflect the measurement category for IFRS 9.Furthermore, the Bank has adopted consequential amendments to IFRS 7 Financial Instruments: Disclosures that are applied to disclosures in 2018, but have not been applied to the comparative information.
Classification and Measurement of financial assets
The Bank initially applied IFRS 15 on 1 January 2018 retrospectively in accordance with IAS 8 without any practical expedients. The timing or amount of the Bank’s fee and commission income from contracts with customers was not impacted by the adoption of IFRS 15.The impact of IFRS 15 was limited to the new disclosure requirements.
Financial Instruments - Accounting policies applicable after 1 January 2018
Financial assets and financial liabilities are recognized when the Bank becomes a party to the contractual provisions of the instrument. The Bank’s financial instruments consist primarily of cash and deposits with banks, loans and advances to customers, investment securities, other assets, amounts due to banks, derivative financial instruments, debt securities in issue, deposit and customer accounts and other liabilities. The Bank borrows funds to meet disbursements in foreign currency as part of its matching of assets and liabilities in order to manage foreign currency risks. The proceeds from loans repayments are used to repay the borrowings.
Financial assets and liabilities, with the exception of loans and advances to customers and balances due to customers, are initially recognised on the trade date. Loans and advances to customers are recognised when funds are transferred to the customers’ account.
A financial asset or financial liability is initially measured at fair value plus, for an item not at fair value through profit or loss (FVTPL), transaction costs that are directly attributable to its acquisition or issue.
IFRS 9 contains three principal classification categories for financial assets: measured at amortised cost, fair value through other comprehensive income (FVOCI) and fair value through profit or loss (FVTPL). IFRS 9 classification is generally based on the business model in which a financial asset is managed and its contractual cash flows. The standard eliminates the previous IAS 39 categories of held-to-maturity, loans and receivables and available-for-sale. Under IFRS 9, derivatives embedded in contracts where the host is a financial asset in the scope of the standard are never bifurcated. Instead, the whole hybrid instrument is assessed for classification. See the Transition to IFRS on note 36 for an explanation of how the Bank classifies financial assets under IFRS 9.
IFRS 9 largely retains the existing requirements in IAS 39 for the classification of financial liabilities with minor changes with no significant impact on the financial liabilities of the Bank.Expected Credit Loss Model – Impairment of financial instrumentsIFRS 9 replaces the ‘incurred loss’ model in IAS 39 with an ‘expected credit loss’ model. The new impairment model also applies to certain loan commitments and financial guarantee contracts but not to equity investments.Under IFRS 9, credit losses are recognised earlier than under IAS 39. See the Transition to IFRS on note 36 for an explanation of how the Bank applies the impairment requirements of IFRS 9.
IFRS 15 Revenue from Contracts with CustomersIFRS 15 establishes a comprehensive framework for determining whether, how much and when revenue is recognised. It replaced IAS 18 Revenue, IAS 11 Construction Contracts and related interpretations.
F-41
AFRICAN EXPORT-IMPORT BANKNOTES TO THE SPECIAL PURPOSE FINANCIAL STATEMENTSFOR THE YEAR ENDED 31 DECEMBER 2018
Subsequent measurement
All other financial assets are classified as measured at FVTPL.
Business Model Assessment
A financial asset is classified as subsequently measured at: amortized cost, fair value through other comprehensive income (FVOCI) or FVTPL on the basis of both the Bank's business model for managing the financial asset and the contractual cash flows characteristics of the financial asset.
On initial recognition of an equity investment that is not held for trading, the Bank may irrevocably elect to present subsequent changes in fair value in other comprehensive income (OCI). This election is made on an investment-by-investment basis. Amount presented in OCI shall not be subsequently transferred to profit or loss on disposal or derecognition but the Bank may transfer the cumulative gain or loss to retained earnings or within equity.
In addition, on initial recognition, the Bank may irrevocably designate a financial asset that otherwise meets the requirements to be measured at amortized cost or at FVOCI as at FVTPL if doing so eliminates or significantly reduces an accounting mismatch that would otherwise arise.
The Bank also designates financial liabilities at fair value through profit or loss whenThe assets or liabilities are managed, evaluated and reported internally on a fair value basis.The designation eliminates or significantly reduces an accounting mismatch which would otherwise arise.
The asset or liability contains an embedded derivative that significantly modifies the cash flows that would otherwise be required under thecontract.
A debt instrument is measured at amortized cost if it meets both of the following conditions: the asset is held within a business model whose objective is to hold assets to collect contractual cash flows; and
the contractual terms of the financial asset give rise on specified dates to cash flows that are solely payments of principal and interest on theprincipal amount outstanding.
A debt instrument is measured at FVOCI only if it meets both of the following conditions:the asset is held within a business model whose objective is achieved by both collecting contractual cash flows and selling financial assets; and
the contractual terms of the financial asset give rise on specified dates to cash flows that are solely payments of principal and interest on theprincipal amount outstanding
Financial assets that are held for trading or managed and whose performance is evaluated on a fair value basis are measured at FVTPL because they are neither held to collect contractual cash flows nor held both to collect contractual cash flows and to sell financial assets.
The Bank makes an assessment of the objective of a business model in which an asset is held at a portfolio level because this best reflects the way the business is managed and information is provided to management. The information considered includes:
the stated policies and objectives for the portfolio and the operation of those policies in practice. In particular, whether management’s strategy focuses on earning contractual interest revenue, maintaining a particular interest rate profile, matching the duration of the financial assets tothe duration of the liabilities that are funding those assets or realizing cash flows through the sale of the assets;
how the performance of the portfolio is evaluated and reported to the Bank’s management;
the risks that affect the performance of the business model (and the financial assets held within that business model) and how those risks aremanaged;
how managers of the business are compensated - e.g. whether compensation is based on the fair value of the assets managed or the contractual cash flows collected; and
the frequency, volume and timing of sales in prior periods, the reasons for such sales and its expectations about future sales activity. However,information about sales activity is not considered in isolation, but as part of an overall assessment of how the Bank’s stated objective formanaging the financial assets is achieved and how cash flows are realized.
F-42

AFRICAN EXPORT-IMPORT BANKNOTES TO THE SPECIAL PURPOSE FINANCIAL STATEMENTSFOR THE YEAR ENDED 31 DECEMBER 2018
Modifications of financial assets and financial liabilities- Financial assets
- Financial liabilities
Offset of financial assets
Assessment whether contractual cash flows are solely payments of principal and interestFor the purposes of this assessment, ‘principal’ is defined as the fair value of the financial asset on initial recognition.
‘Interest’ is defined as consideration for the time value of money and for the credit risk associated with the principal amount outstanding during a particular period of time and for other basic lending risks and costs (e.g. liquidity risk and administrative costs), as well as profit margin.In assessing whether the contractual cash flows are solely payments of principal and interest, the Bank considers the contractual terms of the instrument. This includes assessing whether the financial asset contains a contractual term that could change the timing or amount of contractual cash flows such that it would not meet this condition. In making the assessment, the Bank considers:
contingent events that would change the amount and timing of cash flows;
Financial assets are not reclassified subsequent to their initial recognition, except in the period after the Bank changes its business model for managing financial assets.
- Financial liabilitiesFinancial liabilities are not reclassified.
If the terms of a financial asset are modified, the Bank evaluates whether the cash flows of the modified asset are substantially different. If the cash flows are substantially different, then the contractual rights to cash flows from the original financial asset are deemed to have expired. In this case, the original financial asset is derecognized and a new financial asset is recognized at fair value. Any costs or fees incurred as part of the modification are recognised as part of the gain or loss on derecognition.
If the cash flows of the modified asset are not substantially different, then the modification does not result in derecognition of the financial asset. In this case, the Bank recalculates the gross carrying amount of the financial asset using the original EIR and recognizes any difference arising between this recalculated amount and the existing gross carrying amount as a modification gain or loss in profit or loss. Any costs or fees incurred as part of the modification adjust the carrying amount of the modified financial asset, and are amortised over the remaining term of the modified financial asset.
The Bank derecognized a financial liability when its terms are modified and the cash flows of the modified liability are substantially different. In this case, a new financial liability based on the modified terms is recognized at fair value. The difference between the financial liability extinguished and the new financial liability with modified terms is recognized in profit or loss.
leverage features;prepayment and extension terms;
terms that limit the Bank’s claim to cash flows from specified assets (e.g. non- recourse asset arrangements); and features that modify consideration of the time value of money - e.g. periodical reset of interest rates.
Reclassifications- Financial assets
When the cash flows of the modified financial liability are not substantially different, then the modification does not result in derecognition of the financial asset and any difference in recognized in profit or loss (similar to the principle for accounting for modification of financial asset that do not result in derecognition).
Financial assets and liabilities are offset and the net amount presented in the statement of financial position when, and only when, the Bank has currently enforceable a legal right to offset the amounts and intends either to settle on a net basis or to realize the asset and settle the liability simultaneously. The financial assets and liabilities are presented on a gross basis.
Income and expenses are presented on a net basis only when permitted by accounting standards, or for gains and losses arising from a Bank of similar transactions such as in the Bank's trading activity.
F-43

AFRICAN EXPORT-IMPORT BANKNOTES TO THE SPECIAL PURPOSE FINANCIAL STATEMENTSFOR THE YEAR ENDED 31 DECEMBER 2018
Derecognition- Financial assets
- Financial liabilities`
Derivative financial instruments and hedge accounting
Derivative financial instruments
The Bank enters into transactions whereby it transfers assets recognised on its statement of financial position, but retains either all or substantially all of the risks and rewards of the transferred assets or a portion of them. In such cases, the transferred assets are not derecognised. Examples of such transactions are securities lending and sale-and-repurchase transactions.
When assets are sold to a third party with a concurrent total rate of return swap on the transferred assets, the transaction is accounted for as a secured financing transaction similar to sale-and-repurchase transactions, because the Bank retains all or substantially all of the risks and rewards of ownership of such assets.In transactions in which the Bank neither retains nor transfers substantially all of the risks and rewards of ownership of a financial asset and it retains control over the asset, the Bank continues to recognise the asset to the extent of its continuing involvement, determined by the extent to which it is exposed to changes in the value of the transferred asset.In certain transactions, the Bank retains the obligation to service the transferred financial asset for a fee. The transferred asset is derecognised if it meets the derecognition criteria. An asset or liability is recognised for the servicing contract if the servicing fee is more than adequate (asset) or is less than adequate (liability) for performing the servicing.Financial assets transferred to external parties that do not qualify for de-recognition are reclassified in the statement of financial position to assets pledged as collateral, if the transferee has received the right to sell or re-pledge them in the event of default from agreed terms. Initial recognition of assets pledged as collateral is at fair value, whilst subsequently measured at amortized cost or fair value as approriate.
The Bank derecognises a financial liability when its contractual obligations are discharged or cancelled, or expire.
The Bank derecognizes a financial asset when the contractual rights to the cash flows from the asset expire, or when it transfers the rights to receive the contractual cash flows in a transaction in which substantially all the risks and rewards of ownership of the financial assets are transferred or in which the Bank neither transfers nor retains substantially all the risks and rewards of ownership and it does not retain control of the financial asset. Any interest in transferred financial assets that qualify for derecognition that is created or retained by the Bank is recognized as a separate asset or liability in the statement of financial position.
On derecognition of a financial asset, the difference between the carrying amount of the asset (or the carrying amount allocated to the portion of the asset transferred), and the sum of (i) the consideration received (including any new asset obtained less any new liability assumed) and (ii) any cumulative gain or loss that had been recognized in other comprehensive income is recognized in profit and loss.
From 1 January 2018 any cumulative gain/loss recognised in OCI in respect of equity investment securities designated as at FVOCI is not recognised in profit or loss on derecognition of such securities. Any interest in transferred financial assets that qualify for derecognition that is created or retained by the Bank is recognised as a separate asset or liability.
The Bank makes use of derivative instruments to manage exposures to interest rate, foreign currency and credit risks, including exposures arising from highly probable forecast transactions and firm commitments. In order to manage particular risks, the Bank applies hedge accounting for transactions which meet specified criteria. However, the Bank has discontinued its hedge accounting from 1 January 2017.
The Bank enters into interest rate swaps , corss currency swaps and foreign exchange forward contracts to hedge its exposure to changes in the fair value and cash flows attributable to changes in market interest and exchange rates on its assets and liabilities. Derivatives are initially recognized at fair value at the date the derivative contract is entered into and are subsequently measured at their fair value at the end of each reporting period. The resulting gain or loss is recognized in profit or loss immediately. A derivative with a positive fair value is recognized as a financial asset; a derivative with a negative fair value is recognized as a financial liability.
F-44

AFRICAN EXPORT-IMPORT BANKNOTES TO THE SPECIAL PURPOSE FINANCIAL STATEMENTSFOR THE YEAR ENDED 31 DECEMBER 2018
Impairment
financial assets that are debt instruments; other assets and trade receivables;
financial guarantee contracts issued; andloan commitments issued.
No impairment loss is recognized on equity investments.
Measurement of ECL
DefaultUnder IFRS 9, the Bank will consider a financial asset to be in default when:
In assessing whether a borrower is in default, the Bank will consider indicators that are:qualitative: e.g. breach of covenants that are deemed as default events;
Loss allowances for other assets and receivables are always measured at an amount equal to lifetime ECL.
The Bank considers a debt security to have low credit risk when their credit risk rating is equivalent to the globally understood definition of ‘investment grade’ or it is a sovereign debt issued in the local currency.
12-month ECL are the portion of ECL that result from default events on a financial instrument that are possible within the 12 months after the reporting date.
Life time ECL are credit losses that result from all possible default event over the expected life of a financial instrument.
ECL are a probability-weighted estimate of credit losses. They are measured as follows:financial assets that are not credit-impaired at the reporting date: as the present value of all cash shortfalls (i.e. the difference between the cash flows
due to the entity in accordance with the contract and the cash flows that the Bank expects to receive);
The Bank recognizes loss allowances for expected credit losses (ECL) on the following financial instruments that are not measured at FVTPL:
The Bank measures loss allowances at an amount equal to lifetime ECL, except for the following, for which they are measured as 12-month ECL:
debt investment securities that are determined to have low credit risk at the reporting date; andother financial instruments (other than other receivables) on which credit risk has not increased significantly since their initial recognition.
Stage 2 - Financial instruments that have had a significant increase in credit risk since initial recognition (unless they have low credit risk at the reporting date) but that do not have objective evidence of impairment. The financial instruments in stage 2 have their ECL measured based on expected credit losses on a lifetime basis.Stage 3 - Financial assets that have objective evidence of impairment at the reporting date and those purchased or originated credit impaired. Financial instruments in this stage are considered non-performing. The financial instruments in stage 3 have their ECL measured based on expected credit losses on a lifetime basis.
the borrower is unlikely to pay its credit obligations to the Bank in full, without recourse by the Bank to actions such as realizing security (if any is held); or
the borrower is more than 90 days past due on any material credit obligation to the Bank.Overdrafts are considered past due once the customer has breached an advised limit or been advised of a limit that is smaller than the current
amount outstanding.
quantitative: e.g. 90 days overdue status and non-payment of another obligation of the same issuer to the Bank; and
financial assets that are credit-impaired at the reporting date: as the difference between the gross carrying amount and the present value of estimated future cash flows;
undrawn loan commitments: as the present value of the difference between the contractual cash flows that are due to the Bank if the commitment is drawn down and the cash flows that the Bank expects to receive; and
financial guarantee contracts: the expected payments to reimburse the holder less any amounts that the Bank expects to recover from the holder, thedebtor or any other party.
IFRS 9 introduces a three-stage model for impairment based on changes in credit risk since initial recognition. The three-stage model is described below;
Stage 1 - Financial instruments that have not had a significant increase in credit risk since initial recognition or that have low credit risk at the reporting date . The financial instruments in stage 1 have their ECL measured at expected credit losses on a 12months basis.
based on internally and external objective evidence of impairment. Inputs into the assessment of whether a financial instrument is in default and their significance may vary over time to reflect changes in circumstances.
F-45

AFRICAN EXPORT-IMPORT BANKNOTES TO THE SPECIAL PURPOSE FINANCIAL STATEMENTSFOR THE YEAR ENDED 31 DECEMBER 2018
Significant increase in credit risk
the risk of default on the exposure as at the reporting date; with the risk of default on the exposure as at the date of initial recognition
Individual or collective assessment of Significant increase in credit risk
instrument type;credit risk ratings;collateral type;
date of origination;remaining term to maturity;industry;geographical location of the borrower; and
ratios for non-recourse loans in some jurisdictions.
The Bank apply different notch movement across each rating grade as evidence of SICR. Generally, obligors with higher credit rating would require more notches downgrade to evidence SICR, when compared with obligors with lower credit rating.
Similarly, the Bank shall monitor changes in external ratings of financial instruments to assess SICR. Evidence of SICR depends on rating at initial recognition and the extent of movement (number of notches downgrade) as at reporting date.The Bank also uses the backstop indicator otherwise known as “30 days past due presumption” to assess significant increase in credit risk. Evidence of SICR shall depend on the number of days for which contractual payments are past due.
From a qualitative perspective, the Bank shall a wide range of qualitative criteria for staging purposes both individually and collectively, leveraging on IFRS 9 recommendations and a range of other factors. In this case, the back shall consider, significant changes in internal price indicators of credit risk, significant changes in external market indicators of credit risk for a particular financial instrument or similar financial instruments with the same expected life , actual or expected significant change in the operating results of the borrower, expectation of forbearance or restructuring due to financial difficulties etc.
The objective of the impairment requirements in IFRS 9 is to recognise lifetime expected credit losses for all financial instruments for which there has been a significant increase in credit risk since initial recognition – whether assessed on an individual or collective basis. For some instruments, asignificant increase in credit risk may be evident on an individual instrument basis before the financial instrument becomes past due. In these cases, an assessment of whether there has been a significant increase in credit risk is carried out on an individual basis.
For some other instruments, a significant increase in credit risk may not be evident on an individual instrument basis before the financial instrument becomes past due. For example, this could be the case when there is little or no updated information that is routinely obtained and monitored on an individual instrument until a customer breaches the contractual terms – e.g. for many retail loans. In these cases, an assessment of whether there has been a significant increase in credit risk on an individual basis would not faithfully represent changes in credit risk since initial recognition, and so if more forward-looking information is available on a collective basis, an entity makes the assessment on a collective basis.
The Bank has established a framework that consider qualitative, quantitative, and ‘backstop’ (30 days past due presumption) indicators to determine whether the credit risk on a particular financial instrument has increased significantly since initial recognition. The framework aligns with the Bank’sinternal credit risk management process.
The criteria for determining whether credit risk has increased significantly will vary by portfolio and will include backstop based on delinquency.
In determining whether the credit risk (i.e. risk of default) on a financial instrument has increased significantly since initial recognition, the Bank will consider reasonable and supportable information that is relevant and available without undue cost or effort, including both quantitative and qualitative information and analysis based on the Bank’s historical experience, expert credit assessment and forward-looking information.
The Bank will primarily assess whether a significant increase in credit risk has occurred for an exposure in line with its staging criteria by comparing:
From a quantitative point, the Bank uses changes in internal ratings of financial assets to assess significant increase/decrease in credit risk. Evidence of SICR depends on rating at initial recognition and the extent of movement (number of notches downgrade/upgrade) as at reporting date.
To assess significant increases in credit risk on a collective basis, the Bank group financial instruments on the basis of shared credit risk characteristics, which may include any of the following examples of shared credit risk characteristics:
the value of collateral relative to the financial asset if it has an impact on the PD – e.g. loan-to-value
The Bank may change the grouping of financial instruments for collective assessment over time as new information becomes available.
F-46

AFRICAN EXPORT-IMPORT BANKNOTES TO THE SPECIAL PURPOSE FINANCIAL STATEMENTSFOR THE YEAR ENDED 31 DECEMBER 2018
Restructured financial assets
the risk of default at the reporting date based on the modified terms; with
the risk of default at the reporting date based on the modified terms; with
Credit-impaired financial assets
Evidence that a financial asset is credit-impaired includes the following observable data:significant financial difficulty of the borrower or issuer;a breach of contract such as a default or past due event;
The market’s assessment of creditworthiness as reflected in the bond yields. The rating agencies’ assessments of creditworthiness.
The current financial situation of the sub-national/corporate issuer.
Presentation of allowance for ECL in the statement of financial position
loan commitments and financial guarantee contracts: generally, as a provision;
If the terms of a financial asset are renegotiated or modified or an existing financial asset is derecognized and replaced with a new one due to financial difficulties of the borrower, then the modified asset is considered to be a new financial asset. Accordingly, the date of modification is treated as the date of initial recognition for the purpose of impairment calculation. The determination of whether the asset’s credit risk has increased significantly reflects comparison of:
the risk of default based on data on initial recognition (i.e. the modification date) and the modified terms.However, in some unusual circumstances following a modification that results in derecognition of the original financial asset, there may be evidence that the modified financial asset is credit-impaired at initial recognition, and thus, the financial asset should be recognized as an originated credit-impaired financial asset. This might occur, for example, in a situation in which there was a substantial modification of a distressed asset that resulted in the derecognition of the original financial asset. In such a case, the Bank treats the new assets resulting from the modification as credit- impaired on the modification date (initial recognition).
At each reporting date, the Bank assesses whether financial assets carried at amortized cost and debt financial assets carried at FVOCI are credit-impaired. A financial asset is ‘credit-impaired‘ when one or more events that have a detrimental impact on the estimated future cash flows of the financial asset have occurred.
the restructuring of a loan or advance by the Bank on terms that the Bank would not consider otherwise;it is becoming probable that the borrower will enter bankruptcy or other financial reorganisation;or
The contractual terms of a loan may be modified for a number of reasons, including changing market conditions, customer retention and other factors not related to a current or potential credit deterioration of the customer. An existing loan whose terms have been modified may be derecognized and the renegotiated loan recognized as a new loan at fair value.
Under IFRS 9, when the terms of a financial asset are modified and the modification does not result in derecognition, the determination of whether the asset’s credit risk has increased significantly reflects comparison of:
the risk of default based on data on initial recognition and the original contractual terms.
debt instruments measured at FVOCI: no loss allowance is recognized in the statement of financial position because the carrying amount of theseassets is their fair value. However, the loss allowance is disclosed and is recognized in the fair value reserve.
the disappearance of an active market for a security because of financial difficulties.A loan that has been renegotiated due to a deterioration in the borrower’s condition is usually considered to be credit-impaired unless there is evidence that
The mechanisms in place to provide the necessary support (from the central government), as well as the intention, reflected in publicstatements of governments/corporate issuer and availability to use those mechanisms.
Loss allowances for ECL are presented in the statement of financial position as follows:financial assets measured at amortized cost: as a deduction from the gross carrying amount of the assets;
where a financial instrument includes both a drawn and an undrawn component, and the Bank cannot identify the ECL on the loan commitmentcomponent separately from those on the drawn component: the Bank presents a combined loss allowance for both components. The combinedamount is presented as a deduction from the gross carrying amount of the drawn component. Any excess of the loss allowance over the gross amount of the drawn component is presented as a provision; and
F-47

AFRICAN EXPORT-IMPORT BANKNOTES TO THE SPECIAL PURPOSE FINANCIAL STATEMENTSFOR THE YEAR ENDED 31 DECEMBER 2018
Write-off
Financial liabilities
Financial guarantees and loan commitments
Amortised cost and gross carrying amount
Change in Cash flows
Calculation of interest income and expense
Loans and debt securities are written off (either partially or in full) when there is no realistic prospect of recovery. This is generally the case when the Bank determines that the borrower does not have assets or sources of income that could generate sufficient cash flows to repay the amounts subject to the write-off and this is taken as a derecognition event. However, financial assets that are written off are still subject to enforcement activities in order to comply with the Bank’s procedures for recovery of amounts due.
The Bank classifies its financial liabilities, other than financial guarantees and loan commitments, as measured at amortised cost or FVTPL (or as derivatives designated as hedging instruments in an effective hedge). The Bank has not designated any financial liabilities at fair value through profit or loss.
All financial liabilities are recognized initially at fair value and, in the case of those subsequently measured at amortised, net of directly attributable transaction costs.
Financial guarantees’ are contracts that require the Bank to make specified payments to reimburse the holder for a loss that it incurs because a specified debtor fails to make payment when it is due in accordance with the terms of a debt instrument. ‘Loan commitments’ are firm commitments to provide credit under pre-specified terms and conditions. Such financial guarantees are given to banks, financial institutions and other bodies on behalf of customers to secure loans and other banking facilities.
Financial guarantees issued or commitments to provide a loan at a below-market interest rate are initially measured at fair value and the initial fair value is amortised over the life of the guarantee or the commitment. Subsequently, they are measured as at the higher of this amortised amount and the amount of loss allowance.
For loan commitments, the Bank recognises loss allowance in line with the ECL impairment requirements. Liabilities arising from financial guarantees and loan commitments are included within provisions.
The amortised cost of a financial asset or liability is the amount at which the financial asset or liability is measured at initial recognition, minus principal repayments, plus or minus the cumulative amortisation using the effective interest method of any difference between the initial amount recognised and the maturity amount, minus any reduction for impairment.
When an entity revises its estimates of payments or receipts (excluding modifications that do not result in derecognition and changes in estimates of expected credit losses), it shall adjust the gross carrying amount of the financial asset or amortised cost of a financial liability to reflect actual and revised estimated contractual cash flows. The entity recalculates the gross carrying amount of the financial asset or amortised cost of the financial liability as the present value of the estimated future contractual cash flows that are discounted at the financial instrument's original EIR (or credit-adjusted effective interest rate for purchased or originated credit-impaired financial assets) or, when applicable, the revised EIR. The adjustment is recognised in profit or loss as income or expense.
In calculating interest income and expense, the effective interest rate is applied to the gross carrying amount of the asset (when the asset is not credit-impaired) or to the amortised cost of the liability. However, for financial assets that have become credit- impaired subsequent to initial recognition, interest income is calculated by applying the effective interest rate to the amortised cost of the financial asset. If the asset is no longer credit-impaired, then the calculation of interest income reverts to the gross basis.
For financial assets that were credit-impaired on initial recognition, interest income is calculated by applying the credit-adjusted effective interest rate to the amortised cost of the asset. The calculation of interest income does not revert to a gross basis, even if the credit risk of the asset improves.
The calculation of the effective interest rate includes transaction costs and fees and points paid or received that are an integral part of the effective interest rate. Transaction costs include incremental costs that are directly attributable to the acquisition or issue of a financial asset or financial liability.
F-48

AFRICAN EXPORT-IMPORT BANKNOTES TO THE SPECIAL PURPOSE FINANCIAL STATEMENTSFOR THE YEAR ENDED 31 DECEMBER 2018
PresentationInterest income and expense presented in the statement of profit or loss and OCI include:
2.2.3 Financial Instruments - Accounting Policies applicable before 1 January 2018 - Comparative period
Classification and measurement of financial assets
Loans and receivables
Loans with renegotiated terms
Financial assets at fair value through profit or loss
Available-for-sale financial assets
Financial investments - Held to maturity
interest on financial assets and financial liabilities measured at amortised cost calculated on an effective interest basisinterest on debt instruments measured at FVOCI calculated on an effective interest basis;
Financial assets and financial liabilities are recognized when the Bank becomes a party to the contractual provisions of the instrument. The Bank’s financial instruments consist primarily of cash and deposits with banks, loans and advances to customers, amounts due to banks, derivative financial instruments, debt securities in issue and customer deposits. The Bank borrows funds to meet disbursements in foreign currency as part of its matching of assets and liabilities in order to manage foreign currency risks. The proceeds from loans repayments are used to repay the borrowings.
Financial assets and liabilities, with the exception of loans and advances to customers and balances due to customers, are initially recognised on the trade date. Loans and advances to customers are recognised when funds are transferred to the customers’ account.
Financial assets are classified, at initial recognition, as financial assets at fair value through profit or loss, loans and receivables, held‑to‑maturity financial assets and available‑for‑sale financial assets. All financial assets are recognized initially at fair value plus, in the case of financial assets not recorded at fair value through profit or loss, transaction costs that are attributable to the acquisition of the financial asset.
Loans and receivables including loans and advances to customers and cash and deposits with banks are non-derivative financial assets with fixed or determinable payments that are not quoted in an active market. They are initially recognized at fair value plus transaction costs and are de-recognized when the rights to receive cash flows from the financial assets have expired or where the Bank has transferred substantially all risks and rewards of ownership. Subsequently, loans and receivables are measured at amortized cost using the effective interest rate method less allowance for impairment, and are recognized on the day on which they are drawn down by the borrower.
The contractual terms of a loan may be modified for a number of reasons including changing market conditions, customer retention and other factors not related to a current or potential credit deterioration of the customer. An existing loan whose terms have been modified may be derecognized and the negotiated loan recognised as a new loan at fair value.
A financial asset is classified as at fair value through profit or loss if it is classified as held for-trading or is designated as such on initial recognition. Directly attributable transaction costs are recognised in profit or loss as incurred. Financial assets at fair value through profit or loss are measured at fair value and changes therein, including any interest or dividend income, are recognised in profit or loss.
These assets are initially measured at fair value plus any directly attributable transaction costs. Subsequent to initial recognition, they are measured at fair value and changes therein, other than impairment losses and foreign currency differences on debt instruments, are recognised in OCI and accumulated in the fair value reserve. When these assets are derecognised, the gain or loss accumulated in equity is reclassified to profit or loss.
Held-to-maturity financial investments are non–derivative financial assets with fixed or determinable payments and fixed maturities that the Bank has the intention and ability to hold to maturity. After initial measurement, held-to-maturity financial investments are subsequently measured at amortised cost using the EIR less impairment. Amortised cost is calculated by taking into account any discount or premium on acquisition and fees that are an integral part of the EIR. The amortisation is included in interest and similar income in the income statement. The losses arising from impairment of such investments are recognised in the income statement within credit loss expense. If the Bank were to sell or reclassify more than an insignificant amount of held-to-maturity investments before maturity (other than in certain specific circumstances), the entire category would be tainted and would have to be reclassified as available-for-sale. Furthermore, the Bank would be prohibited from classifying any financial asset as held-to-maturity during the following two years.
F-49

AFRICAN EXPORT-IMPORT BANKNOTES TO THE SPECIAL PURPOSE FINANCIAL STATEMENTSFOR THE YEAR ENDED 31 DECEMBER 2018
Classification and measurement of financial liabilities
Derivative financial instruments and hedge accounting
(i) Fair value hedges
(ii) Cash flow hedges
The Bank makes use of derivative instruments to manage exposures to interest rate, foreign currency and credit risks, including exposures arising from highly probable forecast transactions and firm commitments. In order to manage particular risks, the Bank applies hedge accounting for transactions which meet specified criteria.
At inception of the hedge relationship, the Bank formally documents the relationship between the hedged item and the hedging instrument, including the nature of the risk, the risk management objective and strategy for undertaking the hedge and the method that will be used to assess the effectiveness of the hedging relationship at inception and on an ongoing basis.
At each hedge effectiveness assessment date, a hedge relationship must be expected to be highly effective on a prospective basis and demonstrate that it was effective (retrospective effectiveness) for the designated period in order to qualify for hedge accounting. A formal assessment is undertaken by comparing the hedging instrument’s effectiveness in offsetting the changes in fair value or cash flows attributable to the hedged risk in the hedged item, both at inception and at each quarter end on an ongoing basis. A hedge is expected to be highly effective if the changes in fair value or cash flows attributable to the hedged risk during the period for which the hedge is designated were offset by the hedging instrument in a range of 80% to 125%and were expected to achieve such offset in future periods. Hedge ineffectiveness is recognized in the profit or loss in other income. For situations where the hedged item is a forecast transaction, the Bank also assesses whether the transaction is highly probable and presents an exposure to variations in cash flows that could ultimately affect the profit or loss.
For designated and qualifying fair value hedges, the cumulative change in the fair value of a hedging derivative is recognized in the profit or loss in other income. Meanwhile, the cumulative change in the fair value of the hedged item attributable to the risk hedged is recorded as part of the carrying value of thehedged item in the statement of financial position and is also recognized in profit or loss in other income.
If the hedging instrument expires or is sold, terminated or exercised, or where the hedge no longer meets the criteria for hedge accounting, the hedge relationship is discontinued prospectively. For hedged items recorded at amortized cost, the difference between the carrying value of the hedged item on termination and the face value is amortized over the remaining term of the original hedge using the recalculated effective interest rate method. If the hedged item is derecognized, the unamortized fair value adjustment is recognized immediately in profit or loss.
For designated and qualifying cash flow hedges, the effective portion of the cumulative gain or loss on the hedging instrument is initiallyrecognized in other comprehensive income and accumulated in equity in the cash flow hedge reserve. The ineffective portion of the gain or loss on thehedging instrument is recognized immediately in other income in profit or loss.
Financial liabilities within the scope of IAS 39 are classified as financial liabilities at fair value through profit or loss, loans and borrowings, or as derivatives designated as hedging instruments in an effective hedge, as appropriate. The Bank determines the classification of its financial liabilities at initial recognition. The Bank has not designated any financial liabilities at fair value through profit or loss. All financial liabilities are recognized initially at fair value and, in the case of loans and borrowings, net of directly attributable transaction costs.
The Bank’s financial liabilities include amount due to banks, debt securities in issue and customer deposits which are initially measured at fair value, net of directly attributable transaction costs. Subsequently, they are measured at amortised cost.
When the hedged cash flow affects profit or loss, the gain or loss on the hedging instrument is recorded in the corresponding income or expense line of profit or loss. When the forecast transaction subsequently results in the recognition of a non- financial asset or a non-financial liability, the gains and losses previously recognized in the other comprehensive income are removed from the reserve and included in the initial cost of the asset or liability.
When a hedging instrument expires, or is sold, terminated, exercised, or when a hedge no longer meets the criteria for hedge accounting, any cumulative gain or loss that has been recognized in other comprehensive income at that time remains separately in equity and is transferred to profit or loss when the hedged forecast transaction occurs. When a forecast transaction is no longer expected to occur, the cumulative gain or loss that was reported in other comprehensive income is immediately transferred to profit or loss.
F-50

AFRICAN EXPORT-IMPORT BANKNOTES TO THE SPECIAL PURPOSE FINANCIAL STATEMENTSFOR THE YEAR ENDED 31 DECEMBER 2018
Impairment of financial assets
De-recognition of financial assets
• The rights to receive cash flows from the asset have expired, or
De-recognition of financial liabilities
Interest income and expense
When a loan is uncollectible, it is written off against the related provision for loan impairment. Such loans are written off after all the necessary procedures have been completed, including obtaining Board of Directors approval, and the amount of loss has been determined.
If, in a subsequent period the amount of the impairment loss decreases and the decrease can be related objectively to an event occurring after the impairment was recognized, the previously recognized impairment loss is reversed by adjusting the allowance account. The amount of the reversal is recognized as a reduction to loan impairment charges in profit or loss.
A financial asset (or, where applicable, a part of a financial asset is primarily derecognized (i.e. removed from the Bank’s statement of financial position) when:
• The Bank has transferred its rights to receive cash flows from the asset or has assumed an obligation to pay the received cash flows in full without material delay to a third party under a ‘pass-through’ arrangement; and either (a) the Bank has transferred substantially all the risks and rewards of theasset, or (b) the Bank has neither transferred nor retained substantially all the risks and rewards of the asset, but has transferred control of the asset.
A financial liability is derecognized when the obligation under the liability is discharged or cancelled, or expires. When an existing financial liability is replaced by another from the same lender on substantially different terms, or the terms of an existing liability are substantially modified, such an exchange or modification is treated as the derecognition of the original liability and the recognition of a new liability. The difference in the respective carrying amounts is recognized in profit or loss.
For all financial instruments measured at amortized cost and interest bearing financial instruments classified as available-for-sale financial instruments, interest income or expense is recognized at the effective interest rate, which is the rate that exactly discounts estimated future cash payments or receipts through the expected life of the financial instrument or shorter period, where appropriate, to the net carrying amount of the financial asset or financial liability. The carrying amount of the financial asset or financial liability is adjusted if the Bank revises its estimates of payments or receipts. The adjusted carrying amount is calculated based on the original effective interest rate (EIR) and the change in carrying amount is recognized as interest income or expense.
The Bank assesses at each reporting date whether there is objective evidence that a financial asset or a group of financial assets is impaired. Loans and advances are identified as impaired where there is reasonable doubt regarding the collectability of principal or interest. Whenever a payment is 90 days past due, loans and advances are automatically placed on an impairment test. A loan is impaired and impairment losses are incurred only if there is objective evidence of impairment as a result of one or more events that occurred after the initial recognition of the loan (a loss event) and that loss event (or events) has an impact on the estimated future cash flows of the loan that can be reliably estimated. The estimated period between losses occurring and its identification is determined by management for each loan. In general, the periods used vary between three months and twelve months; in exceptional cases, longer periods are warranted.
The amount of loss is measured as the difference between the carrying amount of the loan and the present value of estimated future cash flows discounted at the loan's original effective interest rate determined under contract. The carrying amount of loans and advances are reduced through the use of an allowance account and the amount of the loss is recognized in profit or loss. Further details on estimates and assumptions used in impairment of loans and advances are shown in note 6.
In addition to specific provisions against individually significant loans and advances, the Bank also makes a collective impairment provision against loans and advances which although not specifically identified as requiring specific provisions, have a greater risk of default than when originally granted. The amount of provision is based on historical loss experience for loans.The methodology and assumptions used for estimating future cash flows are reviewed regularly by the Bank to reduce any differences between loss estimates and actual loss experience.
Once the recorded value of a financial asset or a group of similar financial assets has been reduced due to an impairment loss, interest income continues to be recognized using the original effective interest rate applied to the new carrying amount.
F-51

AFRICAN EXPORT-IMPORT BANKNOTES TO THE SPECIAL PURPOSE FINANCIAL STATEMENTSFOR THE YEAR ENDED 31 DECEMBER 2018
Financial guarantees
Other accounting policies2.3 Offsetting of financial instruments
2.4 Cash and cash equivalent
2.5 Fair value measurement
When one is available, the Bank measures the fair value of an instrument using the quoted price in an active market for that instrument. A market is regarded as active if transactions for the asset or liability take place with sufficient frequency and volume to provide pricing information on an ongoing basis.
If there is no quoted price in an active market, then the Bank uses valuation techniques that maximise the use of relevant observable inputs and minimise the use of unobservable inputs. The chosen valuation technique incorporates all of the factors that market participants would take into account in pricing a transaction.
All assets and liabilities for which fair value is measured or disclosed in the financial statements are categorized within the fair value hierarchy, described as follows, based on the lowest level input that is significant to the fair value measurement as a whole:
Financial guarantee contracts are contracts that require the issuer to make specified payments to reimburse the holder for a loss it incurs because a specified debtor fails to make payments when due, in accordance with the terms of a debt instrument. Such financial guarantees are given to banks, financial institutions and other bodies on behalf of customers to secure loans and other banking facilities. Financial guarantees are initially recognized in the financial statements at fair value on the date the guarantee was given adjusted for transaction costs that are directly attributable to the issuance of the guarantee. Subsequent to initial recognition, the Bank’s liabilities under such guarantees are measured at the higher of the initial measurement, less amortization calculated to recognize in the statement of profit or loss and other comprehensive income the fee income earned on a straight line basis over the life of the guarantee and the best estimate of the expenditure required to settle any financial obligation arising at the reporting date. These estimates are determined based on experience of similar transactions and history of past losses, supplemented by the judgment of management. Any increase in the liability relating to guarantees is taken to profit or loss under operating expenses.
Financial assets and liabilities are offset and the net amount reported in the statement of financial position when there is a currently enforceable legal right to set off the recognised amounts and there is an intention to settle on a net basis or realise the asset and settle the liability simultaneously.
Cash and cash equivalents’ include notes and coins on hand, unrestricted balances held with central banks and highly liquid financial assets with original maturities of three months or less from the date of acquisition that are subject to an insignificant risk of changes in their fair value, and are used by the Bank in the management of its short-term commitments. Cash and cash equivalents are carried at amortized cost in the statement of financial position.
The Bank measures financial instruments, such as derivatives, and non-financial assets, such as land and buildings, at fair value at each reporting date. Also, fair values of financial instruments measured at amortised cost are disclosed in note 4. Fair value is the price that would be received to sell an asset or paid to transfer a liability in an orderly transaction between market participants at the measurement date. The fair value measurement is based on the presumption that the transaction to sell the asset or transfer the liability takes place either: In the principal market for the asset or liability, or In the absence of a principal market, in the most advantageous market for the asset or liability. The principal market or the most advantageous market must be accessible by the Bank.
A fair value measurement of a non-financial asset takes into account a market participant's ability to generate economic benefits by using the asset in its highest and best use or by selling it to another market participant that would use the asset in its highest and best use.
F-52

AFRICAN EXPORT-IMPORT BANKNOTES TO THE SPECIAL PURPOSE FINANCIAL STATEMENTSFOR THE YEAR ENDED 31 DECEMBER 2018
2.6 Debt securities in issue
2.7 Fees and Commission income
2.8 Other operating income
2.9 Operating expensesOperating expenses are recorded on accrual basis.
2.10 Dividends on ordinary shares
2.11 Foreign currencies
• Level 1 — Quoted (unadjusted) market prices in active markets for identical assets or liabilities• Level 2 — Valuation techniques for which the lowest level input that is significant to the fair value measurement is directly or indirectly observable
• Level 3 — Valuation techniques for which the lowest level input that is significant to the fair value measurement is unobservableInformation on the Bank’s fair value hierarchy is provided in note 4.
Transactions in foreign currencies are initially recorded at their respective functional currency spot rate prevailing at the date of the transaction. At the reporting date, balances of monetary assets and liabilities denominated in foreign currencies are translated at the exchange rates ruling at that date. Any gains or losses resulting from the translation are recognized in profit or loss in the statement of profit or loss and comprehensive income.
Non-monetary items that are measured in terms of historical cost in a foreign currency are translated using the exchange rate as at the date of the initial transaction and are not subsequently restated. Non-monetary items measured at fair value in a foreign currency are translated using the exchange rates at the date when the fair value was determined. The gain or loss arising on translation of non-monetary items measured at fair value is treated in line with the recognition of gain or loss on change in fair value of the item (i.e. translation differences on items whose fair value gain or loss is recognized in other comprehensive income or profit or loss are also recognized in other Comprehensive income or profit or loss, respectively).
The best evidence of the fair value of a financial instrument on initial recognition is normally the transaction price - i.e. the fair value of the consideration given or received. If the Bank determines that the fair value on initial recognition differs from the transaction price and the fair value is evidenced neither by a quoted price in an active market for an identical asset or liability nor based on a valuation technique for which any unobservable inputs are judged to be insignificant in relation to the measurement, then the financial instrument is initially measured at fair value, adjusted to defer the difference between the fair value on initial recognition and the transaction price. Subsequently, that difference is recognised in profit or loss on an appropriate basis over the life of the instrument but no later than when the valuation is wholly supported by observable market data or the transaction is closed out. If an asset or a liability measured at fair value has a bid price and an ask price, then the Bank measures assets and long positions at a bid price and liabilities and short positions at an ask price.
The fair value of a financial liability with a demand feature (e.g. a demand deposit) is not less than the amount payable on demand, discounted from the first date on which the amount could be required to be paid.
Debt securities in issue are one of the Bank’s sources of debt funding. Debt securities are initially measured at fair value plus incremental direct transaction costs, and subsequently measured at their amortized cost using effective interest method.
Unless included in the effective interest rate calculation, fees and commissions are generally recognized when the Bank satisfies the performance obligation in the contract by tranferring the promised service to a custmer. Fees or component of fees that are performance linked (e.g. investment banking advisory services including among other things evaluating financing options, debt restructuring, etc.) are recognized when the performance criteria are fulfilled in accordance with the applicable terms of engagement.
Other operating income consists mainly of rental income which is accounted for on a straight-line basis over the lease terms on ongoing leases. This also include recoveries from previously written-off facilities.
Dividend on ordinary shares are recognized as a liability and deducted from equity when they are approved by the Bank’s shareholders. Dividends for the year that are approved after the reporting date are disclosed as a non-adjusting event.
F-53

AFRICAN EXPORT-IMPORT BANKNOTES TO THE SPECIAL PURPOSE FINANCIAL STATEMENTSFOR THE YEAR ENDED 31 DECEMBER 2018
2.12 Property and equipment
2.13 Intangible assetsThe Bank’s other intangible assets include the value of computer software
2.14
Motor vehicles, furniture and equipment, computers and leasehold improvements are stated at cost, excluding the costs of day-to-day servicing, lessaccumulated depreciation and accumulated impairment in value. Cost includes expenditure that is directly attributable to the acquisition of the items. Repairand maintenance costs are recognized in profit or loss as incurred.
Depreciation is calculated on the straight line basis at annual rates estimated to write off the carrying amounts of the assets over their expected useful lives,as follows:- Buildings 20 years- Motor vehicles 5 years- Furniture and equipment 4 years- Computers 3 years- Leasehold improvements Over the remaining period of the lease
Motor vehicles, furniture and equipment, computers and leasehold improvements are periodically reviewed for impairment. Please refer to (Note 2.14) onimpairment of non -financial assets for further information about impairment.
Motor vehicles, furniture and equipment, computers and leasehold improvements are de-recognized upon disposal or when no future economic benefits areexpected to arise from the continued use of the asset. Any gain or loss arising on de-recognition of the asset (calculated as the difference between the netdisposal proceeds and the carrying amount of the item) is included in profit or loss in the year the item is de-recognized.
Amortisation is calculated using the straight–line method to write down the cost of intangible assets to their residual values over their estimated useful lives,as follows:- Computer & Core application software 4 years
Government grantsGovernment grants related to assets, including non-monetary grants at fair value, are presented in the statement of financial position by deducting the grant inarriving at the carrying amount of the asset. the grant is deducted in calculating the carrying amount of the asset. The grant is recognised in profit or loss overthe life of a depreciable asset as a reduced depreciation expense.
The assets residual values, useful lives and methods of depreciation are reviewed at each reporting date, and adjusted prospectively if appropriate. Furtherdetails on key estimates and assumptions made are disclosed in note 6.
The Headquarters’ land and building are measured at fair value less accumulated depreciation on buildings and impairment losses recognized at the date ofrevaluation.
Valuations are performed by an independent valuer at the reporting date to ensure that the fair value of a revalued asset does not differ materially from itscarrying amount.
A revaluation surplus is recorded in other comprehensive income and credited to the asset revaluation reserve in equity. However, to the extent that itreverses a revaluation deficit of the same asset previously recognized in profit or loss, the increase is recognized in profit or loss. A revaluation deficit isrecognized in the profit or loss, except to the extent that it offsets an existing surplus on the same asset recognized in the asset revaluation reserve. Upondisposal, any revaluation reserve relating to the particular asset being sold is transferred to retained earnings. An annual transfer from the asset revaluationreserve to retained earnings is made for the difference between depreciation based on the revalued amount of the asset and depreciation based on the assetoriginal cost.
An intangible asset is recognised only when its cost can be measured reliably and it is probable that the expected future economic benefits that areattributable to it will flow to the Bank. Intangible assets acquired separately are measured on initial recognition at cost. Following initial recognition,intangible assets are carried at cost less any accumulated amortisation and any accumulated impairment losses.
The useful lives of intangible assets are assessed to be either finite or indefinite. Intangible assets with finite lives are amortised over the useful economiclife. The amortisation period and the amortisation method for an intangible asset with a finite useful life are reviewed at least at each financial year-end.Changes in the expected useful life, or the expected pattern of consumption of future economic benefits embodied in the asset, are accounted for by changingthe amortisation period or methodology, as appropriate, which are then treated as changes in accounting estimates.
F-54

AFRICAN EXPORT-IMPORT BANKNOTES TO THE SPECIAL PURPOSE FINANCIAL STATEMENTSFOR THE YEAR ENDED 31 DECEMBER 2018
2.15
2.16 Employee benefits
2.17 Provisions
2.18 Operating leases
2.19 Warrants
Earnings per shareBasic earnings per share (EPS) is calculated by dividing the net profit for the year attributable to equity holders of the Bank by the weighted average numberof shares outstanding during the year. Diluted EPS is calculated by dividing the net profit attributable to equity holders of the Bank (by the weighted averagenumber of shares outstanding during the year plus the weighted average number of shares that would be issued on the conversion (warrants) of all thedilutive potential ordinary shares into ordinary shares.
i. Defined contribution planThe Bank operates a defined contribution plan approved by the Board of Directors. Contributions are recognized in profit or loss on an accrual basis. TheBank has no further payment obligations once the contributions have been paid.
Proceeds from the issuance of warrants, net of issue costs, are credited to share warrants account. Share warrants account is non-distributable and will betransferred to share capital and premium accounts upon the exercise of warrants.
i) Bank as lesseeLeases which do not transfer to the Bank substantially all the risks and benefits incidental to ownership of the leased item, are accounted for as operatingleases. The Bank has entered into operating lease agreements for leasing of office premises. These leases have an average life of between two and five years,with renewal option included in the contracts.
The total payments made under operating leases are charged to profit or loss on a straight-line basis over the period of the lease. When an operating lease isterminated before the lease period has expired, any payment required to be made to the lessor by way of penalty is recognized as an expense in the period inwhich termination takes place.
ii) Bank as lessorThe Bank assesses, at each reporting date or more frequently, whether there is an indication that an asset may be impaired. If such indication exists, the Bankmakes an estimate of the asset’s recoverable amount. Where the carrying amount of an asset exceeds its recoverable amount, the asset is considered impairedand is written down to its recoverable amount. Impairment losses are recognized in profit or loss in expense categories consistent with the function of theimpaired asset, except for properties previously revalued with the revaluation taken to OCI. For such properties, the impairment is recognised in OCI up tothe amount of any previous revaluation.
The recoverable amount is the greater of fair value less costs of disposal and value in use. In assessing value in use, the estimated future cash flows arediscounted to their present value using a discount rate that reflects current market assessments of the time value of money and the risks specific to the asset.In determining fair value less costs of disposal, recent market transactions are taken into account. If no such transactions can be identified, an appropriatevaluation model is used. These calculations are corroborated by valuation multiples, quoted share prices for publicly traded companies or other available fairvalue indicators.
For all assets, an assessment is made at each reporting date to determine whether there is an indication that previously recognized impairment losses nolonger exist or have decreased. If such indication exists, the Bank estimates the asset’s recoverable amount. A previously recognized impairment loss isreversed only if there has been a change in the assumptions used to determine the asset’s recoverable amount since the last impairment loss was recognized.The reversal is limited so that the carrying amount of the asset does not exceed its recoverable amount, nor exceed the carrying amount that would have beendetermined, net of depreciation, had no impairment loss been recognized for the asset in prior years. The reversal of impairment losses is recognised in profitor loss unless the asset is carried at a revalued amount, in which case, the reversal is treated as a revaluation increase.Further details on key estimates andassumptions used are as shown in Note 6.
ii. Other long term benefitsThe Bank's net obligation in respect of long-term employees benefits is the amount of future benefits that the employee have earned in return for their servicein current and prior periods that benefits are recognized in profit or loss on an accrual basis.
iii. Termination benefitsTermination benefits are expensed at the earlier of when the Bank can no longer withdraw the offer of those benefits and when the Bank recognizes cost fora restructring . If benefits are not expexted to be wholly setteled within 12 months of the reporting date, then they are discounted
iv. Short term employee benefitsShort tern employee benefits are expensed as the related service is provided. A liabity is recognized for the amount expected to be paid if the Bank has legalor constructive obligation to pay this amount as a result of past service provided by the employee and the obligation can be estimated reliably.
Provisions are recognized when the Bank has a present legal or constructive obligation as a result of past events, for which it is probable that an outflow ofeconomic benefits will be required to settle the obligation and a reliable estimate can be made of the amount of the obligation. Staff bonuses are recognizedin profit or loss as an expense.
The estimated monetary liability for employees’ accrued annual leave and bonus entitlement at the reporting date is recognized as an expense accrual.
The determination of whether an arrangement is, or contains, a lease is based on the substance of the arrangement at inception date, whether fulfillment ofthe arrangement is dependent on the use of a specific asset or assets or the arrangement conveys a right to use the asset, even if that right is not explicitlyspecified in an arrangement.
F-55

AFRICAN EXPORT-IMPORT BANK
NOTES TO THE SPECIAL PURPOSE FINANCIAL STATEMENTS
2.20 New Standards and amendments to existing standards in issue not yet adopted
At the date of authorisation of these financial statements the following new standards and amendments to existing standards were in issue but not yet effective.Impact of intial application of the below IFRS is not known :
• IFRS 16 “Leases” (effective for annual periods beginning on or after 1 January 2019).IFRS 16 was issued in January 2016 and it replaces IAS 17 Leases, IFRIC 4 Determining whether an Arrangement contains a Lease, SIC-15 Operating Leases-Incentives and SIC-27 Evaluating the Substance of Transactions Involving the Legal Form of a Lease. IFRS 16 sets out the principles for the recognition,measurement, presentation and disclosure of leases and requires lessees to account for all leases under a single on-balance sheet model similar to the accountingfor finance leases under IAS 17. The standard includes two recognition exemptions for lessees – leases of ’low-value’ assets (e.g., personal computers) and short-term leases (i.e., leases with a lease term of 12 months or less). At the commencement date of a lease, a lessee will recognise a liability to make lease payments(i.e., the lease liability) and an asset representing the right to use the underlying asset during the lease term (i.e., the right-of-use asset). Lessees will be requiredto separately recognise the interest expense on the lease liability and the depreciation expense on the right-of-use asset.Lessees will be also required to remeasure the lease liability upon the occurrence of certain events (e.g., a change in the lease term, a change in future leasepayments resulting from a change in an index or rate used to determine those payments). The lessee will generally recognise the amount of the remeasurement ofthe lease liability as an adjustment to the right-of-use asset.Lessor accounting under IFRS 16 is substantially unchanged from today’s accounting under IAS 17. Lessors will continue to classify all leases using the sameclassification principle as in IAS 17 and distinguish between two types of leases: operating and finance leases.IFRS 16 also requires lessees and lessors to make more extensive disclosures than under IAS 17.IFRS 16 is effective for annual periods beginning on or after 1 January 2019. Early application is permitted, but not before an entity applies IFRS 15. A lesseecan choose to apply the standard using either a full retrospective or a modified retrospective approach. The standard’s transition provisions permit certain reliefs.In 2019, the bank will continue to assess the potential effect of IFRS 16 on its financial statements
• IFRS 17 “Insurance contracts” (effective for annual periods beginning on or after 1 January 2021).In May 2017, the IASB issued IFRS 17 Insurance Contracts (IFRS 17), a comprehensive new accounting standard for insurance contracts covering recognition and measurement, presentation and disclosure. Once effective,IFRS 17 will replace IFRS 4 Insurance Contracts (IFRS 4) that was issued in 2005. IFRS 17 applies to all types of insurance contracts (i.e., life, non-life, direct insurance and re-insurance), regardless of the type of entities that issue them, as well as to certain guarantees and financial instruments with discretionary participation features.A few scope exceptions will apply. The overall objective of IFRS 17 is to provide an accounting model for insurance contracts that is more useful and consistentfor insurers. In contrast to the requirements in IFRS 4, which are largely based on grandfathering previous local accounting policies, IFRS 17 provides a comprehensive model for insurance contracts, covering all relevant accounting aspects. The core of IFRS 17 is the generalmodel, supplemented by:• A specific adaptation for contracts with direct participation features (the variable fee approach)• A simplified approach (the premium allocation approach) mainly for short-duration contracts.IFRS 17 is effective for reporting periods beginning on or after 1 January 2021, with comparative figures required. Early application is permitted, provided the entity also applies IFRS 9 and IFRS 15 on or before the date it first applies IFRS 17.
• Other standardsThe following amended standards are not expected to have a significant impact on the Bank's financial statements.– Annual Improvements to IFRS Standards 2015–2017 Cycle – various standards– Long-term Interests in Associates and Joint Ventures (Amendments to IAS 28)– Plan Amendment , Curtailment or Settlement (Amendments to IAS 19)– IFRIC 23 Uncertainty over Income Tax Treatments– Amendments to References to Conceptual Framework in IFRS Standards
F-56

AFRICAN EXPORT-IMPORT BANKNOTES TO THE SPECIAL PURPOSE FINANCIAL STATEMENTSFOR THE YEAR ENDED 31 DECEMBER 2018
3 FINANCIAL INSTRUMENTS AND RISK MANAGEMENT
3.1 Risk management
3.2 Risk management structure
3.3 Credit risk
3.3.1 Credit Risk Exposure
Credit Risk ExposureMaximum exposure to credit risk (including credit quality analysis)
2017
12-month ECL
Lifetime ECL not credit-
impaired
Lifetime ECL credit-
impaired Total
Grades 1-3: Low risk 1,256,151 - - 1,256,151 - Grades 4-6: Satisfactory risk 2,471,460 - - 2,471,460 39,059 Grades 7-8: Moderate list 3,828,321 - - 3,828,321 5,234,639Grade 9-10: Watchlist 1,013,738 - - 1,013,738 1,519,316Grade 11: Sub-standard - 1,684,583 257,629 1,942,212 1,301,810Grade 12-13: Doubtful and Bad - 90,893 671,848 762,741 631,491Grade 14: Loss - - 436 436 - Gross amount 8,569,670 1,775,476 929,913 11,275,059 8,726,315Loss allowance (47,849) (60,049) (162,520) (270,418) -294,351Carrying amount 8,521,821 1,715,427 767,393 11,004,641 8,431,964
Ungraded 49,549 49,549 7,320 Gross amount - - 49,549 49,549 7,320Loss allowance - - (9,722) (9,722) (1,319)Carrying amount - - 39,827 39,827 6,001
Credit risk is the risk that a customer or counterparty of the Bank will be unable or unwilling to meet a commitment that it has entered into with the Bank. It arises from lending, trade finance, treasury and other activities undertaken by the Bank.
The gross carrying amounts of cash and deposits with banks, loans and advances to customers and derivative financial instruments represent the maximum amount exposed to credit risk.
The following table contains an analysis of the credit quality of financial assets measured at amortised cost. For financial assets, the amounts in the table represent gross carrying amounts. For loan commitments and financial guarantee contracts, the amounts in the table represent the amounts committed or guaranteed, respectively. The gross amount of the financial assets below represents the Bank's maximum exposure to credit risk on these assets.
2018
Loans and advances to customers at amortised cost
Accrued income
In US$000
The Bank’s business involves taking on risks in a reasonable manner and managing them professionally. The core functions of the Bank’s risk management are to identify all key risks facing the Bank, measure these risks, manage the risk positions and determine capital allocations. The Bank regularly reviews its risk management policies and systems to reflect changes in markets, products and best market practice.
The Bank is not regulated by any monetary and/or financial authority, but strives to comply with all international risk management standards and to operate in accordance with the best practices in the industry.
To conduct the Bank’s operations in a manner consistent with its charter and aims, objectives and expectations of its stakeholders, the Board of Directors has approved the Risk Management Policies and Procedures (RMPP). This document incorporates different risk management policies that were operating as stand-alone policies into an integrated document that takes an enterprise wide approach to risk management.
The Bank identifies and controls the various operational risks inherent in its business. Operational risk is managed and mitigated by ensuring that there is appropriate infrastructure, controls, systems, procedures, and trained and competent people in place discharging the various functions.
The risk management governance structure comprises (i) Board of Directors, responsible for oversight and approval of risk policies; (ii) Board Executive Committee, responsible for credit approval above management’s authority levels; (iii) Management Risk and Strategy Committee, responsible for the risk policies review and implementation; and (iv) Risk Management Department, responsible for risk policies development and monitoring.
F-57

AFRICAN EXPORT-IMPORT BANKNOTES TO THE SPECIAL PURPOSE FINANCIAL STATEMENTSFOR THE YEAR ENDED 31 DECEMBER 2018
12-month ECL
Lifetime ECL not credit-
impaired
Lifetime ECL credit-
impaired Total 2017Loan CommitmentGrades 1-3: Low risk - - - - -Grades 4-6: Satisfactory risk 40,617 - - 40,617 5,096Grades 7-8: Moderate list 335,623 - - 335,623 263,229Grade 9-10: Watchlist 1,545 - - 1,545 -Grade 11: Sub-standard 167,389 - - 167,389 -Grade 12-13: Doubtful and Bad - - - - 52,916Grade 14: Loss - - - - -Gross amount 545,174 - - 545,174 321,241Loss allowance (7,171) - - (7,171) -3,940Carrying amount 538,003 - - 538,003 317,301
12-month ECL
Lifetime ECL not credit-
impaired
Lifetime ECL credit-
impaired Total 2017
Grades 1-3: Low risk - - - - -Grades 4-6: Satisfactory risk 50,000 - - 50,000 236,014Grades 7-8: Moderate list 199,182 - - 199,182 65,525Grade 9-10: Watchlist - - - - 75,142Grade 11: Sub-standard 187,284 - - 187,284 -Grade 12-13: Doubtful and Bad - - - - -Grade 14: Loss - - - - -Gross amount 436,466 - - 436,466 376,681Loss allowance (1,645) - - (1,645) -701Carrying amount 434,821 - - 434,821 375,980
12-month ECL
Lifetime ECL not credit-
impaired
Lifetime ECL credit-
impaired Total 2017
Grades 1-3: Low risk - - - - -Grades 4-6: Satisfactory risk 155,652 - - 155,652 226,847Grades 7-8: Moderate list 260,238 - - 260,238 9,000Grade 9-10: Watchlist - - - - -Grade 11: Sub-standard 5,669 - - 5,669 82,181Grade 12-13: Doubtful and Bad - - - - 1,912Grade 14: Loss - - - - -Gross amount 421,559 - - 421,559 319,940Loss allowance (343) - - (343) -85Carrying amount 421,216 - - 421,216 319,855
Note 2018 2017Rated AAA 20 - - Rated AA- to AA+ 20 - - Rated A- to A+ 20 - - Rated BBB+ and below 20 - - Unrated 20 170,268 30,268 Gross amount 170,268 30,268Loss allowance (1,940) (810)Carrying amount 168,328 29,458
Rated AAA 16.1 150,107 180,605 Rated AA- to AA+ 16.1 50,000 100,267 Rated A- to A+ 16.1 602,659 1,341,863Rated BBB+ and below 16.1 502,860 730,440 Gross amount 1,305,626 2,353,175Loss allowance (36) (99)Carrying amount 1,305,590 2,353,076
US$'000
Financial guarantee contracts
Letter of credits
The following table sets out the credit quality of debt investment securities measured at amortised. The analysis has been based on external rating agency ratings. All Invements securities, money market placements deposits with other banks are under stage 1 given that there is no siginificant deterioration in the credit risk
Investment securities - Treasury bills
Money market placements
US$'000
US$'000
F-58

AFRICAN EXPORT-IMPORT BANKNOTES TO THE SPECIAL PURPOSE FINANCIAL STATEMENTSFOR THE YEAR ENDED 31 DECEMBER 2018
12-month ECL
Lifetime ECL not credit-
impaired
Lifetime ECL credit-
impaired Total 2017Deposit with other banksRated AAA 16.1 - -Rated AA- to AA+ 16.1 469,577 453,844Rated A- to A+ 16.1 32,010 280,968Rated BBB+ and below 16.1 170 36,988Unrated 111,000 89,507Gross amount 612,757 861,307Loss allowance (14) (3)Carrying amount 612,743 861,304
The following table sets out the credit analysis for loans and adavnces to customers measured at FVTPL.
2018 2017
Grades 7-8: Moderate risk 129,783 -Total carrying amount 129,783 -
Notional Amount Fair Value
Notional Amount Fair Value
2018Derivative assets 888,500 3,684 888,500 3684Derivative liabilities 700,000 (24,840) 700,000 (24,840)2017Derivative assets 575,000 3,574 575,000 3,574Derivative liabilities 1,100,000 (21,467) 1,100,000 (21467)
Collateral held and other credit enhancement
Derivative transactions 100 100 Cash
- - None
Loans and advances to customers 100+ 100+
Equity instrumentsCashMachineryInventoryTreasury billsInsuranceLegal mortgageGuarantee
Debt investment securities- - None
Deposit with other banks- - None
Money market placements
US$ 000 31 December 2018 31 December 2017Principal type of collateral held
Deposits with other banksThe Bank held cash and bank balances US$613 million at December 2018 (2017: US$862 million). A siginficant portion of cash and bank balances are held with central banks and financial institution counterparties that are rated BB+ to AA+, based on external rating agency ratings. In some cases, the Bank can maintain cash and bank balances with sovereigns with no rating.
The Bank holds collateral and other credit enhancements against certain of its credit exposures. The following table sets out the principal types of collateral held against different types of financial assets
Type of Credit exposurePercentage of exposure that is subject to collateral requirements
US'000
In millions of usdLoans and advances to customers
The following table shows an analysis of counterparty credit exposures arising from derivative transactions. Derivative transactions of the Bank are generally fully collateralised by cash.
F-59

AFRICAN EXPORT-IMPORT BANKNOTES TO THE SPECIAL PURPOSE FINANCIAL STATEMENTSFOR THE YEAR ENDED 31 DECEMBER 2018
GuaranteesEquity instrumentsMachineriesCashTreasury billsInsuranceLegal MortgageInventories
During the period, there was no change in the Bank’s collateral policies.Assets obtained by taking possession of collateral
12,714,988
The Bank’s policy is to pursue timely realisation of the collateral in an orderly manner. The Bank does not generally use the non-cash collateral for its ownoperations. During the period there were no assets obtained by taking possession of collateral.
4,797,687 6,282,519 Collateral types
153,337 -
836,963 457,964 2,996,907 3,290,232 2,866,667 2,031,598
1,399,613 227,329
1,104,084 319,692
16,190,600
20172018
At 31 December 2018, the net carrying amount of credit-impaired loans and advances to customers amounted to US$174 million (2017: US$61 million) and the value of identifiable collateral held against those loans and advances amounted to US$215 million (2017: US$187 million). For each loan, the value of disclosed collateral is capped to the nominal amount of the loan that is held against. The table below summarised the total values of the collateral by collateral types;
Loans and advance to customersThe general creditworthiness of a corporate customer tends to be the most relevant indicator of credit quality of a loan extended to it. However, collateral provides additional security and the Bank generally requests that corporate borrowers provide it. The Bank may take collateral in the form of a cash and non-cash colateral like, treasury bills, legal mortgage, inventories and other liens and financial guarantees etc.
In the course of lending, the bank focuses on the high quality customers and therefore does not routinely update the valuation of collateral held against all loans to these customers. Valuation of collateral is updated when the loan is put on a watch list and the loan is monitored more closely.For credit-impaired loans, the Bank obtains appraisals of collateral because it provides input into determining the management credit risk actions.
1,427,265 713,731
F-60

AFRICAN EXPORT-IMPORT BANKNOTES TO THE SPECIAL PURPOSE FINANCIAL STATEMENTSFOR THE YEAR ENDED 31 DECEMBER 2018
3.3.2
Significant increase in credit risk
• the remaining lifetime probability of default (PD) as at the reporting date; with•
Credit risk grades
Rating GradesIFRS 9
Reclassification Grade
Description
123456789
1011 IF3 Substandard12 Default13 Default14 Default
Generating the term structure of PD
The table below shows the Bank's rating grades and their risk definitions;
Credit risk grades are a primary input into the determination of the term structure of PD for exposures.The Bank collects performance and default informationabout its credit risk exposures analysed by jurisdiction or region and by type of product and borrower as well as by credit risk grading. For some portfolios,information purchased from external credit reference agencies is also used.
The Bank employs statistical models to analyse the data collected and generate estimates of the remaining lifetime PD of exposures and how these are expected tochange as a result of the passage of time.
This analysis includes the identification and calibration of relationships between changes in default rates and changes in key macro-economic factors as well as in-depth analysis of the impact of certain other factors (e.g. forbearance experience) on the risk of default. For most exposures, key macro-economic indicatorsinclude: GDP growth, benchmark interest rates and unemployment. For exposures to specific industries and/or regions, the analysis may extend to relevantcommodity and/or real estate prices.
The Bank’s Economic Research team (RICO) in discussion with the Credit Risk Management, Finance, Treasury, and Business development teams shall at theend of every reporting period identify macroeconomic variables that may impact the Bank’s risk assets portfolio. Based on advice from the Bank's (RICO) andconsideration of a variety of external actual and forecast information, the Bank produces base case, best case and worst case forecasts of the selected macro-economic indicators, based on trends in the indicators and macro-economic commentaries. The Bank then uses these forecasts to adjust its ECL estimates.
IF2
IF5
Low risk
Satisfactory risk
Moderate risk
Watchlist
4. Existing and forecast changes in business, financial and economic conditions
Amount Arising from Expeceted Credit Loss (ECL)Inputs, assumptions and techniques used for estimating impairment
When determining whether the risk of default on a financial instrument has increased significantly since initial recognition, the Bank considers reasonable andsupportable information that is relevant and available without undue cost or effort. This includes both quantitative and qualitative information and analysis, basedon the Bank’s historical experience and expert credit assessment and including forward-looking information.
The objective of the assessment is to identify whether a significant increase in credit risk has ccurred for an exposure by comparing:
the remaining lifetime PD for this point in time that was estimated at the time of initial recognition of the exposure (adjusted where relevant for changes in prepayment expectations).
The Bank allocates each exposure to a credit risk grade based on a variety of data that is determined to be predictive of the risk of default and applyingexperienced credit judgement. In some cases, the Bank allocate exposures to credit risk grade using rating grade by external rating agencies. Credit risk grades aredefined using qualitative and quantitative factors that are indicative of risk of default. These factors vary depending on the nature of the exposure and the type ofborrower.Credit risk grades are defined and calibrated such that the risk of default occurring increases exponentially as the credit risk deteriorates so, for example, thedifference in risk of default between credit risk grades 1 and 2 is smaller than the difference between credit risk grades 2 and 3.
Each exposure is allocated to a credit risk grade at initial recognition based on available information about the borrower. Exposures are subject to ongoingmonitoring, which may result in an exposure being moved to a different credit risk grade. The monitoring typically involves use of the following data;
1. Information obtained during periodic review of customer files - e.g. audited financial statements, management accounts, budgets and projections, Payment record- this includes overdue status as well as a range of variables about payment ratios. Others relevant factors are gross profit margins, financial leverage ratios,debt service coverage, compliance with covenants, quality of management, senior management changes
2. Data from credit reference agencies, rating agencies, press articles, changes in external credit ratings3. Quoted bond and credit default swap (CDS) prices for the borrower where available
In determining the ECL for other assets, the Bank applies the simplified model to estimate ECLs, adopting a provision matrix to determine the lifetime ECLs. Theprovision matrix estimates ECLs on the basis of historical default rates, adjusted for current and future economic conditions (expected changes in default rates)without undue cost and effort.
IF1
F-61

AFRICAN EXPORT-IMPORT BANKNOTES TO THE SPECIAL PURPOSE FINANCIAL STATEMENTSFOR THE YEAR ENDED 31 DECEMBER 2018
Determining whether credit risk has increased significantly
•• the criteria do not align with the point in time when an asset becomes 30 days past due; and•
• its remaining lifetime PD at the reporting date based on the modified terms; with•
Definition of defaultThe Bank considers a financial asset to be in default when:
•
•
In assessing whether a borrower is in default, the Bank considers indicators that are:• qualitative - e.g. breaches of covenant;•• based on data developed internally and obtained from external sources.
Inputs into the assessment of whether a financial instrument is in default and their significance may vary over time to reflect changes in circumstances.
The Bank's definition of default largely aligns with that applied by the Bank for regulatory capital purposes.
Using its expert credit judgement and, where possible, relevant historical experience, the Bank may determine that an exposure has undergone a significantincrease in credit risk based on particular qualitative indicators that it considers are indicative of such and whose effect may not otherwise be fully reflected in itsquantitative analysis on a timely basis.
As a backstop, the Bank considers that a significant increase in credit risk occurs no later than when an asset is more than 30 days past due. Days past due aredetermined by counting the number of days since the earliest elapsed due date in respect of which full payment has not been received. Due dates are determinedwithout considering any grace period that might be available to the borrower.
The Bank monitors the effectiveness of the criteria used to identify significant increases in credit risk by regular reviews to confirm that:
quantitative - e.g. overdue status and non-payment on another obligation of the same issuer to the Bank; and
there is no unwarranted volatility in loss allowance from transfers between 12-month PD (stage 1) and lifetime PD (stage 2).The contractual terms of a loan may be modified for a number of reasons, including changing market conditions, customer retention and other factors not relatedto a current or potential credit deterioration of the customer. An existing loan whose terms have been modified may be derecognised and the renegotiated loanrecognised as a new loan at fair value in accordance with the accounting policy set out in the accounting policy.
When the terms of a financial asset are modified and the modification does not result in derecognition, the determination of whether the asset’s credit risk hasincreased significantly reflects comparison of:
the remaining lifetime PD estimated based on data at initial recognition and the original contractual terms.
The Bank renegotiates loans to customers in financial difficulties (referred to as ‘forbearance activities’a) to maximise collection opportunities and minimise therisk of default. Under the Bank’s forbearance policy, loan forbearance is granted on a selective basis if the debtor is currently in default on its debt or if there is ahigh risk of default, there is evidence that the debtor made all reasonable efforts to pay under the original contractual terms and the debtor is expected to be able tomeet the revised terms.
The revised terms usually include extending the maturity, changing the timing of interest payments and amending the terms of loan covenants. Both retail andcorporate loans are subject to the forbearance policy. The Bank Audit Committee regularly reviews reports on forbearance activities.
For financial assets modified as part of the Bank’s forbearance policy, the estimate of PD reflects whether the modification has improved or restored the Bank’sability to collect interest and principal and the Bank’s previous experience of similar forbearance action. As part of this process,the Bank evaluates the borrower’spayment performance against the modified contractual terms and considers various behavioural indicators.
Generally, forbearance is a qualitative indicator of a significant increase in credit risk and an expectation of forbearance may constitute evidence that an exposureis credit-impaired/in default. A customer needs to demonstrate consistently good payment, in addition to other qualitative behavious over a period of time beforethe exposure is no longer considered to be credit-impaired/in default or the PD is considered to have decreased such that the loss allowance reverts to beingmeasured at an amount equal to 12-month ECL or Lifetime ECL not credit-impaired.
the borrower is unlikely to pay its credit obligations to the Bank in full, without recourse by the Bank to actions such as realising security (if any is held); orthe borrower is past due more than 90 days on any material credit obligation to the Bank.Overdrafts are considered as being past due once the customer has breached an advised limit or been advised of a limit smaller than the current amount outstanding.
the criteria are capable of identifying significant increases in credit risk before an exposure is in default;
The criteria for determining whether credit risk has increased significantly vary by portfolio and include quantitative changes in PDs and qualitative factors,including a backstop based on delinquency.
The credit risk of a particular exposure is deemed to have increased significantly since initial recognition if, based on the Bank’s quantitative modelling, theremaining lifetime PD is determined to have increased by more than a predetermined percentage/range.
F-62

AFRICAN EXPORT-IMPORT BANKNOTES TO THE SPECIAL PURPOSE FINANCIAL STATEMENTSFOR THE YEAR ENDED 31 DECEMBER 2018
Incorporation of forward-looking information
2018 2017Crude price Base 8% Base 6%
Range between 7 and 10% Range between 5 and 8%Interest rates Base 1% Base 2%
Range between 0.5 and 2% Range between 1 and 3%GDP growth Base 1.5% Base 2%
Range between 0 and 2.5% Range between 0.5 and 3%
Measurement of ECLThe key inputs into the measurement of ECL are the term structure of the following variables:
• probability of default (PD);• loss given default (LGD);• exposure at default (EAD).
Predicted relationships between the key indicators and default and loss rates on various portfolios of financial assets have been developed based on analysinghistorical data over the past 5 years.
These parameters are generally derived from internally developed statistical models, external data and other historical data. They are adjusted to reflect forward-looking information as described above.
The Bank incorporates forward-looking information into both its assessment of whether the credit risk of an instrument has increased significantly since its initialrecognition and its measurement of ECL. Based on advice from the Bank RICO and consideration of a variety of external actual and forecast information, theBank formulates a forecast of the future direction of relevant economic variables as well as a representative range of other possible forecast scenarios. This processinvolves developing two or more additional economic scenarios and considering the relative probabilities of each outcome. External information includeseconomic data and forecasts published by governmental bodies and monetary authorities in the countries where the Bank operates, supranational organisationssuch as the OECD and the International Monetary Fund, and selected private-sector and academic forecasters.
The base case represents a most-likely outcome and is aligned with information used by the Bank for other purposes such as strategic planning and budgeting. Theother scenarios represent more optimistic and more pessimistic outcomes. Where, there are no significant correlations between the macroeconomic variable anddefault, the Bank supplement this analysis with expert judgement. In cases where the Bank use expert judgment due to limitations, it shall keep exploring otheroptions to arrive at a statistical basis for incorporating FLI into its ECL computation.Furthermore, the Bank periodically carries out stress testing of more extreme shocks to calibrate its determination of these other representative scenarios.
The Bank has identified and documented key drivers of credit risk and credit losses for each portfolio of financial instruments and, using an analysis of historicaldata, has estimated relationships between macro-economic variables and credit risk and credit losses. The economic scenarios used as at 31 December 2018 and2017 are as follows;
F-63

AFRICAN EXPORT-IMPORT BANKNOTES TO THE SPECIAL PURPOSE FINANCIAL STATEMENTSFOR THE YEAR ENDED 31 DECEMBER 2018
• instrument type;• credit risk gradings;• collateral type;• Past due information;• date of initial recognition;• remaining term to maturity;• industry; and• geographic location of the borrower.
Financial Instrument EAD LGD PD
Loans and advances Estimated Individually based on the amortization pattern of the loan
Off-balance sheet items
Segmented based on type of off-balance sheet item.
Placements, Debt/Investment securities, and Trade receivables with significant financing components
Estimated Individually based on amortization pattern of the security
Estimated collectively based on external data (e.g. Moody’s historical recovery rates)
Segmented based on external credit ratings
Trade receivables without significant financing components
Segmented by days past due buckets
The groupings are subject to regular review to ensure that exposures within a particular group remain appropriately homogeneous. Below is information on how the Bank has segmented its portfolio for the purpose of computing ECL.
For portfolios in respect of which the Bank has limited historical data such as investment securities - debt, Money market placement & deposit with other banks selected external ratingagencies is used to supplement the internally available data.External benchmark is unavailable
Probability of Default is a measure of the likelihood that an obligor will default on a contractual obligation. PD estimate are calculated based on statistical rating models, and assessed usingrating tools tailored to the various categories of counterparties and exposures.These statistical models are based on internally compiled data comprising both quantitative and qualitativefactors. Generally, the Bank uses two approaches in estimating PDs: Internally generated PDs (where internal data is available) and External PDs (where internal data is unavailable). For the purposes of PD estimation for internally rated financial assets, credit ratings were adopted as the basis for homogenous segmentation. This means that PDs will be derived for eachloan based on the credit rating attached to the loan. As a result, every loan with similar credit rating would have the same PD. In External PDs, market data are used to derive the PDs forcounterparties. If a counterparty or exposure migrates between rating classes, then this will lead to a change in the estimate of the associated PD.
Loss Given Default is the measure of the proportion of the outstanding balance that the Bank stands to lose in the event of a default. The Bank estimates LGD parameters based on thehistory of recovery rates of claims against defaulted counterparties. The LGD models consider the structure, collateral, seniority of the claim, counterparty industry, currency adjustmentfactors, and recovery costs of any collateral that is integral to the financial asset. Due to insufficient historical recovery data, the Bank has applied standard recovery rates for differentcollateral types including sovereign and corporate investments. This is calculated by applying standard haircuts on the collateral value and are calculated on a discounted cash flow basisusing the effective interest rate as the discounting factor.
Exposure at default is an estimate of the outstanding balance on a credit facility at the time of default. The outstanding balance includes the gross amortised cost, accrued principal andinterest, and overdue principal and interest. Multi-period EADs are a collection of EAD values referring to different time periods over the lifetime of a financial asset.The Bank estimates the multi-period EAD for on-balance sheet exposures, based on the contractual repayment cash flows and expectation of future prepayment. For off-balance sheet exposures, the EAD includes the amount drawn, as well as potential future amounts that may be drawn under the contract. In this case, the Bank will estimate the creditexposure equivalent (CEE) of all off-balance sheet exposures including lines of credit, letters of credit (LC), loan commitment, guarantees and standby letter of credit (SBLC). This is doneusing the credit conversion factor (CCF). CCF is the rate at which off-balance sheet commitments crystalise and become on-balance sheet exposures
As described above, and subject to using a maximum of a 12-month PD for financial assets for which credit risk has not significantly increased, the Bank measures ECL considering the riskof default over the maximum contractual period (including any borrower’s extension options) over which it is exposed to credit risk, even if, for risk management purposes, the Bankconsiders a longer period. The maximum contractual period extends to the date at which the Bank has the right to require repayment of an advance or terminate a loan commitment orguarantee.
However, for overdrafts and revolving facilities that include both a loan and an undrawn commitment component, the Bank measures ECL over a period longer than the maximumcontractual period if the Bank’s contractual ability to demand repayment and cancel the undrawn commitment does not limit the Bank’s exposure to credit losses to the contractual noticeperiod.These facilities do not have a fixed term or repayment structure and are managed on a collective basis. The Bank can cancel them with immediate effect but this contractual right is notenforced in the normal day-to-day management, but only when the Bank becomes aware of an increase in credit risk at the facility level. This longer period is estimated taking into accountthe credit risk management actions that the Bank expects to take and that serve to mitigate ECL. These include a reduction in limits, cancellation of the facility and/or turning the outstandingbalance into a loan with fixed repayment terms.
Where modelling of a parameter is carried out on a collective basis, the financial instruments are Banked on the basis of shared risk characteristics that include:
Segmented based on collateral type.
Segmented based on internal credit rating
Loss rate segmented based on days past due buckets
F-64

AFRICAN EXPORT-IMPORT BANKNOTES TO THE SPECIAL PURPOSE FINANCIAL STATEMENTSFOR THE YEAR ENDED 31 DECEMBER 2018
3.3.3 ALLOWANCE FOR IMPAIRMENT
Loan allowance
12-month ECLLifetime ECL not
credit-impairedLifetime ECL
credit-impaired Total Specific Collective Total
50,727 48,521 205,372 304,620 144,372 23,046 167,4187,038 (7,038) - - - -
(4,620) 37,882 (33,262) - -- (11,482) 11,482 - -
(21,769) (16,518) 120,189 81,902 58,086 5,311 63,39725,829 15,382 - 41,211 -(9,356) (6,699) (2,096) (18,151) -
Write-offs - - (139,164) (139,164) (51,972) (51,972)- - - - -- - - - 1,757 - 1,757
47,849 60,048 162,521 270,418 152,243 28,357 180,600
the changes in the reported loss allowance as disclosed in the table above was mainly impacted by the gross loans amounts written off during 2018 see note (17.2 a)-
Money market placements
99 - - 99(63) - - (63)- - - -- - - -
36 - - 36 - -
Deposit with other banks
3 - - 311 - - 11
- - - -- - - -
14 - - 14 - -
Investment securities at amortised cost
810 - - 8101,130 - - 1,130
- - - -- - - -
1,940 - - 1,940 - -
Financial guarantee contracts
Balance at 1 January 701 701 -Net remeasurement of loss allowance 944 944 -
- -Foreign exchange and other movements - -Balance at 31 December 1,645 - - 1,645 - -
Loan commitments
Balance at 1 January 3,940 3,940 -Net remeasurement of loss allowance 3,231 3,231 -
- -Foreign exchange and other movements - -Balance at 31 December 7,171 - - 7,171 - -
Letter of creditsBalance at 1 January 85 85 - -Net remeasurement of loss allowance 258 258 -
- -Foreign exchange and other movements - -
Balance at 31 December 343 - - 343 - -
Accrued income
Balance at 1 January 1,319 1,319 2,848 New financial assets originated or purchased - 8,403 8,403 (1,749)
- - - -Foreign exchange and other movements - - - - Balance at 31 December - - 9,722 9,722 - 1,099
Changes in models/risk parameters
Changes in models/risk parameters
Changes in models/risk parameters
Balance at 31 December
Balance at 1 JanuaryNet remeasurement of loss allowanceChanges in models/risk parametersForeign exchange and other movements
Balance at 31 December
Changes in models/risk parameters
Foreign exchange and other movements
Balance at 1 JanuaryNet remeasurement of loss allowanceChanges in models/risk parametersForeign exchange and other movements
Balance at 31 December
Balance at 1 JanuaryNet remeasurement of loss allowanceChanges in models/risk parameters
Changes in models/risk parametersForeign exchange and other movements
Balance at 31 December
Transfer to lifetime ECL not credit-Transfer to lifetime ECL credit-impairedNet remeasurement of loss allowance including changes in EADNew financial assets originated or Financial assets that have been
The following tables show reconciliations from the opening to the closing balance of the loss allowance by class of financial instrument. Explanation of the terms: 12-month ECL, lifetime ECL and credit-impaired are included in Note 18. Comparative amounts for 2017 represent allowance account for credit losses and reflect measurement basis under IAS 39.
2017
Transfer to 12-month ECL
2018
USD'000
Loans and advances to customers at amortised cost
Restated balance at 1 January
F-65

AFRICAN EXPORT-IMPORT BANKNOTES TO THE SPECIAL PURPOSE FINANCIAL STATEMENTSFOR THE YEAR ENDED 31 DECEMBER 2018
3.3.3 ALLOWANCE FOR IMPAIRMENT (CONTINUED)
Credit-impaired financial assets
2018 201760,657 100,837
IFRS 9 Impact at 1 January 90,093 - Change in allowance for impairment (96,991) (78,116)Classified as credit-impaired during the year 288,782 35,818
(93,808) - Net repayments (74,307) - Other movements - 2,118
174,426 60,657
Impaired financial assets - Comparative information under IAS 39Loan advances to
customersMoney market
placementsDeposit with other
banksInvestment
securities - held to maturity
2017 2017 2017 2017Neither past due nor impaired 8,218,407 2,353,175 861,307 30,268Past due but not impaired 295,007Impaired 212,902Gross 8,726,316 2,353,175 861,307 30,268Allowance for impairment (180,600)Net carrying amount 8,545,716 2,353,175 861,307 30,268
Loan advances to customers
Money market placements
Deposit with other banks
Investment securities - held to
maturityUS$'000 2018 2018 2018 2018Neither past due nor impairedGrades 1-3: Low risk 1,256,151 1,305,626 612,757 170,268Grades 4-6: Satisfactory risk 2,471,460Grades 7-8: Moderate list 3,828,321Grade 9-10: Watchlist 1,223,660Grade 11: Sub-standard 389,153Grade 12-13: Doubtful and Bad - Grade 14: Loss
9,168,745 1,305,626 612,757 170,268
Past due but not impaired30-60 days - 61-90 days 231,41891-180 days 579,652181 days+ 958,297
1,769,367 -
Individually impairedGrade 11: Sub-standard 53,773Grade 12-13: Doubtful and Bad 282,737Grade 14: Loss 436
336,946 - - - Allowance for impairmentIndividual 162,520 - - - Collective 107,898 36 14 1,940Total allowance for impairment 270,418 36 14 1,940
Credit-impaired loans and advances to customers at 1 January
Transferred to not credit-impaired during the year
Credit-impaired loans and advances to customers at 31 December
USD'000
The following table sets out a reconciliation of changes in the net carrying amount of credit-impaired loans and advances to customersUSD'000
F-66

AFRICAN EXPORT-IMPORT BANKNOTES TO THE SPECIAL PURPOSE FINANCIAL STATEMENTSFOR THE YEAR ENDED 31 DECEMBER 2018
3.3.4 Concentration risks of loans and advances to customers with credit risk exposure
a) Geographical sectors
2018 2017% US$000 % US$000
West Africa 48.7 5,548,560 49.5 4,329,704North Africa 25.2 2,879,597 22.6 1,969,195East Africa 9.5 1,089,106 8.9 774,360Central Africa 5.0 575,225 7.5 650,335Southern Africa 11.6 1,312,353 11.5 1,002,722Total (Note 17) 100 11,404,841 100 8,726,316
b) Industry sectors
2018 2017% US$000 % US$000
Agriculture 2.0 225,151 2.5 222,032Agro-processing 3.5 402,755 1.9 165,306Financial Services 49.8 5,674,340 56.9 4,968,172Government 5.5 629,692 3.0 260,549Hospitality (Hotels, Resorts, etc.) 1.5 172,323 3.3 287,928Manufacturing 2.8 317,595 4.0 352,363Metals and Minerals 1.0 115,660 0.3 27,803Oil and Gas 18.6 2,122,734 12.8 1,114,942Other 0.3 42,967 0.5 40,104Power 5.6 634,007 6.9 603,190Telecommunication 7.0 795,330 3.8 328,014Transportation 2.4 272,287 4.1 355,911Total (Note 18) 100 11,404,841 100 8,726,315
3.4 Market risk
3.4.1 Interest rate risk
As at 31 December 2018 Up to 3 3-6 6-12 Over Non interest Fixed Ratemonths months months 1 year bearingUS$000 US$000 US$000 US$000 US$000 US$000
Financial assetsCash and due from banks 612,757 - - - 101 -Deposits with other banks 1,305,626 - - - -Loans and advances to customers at amortised cost 7,804,378 1,942,411 1,528,270Loans and advances to customers (FVTPL) 129,783 - - - -Other assets - - - - 13,988 -Financial investments - held to maturity - - - - 168,328Total financial assets 9,852,544 1,942,411 - - 14,089 1,696,598
Financial liabilitiesDue to banks 181,167 336,000 559,525 2,808,056 - 1,263,197Debt securities in issue - - 575,000 886,500 - 1,566,217Deposits and customer accounts 320,904 - - - - 2,044,481Other liabilities - - - - 113,805Total financial liabities 502,071 336,000 1,134,525 3,694,556 113,805 4,873,895
Total interest gap 9,350,472 1,606,411 (1,134,525) (3,694,556) - -
Cumulative gap 9,350,472 10,956,883 9,822,359 6,127,803
Interest rate movements affect the Bank’s profitability. Exposure to interest rate movements exists because the Bank has assets and liabilities on which interest rates either changefrom time to time (rate sensitive assets and liabilities) or, do not change (rate insensitive assets and liabilities). Exposure to interest rate movements arises when there is a mismatchbetween the rate sensitive assets and liabilities.
The Bank closely monitors interest rate movements and seeks to limit its exposure by managing the interest rate and maturity structure of assets and liabilities carried on thestatement of financial position. Interest rate swaps are also used to manage interest rate risk.The table below summarizes the Bank’s exposure to interest rate risks as at 31 December 2018. It includes the Bank’s financial instruments at carrying amounts (non-derivatives),categorized by the period of contractual re-pricing.
The following table breaks down the Bank’s credit exposure at their gross amounts (without taking into account any collateral held or other credit support), as categorized by
The following table breaks down the Bank’s credit exposure at their gross amounts (without taking into account any collateral held or other credit support), as categorized by
F-67

AFRICAN EXPORT-IMPORT BANKNOTES TO THE SPECIAL PURPOSE FINANCIAL STATEMENTSFOR THE YEAR ENDED 31 DECEMBER 2018
3.4 Market risk (Continued)
3.4.1 Interest rate risk
As at 31 December 2017 Up to 3 3-6 6-12 Over Non interest Fixed Ratemonths months months 1 year bearingUS$000 US$000 US$000 US$000 US$000 US$000
Financial assetsCash and due from banks 861,307 - - - 90 -Deposits with other banks 2,152,584 200,592 - - - -Loans and advances to customers 5,059,420 673,502 941,637 - 2,051,755Prepayments and accrued income - - - - 239,329 -Other assets - - - - 2,931 -Financial investments - held to maturity - - - - 30,268Total financial assets 8,073,311 874,094 941,637 - 2,294,105 30,268
Financial liabilitiesDue to banks 72,313 100,000 466,000 1,702,601 - 1,890,460Debt securities in issue - 400,000 - 1,275,000 - 1,206,622Deposits and customer accounts 386,517 - - - - 1,762,839Other liabilities - - - - 85,713Total financial liabities 458,830 500,000 466,000 2,977,601 85,713 4,859,921
Total interest gap 7,614,481 374,094 475,637 (2,977,601) - -
Cumulative gap 7,614,481 7,988,575 8,464,212 5,486,611
Interest rate risk sensitivity analysis
Impact on Impact on Impact on Impact on Carrying profit or loss profit or loss Carrying profit or loss profit or loss
amount and equity and equity amount and equity and equity2018 2018 2018 2017 2017 2017
US$000 US$000 US$000 US$000 US$000 US$000
Changes in interest rates +90bp of US$1R (-)90bp of US$1R +90bp of US$1R (-)90bp of US$1R
Financial assetsCash due from banks 612,859 5,516 (5,516) 861,396 7,753 (7,753)Deposits with other banks 1,305,626 11,751 (11,751) 2,353,176 21,179 (21,179)Gross loans and advances to customers 11,404,841 102,644 (102,644) 8,726,315 78,537 (78,537)Impact from financial assets 13,323,326 119,911 (119,911) 11,940,887 107,469 (107,469)
Financial liabilitiesDue to banks 3,884,747 (34,963) 34,963 2,340,914 (21,068) 21,068Debt securities in issue 1,461,500 (13,154) 13,154 1,675,000 (15,075) 15,075Deposits and customer accounts 320,904 (2,888) 2,888 386,517 (3,479) 3,479Impact from financial liabilities 5,667,151 (51,005) 51,005 4,402,431 (39,622) 39,622
Total increase/(decrease) on profit or loss and equity 7,656,175 68,906 (68,906) 7,538,456 67,847 (67,847)
3.4.2 Foreign exchange risk exposure
At 31 December 2018, if interest rates at that date had been 90 basis points higher with all other variables held constant, profit and reserves for the year would have been US$37,197,000 (2017: US$ 28,970,000) lower, arising mainly as a result of the higher decrease in interest income on loans than the decrease in interest expense on borrowing . Ifinterest rates had been 90 basis points (2017: 90 basis points) lower, with all other variables held constant, profit would have been US$ 37,197,000 (2017: US$ 28,970,000) higher,arising mainly as a result of higher increase in interest income on loans than the increase in interest expense on borrowings . The sensitivity is higher in 2018 than in 2017 due toincrease in interest rate sensitive assets and liabilities.The table below summarizes the impact on profit or loss and equity for each category of financial instruments held as at 31 December 2018 and comparatives. It includes the Bank’sfinancial instruments at carrying amounts.
The Bank takes on exposure to the effects of fluctuations in the prevailing foreign currency exchange rates on its financial position and cash flows. Foreign exchange risk ismanaged by the Bank by matching assets and liabilities in respective currencies. The Bank also uses currency derivatives, especially forward foreign exchange contracts to hedgeforeign exchange risk.The table below summarises the Bank exposure to foreign currency exchange rate risk as at 31 December 2018. Included in the table are the Bank’s financial instruments atcarrying amounts, categorised by currency:
F-68

AFRICAN EXPORT-IMPORT BANKNOTES TO THE SPECIAL PURPOSE FINANCIAL STATEMENTSFOR THE YEAR ENDED 31 DECEMBER 2018
3.4 Market risk (Continued)
3.4.2 Foreign exchange risk exposure
Euro NGN Other Currencies TotalAs at 31 December 2018 US$000 US$000 US$000 US$000AssetsCash and due from banks 44,711 451 5,514 50,676Loans and advances to customers 1,276,631 - - 1,276,631Derivative for risk management - - 56,167 56,167Total financial assets 1,321,342 451 61,681 1,383,474
LiabilitiesDue to banks 1,094,590 - 56,167 1,150,757Deposits and customer accounts 5,568 - - 5,568Other liabilities 224,660 - - 224,660Derivatives for risk management 1,713 - - 1,713Total financial liabilities 1,326,531 - 56,167 1,382,698
Net exposure on statement of financial position (5,189) 452 5,514 776
Credit commitments & financial guarantees 87,781 - - 87,781
Euro NGN Other Currencies TotalAs at 31 December 2017 US$000 US$000 US$000 US$000AssetsCash and due from banks 227,444 1,215 1,016 229,675Loans and advances to customers 911,619 - - 911,619Total financial assets 1,139,063 1,215 1,016 1,141,294
LiabilitiesDue to banks 1,202,441 - 55,016 1,257,457Deposits and customer accounts 109,997 956 - 110,953Hedging derivatives - - 55,016 55,016Other liabilities 2,306 304 - 2,610Total financial liabilities 1,314,744 1,260 110,032 1,426,036
Net exposure on statement of financial position (175,681) (45) (109,016) (284,742)
Credit commitments & financial guarantees 1,842,535 - - 1,842,535
Foreign exchange risk sensitivity analysis
Impact on Impact on Impact on Impact on Carrying profit or loss profit or loss Carrying profit or loss profit or loss
amount and equity and equity amount and equity and equity2018 2018 2018 2017 2017 2017
US$000 US$000 US$000 US$000 US$000 US$000
Changes in value of USD against Euro 10% increase 10% decrease 10% increase 10% decreaseFinancial assetsCash due from banks 44,711 4,471 (4,471) 227,444 22,744 (22,744)Gross loans and advances to customers 1,276,631 127,663 (127,663) 911,619 91,162 (91,162)Hedging derivatives - -Impact from financial assets 1,321,342 132,134 (132,134) 1,139,063 113,906 (113,906)
Financial liabilitiesDue to banks 1,094,590 (109,459) 109,459 1,202,441 (120,244) 120,244Deposits and customer accounts 5,568 (557) 557 109,997 (11,000) 11,000Other liabilities 224,660 (22,466) 22,466 2,306 (231) 231Impact from financial liabilities 1,324,818 (132,482) 132,482 1,314,744 (131,475) 131,475
Total increase/(decrease) on profit or loss and equity (3,476) (348) 348 (175,681) (17,569) 17,569
The following analysis details the Bank’s sensitivity to a 10% increase and decrease in the value of the USD against the Euro, as the Bank is mainly exposed to Euro. 10% is thesensitivity rate used when reporting foreign currency risk internally and represents management 's assessment of the reasonably possible change in foreign exchange rates. The tablebelow summarizes the impact on profit or loss and equity for each category of Euro financial instruments held as at 31 December 2018. It includes the Bank’s Euro financialinstruments at carrying amounts.
At 31 December 2018, if foreign exchange rates at that date had been 10 percent lower with all other variables held constant, profit and reserves for the year would have been US$7,280,000 (2017: US$ 17,569,000) lower, arising mainly as a result of more financial liabilties than financial assets in Euro. If foreign exchange rates had been 10 percent higher,with all other variables held constant, profit would have been US$ 7,280,000 (2017: US$ 17,569,000) higher, arising mainly as a result of decline in revaluation of financial assetsthan financial liabilities in Euro.
F-69

AFRICAN EXPORT-IMPORT BANKNOTES TO THE SPECIAL PURPOSE FINANCIAL STATEMENTSFOR THE YEAR ENDED 31 DECEMBER 2018
3.5 Liquidity Risk
As at 31 December 2018 Up to 1 1-3 3-12 1-5 Over 5 2018month months months years years Total
US$000 US$000 US$000 US$000 US$000 US$000Financial assets by typeNon-derivative assetsCash and due from banks 612,858 - - - - 612,858Deposits with other banks 1,114,770 190,857 - - - 1,305,626Loans and advances to customers (HTM) 3,085,274 739,476 3,537,763 3,546,332 366,788 11,275,634Loans and advances to customers (FV) 16,151 16,151 64,603 32,302 - 129,207Dreivative assetsDerivative assets held for risk management 577 1,588 1,520 - - 3,685Total assets 4,829,630 948,072 3,603,887 3,578,634 366,788 13,327,010
Financial liabilitiesNon-derivative liabilitiesDue to banks 180,920 614,540 1,259,902 2,581,117 514,855 5,151,333Debt securities in issue - - 700,224 1,589,142 751,755 3,041,121Deposits and customer accounts 1,145,539 400,014 500,047 - - 2,045,600Derivative liabilitiesDerivative liabilities held for risk management - - - 24,840 - 24,840Total liabilities 1,326,459 1,014,554 2,460,173 4,195,099 1,266,610 10,262,894
Net liquidity gap 3,503,172 (66,482) 1,143,713 (616,464) (899,823) 3,064,115
Cumulative liquidity gap 3,503,172 3,436,689 4,580,402 3,963,938 3,064,115
As at 31 December 2017 Up to 1 1-3 3-12 1-5 Over 5 2017month months months years years Total
US$000 US$000 US$000 US$000 US$000 US$000Financial assetsNon-derivative assetsCash and due from banks 790,445 - - - - 790,445Deposits with other banks 2,152,584 - 200,592 - - 2,353,176Loans and advances 1,334,864 1,329,861 4,142,711 1,865,827 53,052 8,726,315Dreivative assetsDerivative assets held for risk management - - - 2,766 - 2,766Total assets 4,277,893 1,329,861 4,343,303 1,868,593 53,052 11,872,702
Financial liabilitiesNon-derivative liabilitiesDue to banks 125,966 421,314 1,208,211 2,593,474 68,937 4,417,903Debt securities in issue - - 508,648 1,824,962 946,917 3,280,526Deposits and customer accounts 881,235 400,827 502,097 - - 1,784,159Derivative liabilities -Derivative liabilities held for risk management - - 135 22,892 - 23,027Total liabilities 1,007,201 822,141 2,219,092 4,441,328 1,015,854 9,505,615
Net liquidity gap 3,270,692 507,720 2,124,212 (2,572,735) (962,802) 2,367,086
Cumulative liquidity gap 3,270,692 3,778,412 5,902,624 3,329,889 2,367,087
Liquidity risk concerns the ability of the Bank to fulfill its financial obligations as they become due. The management of the liquidity risk is focused on the timing of the cashinflows and outflows as well as in the adequacy of the available cash, credit lines and high liquidity investments. The Bank manages its liquidity risk by preparing dynamic cashflow forecasts covering all expected cash flows from assets and liabilities and taking appropriate advance actions. Further, the bank has committed credit lines it can draw in case ofneedThe table below analyses the Bank’s financial assets and financial liabilities (including principal and interest) into relevant maturity grouping based on the remaining period at thereporting date to the contractual maturity date as at 31 December 2018 and the amounts disclosed in the table are the contractual undiscounted cash flows:
Cash flows may be significantly different from those indicated in the above table
The table below analyses the contractual expiry by maturity of the Bank’s contingent liabilities. For issued financial guarantees contract, the maximum amount of the guarantee isallocated to the earliest period in which the guarantee could be called.
F-70

AFRICAN EXPORT-IMPORT BANKNOTES TO THE SPECIAL PURPOSE FINANCIAL STATEMENTSFOR THE YEAR ENDED 31 DECEMBER 2018
3.5 Liquidity Risk (continued)
Up to 1 1-3 3-12 1-5 Over 5month months months years years Total
US$000 US$000 US$000 US$000 US$000 US$000As at 31 December 2018Letters of credit 97,225 72,653 251,680 - - 421,558Financial guarantees 74,145 3,584 257,570 63,882 37,284 436,465Total 171,370 76,237 509,250 63,882 37,284 858,023
As at 31 December 2017Letters of credit 1,912 - 253,064 64,963 - 319,939Financial guarantees - 150,000 127,392 62,005 37,284 376,681Total 1,912 150,000 380,456 126,968 37,284 696,620
3.6 Capital management
2018 2017US$000 US$000
Capital adequacyShare capital 506,300 470,816Share premium 764,790 562,350Warrants 191,531 91,723General reserves 551,228 455,262Retained earnings 502,585 524,412Total Tier 1 capital 2,516,434 2,104,563
Asset revaluation reserve 12,741 9,395Collective impairment allowance 107,898 28,356Total Tier 2 capital 120,639 37,751
Total capital base 2,637,073 2,142,314
Risk weighted assetsOn-statement of financial position 9,023,048 7,261,266Off-statement of financial position:Credit risk 784,148 427,131Operational risk 729,572 568,056Market risk 774 763Total risk weighted assets 10,537,542 8,257,216
Basel capital adequacy ratio (Total capital base/Total risk weighted assets) 25% 26%
Capital adequacy is reviewed regularly by management using techniques based on the guidelines developed by Basel Committee.With effect from 1 January 2009, the Bank is complying with the provisions of the Basel II framework in respect of capital.
The risk-weighted assets is measured by means of a hierarchy of seven risk weights classified according to its nature and reflecting an estimate of credit, market and other risksassociated with each asset and counterparty. A similar treatment is adopted for off-statement of financial position exposures.
The table below summarizes the composition of capital and the ratio of the Bank’s capital for the year ended 31 December.
The increase of the capital in 2018 is primarily due to increase in profits and share capital subscriptions. The increase of risk weighted assets arises mainly from the growth in thebank's business.
The Bank’s objectives when managing capital, which is a broader concept than the equity on the face of statement of financial position, are:• To maintain a set minimum ratio of total capital to total risk weighted assets. The Bank’s minimum risk asset ratio is at least three per cent above minimum ratio prescribed fromtime to time by the Basel Committee on Banking Supervision;• To safeguard the Bank’s ability to continue as a going concern so that it can continue to provide returns to shareholders and benefits to other stakeholders; and• To maintain a strong capital position necessary for its long term financial health, and to support the development of its business.
The Bank is not subject to capital requirements by a regulatory body such as a central bank or equivalent. However, management has established a capital management policy that isbased on maintenance of certain capital adequacy ratio in line with Basel Committee requirements.
F-71

AFRICAN EXPORT-IMPORT BANKNOTES TO THE SPECIAL PURPOSE FINANCIAL STATEMENTSFOR THE YEAR ENDED 31 DECEMBER 2018
4 FAIR VALUE OF FINANCIAL ASSETS AND LIABILITIES
(a) Financial instruments not measured at fair value
2018 2017 2018 2017US$000 US$000 US$000 US$000
Financial assetsCash and cash equivalents 1,918,434 3,214,573 1,918,434 3,214,573Loans and advances to customers - amortised cost 11,134,424 8,545,716 11,420,557 8,981,351Financial investments at amortised cost 168,328 30,268 168,328 30,268Other assets 13,988 2,931 13,988 2,931Financial liabilitiesDue to banks 5,147,944 4,231,374 5,498,410 4,441,546Deposits and customer accounts 2,365,385 2,149,356 2,365,385 2,149,356Debt securities in issue 3,036,500 2,891,500 3,016,768 2,944,415Other liabilities 293,737 505,624 293,737 505,624
(b) Financial instruments measured at fair value are disclosed in note 5.
Fair value hierarchy
There were no transfers during the year
Level 2 2018 2017US$000 US$000
AssetsInterest rate swap 1,520 3,274Foreign exchange forward contracts 577 -Cross Currency Swap 1,587 300
3,684 3,574LiabilitiesInterest rate swap (24,840) (21,467)Foreign exchange forward contracts - -
(24,840) (21,467)(21,156) (17,893)
129,783 -
Fair value is the price that would be received to sell an asset or paid to transfer a liability in an ordinary transaction between market participantsat the measurement date. The fair values of financial instruments not recognized on the statement of financial position are the same figuresappearing as contingent liabilities and commitments (see note 7).
The table below summarizes the carrying amounts and fair values of those financial assets and liabilities not presented on the Bank’s statementof financial position at their fair value:
Carrying amount Fair value
• Loans and advances to customers and financial investments at amortised costLoans and advances are net of charges for impairment. The estimated fair value of loans and advances and financial investments represents thediscounted amount of estimated future cash flows expected to be received. Expected cash flows are discounted at current market rates todetermine fair value.
IFRS 13 specifies a hierarchy of valuation techniques based on whether the inputs to those valuation techniques are observable or unobservable.Observable inputs reflect market data obtained from independent sources; unobservable inputs reflect the Bank’s market assumptions. Thesetwo types of inputs have created the following fair value hierarchy:
• Level 1 – Quoted prices (unadjusted) in active markets for identical assets or liabilities. This level includes listed equity securities and debtinstruments on exchanges (for example, London Stock Exchange, Frankfurt Stock Exchange, New York Stock Exchange) and exchange tradedderivatives like futures (for example, Nasdaq, S&P 500).
• Level 2 – Inputs other than quoted prices included within Level 1 that are observable for the asset or liability, either directly (that is, as prices)or indirectly (that is, derived from prices). This level includes the majority of the OTC derivative contracts, traded loans and issued structureddebt. The source of input parameters like LIBOR yield curve or counterparty credit risk is Bloomberg.
• Level 3 – Inputs for the asset or liability that are not based on observable market data. This level includes equity investments and debtinstruments with significant unobservable components. This hierarchy requires the use of observable market data when available. The Bankconsiders relevant and observable market prices in its valuations where possible.
(i) The table below shows the fair values of financial assets and liabilities measured at fair value at year-end.
• Financial LiabilitiesThe estimated fair value of due to banks and debt securities in issue represents the discounted amount of estimated future cash flows expected tobe paid. Expected cash outflows are discounted at current market rates to determine fair value.
• Other assets and other liabilities The carrying amounts of these balances approximate their fair values.
Loans and advances to customers at FVTPL
F-72

AFRICAN EXPORT-IMPORT BANKNOTES TO THE SPECIAL PURPOSE FINANCIAL STATEMENTSFOR THE YEAR ENDED 31 DECEMBER 2018
4 FAIR VALUE OF FINANCIAL ASSETS AND LIABILITIES (CONTINUED)
Level 3 2018 2017US$000 US$000
Revalued property and equipmentLand and building 36,275 29,069
Level 2 2018 2017US$000 US$000
Financial assetsLoans and advances 11,420,557 8,981,351
Financial liabilitiesDue to banks 5,498,410 4,441,546Debt securities in issue (gross) 3,016,768 2,944,415
8,515,178 7,385,961
Revalued property and equipment
2018 2017US$000 US$000
Valuation as at 1 January 29,069 21,193Addition in the year 217 5Total gain / (loss)recorded in other comprehensive income 9,491 9,279Accumulated depreciation eliminated on revaluation (2,502) (1,408)Valuation as at 31 December 36,275 29,069
Impact on fair value of level 3 non financial assets due to changes in key assumptions
Carrying amount
Effect of 10%change in
annual market rentals Carrying amount
Effect of 10%change in annual
market rentalsUS$000 US$000 US$000 US$000
Property and equipment 36,275 3,627 29,069 2,907
The significant unobservable valuation input used in obtaining the value of the land and building was annual market rentals of similar properties. The table below shows the impact on the fair value of the land and building assuming that the annual market rentals increase or decrease by 10%. The positive and negative effects are approximately the same.
31-Dec-18 31-Dec-17
Total gains or losses for the period are included in profit or loss as well as total gains relating financial instruments designated at fair valuedepending on the category of the related asset/ liability.
(iv) Movements in level 3 non financial assets measured at fair value
The following table shows a reconciliation of the opening and closing amounts of level 3 non-financial assets which are recorded at fair value:
Land and building
The following methods and assumptions were used to estimate the fair values:• The Bank enters into derivative financial instruments with various counterparties, principally financial institutions with investment grade credit ratings. Derivatives valued using valuation techniques with market observable inputs are mainly interest rate swaps and foreign exchange forward contracts. The most frequently applied valuation techniques include forward pricing and swap models, using present value calculations. The models incorporate various inputs including the credit quality of counterparties, foreign exchange spot and forward rates, interest rate curves and forward rate curves. The changes in counterparty credit risk had no material effect on the hedge effectiveness assessment for derivatives designated in hedge relationships and other financial instruments recognized at fair value.
• Fair values of the Bank’s debt securities in issue and loans and advances are as disclosed in Note 4(a).• Methods and assumptions used in the valuation of land and building are detailed in Note 6.
(iii) The table below shows the assets and liabilities for which fair values are disclosed.
(ii) The table below shows the fair values of non-financial assets measured at fair value at year-end.
F-73

AFRICAN EXPORT-IMPORT BANKNOTES TO THE SPECIAL PURPOSE FINANCIAL STATEMENTSFOR THE YEAR ENDED 31 DECEMBER 2018
5 DERIVATIVES HELD FOR RISK MANAGEMENT
2018 2017US$000 US$000
Derivative assets
Interest rate swap 1,520 3,274Foreign exchange forward contracts 577 -Cross currency swap 1,587 300
3,684 3,574Derivative liabilities
Interest rate swap (24,840) (21,467)Foreign exchange forward contracts - -
(24,840) (21,467)
Interest rate derivative contracts2018 2017
US$000 US$000
Interest rate swap 1,275,000 1,675,000
2018 2017US$000 US$000
AssetsUp to one year 3,684 -One to five years - 3,274
3,684 3,274LiabilitiesUp to one year - (219)One to five years (24,840) (21,248)
(24,840) (21,467)
The following shows the notional value of interest rate derivative contracts that the Bank held at 31 December:
The Bank enters into interest rate swaps and foreign exchange forward contracts to hedge its exposure to changes in the fair value and cashflows attributable to changes in market interest and exchange rates on its assets and liabilities.
The table below shows the fair values of derivative financial instruments, recorded as assets or liabilities at year-end.
Swaps are contractual agreements between two parties to exchange streams of payments over time based on specified notional amounts, inrelation to movements in a specified underlying index such as interest rates, foreign currency rate or equity index.
Interest rate swaps relate to contracts taken out by the Bank with other financial institutions in which the Bank either receives or pays a floatingrate of interest in return for paying or receiving, respectively, a fixed rate of interest. The payment flows are usually netted against each other,with the difference being paid by one party to the other.
In a foreign exchange swap, the Bank pays a specified amount in one currency and receives a specified amount in another currency. Foreignexchange swaps are settled gross.
The time periods in which the discounted derivatives cash flows are expected to occur and affect profit or loss are as follows:
The Bank entered into interest rate swap to hedge US$ 1,275 million (2017: US$ 1,675 million) received from the debt securities issued inJuly 2014, November 2014, and October 2016 with fixed interest rates. The swap exchanged fixed rate for floating rate on funding to matchfloating rates received on assets. In this respect a cash flow hedge loss of US$ 23,319,000 (2017: US$ 18,193,000) arose on the hedginginstruments during the year.
F-74

AFRICAN EXPORT-IMPORT BANKNOTES TO THE SPECIAL PURPOSE FINANCIAL STATEMENTSFOR THE YEAR ENDED 31 DECEMBER 2018
6 CRITICAL ACCOUNTING ESTIMATES AND JUDGEMENTS IN APPLYING ACCOUNTING POLICIES
7 CONTINGENT LIABILITIES AND COMMITMENTS AND LEASE ARRANGEMENTS
7.1.1 Contingent liabilities2018 2017
US$000 US$000Letters of credit 421,559 319,939Guarantees 436,466 376,680
858,025 696,619
(f) Going Concern
The bank's management has made an assessment on its ability to continue as a going concern and is satisfied that it has the resources to continuein business for the forseable future. Furthermore, management is not aware of any material uncertainities that may cost significant doubt on thebank's ability to continue as a going concern.Therefore, the special purpose financial statements continue to be prepared on a going concern basis.
The preparation of special purpose financial statements involves management estimates and assumptions that may affect the reported amountsof assets and liabilities within the next financial year. Estimates and judgments are continually evaluated based on historical experience andother factors, including expectations of future events that are believed to be reasonable under the circumstances.
The Bank reviews its loan portfolio regularly to assess whether a provision for impairment should be recorded in profit or loss. In particular,considerable judgment by management is required in the estimation of the amount and timing of future cash flows when determining the levelof provisions required. Such estimates are necessarily subjective based on assumptions about several factors involving varying degrees ofjudgment and uncertainty. Consequently, actual results may differ resulting in future changes to such provisions. Further details on the carryingamount of loans and advances are set out in note 17. The key assumptions and estimates used are provided in note 2.8 and 3.6.
The fair value of financial instruments where no active market exists or where quoted prices are not otherwise available are determined by usingvaluation techniques. In these cases, the fair values are estimated from observable data in respect of similar financial instruments. Where marketobservable inputs are not available, they are estimated based on appropriate assumptions. Refer to note 4 for further information on fair value offinancial assets and liabilities.
The Bank measures land and buildings at revalued amounts with changes in fair value being recognized in Other Comprehensive Income. TheBank engaged an independent valuation specialist to assess fair value as at 31 December 2016. Land and buildings were valued by reference tomarket-based evidence, using comparable prices adjusted for specific market factors such as nature, location and condition of the property. Thecarrying amount at the reporting date is as set out in note 24.
Impairment exists when the carrying amount of an asset exceeds its recoverable amount. The recoverable amount is the greater of fair value lesscosts of disposal and value in use. In assessing value in use, the estimated future cash flows are discounted to their present value using adiscount rate that reflects current market assessments of the time value of money and the risks specific to the asset. Impairment losses arerecognized in profit or loss. Refer to note 2.14 for further information.
(a) Impairment losses on loans and advances
(b) Fair value of financial instruments
(c) Revaluation of property, plant and equipment
(d) Impairment of non-financial assets
(e) Property, plant and equipment
Critical estimates are made by the Bank in determining depreciation rates for property and equipment. The rates used are set out in accountingpolicy (note 2.9) above. The assets residual values, useful lives and methods of depreciation are reviewed at each reporting date, and adjustedprospectively if appropriate. The carrying amount at the reporting date is as set out in note 24.
The credit risk associated with these transactions is considered minimal. To limit credit risk, the Bank deals exclusively with creditworthycounterparties.
F-75

AFRICAN EXPORT-IMPORT BANKNOTES TO THE SPECIAL PURPOSE FINANCIAL STATEMENTSFOR THE YEAR ENDED 31 DECEMBER 2018
7.1.2 Commitments
Credit lines and other commitments to lend
2018 2017US$000 US$000
Less than one year 73,547 22,075More than one year 471,627 299,167
545,174 321,242
7.2 Lease arrangements
7.2.1 Operating lease commitments-Bank as lessee
2018 2017US$000 US$000
Less than one year 619 554After one year but not later than five years 253 767
872 1,321
7.2.2 Operating lease commitments-Bank as lessor
2018 2017US$000 US$000
Less than one year 234 335After one year but not later than five years 131 152
365 487
The contractual amounts of the Bank’s commitments not recognized on the statement of financial position as at 31 December are indicatedbelow.
Included in administrative expenses is minimum lease payments recognised as an operating lease expense amounting to US$492,000 (2017 :US$381,000)
Included in other operating income recognized as an operating lease income amounting to US$ 633 (2017 : US$1,100)
The Bank has entered into operating lease agreements for leasing of office premises. These leases have an average life of between two and fiveyears, with renewal option included in the contracts. Where the Bank is the lessee, the future minimum lease payments under non-cancellableoperating leases are as follows:
The Bank has entered into operating lease agreements for leasing of office space on its building. These leases have an average life of betweentwo and five years, with renewal option included in the contracts. Where the Bank is the lessor, the future minimum lease receivables under non-cancellable operating leases are as follows:
F-76

AFRICAN EXPORT-IMPORT BANKNOTES TO THE SPECIAL PURPOSE FINANCIAL STATEMENTSFOR THE YEAR ENDED 31 DECEMBER 2018
8 INTEREST AND SIMILAR INCOME2018 2017
US$000 US$000
Loans and advances 675,600 577,516Interest on derivative contracts (10,651) 4,359Interest on money market investments 40,488 22,686Interest on investments amortised cost (held to maturity in 2017) 4,042 1,513
709,478 606,074
9 INTEREST AND SIMILAR EXPENSE2018 2017
US$000 US$000
Due to banks 151,274 110,638Debt securities in issue 122,542 109,318Shareholder and customer deposits 31,838 47,793
305,654 267,749
10 FEES AND COMMISSION INCOME2018 2017
US$000 US$000Advisory fees 79,201 21,307Commission on L/Cs 7,762 8,511Guarantee fees 5,965 9,368Structuring Fees 789 58
93,717 39,245
11 FEES AND COMMISSION EXPENSE2018 2017
US$000 US$000Bond issue fees 827 1,147Legal and agency fees 642 700Other fees paid 8,560 7,036
10,029 8,883
12 OTHER OPERATING INCOME2018 2017
US$000 US$000Rental income 633 1,100Other income 1,688 2,339
2,321 3,439
13 PERSONNEL EXPENSESPersonnel expenses are made up as follows:
2018 2017US$000 US$000
Wages and salaries 30,300 25,087Staff provident fund costs (Note 2.10) 1,180 2,301Other employee benefits 15,504 11,370
46,984 38,758
14 GENERAL AND ADMINISTRATIVE EXPENSEGeneral and administrative expenses are made up as follows:
2018 2017US$000 US$000
Operational missions and statutory meetings 15,036 10,314Professional service fees 10,946 6,031Communications 3,694 2,849Operational lease 492 382Other general and administrative expenses 6,124 5,096
36,292 24,672Professional services fees include US$ 210,000 (2017: US$90,000) in respect of external auditors' fees.
15 EARNINGS PER SHARE
2018 2017US$000 US$000
Net income attributable to equity holders of the bank 275,902 220,494
Weighted average number of ordinary shares in issue (basic) (note 15.1) 49,092 39,488 Weighted average number of ordinary shares in issue (Diluted) (note 15.2) 113,066 98,164
5.62 5.58 Basic earnings per share (expressed in US$000 per share) 2.44 2.25 Diluted earnings per share (expressed in US$000 per share)
The interest income reported above are calculated using the effective interest method
The interest expense reported above are calculated using the effective interest method.
The fees and commission income exclude those included in determining the effective interest rate for financial assets measured at amortised cost.
Interest income accrued on impaired financial assets amounting to US$2,541,929 was recorded in 2017. Total interest income from loans and advances measured at FV amountedto US$ 3,530,000 and interest income from loans and advances measured at amortized cost amounting to US$ 672,070,000.
Earnings per share are calculated by dividing the net income attributable to equity holders of the Bank by the weighted average number of ordinary shares in issue during the year.
Net income attributable to equity holders of the Bank have been calculated on the basis of assuming that all the net income for the year is distributed.
F-77

AFRICAN EXPORT-IMPORT BANKNOTES TO THE SPECIAL PURPOSE FINANCIAL STATEMENTSFOR THE YEAR ENDED 31 DECEMBER 2018
15.1 Weighted average number of ordinary shares in issue (basic)Issued ordinary shares at 1 Janaury 47,082 35,669 Issued during the year 2,010 3,819 Weighted average number of ordinary shares at 31 Decemeber 49,092 39,488
15.2 Weighted average number of ordinary shares in issue (diluted)Weighted average number of ordinary shares in issue (basic) 49,092 39,488 Effect of warrants issuance 440 1,244 Effect of partly paid shares 63,534 57,432 Weighted average number of ordinary shares at 31 Decemeber 113,066 98,164
16 CASH AND CASH EQUIVALENTS2018 2017
US$000 US$000Cash in hand 101 90 Deposits with other banks 612,757 861,307 Money market placements 1,305,626 2,353,176 Gross 1,918,484 3,214,573 Less: allowance for impairment 12months ECL (50) - Net cash and cash equivalents 1,918,434 3,214,573
These instruments are allocated in stage 1 for ECL purposes
16.1 Net money market placementsCurrent 1,305,576 2,353,176 Non-current - -
1,305,576 2,353,176
17 LOANS AND ADVANCES TO CUSTOMERS US$0002018 2017
Loans and advances to customers at amortised cost Stage 1 Stage 2 Stage 3 Total TotalGross amount 8,569,670 1,775,476 929,913 11,275,059 8,726,316 Less:Allowance for impairment (note 18.1) (180,600)12months ECL (47,849) (47,849)Lifetime ECL not credit impaired (60,049) (60,049)Lifetime ECL credit impaired (162,520) (162,520)Net loans and advances to customers 8,521,821 1,715,427 767,393 11,004,641 8,545,716
Loans and advances to customers at FVTPL2018 2017
129,783 - 129,783 -
Total loans and advances to customers 11,134,424 8,545,716
Net loans and advances to customersCurrent 7,208,168 7,187,880 Non-current 3,926,256 1,357,836
11,134,424 8,545,716
17.1 CREDIT LOSSES ON FINANCIAL INSTRUMENTS
(a) Statement of Financial Position2018 2017
US$000 US$000Loans and advances 270,418 180,600 Money market placements 36 - Deposit with other banks 14 - Investment securities at amortised cost 1,940 - Financial guarantee contracts 1,645 - Letter of credits 343 - Loan commitments 7,171 - Prepayments and accrued income 9,722 1,099 Other Assets 4,322 4,322
295,611 186,021
(b) Statement of Comprehensive Income2018 2017
US$000 US$000Loans and advances 104,963 63,397 Money market placements (63) - Deposit with other banks 11 - Investment securities at amortised cost 1,130 - Financial guarantee contracts 944 - Letter of credits 258 - Loan commitments 3,231 - Prepayments and accrued income 8,403 1,857
118,877 65,254
These loans and advances relate to Syndicated loans in which the Bank acted as lead arranger.
F-78

AFRICAN EXPORT-IMPORT BANKNOTES TO THE SPECIAL PURPOSE FINANCIAL STATEMENTSFOR THE YEAR ENDED 31 DECEMBER 2018
17.2 Allowance for impairment on loans and advances
Reconciliation of allowance for impairment of loans and advances is as follows:(a) Statement of Financial Position
2018 2017US$000 US$000
Balance as at 1 January 180,600 167,418 Impact of Adopting IFRS 9 at 1 January 2018 124,020 Restated balance at 1 January 304,620 167,418 Impairment charge for the year (note 18.1b) 104,962 63,397 Revaluation effect of provisions of loans in EURO - 1,757 Loans written off during the year as uncollectible (139,164) (51,972) Balance as at 31 December (note 17) 270,417 180,600
(b) Statement of Comprehensive Income
104,962 63,397 Impairment charge for the year on loans and advances
104,962 63,397
18 PREPAYMENTS AND ACCRUED INCOME2018 2017
US$000 US$000Accrued income 49,549 24,654 Other prepayments 94,531 58,774 Less: Impairment on accrued income (9,722) (1,099)
134,358 82,329
18.1 Impairment on prepaymens and accrued income(a) Statement of Financial Position
2018 2017US$000 US$000
Balance as at 1 January 1,099 2,848 Remeasurement 220 Restated balance at 1 January 1,319 2,848 Impairment charge for the year (note 18.1b) 8,403 1,259 Revaluation effect of provisions of loans in EURO - - Written off during the year as uncollectible - (3,008) Balance as at 31 December (note 17) 9,722 1,099
(b) Statement of Comprehensive Income
- Impairment charge for the year 8,403 1,259
8,403 63,397
19 OTHER ASSETS2018 2017
US$000 US$000Other receivables 3,883 4,589 Sundry debtors 14,427 2,664 Less: Impairment on other assets (4,322) (4,322)
13,988 2,931
19.1 Impairment on other assetsECL on other assets are estimated on lifetime basis(a) Statement of Financial Position
2018 2017US$000 US$000
Balance as at 1 January 4,322 5,575 Remeasurement Restated balance at 1 January 4,322 5,575 Impairment charge for the year - 598 Written off during the year as uncollectible - (1,851) Balance as at 31 December (note 19) 4,322 4,322
(b) Statement of Comprehensive Income
Impairment charge for the year - 598 - 598
Accrued income relates to fees and commisions receivable. Other prepayments include fees and commissions on borrowings, prepaid rent and insurance expenses.
Other receivables above mainly relate to taxes recoverable from some member countries arising from payment of invoices inclusive of tax. In accordance with Article XIV of the agreement for Establishment of African Export Import Bank, the Bank is exempt from all taxation and custom duties (note 38). There are all current in nature.
F-79

AFRICAN EXPORT-IMPORT BANKNOTES TO THE SPECIAL PURPOSE FINANCIAL STATEMENTSFOR THE YEAR ENDED 31 DECEMBER 2018
2018 2017US$000 US$000
20 Financial investments at amortized cost (Held to maturity in 2017)Begining balance at 01 January 30,268 30,268 Additions during the year 140,000 - Gross 170,268 30,268 Less: allowance for impairment 12months ECL (1,940) - Net financial assets at amrtised cost 168,328 30,268
These instruments are treasury bills issued by the Central Bank of Zimbabwe and they have been allocated in stage 1 for ECL purposes2018 2017
Net financial investments at amortized cost US$000 US$000Current 138,060 - Non current 30,268 30,268
168,328 30,268
21 DUE TO BANKS2018 2018
US$000 US$000Money market placements 614,260 452,030 Loans from financial institutions 4,533,684 3,779,344
5,147,944 4,231,374
2018 2017US$000 US$000
Current 2,055,023 1,733,393 Non current 3,092,921 2,497,981
5,147,944 4,231,374
22 DEBT SECURITIES IN ISSUE
Debt securities at amortised cost:Coupon 2018 2017 Date of Date of
(%) US$000 US$000 issuance maturityFixed rate debt securities due 2018 3.88 - 500,000 Jun 2013 Jun 2018Fixed rate debt securities due 2019 4.75 700,000 700,000 Jul 2014 Jul 2019Fixed rate debt securities due 2021 4.00 900,000 900,000 Oct 2016 May 2021Fixed rate debt securities due 2023 4.00 500,000 - Oct 2018 Oct 2023Fixed rate debt securities due 2024 4.13 750,000 750,000 Jun 2017 Jun 2024Floating rate private placement note due 2021 41,500 41,500 Dec 2014 Mar 2016Floating rate private placement note due 2022 145,000 - Jul 2017 Jul 2021Less: Discount on bond payable (9,873) (11,429) Jul 2018 Aug 2022Add: Premium on bond payable 1,090 1,551
3,027,717 2,881,622
Current 700,000 1,200,000 Non-current 2,327,717 1,681,622
3,027,717 2,881,622
The Bank issued, under the Euro Medium Term Note Programme (EMTN), US$ 3,036.50 million bonds (2017: US$2,850 million) with different maturities and coupon rates. Further, the Bank issued under an EMTN Programme, US$186.5 million (2017: US$41.5 million) private placement with floating rate. Fitch Ratings and Moody's assigned these bonds an investment grade rating BBB-, and Baa2 respectively.
The Bank has not had any defaults of principal, interest or other breach with respect to its debt securities during the year ended 31 December 2018 and 2017. The debt securities in issue are unsecured.
Loans from financial institutions, have both short-term and long-term borrowings ranging from tenor periods of one month to 12 years with interest rates ranging from 0.5% to 4.65%. Note that the long-term tenor borrowings are matched with specific assets with the same tenor.
F-80

AFRICAN EXPORT-IMPORT BANKNOTES TO THE SPECIAL PURPOSE FINANCIAL STATEMENTSFOR THE YEAR ENDED 31 DECEMBER 2018
23 PROPERTY AND EQUIPMENT
The table below analyses the details of the Bank's property and equipment.
Land Building Motor Furniture Leasehold Assets TotalVehicles and improvements under
equipment constructionUS$000 US$000 US$000 US$000 US$000 US$000 US$000
YEAR ENDED 31 DECEMBER 2017COSTCost/valuation as at 1 January 2017 6,642 14,551 719 8,910 1,034 544 32,400Additions - 5 90 1,308 - 331 1,734Capitalisation of assets under construction - - - - - -Disposals - - - - -Revaluation (734) 10,013 - - - - 9,279Transfer* - (1,408) - - - - (1,408)Cost/valuation as at 31 December 2017 5,908 23,161 809 10,218 1,034 875 42,005
ACCUMULATED DEPRECIATIONAccumulated depreciation as at 1 January 2017 - - (227) (6,685) (1,022) - (7,934)Charge for the year - (1,408) (146) (1,078) (9) - (2,641)Disposals - - - - - - -Transfer* - 1,408 - - - - 1,408Total accumulated depreciation as at 31 December 2017 - - (373) (7,763) (1,031) - (9,167)
Net carrying amount as at 31 December 2017 5,908 23,161 436 2,455 3 875 32,838
The table below analyses the details of the Bank's property and equipment.
Land Building Motor Furniture Leasehold Assets TotalVehicles and improvements under
equipment constructionUS$000 US$000 US$000 US$000 US$000 US$000 US$000
YEAR ENDED 31 DECEMBER 2018COSTCost/valuation as at 1 January 2018 5,908 23,161 809 10,218 1,034 875 42,005Additions - 217 84 847 364 1,512Capitalisation of assets under construction - - - - (217) (217)Disposals - - - - -Revaluation 7,506 1,985 - - - - 9,491Transfer* (2,502) - - - - (2,502)Cost/valuation as at 31 December 2018 13,414 22,860 893 11,065 1,034 1,022 50,289
ACCUMULATED DEPRECIATIONAccumulated depreciation as at 1 January 2018 - - (373) (7,763) (1,031) - (9,167)Charge for the year - (2,502) (128) (1,184) (3) - (3,818)Disposals - - - - - - -Transfer* - 2,502 - - - - 2,502Total accumulated depreciation as at 31 December 2018 - - (501) (8,947) (1,034) - (10,483)
Net carrying amount as at 31 December 2018 13,414 22,860 392 2,118 -- 1,022 39,806
*Transfers relates to the accumulated depreciation as at the revaluation date that was eliminated against the gross carrying amount of the revalued asset.During 2017 the bank received a land from government of Zimbabwe in order to establish a reginonal office to facilitate the business of the Bank in Southern Africa region as is being accounted for as a government grant.
The fair value of the building and the land which reflects market conditions at the reporting date was US$ 22,860,000 (2017: US$ US$ 23,161,000) and US$ 13,415,000 (2017: US$ 5,908,000) respectively. The fair value was determined using an independent valuer on 31 December 2018.The valuer used was Arab Group for Technical Consultant who has experience in similar projects. The net carrying amount of the Headquarters' land and building would have been US$ 34,000 (2017:US$ 34,000) and US$ 8,247,000 (2017:US$ 8,796,000) respectively if both classes had not been revalued.
F-81

AFRICAN EXPORT-IMPORT BANKNOTES TO THE SPECIAL PURPOSE FINANCIAL STATEMENTSFOR THE YEAR ENDED 31 DECEMBER 2018
24 Intangible Assets2018 2017
US$000 US$000Cost 1 January 3,935 3,029Additions 456 906Software in progress 5,144Cost 31 December 9,535 3,935Accumulated amortizationAs at 1 January (2,687) (2,215)Amortization charges for the year (500) (472)As at 31 December (3,187) (2,687)Net value as 31 December 6,348 1,248
25 DEPOSITS AND CUSTOMER ACCOUNTS2018 2017
US$000 US$000Shareholders' deposits for shares 9,307 9,151Deposit accounts 195,932 57,134Customer accounts 2,160,146 2,083,071
2,365,385 2,149,356
Current 2,365,385 1,649,356Non-Current 500,000
2,365,385 2,149,356
26 OTHER LIABILITIES AND PROVISIONS2018 2017
US$000 US$000Financial guarantee contracts issued 1,645 -Loan commitments issued 7,171 - Letter of credits 343 - Other liabilities recognised (NOTE 26.1) 284,578 505,624
293,737 505,624
Financial guarantee contracts issued
Loan commitments issued
In terms of customer group, the deposits and customer accounts above were from sovereigns, enterprises and financial institutions.The fair value of the deposits of customer accounts approximate the carrying amount, as they have variable interest rates.
The amount in respect of loan commitments issued represents:- At 31 December 2018 - the sum of: ECL provision of USD3.9 million (see impairment note 3.3.3) and the amounts recognised at origination of loan commitments less cumulative amortisation of USD 538 million (US$317 million).
The amount in respect of financial guarantee contracts issued represents:- At 31 December 2018 - the sum of: ECL provision of USD0.34 million (see impairment note 3.3.3) and the amounts recognised at origination of financial guarantee contract lesscumulative amortisation of US$435 million (2017: US$376 million).
F-82

26.1 Other liabilities 2018 2017
US$000 US$000Prepaid and unearned income 118,560 84,926Dividends payable 10,713 14,784Deposits from tenants 441 423Accrued expenses 103,092 70,929Sundry creditors 42,501 327,411Legal fees deposits 9,271 7,151
284,578 505,624
2018 2017US$000 US$000
Current 29,640 21,231Non current 254,938 484,393
284,578 505,624
27 SHARE CAPITAL
2018 2017US$000 US$000
Authorised capital500,000 ordinary shares of US$10,000 each 5,000,000 5,000,000
Paid in share capitalPaid in capital -class A 270,264 248,868Paid in capital -class B 120,700 109,092Paid in capital -class C 46,236 46,076Paid in capital -class D 69,100 66,780
506,300 470,816
The movement in paid up share capital is summarised as follows:
Shareholders rights are the same for all classes from the perspective of voting rights. Dividends are shared prorata according to number of shares subscribed.
As at 31 December 2018 the authorised capital comprised 500,000 ordinary shares (2017: 500,000 ordinary shares). The number shares issued but not fully paid for class A, B & C shareholders as at 31 December 2018 was 109,300 (2017: 101,009). The number of fully paid shares for class D shareholders as at 31 December 2018 was 6,910 (2016: 6,678). The nominal value per share is US$10,000.
The share capital of the bank is divided into four classes of which A,B and C classes are payable in five equal instalments, of which the first two installments have been called up. Class D shares are fully paid at time of subscription. Shareholders can use their dividend entitlement to acquire more shares.
Class A are shares which may only be issued to (a) African states, either directly or indirectly through their central banks or other designated institutions, (b) the African Development Bank, and ( c ) African regional and sub regional institutions;
Class B are shares which may only be issued to African public and private commercial banks, financial institutions and African public and private investors; and
Class C are shares which may only be issued to (a) international financial institutions and economic organisations; (b) non African or foreign owned banks and financial institutions; and non African public and private investors.
Class D are shares which may be issued in the name of any person.
F-83

2018 2018 2017 2017No of shares US$000 No of shares US$000
At 1 January 107,687 470,816 94,622 378,488Paid up from dividends during the year 1,595 6,380 908 3,632Paid up in cash during the year 6,928 29,104 12,157 88,696At 31 December 116,210 506,300 107,687 470,816
28 SHARE PREMIUMPremiums from the issue of shares are reported in the share premium accountThe movement in share premium account is summarised as follows:
2018 2018 2017 2017No of shares US$000 No of shares US$000
At 1 January 107,687 562,350 94,622 355,310Paid up from dividends during the year 1,595 22,082 908 11,946Paid up in cash during the year 6,928 189,852 12,157 200,669Transaction cost of raising equity - (9,494) - (5,575)At 31 December 116,210 764,790 107,687 562,350
29 RESERVES
General Reserves
Asset revaluation
ReserveCashflow
hedge Reserve
Project preparation
facility Fund reserve Total
US$000 US$000 US$000 US$000 US$000Balance as at 1 January 2017 366,282 11,600 (13,476) 0 364,406Revaluation of land - (734) - (734)Revaluation of building - 10,013 - 10,013Depreciation transfer : buildings - (1,408) - (1,408)Transfer to cashflow hedge reserve 13,476 13,476Transfer from retained earnings (note 31) 81,480 - - 7500 88,980Balance as at 31 December 2017 447,762 19,471 - 7,500 474,733
Balance as at 1 January 2018 447,762 19,471 - 7,500.00 474,733 Revaluation of land - 7,506 - 7,506 Revaluation of building - 1,985 - 1,985 Depreciation transfer : buildings - (649) - (649) Recycling of fair value adjustment to profit and loss - - Transfer from retained earnings (note 31) 103,466 - - 7,500 110,966 Balance as at 31 December 2018 551,228 28,313 - 15,000 594,541
- The asset revaluation and cashflow hedge reserves are restricted from distribution to the shareholders.- At the beginning of the year, Management recycled fair value losses arising from discontinuation of hedge accounting for the Interest Rate Swaps due to the
prevailing environment where interest rates are rising and expected to continue on the same trend.
During the Annual General Meeting held on 23 July 2016, the shareholders approved the equity raise of up to US$1 billion across all classes of the Bank, being Class A, Class B, Class C and Class D and using market and other insturments such as warrants and option. Accordingly, 8,523 additional shares (2017: 13,065 additional shares) were issued during the year bring in total capital of US$237,922,000 (2017: US$299,368,000).
F-84

29 RESERVES (CONTINUED)
Nature and purpose of reservesa. General reserve
b. Asset revaluation reserve
c. Cash flow hedge reserve
d. Project preparation facility Fund reserve
30 RETAINED EARNINGS2018 2017
US$000 US$000Balance as at 1 January 524,412 429,448 Impact of Adopting IFRS 9 at 1 January 2018 (129,878) - Restated Balance at 1 January 2018 394,534 429,448 Profit for the year 275,902 220,494 Transfer to general reserve (103,466) (81,480) Transfer to Project preparation facility (7,500) (7,500) Depreciation transfer: buildings 649 1,408 Dividends for prior year (57,534) (37,958) Balance as at 31 December 502,585 524,412
31 DIVIDENDS
Dividends per share is summarised as follows:2018 2017
US$000 US$000
Proposed dividends per shareDividends appropriations 68,970 57,534
Number of shares at 31 December 116,210 107,687
Dividends per share 0.59 0.53
Dividends per share declared and paidDividends appropriations 57,534 37,958
Number of shares at 31 December of the previous year 107,687 94,622
Dividends per share 0.53 0.40
The cash flow hedge reserve represents the cumulative effective portion of gains or losses arising from changes in fair value of hedging instruments entered into for cash flow hedges. The cumulative gain or loss arising on changes in fair value of the hedging instruments that are recognised and accumulated under the heading of cash flow hedge reserve will be reclassified to profit or loss only when the hedged transaction affects the profit or loss, or included as a basis adjustment to the non-financial hedged item, consistent with the relevant accounting policy.
After reporting date, the directors proposed dividends appropriations amounting to US$ 68,970,000 (2017: US$ 57,534,000). The 2017 dividend appropriation is subject to approval by the shareholders in their Annual General Meeting. These financial statements do not reflect the dividend payable, which will be accounted for in equity as an appropriation of retained earnings in the year ending 2018.
The Project Preparation Facility Fund was approved by the Board in December 2018 for the purposes of setting funds aside to be utilized by the Bank during project preparation phase. Project preparation phase will comprise the entire set of activities undertaken to progress a project from conceptualization through concept design to financial close. It will entail the provision of technical and financial support services - such as technical, environmental, market, financial, legal and regulatory, advocacy services that may be required to a point where the project can attract revenue from investors (both debt and equity). The Project Preparation Facility Fund was approved for a total amount of USD15 million to be appropriated from the Bank’s profits equally over two years from 2017 to 2018. The fund will be operated on a full cost recovery revolving basis and solely deployed towards project preparation work and related activities.
The Bank considered the equivalent number of fully paid up shares in calculation of the dividends given that Classes A, B and C shares are partially paid, that is 40%at subscription with 60% remaining as callable capital
The general reserve is set up in accordance with the Bank's policy in order to cover general banking risks, including future losses and other unforeseeable risks or contingencies. Each year the Bank transfers 50% of profit after deduction of dividends to general reserves.
The revaluation reserve is used to record increases in the fair value of land and building and decreases to the extent that such decrease relates to an increase on the same asset previously recognised in equity. An annual transfer from the asset revaluation reserve to retained earnings is made for the difference between depreciation based on the revalued amount of the asset and depreciation based on the asset original cost. When revalued assets are sold, the portion of the revaluation reserve that relates to those assets is effectively realised and transferred directly to retained earnings.
F-85

32 WARRANTS
2018 2018 2017 2017No of warrants US$000 No of warrants US$000
At 1 January 2,515 91,723 2,424 98,716 Retirement during the year (2,515) (91,723) (4,778) (198,575)Issued during the year 5,284 191,531 4,869 191,582 At 31 December 5,284 191,531 2,515 91,723
33 RELATED PARTY TRANSACTIONS
The details of related party transactions are as follows:
34 Key management personnel compensation
34.1 Salaries and benefits to management personnel
2018 2017US$000 US$000
Salaries and short-term benefits 13,185 8,522 Other long-term benefits 3,417 2,287 Post-employment benefits 1,290 554 Termination benefits 261 200
18,153 11,563
Compensation paid to the Bank's executive officers and directors during the year is as follows:
Short -term benefits above include meeting allowances for Board members and staff allowances for children's education, dependency, home leave and housing.
During the Annual General Meeting held on 23 July 2016, the shareholders approved the equity raise of up to US$1 billion across all share classes of the Bank, and using market and other insturments such as warrants and option. The Bank issued 5,284 share warrants to two investors for an aggegate principal amount of of US$214,978,061 and credited the same to capital of the Bank net of issuance costs amounting to US$23,446,709 The average tenor of the warrants issued during the year is 5 years.
The Bank's principal related parties are its shareholders. The Bank transacts commercial business such as loans and deposits directly with the shareholders themselves and institutions which are either controlled by the shareholder governments or over which they have significant influence.
F-86

34.2 Loans and advances to management personnel
2018 2017US$000 US$000
Balance as at I January 507 225 Loan disbursements during the year 766 612 Loan repayments during the year (717) (330) Balance as at 31 December 556 507
No loans to related parties were written off in 2018 and 2017.
35 SEGMENT REPORTING
35.1 Operating Segments
Lending Treasury Total Lending Treasury Total2018 2018 2018 2017 2017 2017
US$000 US$000 US$000 US$000 US$000 US$000
Interest income 673,098 36,381 709,478 576,985 29,089 606,074 Net fees and commission 90,162 (6,474) 83,688 39,418 (9,056) 30,362 Other operating income 2,485 (164) 2,321 3,439 - 3,439 Total segment revenue 765,745 29,743 795,487 619,842 20,033 639,875 Less: interest expense - (305,654) (305,654) (137) (267,612) (267,749)Foreign exchange adjustments & Fair value adjustment (8,184) 721 (7,463) (18,169) (1,666) (19,835) Less: personnel and other admin. expenses (86,857) 3,581 (83,276) (61,262) (2,168) (63,430) Less: depreciation and amortization (4,175) (140) (4,315) (3,039) (74) (3,113) Segment income before impairment 666,529 (271,749) 394,779 537,235 (251,489) 285,748 Less: loan impairment charges (118,877) - (118,877) (63,397) - (63,397) Less: provisions - - - (1,857) - (1,857) Net income for the year 547,652 (271,749) 275,902 471,980 (251,489) 220,494
Financial PositionSegment assets 11,350,883 2,068,486 13,419,370 8,662,712 3,248,125 11,910,837Capital expenditures - - - 2,350 290 2,640 Total assets at year end 11,350,883 2,068,486 13,419,370 8,665,062 3,248,415 11,913,477Segment liabilities 2,659,120 8,200,501 10,859,623 2,654,980 7,134,463 9,789,443Capital funds - - 2,559,747 - - 2,124,034Total liabilities and capital funds 11,350,883 2,068,486 13,419,370 8,665,062 3,248,415 11,913,477
Interest income from staff loans amounted to US$ 26,451 (2017: US$ 24,268). There were no loan loss provisions on staff loans in both current and prior year.
The segment income are 100% external, thus there are no inter-segment income. The Bank did not have any transactions with a single customer exceeding 10% of the Bank's total revenue.
Transfer prices between operating segments are based on the bank's pricing framework.
The Bank is a multilateral trade finance institution whose products and services are similar in nature, and are structured and distributed in a fairly uniform manner across borrowers. The Bank's primary reporting format for business segments includes Lending and Treasury operations. Lending activities represent investments in facilities such as loans, letters of credit and guarantees, which promote intra and extra African trade. Treasury activities include raising debt finance, investing surplus liquidity and managing the Bank's foreign exchange and interest rate risks.The Bank's distribution of loans and advances by geographical and industry sectors is as disclosed in note 3.3.4.
Statement of profit or loss and other comprehensive income
The Bank provides loans and advances to its staff, including those in management. Such loans and advances are guaranteed by the staff terminal benefits payable at the time of departure from the Bank. The staff loans and advances are interest bearing and are granted in accordance with the Bank's policies. The movement in loans and advances to management during the year ended 31 December 2018 was as follows:
F-87

AFRICAN EXPORT-IMPORT BANKNOTES TO THE SPECIAL PURPOSE FINANCIAL STATEMENTSFOR THE YEAR ENDED 31 DECEMBER 2018
36 Transition to IFRS - Financial assets and financial liabilitiesA. Classification of financial assets and financial liabilities
Total31 December 2018 Amortised carryingUS$'000 Note FVTPL cost amountCash and bank balances 16 1,918,434 1,918,434Derivative assets held for risk management 5 3,684 - 3,684Loans and advances to customers: -
Measured at amortised cost 17 11,004,641 11,004,641Measured at fair value 17 129,783 129,783
Investment securities at amortised cost 20 168,328 168,328Prepayments and Accrued income 18 134,358 134,358
Total financial assets 133,467 13,225,761 - 13,359,228
Derivative liabilities held for risk management 5 24,840 24,840Due to banks 21 5,147,944 5,147,944Deposits and customer accounts 25 2,365,385 2,365,385Debt securities in issue 22 3,027,717 3,027,717Other liabilities 26 293,737 293,737Total financial liabilities 24,840 10,834,783 - - 10,859,623
Total31 December 2017 Held-to- Loans and Amortised carryingUS$'000 Note At FVTPL maturity receivables cost amountCash and bank balances 16 - - 3,214,573 - 3,214,573Derivative assets held for risk management 5 3,574 - - - 3,574Loans and advances to customers: 17 - - 8,545,716 - 8,545,716Investment securities: 20 30,268 30,268Prepayments and Accrued income 18 82,329 82,329
Total financial assets 3,574 30,268 11,760,289 82,329 11,876,460
Derivative liabilities held for risk management 5 21,467 - - - 21,467Due to banks 21 - - - 4,231,374 4,231,374Deposits and customer accounts 25 2,149,356 2,149,356Debt securities in issue 22 - - - 2,881,622 2,881,622Other liabilities 26 - - 505,624 505,624Total financial liabilities 21,467 - - 9,767,977 9,789,444
Original New
US$'000 Note IAS 39 IFRS 9 IAS 39 IFRS 9Financial assetsCash and bank balances 16 Loans and receivables Amortised cost 3,214,573 3,214,471Derivative assets held for risk management 5 FVTPL FVTPL 3,574 3,574Loans and advances to customers
Measured at amortised cost 17 Loans and receivables Amortised cost 8,545,716 8,421,696Measured at fair value 17 Loans and receivables FVTPL - -
Investment securities at amortised cost 20 Held to maturity Amortised cost 30,268 29,458Prepayment Accrued income 18 Loans and receivables Amortised cost 82,329 82,109
Total financial assets 11,876,460 11,751,308
Original New Original classification
New classification amount under amount under
US$'000 Note under IAS 39 under IFRS 9 IAS 39 IFRS 9Financial liabilities
Derivative liabilities held for risk management 5 FVTPL FVTPL 21,467 21,467 Due to banks 21 Amortised cost Amortised cost 4,231,374 4,231,374Deposits and customer accounts 25 Amortised cost Amortised cost 2,149,356 2,149,356Debt securities in issue 22 Amortised cost Amortised cost 2,881,622 2,881,622Other liabilities 26 Amortised cost Amortised cost 505,624 500,898
Total financial liabilities 9,789,444 9,784,717
The following table provides a reconciliation between line items in the statement of financial position and categories of financial instruments.
B. Classification of financial assets and financial liabilities on the date of initial application of IFRS 9 The following table shows the original measurement categories in accordance with IAS 39 and the new measurement categories under IFRS 9 for the Banks’s financial assets and financial liabilities as at 1 January 2018.
Classification Carrying amount
F-88
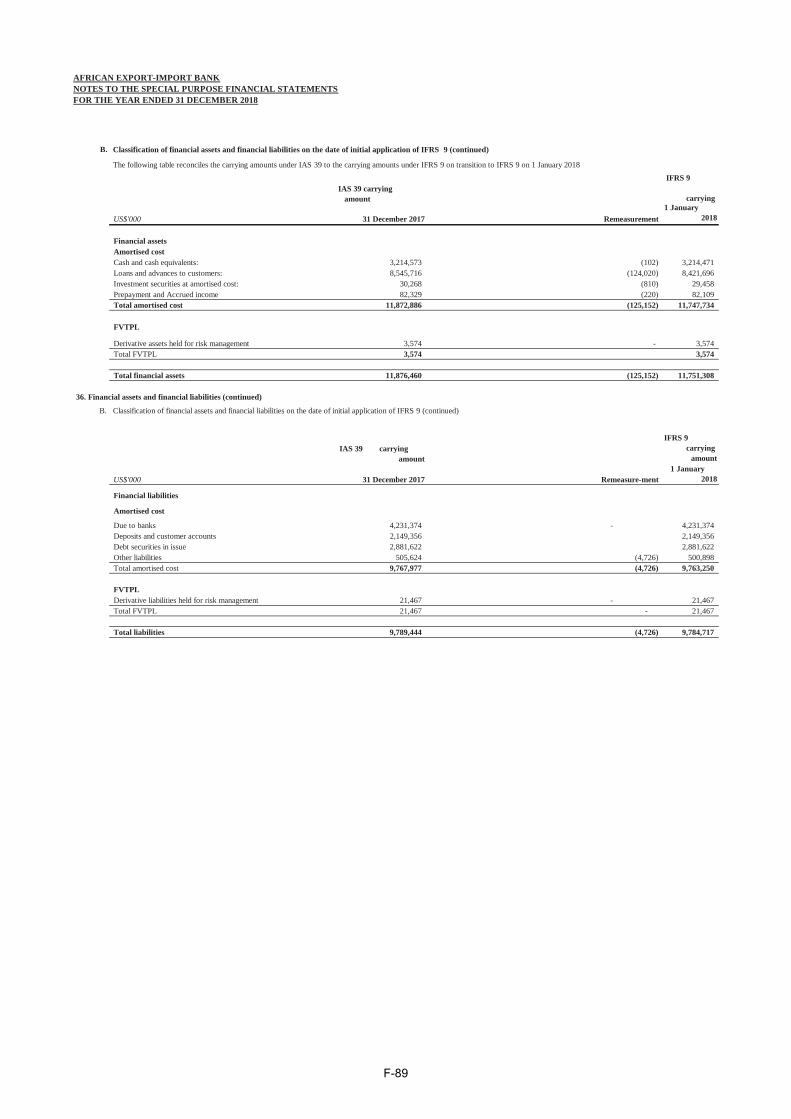
AFRICAN EXPORT-IMPORT BANKNOTES TO THE SPECIAL PURPOSE FINANCIAL STATEMENTSFOR THE YEAR ENDED 31 DECEMBER 2018
B.
IFRS 9
carrying
US$'000 1 January
2018
Financial assetsAmortised costCash and cash equivalents: 3,214,573 (102) 3,214,471Loans and advances to customers: 8,545,716 (124,020) 8,421,696Investment securities at amortised cost: 30,268 (810) 29,458Prepayment and Accrued income 82,329 (220) 82,109Total amortised cost 11,872,886 (125,152) 11,747,734
FVTPL
Derivative assets held for risk management 3,574 - 3,574Total FVTPL 3,574 3,574
Total financial assets 11,876,460 (125,152) 11,751,308
36. Financial assets and financial liabilities (continued)
IFRS 9 carrying
amount
US$'000 1 January
2018
Financial liabilities
Amortised cost
Due to banks 4,231,374 - 4,231,374Deposits and customer accounts 2,149,356 2,149,356Debt securities in issue 2,881,622 2,881,622Other liabilities 505,624 (4,726) 500,898 Total amortised cost 9,767,977 (4,726) 9,763,250
FVTPLDerivative liabilities held for risk management 21,467 - 21,467 Total FVTPL 21,467 - 21,467
Total liabilities 9,789,444 (4,726) 9,784,717
Classification of financial assets and financial liabilities on the date of initial application of IFRS 9 (continued)
The following table reconciles the carrying amounts under IAS 39 to the carrying amounts under IFRS 9 on transition to IFRS 9 on 1 January 2018
IAS 39 carrying amount
31 December 2017 Remeasurement
B. Classification of financial assets and financial liabilities on the date of initial application of IFRS 9 (continued)
IAS 39 carrying amount
31 December 2017 Remeasure-ment
F-89

AFRICAN EXPORT-IMPORT BANKNOTES TO THE SPECIAL PURPOSE FINANCIAL STATEMENTSFOR THE YEAR ENDED 31 DECEMBER 2018
B.
US$'000 2018
Retained earnings
Closing balance under IAS 39 (31 December 2017) 524,412Remeasurement of financial assets -Recognition of expected credit losses
Cash and bank balances (102)Loans and advances to customers (124,020)Investment securities at amortised cost (810)Prepayments and Accrued income (220)
loan commitments and financial guarantee contracts) (4,726)Opening balance under IFRS 9 (1 January 2018) 394,534
C. The following table reconciles:
•
• the opening ECL allowance determined in accordance with IFRS 9 as at 1 January 2018.
US'000
1 January 2018
(IFRS 9)
Cash and bank balancesDeposit with other banks - - 3 3Money market placements - - 99 99
Loans and advances to customers - 180,600 124,020 304,620Investment securities at amortised cost - - 810 810Prepayments and Accrued income 1,099 220 1,319
- 181,699 - 125,152 306,851
Financial guarantee contracts issued - 701 701 Loan commitment contracts issued - 3,940 3,940 Letter of credits - 85 85
- - - 4,726 4,726
Total - 181,699 - 129,878 311,576
31 December 2017 (IAS 39/ IAS 37) Remeasurement
Classification of financial assets and financial liabilities on the date of initial application of IFRS 9 (continued)
The following table analyses the impact, of transition to IFRS 9 on reserves and retained earnings. The impact relates to the retained earnings. There is no impact on other components ofequity.
Impact of adopting IFRS
36. Financial assets and financial liabilities (continued) Reconcilliation of Impairment at the date of initial application of IFRS 9
the closing impairment allowance for financial assets in accordance with IAS 39 and provisions for loan commitments and financial guarantee contracts in accordance with IAS 37 Provisions,Contingent Liabilities and Contingent Assets as at 31 December 2017; to
36. Financial assets and financial liabilities (continued)
F-90

AFRICAN EXPORT-IMPORT BANKNOTES TO THE SPECIAL PURPOSE FINANCIAL STATEMENTSFOR THE YEAR ENDED 31 DECEMBER 2018
37 TAXATION
38 EVENTS AFTER THE REPORTING DATE
39 RECLASSIFICATION FOR COMPARATIVE FIGURES
40 APPROVAL OF FINANCIAL STATEMENTS
The financial statements were approved by the Chairman on behalf of theBoard of Directors on 7 October 2019.
According to Article XIV of the Agreement for the Establishment of African Export-Import Bank, which is signed and ratified by African member countries, the Bank's property, assets, income, operations and transactions are exempt from all taxation and custom duties.
There are no material events after the reporting date that would require adjustment to these financial statements. Subsequent to year end the bank raised additional capital and retired warrants as disclosed in (note 15)
Some of the comparative figures have been reclassified to be consistent with the classification of the financial statements for the current year.
F-91
Africa Export Import Bank
Special Purpose Financial Statements for the yearended 31 December 2017
F-92

INDEPENDENT AUDITORS’ REPORT
TO THE BOARD OF DIRECTORS OF AFRICAN EXPORT-IMPORT BANK
Report on the Special Purpose Financial Statements
Opinion
We have audited the special purpose financial statements of African Export-Import Bank (the “Bank”), which comprise the special purpose statements of financial position as at 31 December 2017 and 2016, the special purpose statements of profit or loss and other comprehensive income, changes in equity and cash flows for the years then ended, and notes, comprising significant accounting policies and other explanatory information.
In our opinion, the accompanying special purpose financial statements present fairly, in all material respects, the financial position of African Export-Import Bank as at 31 December 2017 and 2016, and its financial performance and its cash flows for the years then ended in accordance with International Financial Reporting Standards (IFRS).
Basis for Opinion
We conducted our audit in accordance with International Standards on Auditing (ISAs). Our responsibilities under those standards are further described in the Auditors’ Responsibilities for the Audit of the Special Purpose Financial Statements section of our report. We are independent of the Bank in accordance with International Ethics Standards Board for Accountants Code of Ethics for Professional Accountants (IESBA Code) and we have fulfilled our other ethical responsibilities in accordance with these requirements. We believe that the audit evidence we have obtained is sufficient and appropriate to provide a basis for our opinion.
Emphasis of Matter - Basis of Accounting and Restriction on Use and Distribution
We draw attention to Note 2.1 “Basis of preparation” to the special purpose financial statements, the special purpose financial statements are prepared to be included in a registration document for the proposed offering to investors of global depository receipts “GDRs” representing interests in class D shares of the Bank for trading in London Stock Exchange. As a result, the special purpose financial statements may not be suitable for another purpose. Our report is intended solely to be included in the GDR registration document. Our opinion is not modified in respect of this matter.
Key Audit Matters
Key audit matters are those matters that, in our professional judgment, were of most significance in our audit of the special purpose financial statements. These matters were addressed in the context of our audit of the special purpose financial statements as a whole, and in forming our opinion thereon, and we do not provide a separate opinion on these matters.
F-93
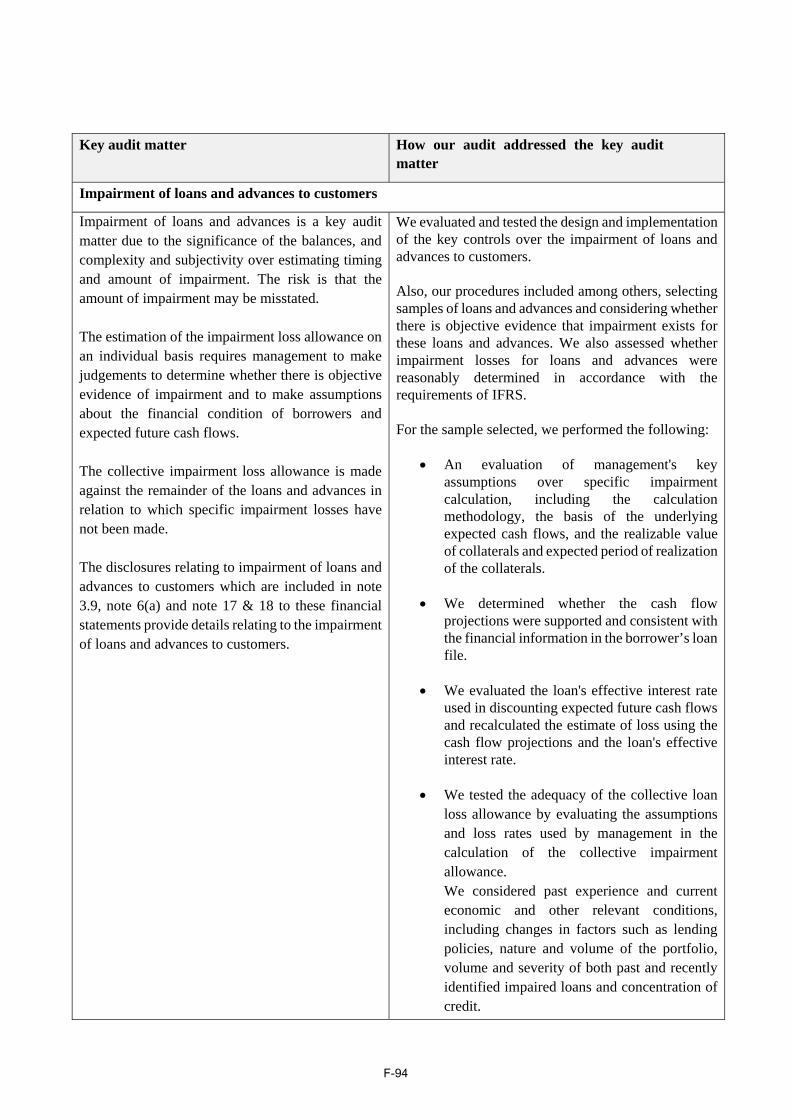
Key audit matter How our audit addressed the key audit matter
Impairment of loans and advances to customers
Impairment of loans and advances is a key audit matter due to the significance of the balances, and complexity and subjectivity over estimating timing and amount of impairment. The risk is that the amount of impairment may be misstated.
The estimation of the impairment loss allowance on an individual basis requires management to make judgements to determine whether there is objective evidence of impairment and to make assumptions about the financial condition of borrowers and expected future cash flows.
The collective impairment loss allowance is made against the remainder of the loans and advances in relation to which specific impairment losses have not been made.
The disclosures relating to impairment of loans and advances to customers which are included in note 3.9, note 6(a) and note 17 & 18 to these financial statements provide details relating to the impairment of loans and advances to customers.
We evaluated and tested the design and implementation of the key controls over the impairment of loans and advances to customers.
Also, our procedures included among others, selecting samples of loans and advances and considering whether there is objective evidence that impairment exists for these loans and advances. We also assessed whether impairment losses for loans and advances were reasonably determined in accordance with the requirements of IFRS.
For the sample selected, we performed the following:
An evaluation of management's keyassumptions over specific impairmentcalculation, including the calculationmethodology, the basis of the underlyingexpected cash flows, and the realizable valueof collaterals and expected period of realizationof the collaterals.
We determined whether the cash flowprojections were supported and consistent withthe financial information in the borrower’s loanfile.
We evaluated the loan's effective interest rateused in discounting expected future cash flowsand recalculated the estimate of loss using thecash flow projections and the loan's effectiveinterest rate.
We tested the adequacy of the collective loanloss allowance by evaluating the assumptionsand loss rates used by management in thecalculation of the collective impairmentallowance.We considered past experience and currenteconomic and other relevant conditions,including changes in factors such as lendingpolicies, nature and volume of the portfolio,volume and severity of both past and recentlyidentified impaired loans and concentration ofcredit.
F-94

We also considered the consistency of the approach and evaluated the adequacy of the Bank’s disclosures on impairment of loans and advances to customers.
Valuation of derivatives
The Bank has entered into various derivatives for trading purposes as disclosed in note 5 to the financial statements. These derivatives include:
Interest rate swaps
IAS 39 requires that all derivatives are marked at fair value (marked to market). IFRS 13 sets out a hierarchy of the determination of fair value. Depending on whether the instruments are traded in active markets or not, a quoted price or recent market transactions data should be used. However, for instruments for which there is no active market, a valuation technique is used.
Discounting cash flows at different times is a routine but key part of derivatives valuations. Discount rates for varying periods can be implied from pure interest rate instruments such as government bond, interest rate futures, interest rate swaps, treasury bills, money market deposits.
There is a risk of improper valuation of derivative instruments in line with IAS 39. The discount rates or swap curves used in the derivatives valuation may not be accurately compiled.
We also considered there to be a risk that the derivative financial instruments disclosures included in note 2.19 and note 5 are not complete.
We evaluated and tested the design and implementation of key controls over the valuation of interest rate swaps (IRS) and currency swaps and forwards.
We performed the following procedures:
Assessed the appropriateness of the valuation modelsused to value the derivative financial instruments.
Reperformed the valuation of a sample of each typeof derivative financial instruments. Applied relevantderivative pricing theory and market practice, inorder to determine an appropriate valuationmethodology for each derivative instrument.
Compared the fair value adjustments passed bymanagement to our recalculation.
Assessed the sources and accuracy of key inputs usedin the valuations such as the risk free rates, spot ratesand implied forward rates, and benchmarked theserates against external sources.
We obtained third party confirmations for the open positions.
We assessed whether the disclosures on derivative financial intruments are complete and adequate.
Responsibilities of Management and Those Charged with Governance for the Special Purpose Financial Statements
Management is responsible for the preparation and fair presentation of the special purpose financial statements in accordance with IFRS and for such internal control as management determines is necessary to enable the preparation of special purpose financial statements that are free from material misstatement, whether due to fraud or error.
F-95

In preparing the special purpose financial statements, management is responsible for assessing the Bank’s ability to continue as a going concern, disclosing, as applicable, matters related to going concern and using the going concern basis of accounting unless management either intends to liquidate the Bank or to cease operations, or has no realistic alternative but to do so.
Those charged with governance are responsible for overseeing the Bank’s financial reporting processes.
Auditors’ Responsibilities for the Audit of the Special Purpose Financial Statements
Our objectives are to obtain reasonable assurance about whether the special purpose financial statements as a whole are free from material misstatement, whether due to fraud or error, and to issue an auditors’ report that includes our opinion. Reasonable assurance is a high level of assurance, but is not a guarantee that an audit conducted in accordance with ISAs will always detect a material misstatement when it exists. Misstatements can arise from fraud or error and are considered material if, individually or in the aggregate, they could reasonably be expected to influence the economic decisions of users taken on the basis of these special purpose financial statements. As part of an audit in accordance with ISAs, we exercise professional judgment and maintain professional skepticism throughout the audit. We also:
Identify and assess the risks of material misstatement of the special purpose financial statements,whether due to fraud or error, design and perform audit procedures responsive to those risks, and obtainaudit evidence that is sufficient and appropriate to provide a basis for our opinion. The risk of notdetecting a material misstatement resulting from fraud is higher than for one resulting from error, asfraud may involve collusion, forgery, intentional omissions, misrepresentations, or the override ofinternal control.
Obtain an understanding of internal control relevant to the audit in order to design audit procedures thatare appropriate in the circumstances, but not for the purpose of expressing an opinion on theeffectiveness of the Bank’s internal control.
Evaluate the appropriateness of accounting policies used and the reasonableness of accountingestimates and related disclosures made by management.
Conclude on the appropriateness of management’s use of the going concern basis of accounting and,based on the audit evidence obtained, whether a material uncertainty exists related to events orconditions that may cast significant doubt on the Bank’s ability to continue as a going concern. If weconclude that a material uncertainty exists, we are required to draw attention in our auditors’ report tothe related disclosures in the special purpose financial statements or, if such disclosures are inadequate,to modify our opinion. Our conclusions are based on the audit evidence obtained up to the date of ourauditors’ report. However, future events or conditions may cause the Bank to cease to continue as agoing concern.
Evaluate the overall presentation, structure and content of the special purpose financial statements,including the disclosures, and whether special purpose the financial statements represent the underlyingtransactions and events in a manner that achieves fair presentation.
F-96

…………………………………..KPMG Hazem Hassan Public Accountants & Consultants Smart Village – Building 105, KM 28 Cairo - Alex Desert Road, Giza, Egypt
Date: 7 October 2019.
We communicate with those charged with governance regarding, among other matters, the planned scope and timing of the audit and significant audit findings, including any significant deficiencies in internal control that we identify during our audit. We also provide those charged with governance with a statement that we have complied with relevant ethical requirements regarding independence, and to communicate with them all relationships and other matters that may reasonably be thought to bear on our independence, and where applicable, related safeguards.
From the matters communicated with those charged with governance, we determine those matters that were of most significance in the audit of the special purpose financial statements and are therefore the key audit matters. We describe these matters in our auditors’ report unless law or regulation precludes public disclosure about the matter or when, in extremely rare circumstances, we determine that a matter should not be communicated in our report because the adverse consequences of doing so would reasonably be expected to outweigh the public interest benefits of such communication.
Report on Other Legal and Regulatory Requirements
This report is required by Item 18.3.1 of Annex 1 of Commission Delegated Regulation (EU) 2019/980 (the ‘PR Regulation’). For the purposes of Item 1.2 of Annex 1 to the PR Regulation we are responsible for this report as part of the registration document and declare that, to the best of our knowledge, the information contained in this report is in accordance with the facts and that the report makes no omission likely to affect its import. This declaration is included in the registration document in compliance with Item 1.2 of Annex 1 of the PR Regulation.
The engagement partner on the audit resulting in this independent auditors’ report is Abdel Hadi M. Ibrahim.
F-97

AFRICAN EXPORT-IMPORT BANKSPECIAL PURPOSE STATEMENT OF FINANCIAL POSITIONAS AT 31 DECEMBER 2017
31/12/2017 31/12/2016Note US$000 US$000
ASSETS
Cash and cash equivalents 16 3,214,573 1,269,080Loans and advances to customers 17 8,329,943 10,148,202Derivative assets held for risk management 5 3,574 8,792Prepayments and accrued income 19 298,102 241,556Financial investments - held to maturity 21 30,268 30,268Other assets 20 2,931 3,069Property and equipment 24 32,838 24,466Intangible Assets 25 1,248 814Total assets 11,913,477 11,726,247
LIABILITIES
Due to banks 22 4,231,374 4,050,912Debt securities in issue 23 2,881,622 2,091,114Deposits and customer accounts 26 2,149,356 3,778,493Derivative liabilities held for risk management 5 21,467 22,018Other liabilities 27 505,624 157,342Total liabilities 9,789,443 10,099,879
CAPITAL FUNDS
Share capital 28 470,816 378,488Share premium 29 562,350 355,310Warrants 33 91,723 98,716Reserves 30 474,733 364,406Retained earnings 31 524,412 429,448Total capital funds 2,124,034 1,626,368
Total liabilities and capital funds 11,913,477 11,726,247
The financial statements were approved by the Chairman on behalf of the Board of Directors on 7 October 2019 and signed on its behalf as follows:
Prof. Benedict Okey OramahChairman of the Board of Directors
The accompanying notes to the special purpose financial statements form part of this statement
F-98

AFRICAN EXPORT-IMPORT BANK 2SPECIAL PURPOSE STATEMENT OF PROFIT OR LOSS AND OTHER COMPREHENSIVE INCOMEFOR THE YEAR ENDED 31 DECEMBER 2017
2017 2016Note US$000 US$000
Interest and similar income 8 606,074 484,012 Interest and similar expense 9 (267,749) (210,758) Net interest and similar income 338,325 273,254
Fee and commission income 10 39,245 36,290 Fee and commission expense 11 (8,883) (5,855) Net fee and commission income 30,362 30,435
Other operating income 12 3,439 1,675 Personnel expenses 13 (38,758) (32,283) General and administrative expenses 14 (24,672) (19,325) Depreciation and amortisation expense 24, 25 (3,113) (4,483) Exchange adjustments (1,641) 2,124 Fair value loss from derivatives (4,718) - Cash flow hedge adjustments (discontinued) 30 (13,476) - Loan impairment charges 18 (63,397) (82,747) Impairment in other assets & accrued income 18 (1,857) (3,616)
PROFIT FOR THE YEAR 220,494 165,034
OTHER COMPREHENSIVE INCOME
Other comprehensive income to be reclassified to profit or loss in subsequent periodsCashflow hedges 30 - (33,087) Total other comprehensive income to be reclassified to profit or loss in subsequent periods - (33,087)
Other comprehensive income not to be reclassified to profit or loss in subsequent periodsGains (losses) on revaluation of land and buildings 24 9,279 (18,650) Total Other comprehensive income not to be reclassified
9,279 (18,650)
Total other comprehensive income 9,279 (51,737)
TOTAL COMPREHENSIVE INCOME FOR THE YEAR 229,773 113,297
Earnings per shareBasic earnings per share (expressed in US$000 per share) 15 5.58 4.63 Diluted earnings per share (expressed in US$000 per share) 15 2.25 1.85
The accompanying notes to the special purpose financial statements form part of this statement
F-99

AFR
ICA
N E
XPO
RT
-IM
POR
T B
AN
K4
SPE
CIA
L P
UR
POSE
ST
AT
EM
EN
T O
F C
HA
NG
ES
IN E
QU
ITY
FOR
TH
E Y
EA
R E
ND
ED
31
DE
CE
MB
ER
201
7
Shar
e C
apita
lSh
are
Prem
ium
War
rant
sG
ener
al
Res
erve
Ass
et R
eval
uatio
n R
eser
veC
ashf
low
hed
ge
rese
rve
Proj
ect
prep
arat
ion
faci
lity
Fund
re
serv
e R
etai
ned
Ear
ning
sT
otal
(Not
e 28
)(N
ote
29)
(Not
e 33
)(N
ote
30)
(Not
e 30
)(N
ote
30)
(Not
e 30
)(N
ote
31)
US$
000
US$
000
US$
000
US$
000
US$
000
US$
000
US$
000
US$
000
US$
000
Bal
ance
at 1
Jan
uary
201
737
8,48
8
355,
310
98
,716
36
6,28
2
11,6
00
(13,
476)
-
429,
448
1,
626,
368
T
otal
com
preh
ensi
ve in
com
ePr
ofit
of th
e ye
ar-
- -
- -
- -
220,
494
22
0,49
4
Oth
er c
ompr
ehen
sive
inco
me
Rec
yclin
g of
fair
valu
e ad
just
men
t to
prof
it an
d lo
ss-
- -
- -
13,4
76
- -
13,4
76
Ass
et re
valu
atio
n re
serv
e-
- -
- 9,
279
-
- -
9,27
9
Tra
nsac
tions
with
equ
ity o
wne
rs o
f the
Ban
kPr
ojec
t pre
para
tion
faci
lity
Fund
rese
rve
- -
- -
- -
7,50
0
(7,5
00)
-
Tran
sfer
to g
ener
al re
serv
e-
- -
81,4
80
- -
- (8
1,48
0)
- D
epre
ciat
ion
trans
fer:
build
ings
- -
- -
(1,4
08)
-
- 1,
408
-
War
rant
s ret
irem
ent
- -
(198
,575
)
- -
- -
- (1
98,5
75)
Is
sued
and
Pai
d in
cap
ital d
urin
g 20
1792
,328
20
7,04
0
191,
582
-
- -
- -
490,
950
D
ivid
ends
for y
ear 2
016
(Not
e 32
)-
- -
- -
- -
(37,
958)
(3
7,95
8)
Bal
ance
at 3
1 D
ecem
ber
2017
470,
816
56
2,35
0
91,7
23
447,
762
19
,471
-
7,50
0
524,
412
2,
124,
034
Bal
ance
at 1
Jan
uary
201
630
7,15
2
203,
861
46
,316
30
2,74
4
31,8
78
19,6
11
- 35
5,14
7
1,26
6,70
9
Tot
al c
ompr
ehen
sive
inco
me
Prof
it of
the
year
- -
- -
- -
- 16
5,03
4
165,
034
O
ther
com
preh
ensi
ve in
com
eEf
fect
ive
porti
on o
f cha
nges
in fa
ir va
lue
of c
ash
flow
hed
ge-
- -
- -
(33,
087)
-
- (3
3,08
7)
Ass
et re
valu
atio
n re
serv
e-
- -
- (1
8,65
0)
- -
(18,
650)
T
rans
actio
ns w
ith e
quity
ow
ners
of t
he B
ank
Tran
sfer
to g
ener
al re
serv
e-
- -
63,5
38
- -
- (6
3,53
8)
- D
epre
ciat
ion
trans
fer:
build
ings
- -
- -
(1,6
28)
-
- 1,
628
-
Paid
in c
apita
l dur
ing
2016
71,3
36
151,
449
-
- -
- -
- 22
2,78
5
War
rant
s ret
irem
ent
- -
(46,
316)
-
- -
- -
(46,
316)
Is
sued
dur
ing
the
year
- -
98,7
16
- -
- -
- 98
,716
D
ivid
ends
for y
ear 2
015
(Not
e 32
)-
- -
- -
- -
(28,
823)
(2
8,82
3)
Bal
ance
at 3
1 D
ecem
ber
2016
378,
488
35
5,31
0
98,7
16
366,
282
11
,600
(1
3,47
6)
- 42
9,44
8
1,62
6,36
8
The
acco
mpa
nyin
g no
tes t
o th
e sp
ecia
l pur
pose
fina
ncia
l sta
tem
ents
form
par
t of t
his s
tate
men
t
F-100

AFRICAN EXPORT-IMPORT BANK 5SPECIAL PURPOSE STATEMENT OF CASH FLOWSFOR THE YEAR ENDED 31 DECEMBER 2017
2017 2016Note US$000 US$000
CASHFLOW FROM OPERATING ACTIVITIES
Profit for the year 220,494 165,034
Adjustment for non-cash items:Depreciation of property and equipment 24 2,641 3,861 Amortization of intangible assets 25 472 622 Net interest income (338,325) (273,254) Allowance on impairment on loans and advances 18.1(b) 63,397 82,747 Impairment on other assets 18.2(b) 598 1,074 Impairment on accrued income 18.2(b) 1,259 2,542 Leave pay expense 206 306 Net loss from cash flow hedge 18,194 - Gain on disposal of property and equipment - (7)
(31,064) (17,075) Changes in :Money market placements - Maturity more than 3 months (2,094,442) (150,196) Prepayments and accrued income (54,624) (28,959) Hedging derivatives instruments (52) 3,163 Other assets (460) (1,083) Other liabilities 346,892 22,026 Deposits and customer accounts (1,629,137) 2,470,350 Loans and advances to customers 1,754,862 (4,199,901)
(1,708,025) (1,901,675)
Interest receievd 559,979 411,773 Interest paid (224,835) (178,182) Net cash outflows from (used in) operating activities (1,372,881) (1,668,084)
CASH FLOWS FROM INVESTING ACTIVITIES
Purchases and additions to property and equipment 24, 25 (2,640) (2,472) Proceeds from sale of property and equipment - 7 Net cash outflows used in investing activities (2,640) (2,465)
CASH FLOWS FROM FINANCING ACTIVITIES
Net cash from capital subscriptions and share premium 283,790 204,205 Proceeds from issue of warrants 33 191,582 98,716 Retirement of warrants 33 (198,575) (46,316) Dividends paid (21,195) (20,254) Proceeds from borrowed funds and debt securities 9,339,015 7,226,436 Repayment of borrowed funds and debt securities (8,368,045) (5,497,446) Net cash inflows from financing activities 1,226,572 1,965,341
Net increase in cash and cash equivalents (148,949) 294,792 Cash and cash equivalents at 1 January 1,118,884 824,092
CASH AND CASH EQUIVALENTS AT 31 DECEMBER 969,935 1,118,884
Represented in:
Cash and Cash Equivalent as presented in the statement of financial position 16 3,214,573 1,269,080
Money market placements - Maturity more than 3 months (2,244,638) (150,196) CASH AND CASH EQUIVALENTS AT 31 DECEMBER 969,935 1,118,884
The accompanying notes to the special purpose financial statements form part of this statement
F-101

AFRICAN EXPORT-IMPORT BANK 6NOTES TO THE SPECIAL PURPOSE FINANCIAL STATEMENTSFOR THE YEAR ENDED 31 DECEMBER 2017
1 GENERAL INFORMATION
2 SUMMARY OF SIGNIFICANT ACCOUNTING POLICIES
2.1 Basis of preparation
`2.1.1 Initial application of new amendments to the existing Standards effective for current financial period.
The following new amendments to the existing standards issued by the International Accounting Standards Board are effective for current financial period:
• IFRS 12 “Disclosure of Interests in Other Entities” - Clarification of the scope of the disclosure requirements in IFRS 12 (effective from 1 January 2017).The amendments clarify that the disclosure requirements in IFRS 12, other than those in paragraphs B10–B16, apply to an entity’s interest in a subsidiary, a joint venture or an associate (or a portion of its interest in a joint venture or an associate) that is classified (or included in a disposal group that is classified) as held forsale.
The African Export-Import Bank (“the Bank”), headquartered in Cairo, Egypt, is a supranational institution, established on 27 October 1993. The Bank startedlending operations on 30 September 1994. The principal business of the Bank is the finance and facilitation of trade among African countries and between Africaand the rest of the world. The Bank’s headquarters is located at No. 72 (B) El Maahad El Eshteraky Street, Heliopolis, Cairo 11341, Egypt. In addition, the Bankhas branches in Abuja (Nigeria), Harare (Zimbabwe), Abidjan (Cote D'Ivoire) and Nairobi (Kenya).
The accounting policies applied by the Bank have been approved by the Board of Directors of the Bank and in accordance with International Financial ReportingStandards (IFRS) promulgated by the International Accounting Standards Board. The major accounting policies adopted, which are consistent with those used inthe previous financial year, except for the amendments to IFRS effective as of 1 January 2017 as disclosed in note 2.1.1 below and applied by the Bank aresummarized below.
The special purpose financial statements of the Bank have been prepared in accordance with International Financial Reporting Standards as issued by theInternational Accounting Standards Board (IASB).
The special purpose financial statements are prepared on a historical cost basis except for land and buildings and derivative financial instruments that have beenmeasured at fair value and are presented in US Dollars in accordance with the Bank’s Charter. The functional currency of the Bank is the US Dollar based on thefact that most of the activities of the Bank are conducted in US Dollar. The financial statements are presented in US Dollars and all values are rounded to thenearest thousand (US$’000). The Bank has not applied any IFRS before their effective dates.
The preparation of financial statements complying with IFRS requires the use of certain critical accounting estimates. It also requires management to exercise itsjudgment in the process of applying the Bank’s accounting policies. The areas involving a higher degree of judgment or complexity, or areas where assumptionsand estimates are significant to the financial statements are disclosed in note 6 below.
The adoption of these amendments to the existing standards and interpretations has not led to any changes in the Bank’s accounting policies.
• Amendments to IAS 7 “Statement of Cash Flows” - Disclosure Initiative (effective for annual periods beginning on or after 1 January 2017).
The amendments to IAS 7 Statement of Cash Flows are part of the IASB’s Disclosure Initiative and require an entity to provide disclosures that enable users of financial statements to evaluate changes in liabilities arising from financing activities, including both changes arising from cash flows and non-cash changes. On initial application of the amendment, entities are not required to provide comparative information for preceding periods.
The special purpose financial statements has been prepared to be included in a prospectus for the proposed offer to certain institutional and professional investors of global depositary receipts "GDRs" representing interests in Class D Shares of the Bank .
F-102

AFRICAN EXPORT-IMPORT BANK 7NOTES TO THE SPECIAL PURPOSE FINANCIAL STATEMENTSFOR THE YEAR ENDED 31 DECEMBER 2017
2.1.2 New Standards and amendments to existing standards in issue not yet adopted
• IFRS 9 “Financial Instruments” (effective for annual periods beginning on or after 1 January 2018).In July 2014, the IASB issued IFRS 9 “Financial Instruments”, which replaces IAS 39, “Financial Instruments: Recognition and Measurement”. IFRS 9 introducesnew requirements for how an entity should classify and measure financial assets, requires changes to the reporting of ‘own credit’ with respect to issued debtliabilities that are designated at fair value, replaces the current rules for impairment of financial assets and amends the requirements for hedge accounting. Thestandard also requires entities to provide users of financial statements with more informative and relevant disclosures. IFRS 9 is effective for annual periodsbeginning on or after January 1, 2018.Implementation programThe Bank has a centrally managed IFRS 9 committee chaired by the Bank’s Executive Vice President (FABS) and includes subject matter experts onmethodology, data sourcing and modeling, IT processing and reporting. The Bank’s work to date has covered performing an assessment of the population offinancial instruments impacted by the classification and measurement requirements of IFRS 9 and developing an impairment methodology to support thecalculation of the Expected Credit Loss allowance. Specifically, during 2017 the Bank developed its approach for assessing significant increase in credit risk,incorporating forward looking information, including macro-economic factors (to be implemented in 2018) and preparing the required IT systems and processarchitecture. The Bank envisages performing parallel runs in 2018 to ensure procedural readiness and further improve the data quality of new data required.Overall governance of the program’s implementation is through the IFRS 9 Steering Committee and includes representation from Finance, Banking operation,Treasury, Risk and IT. Guidance and training on IFRS 9 across the Bank is delivered across businesses and functions as part of the Bank’s internal controlsystems. The Bank is in the process of enhancing its existing governance framework to ensure that appropriate validations and controls are in place over new keyprocesses and significant areas of judgment. Governance over the Expected Credit Loss calculation process is split across Risk, Credit assessment and Financefunctions.Classification and Measurement of Financial Assets and LiabilitiesIFRS 9 requires that an entity’s business model and a financial instrument’s contractual cash flows will determine its classification and measurement in thefinancial statements. Upon initial recognition each financial asset will be classified as either fair value through profit or loss (‘FVTPL’), amortized cost, or fairvalue through Other Comprehensive Income (‘FVOCI’). As the requirements under IFRS 9 are different than the assessments under the existing IAS 39 rules,some differences to the classification and measurement of financial assets under IAS 39 are expected. The classification and measurement of financial liabilitiesremain largely unchanged under IFRS 9 from current requirements. In 2017, the Bank made an initial determination of business models and assessed thecontractual cash flow characteristics of the financial assets to determine the potential classification and measurement changes as a result of IFRS 9. As a result ofthe analysis performed thus far, the Bank has identified a population of financial assets which are expected to be measured at either amortized cost or fair valuethrough other comprehensive income, which will be subject to the IFRS 9 impairment rules. However, the actual impact that IFRS 9 classification andmeasurement will have on the Bank is mainly dependent on the business models and the inventory of financial assets which exist at the effective date, and as suchthe Bank will roll forward our analysis during 2018 to take into consideration any changes in business strategies and composition of financial assets. Where issueddebt liabilities are designated at fair value, the fair value movements attributable to an entity’s own credit risk will be recognized in Other Comprehensive Incomerather than in the Statement of Income. The standard also allows the Bank the option to elect to apply early the presentation of fair value movements of an entity’scredit risk in Other Comprehensive Income prior to adopting IFRS 9 in full. The Bank has not early adopted this requirement.
Impairment of Financial AssetsThe impairment requirements of IFRS 9 apply to financial assets that are measured at amortized cost or FVOCI, and off balance sheet lending commitments suchas loan commitments and financial guarantees (hereafter collectively referred to in this note as financial assets). The determination of impairment losses andallowance will move from an incurred credit loss model whereby credit losses are recognized when a defined loss event occurs under IAS 39, to an expected lossmodel under IFRS 9, where provisions are taken upon initial recognition of the financial asset (or the date that the Bank becomes a party to the loan commitmentor financial guarantee), based on expectations of potential credit losses at that time under IFRS 9. Currently, the Bank first evaluates individually whetherobjective evidence of impairment exists for loans that are individually significant. It then collectively assesses loans that are not individually significant and loanswhich are significant but for which there is no objective evidence of impairment available under the individual assessment. Under IFRS 9 for financial assetsoriginated or purchased, the Bank will recognize a loss allowance at an amount equal to 12-month expected credit losses, if the credit risk at the reporting date hasnot increased significantly since initial recognition (Stage 1). This amount represents the expected credit losses resulting from default events that are possiblewithin the next 12 months. The interest revenue is calculated on the gross carrying amount for financial assets in Stage 1. IFRS 9 requires the recognition of creditlosses over the remaining life of the financial assets (‘lifetime expected losses’) which are considered to have experienced a significant increase in credit risk(Stage 2) and for financial assets that are credit impaired at the reporting date (Stage 3). The lifetime expected credit losses represent all possible default eventsover the expected life of a financial instrument. The Bank leverages existing risk management indicators (e.g. watch list, fair risk), credit rating changes andtaking into consideration reasonable and supportable information which allows the Bank to identify whether the credit risk of financial assets
At the date of authorisation of these financial statements the following new standards and amendments to existing standards were in issue but not yet effective.Impact of intial application of the below IFRS is not known :
F-103

AFRICAN EXPORT-IMPORT BANK 8NOTES TO THE SPECIAL PURPOSE FINANCIAL STATEMENTSFOR THE YEAR ENDED 31 DECEMBER 2017
Hedge accountingIFRS 9 also incorporates new hedge accounting rules that intend to align hedge accounting with risk management practices. Generally, some restrictions undercurrent rules have been removed and a greater variety of hedging instruments and hedged items become available for hedge accounting. The requirements forgeneral hedge accounting have been simplified for hedge effectiveness testing and may result in more designations of groups of items as the hedged items arepossible.Transition impactBased on December 31, 2017 data and the current implementation status of IFRS 9 as described in further details above the Bank couldn’t estimate the figures forthe current year.
has significantly increased. This process includes considering forward-looking information, including macro-economic factors. Furthermore, financial assets willbe transferred to Stage 2 if 30 days past due. The interest revenue is calculated on the gross carrying amount for financial assets in Stage 2. As the primarydefinition for credit impaired financial assets moving to Stage 3, the Bank will apply the default definition as laid out in CRR Article 178. Interest revenues arecalculated on the net carrying amount for these financial assets only. Forward-looking information, including macro-economic factors must be taken into accountto measure IFRS 9 compliant expected credit losses. IFRS 9 does not distinguish between individually significant or not individually significant financialinstruments. Therefore, the Bank decided to measure the allowance for credit losses on an individual transaction basis. Similarly, the assessment for transferringfinancial assets between Stages 1, 2 and 3 will also be made on an individual transaction basis. For detailed information on the current impairment approachunder IAS 39 please refer to Note 2.8 “Impairment of loans and advances”. The Bank uses three main components to measure expected credit losses which are aprobability of default (‘PD’), a loss given default (‘LGD’) and the exposure at default (‘EAD’). Therefore, the Bank will leverage the existing parameters of theregulatory framework and risk management practices as much as possible on transaction level. For the purpose of IFRS 9 the allowance for credit losses isaffected by a variety of key characteristics, such as, but not limited to the expected balance at default and the related amortization profile as well as the expectedlife of the financial asset. As a consequence, the allowance for credit losses for Stage 2 financial assets will increase with the expected lifetime or the expectedEAD. Incorporating forecasts of future economic conditions into the measurement of expected credit losses will additionally cause an impact on the allowance forcredit losses for each stage. In order to calculate lifetime expected credit losses, the Bank’s calculation includes deriving the corresponding lifetime PDs frommigration matrices that reflect the economic forecasts. To determine whether a financial asset is credit impaired and thus must be classified as Stage 3, one ormore events must be identified that have a detrimental impact on the estimated future cash flows.
As a result of IFRS 9, there will be an increase in subjectivity as the allowance for credit losses will be based on reasonable and supportable forward-lookinginformation which take into consideration future macro-economic scenarios as provided by Afreximbank Bank Research. These macro-economic scenarios arecontinuously monitored and in addition to being used for the Bank’s expected credit loss calculation, this information also forms the basis for performing theBank’s capital planning and stress-testing. This information provided by Afreximbank Bank Research is used to generate possible future scenarios by utilizing theBank’s stress testing infrastructure with appropriate modifications to align with IFRS 9 requirements. The Bank is in the process of analyzing synergies with thecapital forecasting and stress-testing processes. The transition impact and effects resulting from the continuous application of IFRS 9 are reflected in the Bank’scapital planning for 2018 and onwards. The general use of forward-looking information, including macro-economic factors as well as adjustments taking intoaccount extraordinary factors will be monitored by a governance framework. IFRS 9 is estimated to result in an increase in the overall level of allowances forcredit losses as noted above. This estimated increase is driven by the requirement to record an allowance equal to 12 months expected credit losses on thoseinstruments whose credit risk has not significantly increased since initial recognition and driven by the larger population of financial assets to which lifetimeexpected losses must be applied.
F-104

AFRICAN EXPORT-IMPORT BANK 9NOTES TO THE SPECIAL PURPOSE FINANCIAL STATEMENTSFOR THE YEAR ENDED 31 DECEMBER 2017
• IFRS 16 “Leases” (effective for annual periods beginning on or after 1 January 2019).IFRS 16 was issued in January 2016 and it replaces IAS 17 Leases, IFRIC 4 Determining whether an Arrangement contains a Lease, SIC-15 Operating Leases-Incentives and SIC-27 Evaluating the Substance of Transactions Involving the Legal Form of a Lease. IFRS 16 sets out the principles for the recognition,measurement, presentation and disclosure of leases and requires lessees to account for all leases under a single on-balance sheet model similar to the accountingfor finance leases under IAS 17. The standard includes two recognition exemptions for lessees – leases of ’low-value’ assets (e.g., personal computers) and short-term leases (i.e., leases with a lease term of 12 months or less). At the commencement date of a lease, a lessee will recognise a liability to make lease payments(i.e., the lease liability) and an asset representing the right to use the underlying asset during the lease term (i.e., the right-of-use asset). Lessees will be required toseparately recognise the interest expense on the lease liability and the depreciation expense on the right-of-use asset. Lessees will be also required to remeasure the lease liability upon the occurrence of certain events (e.g., a change in the lease term, a change in future leasepayments resulting from a change in an index or rate used to determine those payments). The lessee will generally recognise the amount of the remeasurement ofthe lease liability as an adjustment to the right-of-use asset.Lessor accounting under IFRS 16 is substantially unchanged from today’s accounting under IAS 17. Lessors will continue to classify all leases using the sameclassification principle as in IAS 17 and distinguish between two types of leases: operating and finance leases.IFRS 16 also requires lessees and lessors to make more extensive disclosures than under IAS 17.IFRS 16 is effective for annual periods beginning on or after 1 January 2019. Early application is permitted, but not before an entity applies IFRS 15. A lessee canchoose to apply the standard using either a full retrospective or a modified retrospective approach. The standard’s transition provisions permit certain reliefs.In 2018, the bank will continue to assess the potential effect of IFRS 16 on its financial statements
• IFRS 15 “Revenue from Contracts with Customers” and further amendments (effective for annual periods beginning on or after 1 January 2018).
IFRS 15 specifies how and when an IFRS reporter will recognise revenue as well as requiring such entities to provide users of financial statements with moreinformative, relevant disclosures. The standard supersedes IAS 18 “Revenue”, IAS 11 “Construction Contracts” and a number of revenue-related interpretations.Application of the standard is mandatory for all IFRS reporters and it applies to nearly all contracts with customers: the main exceptions are leases, financialinstruments and insurance contracts. The core principle of the new Standard is for companies to recognise revenue to depict the transfer of goods or services tocustomers in amounts that reflect the consideration (that is, payment) to which the company expects to be entitled in exchange for those goods or services. Thenew Standard will also result in enhanced disclosures about revenue, provide guidance for transactions that were not previously addressed comprehensively (forexample, service revenue and contract modifications) and improve guidance for multiple-element arrangements.The impact of applying IFRS 15 on the Bank's financial statements can not be reasonable estimated.
• IFRS 17 “Insurance contracts” (effective for annual periods beginning on or after 1 January 2021).In May 2017, the IASB issued IFRS 17 Insurance Contracts (IFRS 17), a comprehensive new accounting standard for insurance contracts covering recognition and measurement, presentation and disclosure. Once effective,IFRS 17 will replace IFRS 4 Insurance Contracts (IFRS 4) that was issued in 2005. IFRS 17 applies to all types of insurance contracts (i.e., life, non-life, direct insurance and re-insurance), regardless of the type of entities that issue them, as well as to certain guarantees and financial instruments with discretionary participation features.A few scope exceptions will apply. The overall objective of IFRS 17 is to provide an accounting model for insurance contracts that is more useful and consistentfor insurers. In contrast to the requirements in IFRS 4, which are largely based on grandfathering previous local accounting policies, IFRS 17 provides a comprehensive model for insurance contracts, covering all relevant accounting aspects. The core of IFRS 17 is the generalmodel, supplemented by:• A specific adaptation for contracts with direct participation features (the variable fee approach)• A simplified approach (the premium allocation approach) mainly for short-duration contracts.IFRS 17 is effective for reporting periods beginning on or after 1 January 2021, with comparative figures required. Early application is permitted, provided the entity also applies IFRS 9 and IFRS 15 on or before the date it first applies IFRS 17.
• Amendments to IFRS 2 “Share-based Payment” - Classification and Measurement of Share-based Payment Transactions (effective for annual periods beginning on or after 1 January 2018).The IASB issued amendments to IFRS 2 Share-based Payment that address three main areas: the effects of vesting conditions on the measurement of a cash-settled share-based payment transaction; the classification of a share-based payment transaction with net settlement features for withholding tax obligations; andaccounting where a modification to the terms and conditions of a share-based payment transaction changes its classification from cash settled to equity settled.On adoption, entities are required to apply the amendments without restating prior periods, but retrospective application is permitted if elected for all three amendments and other criteria are met.
F-105

AFRICAN EXPORT-IMPORT BANK 10NOTES TO THE SPECIAL PURPOSE FINANCIAL STATEMENTSFOR THE YEAR ENDED 31 DECEMBER 2017
The Bank has elected not to adopt these new standards and amendements to existing standards in advance of their effective dates and the Bank is in the process of assesing the impact of these amendments on its financial statements.
• IFRIC Interpretation 22 “Foreign Currency” -Transactions and Advance Consideration (effective for annual periods beginning on or after 1 January 2018).The Interpretation clarifies that, in determining the spot exchange rate to use on initial recognition of the related asset, expense or income (or part of it) on the derecognition of a non-monetary asset or non-monetary liability relating to advance consideration, the date of the transaction is the date on which an entity initially recognises the non-monetary asset or non-monetary liability arising from the advance consideration. If there are multiple payments or receipts in advance, then the entity must determine the transaction date for each payment or receipt of advance consideration. Entities may apply the amendments on a fully retrospective basis.Alternatively, an entity may apply the Interpretation prospectively to all assets, expenses and income in its scope that are initially recognised on or after:i. The beginning of the reporting period in which the entity first applies the interpretation Orii. The beginning of a prior reporting period presented as comparative information in the financial statements of the reporting period in which the entity first applies the interpretation.
• Amendments to various standards “Improvements to IFRSs (cycle 2014-2016)” issued in December 2016. They include:- IFRS 1 “First-time Adoption of International Financial Reporting Standards” -Deletion of short-term exemptions for first-time adopters (effective from 1January 2018).Short-term exemptions in paragraphs E3–E7 of IFRS 1 were deleted because they have now served their intended purpose.
• Applying IFRS 9 Financial Instruments with IFRS 4 Insurance Contracts - Amendments to IFRS 4 - (effective from 1 January 2018).The amendments clarifies that:The amendments address concerns arising from implementing the new financial instruments standard, IFRS 9, before implementing IFRS 17 Insurance Contracts,which replaces IFRS 4. The amendments introduce two options for entities issuing insurance contracts: a temporary exemption from applying IFRS 9 and an overlay approach. An entity may elect the overlay approach when it first applies IFRS 9 and apply that approach retrospectively to financial assets designated on transition to IFRS 9. The entity restates comparative information reflecting the overlay approach if, and only if, the entity restates comparative information when applying IFRS 9.
• Amendments to IAS 40 “Investment Property” - Transfers of Investment Property (effective for annual periods beginning on or after1 January 2018).The amendments clarify when an entity should transfer property, including property under construction or development into, or out of investment property. The amendments state that a change in use occurs when the property meets, or ceases to meet, the definition of investment property and there is evidence of the changein use. A mere change in management’s intentions for the use of a property does not provide evidence of a change in use. Entities should apply the amendments prospectively to changes in use that occur on or after the beginning of the annual reporting period in which the entity first applies the amendments.An entity should reassess the classification of property held at that date and, if applicable, reclassify property to reflect the conditions that exist at that date. Retrospective application in accordance with IAS 8 is only permitted if it is possible without the use of hindsight. Effective for annual periods beginning on or after 1 January 2018. Early application of the amendments is permitted and must be disclosed.
• IAS 28 “Investments in Associates and Joint Ventures” - Clarification that measuring investees at fair value through profit or loss is an investment-by investment choice (effective from 1 January 2018).The amendments clarifies that:• An entity that is a venture capital organisation, or other qualifying entity, may elect, at initial recognition on an investment-by-investment basis, to measure itsinvestments in associates and joint ventures at fair value through profit or loss.• If an entity, that is not itself an investment entity, has an interest in an associate or joint venture that is an investment entity, the entity may, when applying the equity method, elect to retain the fair value measurement applied by that investment entity associate or joint venture to the investment entity associate’s or joint venture’s interests in subsidiaries. This election is made separately for each investment entity associate or joint venture, at the later of the date on which: (a) the investment entity associate or joint venture is initially recognised; (b) the associate or joint venture becomes an investment entity; and (c) the investment entity associate or joint venture first becomes a parent.The amendments should be applied retrospectively and are effective from 1 January 2018, with earlier application permitted. If an entity applies those amendments for an earlier period, it must disclose that fact.
• Amendments to IFRS 10 “Consolidated Financial Statements” and IAS 28 “Investments in Associates and Joint Ventures” - Sale or Contribution of Assetsbetween an Investor and its Associate or Joint Venture and further amendments (effective date was deferred indefinitely until the research project on the equitymethod has been concluded).The amendments address the conflict between IFRS 10 and IAS 28 in dealing with the loss of control of a subsidiary that is sold or contributed to an associate orjoint venture. The amendments clarify that the gain or loss resulting from the sale or contribution of assets that constitute a business, as defined in IFRS 3,between an investor and its associate or joint venture, is recognised in full. Any gain or loss resulting from the sale or contribution of assets that do not constitutea business, however, is recognised only to the extent of unrelated investors’ interests in the associate or joint venture.
F-106

AFRICAN EXPORT-IMPORT BANK
NOTES TO THE SPECIAL PURPOSE FINANCIAL STATEMENTS 11
FOR THE YEAR ENDED 31 DECEMBER 2017
2.2 Interest income and expense
2.3 Fees and commission income
2.4 Other operating income
2.5 Operating expenses
2.6 Foreign currencies
For all financial instruments measured at amortized cost and interest bearing financial instruments classified as available-for-sale financial instruments, interestincome or expense is recognized at the effective interest rate, which is the rate that exactly discounts estimated future cash payments or receipts through theexpected life of the financial instrument or shorter period, where appropriate, to the net carrying amount of the financial asset or financial liability. The carryingamount of the financial asset or financial liability is adjusted if the Bank revises its estimates of payments or receipts. The adjusted carrying amount is calculatedbased on the original effective interest rate (EIR) and the change in carrying amount is recognized as interest income or expense.
Once the recorded value of a financial asset or a group of similar financial assets has been reduced due to an impairment loss, interest income continues to berecognized using the original effective interest rate applied to the new carrying amount.
Unless included in the effective interest rate calculation, fees and commissions are generally recognized on an accrual basis when the service has been provided.Fees or component of fees that are performance linked (e.g. investment banking advisory services including among other things evaluating financing options, debtrestructuring, etc.) are recognized when the performance criteria are fulfilled in accordance with the applicable terms of engagement.
Other operating income consists mainly of rental income which is accounted for on a straight-line basis over the lease terms on ongoing leases. And recoveriesfrom previously written-off facilities.
Operating expenses are recorded on accrual basis.
At the reporting date, balances of monetary assets and liabilities denominated in foreign currencies are translated at the exchange rates ruling at that date. Anygains or losses resulting from the translation are recognized in profit or loss in the statement of profit or loss and comprehensive income.
Non-monetary items that are measured in terms of historical cost in a foreign currency are translated using the exchange rate as at the date of the initialtransaction and are not subsequently restated. Non-monetary items measured at fair value in a foreign currency are translated using the exchange rates at the datewhen the fair value was determined. The gain or loss arising on translation of non-monetary items measured at fair value is treated in line with the recognition ofgain or loss on change in fair value of the item (i.e. translation differences on items whose fair value gain or loss is recognized in other comprehensive income orprofit or loss are also recognized in other Comprehensive income or profit or loss, respectively).
Transactions in foreign currencies are initially recorded at their respective functional currency spot rate prevailing at the date of the transaction.
F-107

AFRICAN EXPORT-IMPORT BANK 12NOTES TO THE SPECIAL PURPOSE FINANCIAL STATEMENTSFOR THE YEAR ENDED 31 DECEMBER 2017
2.7 Cash and cash equivalents
2.8 Impairment of loans and advances
In addition to specific provisions against individually significant loans and advances, the Bank also makes a collective impairment provision against loans andadvances which although not specifically identified as requiring specific provisions, have a greater risk of default than when originally granted. The amount ofprovision is based on historical loss experience for loans.
When a loan is uncollectible, it is written off against the related provision for loan impairment. Such loans are written off after all the necessary procedures havebeen completed, including obtaining Board of Directors approval, and the amount of loss has been determined.
If, in a subsequent period the amount of the impairment loss decreases and the decrease can be related objectively to an event occurring after the impairment wasrecognized, the previously recognized impairment loss is reversed by adjusting the allowance account. The amount of the reversal is recognized as a reduction toloan impairment charges in profit or loss.
For the purposes of the statement of cash flows, cash and cash equivalents comprise cash in hand, due from banks, and deposits with other banks with less thanthree months’ maturity from the transaction date. Due from banks and deposits with other banks are carried at amortized cost as these balances earn interest.
The Bank assesses at each reporting date whether there is objective evidence that a loan is impaired (see note 6). Loans and advances are identified as impairedwhere there is reasonable doubt regarding the collectability of principal or interest. Whenever a payment is 90 days past due, loans and advances are automaticallyplaced on an impairment test. A loan is impaired and impairment losses are incurred only if there is objective evidence of impairment as a result of one or moreevents that occurred after the initial recognition of the loan (a loss event) and that loss event (or events) has an impact on the estimated future cash flows of theloan that can be reliably estimated.
The estimated period between losses occurring and its identification is determined by management for each loan. In general, the periods used vary between threemonths and twelve months; in exceptional cases, longer periods are warranted.
The amount of loss is measured as the difference between the carrying amount of the loan and the present value of estimated future cash flows discounted at theloan's original effective interest rate determined under contract. The carrying amount of loans and advances are reduced through the use of an allowance accountand the amount of the loss is recognized in profit or loss. Further details on estimates and assumptions used in impairment of loans and advances are shown innote 6.
The methodology and assumptions used for estimating future cash flows are reviewed regularly by the Bank to reduce any differences between loss estimates andactual loss experience.
F-108

AFRICAN EXPORT-IMPORT BANK 13NOTES TO THE SPECIAL PURPOSE FINANCIAL STATEMENTSFOR THE YEAR ENDED 31 DECEMBER 2017
2.9 Property and equipment
Motor vehicles, furniture and equipment, computers and leasehold improvements are stated at cost, excluding the costs of day-to-day servicing, less accumulateddepreciation and accumulated impairment in value. Cost includes expenditure that is directly attributable to the acquisition of the items. Repair and maintenancecosts are recognized in profit or loss as incurred.
A revaluation surplus is recorded in other comprehensive income and credited to the asset revaluation reserve in equity. However, to the extent that it reverses arevaluation deficit of the same asset previously recognized in profit or loss, the increase is recognized in profit or loss. A revaluation deficit is recognized in theprofit or loss, except to the extent that it offsets an existing surplus on the same asset recognized in the asset revaluation reserve. Upon disposal, any revaluationreserve relating to the particular asset being sold is transferred to retained earnings. An annual transfer from the asset revaluation reserve to retained earnings ismade for the difference between depreciation based on the revalued amount of the asset and depreciation based on the asset original cost.
Depreciation is calculated on the straight line basis at annual rates estimated to write off the carrying amounts of the assets over their expected useful lives, asfollows:
- Buildings 20 years - Motor vehicles 5 years- Furniture and equipment 4 years- Computers 3 years- Leasehold improvements Over the remaining period of the lease
Motor vehicles, furniture and equipment, computers and leasehold improvements are periodically reviewed for impairment. Please refer to (Note 2.14) on impairment of non -financial assets for further information about impairment.
The assets residual values, useful lives and methods of depreciation are reviewed at each reporting date, and adjusted prospectively if appropriate. Further detailson key estimates and assumptions made are disclosed in note 6.
The Headquarters’ land and building are measured at fair value less accumulated depreciation on buildings and impairment losses recognized at the date ofrevaluation.
Motor vehicles, furniture and equipment, computers and leasehold improvements are de-recognized upon disposal or when no future economic benefits areexpected to arise from the continued use of the asset. Any gain or loss arising on de-recognition of the asset (calculated as the difference between the net disposalproceeds and the carrying amount of the item) is included in profit or loss in the year the item is de-recognized.
Valuations are performed by an independent valuer at the reporting date to ensure that the fair value of a revalued asset does not differ materially from its carryingamount.
F-109

AFRICAN EXPORT-IMPORT BANKNOTES TO THE SPECIAL PURPOSE FINANCIAL STATEMENTS 14FOR THE YEAR ENDED 31 DECEMBER 2017
2.10 Intangible assets
2.11 Government grants
2.12 Earnings per share
2.13 Employee benefits
The Bank’s other intangible assets include the value of computer software
An intangible asset is recognised only when its cost can be measured reliably and it is probable that the expected future economic benefits that are attributable to itwill flow to the Bank. Intangible assets acquired separately are measured on initial recognition at cost. Following initial recognition, intangible assets are carriedat cost less any accumulated amortisation and any accumulated impairment losses.
The useful lives of intangible assets are assessed to be either finite or indefinite. Intangible assets with finite lives are amortised over the useful economic life. Theamortisation period and the amortisation method for an intangible asset with a finite useful life are reviewed at least at each financial year-end. Changes in theexpected useful life, or the expected pattern of consumption of future economic benefits embodied in the asset, are accounted for by changing the amortisationperiod or methodology, as appropriate, which are then treated as changes in accounting estimates.
Amortisation is calculated using the straight–line method to write down the cost of intangible assets to their residual values over their estimated useful lives, asfollows:- Computer & Core application software 4 years
Government grants related to assets, including non-monetary grants at fair value, are presented in the statement of financial position by deducting the grant inarriving at the carrying amount of the asset. the grant is deducted in calculating the carrying amount of the asset. The grant is recognised in profit or loss over thelife of a depreciable asset as a reduced depreciation expense.
ii. Other long term benefitsThe Bank's net obligation in respect of long-term employees benefits is the amount of future benefits that the employee have earned in return for their service incurrent and prior periods that benefits are recognized in profit or loss on an accrual basis.
iii. Termination benefitsTermination benefits are expensed at the earlier of when the Bank can no longer withdraw the offer of those benefits and when the Bank recognizes cost for arestructring . If benefits are not expexted to be wholly setteled within 12 months of the reporting date, then they are discounted
iv. Short term employee benefitsShort tern employee benefits are expensed as the related service is provided. A liabity is recognized for the amount expected to be paid if the Bank has legal orconstructive obligation to pay this amount as a result of past service provided by the employee and the obligation can be estimated reliably.
Basic earnings per share (EPS) is calculated by dividing the net profit for the year attributable to equity holders of the Bank by the weighted average number ofshares outstanding during the year. Diluted EPS is calculated by dividing the net profit attributable to equity holders of the Bank (by the weighted average numberof shares outstanding during the year plus the weighted average number of shares that would be issued on the conversion (warrants) of all the dilutive potentialordinary shares into ordinary shares.
i. Defined contribution planThe Bank operates a defined contribution plan approved by the Board of Directors. Contributions are recognized in profit or loss on an accrual basis. The Bankhas no further payment obligations once the contributions have been paid.
F-110

AFRICAN EXPORT-IMPORT BANK 15NOTES TO THE SPECIAL PURPOSE FINANCIAL STATEMENTSFOR THE YEAR ENDED 31 DECEMBER 2017
2.14 Financial instruments
Available-for-sale financial assetsThese assets are initially measured at fair value plus any directly attributable transaction costs. Subsequent to initial recognition, they are measured at fair valueand changes therein, other than impairment losses and foreign currency differences on debt instruments, are recognised in OCI and accumulated in the fair valuereserve. When these assets are derecognised, the gain or loss accumulated in equity is reclassified to profit or loss.
Financial assets at fair value through profit or lossA financial asset is classified as at fair value through profit or loss if it is classified as held for-trading or is designated as such on initial recognition. Directlyattributable transaction costs are recognised in profit or loss as incurred. Financial assets at fair value through profit or loss are measured at fair value and changestherein, including any interest or dividend income, are recognised in profit or loss.
Financial investments - Held to maturityHeld-to-maturity financial investments are non–derivative financial assets with fixed or determinable payments and fixed maturities that the Bank has theintention and ability to hold to maturity. After initial measurement, held-to-maturity financial investments are subsequently measured at amortised cost using theEIR less impairment. Amortised cost is calculated by taking into account any discount or premium on acquisition and fees that are an integral part of the EIR. Theamortisation is included in interest and similar income in the income statement. The losses arising from impairment of suchinvestments are recognised in the income statement within credit loss expense. If the Bank were to sell or reclassify more than an insignificant amount of held-to-maturity investments before maturity (other than in certain specific circumstances), the entire category would be tainted and would have to be reclassified asavailable-for-sale. Furthermore, the Bank would be prohibited from classifying any financial asset as held-to-maturity during the following two years.
Loans with renegotiated termsThe contractual terms of a loan may be modified for a number of reasons including changing market conditions, customer retention and other factors not relatedto a current or potential credit deterioration of the customer. An existing loan whose terms have been modified may be derecognized and the negotiated loanrecognised as a new loan at fair value.
Financial assets and financial liabilities are recognized when the Bank becomes a party to the contractual provisions of the instrument. The Bank’s financialinstruments consist primarily of cash and deposits with banks, loans and advances to customers, amounts due to banks, derivative financial instruments, debtsecurities in issue and customer deposits. The Bank borrows funds to meet disbursements in foreign currency as part of its matching of assets and liabilities inorder to manage foreign currency risks. The proceeds from loans repayments are used to repay the borrowings.Financial assets and liabilities, with the exception of loans and advances to customers and balances due to customers, are initially recognised on the trade date.Loans and advances to customers are recognised when funds are transferred to the customers’ account.
Loans and receivablesLoans and receivables including loans and advances to customers and cash and deposits with banks are non-derivative financial assets with fixed or determinablepayments that are not quoted in an active market. They are initially recognized at fair value plus transaction costs and are de-recognized when the rights to receivecash flows from the financial assets have expired or where the Bank has transferred substantially all risks and rewards of ownership. Subsequently, loans andreceivables are measured at amortized cost using the effective interest rate method less allowance for impairment, and are recognized on the day on which they aredrawn down by the borrower.
i) Classification and measurement of financial assetsFinancial assets are classified, at initial recognition, as financial assets at fair value through profit or loss, loans and receivables, held‑to‑maturity financial assetsand available‑for‑sale financial assets. All financial assets are recognized initially at fair value plus, in the case of financial assets not recorded at fair valuethrough profit or loss, transaction costs that are attributable to the acquisition of the financial asset.
F-111
AFRICAN EXPORT-IMPORT BANK 16NOTES TO THE SPECIAL PURPOSE FINANCIAL STATEMENTSFOR THE YEAR ENDED 31 DECEMBER 2017
The carrying amount of the financial asset is reduced by the impairment loss directly for all financial assets with the exception of loans and advances, where thecarrying amount is reduced through the use of an allowance account. When loans and advances are considered uncollectible, they are written off against theallowance account. Subsequent recoveries of amounts previously written off are credited to other income. Changes in the carrying amount of the allowanceaccount are recognized in profit or loss.
If the terms of the financial asset are renegotiated or modified or an existing asset is replaced with a new one due to financial difficulties of the borrower . then anassesment is made wether
ii) De-recognition of financial assetsA financial asset (or, where applicable, a part of a financial asset is primarily derecognized (i.e. removed from the Bank’s statement of financial position) when:• The rights to receive cash flows from the asset have expired, or• The Bank has transferred its rights to receive cash flows from the asset or has assumed an obligation to pay the received cash flows in full without material delayto a third party under a ‘pass-through’ arrangement; and either (a) the Bank has transferred substantially all the risks and rewards of the asset, or (b) the Bank hasneither transferred nor retained substantially all the risks and rewards of the asset, but has transferred control of the asset.
iii) Impairment of financial assetsThe Bank assesses at each reporting date whether there is objective evidence that a financial asset or a group of financial assets is impaired. A financial asset isdeemed to be impaired if there is objective evidence of impairment that, as a result of one or more events that has occurred since the initial recognition of the asset(an incurred loss event) and that loss event has an impact on the estimated future cash flows of the financial asset that can be reliably estimated. Objectiveevidence of impairment could include; the Bank’s past experience of collecting payments, an increase in the number of delayed payments past the average creditperiod, delinquency, and initiation of bankruptcy proceedings as well as observable changes in economic conditions that correlate with default on receivables.
For certain categories of financial assets, such as loans and advances to customers, assets that are assessed not to be impaired individually are, in addition,assessed for impairment on a collective basis. Objective evidence of impairment for a portfolio of receivables could include the Bank’s past experience ofcollecting payments, an increase in the number of delayed payments in the portfolio past the period of 90 days, as well as observable changes in economicconditions that correlate with default on receivables.
For financial assets carried at amortised cost, the amount of the impairment loss recognized is the difference between the asset’s carrying amount and the presentvalue of estimated future cash flows, discounted at the financial asset’s original effective interest rate.
F-112

AFRICAN EXPORT-IMPORT BANK 17NOTES TO THE SPECIAL PURPOSE FINANCIAL STATEMENTSFOR THE YEAR ENDED 31 DECEMBER 2017
2.15 Provisions
2.16 Operating leases
iv) Classification and measurement of Financial liabilities Financial liabilities within the scope of IAS 39 are classified as financial liabilities at fair value through profit or loss, loans and borrowings, or as derivativesdesignated as hedging instruments in an effective hedge, as appropriate. The Bank determines the classification of its financial liabilities at initial recognition. TheBank has not designated any financial liabilities at fair value through profit or loss. All financial liabilities are recognized initially at fair value and, in the case ofloans and borrowings, net of directly attributable transaction costs.
The Bank’s financial liabilities include amount due to banks, debt securities in issue and customer deposits which are initially measured at fair value, net ofdirectly attributable transaction costs. Subsequently, they are measured at amortised cost.
i) Bank as lesseeLeases which do not transfer to the Bank substantially all the risks and benefits incidental to ownership of the leased item, are accounted for as operating leases.The Bank has entered into operating lease agreements for leasing of office premises. These leases have an average life of between two and five years, withrenewal option included in the contracts.
The total payments made under operating leases are charged to profit or loss on a straight-line basis over the period of the lease. When an operating lease isterminated before the lease period has expired, any payment required to be made to the lessor by way of penalty is recognized as an expense in the period in whichtermination takes place.
vii) Offsetting of financial instrumentsFinancial assets and liabilities are offset and the net amount reported in the statement of financial position when there is a currently enforceable legal right to setoff the recognised amounts and there is an intention to settle on a net basis or realise the asset and settle the liability simultaneously.
vi) De-recognition of financial liabilitiesA financial liability is derecognized when the obligation under the liability is discharged or cancelled, or expires. When an existing financial liability is replacedby another from the same lender on substantially different terms, or the terms of an existing liability are substantially modified, such an exchange or modificationis treated as the derecognition of the original liability and the recognition of a new liability. The difference in the respective carrying amounts is recognized inprofit or loss.
Provisions are recognized when the Bank has a present legal or constructive obligation as a result of past events, for which it is probable that an outflow ofeconomic benefits will be required to settle the obligation and a reliable estimate can be made of the amount of the obligation. Staff bonuses are recognized inprofit or loss as an expense.
v) Derivative financial instrumentsThe Bank enters into interest rate swaps and foreign exchange forward contracts to hedge its exposure to changes in the fair value and cash flows attributable tochanges in market interest and exchange rates on its assets and liabilities. Derivatives are initially recognized at fair value at the date the derivative contract isentered into and are subsequently measured at their fair value at the end of each reporting period. The resulting gain or loss is recognized in profit or lossimmediately. A derivative with a positive fair value is recognized as a financial asset; a derivative with a negative fair value is recognized as a financial liability.See Note 5 for further details.
The estimated monetary liability for employees’ accrued annual leave and bonus entitlement at the reporting date is recognized as an expense accrual.
The determination of whether an arrangement is, or contains, a lease is based on the substance of the arrangement at inception date, whether fulfillment of thearrangement is dependent on the use of a specific asset or assets or the arrangement conveys a right to use the asset, even if that right is not explicitly specified inan arrangement.
ii) Bank as lessorLeases in which the Bank does not transfer substantially all the risks and benefits of ownership of an asset are classified as operating leases. The Bank has enteredinto operating lease agreements for leasing of office space on its building. These leases have an average life of between two and five years, with renewal optionincluded in the contracts.
F-113

AFRICAN EXPORT-IMPORT BANK 18NOTES TO THE SPECIAL PURPOSE FINANCIAL STATEMENTSFOR THE YEAR ENDED 31 DECEMBER 2017
2.17 Impairments of non-financial assets
2.18 Debt securities in issue
2.19 Derivative financial instruments and hedge accounting
The Bank makes use of derivative instruments to manage exposures to interest rate, foreign currency and credit risks, including exposures arising from highlyprobable forecast transactions and firm commitments. In order to manage particular risks, the Bank applies hedge accounting for transactions which meetspecified criteria.
At inception of the hedge relationship, the Bank formally documents the relationship between the hedged item and the hedging instrument, including the nature ofthe risk, the risk management objective and strategy for undertaking the hedge and the method that will be used to assess the effectiveness of the hedgingrelationship at inception and on an ongoing basis.
At each hedge effectiveness assessment date, a hedge relationship must be expected to be highly effective on a prospective basis and demonstrate that it waseffective (retrospective effectiveness) for the designated period in order to qualify for hedge accounting. A formal assessment is undertaken by comparing thehedging instrument’s effectiveness in offsetting the changes in fair value or cash flows attributable to the hedged risk in the hedged item, both at inception and ateach quarter end on an ongoing basis. A hedge is expected to be highly effective if the changes in fair value or cash flows attributable to the hedged risk duringthe period for which the hedge is designated were offset by the hedging instrument in a range of 80% to 125% and were expected to achieve such offset in futureperiods. Hedge ineffectiveness is recognized in the profit or loss in other income. For situations where the hedged item is a forecast transaction, the Bank alsoassesses whether the transaction is highly probable and presents an exposure to variations in cash flows that could ultimately affect the profit or loss.
The Bank assesses, at each reporting date or more frequently, whether there is an indication that an asset may be impaired. If such indication exists, the Bankmakes an estimate of the asset’s recoverable amount. Where the carrying amount of an asset exceeds its recoverable amount, the asset is considered impaired andis written down to its recoverable amount. Impairment losses are recognized in profit or loss in expense categories consistent with the function of the impairedasset, except for properties previously revalued with the revaluation taken to OCI. For such properties, the impairment is recognised in OCI up to the amount ofany previous revaluation.
The recoverable amount is the greater of fair value less costs of disposal and value in use. In assessing value in use, the estimated future cash flows are discountedto their present value using a discount rate that reflects current market assessments of the time value of money and the risks specific to the asset. In determiningfair value less costs of disposal, recent market transactions are taken into account. If no such transactions can be identified, an appropriate valuation model isused. These calculations are corroborated by valuation multiples, quoted share prices for publicly traded companies or other available fair value indicators.
For all assets, an assessment is made at each reporting date to determine whether there is an indication that previously recognized impairment losses no longerexist or have decreased. If such indication exists, the Bank estimates the asset’s recoverable amount. A previously recognized impairment loss is reversed only ifthere has been a change in the assumptions used to determine the asset’s recoverable amount since the last impairment loss was recognized. The reversal islimited so that the carrying amount of the asset does not exceed its recoverable amount, nor exceed the carrying amount that would have been determined, net ofdepreciation, had no impairment loss been recognized for the asset in prior years. The reversal of impairment losses is recognised in profit or loss unless the assetis carried at a revalued amount, in which case, the reversal is treated as a revaluation increase.Further details on key estimates and assumptions used are as shownin Note 6.
Debt securities in issue are one of the Bank’s sources of debt funding. Debt securities are initially measured at fair value plus incremental direct transaction costs,and subsequently measured at their amortized cost using effective interest method.
F-114

AFRICAN EXPORT-IMPORT BANK 19NOTES TO THE SPECIAL PURPOSE FINANCIAL STATEMENTSFOR THE YEAR ENDED 31 DECEMBER 2017
2.20 Dividends on ordinary shares
2.21 Financial guarantee contracts
(i) Fair value hedgesFor designated and qualifying fair value hedges, the cumulative change in the fair value of a hedging derivative is recognized in the profit or loss in other income.Meanwhile, the cumulative change in the fair value of the hedged item attributable to the risk hedged is recorded as part of the carrying value of the hedged itemin the statement of financial position and is also recognized in profit or loss in other income.
Financial guarantees are initially recognized in the financial statements at fair value on the date the guarantee was given adjusted for transaction costs that aredirectly attributable to the issuance of the guarantee. Subsequent to initial recognition, the Bank’s liabilities under such guarantees are measured at the higher ofthe initial measurement, less amortization calculated to recognize in the statement of profit or loss and other comprehensive income the fee income earned on astraight line basis over the life of the guarantee and the best estimate of the expenditure required to settle any financial obligation arising at the reporting date.These estimates are determined based on experience of similar transactions and history of past losses, supplemented by the judgment of management. Anyincrease in the liability relating to guarantees is taken to profit or loss under operating expenses.
(ii) Cash flow hedges For designated and qualifying cash flow hedges, the effective portion of the cumulative gain or loss on the hedging instrument is initially recognized in othercomprehensive income and accumulated in equity in the cash flow hedge reserve. The ineffective portion of the gain or loss on the hedging instrument isrecognized immediately in other income in profit or loss.
When the hedged cash flow affects profit or loss, the gain or loss on the hedging instrument is recorded in the corresponding income or expense line of profit orloss. When the forecast transaction subsequently results in the recognition of a non-financial asset or a non-financial liability, the gains and losses previouslyrecognized in the other comprehensive income are removed from the reserve and included in the initial cost of the asset or liability.
When a hedging instrument expires, or is sold, terminated, exercised, or when a hedge no longer meets the criteria for hedge accounting, any cumulative gain orloss that has been recognized in other comprehensive income at that time remains separately in equity and is transferred to profit or loss when the hedged forecasttransaction occurs. When a forecast transaction is no longer expected to occur, the cumulative gain or loss that was reported in other comprehensive income isimmediately transferred to profit or loss.
Dividend on ordinary shares are recognized as a liability and deducted from equity when they are approved by the Bank’s shareholders. Dividends for the year thatare approved after the reporting date are disclosed as a non-adjusting event.
Financial guarantee contracts are contracts that require the issuer to make specified payments to reimburse the holder for a loss it incurs because a specified debtorfails to make payments when due, in accordance with the terms of a debt instrument. Such financial guarantees are given to banks, financial institutions and otherbodies on behalf of customers to secure loans and other banking facilities.
If the hedging instrument expires or is sold, terminated or exercised, or where the hedge no longer meets the criteria for hedge accounting, the hedge relationshipis discontinued prospectively. For hedged items recorded at amortized cost, the difference between the carrying value of the hedged item on termination and theface value is amortized over the remaining term of the original hedge using the recalculated effective interest rate method. If the hedged item is derecognized, theunamortized fair value adjustment is recognized immediately in profit or loss.
F-115

AFRICAN EXPORT-IMPORT BANK 20NOTES TO THE SPECIAL PURPOSE FINANCIAL STATEMENTSFOR THE YEAR ENDED 31 DECEMBER 2017
2.22 Fair value measurement
2.23 Warrants
3 FINANCIAL INSTRUMENTS AND RISK MANAGEMENT
3.1 Risk management
3.2 Risk management structure
3.3 Credit risk
The risk management governance structure comprises (i) Board of Directors, responsible for oversight and approval of risk policies; (ii) Board ExecutiveCommittee, responsible for credit approval above management’s authority levels; (iii) Management Risk and Strategy Committee, responsible for the risk policiesreview and implementation; and (iv) Risk Management Department, responsible for risk policies development and monitoring.
Credit risk is the risk that a customer or counterparty of the Bank will be unable or unwilling to meet a commitment that it has entered into with the Bank. Itarises from lending, trade finance, treasury and other activities undertaken by the Bank.
The Bank’s business involves taking on risks in a reasonable manner and managing them professionally. The core functions of the Bank’s risk management are toidentify all key risks facing the Bank, measure these risks, manage the risk positions and determine capital allocations. The Bank regularly reviews its riskmanagement policies and systems to reflect changes in markets, products and best market practice.
Proceeds from the issuance of warrants, net of issue costs, are credited to share warrants account. Share warrants account is non-distributable and will betransferred to share capital and premium accounts upon the exercise of warrants.
To conduct the Bank’s operations in a manner consistent with its charter and aims, objectives and expectations of its stakeholders, the Board of Directors hasapproved the Risk Management Policies and Procedures (RMPP). This document incorporates different risk management policies that were operating as stand-alone policies into an integrated document that takes an enterprise wide approach to risk management.
The Bank is not regulated by any monetary and/or financial authority, but strives to comply with all international risk management standards and to operate inaccordance with the best practices in the industry.
Fair value is the price that would be received to sell an asset or paid to transfer a liability in an orderly transaction between market participants at the measurementdate. The fair value measurement is based on the presumption that the transaction to sell the asset or transfer the liability takes place either:• In the principal market for the asset or liability, or• In the absence of a principal market, in the most advantageous market for the asset or liability. The principal market or the most advantageous market must beaccessible by the Bank.
A fair value measurement of a non-financial asset takes into account a market participant's ability to generate economic benefits by using the asset in its highestand best use or by selling it to another market participant that would use the asset in its highest and best use.
The Bank uses valuation techniques that are appropriate in the circumstances and for which sufficient data are available to measure fair value, maximizing the useof relevant observable inputs and minimizing the use of unobservable inputs.
The gross carrying amounts of cash and deposits with banks, loans and advances to customers and derivative financial instruments represent the maximumamount exposed to credit risk.
The Bank identifies and controls the various operational risks inherent in its business. Operational risk is managed and mitigated by ensuring that there isappropriate infrastructure, controls, systems, procedures, and trained and competent people in place discharging the various functions.
All assets and liabilities for which fair value is measured or disclosed in the financial statements are categorized within the fair value hierarchy, described asfollows, based on the lowest level input that is significant to the fair value measurement as a whole: • Level 1 — Quoted (unadjusted) market prices in active markets for identical assets or liabilities• Level 2 — Valuation techniques for which the lowest level input that is significant to the fair value measurement is directly or indirectly observable• Level 3 — Valuation techniques for which the lowest level input that is significant to the fair value measurement is unobservableInformation on the Bank’s fair value hierarchy is provided in note 4.
The Bank measures financial instruments, such as derivatives, and non-financial assets, such as land and buildings, at fair value at each reporting date. Also, fairvalues of financial instruments measured at amortised cost are disclosed in note 4.
F-116
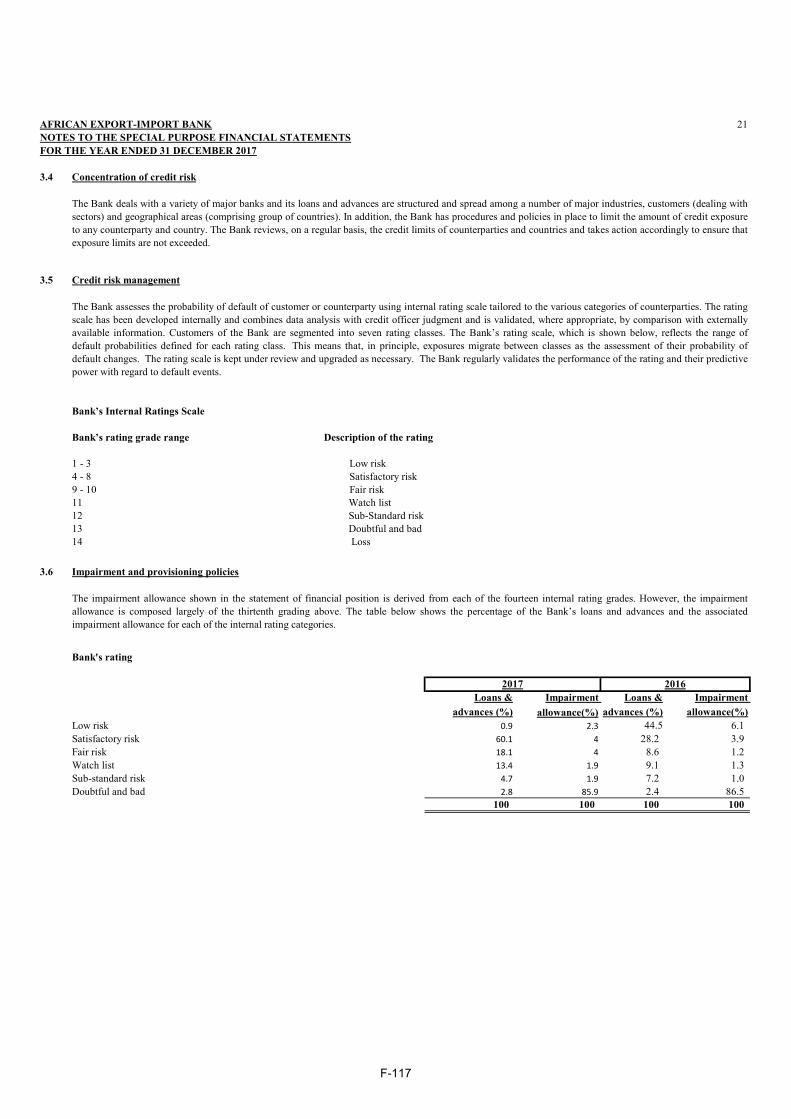
AFRICAN EXPORT-IMPORT BANK 21NOTES TO THE SPECIAL PURPOSE FINANCIAL STATEMENTSFOR THE YEAR ENDED 31 DECEMBER 2017
3.4 Concentration of credit risk
3.5 Credit risk management
3.6 Impairment and provisioning policies
Bank's rating
Loans & Impairment Loans & Impairment advances (%) allowance(%) advances (%) allowance(%)
Low risk 0.9 2.3 44.5 6.1 Satisfactory risk 60.1 4 28.2 3.9 Fair risk 18.1 4 8.6 1.2 Watch list 13.4 1.9 9.1 1.3 Sub-standard risk 4.7 1.9 7.2 1.0 Doubtful and bad 2.8 85.9 2.4 86.5
100 100 100 100
The Bank deals with a variety of major banks and its loans and advances are structured and spread among a number of major industries, customers (dealing withsectors) and geographical areas (comprising group of countries). In addition, the Bank has procedures and policies in place to limit the amount of credit exposureto any counterparty and country. The Bank reviews, on a regular basis, the credit limits of counterparties and countries and takes action accordingly to ensure thatexposure limits are not exceeded.
The Bank assesses the probability of default of customer or counterparty using internal rating scale tailored to the various categories of counterparties. The ratingscale has been developed internally and combines data analysis with credit officer judgment and is validated, where appropriate, by comparison with externallyavailable information. Customers of the Bank are segmented into seven rating classes. The Bank’s rating scale, which is shown below, reflects the range ofdefault probabilities defined for each rating class. This means that, in principle, exposures migrate between classes as the assessment of their probability ofdefault changes. The rating scale is kept under review and upgraded as necessary. The Bank regularly validates the performance of the rating and their predictivepower with regard to default events.
Bank’s Internal Ratings Scale
Bank’s rating grade range Description of the rating
1 - 3 Low risk4 - 8 Satisfactory risk9 - 10 Fair risk11 Watch list12 Sub-Standard risk13 Doubtful and bad14 Loss
The impairment allowance shown in the statement of financial position is derived from each of the fourteen internal rating grades. However, the impairmentallowance is composed largely of the thirtenth grading above. The table below shows the percentage of the Bank’s loans and advances and the associatedimpairment allowance for each of the internal rating categories.
2017 2016
F-117

AFRICAN EXPORT-IMPORT BANK 22NOTES TO THE SPECIAL PURPOSE FINANCIAL STATEMENTSFOR THE YEAR ENDED 31 DECEMBER 2017
3.6 Impairment and provisioning policies (continued)
3.7 Maximum exposure credit risk before collateral held or other credit enhancements
2017 2016US$000 US$000
Credit risk exposures relating to on-statement of financial position items are as follows:Deposits with other banks 861,307 618,770 Loans and advances to customers 8,510,543 10,315,620 Derivative assets held for risk management 3,574 8,792 Money market placements 2,353,176 650,235 Accrued income 240,427 201,164 Financial investments - held to maturity 30,268 30,268
Credit risk exposures relating to off-statement of financial position items are as follows:Letters of credit 319,939 245,070 Guarantees 376,680 500,375 Loan commitments and other credit related liabilities 321,242 453,478
13,017,156 13,023,772
Collaterals held under Loans and advances to customers represent 83% of total loans.
3.8 Concentration risks of loans and advances to customers with credit risk exposure
a) Geographical sectors
2017 2016% US$000 % US$000
West Africa 46.6 3,967,914 43.7 4,509,508 North Africa 22.8 1,939,793 42.3 4,364,785 Regional 0.8 64,943 1.1 108,396 East Africa 9.0 764,793 4.3 441,939 Central Africa 9.2 779,005 1.3 137,290 Southern Africa 11.6 994,095 7.3 753,702 Total (Note 17) 100 8,510,543 100 10,315,620
The internal rating scale assists management to determine whether objective evidence of impairment exists under IAS 39, based on the following criteria set outby the Bank:• Delinquency in contractual payments of principal or interest;• Cash flow difficulties experienced by the borrower;• Breach of loan covenants or conditions;• Initiation of bankruptcy proceedings;• Deterioration of the borrower’s competitive position; and• Deterioration in the value of collateral.
The Bank’s policy requires the review of individual financial assets, facilities and commitments at least quarterly or more regularly when individualcircumstances require. Impairment allowances on individually assessed accounts are determined by an evaluation of the impairment at reporting date on a case-by-case basis, and are applied to all individually significant accounts. The assessment normally encompasses collateral held (including re-confirmation of itsenforceability) and the anticipated receipts for that individual account. Further details on key estimates and assumptions used are detailed in note 6.
The above table represents a worst case scenario of credit risk exposure to the Bank at 31 December 2017 and 31 December 2016, without taking account of anycollateral held or other credit enhancements attached. For on-statement of financial position assets, the exposures set out above are based on gross carryingamounts.
The following table breaks down the Bank’s credit exposure at their gross amounts (without taking into account any collateral held or other credit support), ascategorized by geographical region as at 31 December 2017 and 31 December 2016 of the Bank’s counterparties.
F-118

AFRICAN EXPORT-IMPORT BANK 23NOTES TO THE SPECIAL PURPOSE FINANCIAL STATEMENTSFOR THE YEAR ENDED 31 DECEMBER 2017
3.8.1 Concentration risks of loans and advances to customers with credit risk exposure (continued)b) Industry sectors
2017 2016% US$000 % US$000
Agriculture 7.5 633,895 4.0 412,335 Energy 20.2 1,720,484 15.8 1,633,969 Services 4.2 358,028 2.8 287,965 Metals and minerals 0.3 23,658 1.7 175,851 Transportation 3.3 277,563 3.1 318,696 Manufacturing 3.2 272,731 1.4 146,582 Telecommunications 3.8 327,500 2.7 275,039 Financial institutions 57.5 4,896,684 68.5 7,065,183 Total (Note 18) 100 8,510,543 100 10,315,620
3.9 Loans and advances
Loans and advances are summarised as follows:2017 2016
US$000 US$000Neither past due nor impaired 8,002,634 9,745,457 Past due but not impaired 295,007 324,953 Impaired 212,902 245,210 Gross loans and advances (Note 18) 8,510,543 10,315,620 Less: Allowance for impairment (Note 19) (180,600) (167,418) Net loans and advances 8,329,943 10,148,202
Individually impaired 152,244 144,373 Collective impairment 28,356 23,045 Total 180,600 167,418
(a) Loans and advances neither past due nor impaired
2017 2016US$000 US$000
GradeLow risk 1,235,900 4,587,982 Satisfactory risk 2,385,735 2,912,861 Fair risk 2,276,492 869,297 Watch list 1,047,682 917,851 Sub-Standard risk 1,056,825 457,466 Total 8,002,634 9,745,457
The credit quality of the portfolio of gross amounts of loans and advances that were neither past due nor impaired can be assessed by reference to the internalrating system adopted by the Bank as follows:
The following table breaks down the Bank’s credit exposure at their gross amounts (without taking into account any collateral held or other credit support), ascategorized by industry sector as at 31 December 2017 and 31 December 2016 of the Bank’s counterparties.
The total impairment charge for loans and advances is US$ 63,397,000 (2016: US$ 82,747,000) of which US$ 58,086,000 (2016: US$ 79,763,000) representsthe individually impaired loans and the remaining amount of US$ (5,311,000) (2016: US$ 2,984,000), represents the collective impairment allowance. Furtherinformation of the impairment allowance for loans and advances to customers is provided in note 18.
F-119

AFRICAN EXPORT-IMPORT BANK 24NOTES TO THE SPECIAL PURPOSE FINANCIAL STATEMENTSFOR THE YEAR ENDED 31 DECEMBER 2017
3.9 Loans and advances (cont'd)(b) Loans and advances past due but not impaired
2017 2016US$000 US$000
Past due up to 30 days 10,635 188,255 Past due 30-60 days 4,272 5,182 Past due 60-90 days 7,250 6,714 Past due over 90 days 272,850 124,802 Total 295,007 324,953
Fair value of collateral 412,925 714,934
(c) Loans and advances impaired2017 2016
US$000 US$000Impaired loans 212,902 245,210
Fair value of collateral 119,343 159,629
3.10 Market risk
3.10.1 Interest rate risk
Loans and advances that are past due are not considered impaired, unless other information is available to indicate the contrary. Gross amounts of loans andadvances to customers that were past due but not impaired were as follows:
Upon initial recognition of loans and advances, fair value of the collateral is based on valuation techniques commonly used for the corresponding assets. Insubsequent periods, fair value is updated by reference to market prices, if available. There were no collaterals repossessed during the year. The collaterals heldagainst these loans are in the form of cash cover, insurance, bank guarantees, mortgage bonds and charge over assets.
Interest rate movements affect the Bank’s profitability. Exposure to interest rate movements exists because the Bank has assets and liabilities on which interestrates either change from time to time (rate sensitive assets and liabilities) or, do not change (rate insensitive assets and liabilities). Exposure to interest ratemovements arises when there is a mismatch between the rate sensitive assets and liabilities.
The Bank closely monitors interest rate movements and seeks to limit its exposure by managing the interest rate and maturity structure of assets and liabilitiescarried on the statement of financial position. Interest rate swaps are also used to manage interest rate risk.
F-120

AFRICAN EXPORT-IMPORT BANK 25NOTES TO THE SPECIAL PURPOSE FINANCIAL STATEMENTSFOR THE YEAR ENDED 31 DECEMBER 2017
3.10.1 Interest rate risk (continued)
As at 31 December 2017 Up to 3 3-6 6-12 Over Non interest Fixed Ratemonths months months 1 year bearingUS$000 US$000 US$000 US$000 US$000 US$000
Financial assetsCash and due from banks 861,307 - - - 90 - Deposits with other banks 2,152,584 200,592 - - - - Loans and advances to customers 1,354,182 1,831,709 1,495,325 1,871,432 - 1,957,895 Accrued income - - - - 239,329 - Other assets - - - - 2,931 - Financial investments - held to maturity - - - - 30,268 Total financial assets 4,368,073 2,032,301 1,495,325 1,871,432 242,350 1,988,163
Financial liabilitiesDue to banks 72,313 100,000 466,000 1,702,601 - 1,890,460 Debt securities in issue - 400,000 - 1,275,000 - 1,206,622 Deposits and customer accounts 386,517 - - - - 1,762,839 Other liabilities - - - - 85,713 Total financial liabities 458,830 500,000 466,000 2,977,601 85,713 4,859,921
Total interest gap 3,909,243 1,532,301 1,029,325 (1,106,169) - -
Cumulative gap 3,909,243 5,441,544 6,470,869 5,364,700
As at 31 December 2016 Up to 3 3-6 6-12 Over Non interest Fixed Ratemonths months months 1 year bearingUS$000 US$000 US$000 US$000 US$000 US$000
Financial assetsCash and due from banks 618,770 - - - 75 - Deposits with other banks 650,235 - - - - - Loans and advances to customers 9,293,445 268,712 313,560 - - 439,903Prepayments and accrued income - - - - 198,316 - Other assets - - - - 3,069 - Financial investments - held to maturity - - - - - 30,268 Total financial assets 10,562,450 268,712 313,560 - 201,460 470,171
Financial liabilitiesDue to banks 1,580,803 410,310 107,811 - - 1,951,988 Debt securities in issue 1,736,000 - - - - 355,114 Deposits and customer accounts 148,425 - - - - 3,630,068 Other liabilities - - - - 71,507 Total financial liabities 3,465,228 410,310 107,811 - 71,507 5,937,170
Total interest gap 7,097,222 (141,598) 205,749 - - -
Cumulative gap 7,097,222 6,955,624 7,161,373 7,161,373
The table below summarizes the Bank’s exposure to interest rate risks as at 31 December 2017. It includes the Bank’s financial instruments at carrying amounts(non-derivatives), categorized by the period of contractual re-pricing.
F-121

AFRICAN EXPORT-IMPORT BANK 26NOTES TO THE SPECIAL PURPOSE FINANCIAL STATEMENTSFOR THE YEAR ENDED 31 DECEMBER 2017
3.11 Interest rate risk sensitivity analysis
Impact on Impact on Impact on Impact on Carrying profit or loss profit or loss Carrying profit or loss profit or loss
amount and equity and equity amount and equity and equity2017 2017 2017 2016 2016 2016
US$000 US$000 US$000 US$000 US$000 US$000
Changes in interest rates +54bp of US$1R (-)54bp of US$1R +54bp of US$1R (-)54bp of US$1R
Financial assetsCash due from banks 861,397 4,652 (4,652) 618,845 3,342 (3,342) Deposits with other banks 2,353,176 12,707 (12,707) 650,235 3,511 (3,511) Gross loans and advances to customers 6,552,648 35,384 (35,384) 9,875,717 53,329 (53,329) Impact from financial assets 9,767,221 52,743 (52,743) 11,144,797 60,182 (60,182)
Financial liabilitiesDue to banks 2,340,914 (12,641) 12,641 2,098,924 (11,334) 11,334 Debt securities in issue 1,675,000 (9,045) 9,045 1,736,000 (9,374) 9,374 Deposits and customer accounts 386,517 (2,087) 2,087 148,425 (801) 801 Impact from financial liabilities 4,402,431 (23,773) 23,773 3,983,349 (21,509) 21,509
Total increase/(decrease) on profit or loss and equity 5,364,790 28,970 (28,970) 7,161,448 38,673 (38,673)
3.12 Foreign exchange risk exposure
At 31 December 2017, if interest rates at that date had been 54 basis points higher with all other variables held constant, profit and reserves for the year wouldhave been US$ 28,970,000 (2016: US$ 38,673,000) lower, arising mainly as a result of thehigher decrease in interest income on loans than the decrease ininterest expense on borrowing. If interest rates had been 54 basis points (2016: 54 basis points) lower, with all other variables held constant, profit would havebeen US$ 28,970,000 (2015: US$ 38,673,000) higher, arising mainly as a result of higher increase in interest income on loans than the increase in interestexpense on borrowings. The sensitivity is higher in 2017 than in 2016 due to increase in interest rate sensitive assets and liabilities.
The table below summarizes the impact on profit or loss and equity for each category of financial instruments held as at 31 December 2017 and comparatives. Itincludes the Bank’s financial instruments at carrying amounts.
The Bank takes on exposure to the effects of fluctuations in the prevailing foreign currency exchange rates on its financial position and cash flows. Foreignexchange risk is managed by the Bank by matching assets and liabilities in respective currencies. The Bank also uses currency derivatives, especially forwardforeign exchange contracts to hedge foreign exchange risk. Open currency positions are monitored regularly and appropriate hedging actions taken. Please refer tonote 5 for further details on derivative financial instruments.
F-122

AFRICAN EXPORT-IMPORT BANK 27NOTES TO THE SPECIAL PURPOSE FINANCIAL STATEMENTSFOR THE YEAR ENDED 31 DECEMBER 2017
3.12 Foreign exchange risk exposure (continued)
Other Euro NGN Currencies Total
As at 31 December 2017 US$000 US$000 US$000 US$000
AssetsCash and due from banks 227,444 1,215 1,016 229,675 Loans and advances to customers 911,619 - - 911,619 Total financial assets 1,139,063 1,215 1,016 1,141,294
LiabilitiesDue to banks 1,202,441 - 55,016 1,257,457 Deposits and customer accounts 109,997 956 - 110,953 Derivative for risk management - - 55,016 55,016 Other liabilities 2,306 304 - 2,610 Total financial liabilities 1,314,744 1,260 110,032 1,426,036
Net exposure on statement of financial position (175,681) (45) (109,016) (284,742)
Credit commitments & financial guarantees 1,842,535 - - 1,842,535
Other Euro NGN Currencies Total
As at 31 December 2016 US$000 US$000 US$000 US$000
AssetsCash and due from banks 8,786 1,834 46 10,666 Loans and advances to customers 917,120 - - 917,120 Total financial assets 925,906 1,834 46 927,786
LiabilitiesDue to banks 764,060 - - 764,060 Deposits and customer accounts 16,254 2,685 - 18,939 Hedging derivatives 157,383 - - 157,383 Other liabilities 1,520 - - 1,520 Total financial liabilities 939,217 2,685 - 941,902
Net exposure on statement of financial position (13,311) (851) 46 (14,116)
Credit commitments & financial guarantees 288,342 - - 288,342
The table below summarises the Bank exposure to foreign currency exchange rate risk as at 31 December 2017. Included in the table are the Bank’s financialinstruments at carrying amounts, categorised by currency:
F-123

AFRICAN EXPORT-IMPORT BANK 28NOTES TO THE SPECIAL PURPOSE FINANCIAL STATEMENTSFOR THE YEAR ENDED 31 DECEMBER 2017
3.12.1 Foreign exchange risk sensitivity analysis
Impact on Impact on Impact on Impact on Carrying profit or loss profit or loss Carrying profit or loss profit or loss
amount and equity and equity amount and equity and equity2017 2017 2017 2016 2016 2016
US$000 US$000 US$000 US$000 US$000 US$000
Changes in value of USD against Euro 10% increase 10% decrease 10% increase 10% decrease
Financial assetsCash due from banks 227,444 22,744 (22,744) 8,786 879 (879) Gross loans and advances to customers 911,619 91,162 (91,162) 917,120 91,712 (91,712) Impact from financial assets 1,139,063 113,906 (113,906) 925,906 92,591 (92,591)
Financial liabilitiesDue to banks 1,202,441 (120,244) 120,244 764,060 (76,406) 76,406 Deposits and customer accounts 109,997 (11,000) 11,000 16,254 (1,625) 1,625 Hedging derivatives - - - 157,383 (15,738) 15,738 Other liabilities 2,306 (231) 231 1,520 (152) 152 Impact from financial liabilities 1,314,744 (131,475) 131,475 939,217 (93,921) 93,921
Total increase/(decrease) on profit or loss and equity (175,681) (17,569) 17,569 (13,311) (1,330) 1,330
3.13 Liquidity Risk
Liquidity risk concerns the ability of the Bank to fulfill its financial obligations as they become due. The management of the liquidity risk is focused on thetiming of the cash inflows and outflows as well as in the adequacy of the available cash, credit lines and high liquidity investments. The Bank manages itsliquidity risk by preparing dynamic cash flow forecasts covering all expected cash flows from assets and liabilities and taking appropriate advance actions.Further, the bank has committed credit lines it can draw in case of need.
At 31 December 2017, if foreign exchange rates at that date had been 10 percent lower with all other variables held constant, profit and reserves for the yearwould have been US$ 17,569,000 (2016: US$ 1,330,000) lower, arising mainly as a result of more financial liabilties than financial assets in Euro. If foreignexchange rates had been 10 percent higher, with all other variables held constant, profit would have been US$ 17,569,000 (2016: US$ 1,330,000) higher , arisingmainly as a result of decline in revaluation of financial assets than financial liabilities in Euro.
The following analysis details the Bank’s sensitivity to a 10% increase and decrease in the value of the USD against the Euro, as the Bank is mainly exposed toEuro. 10% is the sensitivity rate used when reporting foreign currency risk internally and represents management's assessment of the reasonably possible changein foreign exchange rates. The table below summarizes the impact on profit or loss and equity for each category of Euro financial instruments held as at 31December 2017. It includes the Bank’s Euro financial instruments at carrying amounts.
F-124

29AFRICAN EXPORT-IMPORT BANKNOTES TO THE SPECIAL PURPOSE FINANCIAL STATEMENTSFOR THE YEAR ENDED 31 DECEMBER 2017
3.13 Liquidity Risk (continued)
As at 31 December 2017 Up to 1 1-3 3-12 1-5 Over 5 2017month months months years years Total
US$000 US$000 US$000 US$000 US$000 US$000Financial assets by typeNon-derivative assetsCash and due from banks 790,445 - - - - 790,445 Deposits with other banks 2,152,584 - 200,592 - - 2,353,176 Loans and advances 1,373,877 1,368,728 4,263,787 1,920,358 54,602 8,981,352 Dreivative assetsDerivative assets held for risk management - - - 2,766 - 2,766 Total assets 4,316,906 1,368,728 4,464,379 1,923,124 54,602 12,127,739
Financial liabilitiesNon-derivative liabilitiesDue to banks 125,966 421,314 1,208,211 2,593,474 68,937 4,417,902 Debt securities in issue - - 508,648 1,824,962 946,917 3,280,527 Deposits and customer accounts 881,235 400,827 502,097 - - 1,784,159 Derivative liabilitiesDerivative liabilities held for risk management - - 135 22,892 - 23,027 Total liabilities 1,007,201 822,141 2,219,091 4,441,328 1,015,854 9,505,615
Net liquidity gap 3,309,705 546,587 2,245,288 (2,518,204) (961,252) 2,622,124
Cumulative liquidity gap 3,309,705 3,856,292 6,101,580 3,583,376 2,622,124
As at 31 December 2016 Up to 1 1-3 3-12 1-5 Over 5 2016month months months years years Total
US$000 US$000 US$000 US$000 US$000 US$000Financial assetsNon-derivative assetsCash and due from banks 618,846 - - - - 618,846 Deposits with other banks 650,235 - - - - 650,235 Loans and advances 1,292,167 335,401 5,561,745 3,056,551 77,606 10,323,470 Dreivative assetsDerivative assets held for risk management - - 1,320 7,472 - 8,792 Total assets 2,561,248 335,401 5,563,065 3,064,023 77,606 11,601,343
Financial liabilitiesNon-derivative liabilitiesDue to banks 89,694 338,640 1,636,757 1,926,054 228,884 4,220,029 Debt securities in issue - - - 2,125,112 - 2,125,112 Deposits and customer accounts 113,616 - 3,163,100 507,167 - 3,783,883 Derivative liabilitiesDerivative liabilities held for risk management 1,071 - - 20,947 - 22,018 Total liabilities 204,381 338,640 4,799,857 4,579,280 228,884 10,151,042
Net liquidity gap 2,356,867 (3,239) 763,208 (1,515,257) (151,278) 1,450,301
Cumulative liquidity gap 2,356,867 2,353,628 3,116,836 1,601,579 1,450,301
The table below analyses the Bank’s financial assets and financial liabilities (including principal and interest) into relevant maturity grouping based on theremaining period at the reporting date to the contractual maturity date as at 31 December 2017 and the amounts disclosed in the table are the contractualundiscounted cash flows:
Cash flows may be significantly different from those indicated in the above table
F-125

AFRICAN EXPORT-IMPORT BANK 30NOTES TO THE SPECIAL PURPOSE FINANCIAL STATEMENTSFOR THE YEAR ENDED 31 DECEMBER 2017
3.13 Liquidity Risk (continued)
Up to 1 1-3 3-12 1-5 Over 5month months months years years Total
US$000 US$000 US$000 US$000 US$000 US$000As at 31 December 2017Letters of credit 1,912 - 253,064 64,963 - 319,939 Financial guarantees - 150,000 127,392 62,005 37,284 376,681 Total 1,912 150,000 380,456 126,968 37,284 696,620
As at 31 December 2016Letters of credit - - 77,217 167,853 - 245,070 Financial guarantees 460 197,524 141,551 123,556 37,284 500,375 Total 460 197,524 218,768 291,409 37,284 745,445
3.14 Capital management
The risk-weighted assets is measured by means of a hierarchy of seven risk weights classified according to its nature and reflecting an estimate of credit, marketand other risks associated with each asset and counterparty. A similar treatment is adopted for off-statement of financial position exposures.
The table below analyses the contractual expiry by maturity of the Bank’s contingent liabilities. For issued financial guarantees contract, the maximum amount ofthe guarantee is allocated to the earliest period in which the guarantee could be called.
The Bank’s objectives when managing capital, which is a broader concept than the equity on the face of statement of financial position, are:• To maintain a set minimum ratio of total capital to total risk weighted assets. The Bank’s minimum risk asset ratio is at least three per cent above minimumratio prescribed from time to time by the Basel Committee on Banking Supervision;• To safeguard the Bank’s ability to continue as a going concern so that it can continue to provide returns to shareholders and benefits to other stakeholders; and• To maintain a strong capital position necessary for its long term financial health, and to support the development of its business.
The Bank is not subject to capital requirements by a regulatory body such as a central bank or equivalent. However, management has established a capitalmanagement policy that is based on maintenance of certain capital adequacy ratio in line with Basel Committee requirements.
Capital adequacy is reviewed regularly by management using techniques based on the guidelines developed by Basel Committee.With effect from 1 January 2009, the Bank is complying with the provisions of the Basel II framework in respect of capital.
F-126

AFRICAN EXPORT-IMPORT BANK 31NOTES TO THE SPECIAL PURPOSE FINANCIAL STATEMENTSFOR THE YEAR ENDED 31 DECEMBER 2017
3.14 Capital management (continued)
2017 2016US$000 US$000
Capital adequacyShare capital 470,816 378,488 Share premium 562,350 355,310 Warrants 91,723 98,716 Reserves 455,262 366,282 Retained earnings 524,412 429,448 Total Tier 1 capital 2,104,563 1,628,244
Asset revaluation reserve 9,395 5,220 Collective impairment allowance 28,356 23,045 Total Tier 2 capital 37,751 28,265
Total capital base 2,142,314 1,656,509
Risk weighted assetsOn-statement of financial position 7,261,266 6,291,657 Off-statement of financial position:Credit risk 427,131 514,139 Operational risk 568,056 462,977 Market risk 763 11,450 Total risk weighted assets 8,257,216 7,280,223
Basel capital adequacy ratio (Total capital base/Total risk weighted assets) 26% 23%
The table below summarizes the composition of capital and the ratio of the Bank’s capital for the year ended 31 December.
The increase of the capital in 2017 is primarily due to increase in profits and share capital subscriptions in class (D). The increase of risk weighted assets arisesmainly from the growth in the bank's business.
F-127
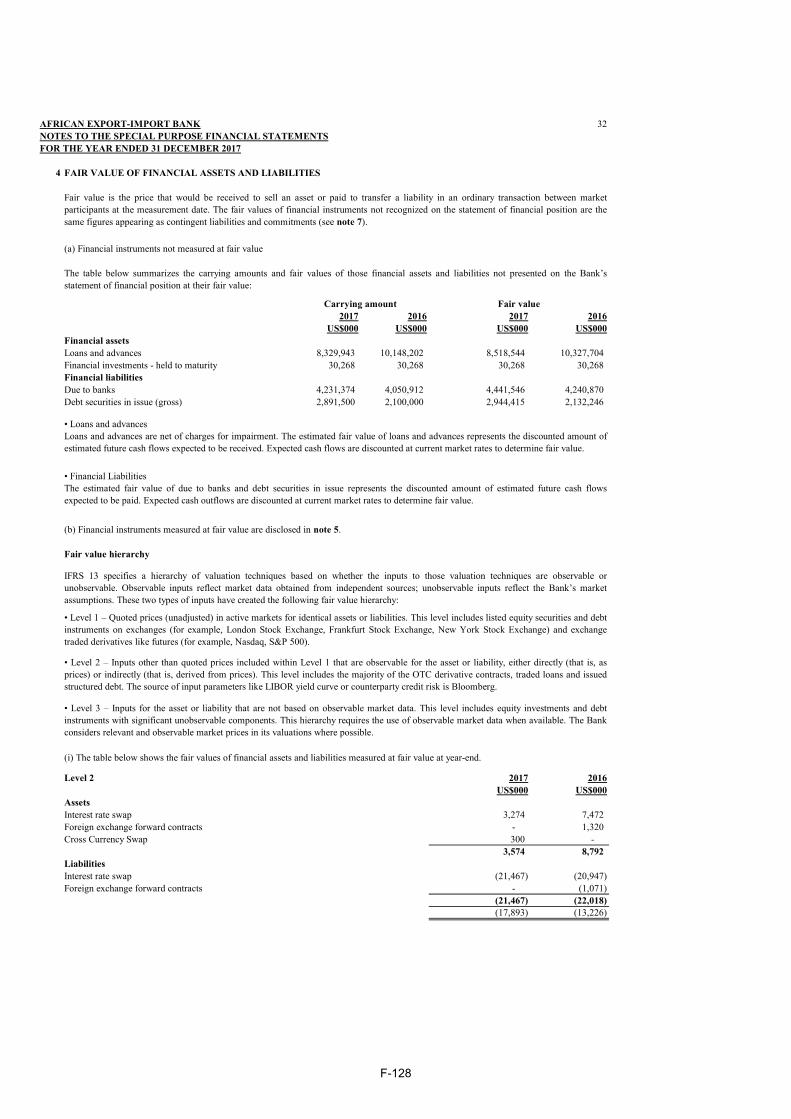
AFRICAN EXPORT-IMPORT BANK 32NOTES TO THE SPECIAL PURPOSE FINANCIAL STATEMENTSFOR THE YEAR ENDED 31 DECEMBER 2017
4 FAIR VALUE OF FINANCIAL ASSETS AND LIABILITIES
(a) Financial instruments not measured at fair value
2017 2016 2017 2016US$000 US$000 US$000 US$000
Financial assetsLoans and advances 8,329,943 10,148,202 8,518,544 10,327,704 Financial investments - held to maturity 30,268 30,268 30,268 30,268 Financial liabilitiesDue to banks 4,231,374 4,050,912 4,441,546 4,240,870 Debt securities in issue (gross) 2,891,500 2,100,000 2,944,415 2,132,246
(b) Financial instruments measured at fair value are disclosed in note 5.
Fair value hierarchy
Level 2 2017 2016US$000 US$000
AssetsInterest rate swap 3,274 7,472 Foreign exchange forward contracts - 1,320 Cross Currency Swap 300 -
3,574 8,792 LiabilitiesInterest rate swap (21,467) (20,947) Foreign exchange forward contracts - (1,071)
(21,467) (22,018) (17,893) (13,226)
Fair value is the price that would be received to sell an asset or paid to transfer a liability in an ordinary transaction between marketparticipants at the measurement date. The fair values of financial instruments not recognized on the statement of financial position are thesame figures appearing as contingent liabilities and commitments (see note 7).
The table below summarizes the carrying amounts and fair values of those financial assets and liabilities not presented on the Bank’sstatement of financial position at their fair value:
Carrying amount Fair value
• Loans and advancesLoans and advances are net of charges for impairment. The estimated fair value of loans and advances represents the discounted amount ofestimated future cash flows expected to be received. Expected cash flows are discounted at current market rates to determine fair value.
IFRS 13 specifies a hierarchy of valuation techniques based on whether the inputs to those valuation techniques are observable orunobservable. Observable inputs reflect market data obtained from independent sources; unobservable inputs reflect the Bank’s marketassumptions. These two types of inputs have created the following fair value hierarchy:
• Level 1 – Quoted prices (unadjusted) in active markets for identical assets or liabilities. This level includes listed equity securities and debtinstruments on exchanges (for example, London Stock Exchange, Frankfurt Stock Exchange, New York Stock Exchange) and exchangetraded derivatives like futures (for example, Nasdaq, S&P 500).
• Level 2 – Inputs other than quoted prices included within Level 1 that are observable for the asset or liability, either directly (that is, asprices) or indirectly (that is, derived from prices). This level includes the majority of the OTC derivative contracts, traded loans and issuedstructured debt. The source of input parameters like LIBOR yield curve or counterparty credit risk is Bloomberg.
• Level 3 – Inputs for the asset or liability that are not based on observable market data. This level includes equity investments and debtinstruments with significant unobservable components. This hierarchy requires the use of observable market data when available. The Bankconsiders relevant and observable market prices in its valuations where possible.
(i) The table below shows the fair values of financial assets and liabilities measured at fair value at year-end.
• Financial LiabilitiesThe estimated fair value of due to banks and debt securities in issue represents the discounted amount of estimated future cash flowsexpected to be paid. Expected cash outflows are discounted at current market rates to determine fair value.
F-128

AFRICAN EXPORT-IMPORT BANK 33NOTES TO THE SPECIAL PURPOSE FINANCIAL STATEMENTSFOR THE YEAR ENDED 31 DECEMBER 2017
4 FAIR VALUE OF FINANCIAL ASSETS AND LIABILITIES (CONTINUED)
Level 3 2017 2016US$000 US$000
Revalued property and equipmentLand and building 29,069 21,193
Level 2 2017 2016US$000 US$000
Financial assetsLoans and advances 8,518,544 10,327,704
Financial liabilitiesDue to banks 4,441,546 4,240,870 Debt securities in issue (gross) 2,944,415 2,132,246
7,385,961 6,373,116
Revalued property and equipment
2017 2016US$000 US$000
Valuation as at 1 January 21,193 42,237 Addition in the year 5 156 Total gain / (loss)recorded in other comprehensive income 9,279 (18,650) Accumulated depreciation eliminated on revaluation (1,408) (2,550) Valuation as at 31 December 29,069 21,193
Impact on fair value of level 3 non financial assets due to changes in key assumptions
Carrying amount
Effect of 10% change in
annual market rentals Carrying amount
Effect of 10% change in annual
market rentalsUS$000 US$000 US$000 US$000
Property and equipment 29,069 2,907 21,193 2,119
(iii) The table below shows the assets and liabilities for which fair values are disclosed.
(ii) The table below shows the fair values of non-financial assets measured at fair value at year-end.
Total gains or losses for the period are included in profit or loss as well as total gains relating financial instruments designated at fair valuedepending on the category of the related asset/ liability.
(iv) Movements in level 3 non financial assets measured at fair value
The following table shows a reconciliation of the opening and closing amounts of level 3 non-financial assets which are recorded at fairvalue:
Land and building
The following methods and assumptions were used to estimate the fair values:• The Bank enters into derivative financial instruments with various counterparties, principally financial institutions with investment grade credit ratings. Derivatives valued using valuation techniques with market observable inputs are mainly interest rate swaps and foreign exchange forward contracts. The most frequently applied valuation techniques include forward pricing and swap models, using present valuecalculations. The models incorporate various inputs including the credit quality of counterparties, foreign exchange spot and forward rates, interest rate curves and forward rate curves. The changes in counterparty credit risk had no material effect on the hedge effectiveness assessment for derivatives designated in hedge relationships and other financial instruments recognized at fair value.
• Fair values of the Bank’s debt securities in issue and loans and advances are as disclosed in Note 4(a).• Methods and assumptions used in the valuation of land and building are detailed in Note 6.
The significant unobservable valuation input used in obtaining the value of the land and building was annual market rentals of similar properties. The table below shows the impact on the fair value of the land and building assuming that the annual market rentals increase or decrease by 10%. The positive and negative effects are approximately the same.
31-Dec-17 31-Dec-16
F-129

AFRICAN EXPORT-IMPORT BANK 34 NOTES TO THE SPECIAL PURPOSE FINANCIAL STATEMENTSFOR THE YEAR ENDED 31 DECEMBER 2017
5 DERIVATIVES HELD FOR RISK MANAGEMENT
2017 2016US$000 US$000
Derivative assets
Interest rate swap 3,274 7,472 Foreign exchange forward contracts - 1,320 Cross currency swap 300 -
3,574 8,792 Derivative liabilities
Interest rate swap (21,467) (20,947) Foreign exchange forward contracts - (1,071)
(21,467) (22,018)
Interest rate derivative contracts2017 2016
US$000 US$000
Interest rate swap 1,675,000 1,675,000
2017 2016US$000 US$000
AssetsUp to one year - - One to five years 3,274 7,472
3,274 7,472 LiabilitiesUp to one year (219) - One to five years (21,248) (20,947)
(21,467) (20,947)
The Bank entered into interest rate swap till 1 January 2017 amounting to US$ 1,675 million to hedge interest received from the loanportfolio disbursed in June 2013, July 2014 and May 2016 with floating interest rates. The swap exchanged fixed rate for floating rate onfunding to match floating rates received on assets. In this respect a cash flow hedge loss of US$ 13,476 on the hedging instruments at t theend of year 2016. At the beginning of the year, management recycled fair value losses arising from discontinuation of hedge accounting forthe Interest Rate Swaps due to the prevailing environment where interest rates are rising and expected to continue on the same trend.
The Bank enters into interest rate swaps and foreign exchange forward contracts to hedge its exposure to changes in the fair value and cashflows attributable to changes in market interest and exchange rates on its assets and liabilities.
The table below shows the fair values of derivative financial instruments, recorded as assets or liabilities at year-end.
Swaps are contractual agreements between two parties to exchange streams of payments over time based on specified notional amounts, inrelation to movements in a specified underlying index such as interest rates, foreign currency rate or equity index.
Interest rate swaps relate to contracts taken out by the Bank with other financial institutions in which the Bank either receives or pays afloating rate of interest in return for paying or receiving, respectively, a fixed rate of interest. The payment flows are usually netted againsteach other, with the difference being paid by one party to the other.
In a foreign exchange swap, the Bank pays a specified amount in one currency and receives a specified amount in another currency. Foreignexchange swaps are settled gross.
The time periods in which the discounted derivatives cash flows are expected to occur and affect profit or loss are as follows:
The following shows the notional value of interest rate derivative contracts that the Bank held at 31 December:
F-130

AFRICAN EXPORT-IMPORT BANK 35 NOTES TO THE SPECIAL PURPOSE FINANCIAL STATEMENTSFOR THE YEAR ENDED 31 DECEMBER 2017
6 CRITICAL ACCOUNTING ESTIMATES AND JUDGEMENTS IN APPLYING ACCOUNTING POLICIES
The preparation of special purpose financial statements involves management estimates and assumptions that may affect the reportedamounts of assets and liabilities within the next financial year. Estimates and judgments are continually evaluated based on historicalexperience and other factors, including expectations of future events that are believed to be reasonable under the circumstances.
The Bank reviews its loan portfolio regularly to assess whether a provision for impairment should be recorded in profit or loss. In particular,considerable judgment by management is required in the estimation of the amount and timing of future cash flows when determining thelevel of provisions required. Such estimates are necessarily subjective based on assumptions about several factors involving varying degreesof judgment and uncertainty. Consequently, actual results may differ resulting in future changes to such provisions. Further details on thecarrying amount of loans and advances are set out in note 17. The key assumptions and estimates used are provided in note 2.8 and 3.6.
The fair value of financial instruments where no active market exists or where quoted prices are not otherwise available are determined byusing valuation techniques. In these cases, the fair values are estimated from observable data in respect of similar financial instruments.Where market observable inputs are not available, they are estimated based on appropriate assumptions. Refer to note 4 for furtherinformation on fair value of financial assets and liabilities.
The Bank measures land and buildings at revalued amounts with changes in fair value being recognized in Other Comprehensive Income.The Bank engaged an independent valuation specialist to assess fair value as at 31 December 2016. Land and buildings were valued byreference to market-based evidence, using comparable prices adjusted for specific market factors such as nature, location and condition ofthe property. The carrying amount at the reporting date is as set out in note 24.
Impairment exists when the carrying amount of an asset exceeds its recoverable amount. The recoverable amount is the greater of fair valueless costs of disposal and value in use. In assessing value in use, the estimated future cash flows are discounted to their present value using adiscount rate that reflects current market assessments of the time value of money and the risks specific to the asset. Impairment losses arerecognized in profit or loss. Refer to note 2.14 for further information.
(a) Impairment losses on loans and advances
(b) Fair value of financial instruments
(c) Revaluation of property, plant and equipment
(d) Impairment of non-financial assets
(e) Property, plant and equipment
Critical estimates are made by the Bank in determining depreciation rates for property and equipment. The rates used are set out inaccounting policy (note 2.9) above. The assets residual values, useful lives and methods of depreciation are reviewed at each reporting date,and adjusted prospectively if appropriate. The carrying amount at the reporting date is as set out in note 24.
(f) Going Concern
The bank's management has made an assessment on its ability to continue as a going concern and is satisfied that it has the resources tocontinue in business for the forseable future. Furthermore, management is not aware of any material uncertainities that may cost significantdoubt on the bank's ability to continue as a going concern.Therefore, the special purpose financial statements continue to be prepared on a going concern basis.
F-131

AFRICAN EXPORT-IMPORT BANK 36NOTES TO THE SPECIAL PURPOSE FINANCIAL STATEMENTSFOR THE YEAR ENDED 31 DECEMBER 2017
7 CONTINGENT LIABILITIES AND COMMITMENTS AND LEASE ARRANGEMENTS
7.1.1 Contingent liabilities2017 2016
US$000 US$000Letters of credit 319,939 245,070 Guarantees 376,680 500,375
696,619 745,445
7.1.2 Commitments
Credit lines and other commitments to lend
2017 2016US$000 US$000
Less than one year 22,075 333,010 More than one year 299,167 120,468
321,242 453,478
7.2 Lease arrangements
7.2.1 Operating lease commitments-Bank as lessee
2017 2016US$000 US$000
Less than one year 554 210 After one year but not later than five years 767 151
1,321 361
7.2.2 Operating lease commitments-Bank as lessor
2017 2016US$000 US$000
Less than one year 335 1,054 After one year but not later than five years 152 -
487 1,054
Included in other operating income recognized as an operating lease income amounting to US$ 1,100 (2016 : US$1,135)
The Bank has entered into operating lease agreements for leasing of office premises. These leases have an average life of between two andfive years, with renewal option included in the contracts. Where the Bank is the lessee, the future minimum lease payments under non-cancellable operating leases are as follows:
The Bank has entered into operating lease agreements for leasing of office space on its building. These leases have an average life ofbetween two and five years, with renewal option included in the contracts. Where the Bank is the lessor, the future minimum leasereceivables under non-cancellable operating leases are as follows:
The credit risk associated with these transactions is considered minimal. To limit credit risk, the Bank deals exclusively with creditworthycounterparties.
The contractual amounts of the Bank’s commitments not recognized on the statement of financial position as at 31 December are indicatedbelow.
Included in administrative expenses is minimum lease payments recognised as an operating lease expense amounting to US$381,000 (2016 :US$213,000)
F-132

AFRICAN EXPORT-IMPORT BANK 37NOTES TO THE SPECIAL PURPOSE FINANCIAL STATEMENTSFOR THE YEAR ENDED 31 DECEMBER 2017
8 INTEREST AND SIMILAR INCOME2017 2016
US$000 US$000
Loans and advances 577,516 468,960 Interest on derivative contracts 4,359 10,439 Interest on money market investments 22,686 3,726 Interest on investments held to maturity 1,513 887
606,074 484,012
9 INTEREST AND SIMILAR EXPENSE2017 2016
US$000 US$000
Due to banks 158,295 87,540 Debt securities in issue 109,318 91,936 Shareholder and customer deposits 136 31,282
267,749 210,758
10 FEES AND COMMISSION INCOME2017 2016
US$000 US$000Advisory fees 21,308 26,822 Commission on L/Cs 8,511 2,833 Guarantee fees 9,368 6,629 Structuring Fees 58 6
39,245 36,290
11 FEES AND COMMISSION EXPENSE2017 2016
US$000 US$000Bond issue fees 1,147 1,951 Legal and agency fees 700 1,064 Other fees paid 7,036 2,840
8,883 5,855
12 OTHER OPERATING INCOME2017 2016
US$000 US$000Rental income 1,100 1,135 Other income 2,339 540
3,439 1,675
13 PERSONNEL EXPENSESPersonnel expenses are made up as follows:
2017 2016US$000 US$000
Wages and salaries 25,087 20,136 Staff provident fund costs (Note 2.10) 2,301 1,863 Other employee benefits 11,370 10,284
38,758 32,283
Interest income accrued on impaired financial assets is US$ 2,541,929 (2016: US$2,344,679).
F-133

AFRICAN EXPORT-IMPORT BANK 38NOTES TO THE SPECIAL PURPOSE FINANCIAL STATEMENTSFOR THE YEAR ENDED 31 DECEMBER 2017
14 GENERAL AND ADMINISTRATIVE EXPENSEGeneral and administrative expenses are made up as follows:
2017 2016US$000 US$000
Operational missions and statutory meetings 10,314 7,667 Professional service fees 6,031 4,354 Communications 2,849 2,019 Operational lease 382 213 Other general and administrative expenses 5,096 5,072
24,672 19,325 Professional services fees include US$ 90,000 (2016: US$100,000) in respect of external auditors' fees.
15 EARNINGS PER SHARE
2017 2016US$000 US$000
Net income attributable to equity holders of the bank 220,494 165,034
Weighted average number of ordinary shares in issue (basic) (note 15.1) 39,488 35,669 Weighted average number of ordinary shares in issue (Diluted) (note 15.2) 98,164 89,173
5.58 4.63 Basic earnings per share (expressed in US$000 per share) 2.25 1.85 Diluted earnings per share (expressed in US$000 per share)
15.1 Weighted average number of ordinary shares in issue (basic)Issued ordinary shares at 1 Janaury 35,669 30,715 Issued during the year 3,819 4,954 Weighted average number of ordinary shares at 31 Decemeber 39,488 35,669
15.2 Weighted average number of ordinary shares in issue (diluted)Weighted average number of ordinary shares in issue (basic) 39,488 35,669 Effect of warrants issuance 1,244 - Effect of partly paid shares 57,432 53,504 Weighted average number of ordinary shares at 31 Decemeber 98,164 89,173
16 CASH AND CASH EQUIVALENTS2017 2016
US$000 US$000Cash in hand 90 75 Deposits with other banks 861,307 618,770 Money market placements (note 16.1) 2,353,176 650,235
3,214,573 1,269,080
Current 2,123,409 650,235 Non-current 229,766 -
2,353,176 650,235
17 LOANS AND ADVANCES TO CUSTOMERS2017 2016
US$000 US$000Loans and advances to customers 8,510,543 10,315,620 Less:Allowance for impairment (note 18.1) (180,600) (167,418) Net loans and advances 8,329,943 10,148,202
Current 7,006,391 7,189,313 Non-current 1,323,552 2,958,889
8,329,943 10,148,202
Earnings per share are calculated by dividing the net income attributable to equity holders of the Bank by the weighted average number of ordinary shares in issue during the year.
Net income attributable to equity holders of the Bank have been calculated on the basis of assuming that all the net income for the year is distributed.
subsequent to the year end the bank issued 1,645 shares in classes (A & B) amounting to US$17.9 million. In addition the bank retired warrants worth US$ 49.2 million in 8 January, 2018
F-134
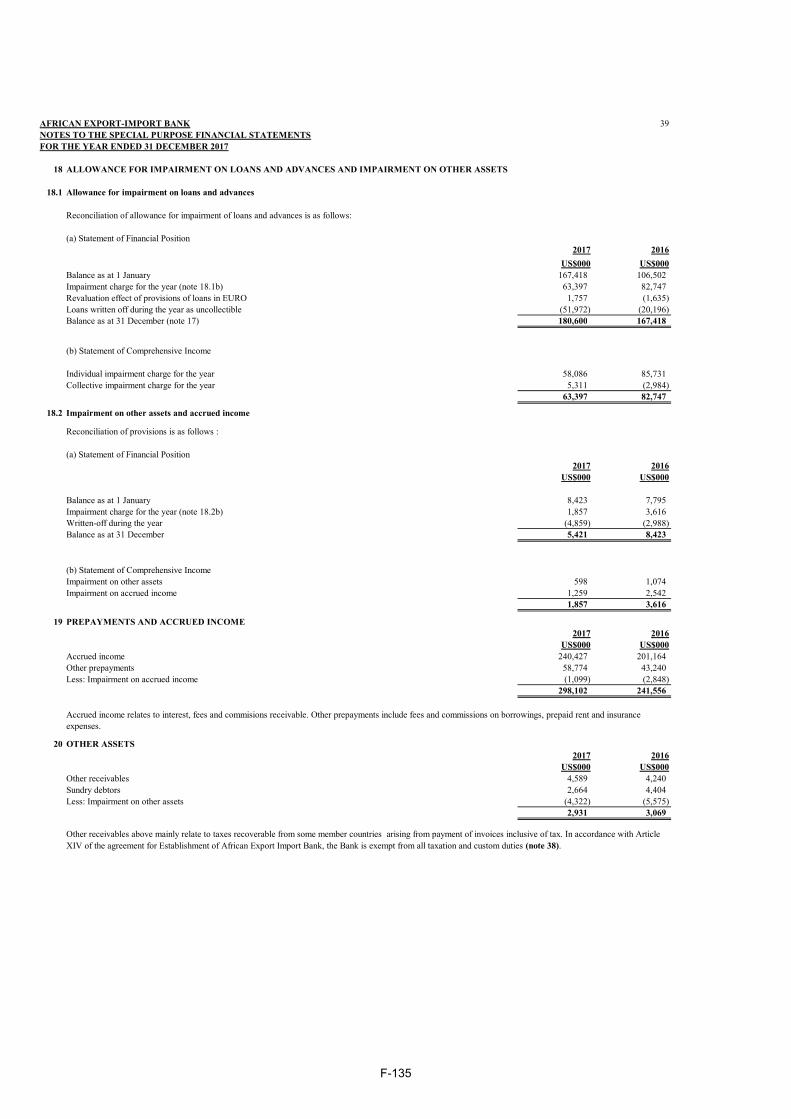
AFRICAN EXPORT-IMPORT BANK 39NOTES TO THE SPECIAL PURPOSE FINANCIAL STATEMENTSFOR THE YEAR ENDED 31 DECEMBER 2017
18 ALLOWANCE FOR IMPAIRMENT ON LOANS AND ADVANCES AND IMPAIRMENT ON OTHER ASSETS
18.1 Allowance for impairment on loans and advances
Reconciliation of allowance for impairment of loans and advances is as follows:
(a) Statement of Financial Position2017 2016
US$000 US$000Balance as at 1 January 167,418 106,502 Impairment charge for the year (note 18.1b) 63,397 82,747 Revaluation effect of provisions of loans in EURO 1,757 (1,635) Loans written off during the year as uncollectible (51,972) (20,196) Balance as at 31 December (note 17) 180,600 167,418
(b) Statement of Comprehensive Income
Individual impairment charge for the year 58,086 85,731 Collective impairment charge for the year 5,311 (2,984)
63,397 82,747
18.2 Impairment on other assets and accrued income
Reconciliation of provisions is as follows :
(a) Statement of Financial Position2017 2016
US$000 US$000
Balance as at 1 January 8,423 7,795 Impairment charge for the year (note 18.2b) 1,857 3,616 Written-off during the year (4,859) (2,988) Balance as at 31 December 5,421 8,423
(b) Statement of Comprehensive IncomeImpairment on other assets 598 1,074 Impairment on accrued income 1,259 2,542
1,857 3,616
19 PREPAYMENTS AND ACCRUED INCOME2017 2016
US$000 US$000Accrued income 240,427 201,164 Other prepayments 58,774 43,240 Less: Impairment on accrued income (1,099) (2,848)
298,102 241,556
20 OTHER ASSETS2017 2016
US$000 US$000Other receivables 4,589 4,240 Sundry debtors 2,664 4,404 Less: Impairment on other assets (4,322) (5,575)
2,931 3,069
Accrued income relates to interest, fees and commisions receivable. Other prepayments include fees and commissions on borrowings, prepaid rent and insurance expenses.
Other receivables above mainly relate to taxes recoverable from some member countries arising from payment of invoices inclusive of tax. In accordance with Article XIV of the agreement for Establishment of African Export Import Bank, the Bank is exempt from all taxation and custom duties (note 38).
F-135

AFRICAN EXPORT-IMPORT BANK 40NOTES TO THE SPECIAL PURPOSE FINANCIAL STATEMENTSFOR THE YEAR ENDED 31 DECEMBER 2017
2017 2016US$000 US$000
21 Financial investments - held to maturityBegining balance at 01 January 30,268 - Additions during the year - 30,268 Balance as at 31 December 30,268 30,268
22 DUE TO BANKS2017 2016
US$000 US$000Current 1,733,393 2,077,769 Non current 2,497,981 1,973,143
4,231,374 4,050,912
2017 201622.1 DUE TO BANKS US$000 US$000
Money market placements 452,030 426,940 Loans from financial institutions 3,779,344 3,623,972
4,231,374 4,050,912
There is no collateral against the above amounts of loans from financial institutions.
23 DEBT SECURITIES IN ISSUE
Debt securities at amortised cost:Coupon 2017 2016 Date of Date of
(%) US$000 US$000 issuance maturityFixed rate debt securities due 2018 3.88 500,000 500,000 Jun 2013 Jun 2018Fixed rate debt securities due 2019 4.75 700,000 700,000 Jul 2014 Jul 2019Fixed rate debt securities due 2021 4.00 900,000 900,000 May 2016 May 2021Fixed rate debt securities due 2024 4.13 750,000 - Jun 2017 Jun 2024Floating rate private placement note due 2021 41,500 - Jul 2017 Jul 2021Less: Discount on bond payable (11,429) (10,880) Add: Premium on bond payable 1,551 1,994
2,881,622 2,091,114
Loans from financial institutions, have both short-term and long-term borrowings ranging from tenor periods of one month to 12 years with interest rates ranging from 0.5% to 4.65%. Note that the long-term tenor borrowings are matched with specific assets with the same tenor.
The Bank has not had any defaults of principal, interest or other breach with respect to its debt securities during the year ended 31 December 2017 and 2016. The debt securities in issue are unsecured.
The Bank issued, under the Euro Medium Term Note Programme (EMTN), US$ 2,850 million bonds (2016: US$2,100 million) with different maturities and coupon rates. Further, the Bank issued under an EMTN Programme, US$41.5 million (2016: US$0million) private placement with floating rate. Fitch Ratings and Moody's assigned these bonds an investment grade rating BBB-, and Baa2 respectively.
The Bank has not had any defaults of principal, interest or other breach with respect to its debt securities during the year ended 31 December 2017 and 2016. The debt securities in issue are unsecured.
F-136

AFR
ICA
N E
XPO
RT
-IM
POR
T B
AN
K41
NO
TE
S T
O T
HE
SPE
CIA
L P
UR
POSE
FIN
AN
CIA
L S
TA
TE
ME
NT
SFO
R T
HE
YE
AR
EN
DE
D 3
1 D
EC
EM
BE
R 2
017
24PR
OPE
RT
Y A
ND
EQ
UIP
ME
NT
(CO
NT
INU
ED
)
The
tabl
e be
low
ana
lyse
s the
det
ails
of th
e B
ank'
s pro
perty
and
equ
ipm
ent. Lan
dB
uild
ing
Mot
orFu
rnitu
reL
ease
hold
Ass
ets
Tot
alV
ehic
les
and
impr
ovem
ents
unde
req
uipm
ent
cons
truc
tion
US$
000
US$
000
US$
000
US$
000
US$
000
US$
000
US$
000
YE
AR
EN
DE
D 3
1 D
EC
EM
BE
R 2
016
CO
STC
ost/v
alua
tion
as a
t 1 Ja
nuar
y 20
1613
,410
28
,827
30
7
11,0
48
1,03
4
11 54
,637
R
e-cl
assi
fied
to In
tang
ible
ass
et-
- -
(2,7
22)
-
- (2
,722
)
Add
ition
s-
132
48
5
991
-
557
2,
165
C
apita
lisat
ion
of a
sset
s und
er c
onst
ruct
ion
- 24
- -
(24)
-
Disp
osal
s-
- (7
3)
(407
)
- -
(480
)
Rev
alua
tion
(6,7
68)
(1
1,88
2)
- -
- -
(18,
650)
Tr
ansf
er*
- (2
,550
)
- -
- -
(2,5
50)
C
ost/v
alua
tion
as a
t 31
Dec
embe
r 20
166,
642
14
,551
71
9
8,91
0
1,03
4
544
32
,400
AC
CU
MU
LA
TE
D D
EPR
EC
IAT
ION
Acc
umul
ated
dep
reci
atio
n as
at 1
Janu
ary
2016
- -
(218
)
(7,4
66)
(1
,012
)
- (8
,696
)
Re-
clas
sifie
d to
Inta
ngib
le a
sset
- -
1,59
3
- -
1,59
3
Cha
rge
of th
e ye
ar-
(2,5
50)
(8
2)
(1,2
19)
(1
0)
- (3
,861
)
Disp
osal
s-
- 73
407
-
-48
0
Tran
sfer
*-
2,55
0
- -
- -
2,55
0
Tot
al a
ccum
ulat
ed d
epre
ciat
ion
as a
t 31
Dec
embe
r 20
16-
- (2
27)
(6
,685
)
(1,0
22)
-
(7,9
34)
Net
car
ryin
g am
ount
as a
t 31
Dec
embe
r 20
166,
642
14
,551
49
2
2,22
5
12 54
4
24,4
66
F-137

AFR
ICA
N E
XPO
RT
-IM
POR
T B
AN
K42
NO
TE
S T
O T
HE
SPE
CIA
L P
UR
POSE
FIN
AN
CIA
L S
TA
TE
ME
NT
SFO
R T
HE
YE
AR
EN
DE
D 3
1 D
EC
EM
BE
R 2
017
24PR
OPE
RT
Y A
ND
EQ
UIP
ME
NT
The
tabl
e be
low
ana
lyse
s the
det
ails
of th
e B
ank'
s pro
perty
and
equ
ipm
ent. Lan
dB
uild
ing
Mot
orFu
rnitu
reL
ease
hold
Ass
ets
Tot
alV
ehic
les
and
impr
ovem
ents
unde
req
uipm
ent
cons
truc
tion
US$
000
US$
000
US$
000
US$
000
US$
000
US$
000
US$
000
YE
AR
EN
DE
D 3
1 D
EC
EM
BE
R 2
017
CO
STC
ost/v
alua
tion
as a
t 1 Ja
nuar
y 20
176,
642
14
,551
71
9
8,91
0
1,03
4
544
32
,400
A
dditi
ons
- 5
90 1,
308
-
331
1,
734
C
apita
lisat
ion
of a
sset
s und
er c
onst
ruct
ion
- -
- -
- -
Disp
osal
s-
- -
- -
Rev
alua
tion
(734
)
10,0
13
- -
- -
9,27
9
Tran
sfer
*-
(1,4
08)
-
- -
- (1
,408
)
Cos
t/val
uatio
n as
at 3
1 D
ecem
ber
2017
5,90
8
23,1
61
809
10
,218
1,
034
87
5
42,0
05
AC
CU
MU
LA
TE
D D
EPR
EC
IAT
ION
Acc
umul
ated
dep
reci
atio
n as
at 1
Janu
ary
2017
- -
(227
)
(6,6
85)
(1
,022
)
- (7
,934
)
Cha
rge
for t
he y
ear
- (1
,408
)
(146
)
(1,0
78)
(9
)
- (2
,641
)
Disp
osal
s-
- -
--
--
Tran
sfer
*-
1,40
8
- -
- -
1,40
8
Tot
al a
ccum
ulat
ed d
epre
ciat
ion
as a
t 31
Dec
embe
r 20
17-
- (3
73)
(7
,763
)
(1,0
31)
-
(9,1
67)
Net
car
ryin
g am
ount
as a
t 31
Dec
embe
r 20
175,
908
23
,161
43
6
2,45
5
3 87
5
32,8
38
*Tra
nsfe
rs re
late
s to
the
accu
mul
ated
dep
reci
atio
n as
at t
he re
valu
atio
n da
te th
at w
as e
limin
ated
aga
inst
the
gros
s car
ryin
g am
ount
of t
he re
valu
ed a
sset
.
The
fair
valu
e of
the
build
ing
and
the
land
whi
ch re
flect
s mar
ket c
ondi
tions
at t
he re
porti
ng d
ate
was
US$
23,
161,
000
(201
6: U
S$ U
S$ 1
4,55
1,00
0) a
nd U
S$ 5
,908
,000
(201
6: U
S$ 6
,642
,000
) re
spec
tivel
y. T
he fa
ir va
lue
was
det
erm
ined
usin
g an
inde
pend
ent v
alue
r on
31 D
ecem
ber 2
017.
The
valu
er u
sed
was
Ara
b G
roup
for T
echn
ical
Con
sulta
nt w
ho h
as e
xper
ienc
e in
sim
ilar
proj
ects.
The
net
car
ryin
g am
ount
of t
he H
eadq
uarte
rs' l
and
and
build
ing
wou
ld h
ave
been
U
S$ 3
4,00
0 (2
016:
US$
34,
000)
and
US$
8,7
96,0
00 (2
016:
US$
9,5
62,0
00)
resp
ectiv
ely
if bo
th
clas
ses h
ad n
ot b
een
reva
lued
.
Dur
ing
the
year
the
bank
rece
ived
a la
nd fr
om g
over
nmen
t of Z
imba
bwe
in o
rder
to e
stab
lish
a re
gino
nal o
ffice
to fa
cilit
ate
the
busi
ness
of t
he B
ank
in S
outh
ern
Afr
ica
regi
on.
F-138

AFRICAN EXPORT-IMPORT BANK 43NOTES TO THE SPECIAL PURPOSE FINANCIAL STATEMENTSFOR THE YEAR ENDED 31 DECEMBER 2017
25 Intangible Assets 2017 2016US$000 US$000
Cost 1 January 3,029 2,722 Additions 906 307 Cost 31 December 3,935 3,029 Accumulated amortizationAs at 1 January (2,215) (1,593) Amortization charges for the year (472) (622) As at 31 December (2,687) (2,215) Net value as 31 December 1,248 814
26 DEPOSITS AND CUSTOMER ACCOUNTS2017 2016
US$000 US$000Shareholders' deposits for shares 9,151 8,866 Deposit accounts 57,134 25,942 Customer accounts 2,083,071 3,743,685
2,149,356 3,778,493
Current 1,649,356 3,278,493 Non-Current 500,000 500,000
2,149,356 3,778,493
27 OTHER LIABILITIES2017 2016
US$000 US$000Prepaid and unearned income 84,926 63,899 Dividends payable 14,784 13,600 Deposits from tenants 423 423 Accrued expenses 70,929 57,907 Sundry creditors 327,411 14,808 Legal fees deposits 7,151 6,705
505,624 157,342
28 SHARE CAPITAL
In terms of customer group, the deposits and customer accounts above were from sovereigns, enterprises and financial institutions.The fair value of the deposits of customer accounts approximate the carrying amount, as they have variable interest rates.
The share capital of the bank is divided into four classes of which A,B and C classes are payable in five equal instalments, of which the first two installments have been called up. Class D shares are fully paid at time of subscription. Shareholders can use their dividend entitlement to acquire more shares.
Class A are shares which may only be issued to (a) African states, either directly or indirectly through their central banks or other designated institutions, (b) the African Development Bank, and ( c ) African regional and sub regional institutions;
Class B are shares which may only be issued to African public and private commercial banks, financial institutions and African public and private investors; and
Class C are shares which may only be issued to (a) international financial institutions and economic organisations; (b) non African or foreign owned banks and financial institutions; and non African public and private investors.
Class D are shares which may be issued in the name of any person.
F-139
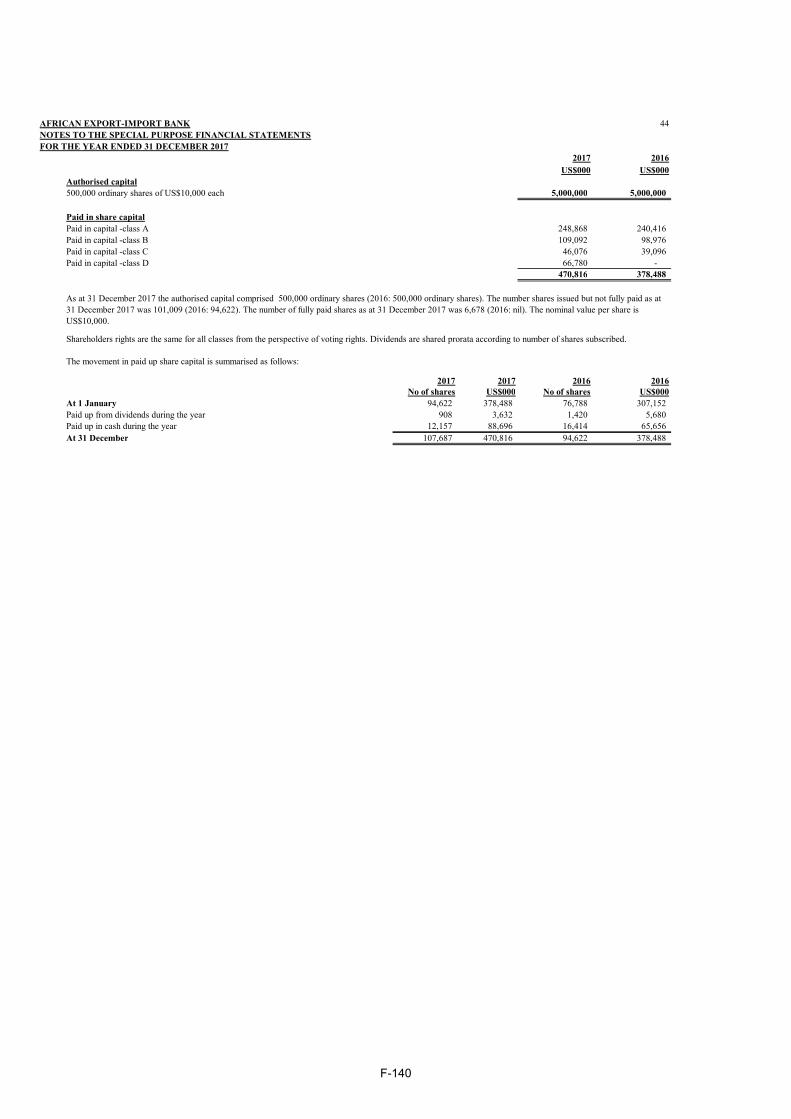
AFRICAN EXPORT-IMPORT BANK 44NOTES TO THE SPECIAL PURPOSE FINANCIAL STATEMENTSFOR THE YEAR ENDED 31 DECEMBER 2017
2017 2016US$000 US$000
Authorised capital500,000 ordinary shares of US$10,000 each 5,000,000 5,000,000
Paid in share capitalPaid in capital -class A 248,868 240,416 Paid in capital -class B 109,092 98,976 Paid in capital -class C 46,076 39,096 Paid in capital -class D 66,780 -
470,816 378,488
The movement in paid up share capital is summarised as follows:
2017 2017 2016 2016No of shares US$000 No of shares US$000
At 1 January 94,622 378,488 76,788 307,152 Paid up from dividends during the year 908 3,632 1,420 5,680 Paid up in cash during the year 12,157 88,696 16,414 65,656 At 31 December 107,687 470,816 94,622 378,488
As at 31 December 2017 the authorised capital comprised 500,000 ordinary shares (2016: 500,000 ordinary shares). The number shares issued but not fully paid as at 31 December 2017 was 101,009 (2016: 94,622). The number of fully paid shares as at 31 December 2017 was 6,678 (2016: nil). The nominal value per share is US$10,000.
Shareholders rights are the same for all classes from the perspective of voting rights. Dividends are shared prorata according to number of shares subscribed.
F-140

AFRICAN EXPORT-IMPORT BANK 45NOTES TO THE SPECIAL PURPOSE FINANCIAL STATEMENTSFOR THE YEAR ENDED 31 DECEMBER 2017
29 SHARE PREMIUMPremiums from the issue of shares are reported in the share premium accountThe movement in share premium account is summarised as follows:
2017 2017 2016 2016No of shares US$000 No of shares US$000
At 1 January 94,622 355,310 76,788 203,861 Paid up from dividends during the year 908 11,946 1,420 12,901 Paid up in cash during the year 12,157 195,093.60 16,414 138,548 At 31 December 107,687 562,350 94,622 355,310
30 RESERVES
General Reserves
Asset revaluation
ReserveCashflow
hedge Reserve
Project preparation
facility Fund reserve Total
US$000 US$000 US$000 US$000 US$000Balance as at 1 January 2016 302,744 31,878 19,611 354,233 Revaluation of land - (6,768) - (6,768) Revaluation of building - (11,882) - (11,882) Depreciation transfer : buildings - (1,628) - (1,628) Transfer to cashflow hedge reserve - - (33,087) (33,087) Transfer from retained earnings (note 31) 63,538 - - 63,538 Balance as at 31 December 2016 366,282 11,600 (13,476) - 364,406
Balance as at 1 January 2017 366,282 11,600 (13,476) - 364,406 Revaluation of land - (734) - (734) Revaluation of building - 10,013 - 10,013 Depreciation transfer : buildings - (1,408) - (1,408) Recycling of fair value adjustment to profit and loss 13,476 13,476 Transfer from retained earnings (note 31) 81,480 - - 7500 88,980 Balance as at 31 December 2017 447,762 19,471 - 7,500 474,733
- The asset revaluation and cashflow hedge reserves are restricted from distribution to the shareholders.
In July 2013, the Bank appealed to its shareholders to increase equity through acquisition of additional shares of which some of the shareholders responded favorably. During the Extra Ordinary Meeting held on 20 September 2014, the shareholders approved a rights issue to raise $ 500 million of equity. Further, the shareholders approved to issue such shares at a discount of 45% to motivate the shareholders exercise their rights. During 2015 the board and shareholders approved to apply the 45% discount retrospectively effective July 2013 to all existing shareholders who responded to the capital increase appeal. Accordingly, 1,121 additional shares were reallocated to the affected shareholders who acquired shares between July 2013 and December 2014 and the related effect on share capital and share premium balances were reflected in 2015.
- At the beginning of the year, Management recycled fair value losses arising from discontinuation of hedge accounting for the Interest Rate Swaps due to the prevailing environment where interest rates are rising and expected to continue on the same trend.
F-141

AFRICAN EXPORT-IMPORT BANK 46NOTES TO THE SPECIAL PURPOSE FINANCIAL STATEMENTSFOR THE YEAR ENDED 31 DECEMBER 2017
Nature and purpose of reserves
a. General reserve
b. Asset revaluation reserve
c. Cash flow hedge reserve
d. Project preparation facility Fund reserve
The cash flow hedge reserve represents the cumulative effective portion of gains or losses arising from changes in fair value of hedging instruments entered into for cash flow hedges. The cumulative gain or loss arising on changes in fair value of the hedging instruments that are recognised and accumulated under the heading of cash flow hedge reserve will be reclassified to profit or loss only when the hedged transaction affects the profit or loss, or included as a basis adjustment to the non-financial hedged item, consistent with the relevant accounting policy.
The general reserve is set up in accordance with the Bank's policy in order to cover general banking risks, including future losses and other unforeseeable risks or contingencies. Each year the Bank transfers 50% of profit after deduction of dividends to general reserves.
The revaluation reserve is used to record increases in the fair value of land and building and decreases to the extent that such decrease relates to an increase on the same asset previously recognised in equity. An annual transfer from the asset revaluation reserve to retained earnings is made for the difference between depreciation based on the revalued amount of the asset and depreciation based on the asset original cost. When revalued assets are sold, the portion of the revaluation reserve that relates to those assets is effectively realised and transferred directly to retained earnings.
The Project Preparation Facility Fund was approved by the Board in December 2017 for the purposes of setting funds aside to be utilized by the Bank during project preparation phase. Project preparation phase will comprise the entire set of activities undertaken to progress a project from conceptualization through concept design to financial close. It will entail the provision of technical and financial support services - such as technical, environmental, market, financial, legal and regulatory, advocacy services that may be required to a point where the project can attract revenue from investors (both debt and equity). The Project Preparation Facility Fund was approved for a total amount of USD15 million to be appropriated from the Bank’s profits equally over two years from 2017 to 2018. The fund will be operated on a full cost recovery revolving basis and solely deployed towards project preparation work and related activities.
F-142

AFRICAN EXPORT-IMPORT BANK 47NOTES TO THE SPECIAL PURPOSE FINANCIAL STATEMENTSFOR THE YEAR ENDED 31 DECEMBER 2017
31 RETAINED EARNINGS2017 2016
US$000 US$000Balance as at 1 January 429,448 355,147 Profit for the year 220,494 165,034 Transfer to general reserve (81,480) (63,538) Transfer to Project preparation facility (7,500) - Depreciation transfer: buildings 1,408 1,628 Dividends for prior year (37,958) (28,823) Balance as at 31 December 524,412 429,448
32 DIVIDENDS
Dividends per share is summarised as follows:2017 2016
US$000 US$000
Proposed dividends per shareDividends appropriations 57,534 37,958
Number of shares at 31 December 107,687 94,622
Dividends per share 0.53 0.40
Dividends per share declared and paidDividends appropriations 37,958 28,823
Number of shares at 31 December of the previous year 94,622 76,788
Dividends per share 0.40 0.38
33 WARRANTS
2017 2017 2016 2016No of warrants US$000 No of warrants US$000
At 1 January 2,424 98,716 1,224 46,316 Retirement during the year (4,778) (198,575) (1,224) (46,316) Issued during the year 4,869 191,582 2,424 98,716 At 31 December 2,515 91,723 2,424 98,716
After reporting date, the directors proposed dividends appropriations amounting to US$ 57,534,000 (2016: US$ 37,958,000). The 2017 dividend appropriation is subject to approval by the shareholders in their Annual General Meeting. These special purpose financial statements do not reflect the dividend payable, which will be accounted for in equity as an appropriation of retained earnings in the year ending 2018.
The Bank held an Extra Ordinary Meeting on 20 September 2014, where the shareholders authorised an equity increase of $500 million from existing shareholders. The shareholders also approved that an arrangement be put in place whereby a third party entity (entities or investors) would provide bridging financing to pre-finance the expected subscribed amounts in terms of the equity raising plan. The third party entity (entities or investors) could achieve this in various ways, including among others, the issue of debt instruments. It was therefore in this context that the Bank put in place the Equity Bridge Bond. Under the Equity Bridge Bond Structure, the Bank created an "orphan Special Purpose Vehicle- SPV" registered in the Seychelles. The shares of the SPV are held by a non-charitable trust with the trustee being an administration company. The SPV is the issuer of the bond. As at 31 December 2017, for 2,515 warrants for an aggregate principal amount of up to approximately US$ 91,723,835 with an average tenor for 2 years. The issuer used the proceeds of the bonds to subscribe for warrants representing Class D shares of African Export-Import Bank.
The Bank considered the equivalent number of fully paid up shares in calculation of the dividends given that Classes A, B and C shares are partially paid, that is 40% at subscription with 60% remaining as callable capital
F-143

AFRICAN EXPORT-IMPORT BANK 48NOTES TO THE SPECIAL PURPOSE FINANCIAL STATEMENTSFOR THE YEAR ENDED 31 DECEMBER 2017
34 RELATED PARTY TRANSACTIONS
The details of related party transactions are as follows:
34 Key management personnel compensation
Salaries and benefits to management personnel
2017 2016US$000 US$000
Salaries and short-term benefits 8,522 6,483 Other long-term benefits 2,287 1,652 Post-employment benefits 554 460 Termination benefits 200 114
11,563 8,709
Loans and advances to management personnel
2017 2016US$000 US$000
Balance as at I January 225 162 Loan disbursements during the year 612 481 Loan repayments during the year (330) (418) Balance as at 31 December 507 225
No loans to related parties were written off in 2017 and 2016.
Interest income from staff loans amounted to US$ 24,268 (2016: US$ 17,675). There were no loan loss provisions on staff loans in both current and prior year.
Compensation paid to the Bank's executive officers and directors during the year is as follows:
The Bank provides loans and advances to its staff, including those in management. Such loans and advances are guaranteed by the staff terminal benefits payable at the time of departure from the Bank. The staff loans and advances are interest bearing and are granted in accordance with the Bank's policies. The movement in loans and advances to management during the year ended 31 December 2017 was as follows:
Short -term benefits above include meeting allowances for Board members and staff allowances for children's education, dependency, home leave and housing.
The Bank's principal related parties are its shareholders. The Bank transacts commercial business such as loans and deposits directly with the shareholders themselves and institutions which are either controlled by the shareholder governments or over which they have significant influence.
F-144
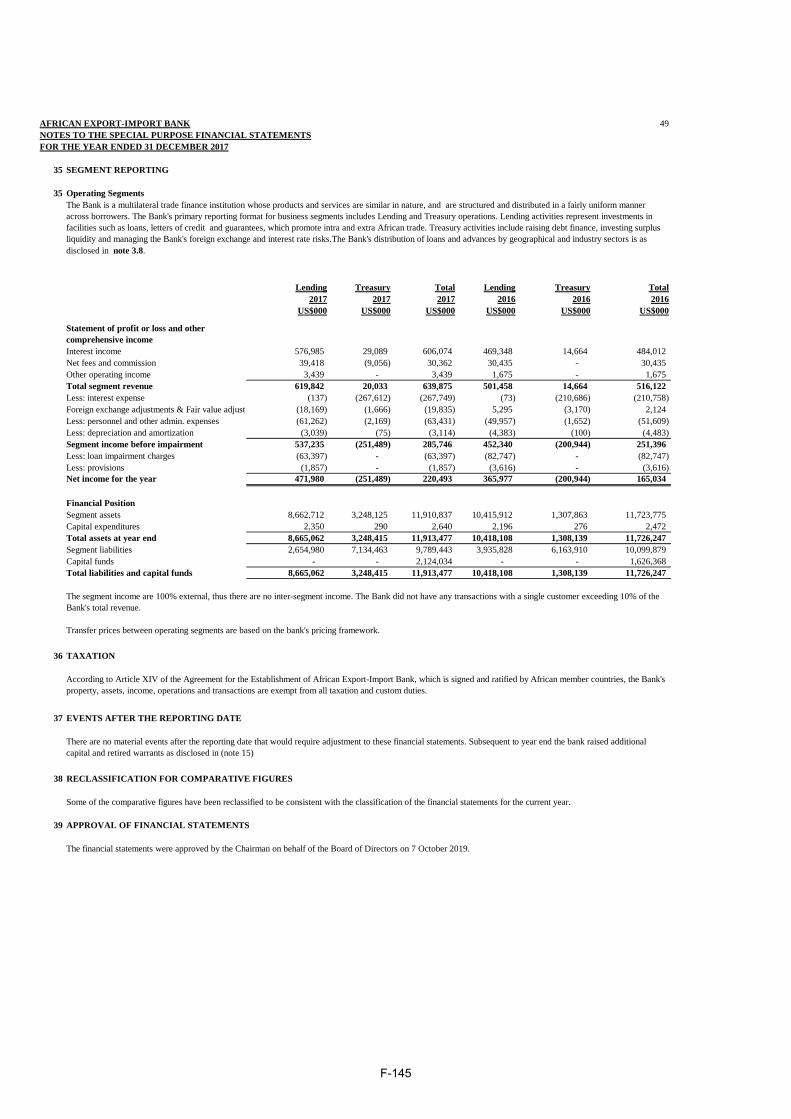
AFRICAN EXPORT-IMPORT BANK 49NOTES TO THE SPECIAL PURPOSE FINANCIAL STATEMENTSFOR THE YEAR ENDED 31 DECEMBER 2017
35 SEGMENT REPORTING
35 Operating Segments
Lending Treasury Total Lending Treasury Total2017 2017 2017 2016 2016 2016
US$000 US$000 US$000 US$000 US$000 US$000
Interest income 576,985 29,089 606,074 469,348 14,664 484,012 Net fees and commission 39,418 (9,056) 30,362 30,435 - 30,435 Other operating income 3,439 - 3,439 1,675 - 1,675 Total segment revenue 619,842 20,033 639,875 501,458 14,664 516,122 Less: interest expense (137) (267,612) (267,749) (73) (210,686) (210,758) Foreign exchange adjustments & Fair value adjustm (18,169) (1,666) (19,835) 5,295 (3,170) 2,124 Less: personnel and other admin. expenses (61,262) (2,169) (63,431) (49,957) (1,652) (51,609) Less: depreciation and amortization (3,039) (75) (3,114) (4,383) (100) (4,483) Segment income before impairment 537,235 (251,489) 285,746 452,340 (200,944) 251,396 Less: loan impairment charges (63,397) - (63,397) (82,747) - (82,747) Less: provisions (1,857) - (1,857) (3,616) - (3,616) Net income for the year 471,980 (251,489) 220,493 365,977 (200,944) 165,034
Financial PositionSegment assets 8,662,712 3,248,125 11,910,837 10,415,912 1,307,863 11,723,775Capital expenditures 2,350 290 2,640 2,196 276 2,472 Total assets at year end 8,665,062 3,248,415 11,913,477 10,418,108 1,308,139 11,726,247Segment liabilities 2,654,980 7,134,463 9,789,443 3,935,828 6,163,910 10,099,879Capital funds - - 2,124,034 - - 1,626,368Total liabilities and capital funds 8,665,062 3,248,415 11,913,477 10,418,108 1,308,139 11,726,247
36 TAXATION
37 EVENTS AFTER THE REPORTING DATE
38 RECLASSIFICATION FOR COMPARATIVE FIGURES
Some of the comparative figures have been reclassified to be consistent with the classification of the financial statements for the current year.
39 APPROVAL OF FINANCIAL STATEMENTS
The segment income are 100% external, thus there are no inter-segment income. The Bank did not have any transactions with a single customer exceeding 10% of the Bank's total revenue.
Transfer prices between operating segments are based on the bank's pricing framework.
The financial statements were approved by the Chairman on behalf of the Board of Directors on 7 October 2019.
The Bank is a multilateral trade finance institution whose products and services are similar in nature, and are structured and distributed in a fairly uniform manner across borrowers. The Bank's primary reporting format for business segments includes Lending and Treasury operations. Lending activities represent investments in facilities such as loans, letters of credit and guarantees, which promote intra and extra African trade. Treasury activities include raising debt finance, investing surplus liquidity and managing the Bank's foreign exchange and interest rate risks.The Bank's distribution of loans and advances by geographical and industry sectors is as disclosed in note 3.8.
According to Article XIV of the Agreement for the Establishment of African Export-Import Bank, which is signed and ratified by African member countries, the Bank's property, assets, income, operations and transactions are exempt from all taxation and custom duties.
There are no material events after the reporting date that would require adjustment to these financial statements. Subsequent to year end the bank raised additional capital and retired warrants as disclosed in (note 15)
Statement of profit or loss and other comprehensive income
F-145

BANKAfrican Export-Import Bank
Afreximbank Building72 (B) El Maahad El Eshteraky St.
HeliopolisCairo 11341
Egypt
LEGAL ADVISERS TO THE BANK
As to English and U.S. law
White & Case LLP5 Old Broad StreetLondon EC2N 1DWUnited Kingdom
INDEPENDENT AUDITORS TO THE BANK
KPMG—Hazem HassanSmart Village—Building 105, Km 28 Cairo Alex Desert road, Giza, Egypt

Toppan Merrill, London19-19410-1