Embed Size (px)
Citation preview
21st Century Science:
The Age of Intelligent Algorithms?
Stephen Roberts
Machine Learning Research Group,
Oxford-Man Institute, University of Oxford,
Alan Turing Institute
& Mind Foundry Ltd.
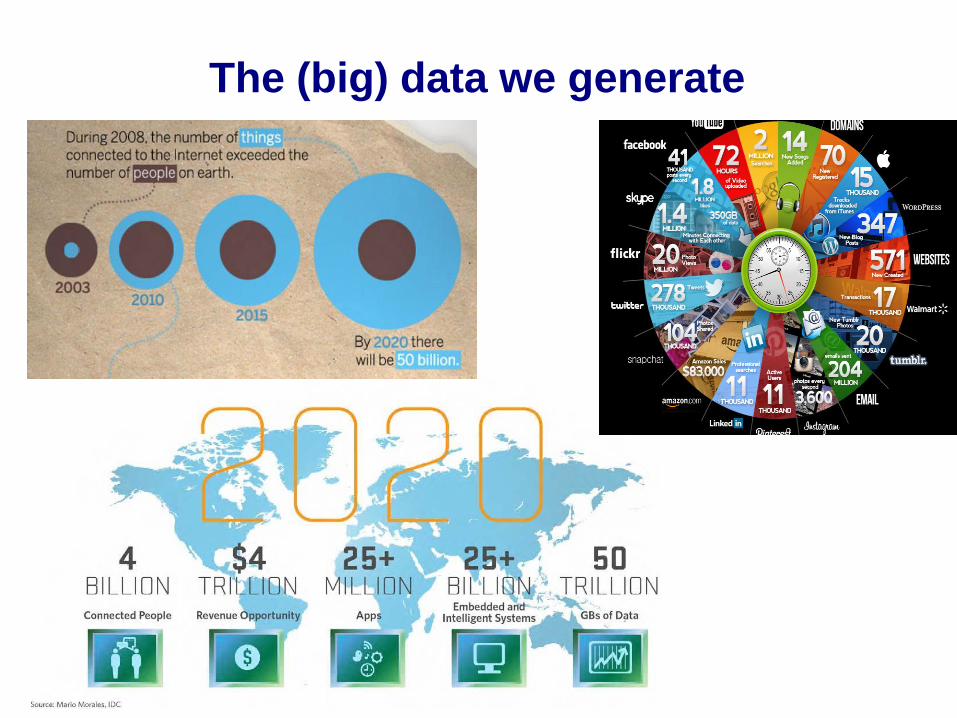
The (big) data we generate
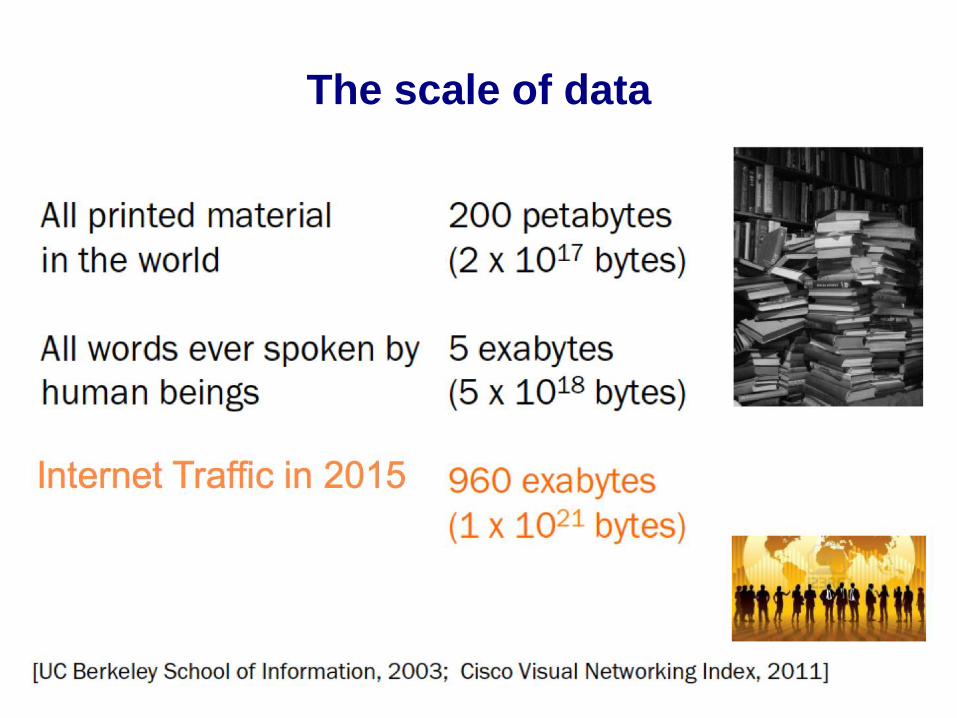
The scale of data
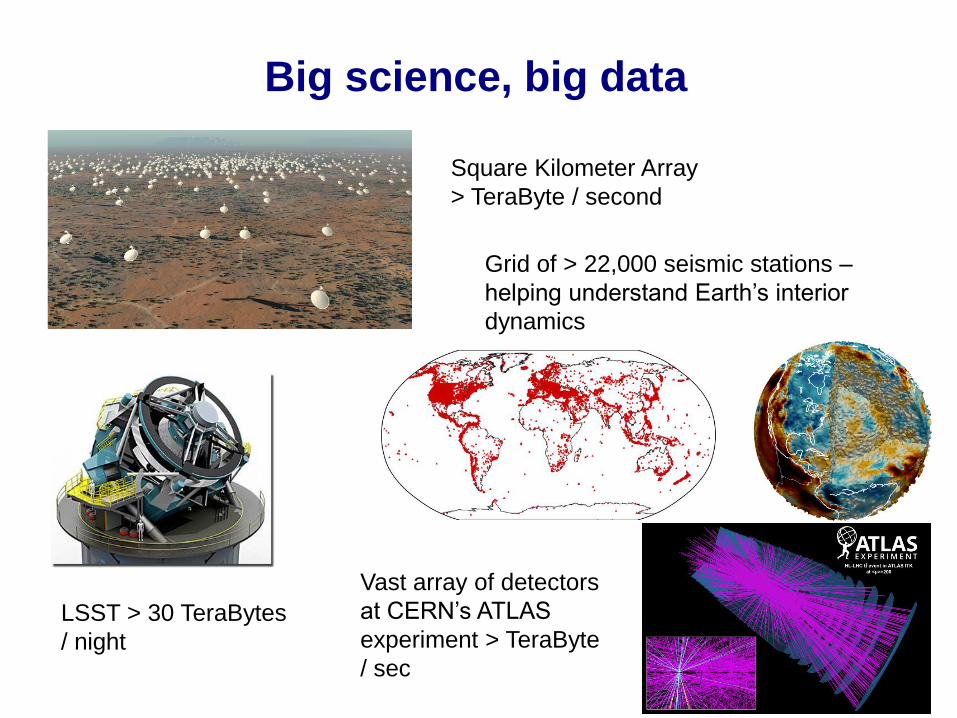
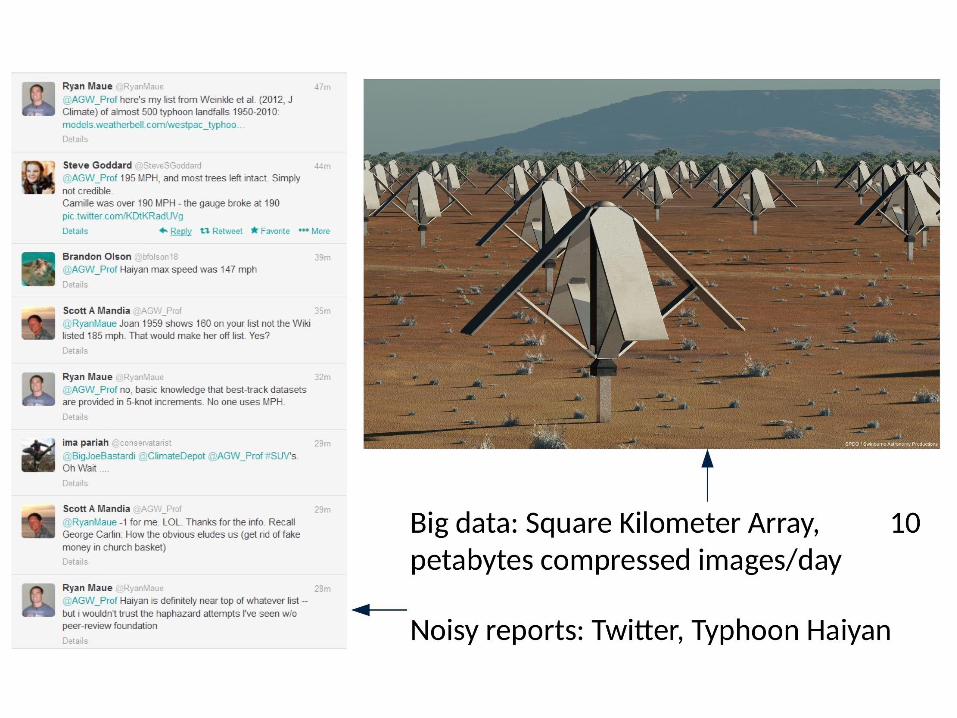
Big science, big data
Figure 1. Artist’s impression of the layout of parabolic antennas comprising the Square Kilometre Array. Credit: Swinburne
Astronomy Productions, Swinburne University of Technology.
frequencies below 350 MHz (low frequency array). At each element of the interferometer, the data will bedigitized at rates of
order 1 Gsamples/s, generating broadband data streams that are combined digitally downstream, in two different ways. Thefirst
uses a device known as a correlator, which generates images of the radio sky. The second uses a device called a beamformer, to
generate high time resolution time series of signals originating from individual and very localized positions in the sky.
The SKA will use beamformer technology to simultaneously generate 500 beams using the low frequency array, and 1500
beams using themid frequency array. Each of these beams will carry information at a rateof approximately 2.5 Mbits/s, leading
to a total data bandwidth of 1.3 Tbits/s and 4 Tbits/s for the low and mid frequency arrays. The primary purpose for generating
these data streams is to search for pulsars and fast radio transients. Storing the data and processing offline is both prohibitively
expensiveand restrictive for thescience; there isno opportunity for a rapid reaction to uniqueevents detected in thedata, which
are often the most astrophysically interesting. Therefore the processing that is required to detect the interesting signals must be
carried out in real time. As a consequence, the necessary algorithms, including specific filters for the correction of dispersion
effects caused by interstellar propagation, and algorithms that search for periodic and quasi-periodic signals embedded in noise,
require extreme optimization. A carefully designed combination of high performance computing hardware and optimized
algorithms, will allow us to perform this unprecedented search in real time and within a tight power budget.
One of the main motivations for this enormous computing effort lies within the amazing properties of pulsars, and their
capacity to continuously provideuswith new insight into extreme processes and fundamental physics.21 Pulsars are neutron
stars, born in supernova explosions of massive stars. Their physical properties are extreme; they contain more than a solar
mass within a sphere of 20 km, at densities that exceed nuclear density in their interiors, and with surface magnetic fields
far greater than what can be generated in a laboratory (109 – 1015 Gauss). They rotate around their spin axis at periods of
milliseconds to seconds, and maintain extremely stable rotational properties over years. For this reason, the radio pulses from
pulsars can be used as ticks from extremely stable clocks, probing fundamental properties of space-time. The stability of
pulsars suggests that we can use lines of sight towards multiple pulsars as arms of a Galactic Gravitational Wave detector,
sensitive to (nHz) frequencies, many orders of magnitude lower than the recent discoveries of LIGO. In addition to stringent
tests of General Relativity, pulsars allow us to study the properties of dense nuclear matter, high energy plasmas, and supernova
explosions, as well as the structure of the intervening magneto-ionized interstellar medium. Pulsars are a treasure-trove for
many areas of research in physics, and theSKA searches will reveal to us themajority of theGalactic pulsar population, feeding
ground-breaking discoveries in the coming decades.
4/17
Square Kilometer Array
> TeraByte / second
Figure 2. Left: Map of 22000 seismograph station deployments since the 1960s (International Seismological Centre).
Currently, 5000 stations deliver data in real-time. Right: Model of seismic velocities in theEarth’s interior (courtesy Kasra
Hosseini).
3.2 Current highlight from Earth sciences
Big Data in the Earth sciences Big Data in the Earth sciences are characterized by the large variety of observables of Earth
processes. For example, satellite observations, weather and buoy stations, permanently deployed GPSstations, tilt meters, and
seismograph stations, to namejust afew. Thesedatahelp to addressawiderangeof theatmospheric and oceanographic sciences
and geoscientific issues and questions, over time-scales as short as minutes (for example earthquakes) to and time-varying
processes over human timescales, that are directly relevant to the existence of humanity for example global warming. Large
simulations in model spaces with billions of parameters are employed to explain these data and unravel the governing physical
systems and their properties.
Geographical Information systems (GIS) have transformed the Earth sciences and enabled geospatial analysis on big data.
However, GIS relies on scientists to interpret and classify what information to input and map. Earth scientists employ a variety
of algorithms to mine and merge datasets, and prepare input to GIS. However, due to the rapid increase of the amount of data
available in the Earth sciences, the algorithms to interpret and classify information lag behind in efficiency and effectiveness.
Moreover, often case they fall short of taking full advantage of the ability to analyse Earth scientific data on aglobal scale. One
sub-field of the Earth sciences where algorithmic research takes a key role in data-mining and interpretation, is seismology.
Earth scientists cannot observe theEarth’s interior directly, all observations are made indirectly and the dominant way in which
we learn about theEarth’s interior is through seismic waves.
Algorithmic challenges and opportunities in seismology Seismology concerns the study of vibrations of thesolid Earth.
These vibrations propagate with seismic velocity, and variations in this velocity teach usabout core and mantle composition,
plate tectonics, pressures, temperatures, rock type, melts, fractures, faults, fluids in pore spaces, resources, underground storage,
etc. The best-known sources of such seismic vibrations are earthquakes. But there are many more sources, including wind,
traffic, volcanoes, (nuclear) explosions, and landslides. The data are used to study awide range of phenomena, and are critical
to awide spectrum of Earth and environmental sciences. The primary use of seismic vibrations is to offer an opportunity to
image theEarth’s interior. The industry acquires seismic data with up to 1000000 sensors distributed extremely densely on a
small patch of theEarth’ssurface, to support exploration and production of underground (usually hydrocarbon) resources.
Seismology on aglobal scale faces the challange of keeping big data with it’s metadata, through acomplicated workflow.
During the last half-century more than 22000 stations havebeen temporarily or permanently deployed (Fig. 2, left). Predomi-
nantly, these are deployed in Western countries (Europe and North America), and cover the other continents and oceans more
sparsely. Although all stations record seismic vibrations, there are of a variety of instrument types that record at different
frequencies under different site conditions. The collected data is interpreted for the properties of theEarth’s interior. One
method for interpretation is by inversion, which relies on large simulations of wave propagation. This enables us to form a map
of seismic velocities in theEarth’s interior (Fig. 2, right). Seismic velocities near theEarth’s surface are known to change
over time. Shedding light on time-variant subsurface processes, such as active volcanoes,22 plate tectonics,23 hydrocarbon
production,24 and water saturation.25
The advancement of dense networks of seismic stations with data available in real-time motivates research into algorithms
that extract information on temporal variations that occur in the subsurfaceof the Earth. Since a few years, a rapidly growing
number of seismic stations supply data in real-time. Currently over 5000 such seismic stations are distributed around the globe.
Software for real-time seismology must combine aspects of data mining, pattern recognition, and map reduction, to deal with
5/17
Grid of > 22,000 seismic stations –
helping understand Earth’s interior
dynamics
[GeV]4lm100 150 200 250
Even
ts/5
GeV
0
5
10
15
20
25
-1Ldt = 4.8 fbò = 7 TeV: s
-1Ldt = 5.8 fbò = 8 TeV: s
4l®(*)
ZZ®H
Data
(*)Background ZZ
tBackground Z+jets, t
=125 GeV)H
Signal (m
Syst.Unc.
ATLAS
-1 -0.8 -0.6 -0.4 -0.2 0 0.2 0.4 0.6 0.8 1
Even
ts /
0.1
4
-110
1
10
210
310
410
Data 2012=1.0)mVH(bb) (
Dibosontt
Single topMultijetW+hfZ+hfUncertaintyPre-fit background
20´VH(bb)
ATLAS
-1
Ldt = 20.3 fbò = 8 TeV s
1 lep., 2 jets, 2 Tight tags
>120 GeVV
Tp
VHBDT
-1 -0.8 -0.6 -0.4 -0.2 0 0.2 0.4 0.6 0.8 1Data
/Pre
d
00.5
11.5
2
Figure 3. Left: The reconstructed mass of Higgs candidates, selected from the ATLAS data by requiring the presence of four
leptons (pairs of electrons or muons). The mass, reconstructed from the four leptons, is shown for the collision data (black
points), the simulated background expectation (red and purple filled histograms) and the simulated signal expectation (light
bluefilled histogram) for a SM Higgs with mH = 125 GeV.26 A significant excess (thirteen events from the billions recorded)
can be observered around a mass of 125 GeV which is consistent with a SM Higgs boson. Right: The output of a boosted
decision tree (BDT) trained to identify collision events where the Higgs decays to a pair of bottom quarks (solid red histogram)
against the multiple sources of background which can mimic the signal (other coloured histograms).27 A comparison between
the four lepton (left) and bottom-quark decay channels (right) illustrates the larger and much more complex background
processes which will need to be overcome in future studies. Bottom: A simulated event containing a top quark pair at an
average pile-up of 200 collisions per bunch crossing, illustrating the challenging conditions at the upgraded LHC. The
bottom-left inset is a2D r-z view of the interaction region. The vertical scale is2.5mm and thehorizontal one12cm. The tracks
coming from the tt̄ vertex of interest are coloured in cyan. Two secondary vertices can be reconstructed and the tracks coming
from them are highlighted in yellow.
particular challenge, as background processes generate bb̄ pairs 9 orders of magnitude more frequently than the Higgs signal.
Once this background is reduced, acomplex mixture of difficult-to-model background processes also needs to be suppressed as
demonstrated in Fig. 327 . These challenges will require another leap in our usage of Big Data techniques in terms of more
advanced machine learning algorithms, pattern recognition and data handling/storage/processing solutions.
3.4 Current highlight from the co-design of computer architectures and algorithms
The physical sciences are facing unprecedented challenges brought about by huge increases in data from experiments ranging
from theEuclid satellite observing thestructure of theUniverse, through Earth observations of climate, down to sub-nuclear
particle interactions at theLHC. By 2023, new experiments in astronomy, chemistry, physics, and material science areprojected
to increase these data holdings to over 1EB. High-performance computing (HPC) systems remain key to these fruitful data
exploitation efforts and, moreover, their scientific interpretation depends on simulations solving partial differential equations of
matching resolution and precision; both Archer (www. ar cher . ac. uk ) and DiRAC (www. di r ac. ac. uk ) are currently
producing more than 10PB of research data for this purpose, with next generation systems set to increase this by a factor of
7/17
Vast array of detectors
at CERN’s ATLAS
experiment > TeraByte
/ sec
LSST > 30 TeraBytes
/ night
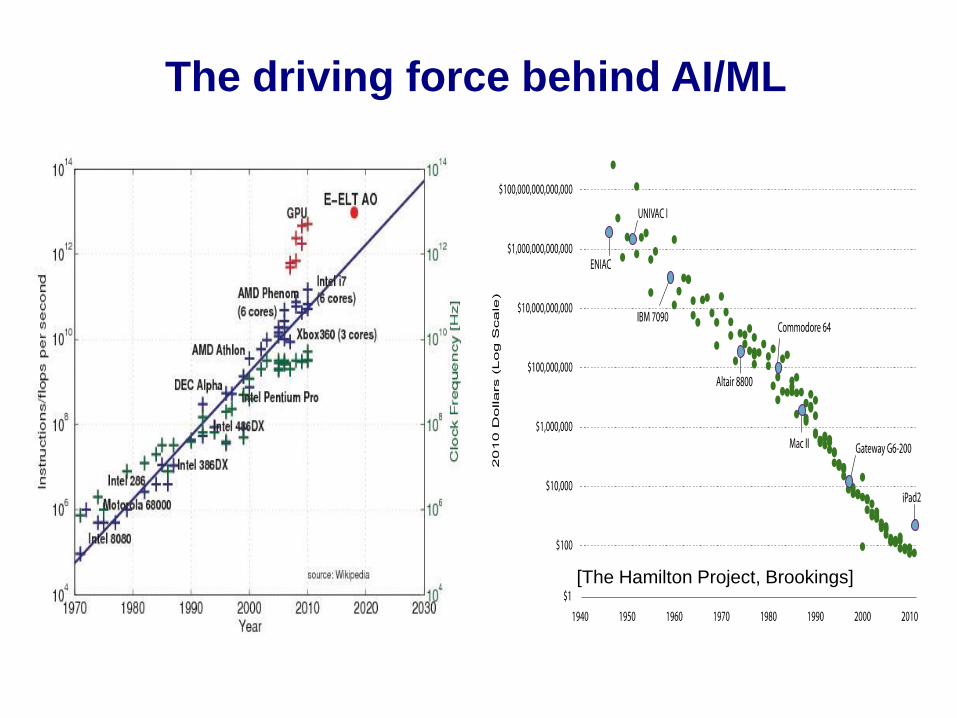
[The Hamilton Project, Brookings]
The driving force behind AI/ML
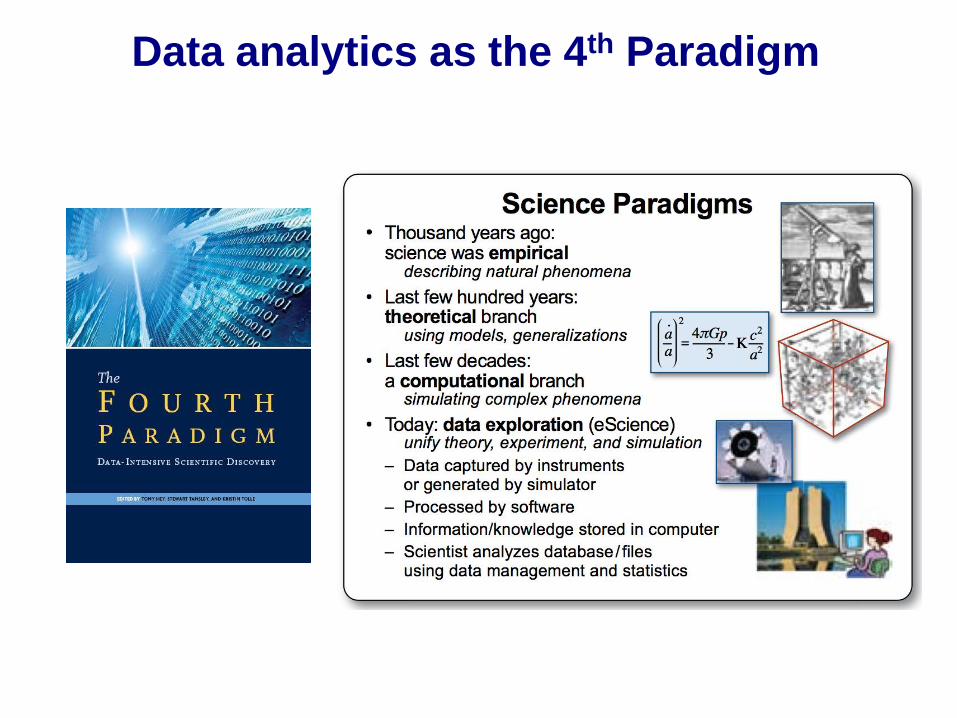
Data analytics as the 4th Paradigm
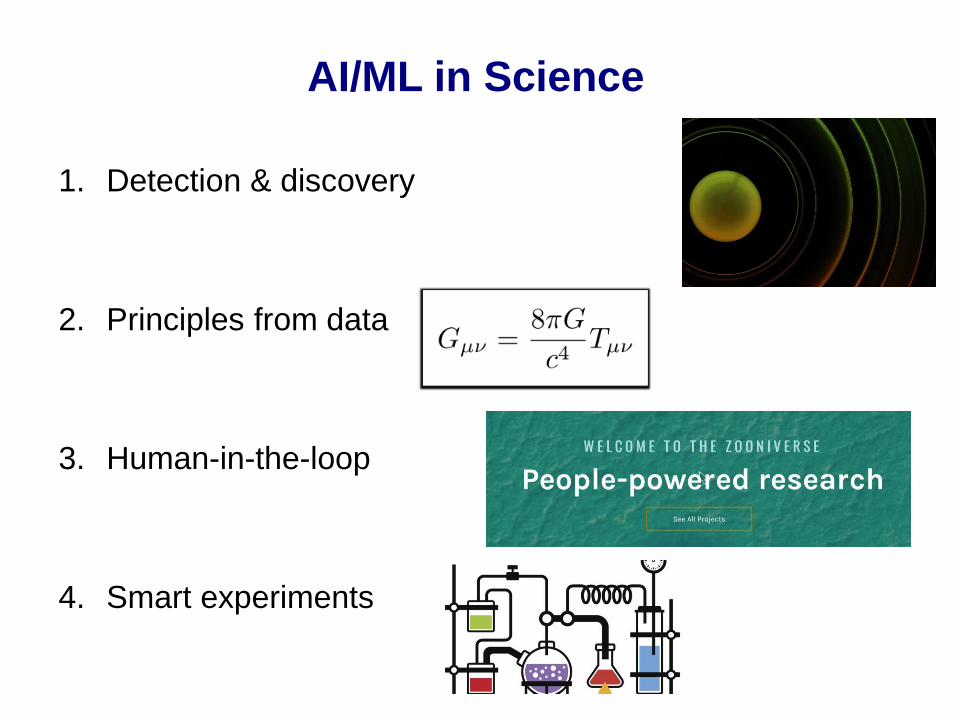
AI/ML in Science
1. Detection & discovery
2. Principles from data
3. Human-in-the-loop
4. Smart experiments
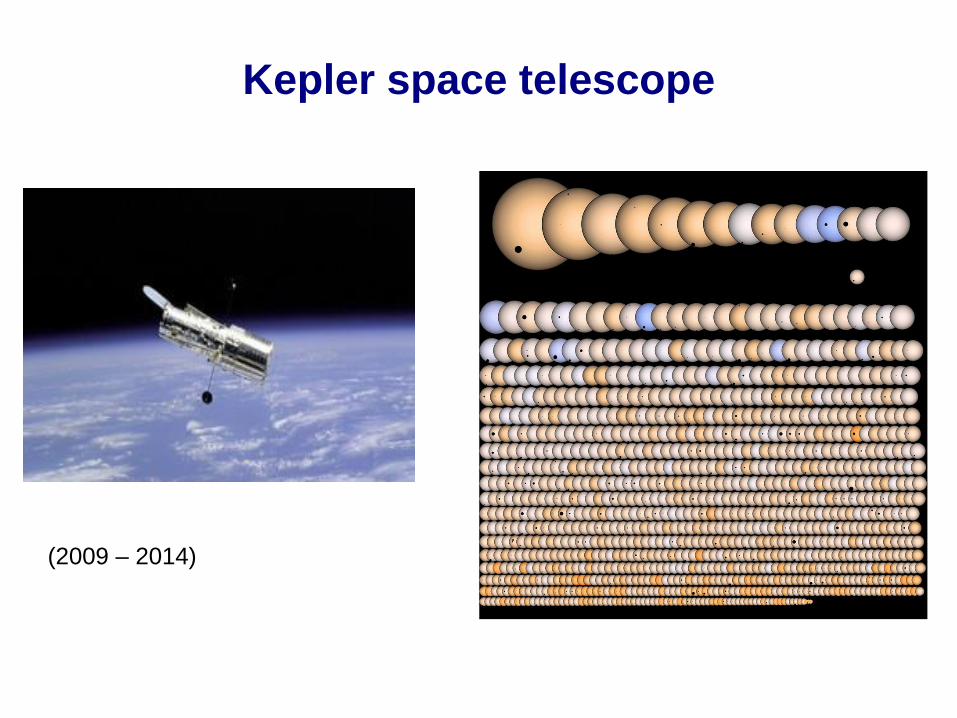
Kepler space telescope
(2009 – 2014)
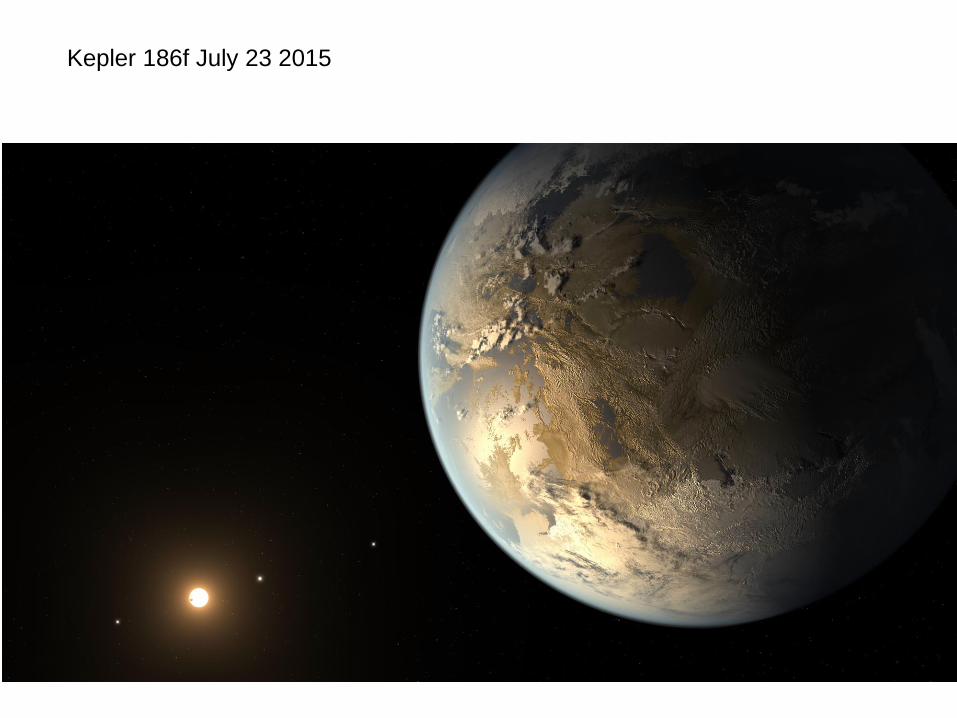
Kepler 186f July 23 2015
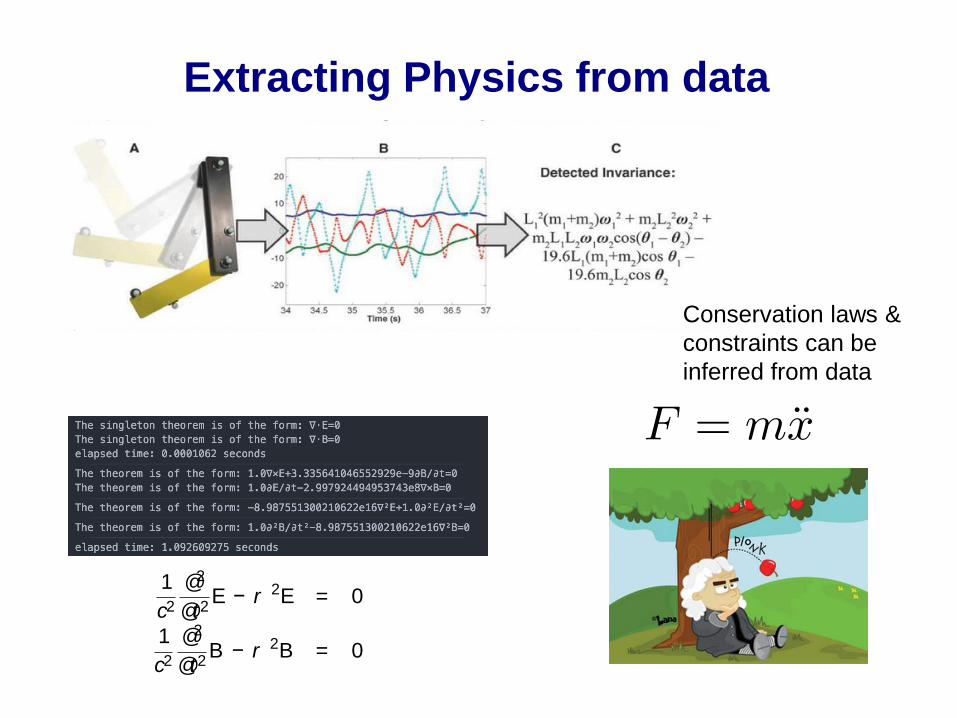
Extracting Physics from data
Conservation laws &
constraints can be
inferred from data
the same scale. After scaling and normalizing, we use Julia’s built -in svdvals() funct ion to obtain
a list of SVs ranked from the largest to the smallest .
As discussed previously, the dimension of the null space can either be 1 or 0, and we only need
to compare the smallest SV with the largest one to see whether the former is orders of magnitude
smaller than the lat ter. If so, we can regard that as a zero, and proceed to ret rieve the null space
vector from the last column of V T (as in A = U⌃V T ) by calling Julia’s svd() funct ion. The
elements of the null space vector are the constants we look for. If not , it implies that the dimension
of the null space is zero, and we conclude that the theory is invalid.
5 Result s
Figure 3: Screenshot of TheoSea’s output showing the Maxwell Equat ions and the wave equat ions
of light including the speed of light c ⇡ 2.99⇥108.
TheoSea has rediscovered theMaxwell Equat ionsasshown in thescreenshot Fig. 3, with t imings.
In addit ion, it redisovered
1
c2
@2
@t2E − r 2E = 0 (7)
1
c2
@2
@t2B − r 2B = 0 (8)
that is a plane electromagnet ic wave traveling in free space: Light.45
6 Concluding Remarks and Fut ure Work
There are many avenues for future development as briefly listed below.
• Generalize the language. Expand the enumerat ion language to allow more expressive theo-
ries. Right now TheoSea is limited to theories of the form c1A1 + c2A2 + . . . where the As
are operators over fields like E , B . The Xu ideal gas law code works with scalar fields and
exponents. Somehow these should be merged.
4The derivat ion of these wave equat ions from the Maxwell Equat ions takes humanssomenon-t rivial vector calculus,
and yet the machine did it by “ enlightened” search.5This machine was a MacBook Pro (Ret ina, 15-inch) running a 2.5 Ghz Intel Core i7 single-threaded.
6
the same scale. After scaling and normalizing, we use Julia’s built -in svdvals() funct ion to obtain
a list of SVs ranked from the largest to the smallest .
As discussed previously, the dimension of the null space can either be 1 or 0, and we only need
to compare the smallest SV with the largest one to see whether the former is orders of magnitude
smaller than the lat ter. If so, we can regard that as a zero, and proceed to ret rieve the null space
vector from the last column of V T (as in A = U⌃V T ) by calling Julia’s svd() funct ion. The
elements of the null space vector are the constants we look for. If not , it implies that the dimension
of the null space is zero, and we conclude that the theory is invalid.
5 Result s
Figure 3: Screenshot of TheoSea’s output showing the Maxwell Equat ions and the wave equat ions
of light including the speed of light c ⇡ 2.99⇥108.
TheoSea has rediscovered theMaxwell Equat ionsasshown in thescreenshot Fig. 3, with t imings.
In addit ion, it redisovered
1
c2
@2
@t2E − r 2E = 0 (7)
1
c2
@2
@t2B − r 2B = 0 (8)
that is a plane elect romagnet ic wave t raveling in free space: Light.45
6 Concluding Remarks and Fut ure Work
There are many avenues for future development as briefly listed below.
• Generalize the language. Expand the enumerat ion language to allow more expressive theo-
ries. Right now TheoSea is limited to theories of the form c1A1 + c2A2 + . . . where the As
are operators over fields like E, B . The Xu ideal gas law code works with scalar fields and
exponents. Somehow these should be merged.
4Thederivat ion of thesewave equat ions from theMaxwell Equat ions takeshumanssome non-t rivial vector calculus,
and yet the machine did it by “ enlightened” search.5This machine was a MacBook Pro (Ret ina, 15-inch) running a 2.5 Ghz Intel Core i7 single-threaded.
6
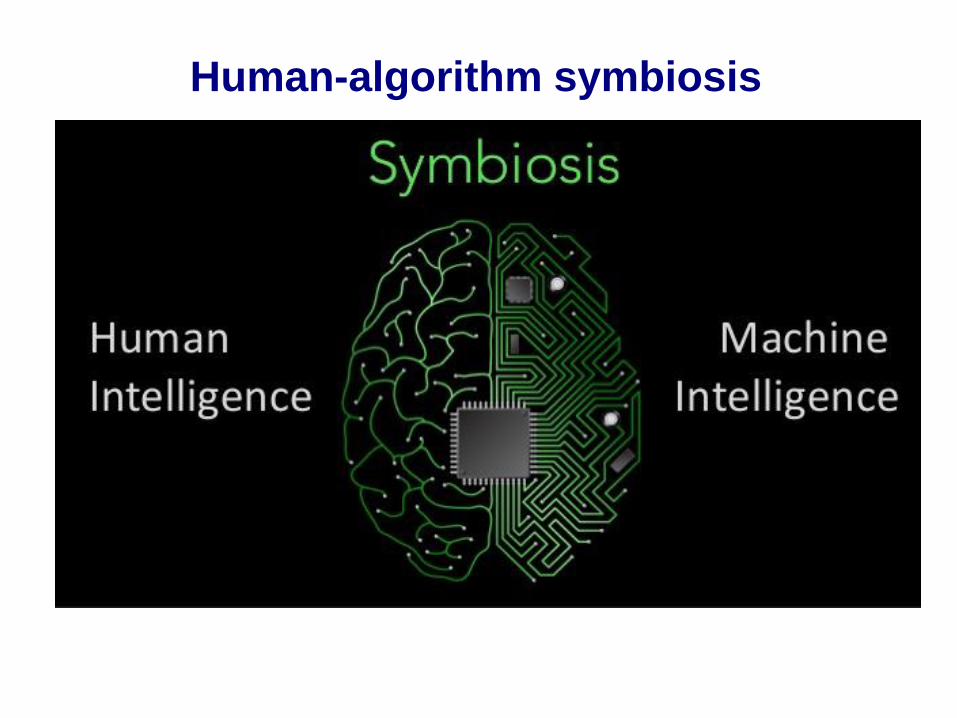
Human-algorithm symbiosis
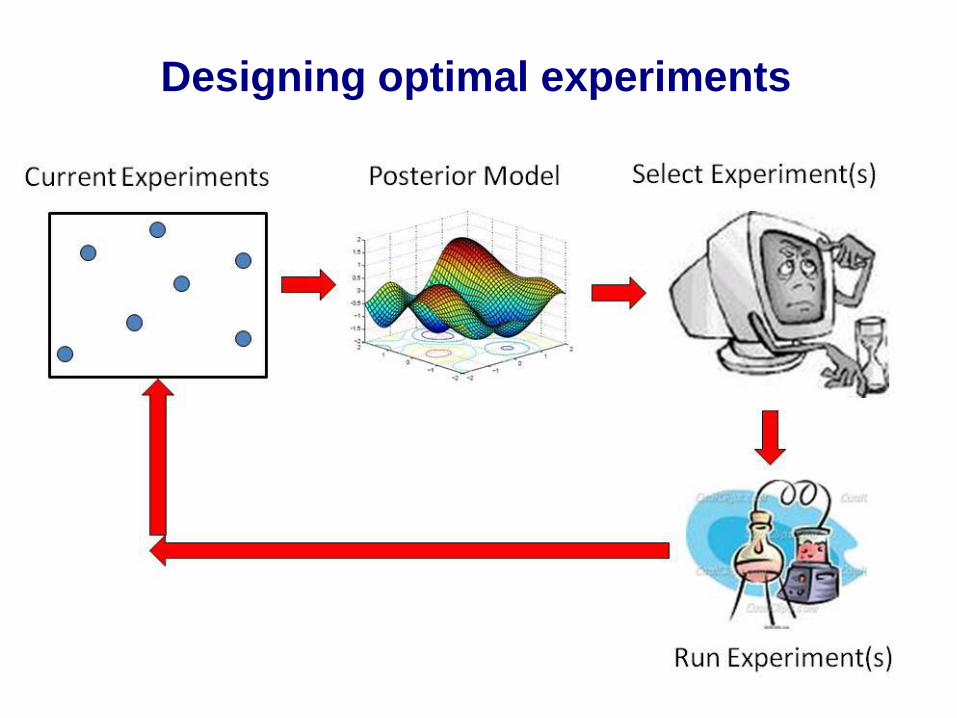
Designing optimal experiments

So – where are we going?
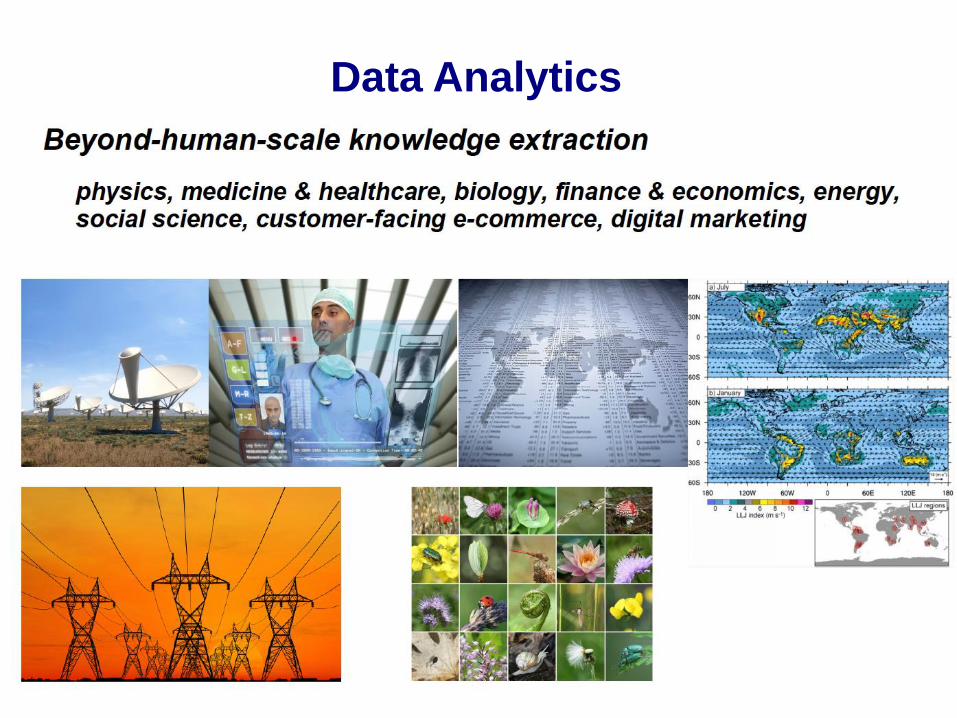
Data Analytics
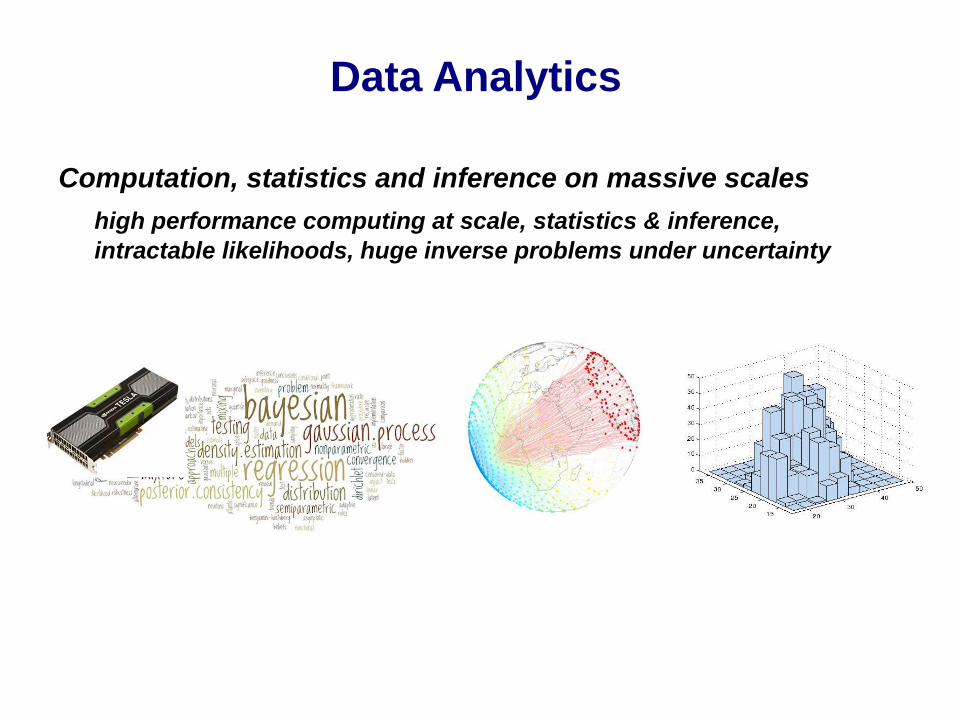
Computation, statistics and inference on massive scales
high performance computing at scale, statistics & inference,
intractable likelihoods, huge inverse problems under uncertainty
Data Analytics
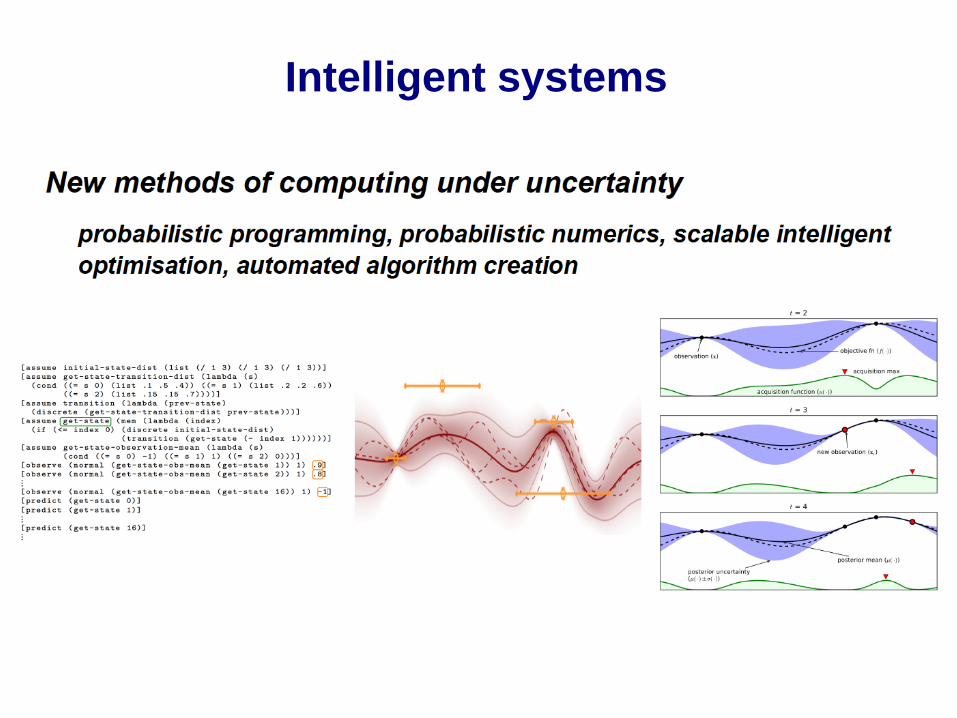
Intelligent systems
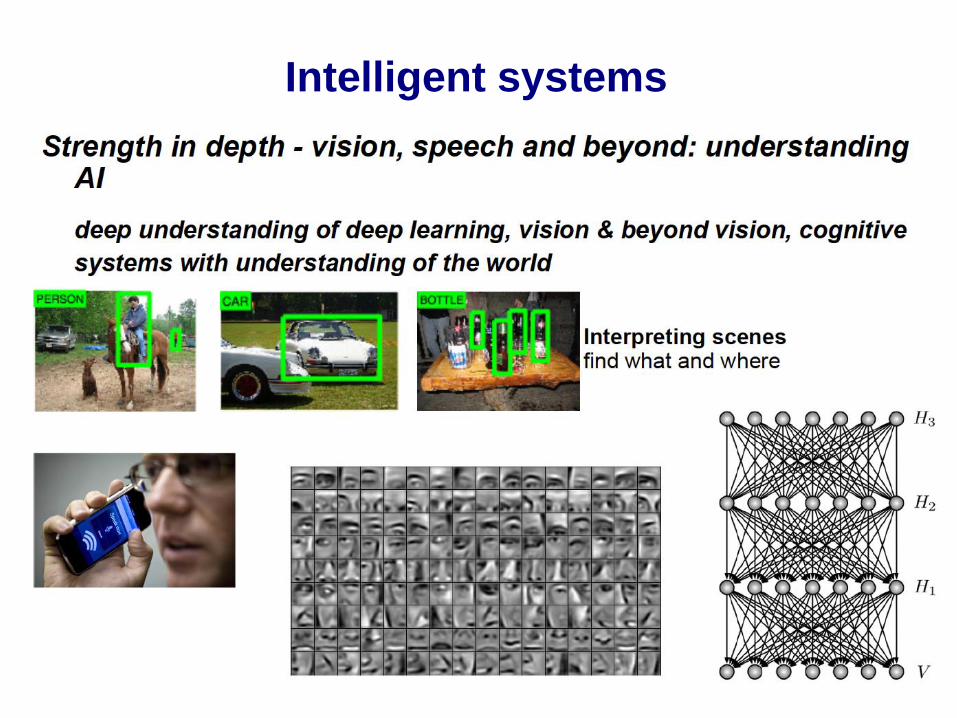
Intelligent systems
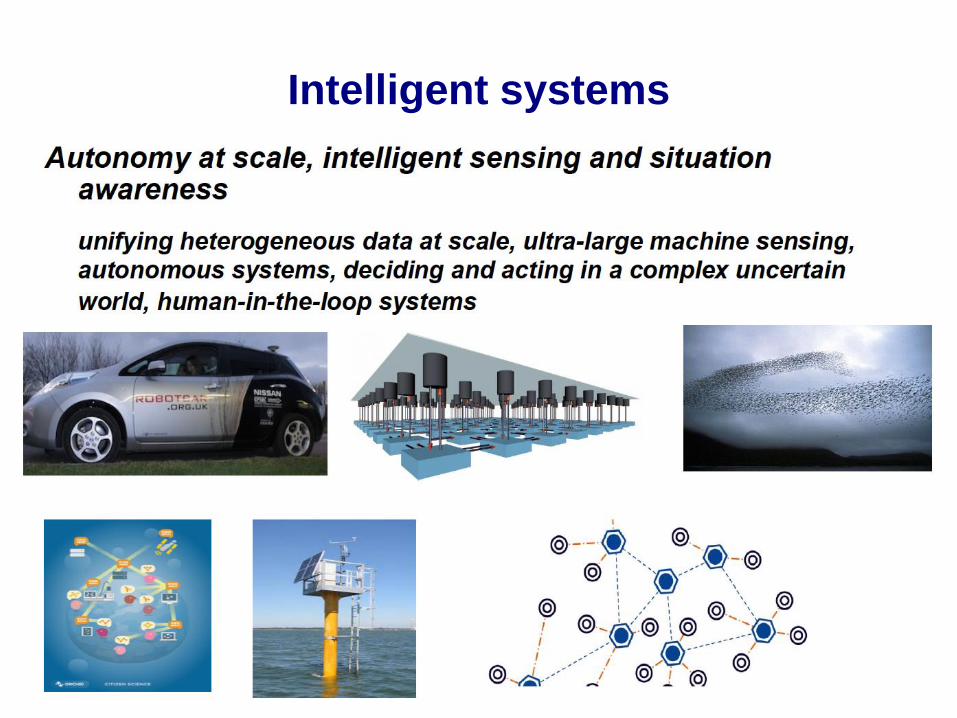
Intelligent systems
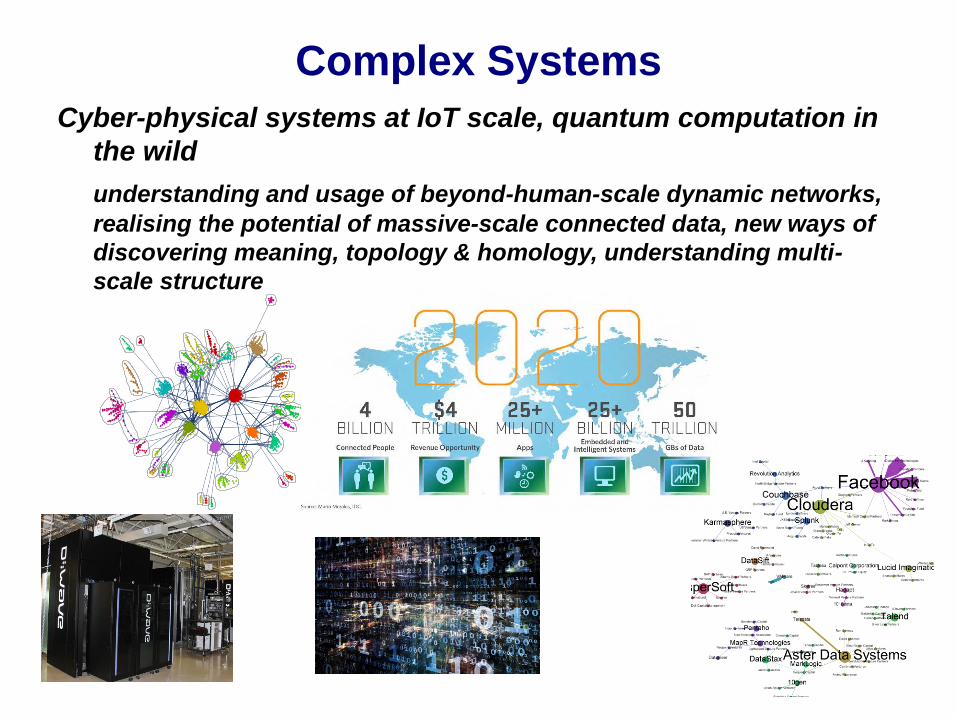
Cyber-physical systems at IoT scale, quantum computation in
the wild
understanding and usage of beyond-human-scale dynamic networks,
realising the potential of massive-scale connected data, new ways of
discovering meaning, topology & homology, understanding multi-
scale structure
Complex Systems
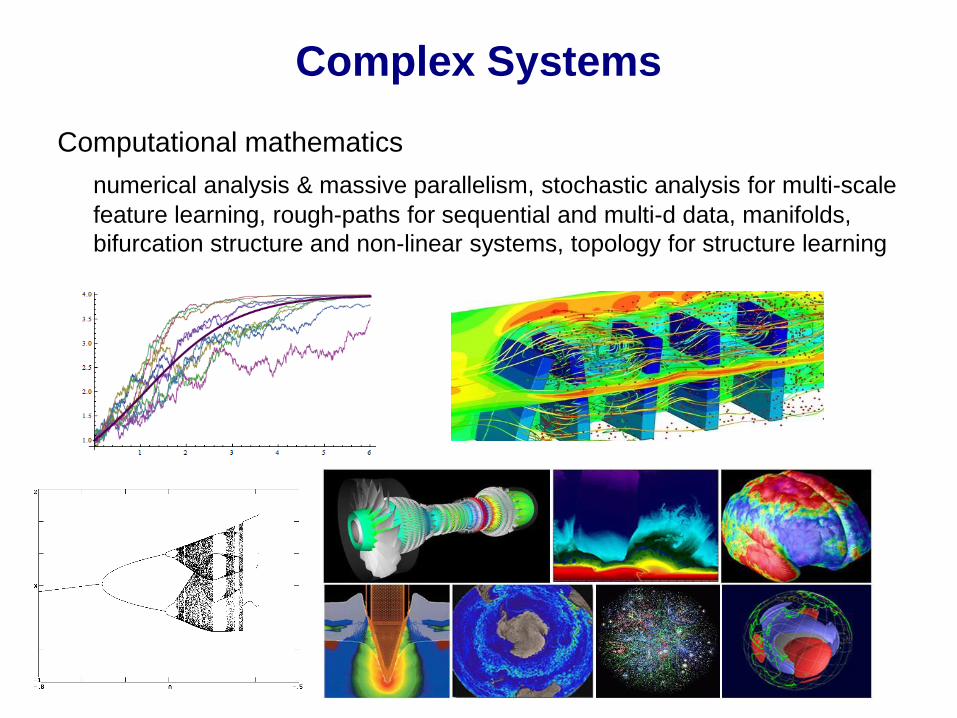
Computational mathematics
numerical analysis & massive parallelism, stochastic analysis for multi-scale
feature learning, rough-paths for sequential and multi-d data, manifolds,
bifurcation structure and non-linear systems, topology for structure learning
Complex Systems
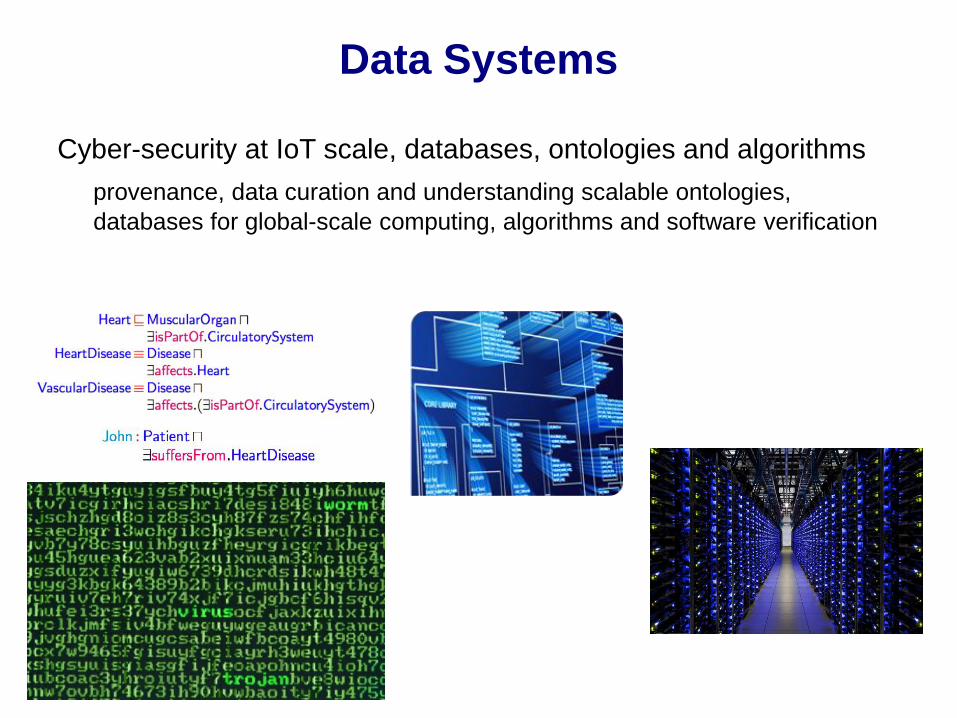
Cyber-security at IoT scale, databases, ontologies and algorithms
provenance, data curation and understanding scalable ontologies,
databases for global-scale computing, algorithms and software verification
Data Systems
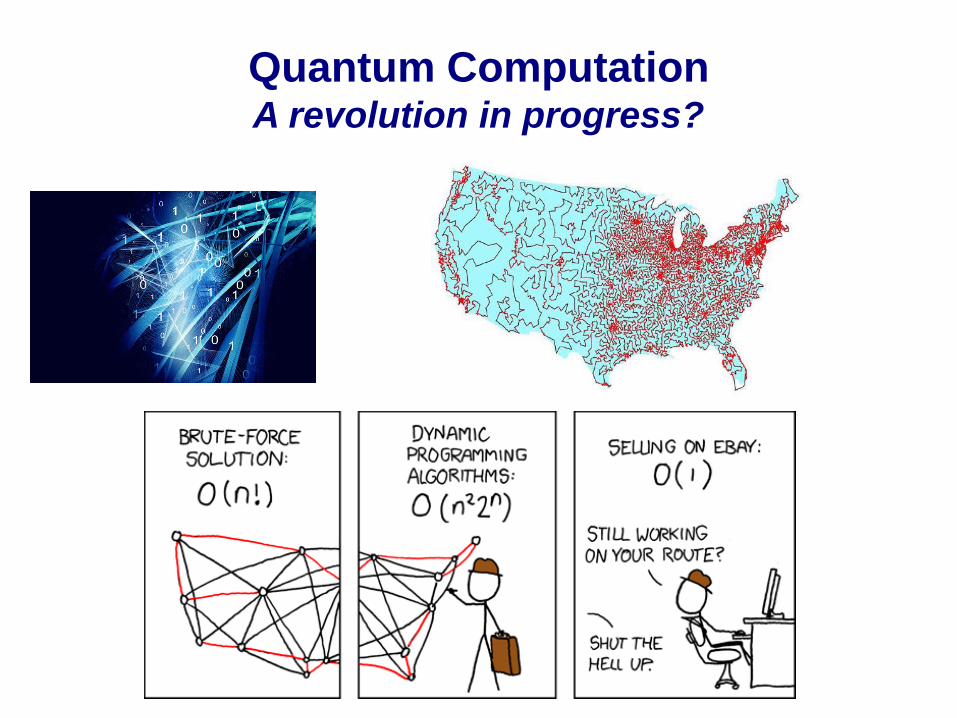
Quantum Computation A revolution in progress?
Scalability features large across domains, from inference to algorithms, from
stochastics to numerics, in application from astronomy to zoology, from e-
health to finance, social data & e-commerce
Creating and verifying systems that decide and act autonomously,
intelligently fusing heterogeneous data and coping with scale, complexity
and uncertainty.
We have the opportunity to catalyse new ways of computing, from quantum
systems to probabilistic programming.
We must be thought leaders in the ethics of information and data analytics –
ethics must be a centrally embedded research stream – not a service or
afterthought.
The Challenges
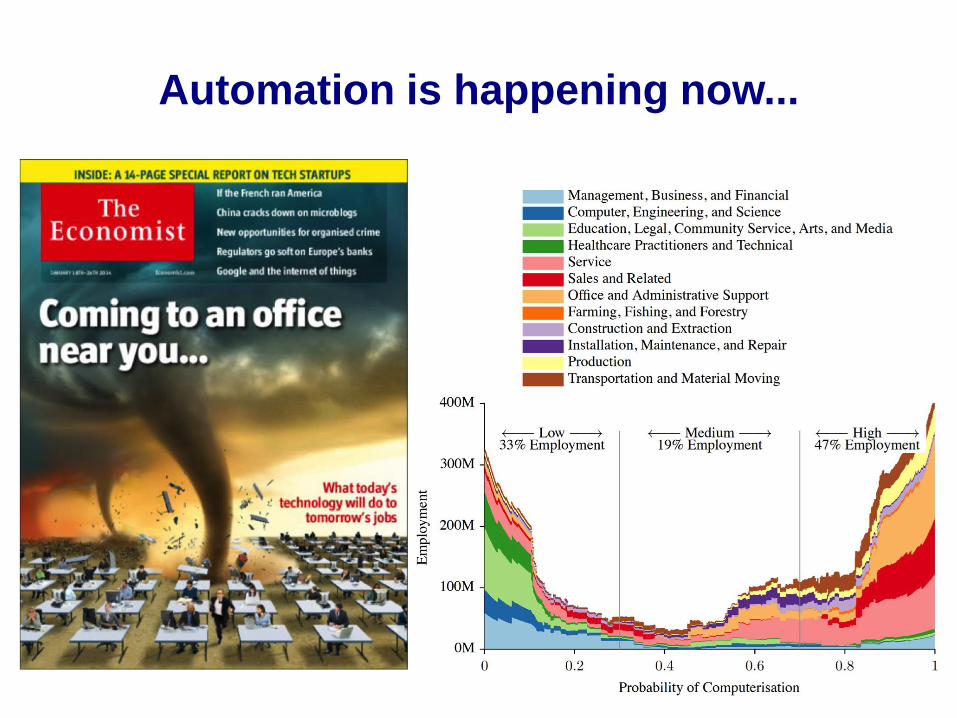
Automation is happening now...
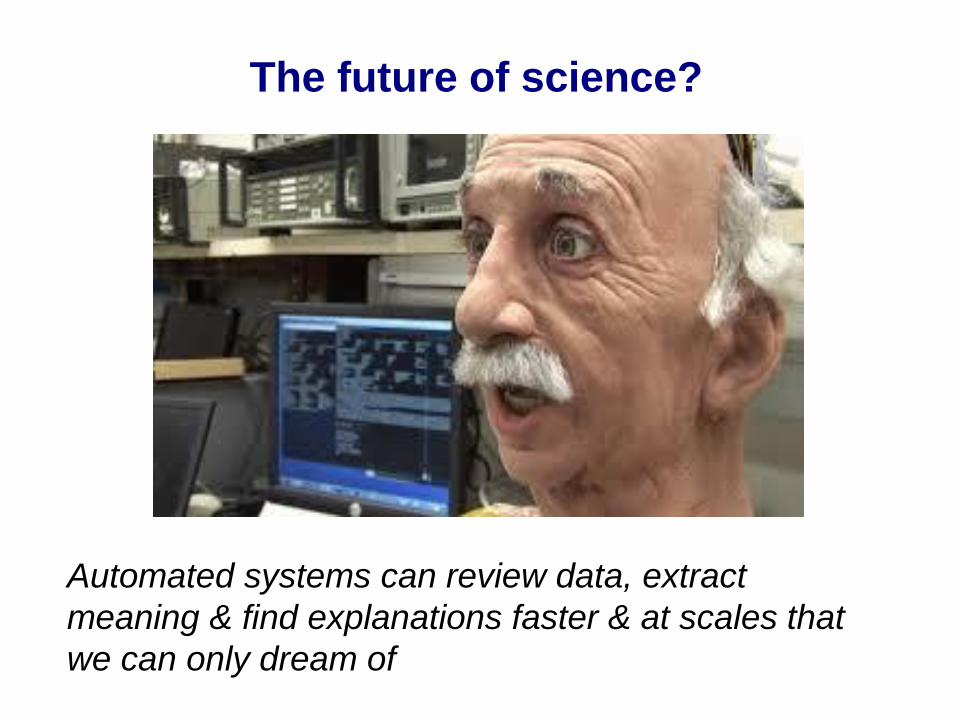
The future of science?
Automated systems can review data, extract
meaning & find explanations faster & at scales that
we can only dream of
The era of human science has ended.
The era of the Automated Scientist
has begun.
With particular thanks to
Mike Osborne, Suzanne Aigrain, Aris Karastergiou, Chris Lintott,
Matt Jarvis, Edwin Simpson, Steve Reece
and, of course, the algorithm...