Embed Size (px)
Citation preview
Texas House Human Services Committee
December 15, 2015
Austin, Texas
The Aging Population in Texas
@TexasDemography
0.00
5.00
10.00
15.00
20.00
25.00
30.00
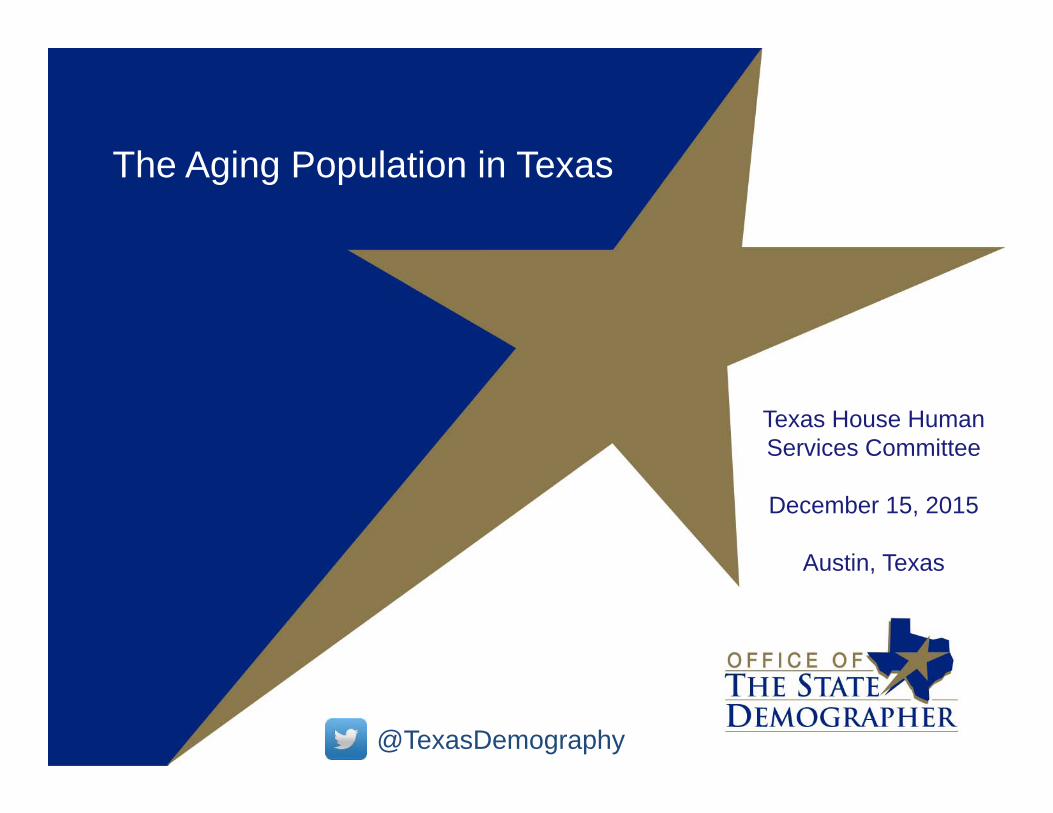
1950 1960 1970 1980 1990 2000 2010 2012 2013 2014
Numeric Change (Millions) Population (Millions)
2All values for the decennial dates are for April 1st of the indicated census year. Values for 2012-2014 are for July 1 as estimated by the U.S. Census Bureau.
Total Population and Components of Population Change in Texas, 1950‐2014
Source: U.S. Census Bureau, Census Counts and Population Estimates
Dallas
Howard
FoardFloyd
B r e w s t e r
FranklinHunt
Newton
S t a r r
Kinney
Collingsworth
TomGreen
Coleman
Brazoria
Leon
Duval
Lamb
Morris
Smith
Jackson
Medina
Wheeler
Dallam
Callahan
Lamar
Coryell
Gaines
Kendall
Nacogdoches
Milam
Hays
Willacy
Johnson
Reagan
W e b b
Shackelford
Bowie
Scurry
Kenedy
Somervell
O l d h a m
Taylor
K ing
Borden
Walker
Stephens
Deaf Smith
Roberts
Tyler
Va l Ve r d e
Brown
Parker
H a r r i s
Zapata
R e dR i v e r
Karnes
P a l oP in to
Glasscock Shelby
Crosby
Refugio
Burnet
Sterling
Montgomery
Rains
Nueces
Jack
Swisher
Camp
Orange
Colorado
P e c o s
Cochran
Parmer
FreestoneWinkler
Wichita
Gray
Schleicher
Hardeman
TravisGillespie
Yoakum
Fayette
Uvalde
Grimes
VanZandt
Throckmorton
Falls
Grayson
E l l i s
H a l l
Dickens
Trinity
R e e v e s
Marion
Te r r e l l
Lynn
La Salle
Jasper
Jones
Castro
Victoria
Kleberg
Briscoe
Clay
Matagorda
Brooks
Runnels
Carson
Liberty
Lee
Hale
Bexar
Garza
Montague
UptonHamilton
FisherDawson
Dimmit
Limestone
Hutchinson
Llano
P r e s i d i o
Eastland
Sabine
Wharton
Rusk
Tarrant
Childress
Hidalgo
Kaufman
Moore
Menard
E d w a r d s
San Patricio
Terry
Cro c k e t t
Houston
Waller
Coke
W a r d
Lampasas
Haskell
Martin
Atascosa
HemphillH a r t l e y
Young
Burleson
Hardin
Gonzales
McMullen
Erath
Galveston
Hopkins
McLennan
MadisonMcCulloch
Donley
Kent
Real
S u t t o n
Midland
H u d s p e t h
Zavala
Harrison
Comanche
Mitchell
Navarro
Crane
Lubbock
Wise
Washington
J e f f D a v i s
El Paso
Gregg
Williamson
Lipscomb
Mason
Henderson
Hansford
Chambers
Hill
Potter
JimWells
Delta
Stonewall
Ector
Cameron
Maverick
Collin
Baylor
Panola
Guadalupe
Bastrop
Austin
Andrews
Blanco
DeWitt
Bandera
Bell
Aransas
Archer
Armstrong
Bee
Angelina
Bailey
Jefferson
F r i o
Fannin
Goliad
Loving
Cass
Fort Bend
Bosque
Hockley
SanSaba
K e r r
Mills
Cooke
Wilbarger
I r i o n
Caldwell
J imHogg
Culberson
Upshur
Cherokee
Denton
Concho
Randall
K i m b l e
Knox
P o l k
Hood
San Jacinto
Robertson
Wilson
Nolan
Cottle
Calhoun
Rockwall
LiveOak
Motley
ShermanOchiltree
Comal
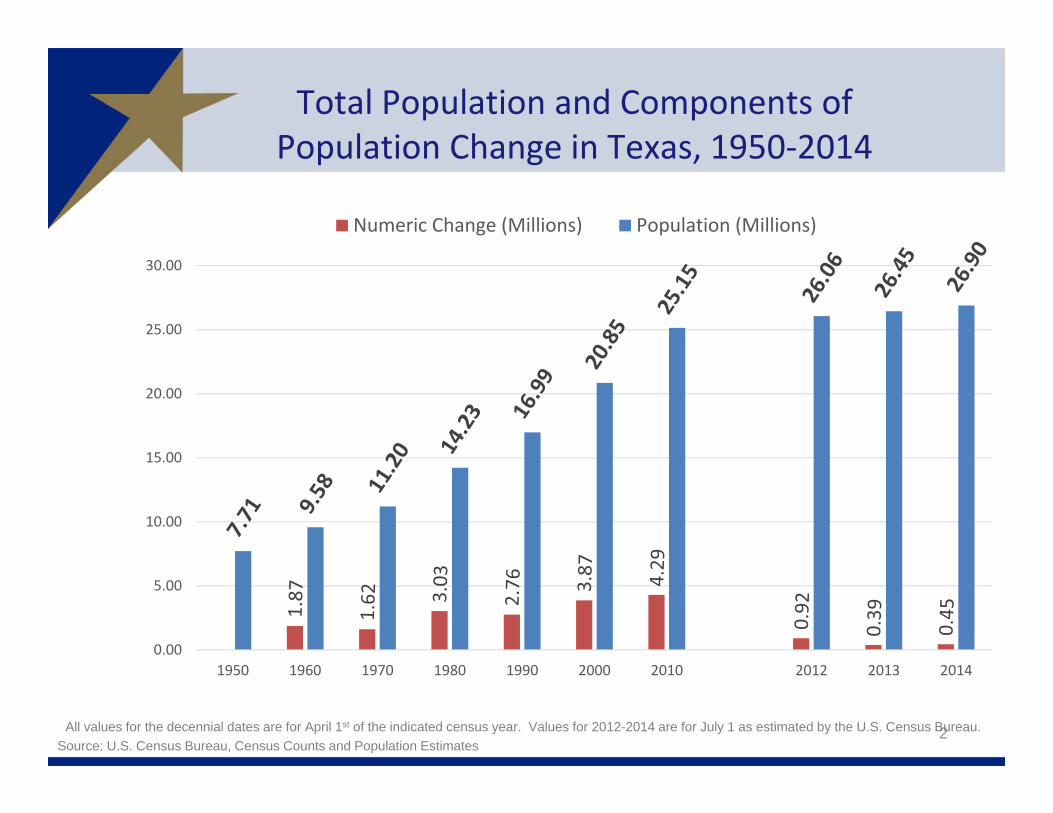
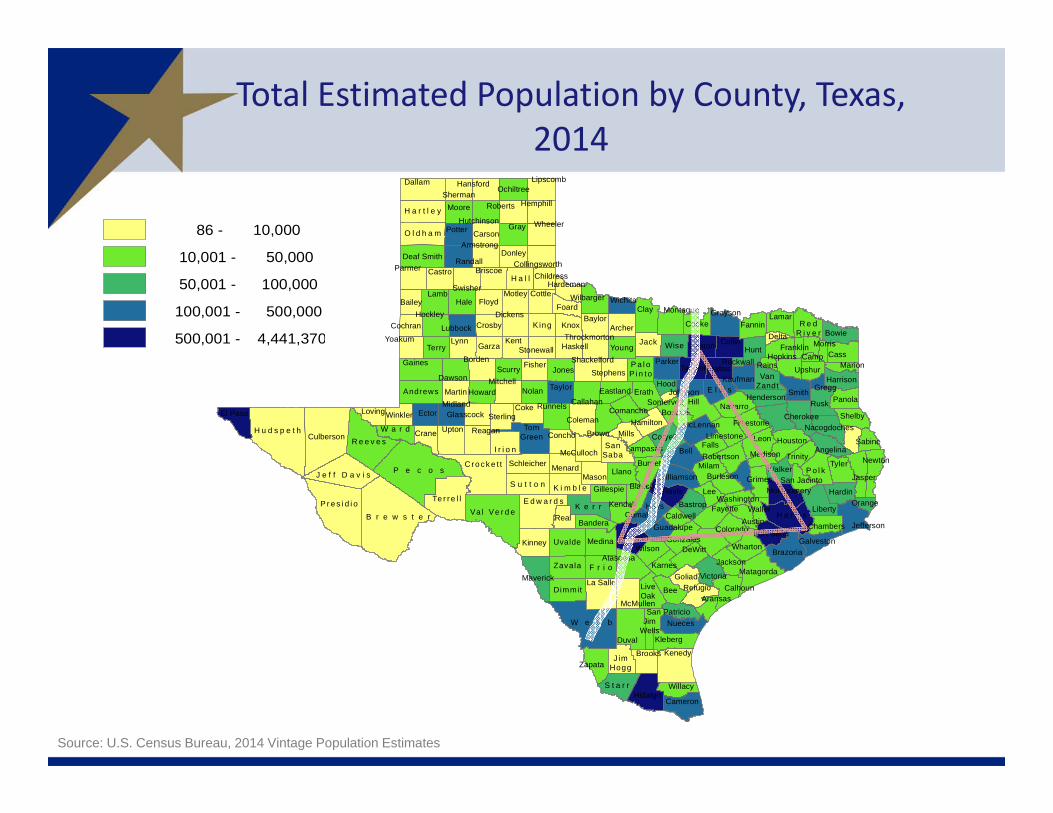
Total Estimated Population by County, Texas, 2014
Source: U.S. Census Bureau, 2014 Vintage Population Estimates
86 - 10,000
10,001 - 50,000
50,001 - 100,000
100,001 - 500,000
500,001 - 4,441,370
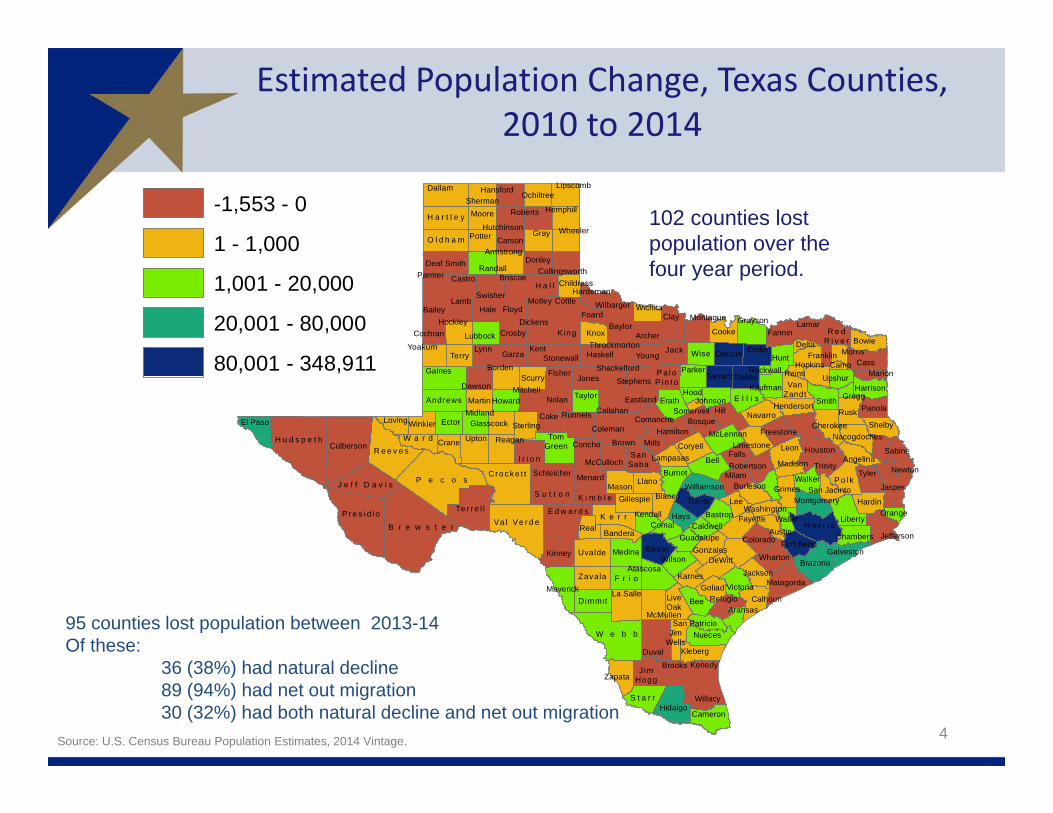
Estimated Population Change, Texas Counties, 2010 to 2014
4Source: U.S. Census Bureau Population Estimates, 2014 Vintage.
102 counties lost population over the four year period.
Dallas
Howard
FoardFloyd
B r e w s t e r
FranklinHunt
Newton
S t a r r
Kinney
Collingsworth
TomGreen
Coleman
Brazoria
Leon
Duval
Lamb
Morris
Smith
Jackson
Medina
Wheeler
Dallam
Callahan
Lamar
Coryell
Gaines
Kendall
Nacogdoches
Milam
Hays
Willacy
Johnson
Reagan
W e b b
Shackelford
Bowie
Scurry
Kenedy
Somervell
O l d h a m
Taylor
K ing
Borden
Walker
Stephens
Deaf Smith
Roberts
Tyler
Va l Ve r d e
Brown
Parker
H a r r i s
Zapata
R e dR i v e r
Karnes
P a l oP in t o
Glasscock Shelby
Crosby
Refugio
Burnet
Sterling
Montgomery
Rains
Nueces
Jack
Swisher
Camp
Orange
Colorado
P e c o s
Cochran
Parmer
FreestoneWinkler
Wichita
Gray
Schleicher
Hardeman
TravisGillespie
Yoakum
Fayette
Uvalde
Grimes
VanZandt
Throckmorton
Falls
Grayson
E l l i s
H a l l
Dickens
Trinity
R e e v e s
Marion
Te r r e l l
Lynn
La Salle
Jasper
Jones
Castro
Victoria
Kleberg
Briscoe
Clay
Matagorda
Brooks
Runnels
Carson
Liberty
Lee
Hale
Bexar
Garza
Montague
UptonHamilton
FisherDawson
Dimmit
Limestone
Hutchinson
Llano
P r e s i d i o
Eastland
Sabine
Wharton
Rusk
Tarrant
Childress
Hidalgo
Kaufman
Moore
Menard
E d w a r d s
San Patricio
Terry
Cro c k e t t
Houston
Waller
Coke
W a r d
Lampasas
Haskell
Martin
Atascosa
HemphillH a r t l e y
Young
Burleson
Hardin
Gonzales
McMullen
Erath
Galveston
Hopkins
McLennan
MadisonMcCulloch
Donley
Kent
Real
S u t t o n
Midland
H u d s p e t h
Zavala
Harrison
Comanche
Mitchell
Navarro
Crane
Lubbock
Wise
Washington
J e f f D a v i s
El Paso
Gregg
Williamson
Lipscomb
Mason
Henderson
Hansford
Chambers
Hill
Potter
JimWells
Delta
Stonewall
Ector
Cameron
Maverick
Collin
Baylor
Panola
Guadalupe
Bastrop
Austin
Andrews
Blanco
DeWitt
Bandera
Bell
Aransas
Archer
Armstrong
Bee
Angelina
Bailey
Jefferson
F r i o
Fannin
Goliad
Loving
Cass
Fort Bend
Bosque
Hockley
SanSaba
K e r r
Mills
Cooke
Wilbarger
I r i o n
Caldwell
J imHogg
Culberson
Upshur
Cherokee
Denton
Concho
Randall
K i m b l e
Knox
P o l k
Hood
San Jacinto
Robertson
Wilson
Nolan
Cottle
Calhoun
Rockwall
LiveOak
Motley
ShermanOchiltree
Comal
-1,553 - 0
1 - 1,000
1,001 - 20,000
20,001 - 80,000
80,001 - 348,911
95 counties lost population between 2013-14Of these:
36 (38%) had natural decline89 (94%) had net out migration30 (32%) had both natural decline and net out migration
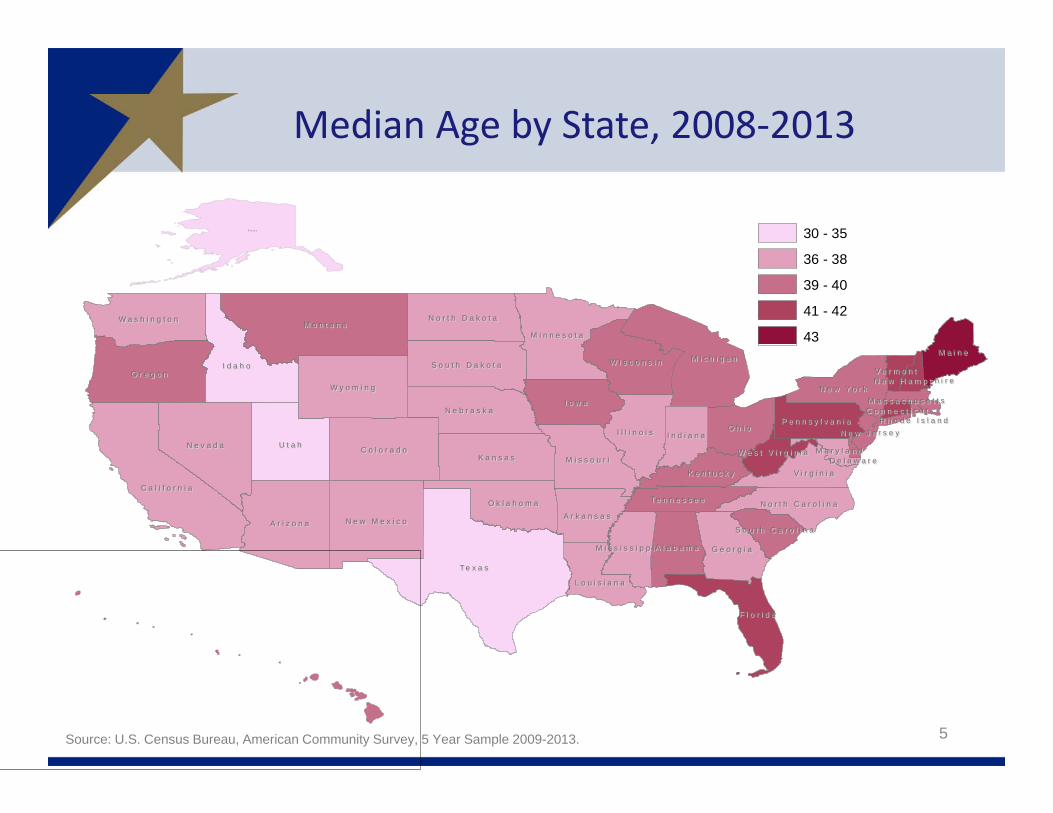
Median Age by State, 2008‐2013
Te x a sTe x a s
M o n t a n aM o n t a n a
U t a hU t a h
I d a h oI d a h o
C a l i f o r n i aC a l i f o r n i a
N e v a d aN e v a d a
O r e g o nO r e g o n
A r i z o n aA r i z o n a
I o w aI o w a
M i c h i g a nM i c h i g a n
W y o m i n gW y o m i n g
C o l o r a d oC o l o r a d oK a n s a sK a n s a s
O h i oO h i o
N e w M e x i c oN e w M e x i c o
M i n n e s o t aM i n n e s o t a
N e b r a s k aN e b r a s k a
I l l i n o i sI l l i n o i s
M i s s o u r iM i s s o u r i
W a s h i n g t o nW a s h i n g t o n
W i s c o n s i nW i s c o n s i n
G e o r g i aG e o r g i a
O k l a h o m aO k l a h o m a
M a i n eM a i n e
N e w Y o r kN e w Y o r k
S o u t h D a k o t aS o u t h D a k o t a
N o r t h D a k o t aN o r t h D a k o t a
A l a b a m aA l a b a m a
A r k a n s a sA r k a n s a s
V i r g i n i aV i r g i n i a
I n d i a n aI n d i a n a
L o u i s i a n aL o u i s i a n a
K e n t u c k yK e n t u c k y
Te n n e s s e eTe n n e s s e e
P e n n s y l v a n i aP e n n s y l v a n i a
N o r t h C a r o l i n aN o r t h C a r o l i n a
F l o r i d aF l o r i d a
M i s s i s s i p p iM i s s i s s i p p i
S o u t h C a r o l i n aS o u t h C a r o l i n a
W e s t V i r g i n i aW e s t V i r g i n i a M a r y l a n dM a r y l a n d
V e r m o n tV e r m o n t
N e w J e r s e yN e w J e r s e y
M a s s a c h u s e t t sM a s s a c h u s e t t s
N e w H a m p s h i r eN e w H a m p s h i r e
C o n n e c t i c u tC o n n e c t i c u t
D e l a w a r eD e l a w a r e
R h o d e I s l a n dR h o d e I s l a n d
5
A l a s k aA l a s k a 30 - 35
36 - 38
39 - 40
41 - 42
43
Source: U.S. Census Bureau, American Community Survey, 5 Year Sample 2009-2013.
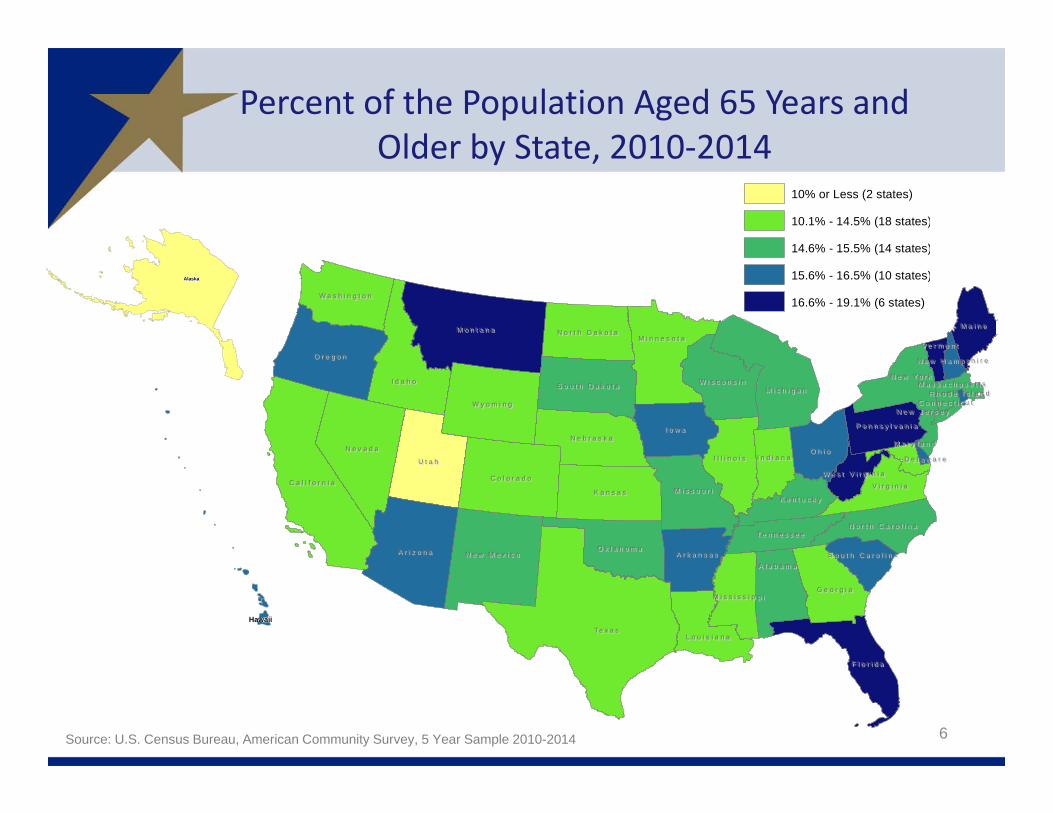
Percent of the Population Aged 65 Years and Older by State, 2010‐2014
6Source: U.S. Census Bureau, American Community Survey, 5 Year Sample 2010-2014
Alaska
Hawaii
W e s t V i r g i n i aW e s t V i r g i n i a
F l o r i d aF l o r i d a
I l l i n o i sI l l i n o i s
M i n n e s o t aM i n n e s o t a
M a r y l a n dM a r y l a n d
R h o d e I s l a n dR h o d e I s l a n dI d a h oI d a h o
N e w H a m p s h i r eN e w H a m p s h i r e
N o r t h C a r o l i n aN o r t h C a r o l i n a
V e r m o n tV e r m o n t
C o n n e c t i c u tC o n n e c t i c u t
D e l a w a r eD e l a w a r e
N e w M e x i c oN e w M e x i c o
C a l i f o r n i aC a l i f o r n i a
N e w J e r s e yN e w J e r s e y
W i s c o n s i nW i s c o n s i n
O r e g o nO r e g o n
N e b r a s k aN e b r a s k aP e n n s y l v a n i aP e n n s y l v a n i a
W a s h i n g t o nW a s h i n g t o n
L o u i s i a n aL o u i s i a n a
G e o r g i aG e o r g i a
A l a b a m aA l a b a m a
U t a hU t a hO h i oO h i o
Te x a sTe x a s
C o l o r a d oC o l o r a d o
S o u t h C a r o l i n aS o u t h C a r o l i n aO k l a h o m aO k l a h o m a
Te n n e s s e eTe n n e s s e e
W y o m i n gW y o m i n g
N o r t h D a k o t aN o r t h D a k o t a
K e n t u c k yK e n t u c k y
M a i n eM a i n e
N e w Y o r kN e w Y o r k
N e v a d aN e v a d a
M i c h i g a nM i c h i g a n
A r k a n s a sA r k a n s a s
M i s s i s s i p p iM i s s i s s i p p i
M i s s o u r iM i s s o u r i
M o n t a n aM o n t a n a
K a n s a sK a n s a s
I n d i a n aI n d i a n a
S o u t h D a k o t aS o u t h D a k o t a M a s s a c h u s e t t sM a s s a c h u s e t t s
V i r g i n i aV i r g i n i a
I o w aI o w a
A r i z o n aA r i z o n a
10% or Less (2 states)
10.1% - 14.5% (18 states)
14.6% - 15.5% (14 states)
15.6% - 16.5% (10 states)
16.6% - 19.1% (6 states)
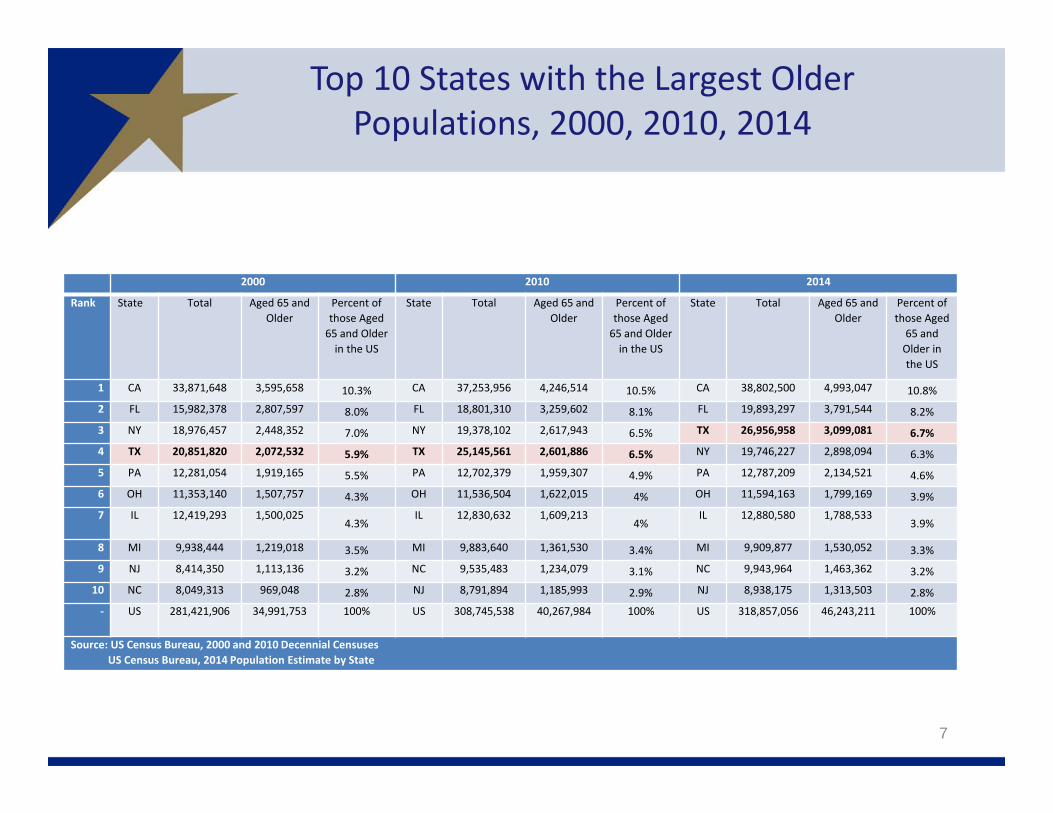
Top 10 States with the Largest Older Populations, 2000, 2010, 2014
2000 2010 2014
Rank State Total Aged 65 and Older
Percent of those Aged 65 and Older in the US
State Total Aged 65 and Older
Percent of those Aged 65 and Older in the US
State Total Aged 65 and Older
Percent of those Aged 65 and Older in the US
1 CA 33,871,648 3,595,658 10.3% CA 37,253,956 4,246,514 10.5% CA 38,802,500 4,993,047 10.8%2 FL 15,982,378 2,807,597 8.0% FL 18,801,310 3,259,602 8.1% FL 19,893,297 3,791,544 8.2%3 NY 18,976,457 2,448,352 7.0% NY 19,378,102 2,617,943 6.5% TX 26,956,958 3,099,081 6.7%4 TX 20,851,820 2,072,532 5.9% TX 25,145,561 2,601,886 6.5% NY 19,746,227 2,898,094 6.3%5 PA 12,281,054 1,919,165 5.5% PA 12,702,379 1,959,307 4.9% PA 12,787,209 2,134,521 4.6%6 OH 11,353,140 1,507,757 4.3% OH 11,536,504 1,622,015 4% OH 11,594,163 1,799,169 3.9%7 IL 12,419,293 1,500,025
4.3%IL 12,830,632 1,609,213
4%IL 12,880,580 1,788,533
3.9%
8 MI 9,938,444 1,219,018 3.5% MI 9,883,640 1,361,530 3.4% MI 9,909,877 1,530,052 3.3%9 NJ 8,414,350 1,113,136 3.2% NC 9,535,483 1,234,079 3.1% NC 9,943,964 1,463,362 3.2%10 NC 8,049,313 969,048 2.8% NJ 8,791,894 1,185,993 2.9% NJ 8,938,175 1,313,503 2.8%‐ US 281,421,906 34,991,753 100% US 308,745,538 40,267,984 100% US 318,857,056 46,243,211 100%
Source: US Census Bureau, 2000 and 2010 Decennial CensusesUS Census Bureau, 2014 Population Estimate by State
7
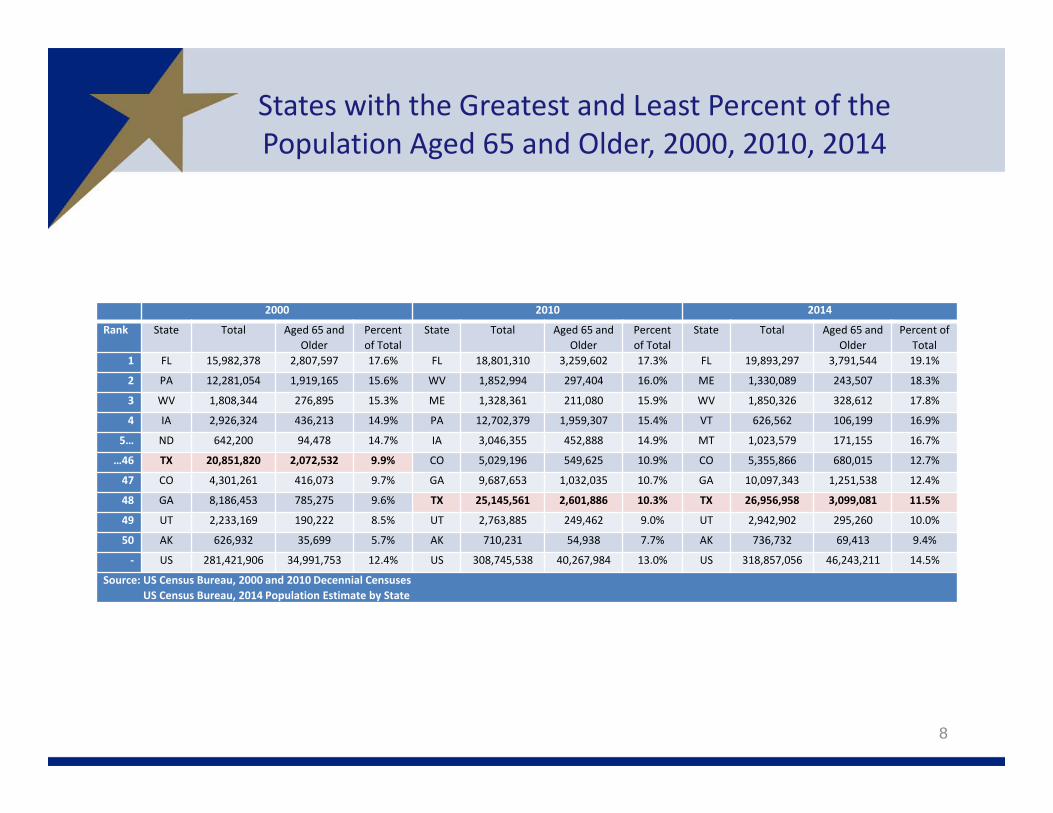
States with the Greatest and Least Percent of the Population Aged 65 and Older, 2000, 2010, 2014
2000 2010 2014
Rank State Total Aged 65 and Older
Percent of Total
State Total Aged 65 and Older
Percent of Total
State Total Aged 65 and Older
Percent of Total
1 FL 15,982,378 2,807,597 17.6% FL 18,801,310 3,259,602 17.3% FL 19,893,297 3,791,544 19.1%
2 PA 12,281,054 1,919,165 15.6% WV 1,852,994 297,404 16.0% ME 1,330,089 243,507 18.3%
3 WV 1,808,344 276,895 15.3% ME 1,328,361 211,080 15.9% WV 1,850,326 328,612 17.8%
4 IA 2,926,324 436,213 14.9% PA 12,702,379 1,959,307 15.4% VT 626,562 106,199 16.9%
5… ND 642,200 94,478 14.7% IA 3,046,355 452,888 14.9% MT 1,023,579 171,155 16.7%
…46 TX 20,851,820 2,072,532 9.9% CO 5,029,196 549,625 10.9% CO 5,355,866 680,015 12.7%
47 CO 4,301,261 416,073 9.7% GA 9,687,653 1,032,035 10.7% GA 10,097,343 1,251,538 12.4%
48 GA 8,186,453 785,275 9.6% TX 25,145,561 2,601,886 10.3% TX 26,956,958 3,099,081 11.5%
49 UT 2,233,169 190,222 8.5% UT 2,763,885 249,462 9.0% UT 2,942,902 295,260 10.0%
50 AK 626,932 35,699 5.7% AK 710,231 54,938 7.7% AK 736,732 69,413 9.4%
‐ US 281,421,906 34,991,753 12.4% US 308,745,538 40,267,984 13.0% US 318,857,056 46,243,211 14.5%
Source: US Census Bureau, 2000 and 2010 Decennial CensusesUS Census Bureau, 2014 Population Estimate by State
8
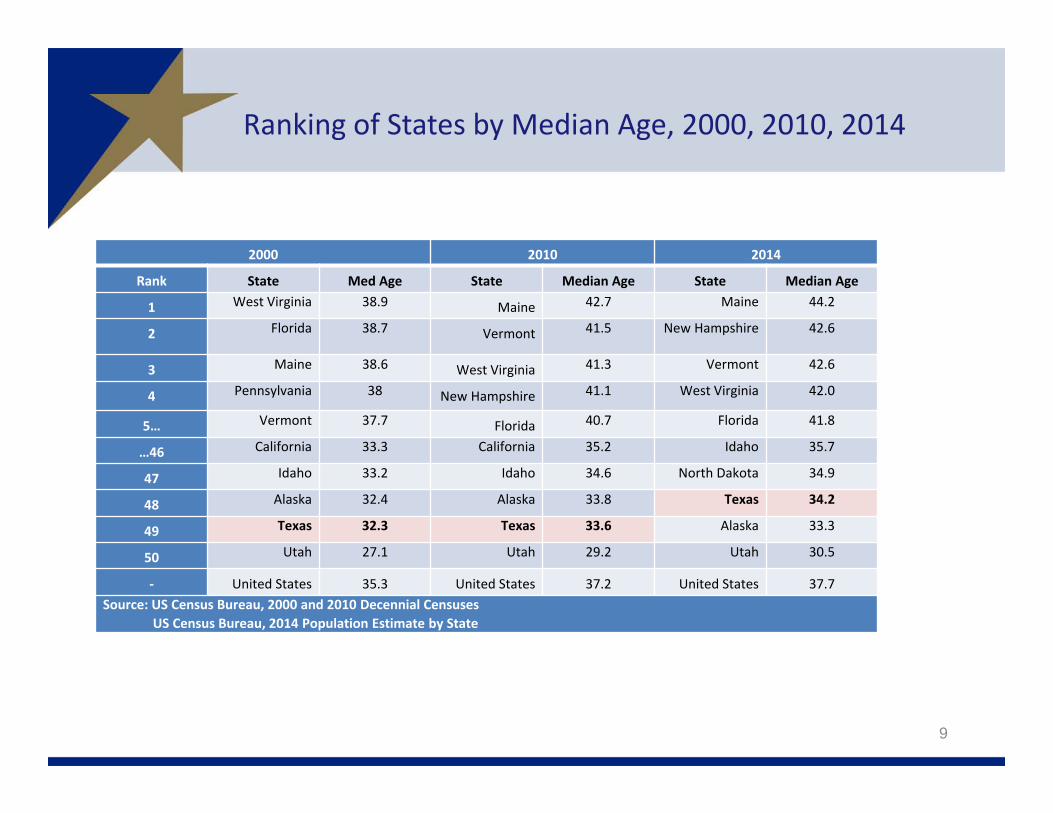
Ranking of States by Median Age, 2000, 2010, 2014
2000 2010 2014
Rank State Med Age State Median Age State Median Age
1 West Virginia 38.9 Maine 42.7 Maine 44.2
2 Florida 38.7 Vermont 41.5 New Hampshire 42.6
3 Maine 38.6 West Virginia 41.3 Vermont 42.6
4 Pennsylvania 38 New Hampshire 41.1 West Virginia 42.0
5… Vermont 37.7 Florida 40.7 Florida 41.8
…46 California 33.3 California 35.2 Idaho 35.7
47 Idaho 33.2 Idaho 34.6 North Dakota 34.9
48 Alaska 32.4 Alaska 33.8 Texas 34.2
49 Texas 32.3 Texas 33.6 Alaska 33.3
50 Utah 27.1 Utah 29.2 Utah 30.5
‐ United States 35.3 United States 37.2 United States 37.7Source: US Census Bureau, 2000 and 2010 Decennial Censuses
US Census Bureau, 2014 Population Estimate by State
9
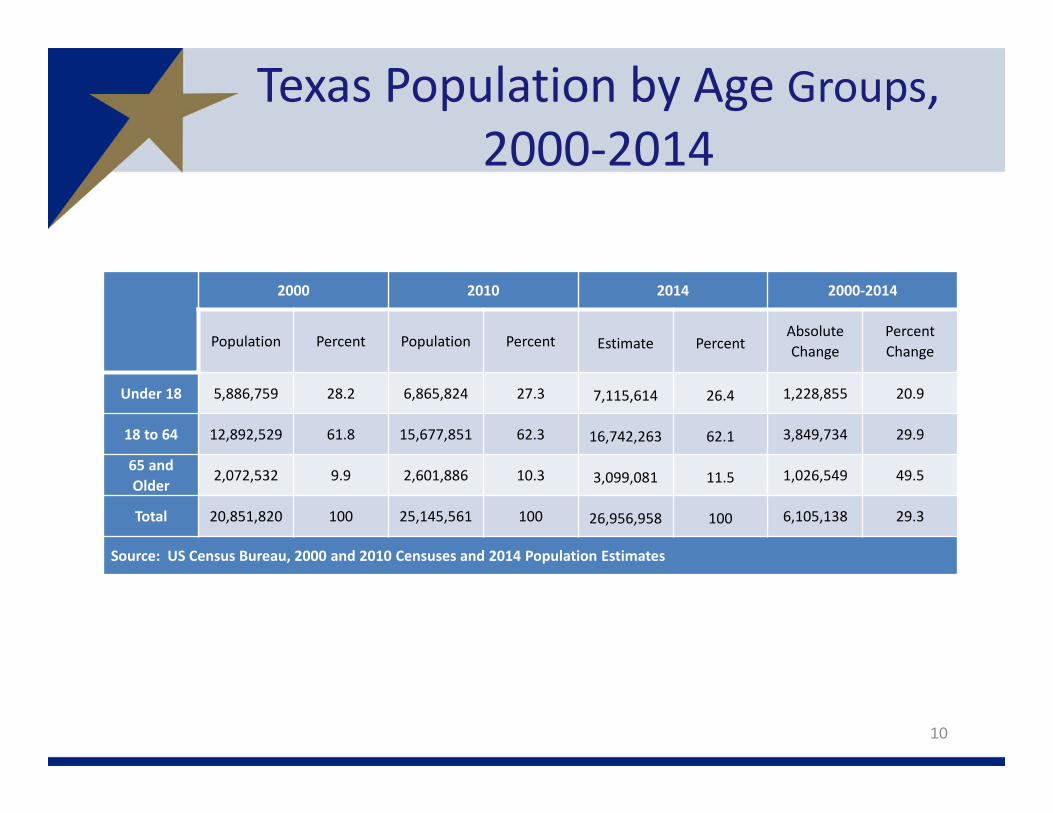
Texas Population by Age Groups, 2000‐2014
10
2000 2010 2014 2000‐2014
Population Percent Population Percent Estimate PercentAbsolute Change
Percent Change
Under 18 5,886,759 28.2 6,865,824 27.3 7,115,614 26.4 1,228,855 20.9
18 to 64 12,892,529 61.8 15,677,851 62.3 16,742,263 62.1 3,849,734 29.9
65 and Older
2,072,532 9.9 2,601,886 10.3 3,099,081 11.5 1,026,549 49.5
Total 20,851,820 100 25,145,561 100 26,956,958 100 6,105,138 29.3
Source: US Census Bureau, 2000 and 2010 Censuses and 2014 Population Estimates
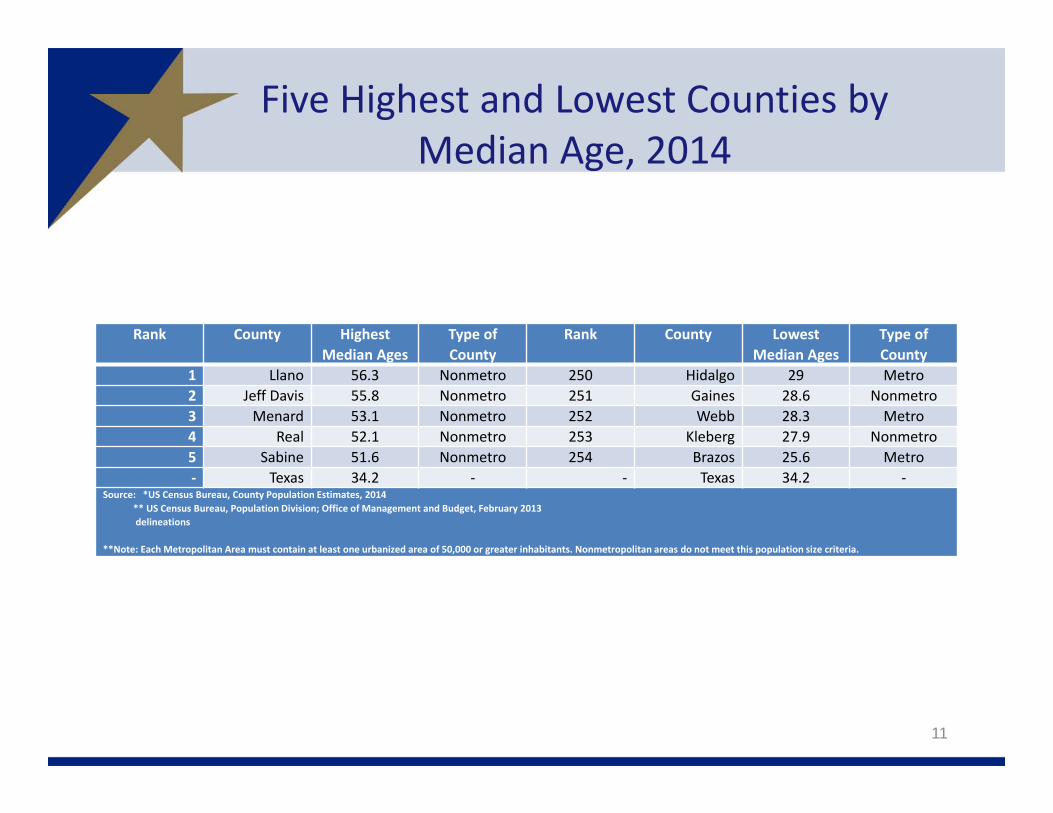
Five Highest and Lowest Counties by Median Age, 2014
Rank County HighestMedian Ages
Type of County
Rank County LowestMedian Ages
Type of County
1 Llano 56.3 Nonmetro 250 Hidalgo 29 Metro2 Jeff Davis 55.8 Nonmetro 251 Gaines 28.6 Nonmetro3 Menard 53.1 Nonmetro 252 Webb 28.3 Metro4 Real 52.1 Nonmetro 253 Kleberg 27.9 Nonmetro5 Sabine 51.6 Nonmetro 254 Brazos 25.6 Metro‐ Texas 34.2 ‐ ‐ Texas 34.2 ‐
Source: *US Census Bureau, County Population Estimates, 2014** US Census Bureau, Population Division; Office of Management and Budget, February 2013 delineations
**Note: Each Metropolitan Area must contain at least one urbanized area of 50,000 or greater inhabitants. Nonmetropolitan areas do not meet this population size criteria.
11
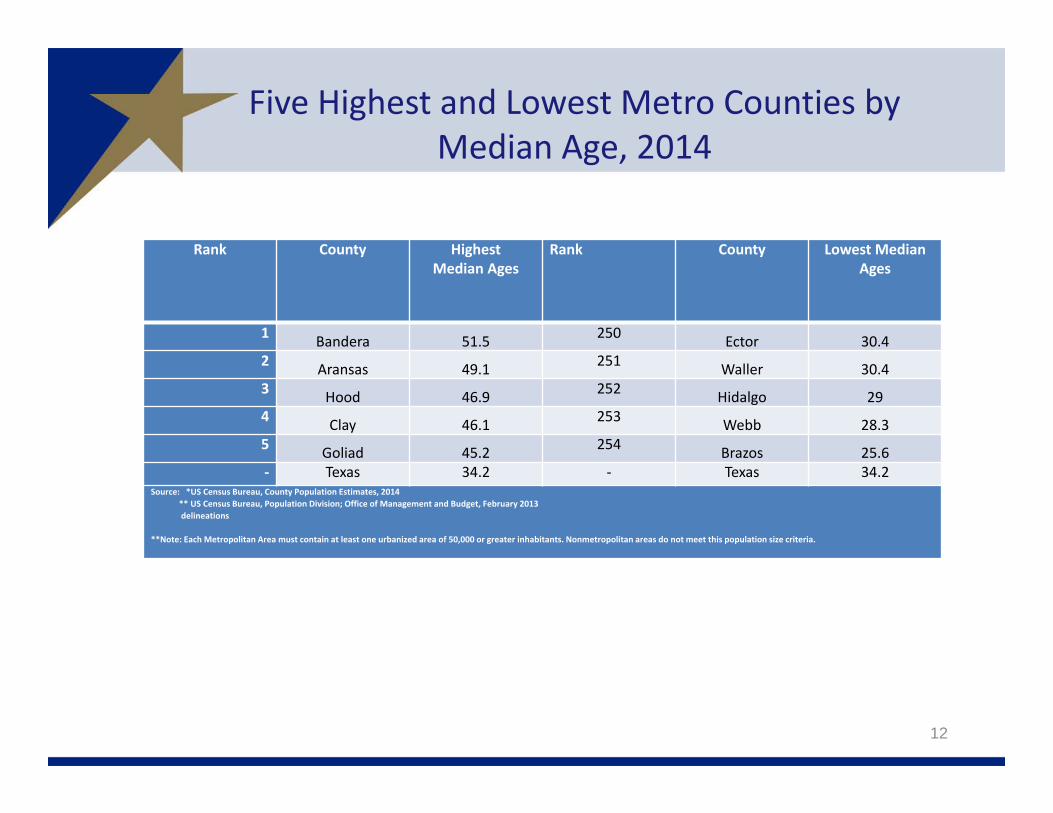
Five Highest and Lowest Metro Counties by Median Age, 2014
Rank County HighestMedian Ages
Rank County Lowest Median Ages
1 Bandera 51.5 250 Ector 30.42 Aransas 49.1 251 Waller 30.43 Hood 46.9 252 Hidalgo 294 Clay 46.1 253 Webb 28.35 Goliad 45.2 254 Brazos 25.6‐ Texas 34.2 ‐ Texas 34.2
Source: *US Census Bureau, County Population Estimates, 2014** US Census Bureau, Population Division; Office of Management and Budget, February 2013 delineations
**Note: Each Metropolitan Area must contain at least one urbanized area of 50,000 or greater inhabitants. Nonmetropolitan areas do not meet this population size criteria.
12
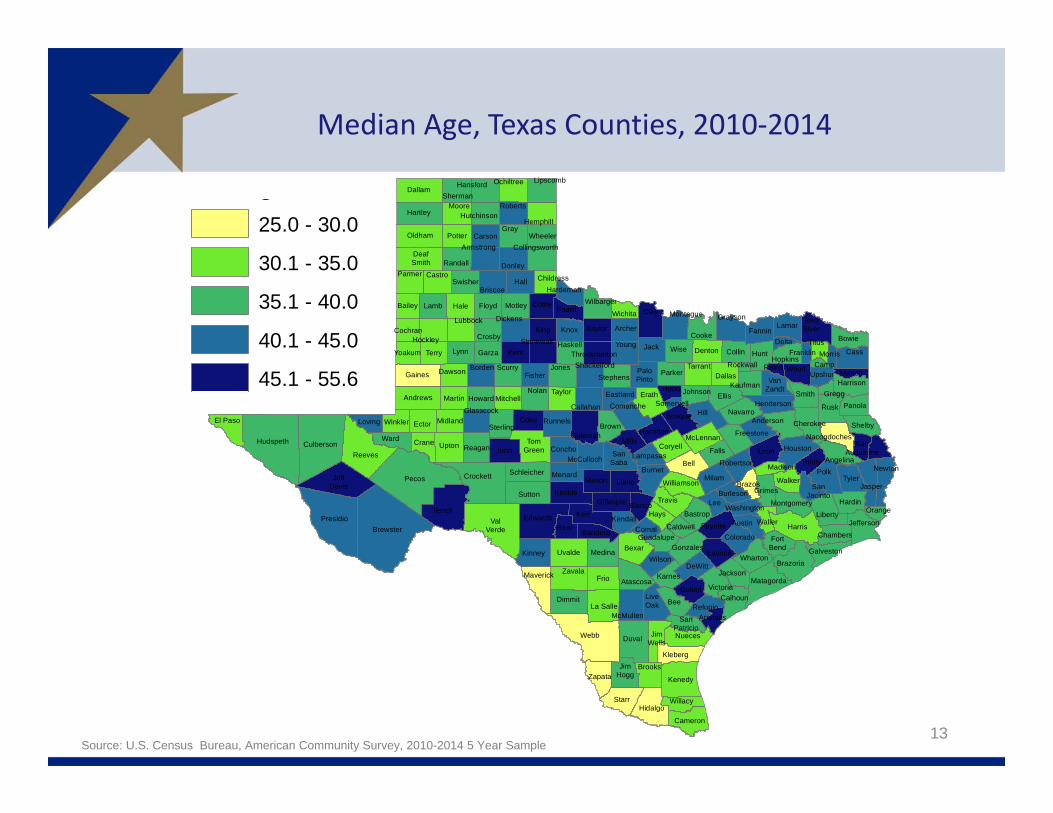
Median Age, Texas Counties, 2010‐2014
13Source: U.S. Census Bureau, American Community Survey, 2010-2014 5 Year Sample
Dallas
Howard
FoardFloyd
Brewster
FranklinHunt
Newton
Starr
Kinney
Collingsworth
TomGreen
Coleman
Brazoria
Leon
Duval
Lamb
Morris
Smith
Jackson
Medina
Wheeler
Dallam
Callahan
Lamar
Coryell
Gaines
Kendall
Nacogdoches
Milam
Hays
Willacy
Johnson
Reagan
Webb
Shackelford
Bowie
Scurry
Kenedy
Somervell
Oldham
Taylor
King
Borden
Walker
Stephens
DeafSmith
Roberts
Tyler
ValVerde
Brown
Parker
Harris
Zapata
RedRiver
Karnes
PaloPinto
Glasscock
Shelby
Wood
Crosby
Refugio
Burnet
Sterling
Montgomery
SanAugustine
Rains
Nueces
Jack
Swisher
Camp
Brazos
Orange
Colorado
Pecos
Cochran
Parmer
FreestoneWinkler
Wichita
Gray
Schleicher
Hardeman
TravisGillespie
Yoakum
Fayette
Uvalde
Grimes
VanZandt
Throckmorton
Falls
Grayson
Ellis
Hall
Dickens
TrinityReeves
Marion
Terrell
Lynn
La Salle
Jasper
Jones
Castro
Victoria
Kleberg
Briscoe
Clay
Matagorda
Brooks
Runnels
Carson
LibertyLee
Hale
Bexar
Garza
Montague
Upton
Hamilton
FisherDawson
Dimmit
Hutchinson
Llano
Presidio
Eastland
Wharton
Rusk
Tarrant
Lavaca
Childress
Hidalgo
Kaufman
Moore
Menard
Edwards
SanPatricio
Terry
Crockett
Houston
Waller
Coke
Ward
Titus
Lampasas
Haskell
Martin
Atascosa
HemphillHartley
Young
BurlesonHardin
Gonzales
McMullen
Erath
Galveston
Hopkins
McLennan
MadisonMcCulloch
Donley
Kent
Real
Sutton
Midland
Hudspeth
Zavala
Harrison
ComancheMitchell
Navarro
Crane
Lubbock
Wise
Washington
JeffDavis
El Paso
Gregg
Williamson
Lipscomb
Mason
Henderson
Hansford
Chambers
Hill
Potter
JimWells
DeltaStonewall
Ector
Cameron
Maverick
Collin
Baylor
Panola
Guadalupe
BastropAustin
Andrews
Anderson
Blanco
DeWitt
Bandera
Bell
Aransas
Archer
Armstrong
Bee
Angelina
Bailey
Jefferson
Frio
Fannin
Goliad
Loving
Cass
FortBend
Bosque
Hockley
SanSaba
Kerr
Mills
Cooke
Wilbarger
Irion
Caldwell
JimHogg
Culberson
Upshur
Cherokee
Denton
Concho
Randall
Kimble
Knox
Polk
Hood
SanJacinto
Robertson
Wilson
Nolan
Cottle
Calhoun
Rockwall
LiveOak
Motley
Sherman
Ochiltree
Comal
g25.0 - 30.0
30.1 - 35.0
35.1 - 40.0
40.1 - 45.0
45.1 - 55.6

Change in Median Age, Texas Counties, 2000‐2014
Menard
Hale
Armstrong
Calhoun
Clay
Orange
Gonzales
Fannin
Kerr
Refugio
JimHogg
Dimmit
Nolan
Brazos
Jefferson
Bell
Bandera
Hidalgo
Schleicher
GraysonCrosby
Delta
Zavala
Rockwall
Eastland
DeWitt
Angelina
McLennan
Lamar
Leon
Stonewall
McMullen
Sutton
FortBend
Parker
Kinney
Fayette
Briscoe
Harrison
Reagan
Coleman
Ochiltree
Crane
Washington
Lynn
Mills
Oldham
Sabine
Hopkins
Houston
Bexar
Upton
Erath
Randall
Rusk
Coryell
Comal
Aransas
Jack
Hemphill
Shackelford
SanJacinto
Kendall
Wharton
Floyd
Karnes
Kaufman
Duval
Johnson
Franklin
EdwardsWaller
Maverick
Kleberg
Gaines
Martin
Bowie
Andrews
Potter
Garza
Caldwell
Parmer
TitusTerry
Foard
Real
Carson
Knox
Hays
Medina
MotleyWichita
Midland
Victoria
Tyler
Falls
Presidio
Willacy
Lubbock
Henderson
Walker
Galveston
Harris
Dawson
Pecos
Nacogdoches
Guadalupe
Tarrant
Jackson
Swisher
SterlingWinkler
Frio
Lipscomb
Collingsworth
Colorado
Wise
GlasscockShelbyComanche
Burnet
Gray
Hudspeth
Cass
Ellis
Cooke
Williamson
Cochran
VanZandt
Donley
Jones
Grimes
Irion
Navarro
Brooks
Dallam
Hunt
Mitchell
Wood
Childress
JeffDavis
Montague
Brown
Haskell
Fisher
Concho
Coke
Polk
Cottle
Young
Lee
Cherokee
Hall
Hood
ArcherBaylor
SanAugustine
MadisonMilam
Reeves
Nueces
Camp
Freestone
Runnels
Terrell
DeafSmith
Marion
Liberty
Jasper
Hansford
Chambers
Hardin
Collin
Brazoria
Throckmorton
Bastrop
Scurry
Ector
Limestone
Denton
RedRiver
Matagorda
Hardeman
PaloPinto
LiveOak
Sherman
Uvalde
Bailey
Culberson
Atascosa
Wilson
Starr
Dallas
Kimble
McCulloch
Crockett
Hill
Kent
El PasoLoving
Dickens
La Salle
Lamb
Austin
Hutchinson
ValVerde
Smith
Robertson
Gillespie
King
TomGreen
Yoakum
Somervell
Kenedy
Borden
SanSaba
Burleson
Bee
Trinity
Castro
Brewster
Gregg
Ward
Wilbarger
Hamilton
Stephens
Lavaca
Bosque
Goliad
Roberts
Callahan
RainsMorris
Lampasas
Upshur
Wheeler
SanPatricio
Moore
Webb
Blanco
Newton
Hockley
Panola
Anderson
Cameron
Montgomery
LlanoMason
Taylor
Hartley
JimWells
Zapata
Travis
Howard
14
Change in Median Age, 2000-2014
1 to 5 Years Younger (27 Counties)
No Change (57 Counties)
2 to 3 Years Older (100 Counties)
4 to 5 Years Older (49 Counties)
Greater than 5 Years Older (21 Counties)
Source: US Census Bureau US Census Bureau, 2000 Decennial Census, SF-1, Population Estimates 2014 Vintage.
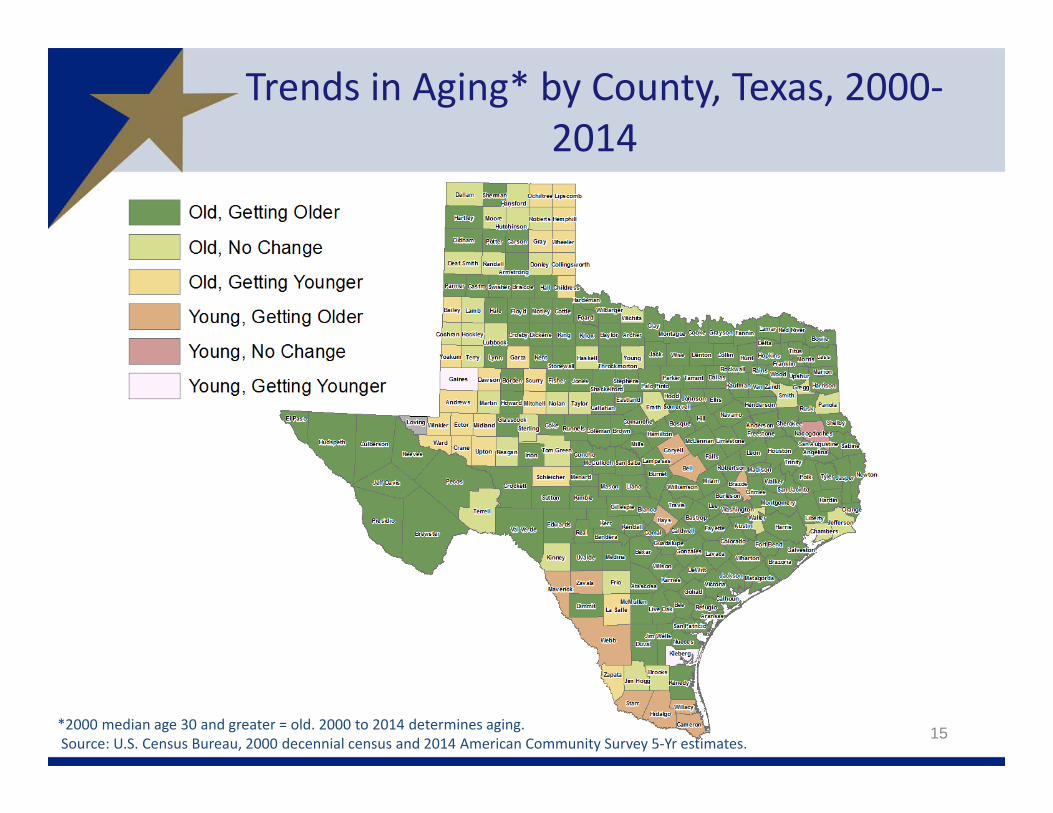
Trends in Aging* by County, Texas, 2000‐2014
15*2000 median age 30 and greater = old. 2000 to 2014 determines aging.Source: U.S. Census Bureau, 2000 decennial census and 2014 American Community Survey 5‐Yr estimates.
‐
5,000,000
10,000,000
15,000,000
20,000,000
25,000,000
30,000,000
35,000,000
1950
1960
1970
1980
1990
2000
2010
2014
2020
2030
2040
2050
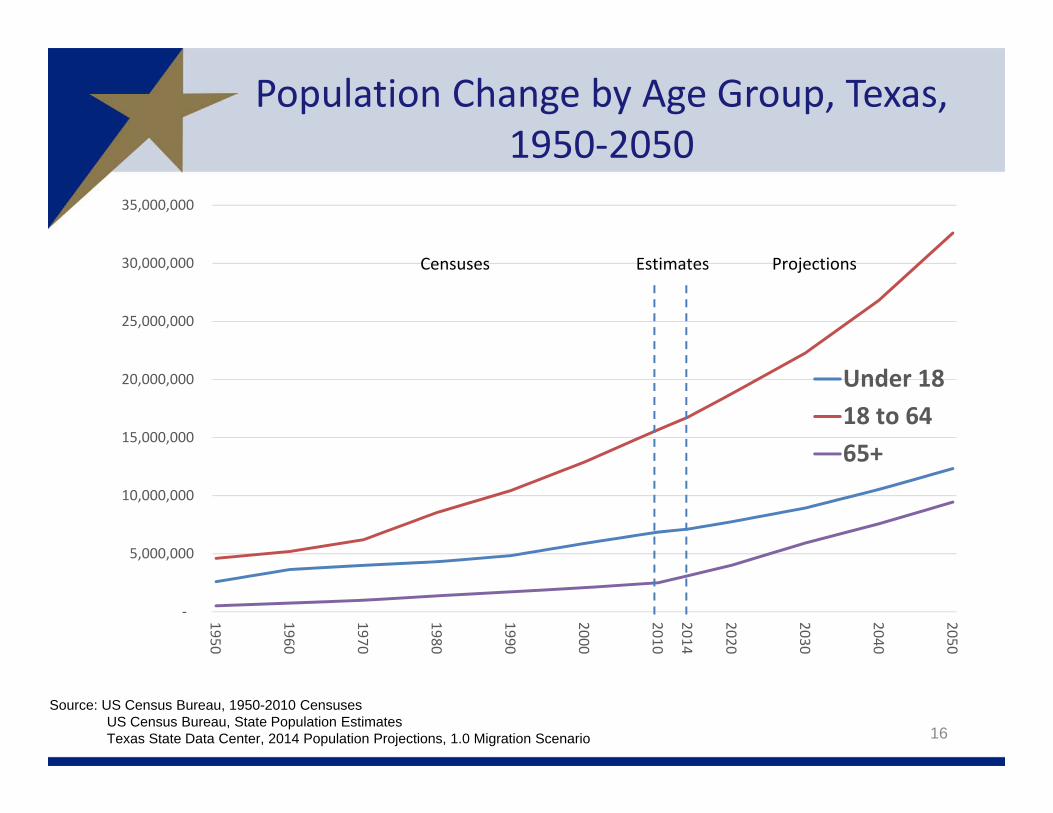
Under 1818 to 6465+
Censuses Estimates Projections
16
Population Change by Age Group, Texas, 1950‐2050
Source: US Census Bureau, 1950-2010 Censuses US Census Bureau, State Population EstimatesTexas State Data Center, 2014 Population Projections, 1.0 Migration Scenario
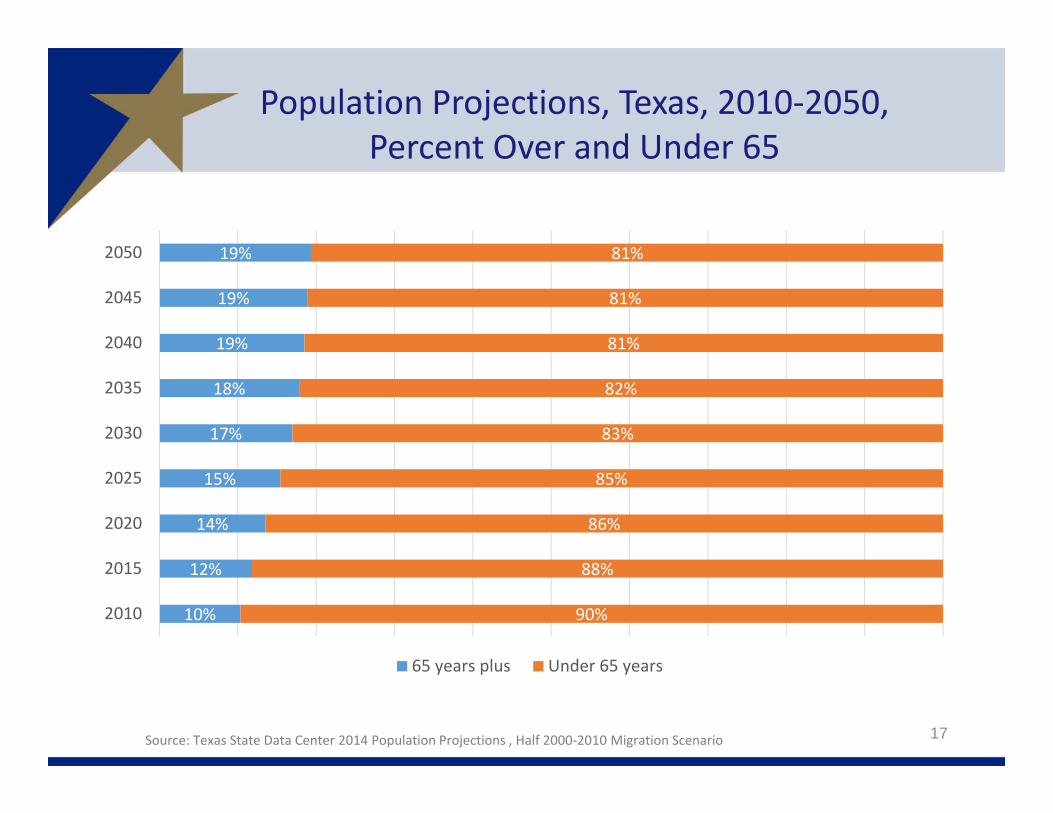
Population Projections, Texas, 2010‐2050,Percent Over and Under 65
17
19%
19%
19%
18%
17%
15%
14%
12%
10%
81%
81%
81%
82%
83%
85%
86%
88%
90%
2050
2045
2040
2035
2030
2025
2020
2015
2010
65 years plus Under 65 years
Source: Texas State Data Center 2014 Population Projections , Half 2000‐2010 Migration Scenario
200,000 150,000 100,000 50,000 0 50,000 100,000 150,000 200,000Under 1 year
5 years
10 years
15 years
20 years
25 years
30 years
35 years
40 years
45 years
50 years
55 years
60 years
65 years
70 years
75 years
80 years
85 years
90 years
95 years
100 to 104 years
18
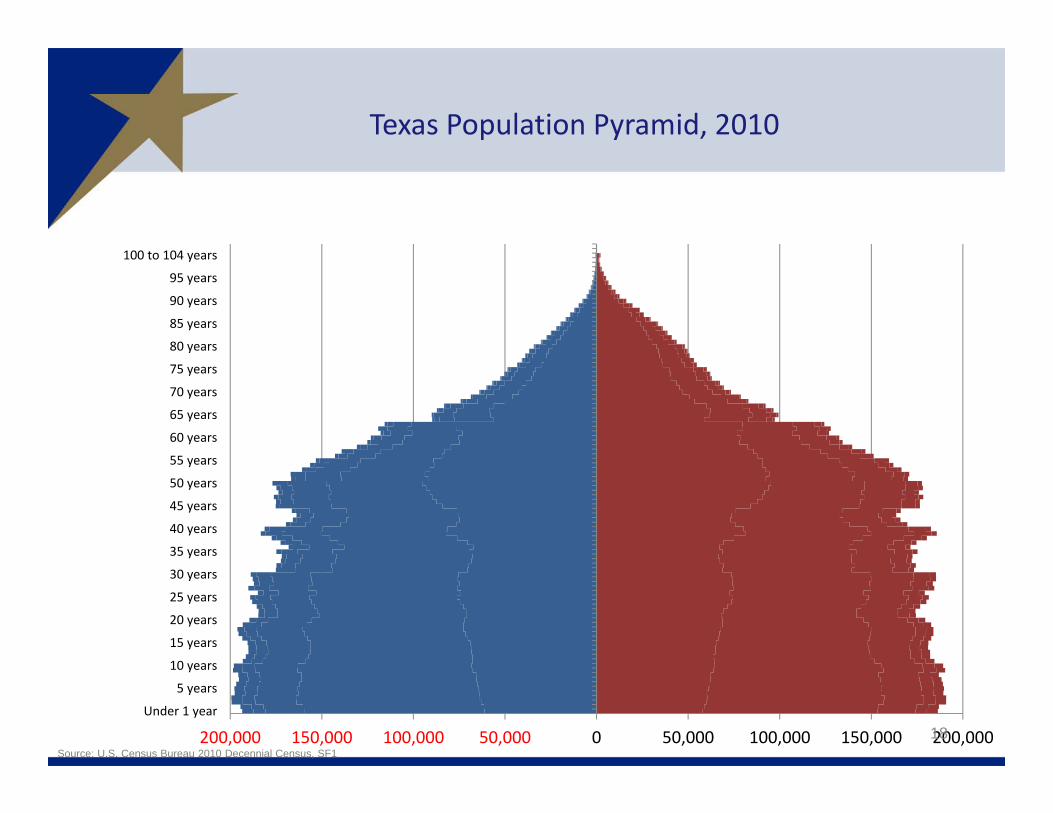
Texas Population Pyramid, 2010
Source: U.S. Census Bureau 2010 Decennial Census, SF1
200,000 150,000 100,000 50,000 0 50,000 100,000 150,000 200,000Under 1 year
5 years
10 years
15 years
20 years
25 years
30 years
35 years
40 years
45 years
50 years
55 years
60 years
65 years
70 years
75 years
80 years
85 years
90 years
95 years
100 to 104 years
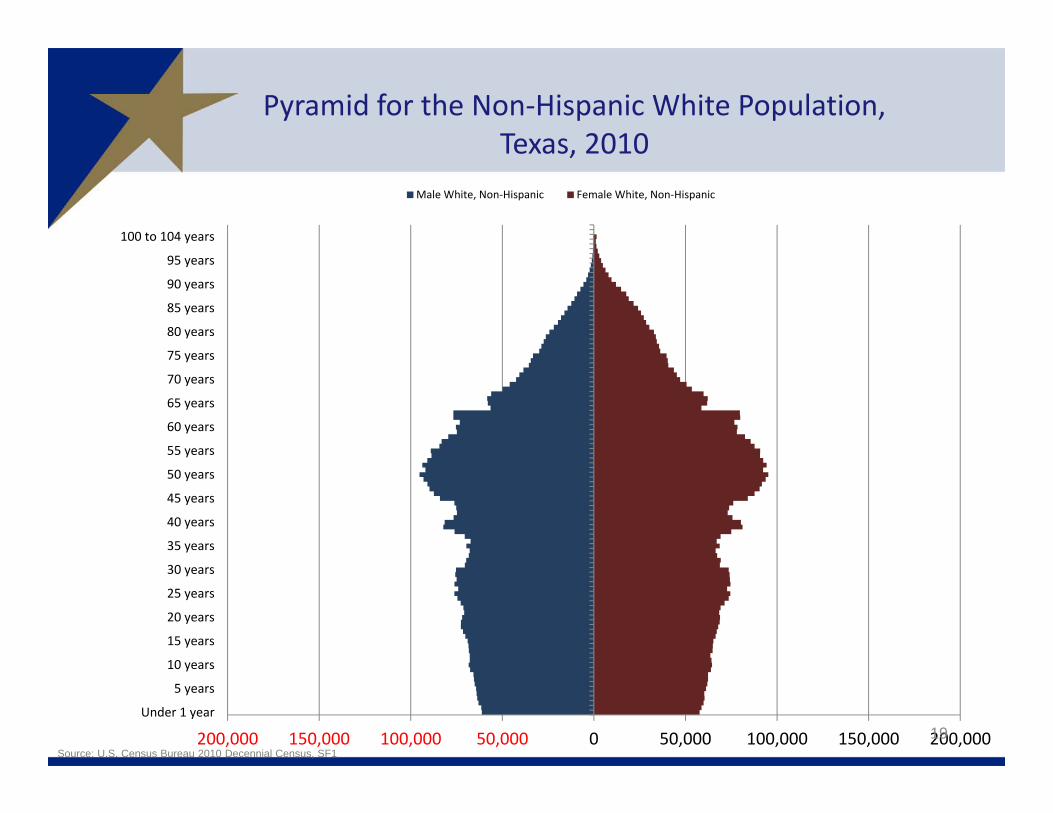
Male White, Non‐Hispanic Female White, Non‐Hispanic
19
Pyramid for the Non‐Hispanic White Population, Texas, 2010
Source: U.S. Census Bureau 2010 Decennial Census, SF1
200,000 150,000 100,000 50,000 0 50,000 100,000 150,000 200,000Under 1 year
5 years
10 years
15 years
20 years
25 years
30 years
35 years
40 years
45 years
50 years
55 years
60 years
65 years
70 years
75 years
80 years
85 years
90 years
95 years
100 to 104 years
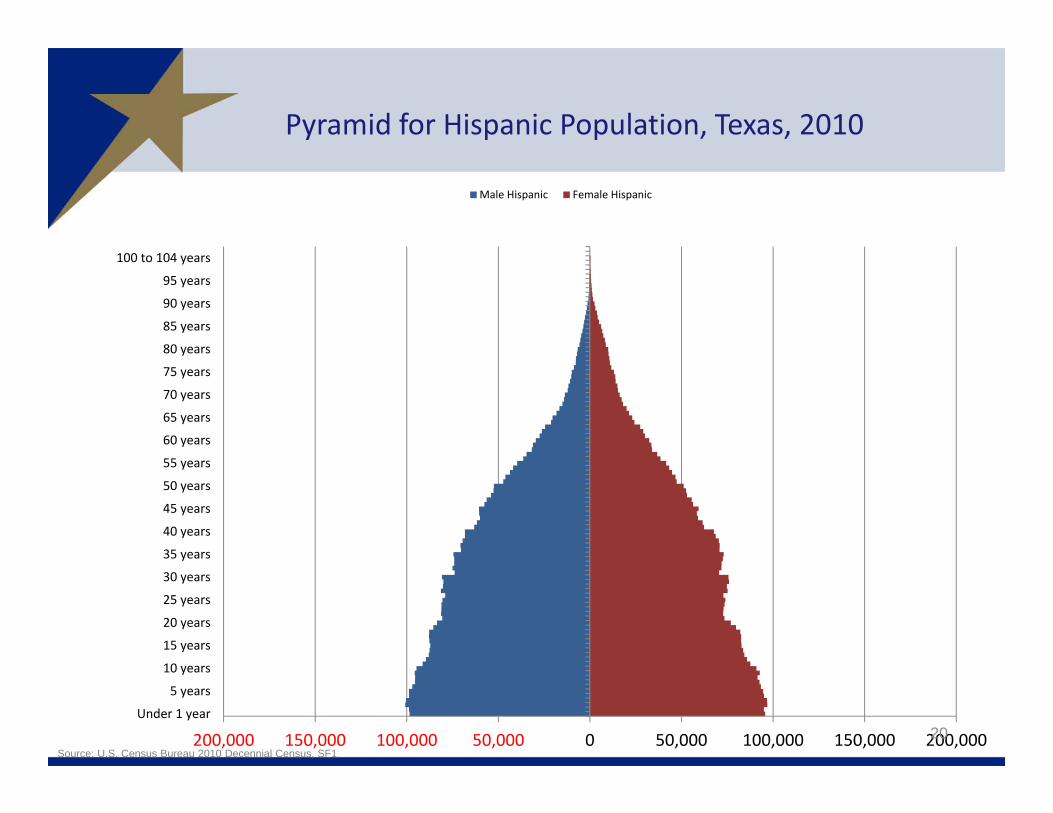
Male Hispanic Female Hispanic
20
Pyramid for Hispanic Population, Texas, 2010
Source: U.S. Census Bureau 2010 Decennial Census, SF1
200,000 150,000 100,000 50,000 0 50,000 100,000 150,000 200,000Under 1 year
5 years
10 years
15 years
20 years
25 years
30 years
35 years
40 years
45 years
50 years
55 years
60 years
65 years
70 years
75 years
80 years
85 years
90 years
95 years
100 to 104 years
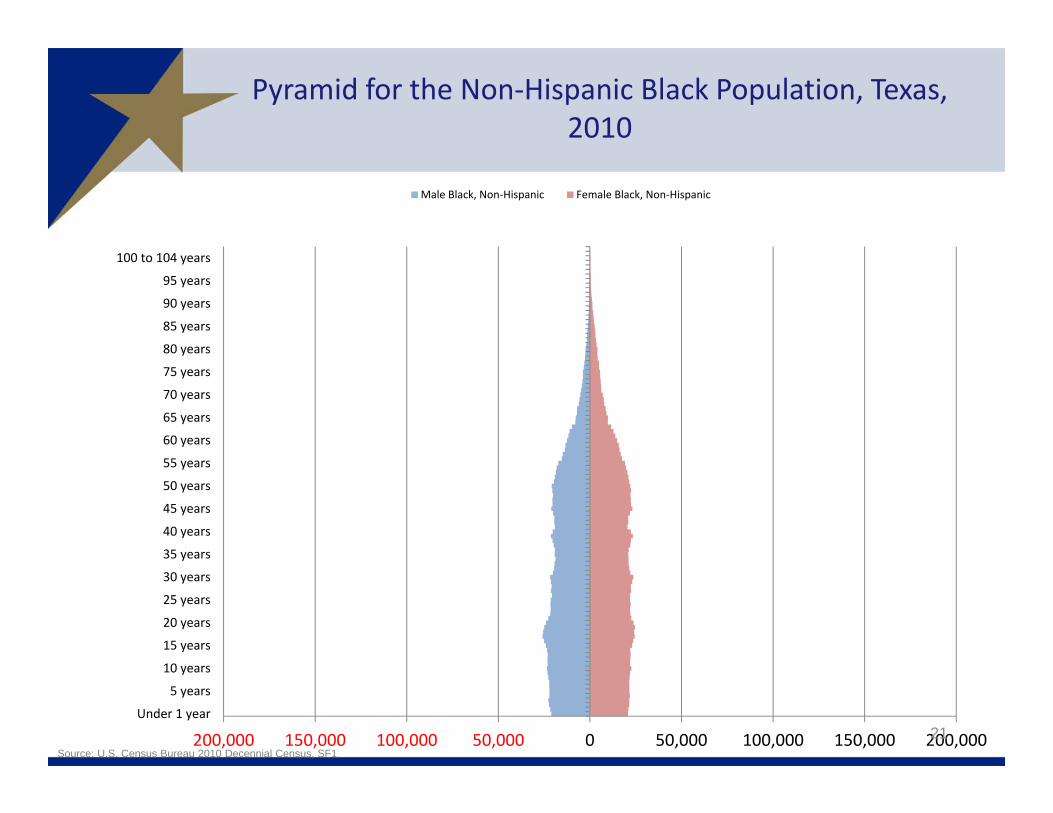
Male Black, Non‐Hispanic Female Black, Non‐Hispanic
21
Pyramid for the Non‐Hispanic Black Population, Texas, 2010
Source: U.S. Census Bureau 2010 Decennial Census, SF1
200,000 150,000 100,000 50,000 0 50,000 100,000 150,000 200,000Under 1 year
5 years
10 years
15 years
20 years
25 years
30 years
35 years
40 years
45 years
50 years
55 years
60 years
65 years
70 years
75 years
80 years
85 years
90 years
95 years
100 to 104 years
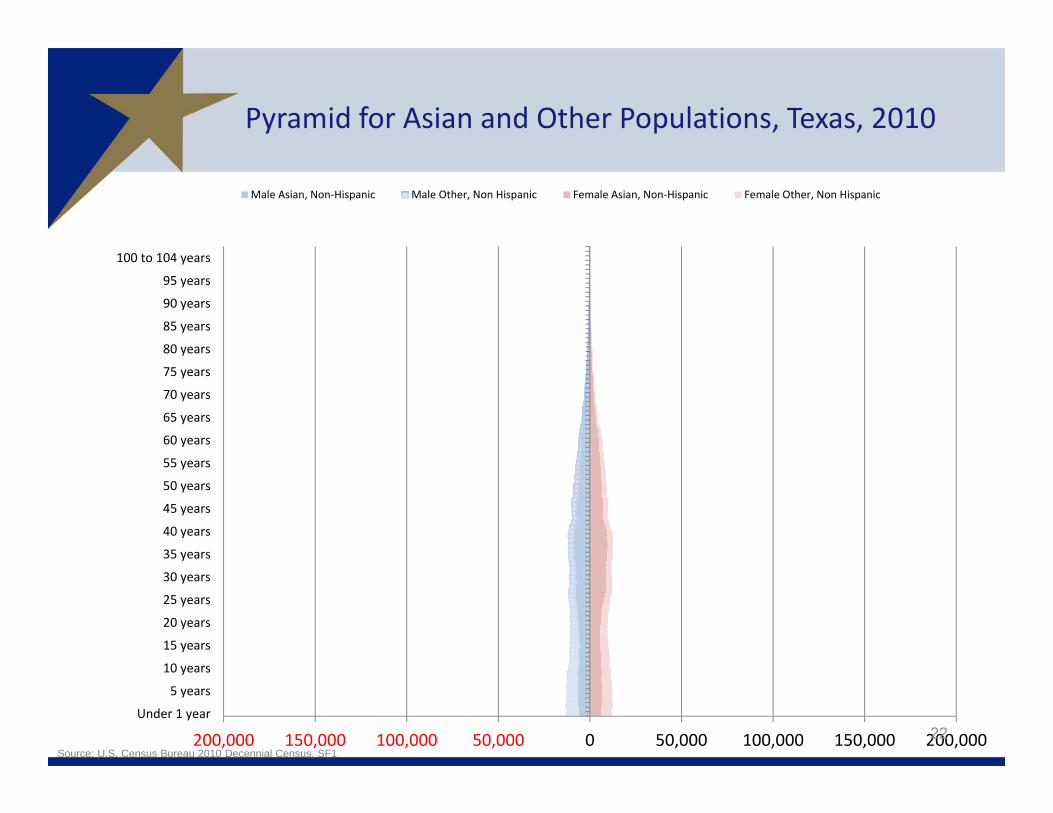
Male Asian, Non‐Hispanic Male Other, Non Hispanic Female Asian, Non‐Hispanic Female Other, Non Hispanic
22
Pyramid for Asian and Other Populations, Texas, 2010
Source: U.S. Census Bureau 2010 Decennial Census, SF1
200,000 150,000 100,000 50,000 0 50,000 100,000 150,000 200,000Under 1 year
5 years
10 years
15 years
20 years
25 years
30 years
35 years
40 years
45 years
50 years
55 years
60 years
65 years
70 years
75 years
80 years
85 years
90 years
95 years
100 to 104 years
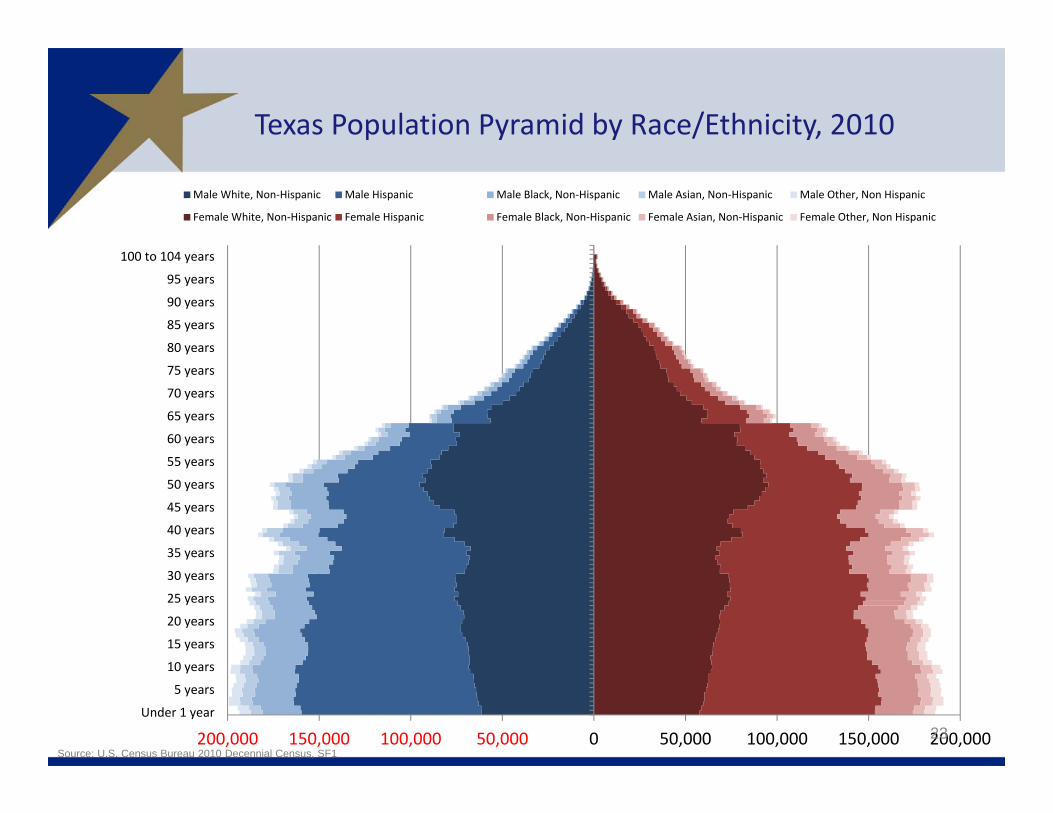
Male White, Non‐Hispanic Male Hispanic Male Black, Non‐Hispanic Male Asian, Non‐Hispanic Male Other, Non Hispanic
Female White, Non‐Hispanic Female Hispanic Female Black, Non‐Hispanic Female Asian, Non‐Hispanic Female Other, Non Hispanic
23
Texas Population Pyramid by Race/Ethnicity, 2010
Source: U.S. Census Bureau 2010 Decennial Census, SF1
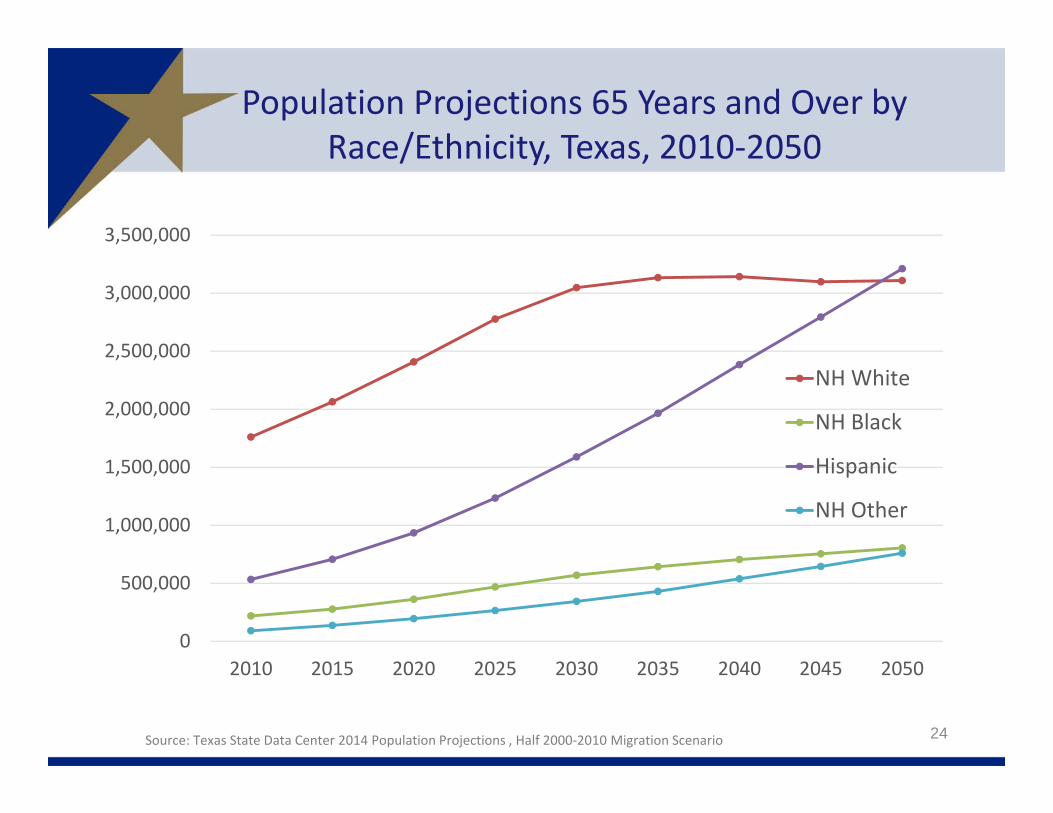
Population Projections 65 Years and Over by Race/Ethnicity, Texas, 2010‐2050
24
0
500,000
1,000,000
1,500,000
2,000,000
2,500,000
3,000,000
3,500,000
2010 2015 2020 2025 2030 2035 2040 2045 2050
NH White
NH Black
Hispanic
NH Other
Source: Texas State Data Center 2014 Population Projections , Half 2000‐2010 Migration Scenario
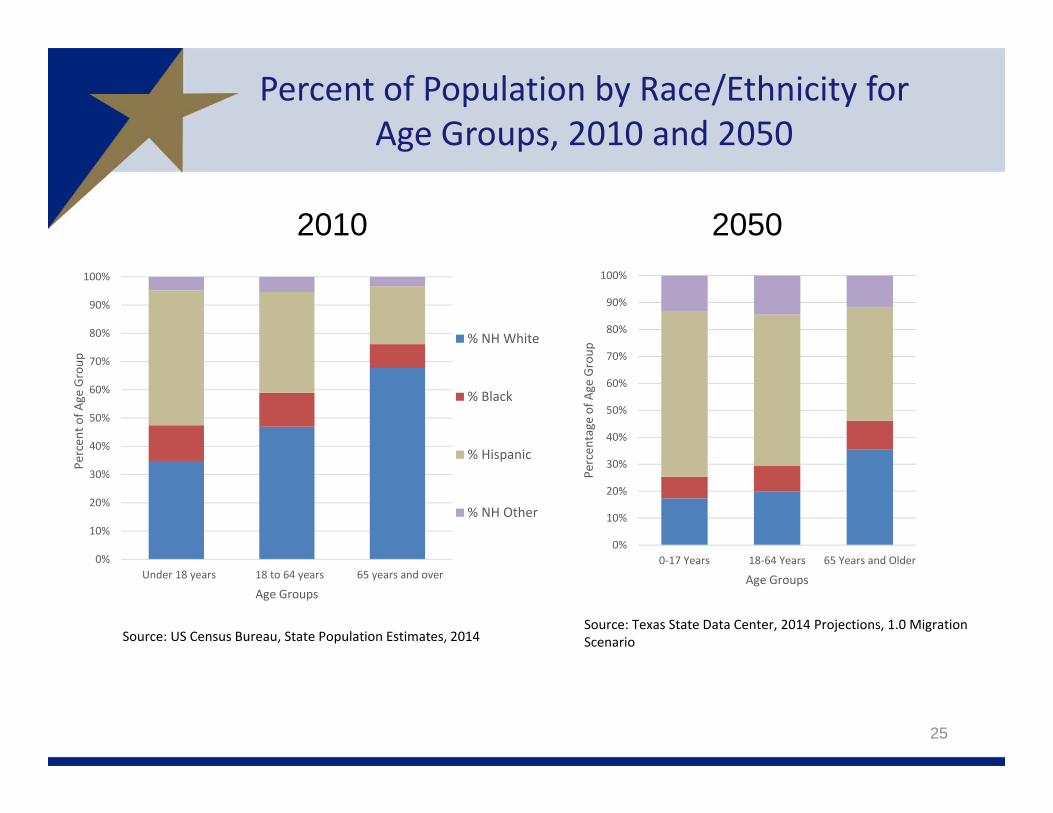
Percent of Population by Race/Ethnicity for Age Groups, 2010 and 2050
25
0%
10%
20%
30%
40%
50%
60%
70%
80%
90%
100%
Under 18 years 18 to 64 years 65 years and over
Percen
t of A
ge Group
Age Groups
% NH White
% Black
% Hispanic
% NH Other
Source: US Census Bureau, State Population Estimates, 2014
0%
10%
20%
30%
40%
50%
60%
70%
80%
90%
100%
0‐17 Years 18‐64 Years 65 Years and Older
Percen
tage of A
ge Group
Age Groups
Source: Texas State Data Center, 2014 Projections, 1.0 Migration Scenario
2010 2050
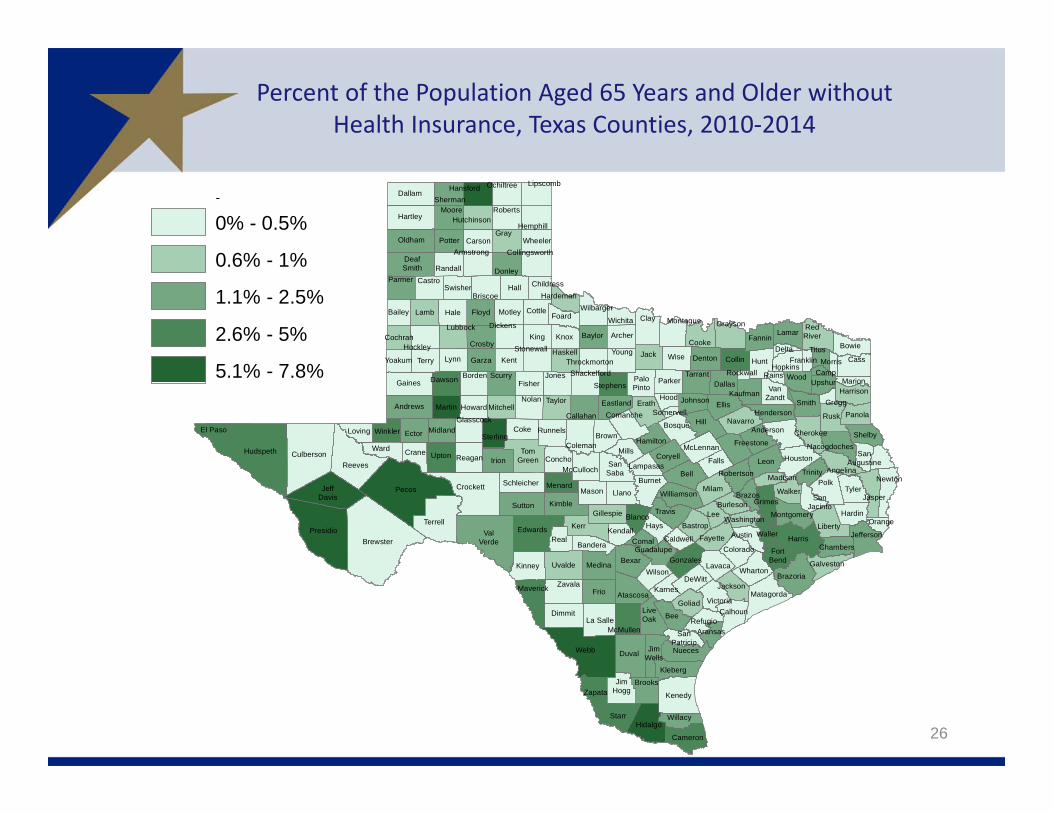
Percent of the Population Aged 65 Years and Older without Health Insurance, Texas Counties, 2010‐2014
Dallas
Howard
FoardFloyd
Brewster
FranklinHunt
Newton
Starr
Kinney
Collingsworth
TomGreen
Coleman
Brazoria
Leon
Duval
Lamb
Morris
Smith
Jackson
Medina
Wheeler
Dallam
Callahan
Lamar
Coryell
Gaines
Kendall
Nacogdoches
Milam
Hays
Willacy
Johnson
Reagan
Webb
Shackelford
Bowie
Scurry
Kenedy
Somervell
Oldham
Taylor
King
Borden
Walker
Stephens
DeafSmith
Roberts
Tyler
ValVerde
Brown
Parker
Harris
Zapata
RedRiver
Karnes
PaloPinto
Glasscock
Shelby
Wood
Crosby
Refugio
Burnet
Sterling
Montgomery
SanAugustine
Rains
Nueces
Jack
Swisher
Camp
Brazos
Orange
Colorado
Pecos
Cochran
Parmer
FreestoneWinkler
Wichita
Gray
Schleicher
Hardeman
TravisGillespie
Yoakum
Fayette
Uvalde
Grimes
VanZandt
Throckmorton
Falls
Grayson
Ellis
Hall
Dickens
TrinityReeves
Marion
Terrell
Lynn
La Salle
Jasper
Jones
Castro
Victoria
Kleberg
Briscoe
Clay
Matagorda
Brooks
Runnels
Carson
LibertyLee
Hale
Bexar
Garza
Montague
Upton
Hamilton
FisherDawson
Dimmit
Hutchinson
Llano
Presidio
Eastland
Wharton
Rusk
Tarrant
Lavaca
Childress
Hidalgo
Kaufman
Moore
Menard
Edwards
SanPatricio
Terry
Crockett
Houston
Waller
Coke
Ward
Titus
Lampasas
Haskell
Martin
Atascosa
HemphillHartley
Young
BurlesonHardin
Gonzales
McMullen
Erath
Galveston
Hopkins
McLennan
MadisonMcCulloch
Donley
Kent
Real
Sutton
Midland
Hudspeth
Zavala
Harrison
ComancheMitchell
Navarro
Crane
Lubbock
Wise
Washington
JeffDavis
El Paso
Gregg
Williamson
Lipscomb
Mason
Henderson
Hansford
Chambers
Hill
Potter
JimWells
DeltaStonewall
Ector
Cameron
Maverick
Collin
Baylor
Panola
Guadalupe
BastropAustin
Andrews
Anderson
Blanco
DeWitt
Bandera
Bell
Aransas
Archer
Armstrong
Bee
Angelina
Bailey
Jefferson
Frio
Fannin
Goliad
Loving
Cass
FortBend
Bosque
Hockley
SanSaba
Kerr
Mills
Cooke
Wilbarger
Irion
Caldwell
JimHogg
Culberson
Upshur
Cherokee
Denton
Concho
Randall
Kimble
Knox
Polk
Hood
SanJacinto
Robertson
Wilson
Nolan
Cottle
Calhoun
Rockwall
LiveOak
Motley
Sherman
Ochiltree
Comal
26
p0% - 0.5%
0.6% - 1%
1.1% - 2.5%
2.6% - 5%
5.1% - 7.8%
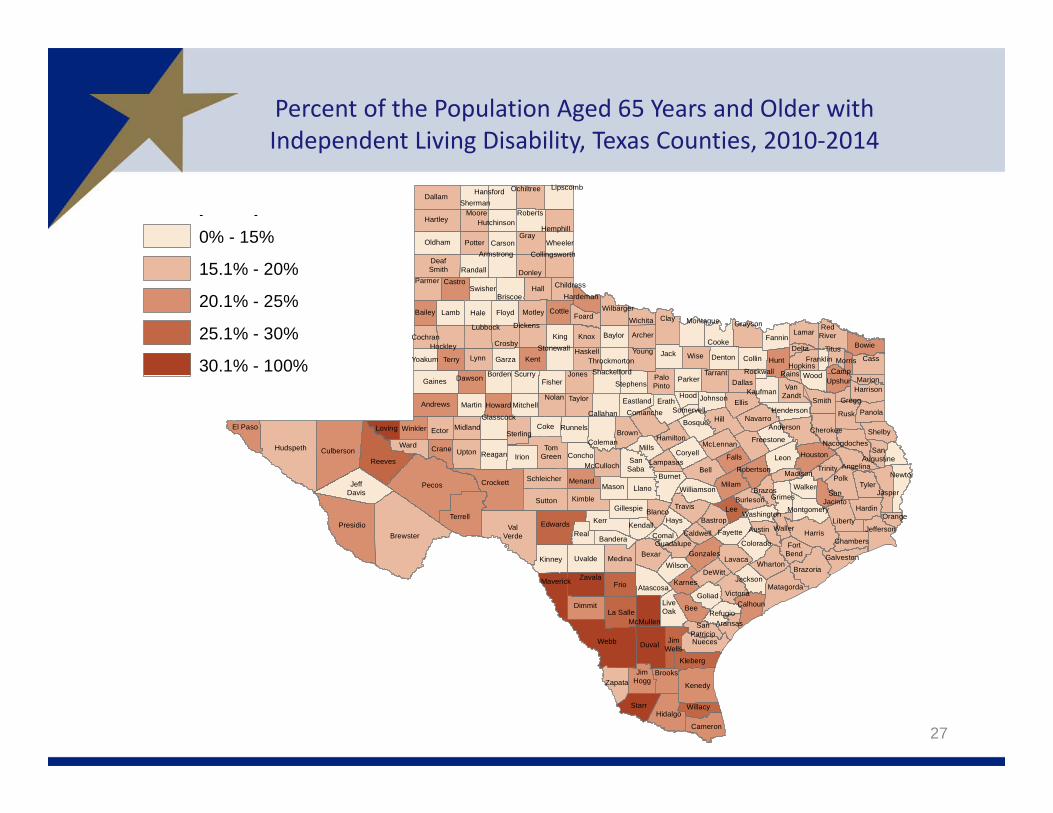
Percent of the Population Aged 65 Years and Older with Independent Living Disability, Texas Counties, 2010‐2014
27
Dallas
Howard
FoardFloyd
Brewster
FranklinHunt
Newton
Starr
Kinney
Collingsworth
TomGreen
Coleman
Brazoria
Leon
Duval
Lamb
Morris
Smith
Jackson
Medina
Wheeler
Dallam
Callahan
Lamar
Coryell
Gaines
Kendall
Nacogdoches
Milam
Hays
Willacy
Johnson
Reagan
Webb
Shackelford
Bowie
Scurry
Kenedy
Somervell
Oldham
Taylor
King
Borden
Walker
Stephens
DeafSmith
Roberts
Tyler
ValVerde
Brown
Parker
Harris
Zapata
RedRiver
Karnes
PaloPinto
Glasscock
Shelby
Wood
Crosby
Refugio
Burnet
Sterling
Montgomery
SanAugustine
Rains
Nueces
Jack
Swisher
Camp
Brazos
Orange
Colorado
Pecos
Cochran
Parmer
FreestoneWinkler
Wichita
Gray
Schleicher
Hardeman
TravisGillespie
Yoakum
Fayette
Uvalde
Grimes
VanZandt
Throckmorton
Falls
Grayson
Ellis
Hall
Dickens
TrinityReeves
Marion
Terrell
Lynn
La Salle
Jasper
Jones
Castro
Victoria
Kleberg
Briscoe
Clay
Matagorda
Brooks
Runnels
Carson
LibertyLee
Hale
Bexar
Garza
Montague
Upton
Hamilton
FisherDawson
Dimmit
Hutchinson
Llano
Presidio
Eastland
Wharton
Rusk
Tarrant
Lavaca
Childress
Hidalgo
Kaufman
Moore
Menard
Edwards
SanPatricio
Terry
Crockett
Houston
Waller
Coke
Ward
Titus
Lampasas
Haskell
Martin
Atascosa
HemphillHartley
Young
BurlesonHardin
Gonzales
McMullen
Erath
Galveston
Hopkins
McLennan
MadisonMcCulloch
Donley
Kent
Real
Sutton
Midland
Hudspeth
Zavala
Harrison
ComancheMitchell
Navarro
Crane
Lubbock
Wise
Washington
JeffDavis
El Paso
Gregg
Williamson
Lipscomb
Mason
Henderson
Hansford
Chambers
Hill
Potter
JimWells
DeltaStonewall
Ector
Cameron
Maverick
Collin
Baylor
Panola
Guadalupe
BastropAustin
Andrews
Anderson
Blanco
DeWitt
Bandera
Bell
Aransas
Archer
Armstrong
Bee
Angelina
Bailey
Jefferson
Frio
Fannin
Goliad
Loving
Cass
FortBend
Bosque
Hockley
SanSaba
Kerr
Mills
Cooke
Wilbarger
Irion
Caldwell
JimHogg
Culberson
Upshur
Cherokee
Denton
Concho
Randall
Kimble
Knox
Polk
Hood
SanJacinto
Robertson
Wilson
Nolan
Cottle
Calhoun
Rockwall
LiveOak
Motley
Sherman
Ochiltree
Comal
p p0% - 15%
15.1% - 20%
20.1% - 25%
25.1% - 30%
30.1% - 100%
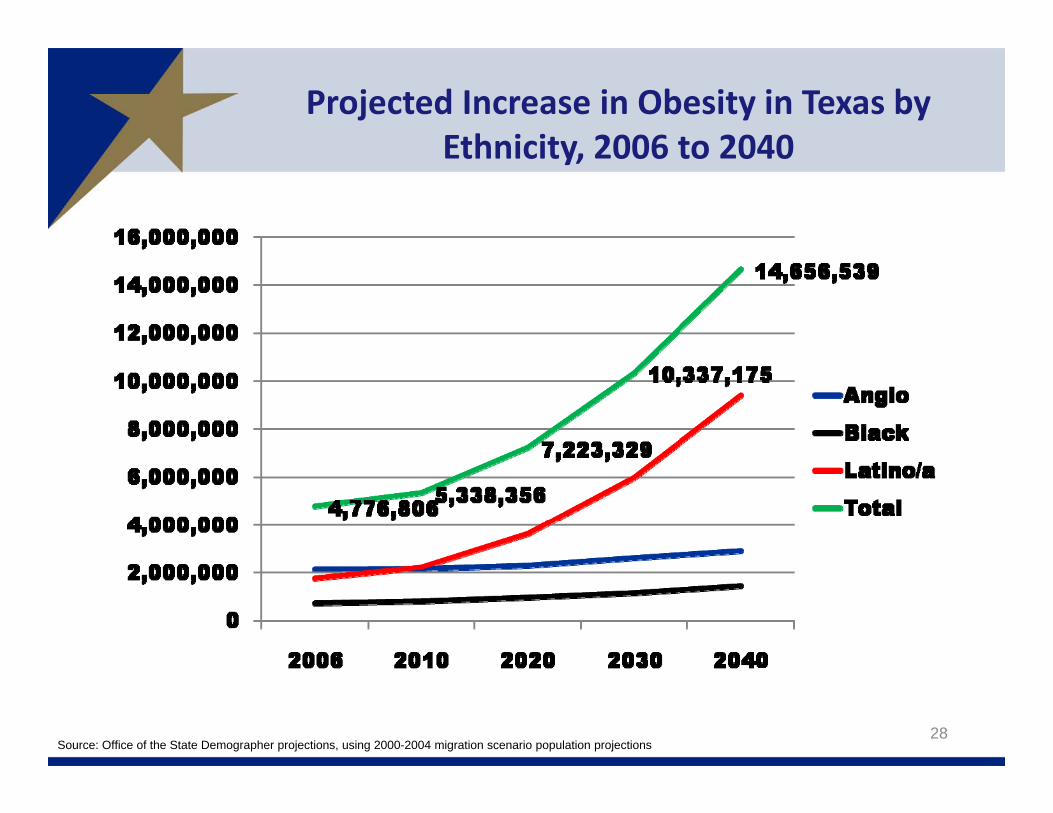
Projected Increase in Obesity in Texas by Ethnicity, 2006 to 2040
28Source: Office of the State Demographer projections, using 2000-2004 migration scenario population projections
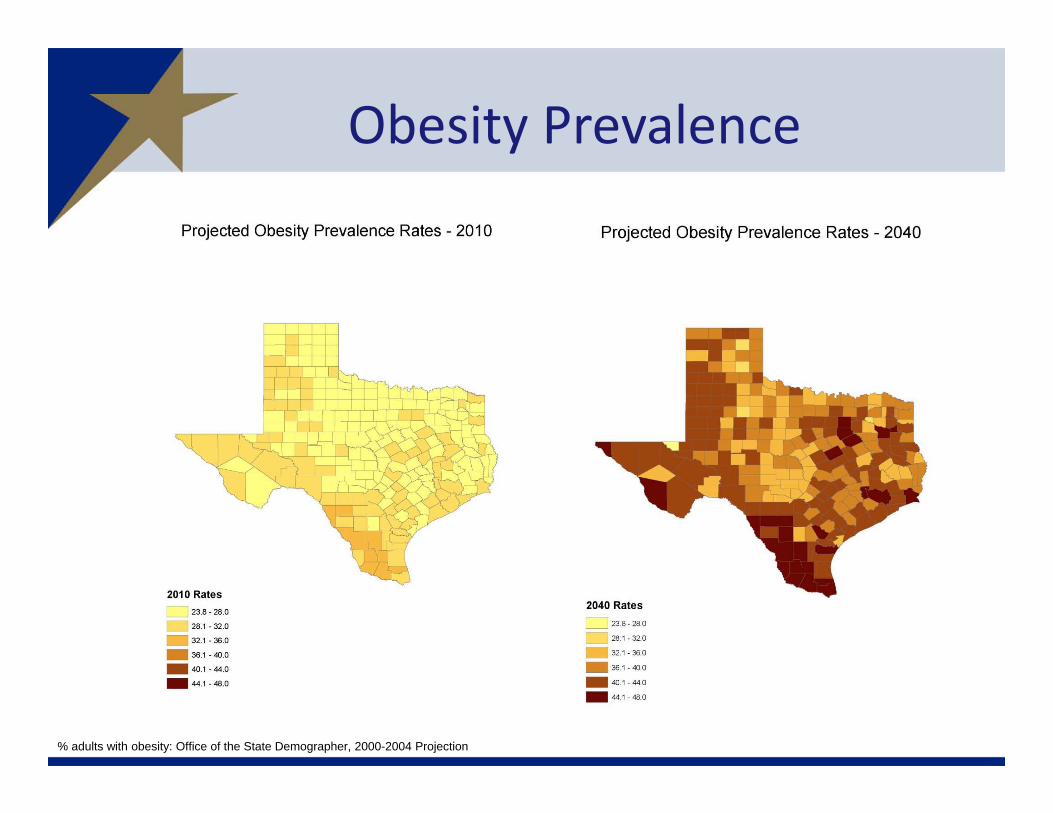
Obesity Prevalence
29% adults with obesity: Office of the State Demographer, 2000-2004 Projection
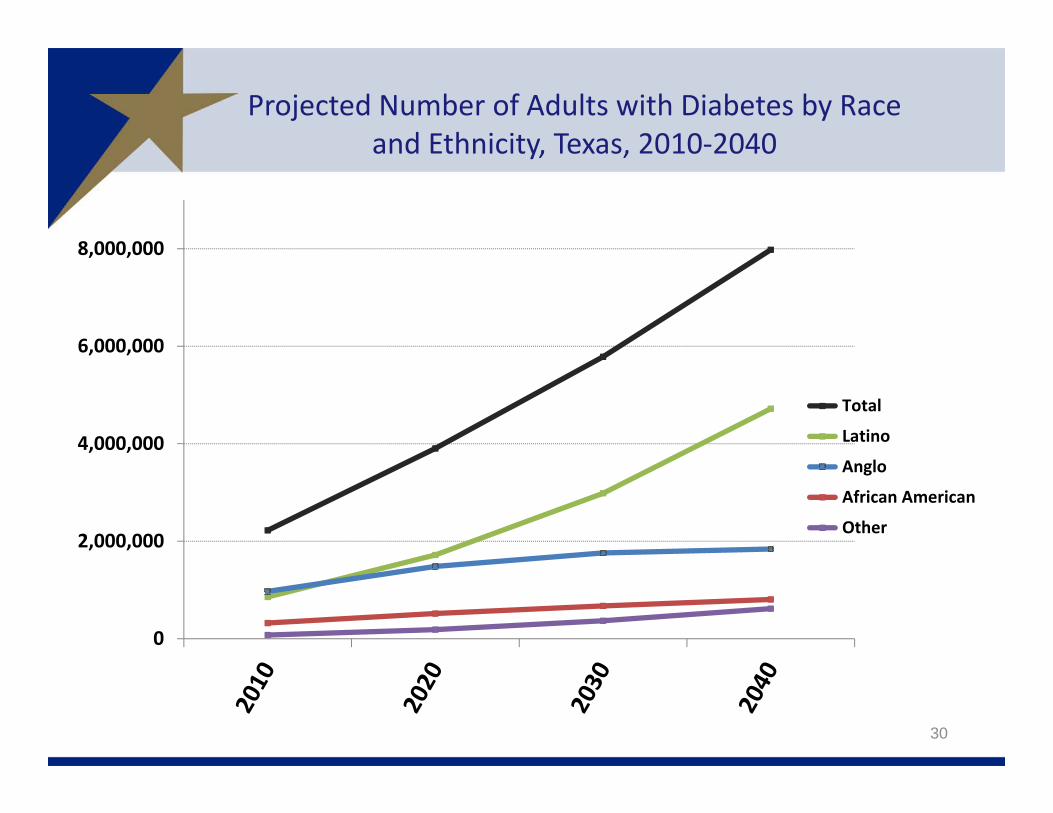
Projected Number of Adults with Diabetes by Race and Ethnicity, Texas, 2010‐2040
30
0
2,000,000
4,000,000
6,000,000
8,000,000
Total
Latino
Anglo
African American
Other
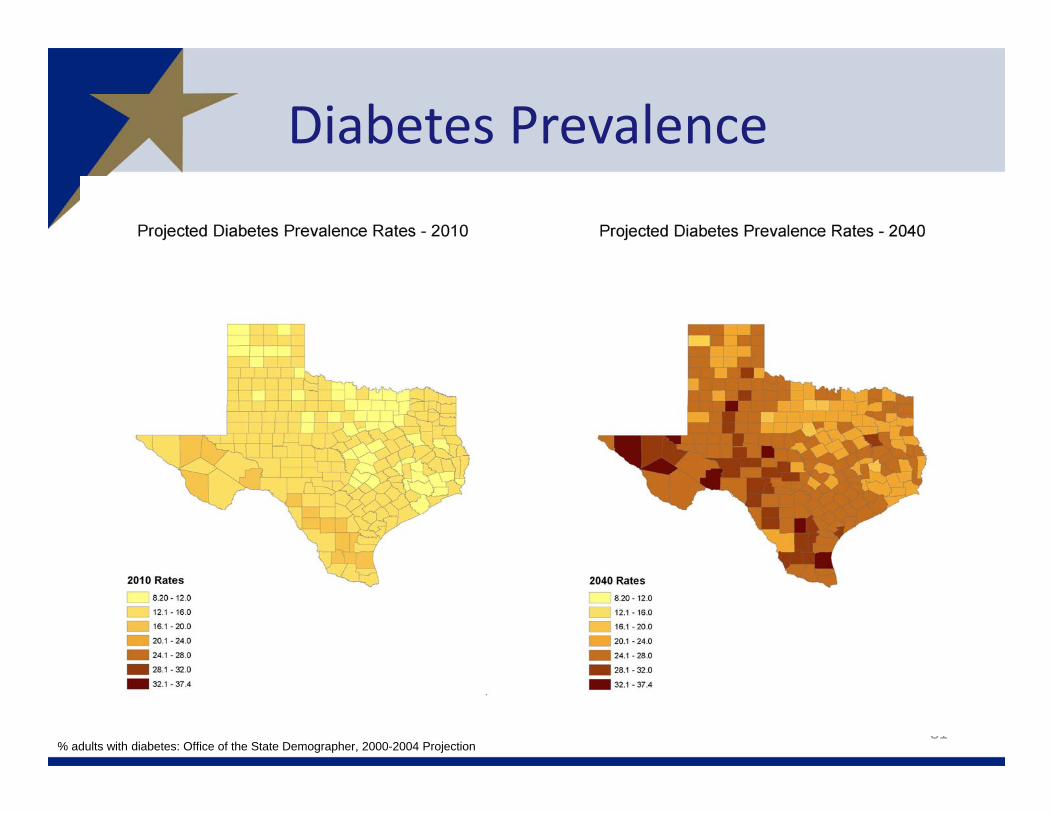
Diabetes Prevalence
31% adults with diabetes: Office of the State Demographer, 2000-2004 Projection
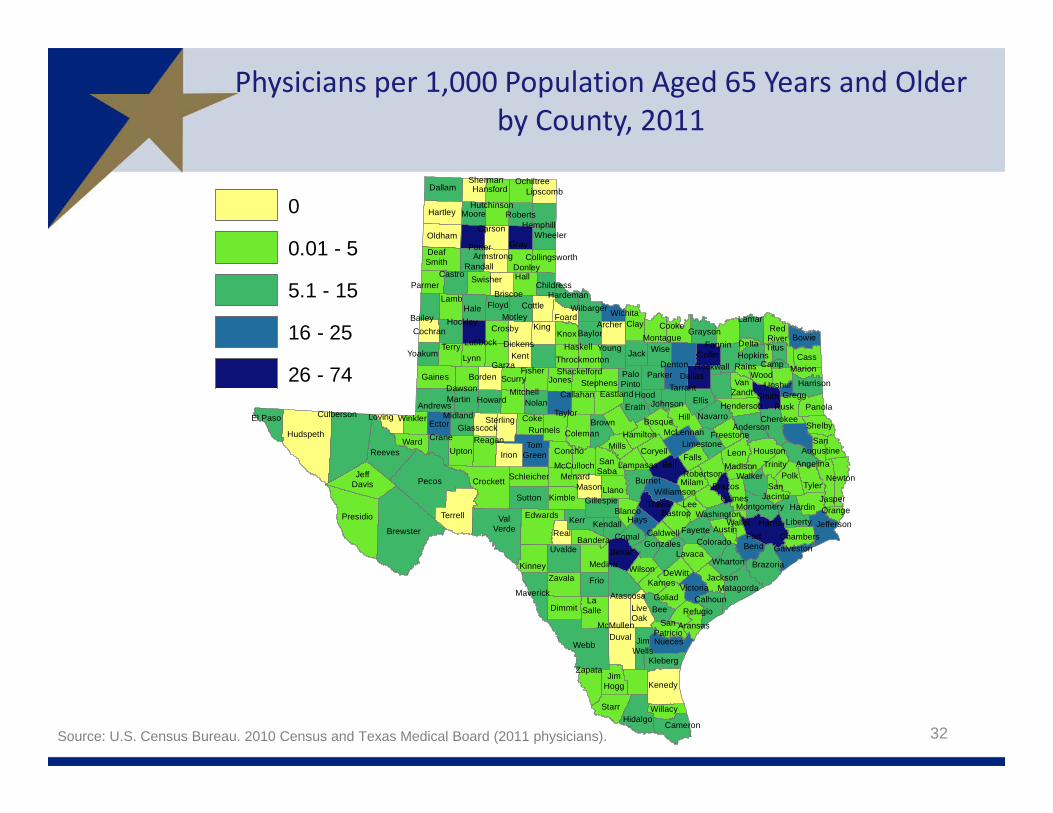
Physicians per 1,000 Population Aged 65 Years and Older by County, 2011
32Source: U.S. Census Bureau. 2010 Census and Texas Medical Board (2011 physicians).
Dallas
Howard
FoardFloyd
Brewster
Newton
Starr
Kinney
Collingsworth
TomGreen
Coleman
Brazoria
Leon
Duval
Lamb
Smith
JacksonMedina
Wheeler
Dallam
Callahan
Lamar
Coryell
Gaines
Kendall
Milam
Hays
Willacy
Johnson
Reagan
Webb
Shackelford
Bowie
Scurry
Kenedy
Oldham
Taylor
King
Borden
Walker
Stephens
DeafSmith
Roberts
Tyler
ValVerde
Brown
Parker
Harris
Zapata
RedRiver
Karnes
PaloPinto
Glasscock Shelby
Wood
Crosby
Refugio
Burnet
Sterling
Montgomery
SanAugustine
Rains
Nueces
Jack
Swisher
Camp
Brazos
Orange
Colorado
Pecos
Cochran
Parmer
Freestone
Winkler
Wichita
Gray
Schleicher
Hardeman
TravisGillespie
Yoakum
Fayette
Uvalde
Grimes
VanZandt
Throckmorton
Falls
Grayson
Ellis
Hall
Dickens
TrinityReeves
Marion
Terrell
Lynn
LaSalle
Jasper
Jones
Castro
Victoria
Kleberg
Briscoe
Clay
Matagorda
Runnels
Carson
Liberty
Lee
Hale
Bexar
Garza
Montague
Upton
Hamilton
Fisher
Dawson
Dimmit
Limestone
Hutchinson
Llano
Presidio
Eastland
Wharton
Rusk
Tarrant
Lavaca
Childress
Hidalgo
Moore
Menard
Edwards
SanPatricio
Terry
Crockett
Houston
Waller
Coke
Ward
Titus
Lampasas
Haskell
Martin
Atascosa
HemphillHartley
Young
Hardin
Gonzales
McMullen
Erath
Galveston
Hopkins
McLennan
MadisonMcCulloch
Donley
Kent
Real
Sutton
Midland
Hudspeth
Zavala
HarrisonMitchell
Navarro
Crane
LubbockWise
Washington
JeffDavis
El Paso
Gregg
Williamson
Lipscomb
Mason
Henderson
Hansford
Chambers
Hill
Potter
JimWells
Delta
Ector
Cameron
Maverick
Collin
Baylor
Panola
Bastrop
Austin
Andrews
Anderson
Blanco
DeWitt
Bandera
Bell
Aransas
Archer
Armstrong
Bee
Angelina
Bailey
Jefferson
Frio
Fannin
Goliad
Loving
Cass
FortBend
Bosque
Hockley
SanSaba
Kerr
Mills
Cooke
Wilbarger
Irion
Caldwell
JimHogg
Culberson
Upshur
Cherokee
Denton
Concho
Randall
Kimble
Knox
Polk
Hood
SanJacinto
Robertson
Wilson
Nolan
Cottle
Calhoun
Rockwall
LiveOak
Motley
Sherman Ochiltree
Comal
0
0.01 - 5
5.1 - 15
16 - 25
26 - 74
Contact
Office: (210) 458‐6530Email: [email protected]: http://osd.texas.gov
Lloyd Potter, Ph.D., M.P.H.
33
@TexasDemography