Embed Size (px)
Citation preview
DIVERSITY f$FWWBtl*4 P & U*?S?AJ?Y
THE AGRICULTURAL POTENTIAL IN ARID AND SEMI-ARID LANDS IN_ //KENYA: A CASE OF MASONGALENI SETTLEMENT SCHEME
By JOSEPH MATUU MUTINDA B.A (HONS) ,1991
A THESIS SUBMITTED IN PART FULFILMENT OF THE DEGREE OF MASTER OF
ARTS (PLANNING) OF THE UNIVERSITY OF NAIROBI.
SEPTEMBER, 1996.
DeclarationThis thesis is my original work and has not been presented
for a degree in any other university.
Candidate
JOSEPH MATUU MUTINDA
" This thesis has been submitted for examination with my
approval as University Supervisor"
11

DedicationThis work is dedicated to my Wife Lucy and my Daughter
Veronica and to my parents, brothers, sisters and friends who
contributed both financially and by words of motivation all
through my academic work.
iii

AcknowledgmentsI wish to express my sincere gratitude to all the people
whose support made this thesis work complete. First and
foremost I wish to thank my supervisor Dr. S. 0. Akatch and Mr.
E. 0. Mairura.
Dr. Akatch's constant criticisms and advice made possible the
perfection of this work. Mr. Mairura assisted in the initial
development of the research proposal.
I wish to thank other members of staff particularly Dr.
Obiero and Mr. Maleche and my fellow colleagues in class. I
appreciate their constant criticisms and moral support.
Thanks are due to Mr. Handley, H. Jenner (Co-Country
Representative for Kenya, Central Mennonite Committee).
Mr. Jenner, assisted with relevant textbooks and publications on
Arid and Semi-Arid areas in Africa and more specifically on
Machakos District.
Thanks to all Masongaleni Settlement Scheme Provincial
Administration Officers and various community leaders who made
this study a success.
I wish to thank Mr. John Mutua Mutinda and Josphat Kyalo
Mutinda who were field research assistants. They were quite
helpful in collecting relevant data from various respondents in
Masongaleni Settlement Scheme.
Thanks to those many individuals whose names are not
mentioned.
IV
AbstractThis study set out to analyze the agricultural potential in
a newly settled Masongaleni Settlement Scheme being an example
of an Arid and Semi-Arid land. The potentials here are the
under-utilized rainfed, irrigated agriculture and livestock
production particularly bee keeping. A comparison of selected
rainfed crop yields from Masongaleni Settlement Scheme and
similar ecological areas is used to identify the potentials of
the scheme.
On the irrigated crops, the study compares the farmers'
incomes from rainfed cash crops and the incomes that may be
realised from selected irrigated crops. The irrigated crops
earn the farmer much higher incomes as compared to the rainfed
crops. The new improved bee keeping method is identified as
untapped potential in the livestock sector. The study compares
the new improved bee keeping method to the traditional method
and finds that the new method is better.
The study identifies the major constraints to the tapping
of these potentials. Opportunities, strategies and solutions to
achieve sustainable development in Masongaleni settlement scheme
are identified.
However, solutions to the above constraints are necessary
if the potentials are to be fully tapped. In rainfed
agriculture, buying of FITs by the farmers is recommended. The
use of drought, pest and disease resistant crops is one of the
solutions. Timely planting, weeding and harvesting are other
v
solutions. The solutions to irrigated agriculture are:
application of appropriate pesticides, proper crop rotation,
timely planting, weeding and harvesting. Growing low irrigation
water requirement crops, tapping irrigation water from the
various rivers in the scheme are viable solutions. On the
livestock sector, AEOs should advise the farmers on the
appropriate veterinary medicine. The farmers should also
maintain land carrying capacity and rear small animals. The
adoption of the new bee keeping method is recommended. Clearing
of tsetse fly infested bushes and keeping tolerant animals is
recommended. A well organised management of the proposed
irrigation project is also recommended.
The study recommends an integration of rainfed, irrigated
agriculture and livestock farming. The study recommends that
future research be done to establish the cost of implementing
the proposed irrigation project and how such a cost should be
shared among the various agencies in the settlement scheme for
its implementation.
Future research should be done to attain a tsetse fly
eradication programme for Masongaleni Settlement Scheme and
other parts of the country.
Data collection for the study was derived from both primary
and secondary sources. The data was analyzed using descriptive
method.
vi
AbbreviationsFITS Farm Implements and Tools.
AAK Action Aid Kenya.
ET Evapotranspiration.
GOK Government of Kenya.
KARI Kenya Agricultural Research Institute.
AMREF Africa Medical Research Foundation.
CORPS Community Own Resource Persons.
GDP Gross Domestic Product.
AEOs Agricultural Extension Officers.
AIs Agricultural Inputs.
MOCSS Ministry of Culture and Social Services.
DDCs District Development Committees.
GVs German Volunteers.
MACOSUD Masongaleni Council For Sustainable Development
FAO Food and Agricultural Organization.
MIFCS Masongaleni Irrigation Farmers Co-operative
Society.
MOLRR&WD Ministry of Land Reclamation, Regional and Water
Development.
DCK Denmark Company of Kenya.
TARDA Tana and Athi Rivers Development Authority.
MOCD Ministry of Co-operative Development.
KIP Kibwezi Irrigation Project.
CINADO Centre for International Agricultural
Development Co-operation.
vii
USAID
IDRDU
CHEK
0 & M
ASALs
EIA
United States Agency for International
Development.
Institute of Dry land Research Development and
Utilization.
Council for Human Ecology Kenya.
Operation and Maintenance.
Arid and Semi-Arid Lands.
Environmental Impact Assessment.
viii
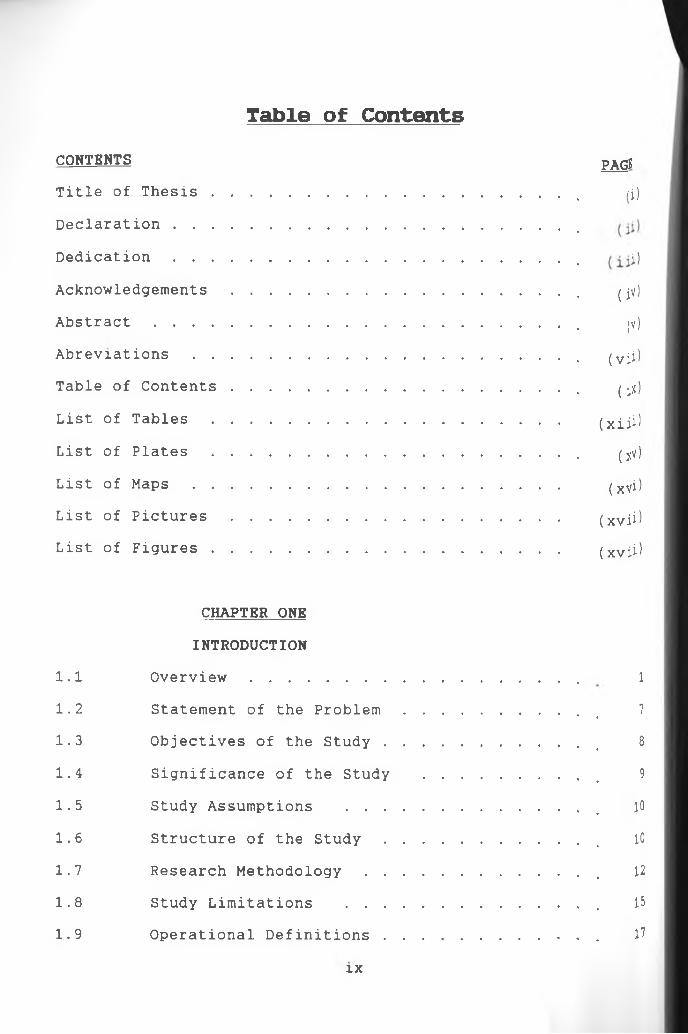
Table of ContentsCONTENTS PAGETitle of T h e s i s ......................................... % /j)
Declaration............................................. %
D e d i c a t i o n ............................................. % j)
Acknowledgements....................................... . jv)
A b s t r a c t ................................................, (v)
Abrevi a t i o n s........................................... , vii)Table of Contents....................................... , ($)
List of T a b l e s ....................................... (xii^
List of P l a t e s ......................................... . v)
List of M a p s ......................................... (xvi)
List of P i c t u r e s ..................................... (xvii)
List of Figures....................................... (xvii)
CHAPTER ONE
INTRODUCTION
1.1 O v e r v i e w ................................... . 1
1.2 Statement of the P r o b l e m .................. . 7
1.3 Objectives of the S t u d y ........................# 8
1.4 Significance of the Study ................. 9
1.5 Study Assumptions ............................ e 10
1.6 Structure of the S t u d y ........................_ 10
1.7 Research M e t h o d o l o g y .......................... 12
1.8 Study Limitations ............................ 15
1.9 Operational Definitions ...................... . 17
IX
CHAPTER TWOLITERATURE REVIEW
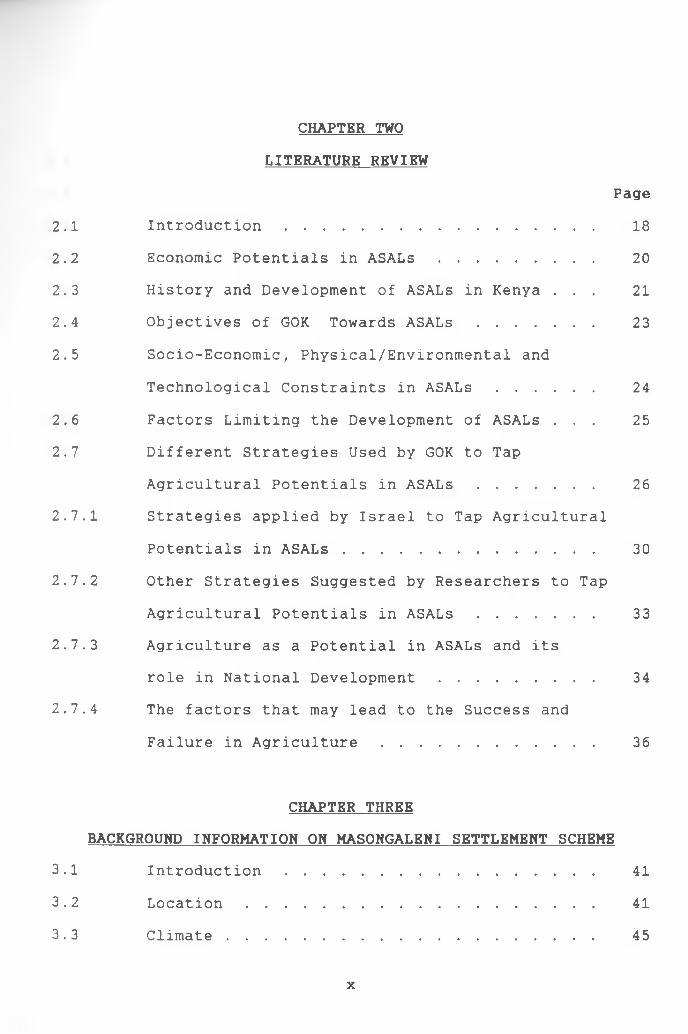
Page2.1 Introduction............................... 18
2.2 Economic Potentials in ASALs ................. 20
2.3 History and Development of ASALs in Kenya . . . 21
2.4 Objectives of GOK Towards A S A L s ......... 23
2.5 Socio-Economic, Physical/Environmental and
Technological Constraints in ASALs ........... 24
2.6 Factors Limiting the Development of ASALs . . . 25
2.7 Different Strategies Used by GOK to Tap
Agricultural Potentials in ASALs ............. 26
2.7.1 Strategies applied by Israel to Tap Agricultural
Potentials in A S A L s ........................ 30
2.7.2 Other Strategies Suggested by Researchers to Tap
Agricultural Potentials in ASALs .......... 33
2.7.3 Agriculture as a Potential in ASALs and its
role in National D e v e l o p m e n t ............. 34
2.7.4 The factors that may lead to the Success and
Failure in Agriculture ........................ 36
CHAPTER THREEBACKGROUND INFORMATION ON MASONGALENI SETTLEMENT SCHEME
3.1 Introduction............................... 41
3.2 L o c a t i o n ................................... 41
3.3 Climate...................................... 45
x
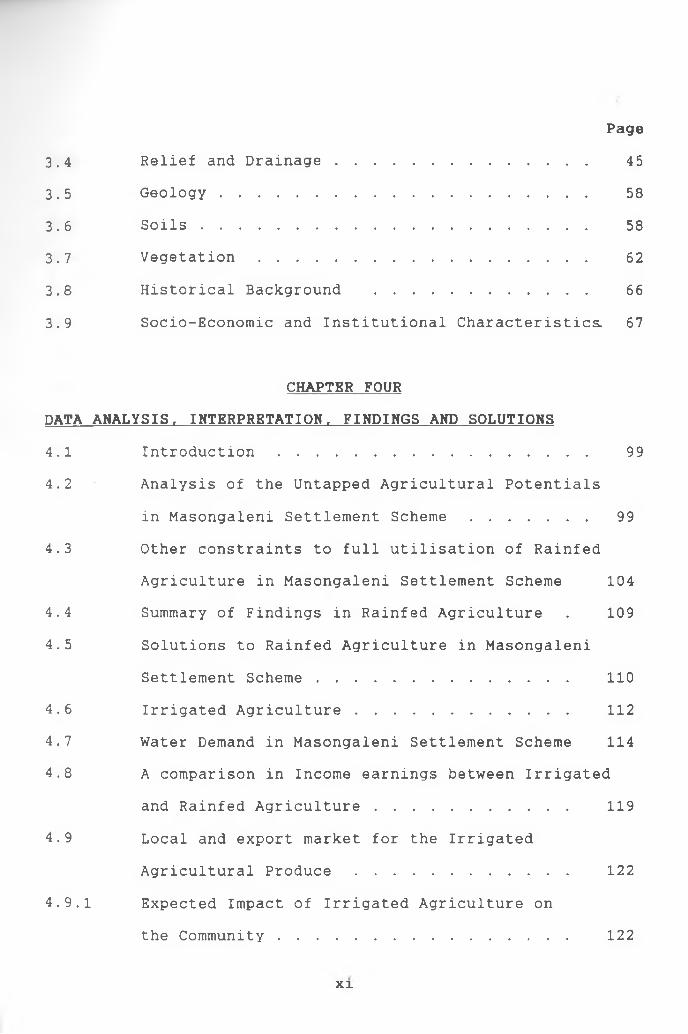
3.4 Relief and Drainage............................ 45
3.5 Geology......................................... 58
3.6 S o i l s ............................................ 58
3.7 V e g e t a t i o n ..................................... 62
3.8 Historical Background ........................ 66
3.9 Socio-Economic and Institutional Characteristics. 67
CHAPTER FOURDATA ANALYSIS, INTERPRETATION, FINDINGS AND SOLUTIONS4.1 Introduction................................... 99
4.2 Analysis of the Untapped Agricultural Potentials
in Masongaleni Settlement Scheme ............. 99
4.3 Other constraints to full utilisation of Rainfed
Agriculture in Masongaleni Settlement Scheme 104
4.4 Summary of Findings in Rainfed Agriculture . 109
4.5 Solutions to Rainfed Agriculture in Masongaleni
Settlement Scheme ............................ 110
4.6 Irrigated Agriculture ........................ 112
4.7 Water Demand in Masongaleni Settlement Scheme 114
4.8 A comparison in Income earnings between Irrigated
and Rainfed Agriculture ...................... 119
4.9 Local and export market for the Irrigated
Agricultural Produce ........................ 122
4.9.1 Expected Impact of Irrigated Agriculture on
the Community......................... 122
Page
xi
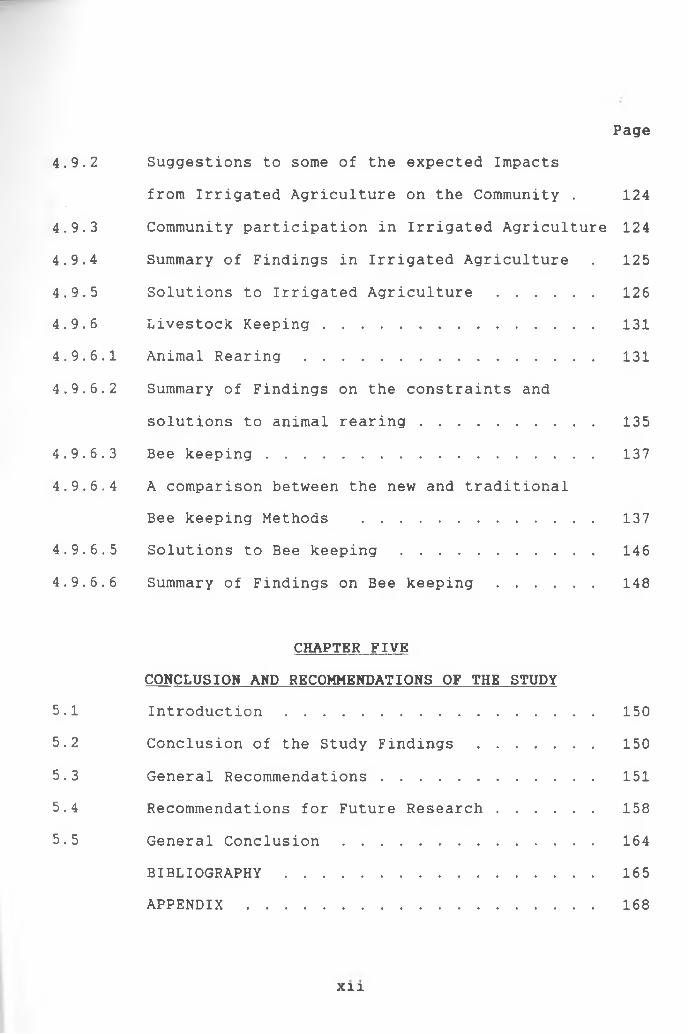
Page4.9.2 Suggestions to some of the expected Impacts
from Irrigated Agriculture on the Community . 124
4.9.3 Community participation in Irrigated Agriculture 124
4.9.4 Summary of Findings in Irrigated Agriculture . 125
4.9.5 Solutions to Irrigated Agriculture ........... 126
4.9.6 Livestock Keeping .............................. 131
4.9.6.1 Animal R e a r i n g ................................. 131
4.9.6.2 Summary of Findings on the constraints and
solutions to animal rearing ................... 135
4.9.6.3 Bee k e eping..................................... 137
4.9.6.4 A comparison between the new and traditional
Bee keeping Methods .......................... 137
4.9.6.5 Solutions to Bee keeping ...................... 146
4.9.6.6 Summary of Findings on Bee k e e p i n g ........... 148
CHAPTER FIVECONCLUSION AND RECOMMENDATIONS OF THE STUDY
5.1 Introduction................................... 150
5.2 Conclusion of the Study F i n d i n g s ............. 150
5.3 General Recommendations ........................ 151
5.4 Recommendations for Future Research ........... 158
5.5 General Conclusion ............................ 164
BIBLIOGRAPHY ................................... 165
A P P E N D I X ....................................... 168
Xll
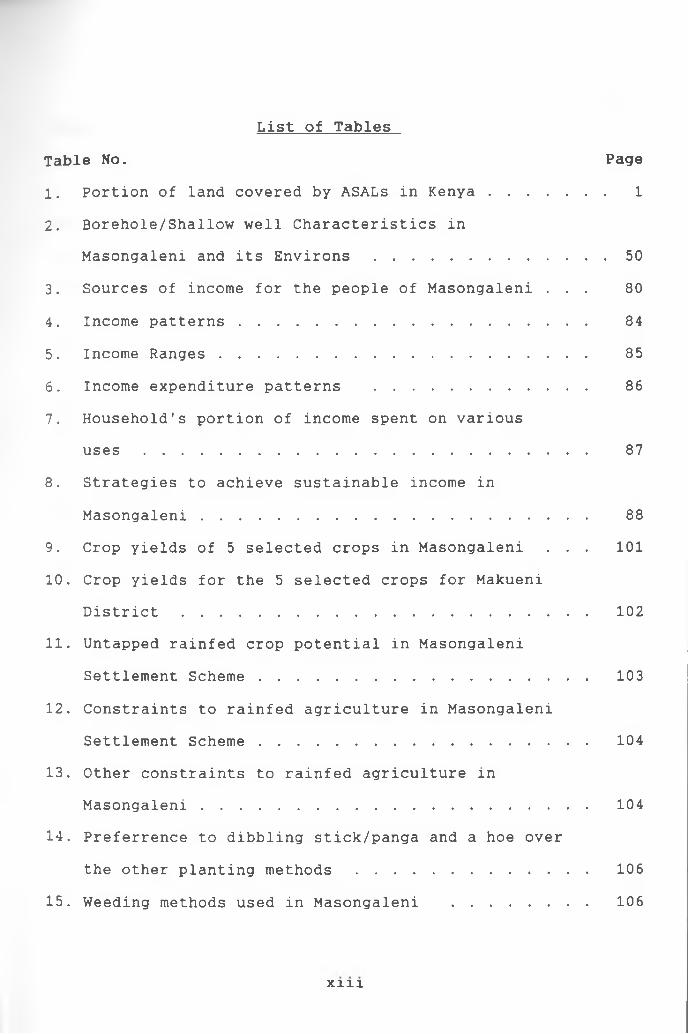
List of Tables
1. Portion of land covered by ASALs in K e n y a ........... 1
2. Borehole/Shallow well Characteristics in
Masongaleni and its E n v i r o n s ............................ 50
3. Sources of income for the people of Masongaleni . . . 80
4. Income patterns.................................... 84
5. Income R a n g e s ...................................... 85
6. Income expenditure patterns ........................ 86
7. Household's portion of income spent on various
u s e s .................................................. 87
8. Strategies to achieve sustainable income in
Masongaleni............................................ 88
9. Crop yields of 5 selected crops in Masongaleni . . . 101
10. Crop yields for the 5 selected crops for Makueni
D i s t r i c t .............................................. 102
11. Untapped rainfed crop potential in Masongaleni
Settlement Scheme ..................................... 103
12. Constraints to rainfed agriculture in Masongaleni
Settlement Scheme ..................................... 104
13. Other constraints to rainfed agriculture in
Masongaleni........................................ 104
14. Preferrence to dibbling stick/panga and a hoe over
the other planting methods .......................... 106
15. Weeding methods used in Masongaleni ............ 106
Table No. Page
x m
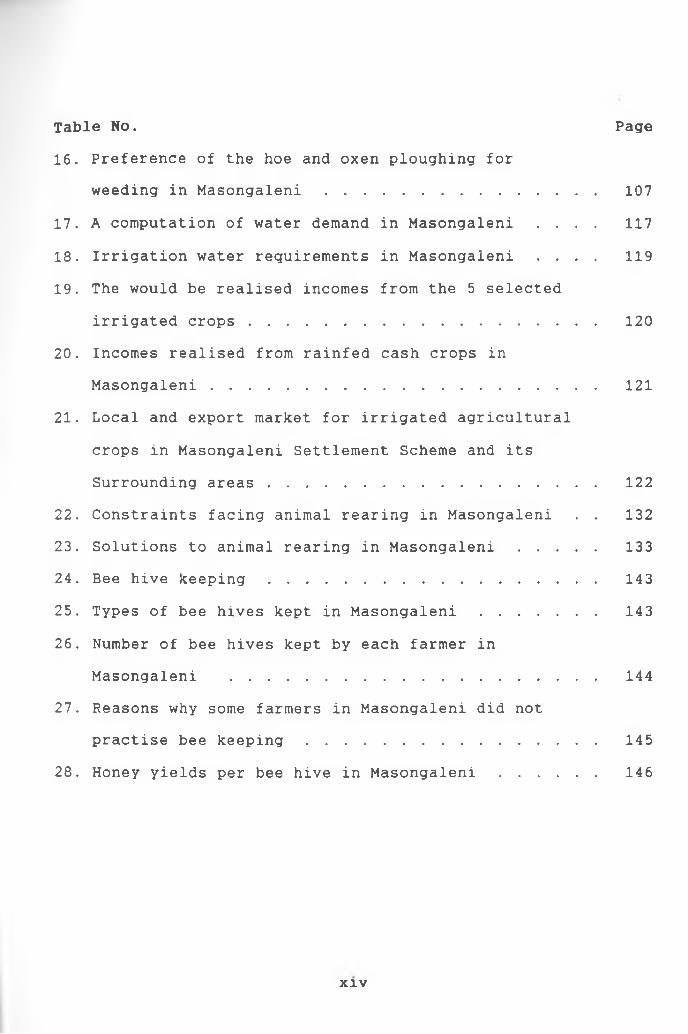
16. Preference of the hoe and oxen ploughing for
weeding in Masongaleni ............................... 107
17. A computation of water demand in Masongaleni . . . . 117
18. Irrigation water requirements in Masongaleni . . . . 119
19. The would be realised incomes from the 5 selected
irrigated crops ....................................... 120
20. Incomes realised from rainfed cash crops in
Masongaleni........................................ 121
21. Local and export market for irrigated agricultural
crops in Masongaleni Settlement Scheme and its
Surrounding areas ..................................... 122
22. Constraints facing animal rearing in Masongaleni . . 132
23. Solutions to animal rearing in Masongaleni ......... 133
24. Bee hive k e e p i n g .................................. 143
25. Types of bee hives kept in M a s o n g a l e n i .......... 143
26. Number of bee hives kept by each farmer in
Masongaleni ......................................... 144
27. Reasons why some farmers in Masongaleni did not
practise bee k e e p i n g ............................. 145
28. Honey yields per bee hive in M a s o n g a l e n i ........ 146
Table No. Page
xiv
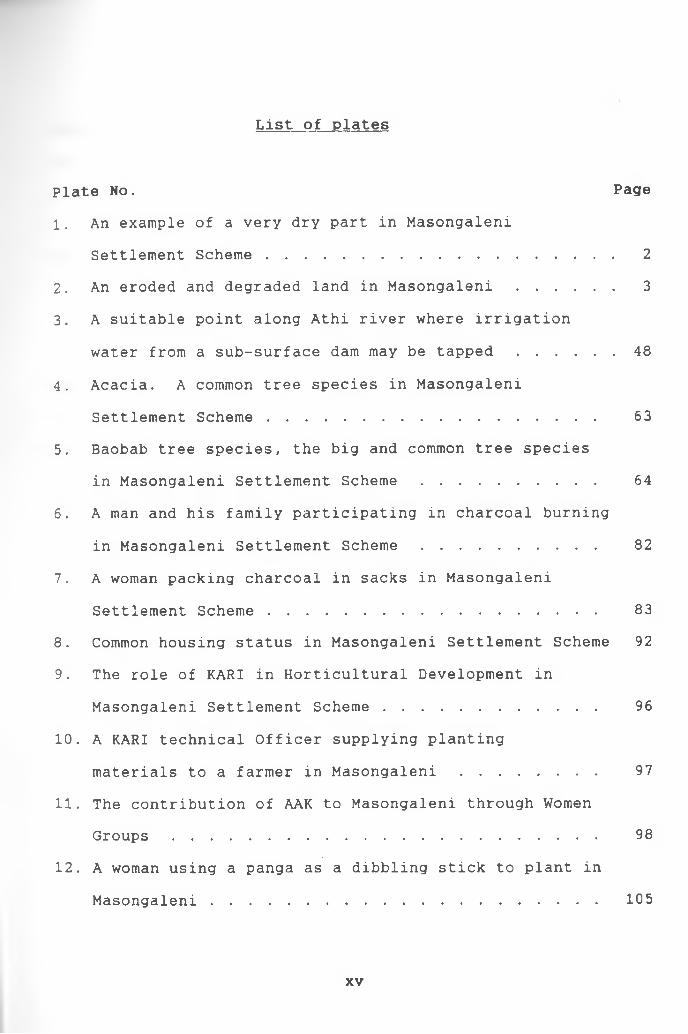
List of plates
Plate No. Page1. An example of a very dry part in Masongaleni
Settlement Scheme ....................................... 2
2. An eroded and degraded land in M a s o n g a l e n i ........... 3
3. A suitable point along Athi river where irrigation
water from a sub-surface dam may be t a p p e d ............. 48
4. Acacia. A common tree species in Masongaleni
Settlement Scheme ..................................... 63
5. Baobab tree species, the big and common tree species
in Masongaleni Settlement Scheme .................... 64
6. A man and his family participating in charcoal burning
in Masongaleni Settlement Scheme .................... 82
7. A woman packing charcoal in sacks in Masongaleni
Settlement Scheme ..................................... 83
8. Common housing status in Masongaleni Settlement Scheme 92
9. The role of KARI in Horticultural Development in
Masongaleni Settlement Scheme ........................ 96
10. A KARI technical Officer supplying planting
materials to a farmer in M a s o n g a l e n i .............. 97
11. The contribution of AAK to Masongaleni through Women
G r o u p s ................................................ 98
12. A woman using a panga as a dibbling stick to plant in
Masongaleni............................................ 105
xv

13. A mud grass-thatched house used for keeping the new
improved bee hives in Masongaleni and its surrounding
a r e a .................................................. 139
14. A man and his wife leaning against the new improved
bee h i v e .............................................. 140
List of MapsMap No. Page1. Location of Masongaleni settlement Scheme in Kenya . 42
2. Location of Msongaleni Settlement Scheme in the
Regional context ....................................... 43
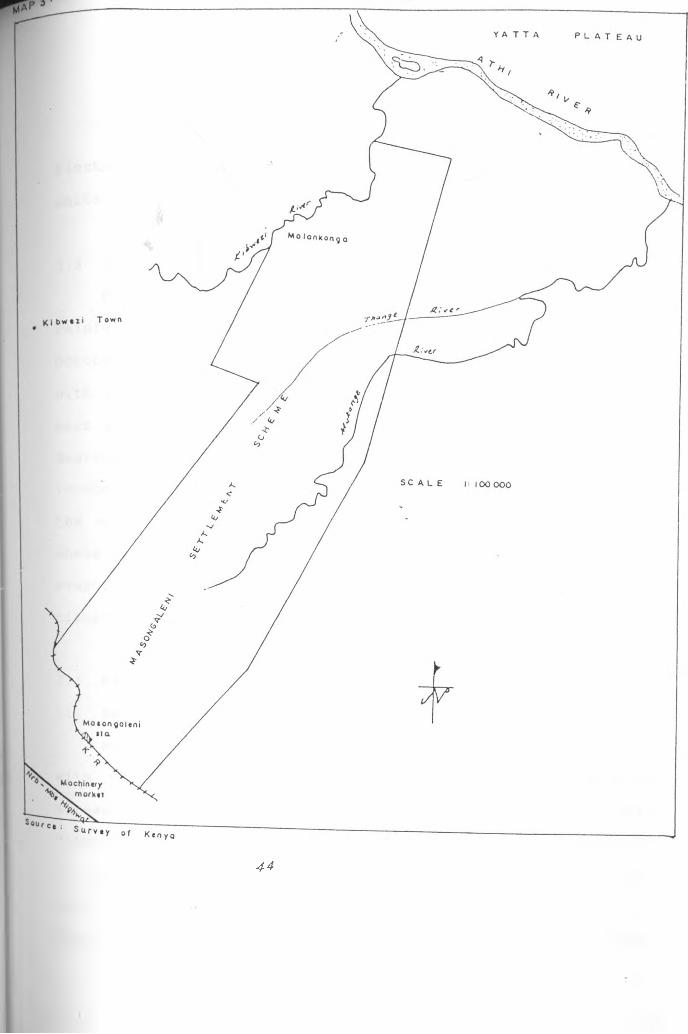
3. Location of Masongaleni in the local context .......... 44
4. Relief and drainage of M a s o n g a l e n i ......................56
5. Geology of m a s o n g a l e n i ................................... 60
6. Soils of M a s o n g a l e n i ..................................... 61
7. Vegetation of Masongaleni .............................. 65
Plate No. Page
xvi
List of Pictures
picture No Page1. A Typical Hut in which Bees are kept using the new
improved bee hives in Kibwezi near Masongaleni
Settlement Scheme ..................................... 141
2. The traditional bee hive in Masongaleni
Settlement Scheme ..................................... 142
List of FiguresFigure No Page
1. A conceptual Framework for Agricultural Potential
in A S A L s .................................................. 38
2. Mean Monthly and Annual R a i n f a l l ........................ 54
3. Cross sections across Masongaleni ...................... 57
4. Population Age S t r u c t u r e .................................68
5. The proposed manner on how the irrigation project
should be r u n ......................................... 160
6. The proposed Irrigation System ...................... 163
xvii
CHAPTER ONE
INTRODUCTION1.1 Overview
ASAL areas are unsuitable for rainfed cultivation due to
physical limitations such as aridity, poor soils and rough
terrain.
According to the official Kenya Atlas of 1970,(p.28) the
lands of Kenya are divided into six ecological zones based on
rainfall and moisture indices. Zone 1 is the wettest and zone
vi is the driest. The Arid and Semi-Arid Lands (ASALs) cover
zones iv, v and vi with mean annual rainfall ranging between 200
and 800 millimetres and a moisture index of -57 and -30.
Together the three zones in ASALs cover 473,000 km* as shown in table (1).
Table 1: Portion of land covered by ASALs in KenyaZone iv (Semi-arid) 5,8000km2 10%Zone v (Arid) 284,1000km2 49%Zone vi (Very arid) 131,000km2 23%Total land area 473,000km2 82% of Kenya's total
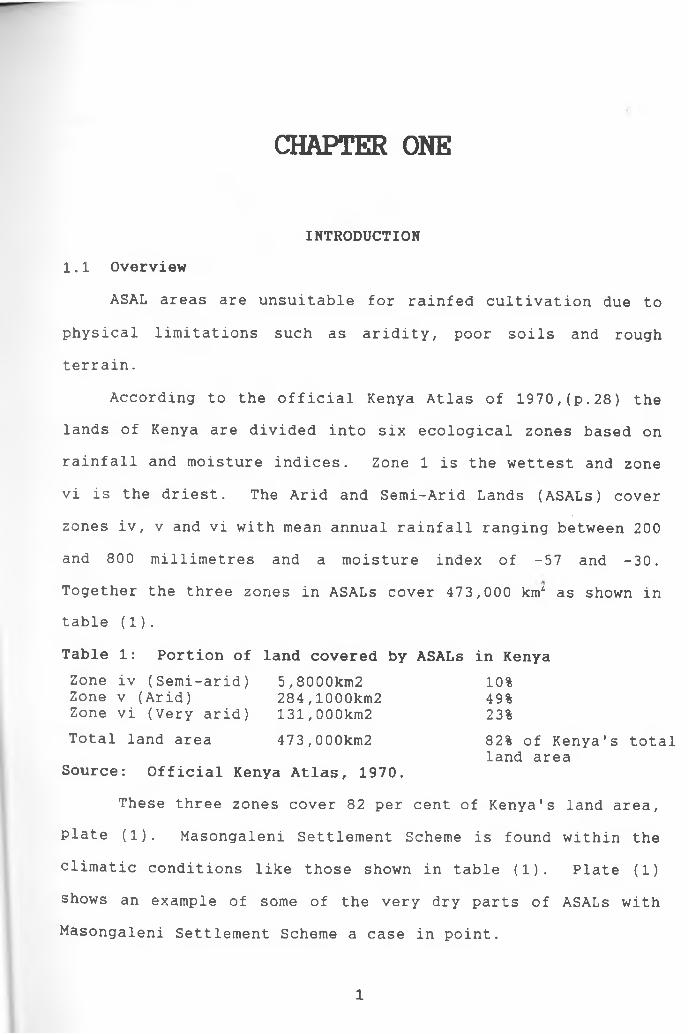
land areaSource: Official Kenya Atlas, 1970.These three zones cover 82 per cent of Kenya's land area,
plate (1). Masongaleni Settlement Scheme is found within the
climatic conditions like those shown in table (1). Plate (1)
shows an example of some of the very dry parts of ASALs with
Masongaleni Settlement Scheme a case in point.
1
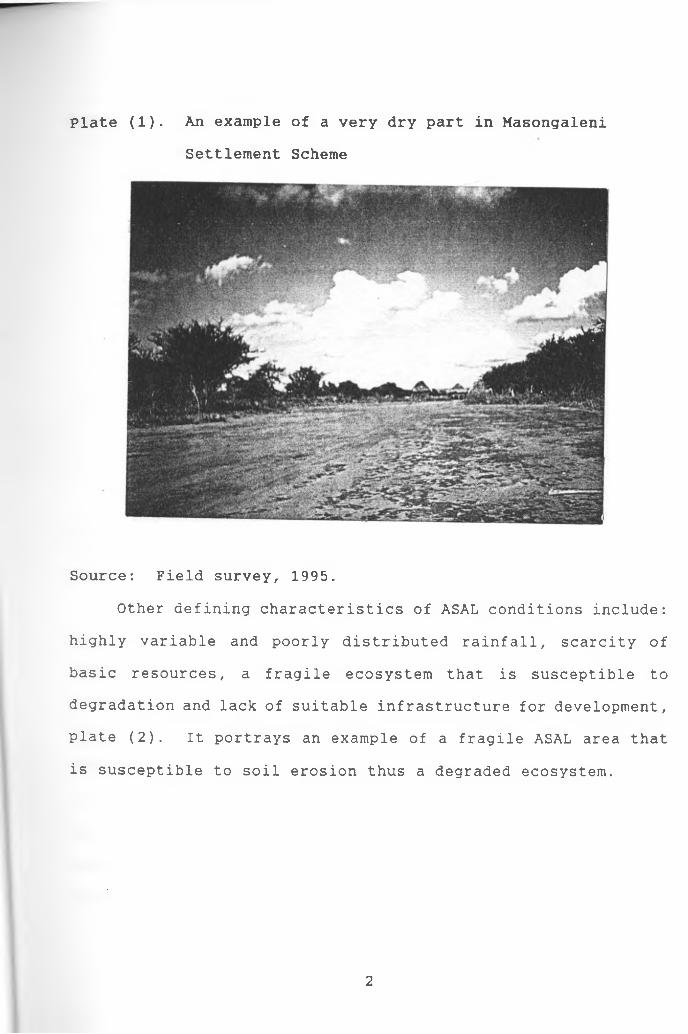
Plate (1). An example of a very dry part in MasongaleniSettlement Scheme
Source: Field survey, 1995.Other defining characteristics of ASAL conditions include:
highly variable and poorly distributed rainfall, scarcity of
basic resources, a fragile ecosystem that is susceptible to
degradation and lack of suitable infrastructure for development,
plate (2). It portrays an example of a fragile ASAL area that
is susceptible to soil erosion thus a degraded ecosystem.
2
Plate (2). An eroded and degraded land in MasongaleniSettlement Scheme
Source: Field survey, 1995.
From plate (2) it is evident that the ASAL areas in Kenya
have ecological conditions that may be characterised generally
as hot and dry with an evapotranspiration rate (ET) which is
more than twice the available rainfall. The typical picture is
that rainfall is between 250 and 1000 millimetres and an ET of
1500-2500 millimetres per year. Thus, Kenya's ASALs are
characterized by severe natural resource limitations, rising
population pressure and inadequate management of the existing
resource base, which combined constitute the basic problem
confronting the area and its people.
The majority of the ASALs' population are pastoralists
3
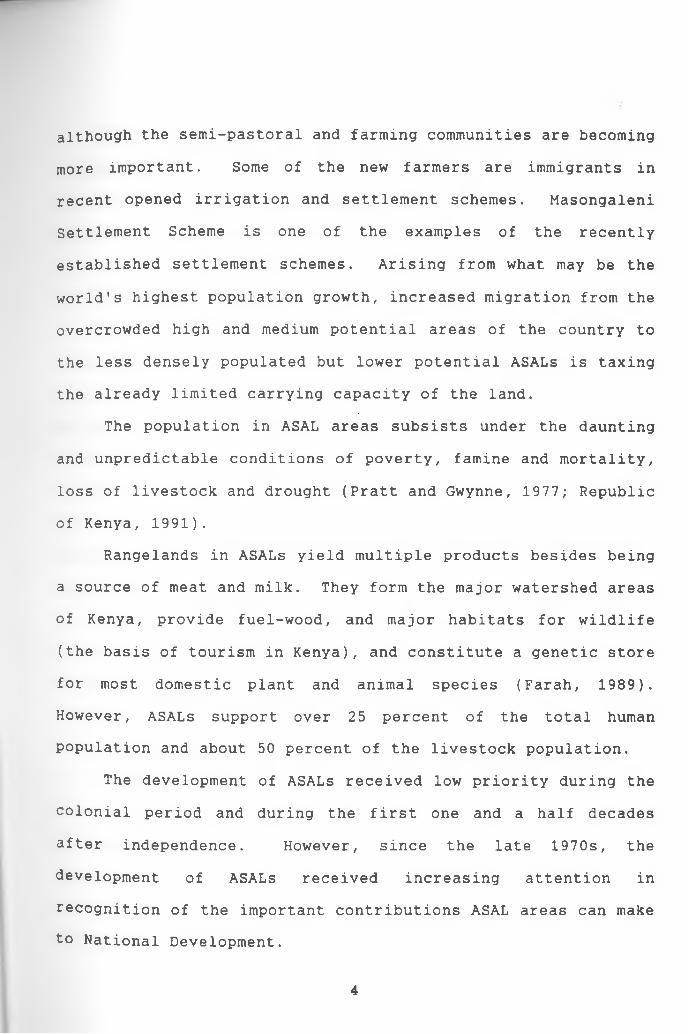
although the semi-pastoral and farming communities are becoming
more important. Some of the new farmers are immigrants in
recent opened irrigation and settlement schemes. Masongaleni
Settlement Scheme is one of the examples of the recently
established settlement schemes. Arising from what may be the
world's highest population growth, increased migration from the
overcrowded high and medium potential areas of the country to
the less densely populated but lower potential ASALs is taxing
the already limited carrying capacity of the land.
The population in ASAL areas subsists under the daunting
and unpredictable conditions of poverty, famine and mortality,
loss of livestock and drought (Pratt and Gwynne, 1977; Republic
of Kenya, 1991) .
Rangelands in ASALs yield multiple products besides being
a source of meat and milk. They form the major watershed areas
of Kenya, provide fuel-wood, and major habitats for wildlife
(the basis of tourism in Kenya), and constitute a genetic store
for most domestic plant and animal species (Farah, 1989).
However, ASALs support over 25 percent of the total human
population and about 50 percent of the livestock population.
The development of ASALs received low priority during the
colonial period and during the first one and a half decades
after independence. However, since the late 1970s, the
development of ASALs received increasing attention in
recognition of the important contributions ASAL areas can make to National Development.
4
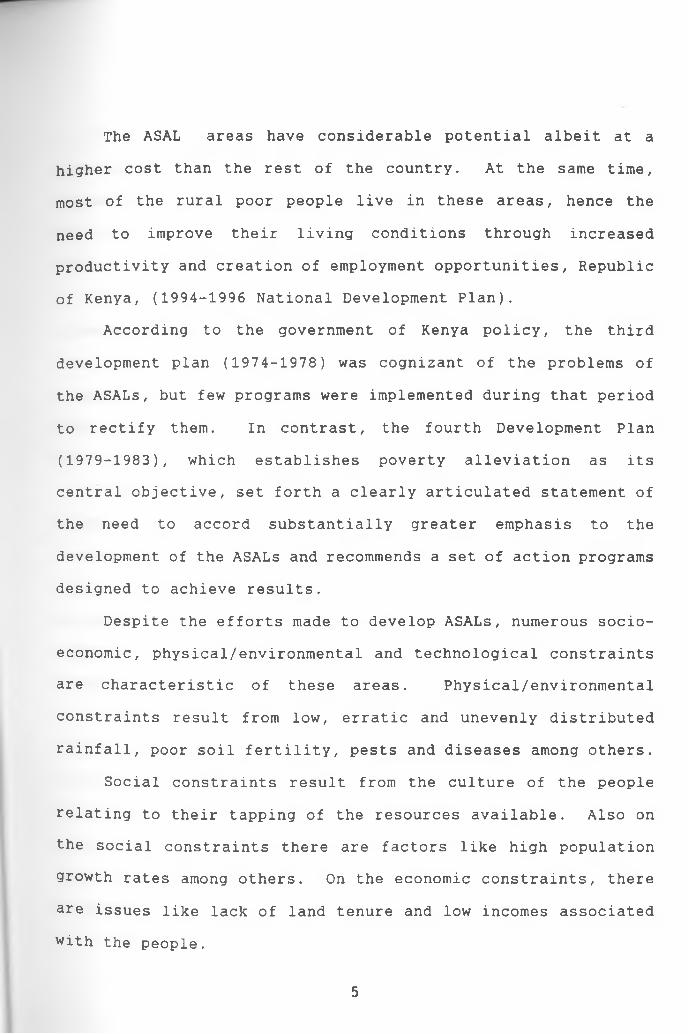
The ASAL areas have considerable potential albeit at a
higher cost than the rest of the country. At the same time,
most of the rural poor people live in these areas, hence the
need to improve their living conditions through increased
productivity and creation of employment opportunities, Republic
of Kenya, (1994-1996 National Development Plan).
According to the government of Kenya policy, the third
development plan (1974-1978) was cognizant of the problems of
the ASALs, but few programs were implemented during that period
to rectify them. In contrast, the fourth Development Plan
(1979-1983), which establishes poverty alleviation as its
central objective, set forth a clearly articulated statement of
the need to accord substantially greater emphasis to the
development of the ASALs and recommends a set of action programs
designed to achieve results.
Despite the efforts made to develop ASALs, numerous socio
economic, physical/environmental and technological constraints
are characteristic of these areas. Physical/environmental
constraints result from low, erratic and unevenly distributed
rainfall, poor soil fertility, pests and diseases among others.
Social constraints result from the culture of the people
relating to their tapping of the resources available. Also on
the social constraints there are factors like high population
growth rates among others. On the economic constraints, there
are issues like lack of land tenure and low incomes associated
with the people.
5
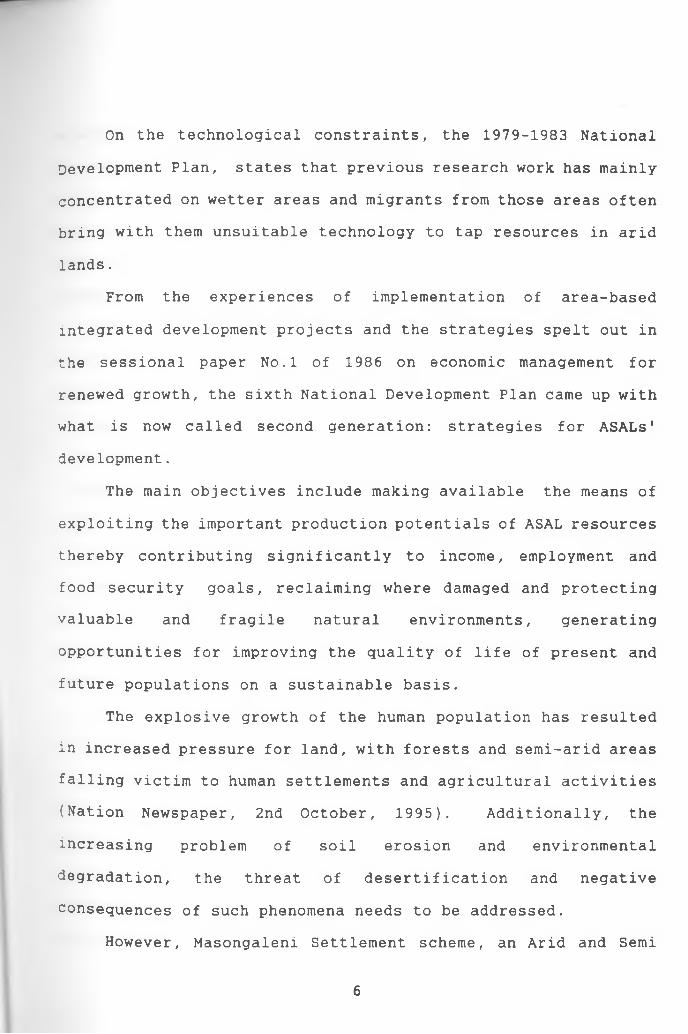
On the technological constraints, the 1979-1983 National
Development Plan, states that previous research work has mainly
concentrated on wetter areas and migrants from those areas often
bring with them unsuitable technology to tap resources in arid
lands.
From the experiences of implementation of area-based
integrated development projects and the strategies spelt out in
the sessional paper No. 1 of 1986 on economic management for
renewed growth, the sixth National Development Plan came up with
what is now called second generation: strategies for ASALs'
development.
The main objectives include making available the means of
exploiting the important production potentials of ASAL resources
thereby contributing significantly to income, employment and
food security goals, reclaiming where damaged and protecting
valuable and fragile natural environments, generating
opportunities for improving the quality of life of present and
future populations on a sustainable basis.
The explosive growth of the human population has resulted
in increased pressure for land, with forests and semi-arid areas
falling victim to human settlements and agricultural activities
(Nation Newspaper, 2nd October, 1995). Additionally, the
increasing problem of soil erosion and environmental
degradation, the threat of desertification and negative
consequences of such phenomena needs to be addressed.
However, Masongaleni Settlement scheme, an Arid and Semi
6
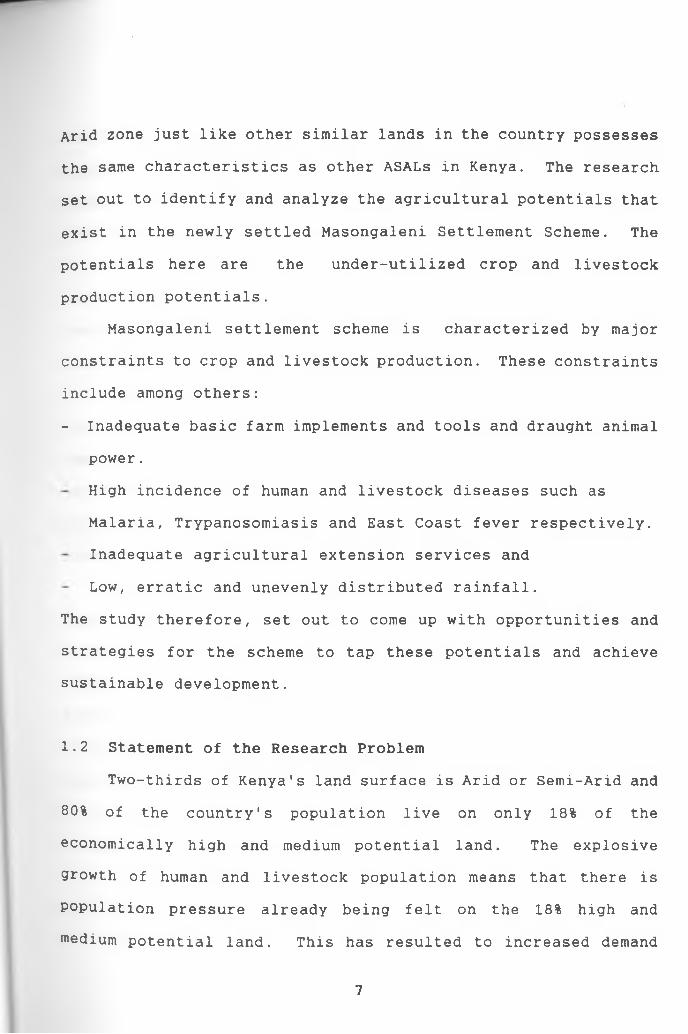
Arid zone just like other similar lands in the country possesses
the same characteristics as other ASALs in Kenya. The research
set out to identify and analyze the agricultural potentials that
exist in the newly settled Masongaleni Settlement Scheme. The
potentials here are the under-utilized crop and livestock
production potentials.
Masongaleni settlement scheme is characterized by major
constraints to crop and livestock production. These constraints
include among others:
- Inadequate basic farm implements and tools and draught animal
power.
High incidence of human and livestock diseases such as
Malaria, Trypanosomiasis and East Coast fever respectively.
Inadequate agricultural extension services and
Low, erratic and unevenly distributed rainfall.
The study therefore, set out to come up with opportunities and
strategies for the scheme to tap these potentials and achieve
sustainable development.
1.2 Statement of the Research ProblemTwo-thirds of Kenya's land surface is Arid or Semi-Arid and
80% of the country's population live on only 18% of the
economically high and medium potential land. The explosive
growth of human and livestock population means that there is
Population pressure already being felt on the 18% high and
medium potential land. This has resulted to increased demand
7
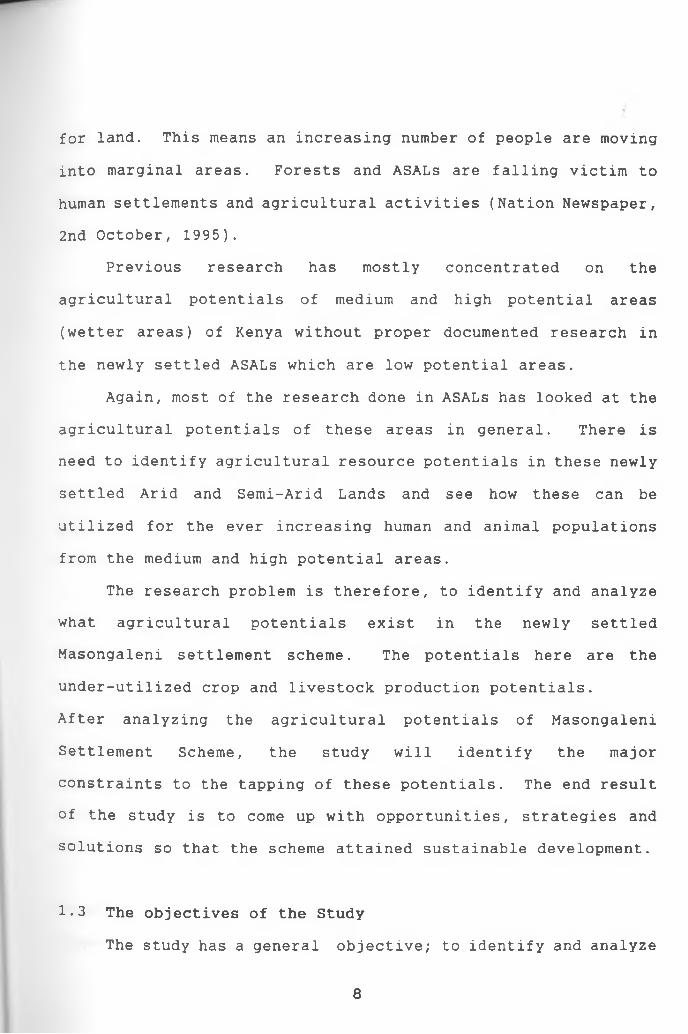
for land. This means an increasing number of people are moving
into marginal areas. Forests and ASALs are falling victim to
human settlements and agricultural activities (Nation Newspaper,
2nd October, 1995 ) .
Previous research has mostly concentrated on the
agricultural potentials of medium and high potential areas
(wetter areas) of Kenya without proper documented research in
the newly settled ASALs which are low potential areas.
Again, most of the research done in ASALs has looked at the
agricultural potentials of these areas in general. There is
need to identify agricultural resource potentials in these newly
settled Arid and Semi-Arid Lands and see how these can be
utilized for the ever increasing human and animal populations
from the medium and high potential areas.
The research problem is therefore, to identify and analyze
what agricultural potentials exist in the newly settled
Masongaleni settlement scheme. The potentials here are the
under-utilized crop and livestock production potentials.
After analyzing the agricultural potentials of Masongaleni
Settlement Scheme, the study will identify the major
constraints to the tapping of these potentials. The end result
of the study is to come up with opportunities, strategies and
solutions so that the scheme attained sustainable development.
1.3 The objectives of the StudyThe study has a general objective; to identify and analyze
8
The specific objectives are:(i) To find out the major constraints to crop and livestock
production in Masongaleni settlement scheme.
(ii) To come up with opportunities, strategies and solutions to
attain sustainable development in Masongaleni Settlement Scheme.
1.4 The Significance of the StudyThe study is very important because Masongaleni was
recently settled (in 1992) and no proper documented research has
been done in the Settlement Scheme especially on the
agricultural potentials that may be tapped in the scheme.
Also, from experience gained from the research interviews,
it was evidenced that no Environmental Impact Assessment (EIA)
was done in Masongaleni before the GOK settled the farmers in
the area. Therefore, this research would act as a model to
planning agencies on what environmental impacts and development
constraints would face the new settlers in their efforts to tap
the agricultural potentials in such areas if a prior
Environmental Impact Assessment was not done in similar
settlement areas in future.
Lastly, there was need to study the agricultural resource
potentiality in the scheme and see how these resources can be
tapped to achieve sustainable development.
the agricultural potential of the newly settled Masongalenisettlement scheme.
9
1 .5 Assumptions of the studyThe study assumes that:
(i) Inadequate farming implements, tools and lack of draught
animal power are the major constraints to full utilization
of crop production.
(ii) Tick and tsetse fly borne diseases are the major
constraints to livestock production.
(iii) There exists a variety of under-utilized crop and
livestock production potentials in Masongaleni Settlement
Scheme that need to be fully tapped.
1.6 Structure of the Study(i) Geographical scope
The research covered all the 8 blocks of Masongaleni
settlement scheme which has an area of about 106 square
kilometres. The project area is located East of Kibwezi
Township in Kibwezi Division of Makueni District, Eastern
Province of Kenya.
(ii) Main Statistical Research CoverageThe research set out to identify and analyze the
agricultural potential in the newly settled Masongaleni
Settlement Scheme. The major fields covered in this include:
The existence of under-utilized crop and livestock
production potentials.
10
Major constraints to full utilization of crop and livestock
production.
Possible opportunities, strategies and solutions for the
scheme to achieve sustainable development.
Chapter one gives an overview of ASALs. Chapter one also
covers the research problem, study objectives, significance of
the study, study assumptions, structure of the study, study
methodology, scope and limitations of the study and operational
definitions used in the study.
Chapter two contains the Literature Review of the study.
The chapter highlights literature on the following sub-topics:
- ASALs conditions
- Economic potentials in ASALs
- The history of the development of ASALs in Kenya
- The main objectives of the Kenyan Government towards ASALs
- The constraints to the exploitation of the potentials in the
ASALs
- The role of Agriculture in National development and some
factors that may lead to agricultural success or failure and
- The strategies adopted and suggested by the GOK, the Israeli
Government and other researchers to tap ASAL resources.
Chapter three provides the background information to
Masongaleni settlement Scheme.
Chapter four is the data analysis, interpretation, summary
of findings and solutions to the various constraints faced in
11
Chapter five covers the conclusion and recommendations of
the study.
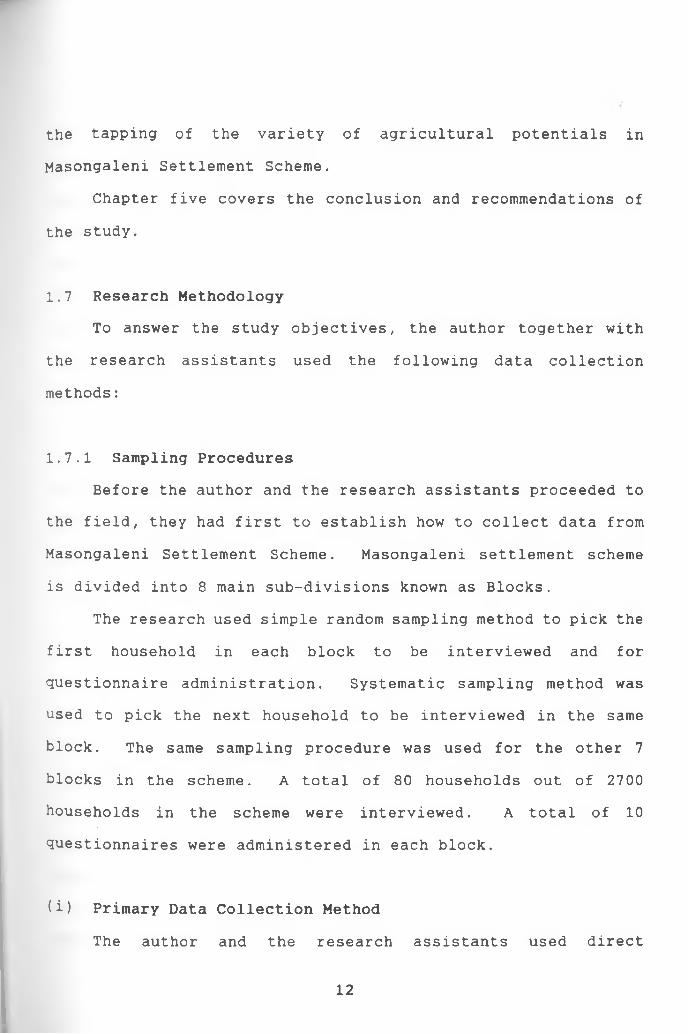
1.7 Research MethodologyTo answer the study objectives, the author together with
the research assistants used the following data collection
methods:
1.7.1 Sampling ProceduresBefore the author and the research assistants proceeded to
the field, they had first to establish how to collect data from
Masongaleni Settlement Scheme. Masongaleni settlement scheme
is divided into 8 main sub-divisions known as Blocks.
The research used simple random sampling method to pick the
first household in each block to be interviewed and for
questionnaire administration. Systematic sampling method was
used to pick the next household to be interviewed in the same
block. The same sampling procedure was used for the other 7
blocks in the scheme. A total of 80 households out of 2700
households in the scheme were interviewed. A total of 10
questionnaires were administered in each block.
(i) Primary Data Collection MethodThe author and the research assistants used direct
the tapping of the variety of agricultural potentials inMasongaleni Settlement Scheme.
12
observation in the field. Mettric, (1993: 172) suggests that
observing operations in the field gives the researcher an
opportunity to discuss with the farmers, what, why and how
things are done, besides checking what one is told against what
one sees. He adds that what farmers say and what they do may
not necessarily coincide. They may sometimes report about the
standard practice in the neighbourhood rather than what they
themselves do. Observation of relevant human activities and the
physical characteristics of the study area was therefore done.
Observations involved ascertaining of the physical presence
of certain items within the household, e.g animal and crop
husbandry activities, the sheds, crops grown and tools used
among others. Direct observation was conducted simultaneously
along with interviews during field visits. Photography was
also used as a method of collecting primary data.
(a) Questionnaire Administration
Questionnaire administration was used to collect primary
data. This research tool employed standardized questionnaires
with both closed and open ended questions. Both household and
institutional guided questionnaires were used.
Informants were allowed to respond freely in open-ended
questions. In guided and closed ended questions, the informants
were confined to give specific alternative answers, eg. yes/no,
for some questions. This enabled the author to generate
specific information on some of the issues probed. Prewitt
13
(1975) points out that a structured questionnaire is important
since it standardizes the stimulus presented to respondents.
Guided and closed questionnaires were used for different
categories of Officers. These included among others:
- The area Land Demarcation Officer,
- Agriculture and Livestock Development Officers.
- Kenya Agricultural Research Institute Officers.
- Environmental Officers.
- Officers from Action Aid Kenya (AAK) Kibwezi station.
- Small-holder irrigation individual projects neighbouring
Masongaleni settlement scheme.
- The District Officer, Kibwezi and
- Water Officers
(b) Field Survey
A field survey of Masongaleni Settlement Scheme was used
and this enabled the researchers have a general picture of the
Scheme.
(c) Informal Discussions
Besides interviewing the small holder farmers, the data
collected was enriched by holding oral discussions and informal
interviews with extension officers and local leaders of
Masongaleni settlement scheme. The discussions provided
additional information on the agricultural potentials of
Masongaleni settlement scheme.
14
(ii) Secondary Data Collection Method
Secondary method of data collection was also used by the
author and the research assistants. This involved acquiring
library and registry literature on Masongaleni settlement
scheme. Crane and Angrosino (1984) and Bernard (1988) suggests
that documentary information is indispensable in anthropological
research especially in its formulation stages.
Library research provided background information to the
subject matter of this study and Masongaleni settlement Scheme.
The literature reviewed provided the author with information on
how much has been done on the agricultural potential in
Masongaleni Settlement Scheme. The Literature reviewed enabled
the author to formulate the conceptual framework in Chapter Two
of this study.
1.8 Limitations of the Study
Masongaleni Settlement Scheme is divided into 8 main
divisions referred to as blocks. Due to differences in block
sizes, some of the blocks (like block 2) are sub-divided further
into small sub-divisions so that there is block 2A, 2B and 2C.
The researchers were only able to collect data from each
major block using the 10 households sample size. This means
that the sample size used was not based on the size of the major
blocks.
If there was adequate time for the field research, those
large blocks would have been given a higher sample size like 13
15
households. This is because as the size of the blocks
increases, it is likely to portray peculiar potential
characteristics that might require more time for a detailed
analysis. To counter act such a limitation, the author used
relevant secondary data.
Again it was not possible to get such population
characteristics as mortality rate and population growth rates.
This is because Masongaleni was recently settled (1992) and no
much records have been complied for the Scheme. There was only
one baseline survey done in Masongaleni Settlement Scheme by AAK
in 1992 which did not cover those population characteristics.
To counter act such a limitation, the author adopted a
population growth rate of 3.3%. This rate was used by the
MOLRR&WD in 1993 when the Ministry conducted research on water
resources in the areas neighbouring Masongaleni Settlement
Scheme.
16
1.9 Operational Definitions
1.9.1 Crop water requirement: According to FAO 1977, crop
water requirement is defined as " the amount of water required
to meet the water loss through evapotranspiration of a heavy
crop growing in a large field under no restricting soil
conditions, including soil water and fertility, achieving full
production under a growing environment".
1.9.2 Indigenous Knowledge. Indigenous Knowledge is used in
the study to mean technology which is based on experience.
Indigenous knowledge is based on experience which is personal,
particular, initiative, implicit, indecomposable and orally
transmitted.
1.9.3 Sustainable Development. The study uses Habitat's
definition of sustainable development. Sustainable Development
here is used to mean, meeting the needs of the present
generation without compromising the ability of future
generations to meet their needs and meeting human needs implies
recognising each person's right to a standard of living adequate
for health and wellbeing, including adequate access to food,
clothing, shelter, medical care and necessary social services
as stated by the universal declaration of human rights.
17
CHAPTER TWO
LITERATURE REVIEW
2.1 Introduction
ASALs are areas which are unsuitable for rainfed
cultivation due to physical limitations such as aridity and poor
rough terrain, inadequate, erratic and unreliable rainfall.
ASAL soil nutrient levels are low, structure is easily lost and
erodibility is high. ASAL areas are prone to frequent and
prolonged droughts. Even with the use of drought-resistant
crops, arable agriculture in these regions remains vulnerable
(Parkipuny, 1991).
According to an Arid and Semi-Arid Land pre-investment study
of Kitui, Embu and Meru in 1979 by Ng'ethe et al, some ASAL
areas are undergoing extremely high population growth rates.
This is attributed to migration from high potential zones
undergoing population pressure; internal movement within Arid
and Semi-Arid areas due to the carrying capacities being reached
or exceeded; establishment of settlement or irrigation schemes
and subdivision of large scale farms. The demand for
cultivation and grazing land contributes to illegal settlement
(Squatting), one type of which is found on special reserves of
state land and on the margins of game parks, on land owned by
Pastoral tribes and on large-scale ranches and farms in the
ASALs . Migrants often apply technologies inappropriate to their
18
newly acquired land, leading to further deterioration of the
fragile ecosystems. Land devastation, declining crop yields and
deteriorating farm systems diminish the quality and quantity of
food produced.
ASAL inhabitants live in dynamic and fluid environment
which incorporates complex values, beliefs and adjustment
mechanisms to stress conditions. People in ASALs view their
economic functions as complementary to social ones since
survival in such a harsh environment depends at least partially,
on traditional social insurance systems.
According to the classification system used by the GOK,
ASALs are comprised of:
Zone IV: Semi-arid with a moisture index of 30-42 and a mean
annual rainfall generally between 500-800 millimetres .
Zone V: Arid, with a moisture index of 42-51 and mean•annual
rainfall usually between 300-500 millimetres.
Zone VI: Very arid, with a moisture index of 51 - 57 and a mean
annual rainfall around 200-350 millimetres.
Zone IV contains 10 per cent of Kenya's total land mass; zone
V 49 per cent; and zone VI, 23 per cent.
Republic of Kenya (1994-1996) National Development Plan
states that the Arid and Semi-Arid Lands (ASALs) of Kenya make
up over 80 per cent of the Country's total land surface and
carry over 25 per cent of the total human population and
slightly more than half of the livestock population.
19
2.2 Economic Potentials in ASALsRangelands in ASALs yield multiple products besides being
a source of meat and milk. They form the major habitats for
wildlife (the basis of tourism in Kenya) and constitute a
genetic store for most domestic plant and animal species (Farah,
1989). The 1994-1996 National Development Plan states that
ASALs have a considerable potential albeit at a higher cost than
the rest of the country. Livestock is one of the economic
potentials in ASALs. According to Farah, K.O (1989), the
livestock sector in the Arid and Semi-Arid areas of Africa
provides millions of dollars in foreign currency annually in the
form of meat, milk, hides and breeding stock.
Kenya's economy is highly dependent on agriculture and over
90% of the country's rural labour force is dependent upon this
sector for employment (Anker and Knowles, 1983). Approximately
30-40% of the country's Gross Domestic product (GDP) is
generated from this sector as compared to 1 0 -1 2 % from
manufacturing, 10% from commerce, and 13-15% from the government
(Republic of Kenya, 1989 a).
The economic significance of agriculture in high, medium
and low potential areas is indeed a common factor in the whole
of sub-saharan Africa. Mcnamara (1991:7) observed that
agriculture is absolutely essential today and will continue to
be in foreseeable future to Sub-Saharan Africa's growth and
development. It contributes 34% of GDP, 40% of exports and 70%
of employment and it is the sector which the majority of
20
Africans depend on for their well-being and livelihood. At the
same time most of the rural poor live in ASAL areas, hence the
need to improve their living conditions through increased
productivity and creation of employment opportunities.
2.3 The History of the Development of ASALs in KenyaThroughout the colonial period, the development of the ASAL
areas was given low priority, a situation that persisted during
the first three post-independence Development Plan periods.
However, by the late 1970s, the Government took a major
evaluation of the potential that the ASAL areas could make to
the National economy. From this evaluation, policy re
orientation gave recognition to the importance of these areas in
National development and the need to accord them special
attention considering that:
(i) They have substantial potential for development though at
higher costs than the rest of the country;
(ii) Most of the poorer people live in these areas hence the
need to improve their living conditions through increased
productivity and creation of employment opportunities that
would enable them to equitably share the benefits of
development
(iii) The increasing problem of soil erosion and environmental
degradation, the threat of desertification and the negative
consequences of phenomena such as hunger and malnutrition
which manifest themselves most severely in these areas
21
often calling for diversion of public resources to famine
relief operations.
The first step in coming to terms with development of the
ASAL areas was the implementation of the marginal lands
pre-investment study project carried out in 1977 whose
results were published in the 1979 policy paper entitled:
The Arid and Semi-Arid Lands of Kenya - A frame work for
implementation, programme planning and Evaluation. Since
then, the ASALs' programme has dealt with integrated area
development projects in Machakos, Kitui, Baringo and
Turkana among other areas which have been met with varying
degrees of success. From experience gained in implementing
these area-based integrated development projects and in
view of the new strategy emphasizing renewed growth as
spelt out in sessional paper NO.1 of 1986, the approach to
ASAL development requires restructuring hence the need for
second generation strategies that will be implemented
during the plan period.
(iv) Determining ways and means of effecting symbiotic exchange
of resources and products between ASALs and the high
potential areas. The new ASALs' strategy will focus
attention on self-sustaining innovation and production
activities in the small-scale dry-land farming, irrigated
agriculture and pastoral sub-sectors. These in turn
requires support through specific policies and investments
in production of physical and social infrastructures which
22
will be necessary to overcome particular operational
constraints in ASAL areas.
In the National development plan of 1978, an Inter-
Ministerial task force began preparing a policy paper which set
forth the GOK's objectives, strategy, general plans, and
organization for implementing its ASALs Development program as
called for in the fourth Development plan. The document, Arid
and Semi-Arid Lands Development in Kenya: the framework for
implementation, program planning, and evaluation (hereafter
referred to as the ASALs Framework Document) was published in
May 1979. It set forth four principle objectives:
(i) Development of Human resources, recognizing that the people
of the ASALs are among the country's most disadvantaged;
(ii) Exploitation of productive potentials, recognizing that the
output realized in ASAL areas of other countries (the
middle East and North America) is far greater than that of
Kenya's ASALs;
(iii) Conservation of Resources, recognized as a "fundamental
objective of the program" and probably a pre-condition to
realizing the production potentials of the land and
(iv) Integration with the National economy to redress the
imbalance associated with past development investments
which were concentrated in the higher potential areas.
2.4 The main Objectives of the Kenya Government towards ASALsThe main objectives of the Kenyan Government on ASALs as
23
per the Sessional Paper N0.1 of 1986 include among others:
Making available the means of exploiting the important
production potentials of ASAL resources, thereby contributing
significantly to income, employment and food security,
reclaiming where damaged and protecting valuable and fragile
natural environments and generating opportunities for improving
the quality of life of present and future populations on a
sustainable basis.
2.5 Socio-Economic, Physical/Environmental and Technological Constraints in ASALsThe constraints to development of ASALs can be identified
as socio-economic, physical/environmental and technological.
(i) Social constraints arise from the cultural aspects of the
people which affect the tapping of ASAL resources
negatively.
(ii) Economic constraints arise from low incomes with the
majority of the ASALs' population. Other economic
constraints are lack of security of land tenure among
others.
(iii) Physical/environmental constraints result from low,
erratic and unevenly distributed rainfall, poor soil
fertility, pests and diseases. Under physical constraints
there is also the issue of rough terrain among others.
24
(iv) Technological constraints arise from use of unsuitable
technology by immigrants to exploit arid lands.
2.6 Factors Limiting Development of the Arid and Semi- Arid LandsTo achieve the objectives of the ASALs' programme,
solutions to a number of serious limiting factors will have to
be found. Before establishing a specific strategy of
development, it is important to set forth the major constraints
that must be overcome.
The environmental limits are the best known and the
overriding constraint. Limited and erratic rainfall makes the
present crop and animal production system marginal and risky in
these areas at the present level of technology. The result is
inadequate production to feed the population of the areas,
creating a dependence on outside relief.
Scarce resources often result in conflict between groups or
individuals for access to these resources. Given the limited
land potential and water availability, these must be allocated
in ways that encourage multiple use yet do not seriously reduce
the productive capacity of any one activity.
Limited and unadapted technology is a severe constraint.
Kenya's research programmes have generally focused on the high
potential areas. The plant varieties, farming systems, water
and conservation technologies needed for full production use of
these areas have not been fully developed or adopted for Kenya.
25
This is a major limiting factor on production. Knowledge of
Arid and Semi-Arid areas and of the nature of response to
development in pastoral economies also limits development.
Population and migration constraints are serious because
present land and water endowments and their distribution can not
support increased population using present technologies. The
problem is compounded by immigrants from higher potential areas
who bring farm systems suitable for the areas they have left but
which are potentially destructive to the environment in the
Semi- Arid areas.
2.7 Different Strategies Applied by GOK to Tap ASAL Potentials
Strategies to overcome the Socio-Economic, Physical/
Environmental and Technological constraints in ASALs should be
highlighted to overcome the various constraints experienced in
ASALs. These are discussed as follows:
(i) Dryland Farming Systems Development
According to the Republic of Kenya 1989-1993 National
Development plan, the leading activities in ASALs will hinge on
the continued development and demonstration of low-cost outlays
of technical packages through an accelerated Farming Systems
Programme (FSP). This will involve farmers co-operating in on-
farm trials and demonstrations and receiving free inputs and
where justified, food aid in compensation for land and labour
opportunity costs.
26
The improved packages will be widely demonstrated to
generate on-going beneficiaries and demand at the local level.
Promising or proven components will include agro-forestry
species, new drought resistant maize and sorghum varieties, the
latter grown on rationing mode for seed and drought period food
reserve, grain legumes, root crops and oil seeds. Vertically
integrated farming systems will be encouraged where they provide
accelerated access to improved farm incomes. Oxen training and
supply of ox-drawn equipment including ox-carts for farm-market
access will be expanded.
Soil and water conservation methods such as terracing and
water harvesting will be integrated within the improved farming
systems. Enhanced vegetative cover in inter-cropping, relay
cropping, agro-forestry and organic structure systems,
improvement for water retention such as composting, the use of
green manure and mulching will be encouraged. Pastoral Systems
and development of livestock remains the most profitable way of
utilising the extensive rangelands of ASALs. The viability of
the pastoral and nomadic systems will be enhanced through
improved disease control, range rehabilitation, production of
supplementary feed and food crops using water harvesting
techniques and various silvo-pastoral agro-forestry systems.
Pastoralists will be encouraged to match livestock numbers
more closely to wet season and post-drought rangelands carrying
capacities while reducing these numbers to match combined
grazing, irrigated fodder and reserve feed supplies in the dry
27
season. The 1989-1993 National Development Plan in Kenya
states that in so doing, the GOK will ensure that the role of
livestock in the community, food security systems is
strengthened and supplemented in several ways. These include
reliable food cropping, improved cash returns from livestock
sales reflecting higher animal quality, and access if all
fails, to reliable famine relief and post-drought recovery
programmes centred on state ranches and incorporating breeding
stock entitlement and food-for work components.
(ii) Promotion of Bee keeping
Bee keeping is one of the strategies emphasized as a
strategy to tap ASAL potentials. Bee keeping can increase
incomes for the residents of ASAL areas who have little or no
land or livestock. Recent experience indicates that modern bee
keeping is particularly suited to women groups and lessons from
traditional bee keepers are being carefully assimilated.
(iii) Small-Scale Irrigation Development in ASALs
There has been a long history of successful low-cost small-
scale irrigation schemes in ASAL areas extending back to the
pre-colonial era. However, in recent years, pre-occupation with
the development of large scale irrigation schemes in the country
has caused these past achievements to be ignored. The 1989-1993
National Development Plan states that, when new schemes are
Proposed for the ASAL areas , the basic approach will be to
28
adopt accessible irrigation technology to the needs of smaller
units. New irrigation Schemes of this kind, rehabilitation of
older ones and improved maintenance of irrigation works will be
accorded high priority.
The 1989-1993 National Development Plan again states that
more efficient use of water for agricultural production in ASAL
areas will be secured by water harvesting techniques of all
kinds in areas far from river basins. The higher rainfall
portions in Arid areas will adopt the development of various
water conservation structures especially the integrated network
of drains and small dams constructed through food-for-work and
Harambee labour to provide high pay-off supplementary irrigation
water.
In the lower rainfall areas, new techniques including the
triangular and trapezoidal bands often referred to as the Kitui
Ridges will be applied where appropriate. The same National
Development Plan (1989-1993) states that even where potential is
known to exit, ground water resources have so far not been
utilised to any significant extent in the ASAL areas.
Technology is already available for the economic delivery of
water to plants which make effective use of the restricted
supply of ground water in the form of drip irrigation.
(iv) Institutional Arrangements for ASAL Planning & Management
Since the initiation of the ASAL programme in 1979 ,
activities in these areas have been co-ordinated by the
29
Rural Planning Department of the Ministry of Planing and National Development. Over time, the Rural Planning Department
has evolved as the focal point for the planning and co
ordination of the programmes in ASALs. This evolution has been
further extended within the context of the District Focus for
Rural Development strategy.
2.7.1 Strategies applied by Israel to Tap Potentials in ASALs:
A case study of Negev (Israel)
Negev is one of the largest desert areas in Israel.
Through the Jewish National Fund, the Israeli Government has
adopted a variety of strategies to fight the desert conditions
in Negev. These strategies are discussed below.
(i) Afforestation Programmes
The role of afforestation in Semi-Arid zones in Negev is
not a fundamental factor in redeeming the desert and checking
its further invasion into fertile land. Long term research and
development in desert ecology in Israel has shown that by proper
management, the process of desertification can not only be
halted, but can be reserved. Planting trees in desert lands has
some major aims and same for all countries. These are to:
(a) Provide some greenery and shade near settlements for
recreation and livestock.
(b) Establish shelter belts around settlements, industrial
30
plants, agricultural crops and grazing fields to provide protection against hot winds and dust storms.
(c) Protect the soil and roads against water and wind.
(d) Provide fuel wood, charcoal and other minor products.
The only available land in which to expand Israeli
agricultural base and disperse the population, thereby easing
the pressure on the central part of the country lies in the
desert. Making the Negev an attractive, more productive region
has been given high priority officially. Thus the creation of
a pleasing visual contrast to the barren dry landscape as well
as the creation of a health ecological system is of utmost
importance.
Planting in a Semi-Arid zone for instance, in order to push
the desert back as far as possible, trees and bushes are now
being planted in the Northern parts of Negev (200 millimetres of
rainfall) creating overtime a new scenery. The most effective
planting method in these areas is based on the principle of
catching run off and of a small number of trees per unit area.
Habitat (1990 ) states that capturing the run off water which
may account for up to 60 percent of the total precipitation also
reduces soil erosion and preserves agricultural lands.
(ii) Development of Water Sources
Development of water sources in Arid zones has been viewed
as an integral part of land development (Habitat 1990). Simply
Put, the more water, the more land can be developed for
31
agricultural use and the creation of pleasant environments. The
existing conventional water sources in Israel are few, so non-
conventional sources are being developed in the following ways:
(a) Dams for catchment of run off water.
(b) Dams for enrichment of the existing aquifer by stopping the
flood water flow and letting it seep into the ground for
sub sequent pumping.
(iii) Waste waters
In Israel the most effective use of recycled waste waters
that can not be put to agricultural use is for the planting of
groves and parks. About 200 hectares of parks and groves are
currently being irrigated with recycled waste waters (Habitat,
1990). Brackish water, saline water containing (1000-2000 parts
per million (pmm) at times even more) can be used. The soluble
salts are being used for irrigation purposes, either for salt
tolerant agricultural crops or for planting trees and
establishing recreational spots mainly in the Negev Highlands
and the Avava valley.
(iv) Savannization
According to Habitat (1990), Jewish National Fund unveiled
Plans for a new strategy to reverse the trend of
desertification. Savannization is a process that involves
creation of a relatively high productive eco-system within the
productive desert to raise the value of otherwise barren
32
land. In the process of savannization, the few shrubs and soil
crust associated with the desert are replaced by trees and
grasses. This process is practised in Negev and it can only be
developed by implementing water harvesting techniques in which
water run-off is utilized to supplement scarce rain water.
Savannization techniques in the Negev desert include:
(a) Agro-technical activities for run off harvesting(b) Soil conservation activities.
(c) Tree planting.
(d) Increasing the productivity of plants and animals in the
desert.
2.7.2 Other Strategies suggested by Researchers
The most important ASAL land-use problem is how to conserve
water and soil for livestock and secondarily crop production.
According to Kiriro et al (1991), development experts now
recognise that traditional societies copped poor soils and
shortage of water by adopting agricultural practices which
emphasized people moving over large areas to utilise the little
water available. People also used the vegetation which was
Produced by the scattered rain for their livestock. Although
experts have for a long time ignored the knowledge which the
People developed to cope with the scattered rainfall, they are
now finding that such traditional knowledge is not only useful
^ut also important if the Semi-Arid areas are to be developed.
Already new institutions are being set up in different parts of
33
the world to tap such knowledge and incorporate it into other
formal research activities.
Kiriro, A. et al (1991), states that one of the most
important traditional agricultural techniques was slash-and-
burn. The authors state that a farmer came to an area which was
not farmed and cut the existing bush but made sure some of the
fruit and construction trees were left standing. This was a way
of preserving the environment.
2.7.3 Agriculture as a Potential in ASALs and its Role in National Development
Agriculture forms the backbone of the rural economy. As a
result, it has a major role to play not only in rural
development but even in the overall National objective of
economic growth and development (Akungo 1980). This also
implies that there are no clear cut roles of agriculture in the
rural areas as opposed to those in the national context. The
major roles of agriculture in the rural and national development are:
(i) To provide food to the rural population. This is important
in giving nutritional ingredients which are important for
good health.
(ii) The provision of income earning opportunities through the
growth and sale of farm produce. This goes along way in
helping to alleviate poverty which is a central theme in
Kenya's 1979/1983 Development plan.
34
(iii) Agricultural growth, i.e higher production and improved
marketing efficiency may lead to the improvement of the
balance of payments especially with regard to exported cash
crops. This is important in a national context.
(iv) Agriculture provides raw materials for industrial
processes, for example, cotton fibres for making clothes.
(v) Agriculture provides food to those in the non-agricultural
sectors of the economy whether in the rural or u r b a n
areas. Agriculture has a major role to play not only in
rural development but also in national development.
Agriculture is the main-stay of Kenya's economy,
contributing 26 per cent of the National Gross Domestic
Product (GDP). The small holder farmers contribute over 75
percent of the country's total value of agricultural output
using only 60 per cent of arable land ( GOK, 1993).
The agricultural share of wage employment is about 18 per
cent but considering self-employment, over 70 per cent of the
country's labour force is engaged in agricultural activities.
The question is not over the importance of these roles in
development, but rather the issue is over the ability of the
government and the people of Masongaleni to tap the potentials
m Masongaleni Settlement Scheme, mostly in the agricultural
sector to effectively play the above outlined roles. Thus the
study addresses the existence of a variety of agricultural
Potentials in Masongaleni Settlement Scheme and finding ways and
lUIVttthti i US- itfctltilto35
means through which these potentials could be tapped in order
to achieve sustainable development.
2.7.4 The Factors that may Lead to the Success and Failure in Agriculture
Several factors have contributed to agrarian development in
Kenya in this century. Among these are land reform,
introduction of high value crops and use of farm inputs (Hunt,
1984; Livingstone, 1981).
Although not widely recognized, availability of
appropriate tools and equipment has played a key role in this
transition. There is considerable evidence to suggest that
sustainable improvements in agricultural output by small holders
has been achieved through improved availability of appropriate
tools and equipment. For example, in a study carried out by
Mortimore and Wellard in Machakos District, it was observed that
adoption of the ox-plough in combination with other agricultural
practices has enabled local small holders to increase their
output by 500 percent between 1910 and 1980 (Mortimore et al,
1991). The authors further note that the time required for
weeding can be reduced by 95 per cent through the use of
appropriate equipment.
On the other hand, unavailability of appropriate tools and
e<?uipment constitutes a major constraint in agricultural
Production. The most basic farm implements and tools required
bY the small holders in Kenya are "Jembes", fork-"Jembes",
36
Shovels, rakes, traditional hoes, Wheel-barrows and ox-ploughs.
However, many farmers do not have adequate supply of these. A
recent study in Embu District found out that there was an
inadequate supply of ploughs and as a result many farmers were
unable to plant at the optimum time just as the rains were
starting (Skinner, 1993). Many farmers had to wait until a
plough was available before they could plough and plant their
crops. A delay of 10 days in planting can lead to a 52 per cent
reduction in yield.
Research has also shown that the use of draught animal
power can reduce the time needed to cultivate a farm by over 60
per cent compared to cultivation by hand and generally the more
mechanized, the higher output per unit acre of land under
agricultural activity (GOk, 1986; Ministry of agriculture, 1992:
19).
In order to raise productivity, Kenyan farmers need to have
access to basic tools and farm implements. In addition, there
are many other simple tools and equipment which can improve
performance of farmers such as rotary planters, weeders,
scarifiers and simple motor powered equipment. The utilization
of these is still very low among small-scale farmers in Kenya.
With some training and/or demonstration, existing tools could
also be put to more and better use, for example, ploughs could
be used much more widely for weeding if crops are planted in lines.
37
A Conceptual Framework For Agricultural Potential in ASALs
38
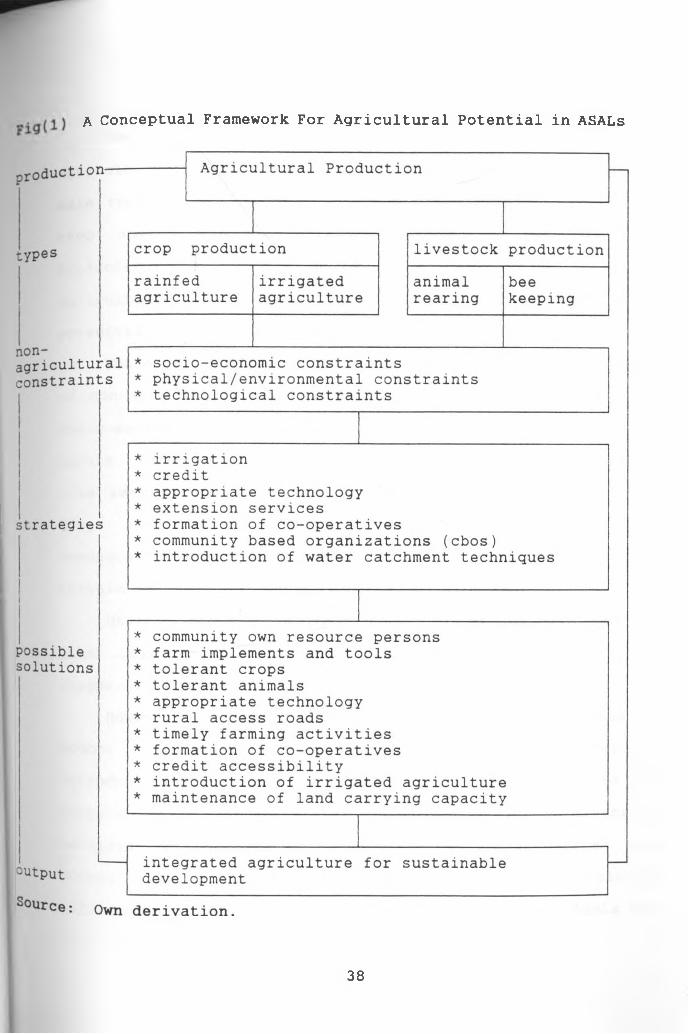
The conceptual framework in Fig (1) tries to show
agricultural production potentials in ASAL zones. There are 2
main types of agricultural production potentials. These are
crop and livestock production potentials. Under crop
production, there is a potential in both rainfed and irrigated
agriculture while under livestock production, there is a
potential in both animal rearing and bee keeping.
These potentials have not been fully tapped due to a number
of non-agricultural constraints. These constraints are of
socio-economic, physical/environmental and technological in
nature. Under socio-economic constraints there are such factors
like small land sizes, lack of land tenure and low incomes.
Under environmental factors there are such factors like
inadequate, erratic and unreliable rainfall, poor soils, rough
terrain and high incidence of pests and diseases.
Under technological constraints, there are such factors
like lack of modern appropriate technology or use of
inappropriate technology in agriculture.
However, to tap this agricultural potential in ASALs, a
number of strategies may be pursued. These include:
introduction of irrigated agriculture, accessing credit to the
farmers, use of appropriate technology, provision of extension
services to the farmers, formation of co-operatives and
formation of Community Based Organizations (CBOs). Possible
solutions to fully tap the agricultural potential in ASALs may
include among others:
39
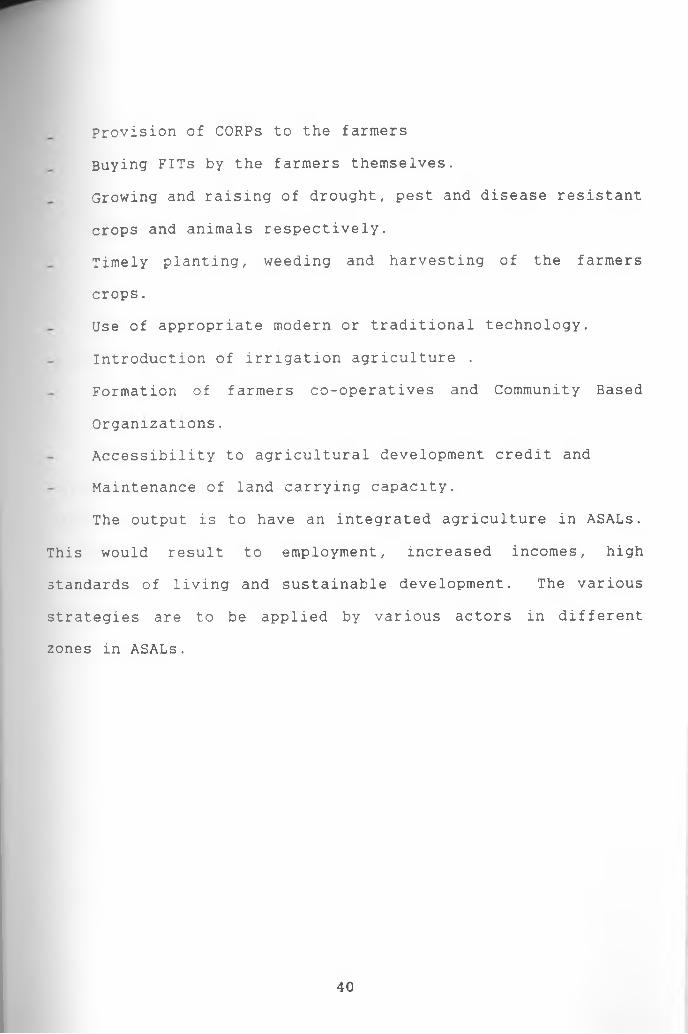
Provision of CORPS to the farmers
Buying FITs by the farmers themselves.
Growing and raising of drought, pest and disease resistant
crops and animals respectively.
Timely planting, weeding and harvesting of the farmers
crops.
Use of appropriate modern or traditional technology.
Introduction of irrigation agriculture .
Formation of farmers co-operatives and Community Based
Organizations.
Accessibility to agricultural development credit and
Maintenance of land carrying capacity.
The output is to have an integrated agriculture in ASALs.
This would result to employment, increased incomes, high
standards of living and sustainable development. The various
strategies are to be applied by various actors in different
zones in ASALs.
40
CHAPTER THREE
BACKGROUND INFORMATION ON MASONGALENI SETTLEMENT SCHEME
3.1 Introduction
This chapter covers the physical, socio-cultural and
economic characteristics of Masongaleni Settlement Scheme.
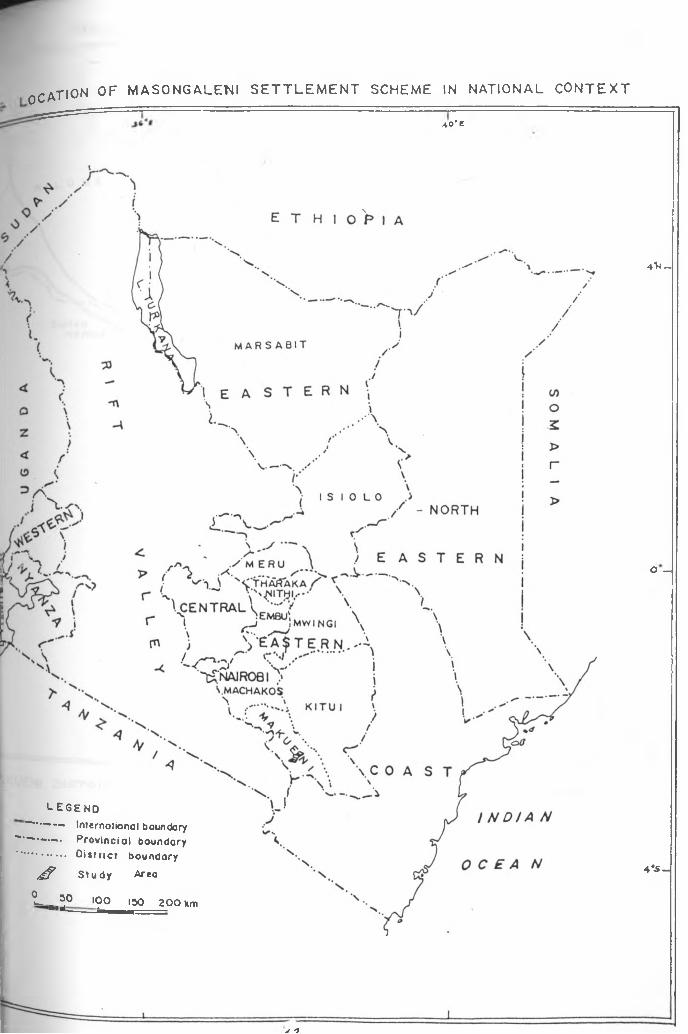
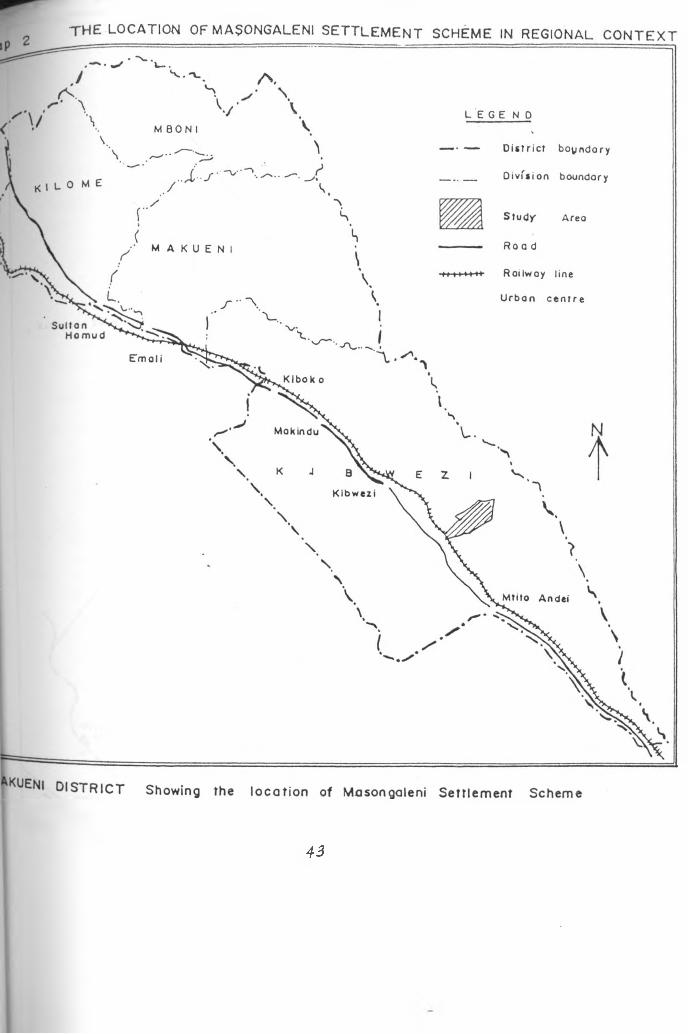
3.2 Location of Masongaleni Settlement Scheme
Masongaleni settlement scheme whose area is about 106
square kilometres is located East of Kibwezi township in Kibwezi
Division of Makueni District, Eastern Province of Kenya. Access
is through the Nairobi-Mombasa tarmac road which runs close to
Masongaleni Settlement Scheme about 200 kilometres south of Nairobi City.
41
OCATION of m a s o n g a l e n i s e t t l e m e n t s c h e m e in national c o n t e x t4 0 ' e
LEGEND------------- International boundary
***"*""•— Provincial boundary................. OietricT boundary
^ Study Area
^ m . 0 '?° 150 200 Km
4^-
O -
4*-S_
v n
43
44
Masongaleni Settlement Scheme is divided into 8 main
blocks. These 8 blocks are further sub-divided into smaller
units giving a total of 18 smaller blocks.
3.3 Climate
Masongaleni is generally a semi-arid zone with a bi-modal
rainfall pattern, February to May being the long rains and
October to December the short rains. Rainfall is not abundant
with a mean annual precipitation of about 631 millimetres. The
mean annual temperatures of Masongaleni Settlement Scheme is 26
degrees centigrade. This temperature is termed as warm
(sombrock et al 1972). The mean annual potential evaporation of
the area is calculated as: E=2422-0.358h (wordhead, 1968),
where h is the altitude in metres and E is the potential
evaporation in millimetres. This area falls in the agro-
climatic zone described as semi-arid.
3.4 Relief and Drainage
(i) Relief
Masongaleni Settlement Scheme is generally of low relief
with the thickly bushed, sandy plains bisected by numerous
streams. The configuration of a number of low ridges between
kibwezi and Athi river is influenced by the north-south strike
°f the Basement system gneisses, hornblende gneisses and
sillimanite gneisses are observed as hills remnant on a
Peneplain in the southern part of Masongaleni Settlement Scheme.
45
Elevations range between 610 metres and 915 metres above mean
sea level. Most of Masongaleni Settlement Scheme is covered by
quaternary red-brown sandy soils overlying undifferentiated
basement system rocks. Recent olivine basalt volcanic cover a
section near Kibwezi town as a result of extrusion of lava-flows
from volcanic vents to the west, forming a plateau. Generally
Masongaleni settlement scheme is a continuation of a gently
undulating landscape falling from North West to South East.
Immediately after the scheme's boundary at river Athi, the
landscape rises as one approaches the Yatta plateau on the
Eastern side of the scheme. Figure (3) is on the cross sections
of Masongaleni Settlement Scheme. Cross section (1) is drawn
from point (A) i.e Umanyi spring to point (B) i.e. Block (7) in
Masongaleni Settlement Scheme. Cross section (2) is drawn from
point (B) i.e. from Block (7) in Masongaleni Settlement Scheme
to point (C) i.e. River Athi. Points A, B and C are on the
relief and drainage map (4).
(ii) Drainage
(a) Surface Water Potential
Masongaleni Settlement Scheme is drained by Thange, Kibwezi
and Mukange rivers. Mukange river is perennial. Umanyi spring
and River Athi are located outside the scheme but can be used as
other sources of water for Masongaleni Settlement Scheme.
Thange river has a maximum flow of 0.65 cubic metres per
Second, mean flow of 0.35 cubic metres per second and a minimum
46
of about 0.23 cubic metres per second. However, the safe yield
from the river would be about 0.23 cubic metres per second.
Kibwezi river: The information concerning the kibwezi
river flows is based upon 25 years of record at gauging station
within the university of Nairobi Dryland Farming Station. The
minimum flow recorded was 0.151 cubic metres/second and the
maximum flow is almost 25 cubic metres/second. If the water in
this river is tapped just by the use of a big dam below " KWA
KYAI" irrigation project, the water is able to irrigate Block 3
and 4.River Athi: At the upstream of the river just above the
Kibwezi river confluence, there has been greater than 1,000
cubic metres per second. If this water is tapped through
construction of a subsurface dam, it can be used to irrigate the
whole of block (1) and (2), plate (3). It shows the possible
portion of river Athi where a sub-surface dam may be constructed
to tap irrigation water for irrigated agriculture for block (1)
and (2) in Masongaleni Settlement Scheme.
47
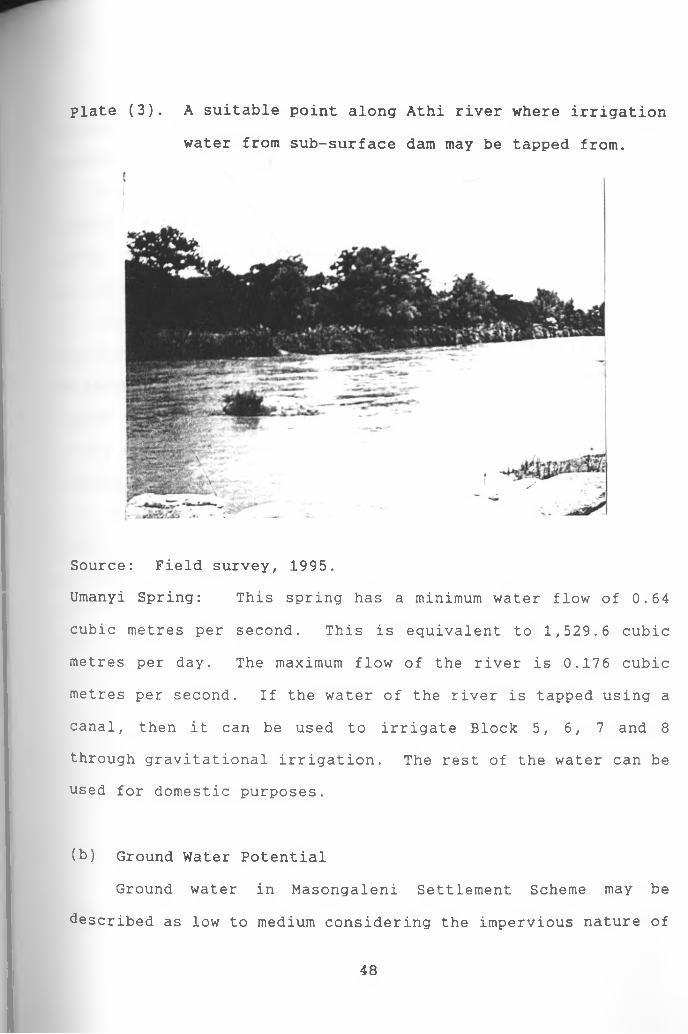
Plate (3). A suitable point along Athi river where irrigation
water from sub-surface dam may be tapped from.
Source: Field survey, 1995.
Umanyi Spring: This spring has a minimum water flow of 0.64
cubic metres per second. This is equivalent to 1,529.6 cubic
metres per day. The maximum flow of the river is 0.176 cubic
metres per second. If the water of the river is tapped using a
canal, then it can be used to irrigate Block 5, 6, 7 and 8
through gravitational irrigation. The rest of the water can be
used for domestic purposes.
(b) Ground Water Potential
Ground water in Masongaleni Settlement Scheme may be
described as low to medium considering the impervious nature of
48
*he crystalline metamorphic rocks found in the area and the low
rainfall experienced.
Ground water occurrence in such geological terrain is
usually restricted to fractured and faulted zones within the
rocks. These zones of broken rock may create sufficient storage
for water especially where they extend deep into the ground.
Some ground water will also occur where the basement rocks
are deeply weathered and at the contact of these crystalline
metamorphic rocks and the overlying Chyulu volcanic where the
latter occur. Shallow ground water may occur within the sands
of dry river bends or along old and buried river channels where
some base flow takes place.
Borehole and shallow well sites may be selected by using a
combination of hydrogeological methods and results of a
geological field study supplemented with geographical data
collected in the field.
Table (2) represents a list of 11 boreholes. These boreholes/
shallow wells are found in Masongaleni settlement scheme and the
neighbouring areas. The current total water yield per day fronr
all those boreholes, the cost of each borehole and the total'
cost is shown.
49
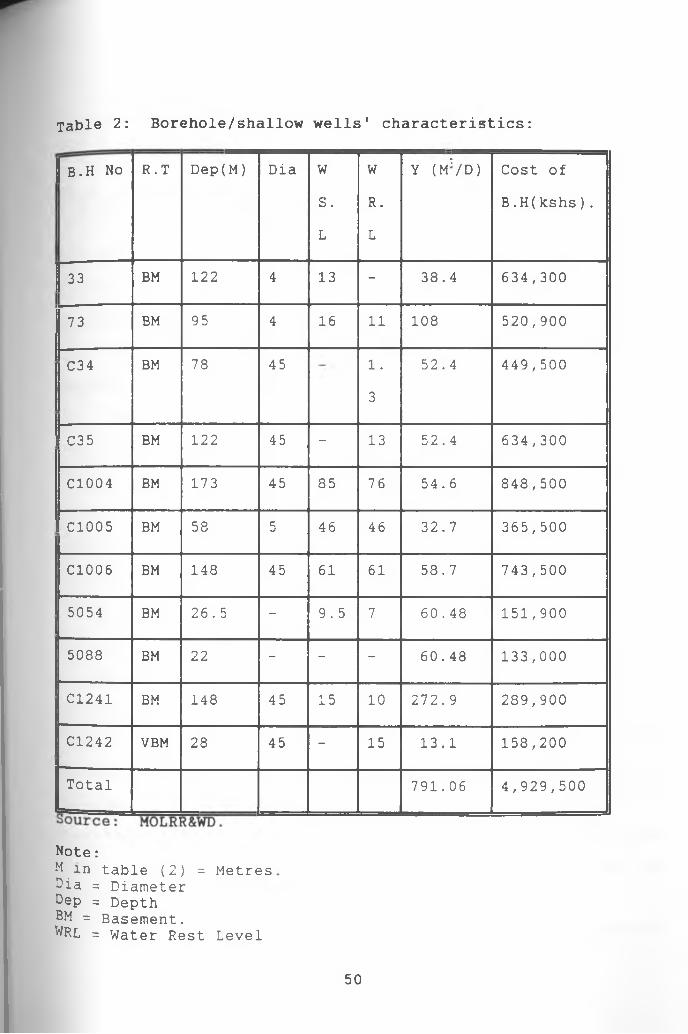
Table 2: Borehole/shallow wells' characteristics:
[ b .H No R.T Dep(M ) Dia W
S.
L
W
R.
L
Y (M3/D) Cost of
B .H (kshs ) .
1 33 BM 122 4 13 - 38.4 634,300
I73 BM 95 4 16 11 108 520,900
C34 BM 78 45 1 .
3
52.4 449,500
I C35 BM 122 45 - 13 52.4 634,300
C1004 BM 173 45 85 76 54.6 848,500
I C1005 BM 58 5 46 46 32.7 365,500
C1006 BM 148 45 61 61 58.7 743,500
5054 BM 26. 5 - 9.5 7 60.48 151,900
5088 BM 22 - - - 60.48 133,000
C1241 BM 148 45 15 10 272.9 289,900
C1242 VBM 28 45 - 15 13.1 158,200
Total 791.06 4,929,500
Note:M m table (2) = Metres Dia = Diameter Dep = Depth BM = Basement.WRL = Water Rest Level
50
WSL = Water Struck Level VBM = Volcanic Basement.B.H = Bore Hole Ft = Feet FT = Rock TypeY(mV d )= Yield in Cubic Metres per day.
Table (2) shows that the boreholes' total water yield per day is
791.06 cubic metres. The total cost of drilling, lining and
even putting up a pump in all those boreholes is kshs . 4,929,500 .
The cost of each borehole is arrived at by using the following
figures:
(i) Borehole siting fee = kshs. 10,000
(ii) Application fee to drill/dig the borehole =kshs.600
(iii) To drill 1 metre deep using a drilling machine= kshs.
4200.
(iv) To dig manually 1 foot deep = kshs. 1273
(v) Using a GOK electric pump= kshs.Ill,300
(vii) Using a Company electric pump= kshs. 145,750
(viii) Using a hand pump= kshs.30,000
Those boreholes with a depth of 28 metres and below may be
dug manually because it is possible to do it according to the
field research conducted on shallow wells' drilling. Such
boreholes\shallow wells should use hand pumps since it is viable
economically to use such. The farmers should as far as possible
buy the electric pumps from GOK for boreholes above 93 feet
deep. It is cheaper to buy the pumps from GOK than from the
Private sector which is expensive.
That recommendation is viable because it promotes
51
empl°Yment t0 the locaJ- community. It also minimise costs of
drillin9 the boreholes/shallow wells. If a shallow well is
done manually, the community may be involved in the digging of
the borehole thus minimising the costs of providing the shallow
wells/boreholes. There is a great potential for ground water in
Masongaleni as it is noted in table (2). The table indicates
that the water yield does not depend on the depth or diameter of
the boreholes. As noted in the table, some boreholes with less
depths yield more water than even some with a greater depth.
(c) Hydrogeology of Masongaleni Settlement Scheme.
The hydrogeology of Masongaleni Settlement Scheme is
intimately dependent upon the nature of the basement rocks.
Depending on the type of rock, the degree of jointing,
fracturing and weathering, varied hydrogeological conditions
certainly exist in Masongaleni Settlement Scheme, with
sufficient amounts of ground water occurring within the
intensively jointed, fractured and/or weathered basement rocks.
In addition, the amount and frequency of precipitation is also
a significant parameter in influencing ground water occurrence.
(d) Aquifers in the Basement Rocks
The crystalline rocks of the basement complex that form the
sub-surface in Masongaleni Settlement Scheme are relatively
impermeable and in their fresh state form poor aquifers.
However, where these rocks have been fractured and jointed, and
52
where weathering has occurred, the breakdown of the minerals
that form the rock may lead to the formation of conditions
favourable to the storage of ground water.
Water wells in basement areas in the Scheme are known for
their large variation in water yields, principally reflecting
the presence or absence of the conditions described above. This
is quite often demonstrated by the normally wide variation in
water yields recorded at boreholes drilled at short distances
from each other. Due to this large variation in water yields,
it is imperative to accurately locate borehole sites to take
advantage of either faulting or weathering of the basement
rocks. Optimum locations can usually be found using aerial
photographic interpretation field verification of the geological
conditions, followed by surface geophysical measurements.
(e) Water Quality from the Ground
Some boreholes in parts of Masongaleni Settlement Scheme
have encountered saline water most probably due to the high
evaporation rates in the area. However, deeper aquifers and
indeed shallow ones can be expected to be less saline as long as
there is sufficient percolation and water does not stagnate.
(f) Rain Water Potential and Mean Annual Rainfall
The mean annual rainfall of the area is about 640
millimetres and its distribution may be described as two seasons
with long rains occurring in March-May and short rains in
^ctober-December.
53
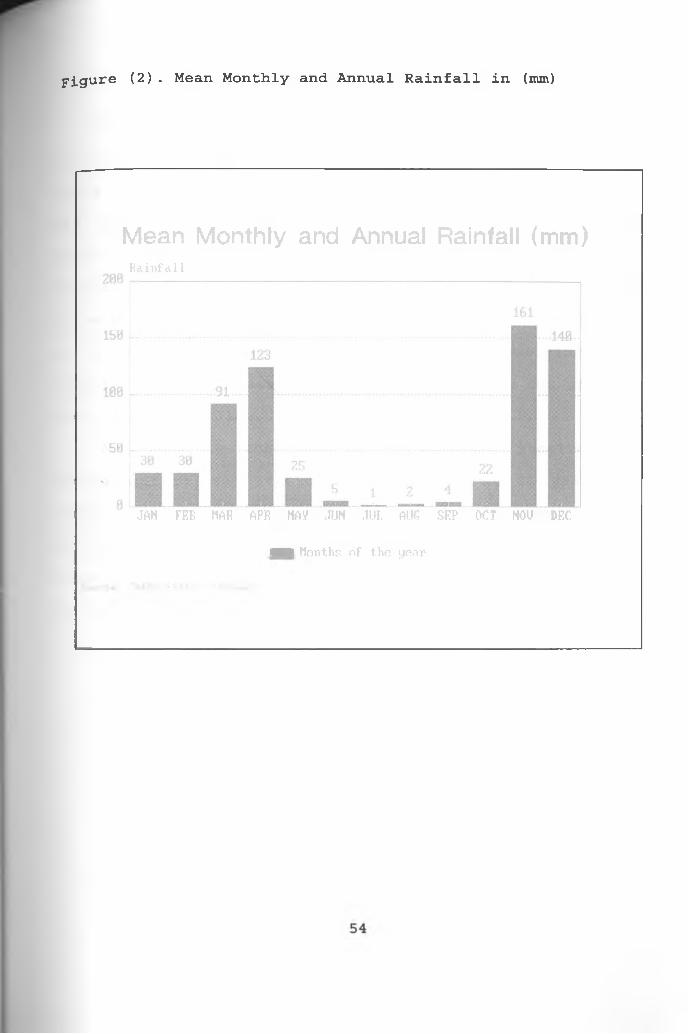
Figure (2). Mean Monthly and Annual Rainfall in (mm)
Mean Monthly and Annual Rainfall (mm)E a in fa l1
JAN FEB MAB APB HAY JIJN JUI. AUG SEP OCT NOU DEC
riigiij Norths of th e year
The rainy seasons, March-May and October-December
contribute 37% and 50% of the mean annual rainfall respectively,
while dry period contributes 11% for January/February and 2% for
the June/ September period. November receives the highest
amount of rainfall while July experiences the least amount of
rainfall. The chances of having a good crop during the long
rains is 2 out of 10 seasons and during the short rains is 4 out
of 10 seasons. Likewise, the probability of receiving a fair
crop is 4 out of 10 seasons for long rains and 6 out of 10 for
short rains Aqua Plan, (1992).
According to the records of rainfall received from
Masongaleni railway station for a period of 64 years, the
average rainfall for Masongaleni Settlement Scheme is 631
millimetres/annum. Using this data, then the possible amount of
water that can be harvested from one square metre of iron sheet
roofed house is 0.631 cubic metres.
55
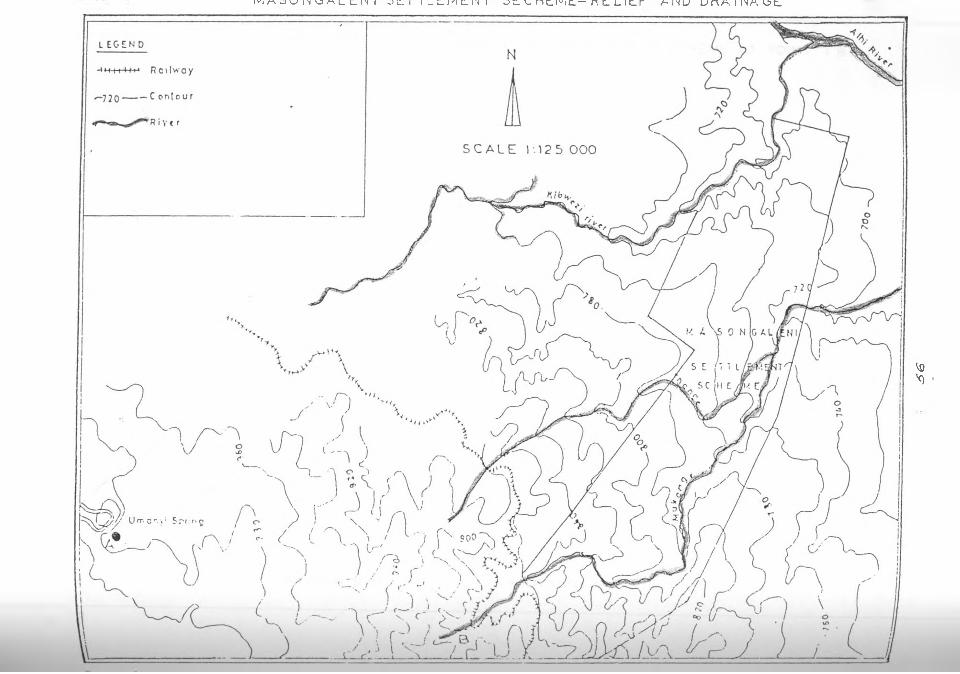
M A j U In b A L L H I S>L.I I L L M L I N I o L L h L M L - n L L I L r A N U U H A I N A b L
0'O -
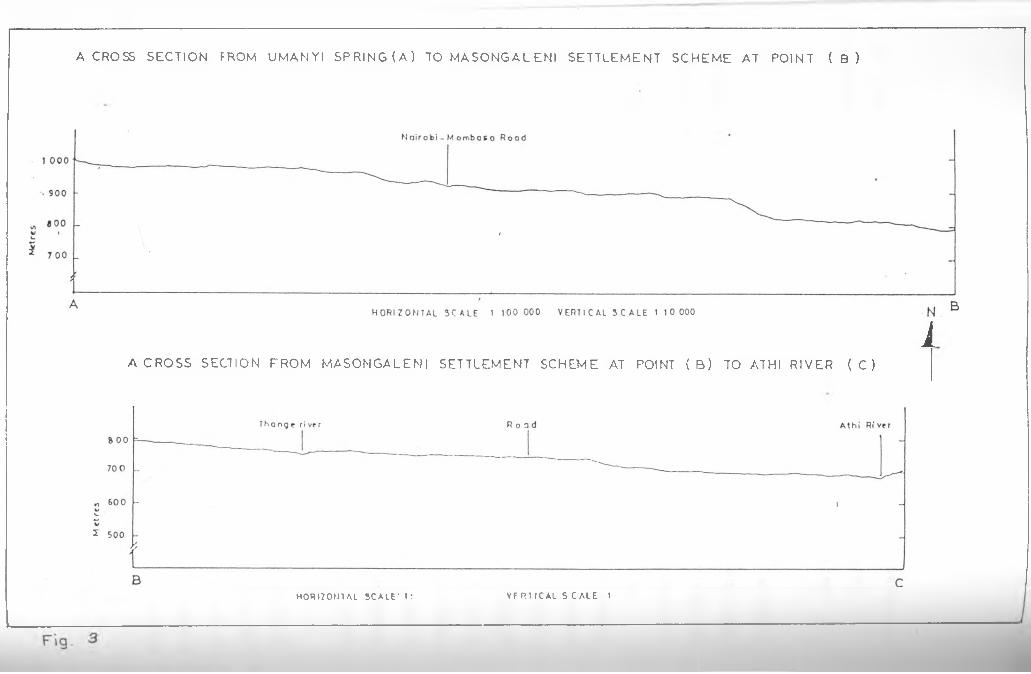
A C R O S S S E C T I O N F R O M U M A N Y I S P R I N G ( A ) T O M A S O N G A L E NI S E T T L E M E N T S C H E M E A T P O I N T ( B )
1ACROSS SECTION FROM MASONGALENI SETTLEMENT SCHEME AT POINT ( B) TO ATHI RIVER ( C )
HORIZONTAL SCALE ' t : VF RT ICAL S C ALE 1
L
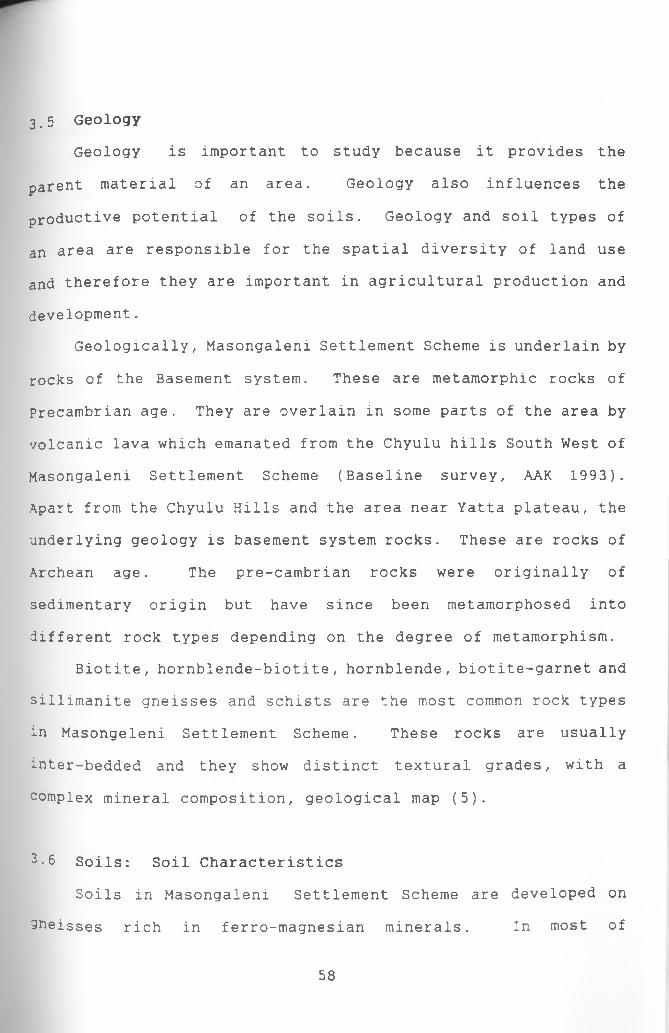
3.5 Geology
Geology is important to study because it provides the
parent material of an area. Geology also influences the
productive potential of the soils. Geology and soil types of
an area are responsible for the spatial diversity of land use
and therefore they are important in agricultural production and
development.
Geologically, Masongaleni Settlement Scheme is underlain by
rocks of the Basement system. These are metamorphic rocks of
Precambrian age. They are overlain in some parts of the area by
volcanic lava which emanated from the Chyulu hills South West of
Masongaleni Settlement Scheme (Baseline survey, AAK 1993).
Apart from the Chyulu Hills and the area near Yatta plateau, the
underlying geology is basement system rocks. These are rocks of
Archean age. The pre-cambrian rocks were originally of
sedimentary origin but have since been metamorphosed into
different rock types depending on the degree of metamorphism.
Biotite, hornblende-biotite, hornblende, biotite-garnet and
sillimanite gneisses and schists are the most common rock types
in Masongeleni Settlement Scheme. These rocks are usually
inter-bedded and they show distinct textural grades, with a
complex mineral composition, geological map (5).
3.6 Soils: Soil Characteristics
Soils in Masongaleni Settlement Scheme are developed on
Sneisses rich in ferro-magnesian minerals. In most of
58
Masongaleni Settlement Scheme, the soils are well drained,
moderately deep to deep, dark red to dark reddish brown,
friable to firm, sandy clay to clay over quartz gravel, map (6).
59
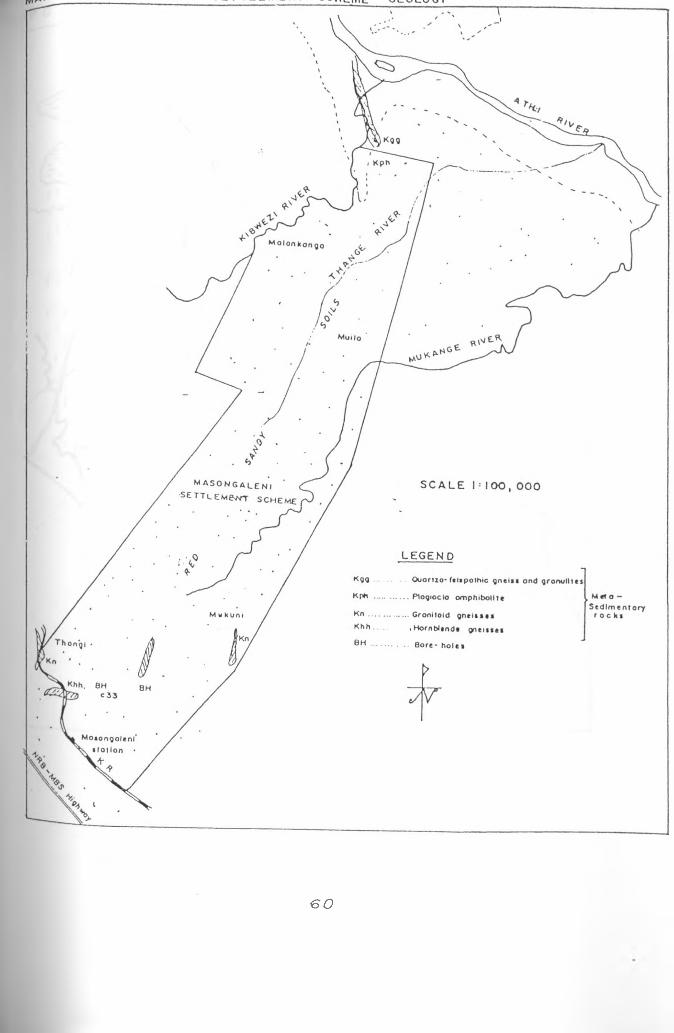
€ 0
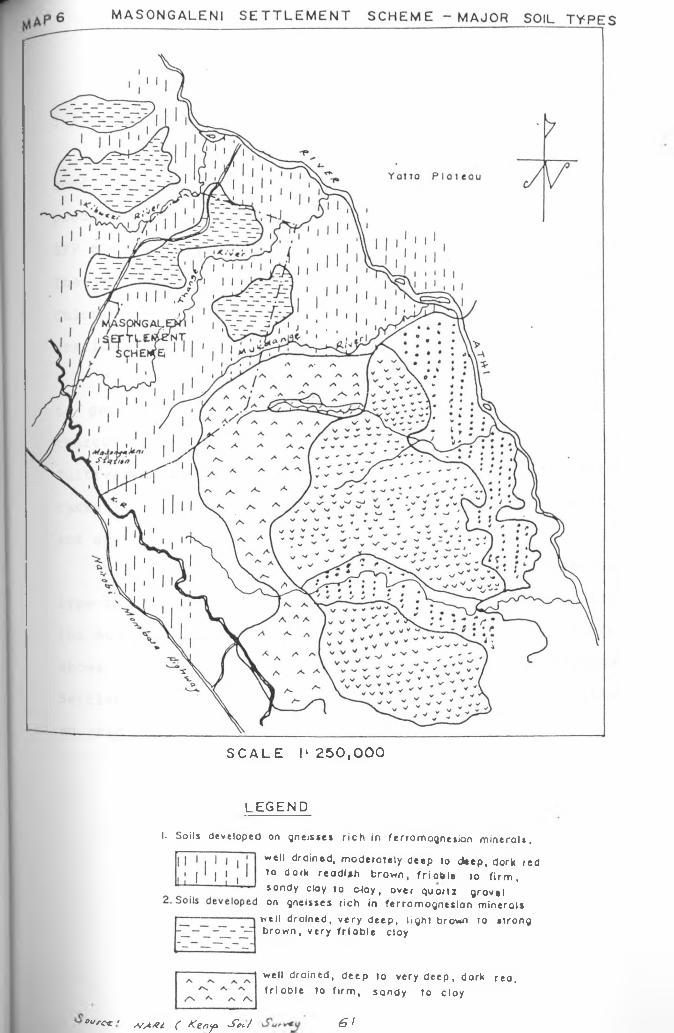
S C A L E I ' 2 5 0 , 0 0 0
L E G E N D
I. Soils developed on gneisses rich in ferromognesion minerals.
well drained, moderately deep to deep, dark ied to dark readish brown, friable to firm, sondy clay to c-foy, over quortx grovel on gneisses rich in ferromognesion minerals
well drolned, very deep, light brown to strong brown, very frloble cloy
well drained, deep to very deep, dork rea, frloble to firm, sandy to cloy
ovscic • S/Afl ( Xenya Sot/ 6 !
3.7 Vegetation
Vegetation is affected by the relief and climatic
conditions of an area. Masongaleni Settlement Scheme is
predominantly scrubland. Commiphora species, grewia SPP, Boscia
SPP and several acacia species are the common woody components.
The very big trees are baobab. Most common grasses include
Chloris Roxyburghiana, Eragrotis Superba, Cehehns cilianis and
arstida species.
Many of the common tree and grass species are becoming rare
to get due to uncontrolled clearing of the vegetation for
charcoal burning and to get land for farming (growing of crops).
Cultivated crops include among others: maize, millet, sorghum,
cassava, cow-peas, beans, pigeon peas, green grams, castor oil
and sweet potatoes, map (7).
Plates (4) and (5). Plate (4) shows the common vegetation
type in Masongaleni Settlement Scheme. This vegetation type is
the Acacia species, an indication of an arid land. Plate (5)
shows the very common big Baobab tree species in Masongaleni
Settlement Scheme. The Baobab trees are also an indication of
an arid land.
62
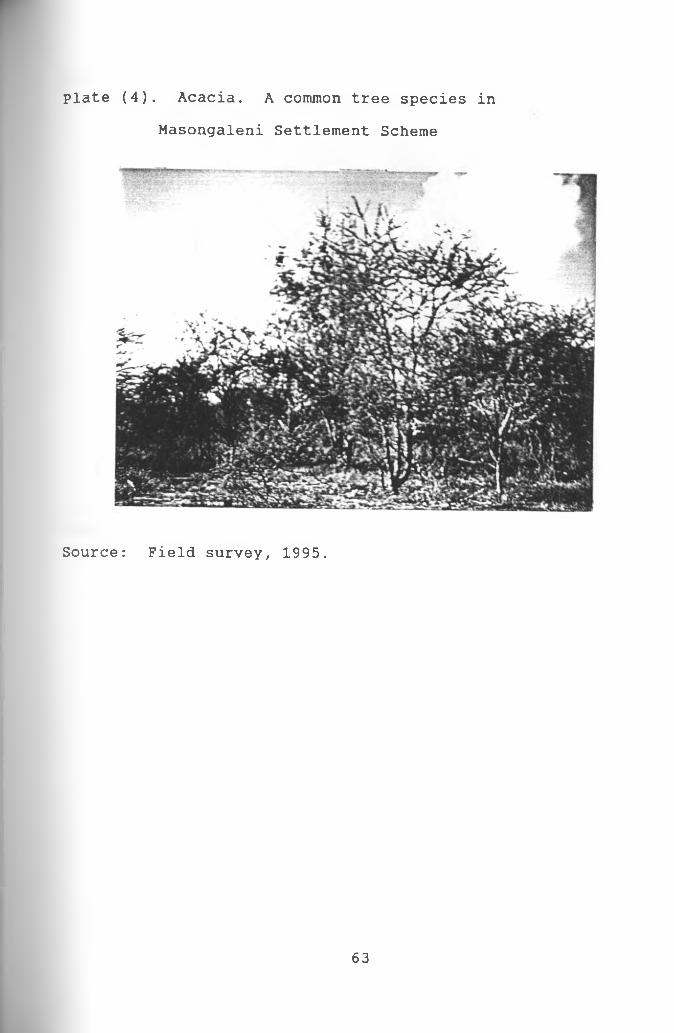
plate (4). Acacia. A common tree species in
Source: Field survey, 1995.
Masongaleni Settlement Scheme
63
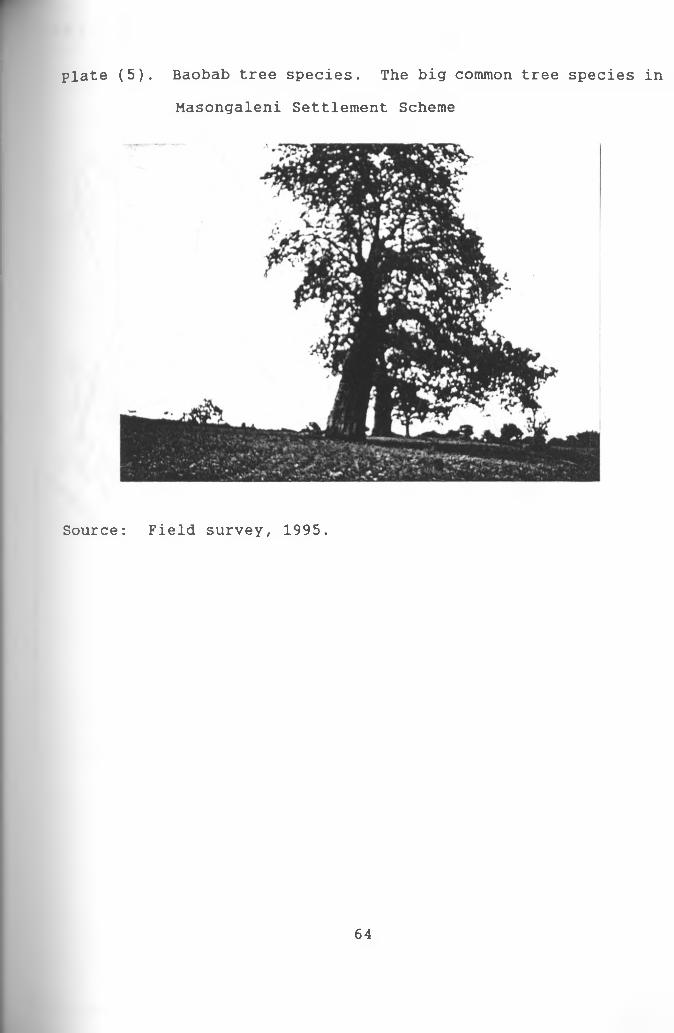
plate (5). Baobab tree species. The big common tree species in
Masongaleni Settlement Scheme
Source: Field survey, 1995.
64
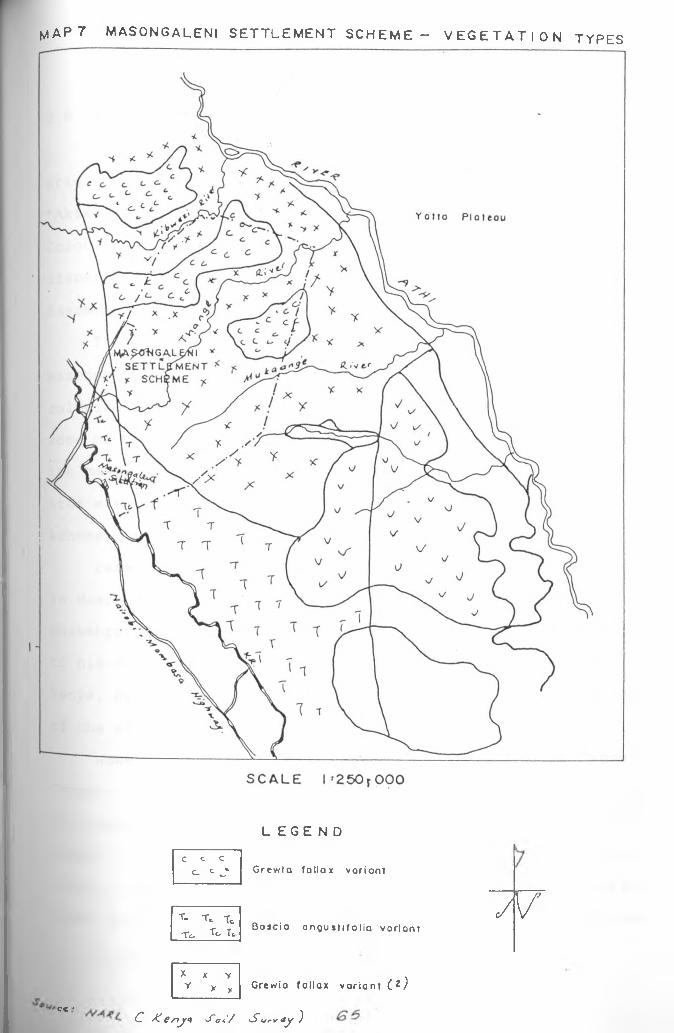
M A P 7 M A S O N G A L E N I S E T T L E M E N T SCH E M E - V E G E T A T I O N TYPES
e t c C. <• J -
T- Tc TtTc. Yo Tt
X x vy X X
L E G E N D
Grewla fallox varionl
Boscia anguitifolia voriom
Grewio follax variant C z )
c« •C £ € nj<\ S'at'/ ySurray)ly
/ V
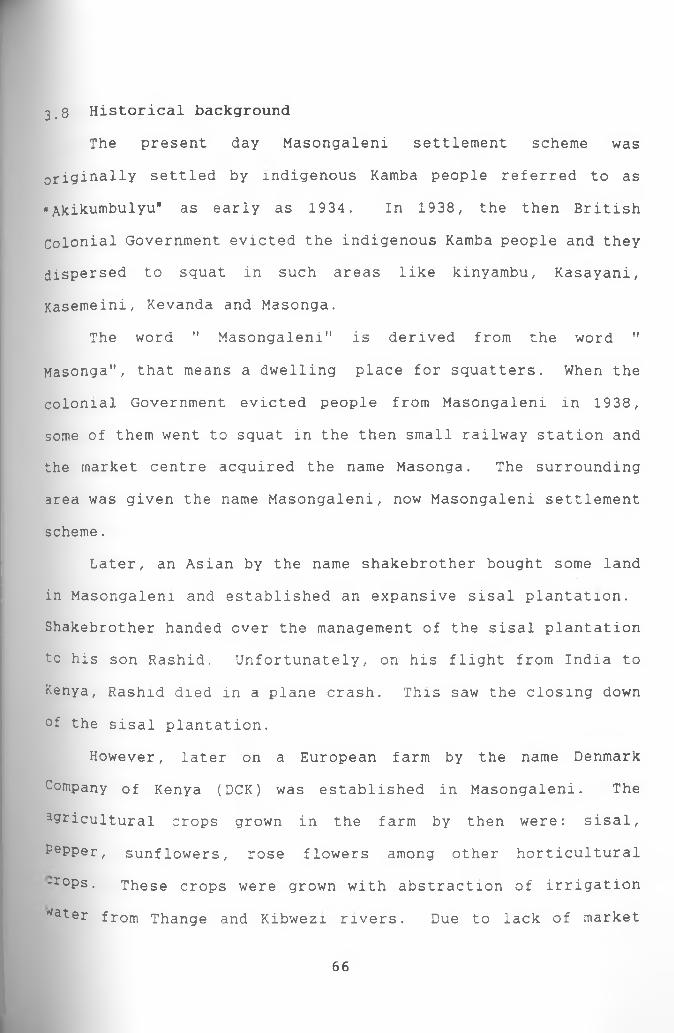
3.8 Historical background
The present day Masongaleni settlement scheme was
originally settled by indigenous Kamba people referred to as
«Akikumbulyu* as early as 1934. In 1938, the then British
Colonial Government evicted the indigenous Kamba people and they
dispersed to squat in such areas like kinyambu, Kasayani,
Kasemeini, Kevanda and Masonga.
The word " Masongaleni" is derived from the word "
Masonga", that means a dwelling place for squatters. When the
colonial Government evicted people from Masongaleni in 1938,
some of them went to squat in the then small railway station and
the market centre acquired the name Masonga. The surrounding
area was given the name Masongaleni, now Masongaleni settlement
scheme.
Later, an Asian by the name shakebrother bought some land
in Masongaleni and established an expansive sisal plantation.
Shakebrother handed over the management of the sisal plantation
tc his son Rashid. Unfortunately, on his flight from India to
Kenya, Rashid died in a plane crash. This saw the closing down
of the sisal plantation.
However, later on a European farm by the name Denmark
Company of Kenya (DCK) was established in Masongaleni. The
agricultural crops grown in the farm by then were: sisal,
Pepper, sunflowers, rose flowers among other horticultural
~rops. These crops were grown with abstraction of irrigation
*ater from Thange and Kibwezi rivers. Due to lack of market
66
abroad for the company's agricultural products, the company
closed down. The government of Kenya bought the land and until
its settlement in 1992, Masongaleni has been a game reserve.
In 1992, through a presidential directive, squatters from
the slopes of Chyulu hills, Kasayani and Kalembwani were
allocated land in Masongaleni.
2.9 Socio-Economic and Institutional Characteristics
According to a baseline survey carried out by AAK in
Masongaleni Settlement scheme in 1993, the scheme had a
population of about 9245 people by the same year. According to
the survey the scheme had 2700 households. The average number
of families per block was about 150 people.
(i) Total Population
According to a study done on Kikumbulyu Water supply in
1983 by the MOLRR&WD in the areas neighbouring Masongaleni
Settlement Scheme, a population growth rate of 3.3% was used.
The author uses this rate to calculate the current total
population for Masongaleni settlement scheme.
Using that population growth rate, then:
In 1993 Masongaleni Settlement Scheme had a population of
3/245 people. The current population is arrived at by saying:
?n= p0 ( i + r% )n
Therefore, the current population = 9245( l+3.3)/100)3
= 3,245(1+0.033)3
= 3/245(1.1023029)= 10190 people.
67
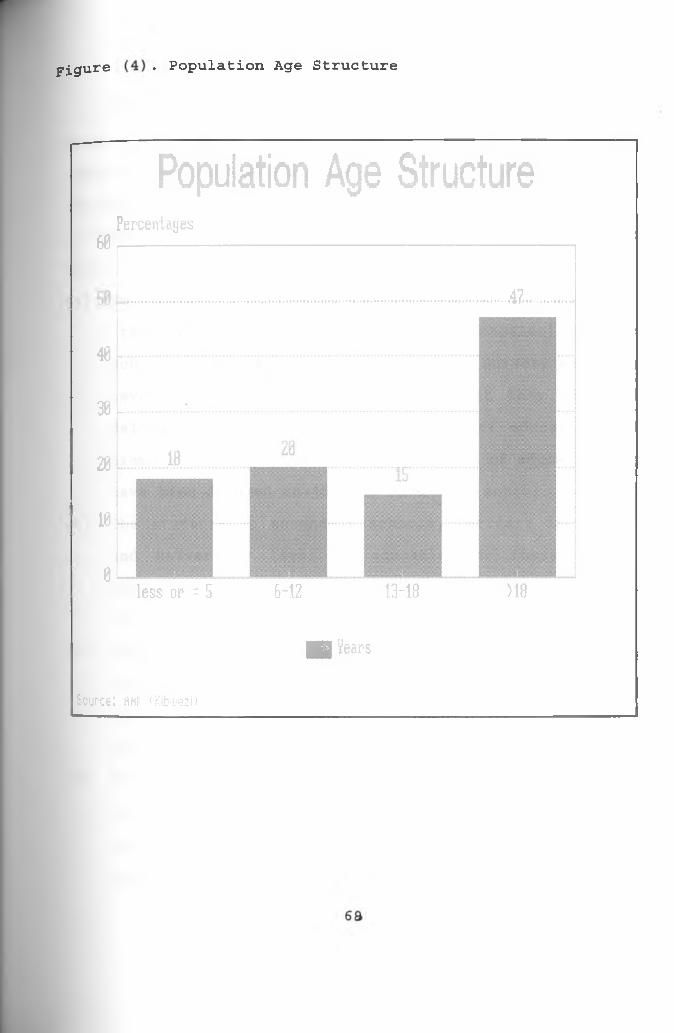
Figure . Population Age Structure
Population Age Structure60
48
30
20
18
0 less or = 5 6-12 13-18 >18
Percentages
.47..........
m tears
Source: fiftK (Kibtuezi)
According to the study, over 90 per cent of the school
going children in Masongaleni settlement scheme are in nursery
and primary levels of education. From the population cohorts in
the population age structure above, a number of implications can
be deduced and the following facts need to be born in mind.
That:(a) The hasty and unexpected resettlement of the people from
their previous places of origin to Masongaleni Settlement
Scheme disrupted the children/pupils in nursery and primary
levels of education. This means that they might have
delayed in going to the next levels of education. For
example, those pupils in primary levels of education might
have been delayed in joining secondary school.
(b) The students in secondary schools, tertiary institutions
and University level of education or those who were
supposed to join these institutions might have abandoned
the idea because of the disruption.
(c) There is need to plan for not only education facilities
for this youthful population but also for other facilities
for the same category of population in Masongaleni
settlement scheme.
(d) There is need to raise the farmers' incomes in the
settlement scheme so that they may send their children in
future to secondary, tertiary institutions and university
level of education.
69
(e) There is need for the GOK to consider such implications so
that in future such problems may be avoided.
(iii) population Migrations
Masongaleni settlement scheme is composed of a population
of squatters mainly from Chyulu hills, Kalembwani and Kasayani
all of them in Makueni District. A small proportion of the
people in Masongaleni Settlement Scheme consists of a minority
group of people who have come from other parts of the country
and have bought land in the scheme.
The data collected from the field reveals that a total of
5,696 people (69%) of the total population migrated (place of
origin before settling in Masongaleni) from the slopes of Chyulu
hills. On the other hand, a total of 2,558 people (27%) of the
total population migrated from Kasayani while 387 people(4%) of
the population migrated from Kalembwani.
(iv) A comparison between Chyulu Hills and Masongaleni
Settlement Scheme
It is very important for this study to compare the two
Places of origin. This is because, the ways of socialization
the people experienced in their original places in terms of
farming systems, values and beliefs among others, will very much
affect the exploitation of the land resources in the new
settlement area (Masongaleni settlement scheme). The author
compares Masongaleni settlement scheme with Chyulu hills only,
70
because Kasayani and Kalembwani have the same agro-ecological
zone like that of Masongaleni settlement scheme,( agro-
ecological zone 5). The author compares Masongaleni settlement
scheme with Chyulu hills because 69% of the settlers in
Masongaleni settlement scheme originated from Chyulu hills.
Masongaleni settlement scheme is within agro-ecological
zone LM5 while Chyulu hills is found within a variety of agro-
ecological zones i.e UM4, UM3-4, LH4, LH3-4.
Masongaleni settlement scheme has an annual average
rainfall of about 631 millimetres while the annual average
rainfall for Chyulu hills is about 1000 millimetres.
•Masongaleni settlement scheme being an example of an ASAL
is capable of supporting the growth of such drought resistant
crops like Katumani composite B, Sorghum, Millet, Cow-peas,
Cotton, Sisal, Pigeon-peas, Green-grams etc while Chyulu hills
being an example of a medium potential zone is able to support
the growth of such crops as Bananas, Potatoes, Arrow roots,
local traditional maize, and to some extent coffee.
However, looking at the above comparison, resettling of
People from the medium potential area to an ASAL has a lot of
implications to the new settlers in Masongaleni settlement
scheme. The following are some of the important facts that need to be noted. That:
(a) The new settlers will take some time before they adjust to
the new agro-ecological zone.
(b) The new settlers are likely to use inappropriate
71
technologies in farming. For example, the use of
inappropriate seeds like the local traditional maize seeds
instead of Katumani maize. Use of inappropriate tools and
farming systems is likely to happen in Masongaleni
settlement scheme. This leads to low agricultural yields
and hence under-utilization of the agricultural potentials
in the settlement scheme.
(c) The new settlers needs a lot of education and
sensitization on the importance of adopting very fast to
the new agro-ecological zone so as to fully tap the
agricultural potentials of the settlement scheme.
(v) Land Tenure
A study of the land tenure system of an area is important
in assessing the feasibilities not only in agricultural
development but also any other development project. All the
land in Masongaleni settlement scheme is Government land. The
land has been demarcated and letters of allotment have been
issued to the settlers. The average land size allocated to each
settler is 8 acres. The settlers have not been issued with
title deeds and they do not know when they will be issued with
the title deeds. Therefore, land tenure was found to be a
critical issue in Masongaleni Settlement Scheme. The settlers
are supposed to pay kshs.600 per acre to the Ministry of lands
and settlement.
During the field survey, the area's Land Demarcation
72
Officer said that the settlers can get their title deeds as soon
a s they pay all their land dues to the Ministry of lands and
Settlement. They are supposed to pay these dues to the
Ministry's Headquarters (Ardhi House) in Nairobi.
The area's land demarcation Officer recalled that there
was to be an office that was to be established in Kibwezi, the
Divisional Headquarters. This office would facilitate easy
payment of the settlers' land dues. This would mean short
travelling distance to the Divisional office. When interviewed
on the issue of paying these dues, some of the constraints the
settlers expressed were:
Unreliable and irregular sources of income from the
agricultural produce.
Far and inaccessible land dues' paying office. The
inaccessibility was said to be in terms of travelling
costs, all the way to Nairobi.
There has not been a follow up from the Government on the
payment of these land dues. This led to reluctance by the
settlers in paying these dues even when some of them had
the money.
One common view from the interviewed settlers was that the
•and size allocated to them was small compared to an average
household size of 8.
Therefore, the 8 acres allocated to the settlers is small
compared to the farmers' activities that they would be willing
to Perform on their land. These activities include mainly
73
arable farming and livestock keeping. In the livestock sector
there is a variety of animals that the farmers wished to keep
for the different benefits they would get from them. For
example, they would wish to keep cattle to obtain milk, bride
wealth and plough their farms. Goats would provide milk, meat,
bride wealth and sell to get incomes to meet their household
requirements. They would keep sheep to get meat and sell to get
incomes to meet household requirements. They would also wish to
keep poultry to meet such requirements as provision of eggs,
meat and for sale sell to meet most of the household's
miscellaneous needs. It is the same piece of land that the
farmers may wish to practise bee keeping.
To raise the farmers' incomes and general standards of
living, the farmers need to apply such agricultural practices
like integrating rainfed agriculture and irrigated agriculture
with livestock farming. Irrigated agriculture enables multiple
cropping, intensive use of land, growing of high value crops
which yield cash incomes thus contributing to employment and
income generation. Also to raise their incomes, the farmers
need to apply such farming practices like soil and water
conservation among other methods.
(vi) Land Potentiality
The factors which determine the potential of land in an
area are its climate, topography and soils. The climate of
Masongaleni Settlement Scheme is generally hot with a mean
74
Thisannual rainfall of about 631 millimetres per annum,
climate can support only a limited number of crops especially
the drought resistant crops like Katumani composite B, sorghum,
green grams, millet, pigeon peas and cow-peas, etc.
(vii) Existing Agricultural Situation
Rainfed agriculture is one of the sectors whose full
potential has not been tapped. Rainfed agriculture involves
cultivation of crops including maize, millet, sorghum, cassava,
cow-peas, beans, castor oil, green grams, pigeon peas, etc.
The cultivation of these crops forms part of the economic
base* of Masongaleni Settlement Scheme. For example, the
surpluses realised in all the above mentioned crops apart from
castor oil, are sold to get cash for purchasing domestic items
and for paying fees for their children in school. Irrigated
agriculture under small holdings could also form another part
of the economic base of Masongaleni Settlement Scheme.
According to a hydrogeological and geophysical survey by Aqua
plan commissioned by AAK in Masongaleni Settlement Scheme in
1992, it was established that the total land available in the
scheme was 2,700 x 8 = 21,600 acres. Aqua plan consultants
assumed that only half of this land would be available for
irrigation use.
Therefore, land available for irrigation would be 21,600/2
= 10,800 acres. Assuming half of this 10,800 acres would be
75
under irrigation at any given time, then land being irrigated at
any given time would be 5,400 acres.
Depending on the data collected from the small-holder
irrigated agriculture in the area neighbouring Masongaleni
Settlement Scheme, irrigated agriculture in Masongaleni
Settlement Scheme may include the following crops:
- Okra- Karelia
.. Doodhee Turia
- Tinda
- Egg Plant (Brinjals)
- Chillies
- Tomatoes
- Guar
Potential irrigation water sources are Kibwezi, Thange and
Athi rivers. Umanyi Springs and the perennial Mukange river are
other sources of irrigation water.
Irrigated agriculture would involve the growing of high value
crops namely horticultural crops like vegetables. According to
Kangangi, G.M. (1982), the production methods for these crops
are labour intensive and generates employment opportunities. It
allows multiple cropping that encourages intensified
agricultural land use. According to the research done by aqua
Plan on behalf of AAK on irrigated agriculture in the area
n®ighbouring Masongaleni Settlement Scheme, one hectare of
Irrigated horticultural field is equivalent to 1000 man days per
76
season. If the four rivers together with Umanyi spring were
tapped for irrigation purposes, then assuming that each farmer
irrigated a minimum of 2 acres, then all the work force in
Masongaleni Settlement Scheme will fully be employed in the
irrigated agriculture.
By tapping irrigation water from the mentioned sources,
then there is a potential of having small scale irrigation
project for each farmer in Masongaleni Settlement Scheme. The
success of such small scale irrigated projects would require an
organization of the following:
Grouping together of the farmers to share a common source
of water supply and other services which leads to solving
of many organizational problems so that the supply of
irrigation water can increase individual small farm incomes
in such areas.
Organization of input and credit, marketing and extension
services necessary to relate to the scheme to the full
range of development needs of the people of Masongaleni.
It is advisable to have an integration of rainfed
agriculture, small scale irrigated agriculture and
livestock farming.
The supplemental irrigation water is expected to achieve
worthwhile response through the horticultural production which
require less land and gives higher potential returns to both
unit of land and labour thus creating employment in agricultural
Production. The growing of high value crops which yield cash
77
incomes is expected to contribute to employment, income
generation and equity distribution of these incomes which
constitute rural development.
Kibwezi, an important local market opens the scheme to the
main urban areas of Nairobi,Mombasa, Nakuru, Eldoret, Kisumu and
Mtito-Andei if the small scale irrigated agriculture is
implemented in Masongaleni Settlement Scheme.
However, a number of constraints are likely to be experienced
in the enhancement of the small-scale irrigated agriculture in
Masongaleni Settlement Scheme. These are:
(a) Operating irrigation equipment
(b) Organizing necessary inputs and satisfactory market outlets
(c) Obtaining market information.
If the farmers are to be involved in an expanded
development programme, they require specific assistance in the
above matters and in financing their enterprise. An attempt to
leave the farmers on their own may lead to the failure of the
irrigation systems as was noted in Karatina in Nyeri. This is
because there would be limited experience in irrigation
developments in Masongaleni settlement scheme where such
irrigation systems have not been done before. Therefore,
institutions for setting of socio-economic organizations for the
management of capital, input supply, provision of extension
services in skills of production methods, marketing and
°iganization of management and production needs to be developed
for the purpose. Despite the creation of a sense of owner
78
operator, the extent to which the Government can let the farmers
alone has to be well established if the irrigated agriculture
has to transform the living standards of the farmers and at the
same time repaying the capital investment on the project.
(viii) Rainfall and Crop Water requirement of Irrigated
Agriculture
According to the data collected from the small-holder
irrigation projects by Aqua plan, the average rainfall is about
239 millimetres for the months of March-May and 339 millimetres
for the months of October-December.
The yearly rainfall distribution shows clear peak in
October -December and March-May. The highest irrigation water
requirements are in January-February and June-September. The
mean potential evapotranspiration (EO) is about 2,162
millimetres. It should be noted that some of the horticultural
crops may be grown as rainfed crops.
• i-x) Season of Production of the Irrigated Agriculture
Most of the irrigated agricultural crops have good prices
throughout the year. The small-scale farmers produce these
cr°Ps all the year round. During September-October-November,
Production is low because farmers concentrate on rainfed food
Cr°ps. These crops may be sold locally or exported to outside
countries. The highest demand for export crops is between
November and May, while that for local market is during dry
79
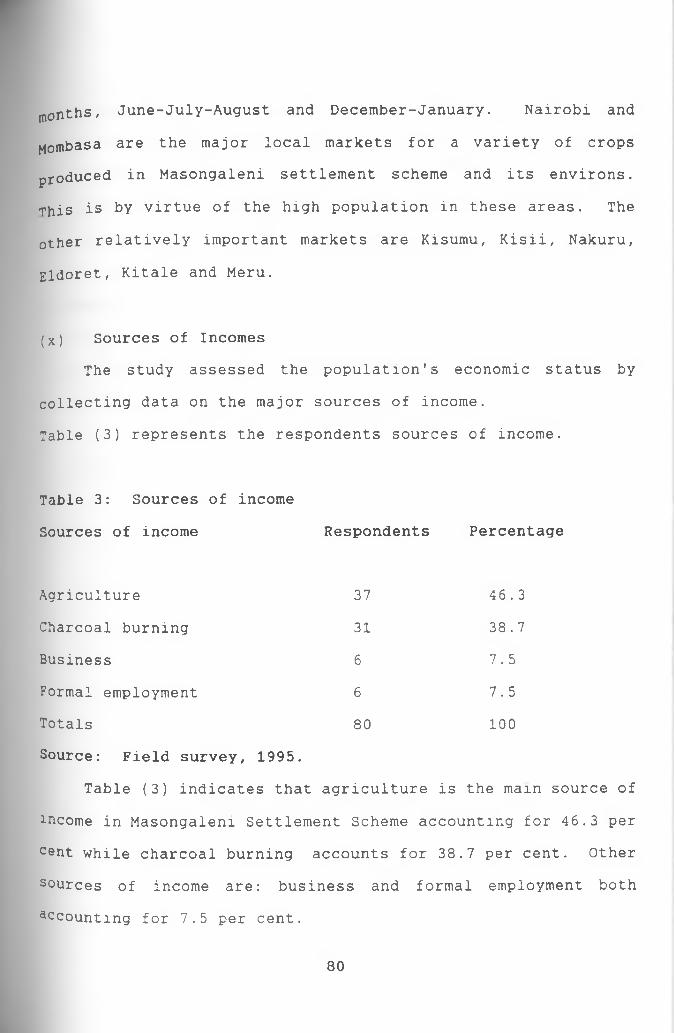
months, June-July-August and December-January. Nairobi and
Mombasa are the major local markets for a variety of crops
produced in Masongaleni settlement scheme and its environs.
This is by virtue of the high population in these areas. The
other relatively important markets are Kisumu, Kisii, Nakuru,
Eldoret, Kitale and Meru.
(x) Sources of Incomes
The study assessed the population's economic status by
collecting data on the major sources of income.
Table (3) represents the respondents sources of income.
Table 3: Sources of income
Sources of income Respondents Percentage
Agriculture 37 46.3
Charcoal burning 31 38.7
Business 6 7.5
Formal employment 6 7.5
Totals 80 100
Source: Field survey, 1995.
Table (3) indicates that agriculture is the main source of
income in Masongaleni Settlement Scheme accounting for 46.3 per
c©nt while charcoal burning accounts for 38.7 per cent. Other
sources of income are: business and formal employment both
accounting for 7.5 per cent.
80
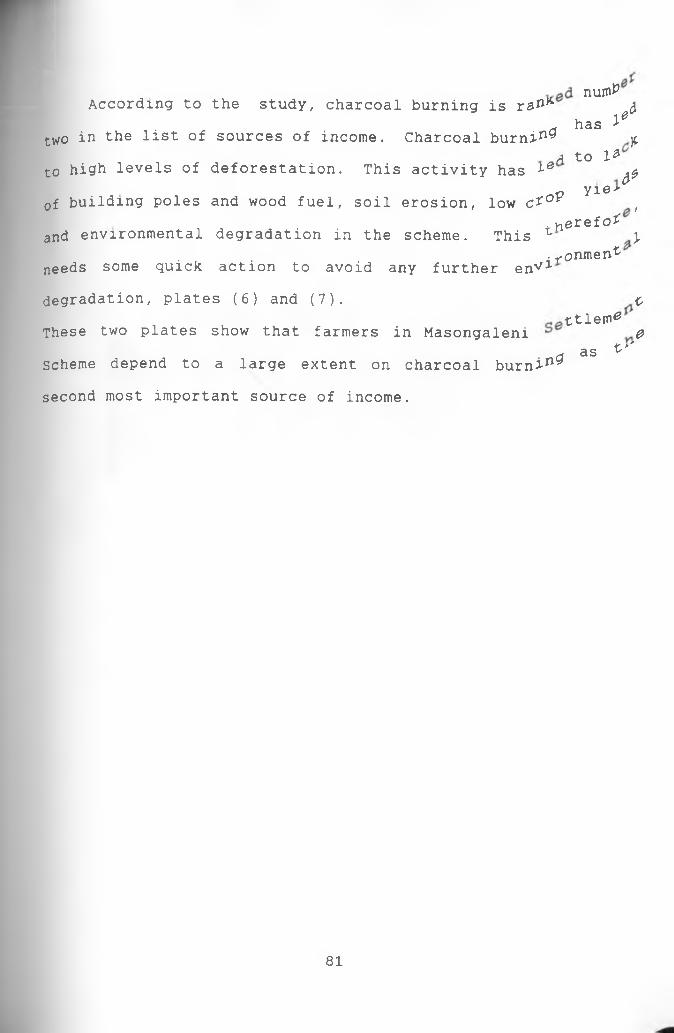
numPAccording to the study, charcoal burning is rah* 4
n has ^two in the list of sources of income. Charcoal burnin 9 y,
a to 1 *to high levels of deforestation. This activity has ie ^
^ yie>0f building poles and wood fuel, soil erosion, low c * ov f
.n erefo*and environmental degradation in the scheme. This z \
. fonment'needs some quick action to avoid any further envl
degradation, plates (6 ) and (7). tttlem^
These two plates show that farmers in Masongaleni 0Y >'
a as vScheme depend to a large extent on charcoal burnin9
second most important source of income.
81
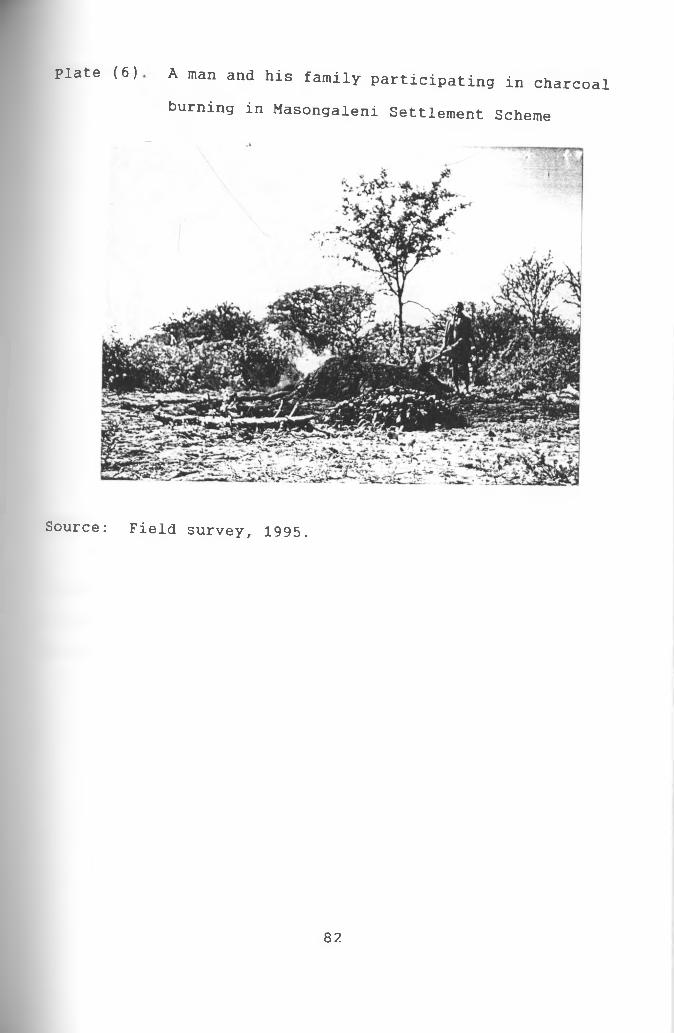
plate (6 ) A man and his family participating in charcoal
burning in Masongaleni Settlement Scheme
Source: Field survey, 1995.
8 2
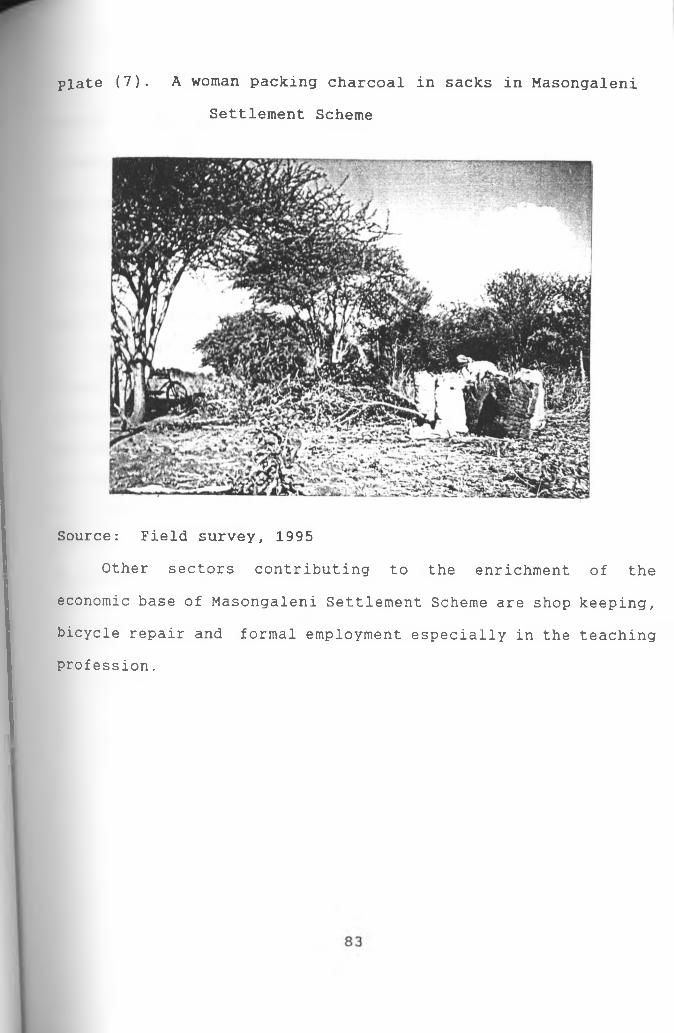
plate (7 ) . A woman packing charcoal in sacks in Masongaleni
Settlement Scheme
Source: Field survey, 1995
Other sectors contributing to the enrichment of the
economic base of Masongaleni Settlement Scheme are shop keeping,
bicycle repair and formal employment especially in the teaching
profession.
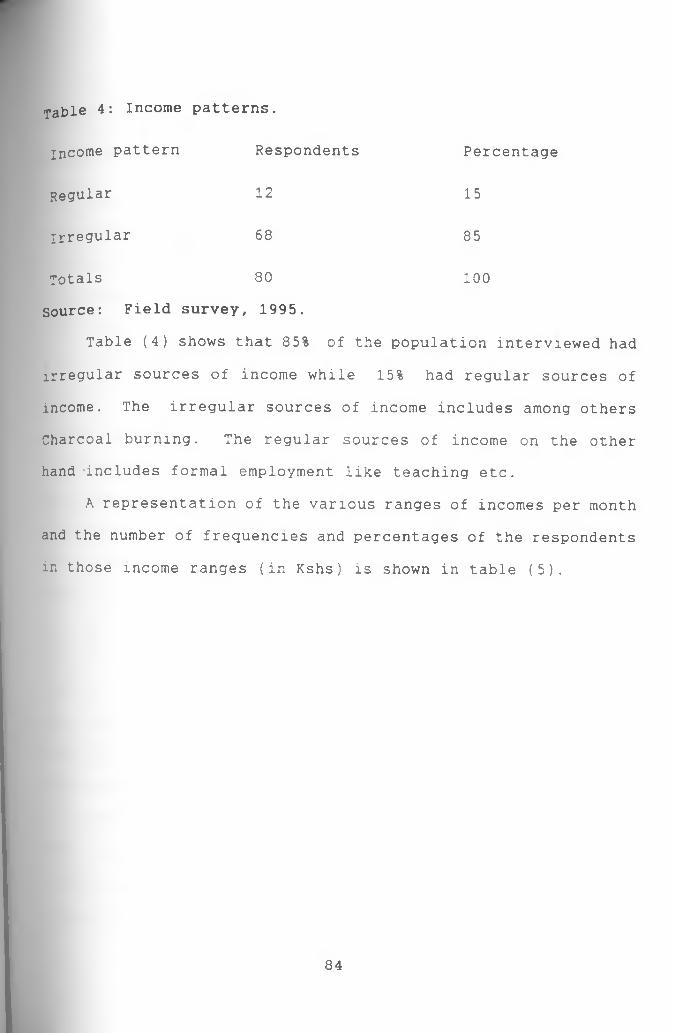
Table 4: Income patterns.
income pattern Respondents Percentage
Regular 12 15
irregular 68 85
Totals 80 100Source: Field survey, 1995.
Table (4) shows that 85% of the population interviewed had
irregular sources of income while 15% had regular sources of
income. The irregular sources of income includes among others
Charcoal burning. The regular sources of income on the other
hand 'includes formal employment like teaching etc.
A representation of the various ranges of incomes per month
and the number of frequencies and percentages of the respondents
in those income ranges (in Kshs) is shown in table (5).
84
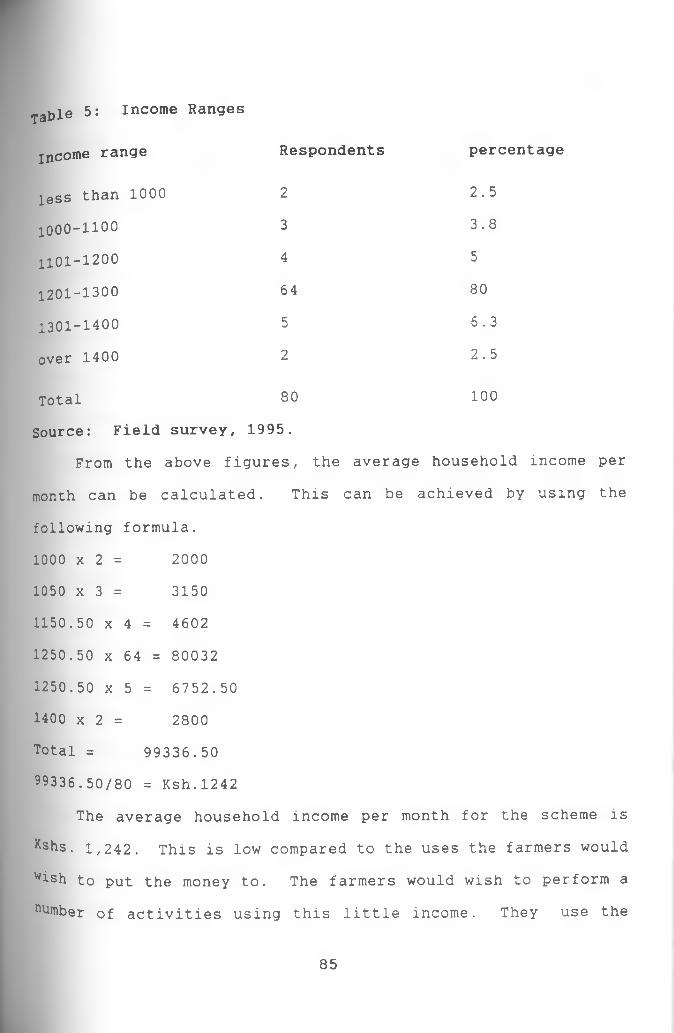
Table 5: Income Ranges
income range Respondents percentage
less than 1 0 0 0 2 2.5
1 0 0 0 - 1 1 0 0 3 3.8
1 1 0 1 - 1 2 0 0 4 5
1201-1300 64 80
1301-1400 5 6.3
over 1400 2 2.5
Total 80 1 0 0
Source: Field survey, 1995.
From the above figures, the average household income per
month can be calculated. This can be achieved by using the
following formula.
1000 x 2 = 2 0 0 0
1050 x 3 = 3150
1150.50 x 4 = 4602
1250.50 x 64 = 80032
1250.50 x 5 = 6752.50
1400 x 2 = 2800
Total = 99336.50
99336.50/80 = Ksh.1242
The average household income per month for the scheme is
Kshs. 1,242. This is low compared to the uses the farmers would
wish to put the money to. The farmers would wish to perform a
dumber of activities using this little income. They use the
85
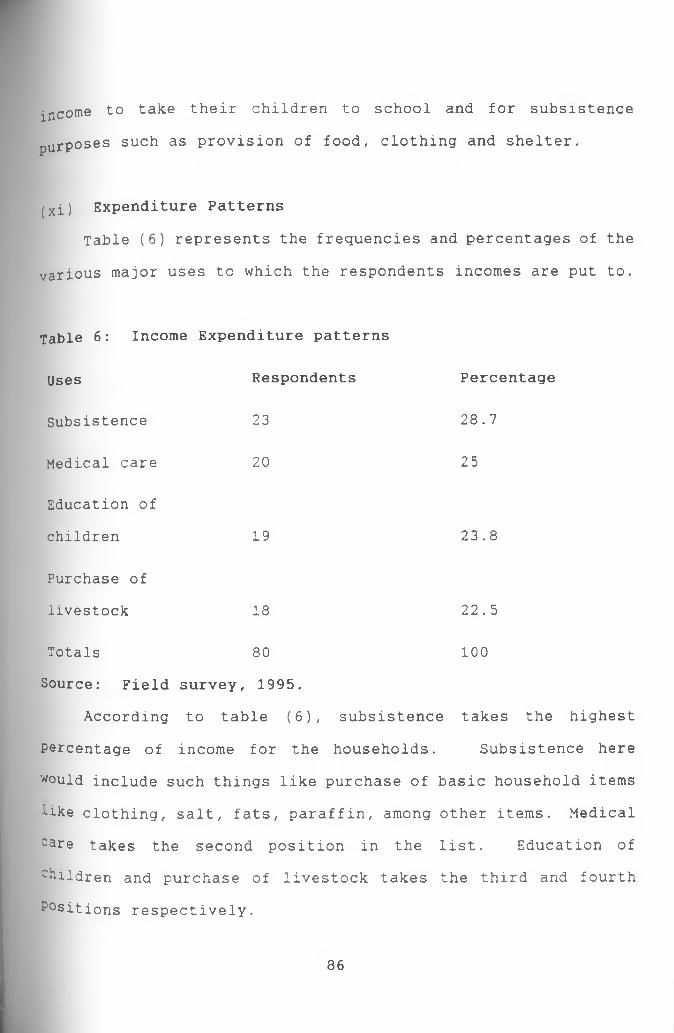
income to take their children to school and for subsistence
purposes such as provision of food, clothing and shelter.
(xi) Expenditure Patterns
Table (6 ) represents the frequencies and percentages of the
various major uses to which the respondents incomes are put to.
Table 6: Income Expenditure patterns
Uses Respondents Percentage
Subsistence 23 28.7
Medical care 20 25
Education of
children 19 23.8
Purchase of
livestock 18 22.5
Totals 80 100
Source: Field survey, 1995.
According to table ( 6 ) , subsistence takes the highest
Percentage of income for the households. Subsistence here
would include such things like purchase of basic household items
"•ike clothing, salt, fats, paraffin, among other items. Medical
care takes the second position in the list. Education of
children and purchase of livestock takes the third and fourth
Positions respectively.
8 6
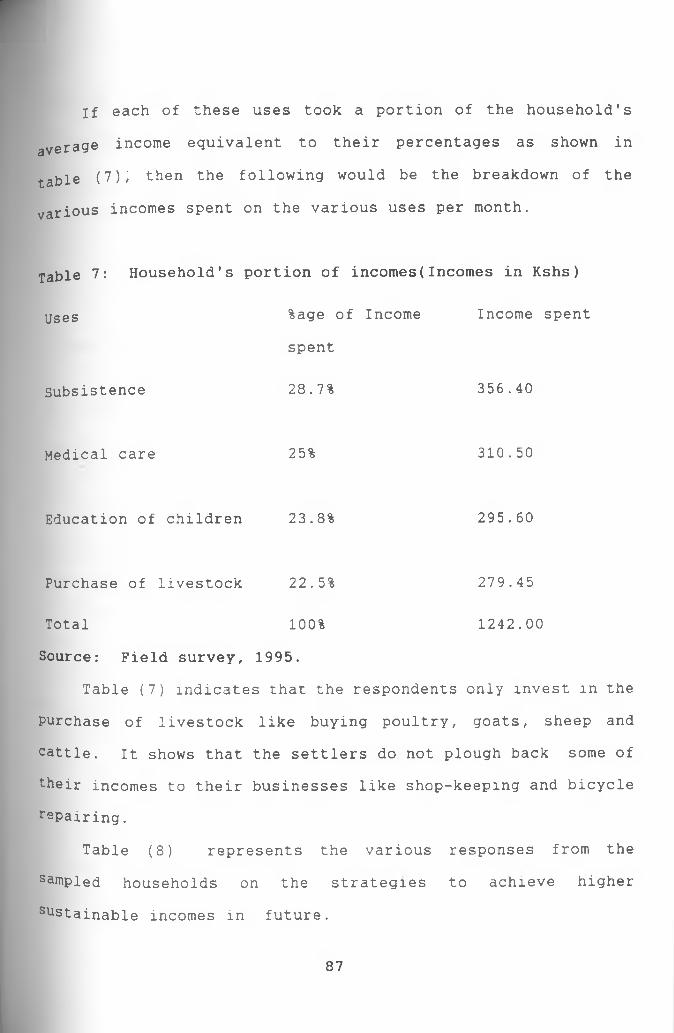
If each of these uses took a portion of the household's
average income equivalent to their percentages as shown in
table (7 )/ then the following would be the breakdown of the
various incomes spent on the various uses per month.
Table 7: Household's portion of incomes(Incomes in Kshs)
Uses %age
spent
Subsistence 28.7%
Medical care 25%
Education of children 23.8%
Purchase of livestock 22.5%
Total 100%
Source: Field survey, 1995.
Table (7) indicates that the respondents only invest in the
Purchase of livestock like buying poultry, goats, sheep and
cattle. It shows that the settlers do not plough back some of
their incomes to their businesses like shop-keeping and bicycle
repairing.
Table (8 ) represents the various responses from the
sampled households on the strategies to achieve higher
Sustainable incomes in future.
of Income Income spent
356.40
310.50
295.60
279.45
1242.00
87
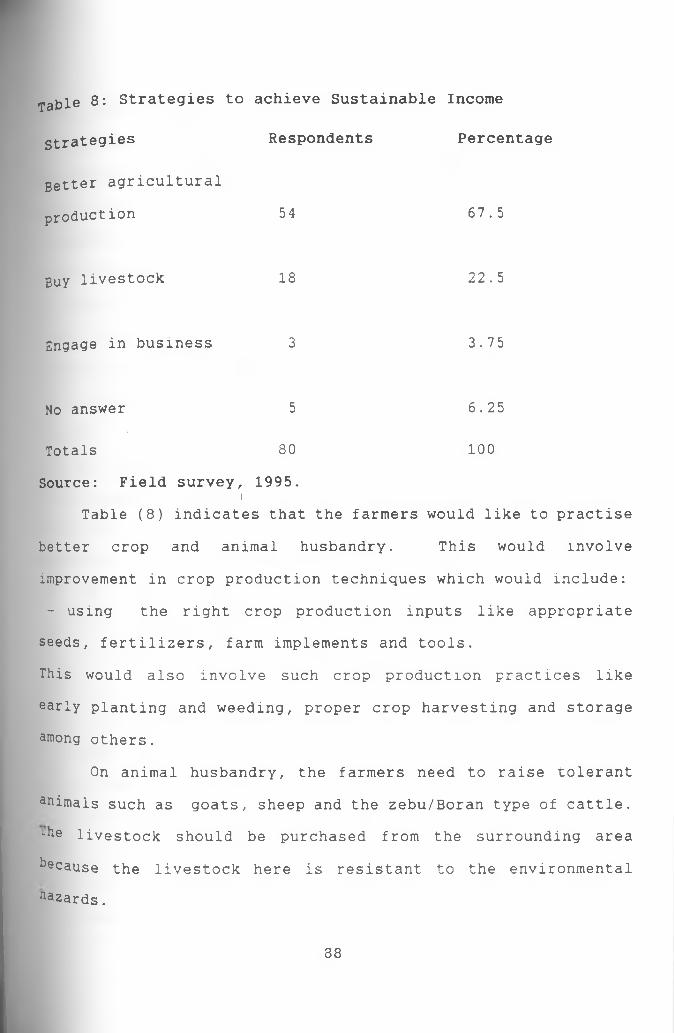
Table 8: Strategies to achieve Sustainable Income
Strategies Respondents Percentage
getter agricultural
production 54 67.5
Buy livestock 18 22.5
Engage in business 3 3.75
No answer 5 6.25
Totals 80 1 0 0
Source: Field survey, 1995.I
Table (8 ) indicates that the farmers would like to practise
better crop and animal husbandry. This would involve
improvement in crop production techniques which would include:
- using the right crop production inputs like appropriate
seeds, fertilizers, farm implements and tools.
This would also involve such crop production practices like
early planting and weeding, proper crop harvesting and storage
among others.
On animal husbandry, the farmers need to raise tolerant
animals such as goats, sheep and the zebu/Boran type of cattle,
-he livestock should be purchased from the surrounding area
because the livestock here is resistant to the environmental
aa2ards.
8 8

(xii) Livestock Keeping
Livestock keeping is one of the economic activities in
Masongaleni Settlement Scheme. The common animals kept are:
sheep, goats, poultry and a few number of cattle and donkeys.
According to the study, virtually all the settlers' livestock
died following their settlement in Masongaleni Settlement Scheme
m 1992. The settlers had very few animals with them during the
field survey compared to the time they were settling in
Masongaleni. The livestock was affected by tsetse fly and tick
borne diseases. The most affected of the animals was cattle.
However, the farmers have tried to raise goats, sheep and
poultry which according to the study are more tolerant to the
environmental factors such as pests, diseases and drought.
According to the study, these animals are kept for several
purposes:
(a) As a means of capital investment.
(b) Sell to get money for household needs such as buying food,
clothing, shelter and sending children to school etc.
(c) For home consumption especially poultry, goats and sheep.
The products for home consumption from these animals are:
milk, meat and eggs.
(d) To pay dowry.
Bee keeping though practised in a low proportion as far as
Part of the livestock practices carried out in the scheme is
c°ncerned is also another economic base of Masongaleni
ettlement Scheme. Data analysis indicates that, 31.5 percent
89
0f the settlers keep bees while 61.3 do not keep bees. In the
areas surrounding Masongaleni Settlement Scheme there are about
30 women groups and a good number of individual families
practise bee keeping. The women groups and private
individuals/families have adopted a relatively better bee
keeping technique compared to the traditional bee keeping
technique.
(xiii) Fish Potential
Masongaleni settlement scheme has a potential for fishing.
Currently, small scale fishing is taking place in the 3 main
rivers. These rivers are: Athi, Kibwezi and Thange. Umanyi
spring is about 19 kilometres from the scheme, so in terms of
distance, it is not accessible for fishing to the people of
Masongaleni. Though there are no records of the fishing
activities along the three rivers, there is a potential for a
variety of fish. Once the proposed dams are constructed there
may be a great potential of fish as a source of protein and
incomes for the people of Masongaleni. Fishing in the scheme is
mostly done during the dry season and therefore it is regarded
as a secondary activity from the other economic activities
within the scheme. However, it is important to sensitize the
local community (mostly the kamba people ) on the importance of
fish as a source of protein to the household.
90
(Xiv) Housing
The quality of life in the rural areas can not be improved
without improvement in the quality of houses in these areas.
Shelter is a basic human need and any development must take
this into account. The provision of decent housing for the
rural people is therefore a necessity for rural development
In Masongaleni Settlement Scheme, most of the housing
structures are of low quality, made of grass thatched roofs and
mud built walls. The main quality of housing structures in the
scheme is a function of the low incomes of most people. Unless
the incomes are raised, the quality of houses will remain low
and this implies low quality of life.
Thus housing in Masongaleni Settlement Scheme is related to
agricultural development in the sense that, it is through
improving agriculture that more incomes can be earned to
provide good quality housing and raise the people's standards of
living, plate (8 ). It portrays the quality of housing which is
found in most parts of Masongaleni Settlement Scheme.
91
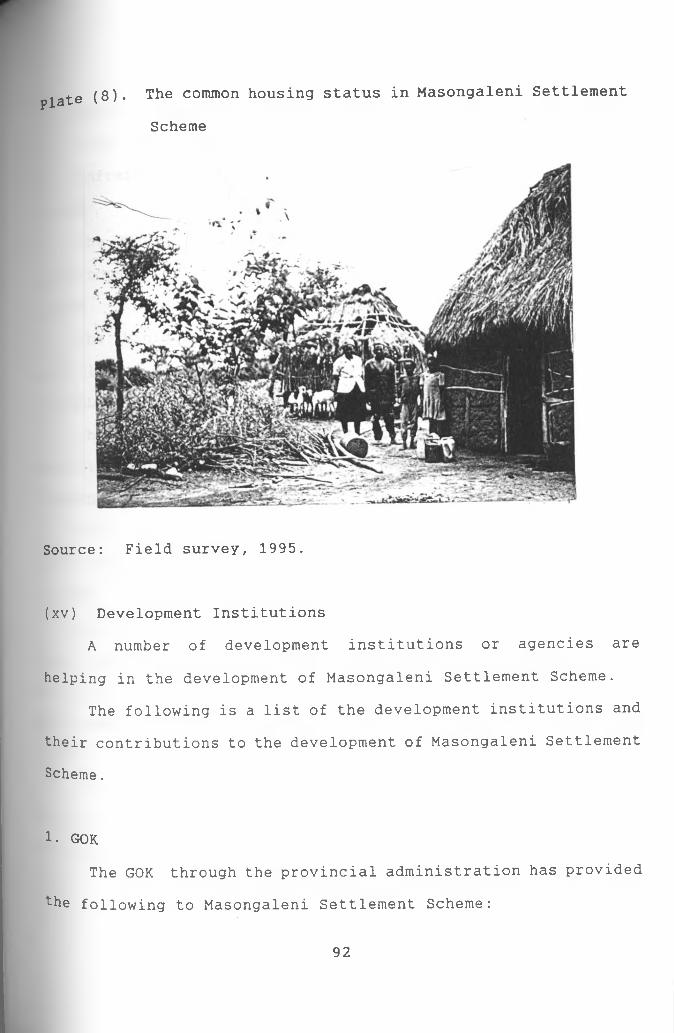
plats (8 ). The common housing status in Masongaleni Settlement
Scheme
Source: Field survey, 1995.
(xv) Development Institutions
A number of development institutions or agencies are
helping in the development of Masongaleni Settlement Scheme.
The following is a list of the development institutions and
their contributions to the development of Masongaleni Settlement
Scheme.
1. GOK
The GOK through the provincial administration has provided
the following to Masongaleni Settlement Scheme:
92
Agricultural extension services Food reliefInfrastructure in form of rural access roads
2. MOE
The Ministry of Education provides teachers and school
inspectorate personnel.
3. MOHThe Ministry of Health provides health services and
agricultural extension services to the Scheme.
4. MOALD&M
The Ministry of Agriculture, Livestock Development and
Marketing provides agricultural extension services.
5. MOCSSThe Ministry of Culture and Social Services has been
involved in registration of self-help groups.
6. AAK
Action Aid Kenya at Kibwezi rural development station has
been assisting in training, provision of infrastructure,
provision of agricultural inputs and offering advice on trade
and commerce.7. CC
The Catholic Church has been assisting in the provision of
agricultural inputs, food relief and provision of health
services .
93
g amref
Africa Medical Research Foundation is involved in the
rehabilitation of the disabled.
9. GV sGermany volunteers from Germany have been involved in the
provision of infrastructure and agricultural extension services.
10. Sub. DDCsThe Sub District Development Committees are involved in
planning, implementation, monitoring and management of projects.
They have been doing that through assistance from such agencies
like GOK, AAK, GVs etc.
11. KARI
Kenya Agricultural Research Institute is involved in the
offering of extension services and provision of planting
materials to the farmers.
12. Pro.Ad
The Provincial Administration is involved in the
administration of the scheme.
13. UON
University of Nairobi is involved in demonstration and
training farmers. UON has been doing this through the small
farmers demonstration and training plots composed of member
farmers from different parts of the Division including
Masongaleni Settlement Scheme. The University of Nairobi
through IDRDU and in conjunction with USAID, a United States
94
agency ana CINADO, an Israeli based agency and European Union
have been involved in the demonstration and training farmers on
horticultural farming (Newspaper 5th, September 1996). These
agencies have been assisting the farmers through Kibwezi
irrigation Project (KIP).
;4. CHEKThe Council for Human Ecology Kenya is involved in the
provision of infrastructure, education and training on
nutrition.
There are about 18 development institutions in Masongaleni
Settlement Scheme. Currently there is an NGO that is in the
process of formation. The NGO is contemplating to be registered
with the Ministry of Culture and Social Services. The proposed
name of the organization is " Masongaleni Council For
Sustainable Development (MACOSUD).
Once the NGO is registered, its main objectives will be:
Agricultural extension services.
Institutional capacity building. This will involve
strengthening of local institutions in project planning,
implementation, monitoring and evaluation. It will also be
involved in influencing policy making by the GOK.
Research and information dissemination and
Gender and HIV/AIDS community sensitization,
Plates (9), (10) and (11).
?late (9) is portraying the role of KARI not only in Masongaleni
Settlement Scheme, but also at the National level. The plate
95
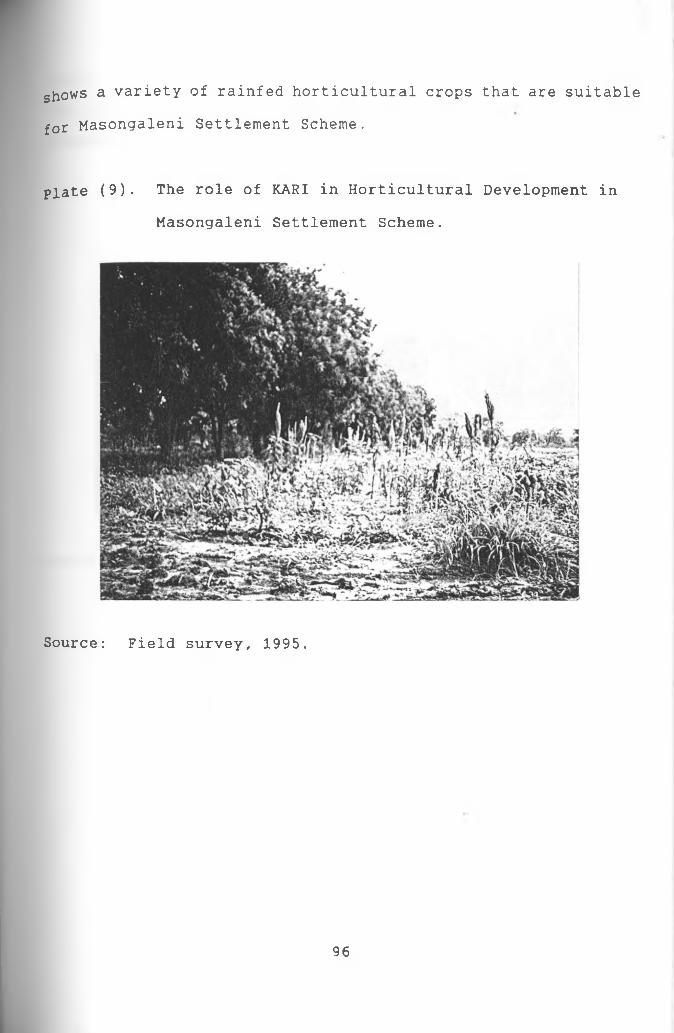
shows a variety of rainfed horticultural crops that are suitable
for Masongaleni Settlement Scheme.
plate (9). The role of KARI in Horticultural Development in
Masongaleni Settlement Scheme.
Source: Field survey, 1995.
96
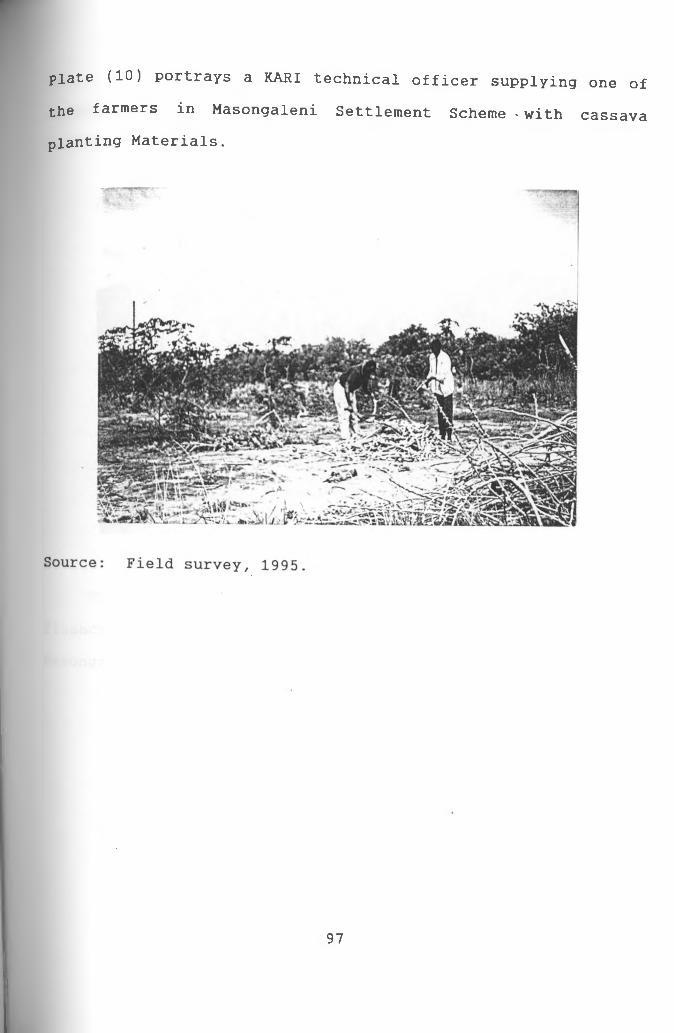
plate (10) portrays a KARI technical officer supplying one of
the farmers in Masongaleni Settlement Scheme * with cassava planting Materials.
97
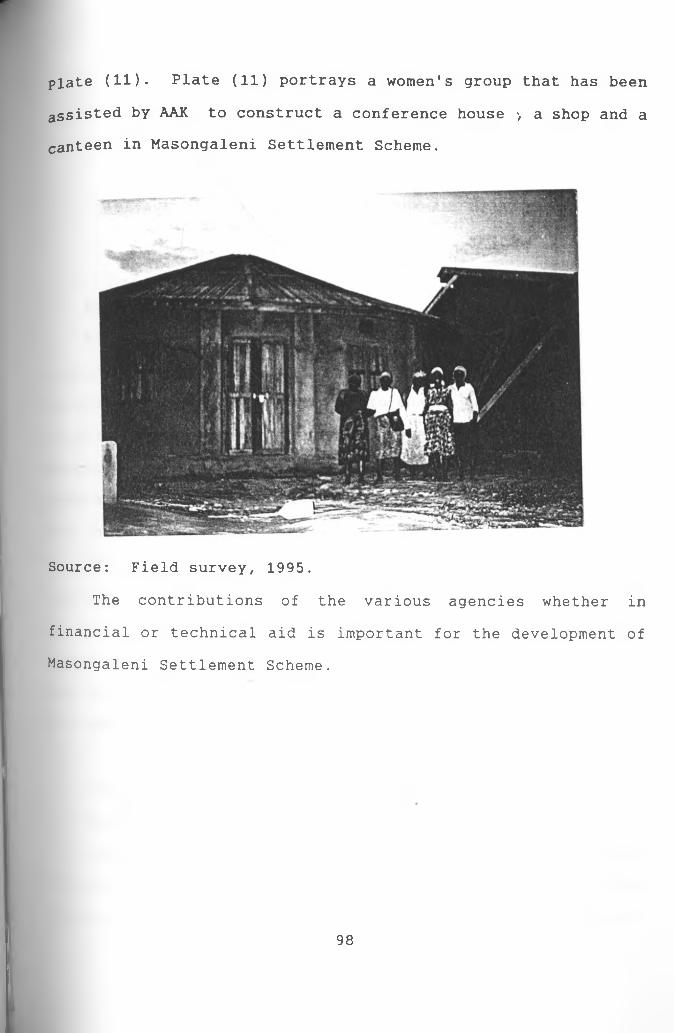
plate (11). Plate (11) portrays a women's group that has been
assisted by AAK to construct a conference house > a shop and a
canteen in Masongaleni Settlement Scheme.
Source: Field survey, 1995.
The contributions of the various agencies whether in
financial or technical aid is important for the development of
Masongaleni Settlement Scheme.
98
CHAPTER FOUR
DATA ANALYSIS, INTERPRETATION, SUMMARY OF FINDINGS
AND SOLUTIONS
4.1 Introduction
After collecting data from the field, the author and his
research assistants went through the questionnaires to fill in
the missing cases. This was done to enable easy processing of
the data. Then the questionnaires were coded. This involved
assigning a number to each questionnaire. This was followed by
preparation of a data structure to be used in the entering of
data into the computer.
In the preparation of the data structure, the author
together with the research assistants gave value labels to all
the answers given by the respondents. This was followed by
running of frequencies in the computer. The frequencies were
used to make tables which were in turn used to present the data
in a descriptive manner.
4-2 Analysis of the Untapped Agricultural Potentials in
Masongaleni Settlement Scheme
Masongaleni Settlement Scheme has untapped agricultural
Potentials. These potentials are identified in the following
sectors: in rainfed agriculture, irrigated agriculture, animal
99
^earing and bee keeping. Each of these potentials is analyzed
below •
i) Rainfed Agriculture
Natural rainfed agriculture is not fully tapped. To prove
'his, the author collected data on the average yields per acre
3f 5 selected crops over the years, i.e from 1992/93 to 1994/95.
The crops selected were maize, sorghum, cow peas, green grams
and pigeon peas. These crops were selected because they are the
main food crops in terms of acreage occupancy. Other factors
considered in selecting the crops were yields per acre and
suitability to the area in terms of climate, diseases and pests
tolerance.
The yields of the five selected crops are compared with the
average yields per acre of the same crops recorded in the annual
report for Makueni District for the years 1992/1993 to
1993/1994. The author compared the average crop yields per acre
m the district on the basis that most parts of the district are
m the same agro-ecological zone and therefore share the same
rainfall and moisture indices with the Masongaleni Settlement
-cheme. Therefore, the figures achieved from the average crop
fields per acre would act as control figures for the data on the
average crop yields per acre for each of the five crops in
Masongaleni Settlement Scheme. The yields in Masongaleni
iettlement Scheme are found to be far much lower compared to the
aV©rage crop yields per acre of the same crops at the District
1 0 0
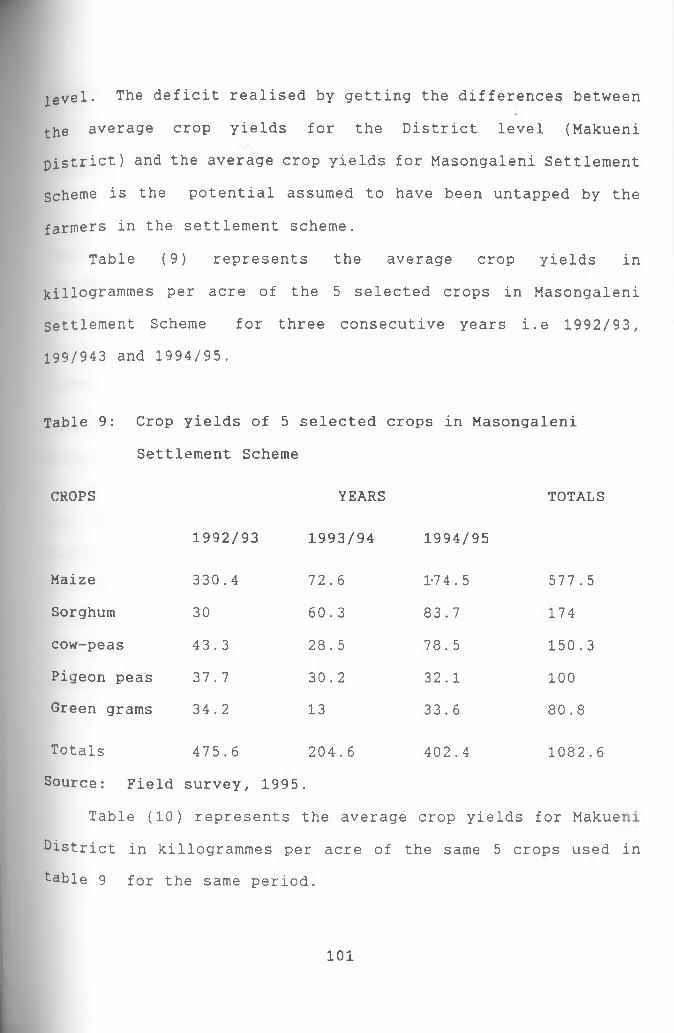
]_evel. The deficit realised by getting the differences between
the average crop yields for the District level (Makueni
District) and the average crop yields for Masongaleni Settlement
Scheme is the potential assumed to have been untapped by the
farmers in the settlement scheme.
Table (9) represents the average crop yields in
killogrammes per acre of the 5 selected crops in Masongaleni
Settlement Scheme for three consecutive years i.e 1992/93,
199/943 and 1994/95.
Table 9: Crop yields of 5 selected crops in Masongaleni
Settlement Scheme
CROPS YEARS TOTALS
1992/93 1993/94 1994/95
Maize 330.4 72.6 17 4.5 577.5
Sorghum 30 60.3 83.7 174
cow-peas 43.3 28.5 78.5 150.3
Pigeon peas 37.7 30.2 32.1 100Green grams 34.2 13 33.6 80.8
Totals 475.6 204.6 402.4 1082.6
Source: Field survey, 1995 •Table (10;) represents the average crop yields for Makue:
district in killogrammes per acre of the same 5 crops used in
table 9 for the same period.
1 0 1
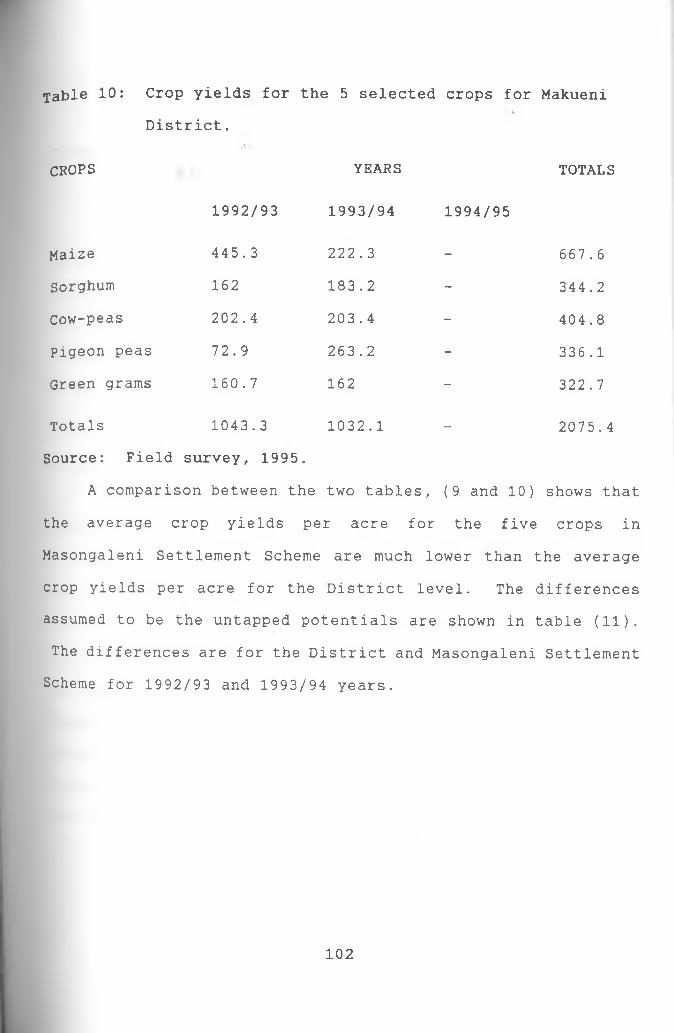
Table 10: Crop yields for the 5 selected crops for MakueniDistrict.
CROPS YEARS TOTALS
1992/93 1993/94 1994/95
Maize 445.3 222.3 - 667.6Sorghum 162 183.2 - 344.2Cow-peas 202.4 203.4 - 404.8
pigeon peas 72.9 263.2 - 336.1
Green grams 160.7 162 - 322.7
Totals 1043.3 1032.1 - 2075.4Source: Field survey, 1995 •
A comparison between the two tables, (9 and 10) shows that
the average crop yields per acre for the five crops in
Masongaleni Settlement Scheme are much lower than the average
crop yields per acre for the District level. The differences
assumed to be the untapped potentials are shown in table (1 1 ).
The differences are for the District and Masongaleni Settlement
Scheme for 1992/93 and 1993/94 years.
1 0 2
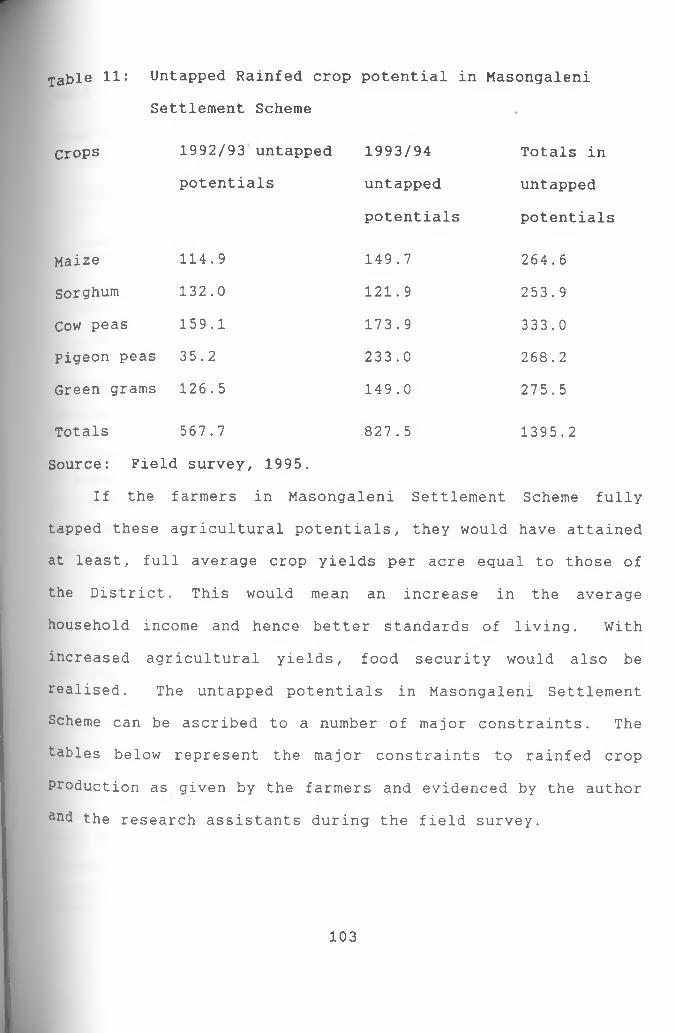
Tafc>]_e 11: Untapped Rainfed crop potential in Masongaleni
Settlement Scheme
Crops 1992/93 untapped 1993/94 Totals inpotentials untapped untapped
potentials potentials
Maize 114.9 149.7 264.6
Sorghum 132.0 121.9 253.9
Cow peas 159.1 173.9 333.0
pigeon peas 35.2 233.0 268.2
Green grams 126.5 149.0 275.5
Totals 567.7 827.5 1395.2
Source: Field survey, 1995.
If the farmers in Masongaleni Settlement Scheme fully
tapped these agricultural potentials, they would have attained
at least, full average crop yields per acre equal to those of
the District This would mean an increase in the average
household income and hence better standards of living. With
increased agricultural yields, food security would also be
realised. The untapped potentials in Masongaleni Settlement
Scheme can be ascribed to a number of major constraints. The
tables below represent the major constraints to rainfed crop
Production as given by the farmers and evidenced by the author
and the research assistants during the field survey.
103
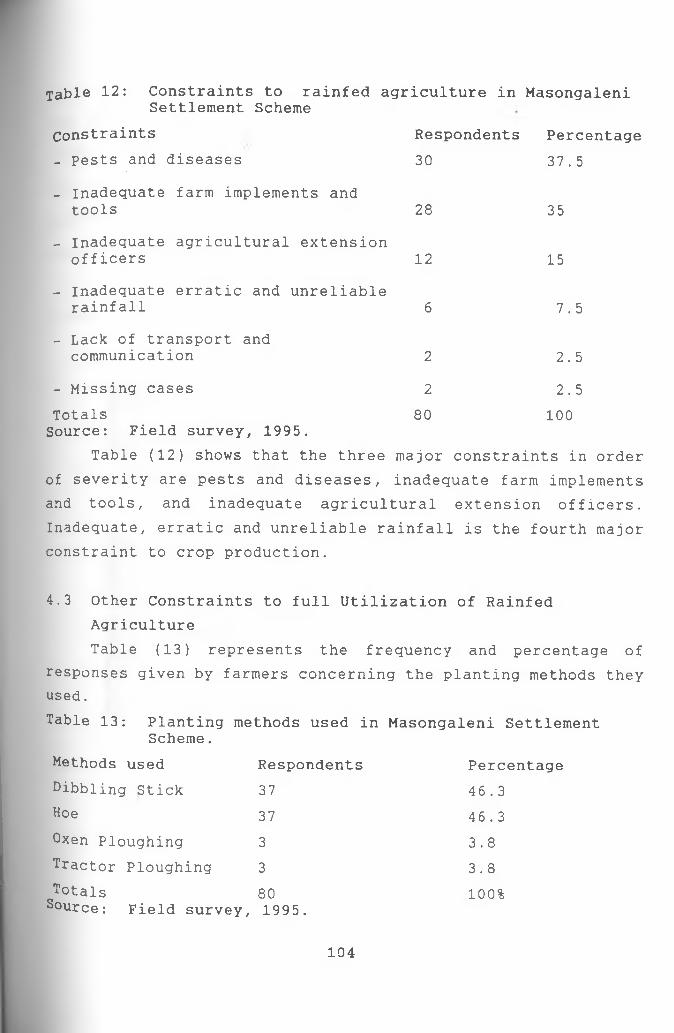
Table 12: Constraints to rainfed agriculture in MasongaleniSettlement Scheme
Constraints Respondents Percentage- Pests and diseases 30 37.5
- inadequate farm implements and tools 28 35
- Inadequate agricultural extension officers 12 15
- Inadequate erratic and unreliable rainfall 6 7.5
- Lack of transport and communication 2 2.5
- Missing cases 2 2.5Totals 80 1 0 0Source: Field survey, 1995.
Table (12) shows that the three major constraints in order of severity are pests and diseases, inadequate farm implements and tools, and inadequate agricultural extension officers. Inadequate, erratic and unreliable rainfall is the fourth major constraint to crop production.
4.3 Other Constraints to full Utilization of Rainfed AgricultureTable (13) represents the frequency and percentage of
responses given by farmers concerning the planting methods they used.Table 13: Planting methods used in Masongaleni Settlement
Scheme.Methods used Dibbling Stick HoeOxen Ploughing Tractor Ploughing TotalsSource: Field survey,
Respondents373733801995.
Percentage46.346.33.83.8 100%
104
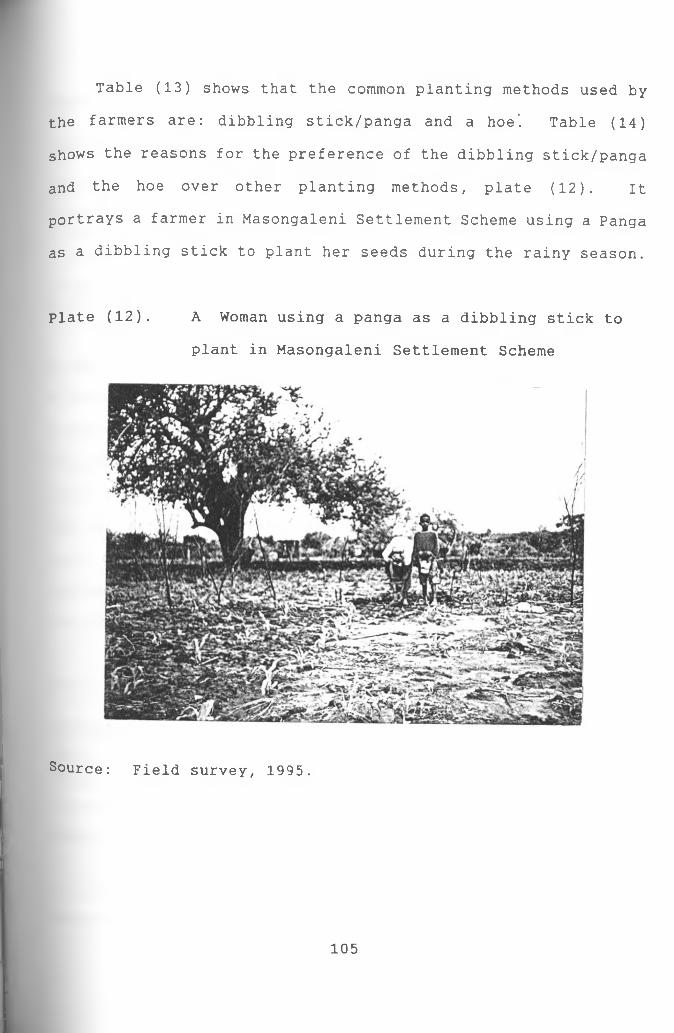
Table (13) shows that the common planting methods used by
the farmers are: dibbling stick/panga and a hoe'. Table (14)
shows the reasons for the preference of the dibbling stick/panga
and the hoe over other planting methods, plate (12). It
portrays a farmer in Masongaleni Settlement Scheme using a Panga
as a dibbling stick to plant her seeds during the rainy season.
Plate (12). A Woman using a panga as a dibbling stick to
plant in Masongaleni Settlement Scheme
Source: Field survey, 1995.
105
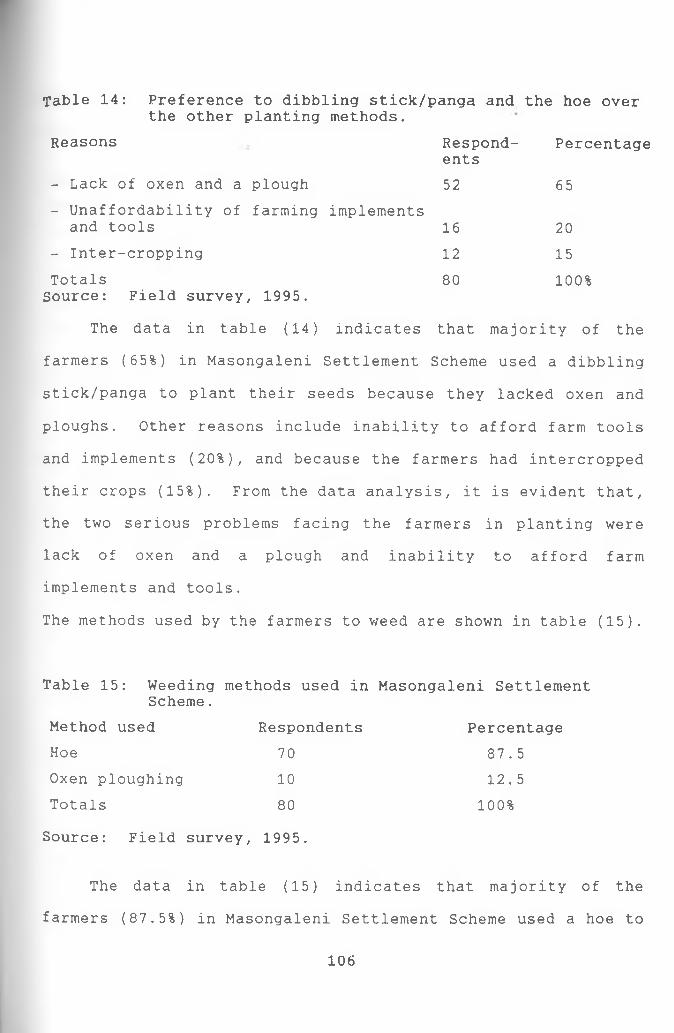
Table 14: Preference to dibbling stick/panga the other planting methods.
and the hoe over
Reasons Respond- Percentage ents
- Lack of oxen and a plough 52 65- Unaffordability of farming
and toolsimplements
16 20- Inter-cropping 12 15TotalsSource: Field survey, 1995.
80 1 0 0 %
The data in table (14) indicates that majority of the
farmers (65%) in Masongaleni Settlement Scheme used a dibbling
stick/panga to plant their seeds because they lacked oxen and
ploughs. Other reasons include inability to afford farm tools
and implements (2 0 %), and because the farmers had intercropped
their crops (15%). From the data analysis, it is evident that,
the two serious problems facing the farmers in planting were
lack of oxen and a plough and inability to afford farm
implements and tools.
The methods used by the farmers to weed are shown in table (15).
Table 15: Weeding methods used in Masongaleni SettlementScheme.
Method used Respondents PercentageHoe 70 87.5Oxen ploughing 10 12.5Totals 80 1 0 0 %
Source: Field survey, 1995.
The data in table (15) indicates that majority of the
farmers (87.5%) in Masongaleni Settlement Scheme used a hoe to
106
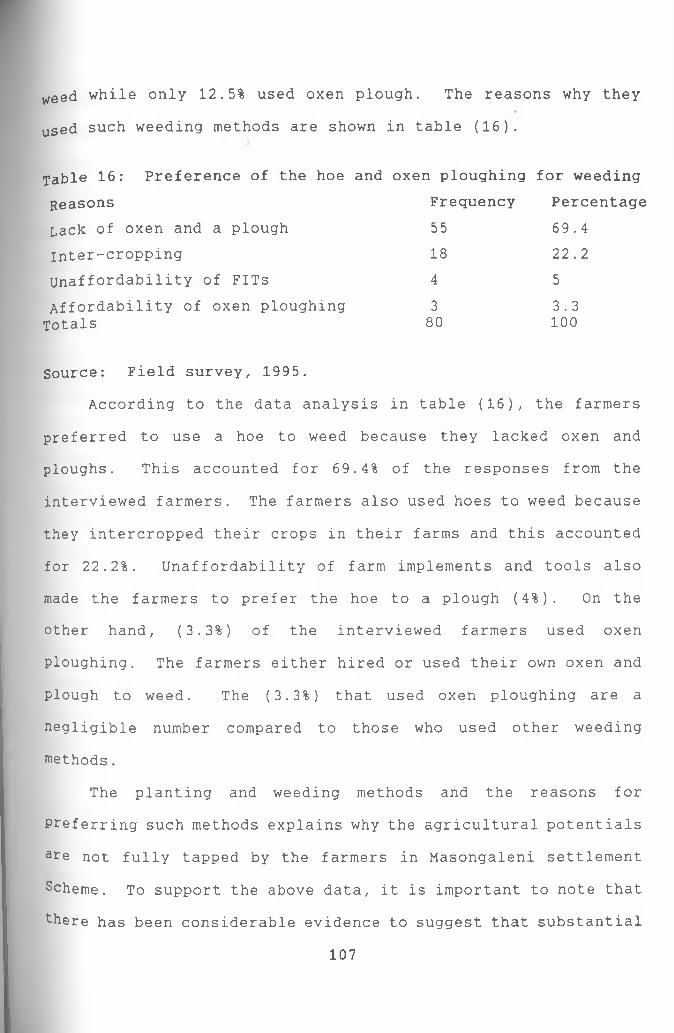
weed while only 12.5% used oxen plough. The reasons why they
used such weeding methods are shown in table (16).
Table 16: Preference of the hoe and oxen ploughing for weedingReasons Frequency PercentageLack of oxen and a plough 55 69.4Inter-cropping 18 2 2 . 2
Unaffordability of FITs 4 5Affordability of oxen ploughing 3 3.3Totals 80 1 0 0
Source: Field survey, 1995.
According to the data analysis in table (16), the farmers
preferred to use a hoe to weed because they lacked oxen and
ploughs. This accounted for 69.4% of the responses from the
interviewed farmers. The farmers also used hoes to weed because
they intercropped their crops in their farms and this accounted
for 22.2%. Unaffordability of farm implements and tools also
made the farmers to prefer the hoe to a plough (4%). On the
other hand, (3.3%) of the interviewed farmers used oxen
ploughing. The farmers either hired or used their own oxen and
plough to weed. The (3.3%) that used oxen ploughing are a
negligible number compared to those who used other weeding
methods.
The planting and weeding methods and the reasons for
Preferring such methods explains why the agricultural potentials
are not fully tapped by the farmers in Masongaleni settlement
Scheme. To support the above data, it is important to note that
there has been considerable evidence to suggest that substantial
107
imProvements iR a9 ricultural output by small-holders has been
aChieved through improved availability of appropriate tools and
equipment.
For example, in a study carried out by Mortimore and
Wellard in Machakos District, it was observed that adoption of
the oxen plough in combination with other agricultural practices
has enabled local small holders to increase their output by 500
per cent between 1910 and 1980 (Mortimore et. al. 1991). The
authors further noted that the time required for weeding can be
reduced by 95 per cent through the use of appropriate equipment.
On the other hand, unavailability of appropriate tools and
equipment constitutes a major constraint in agricultural
production. The most basic farm implements and tools required
by the small holders in Kenya are jembes, fork jembes, shovels,
rakes, traditional hoes, wheel-barrows and oxen ploughs.
However, many farmers do not have adequate supply of these.
The Masongaleni Settlement Scheme farmers are no exception.
Also, a recent study in Embu District found that there was an
inadequate supply of ploughs and as a result many farmers were
unable to plant at the optimum time just as the rains were
starting (Skinner, 1993).
Many farmers had to wait until a plough was available
before they could get a plough and plant their crops. A delay
in 10 days in planting can lead to 52 per cent reduction in
yield.
108
Research has also shown that the use of draught animal
power can reduce this time needed to cultivate a farm by over 60
per cent compared to cultivation by hand, and generally the more
mechanized, the higher output per unit area of land under
agricultural activity. (GOK, 1986; Ministry of Agriculture,
1 9 9 ; 1 9 ) .
4.4 Summary of Findings in Rainfed Agriculture
Basing the research findings on rainfed agriculture with
the general objective and assumption (iii) of the research, it
is evident from the data analysis that rainfed agriculture is a
potential in Masongaleni Settlement Scheme that has not been
fully tapped by the farmers. This is in line with assumption
(iii) that, there exists a variety of crop potential that needs
to be fully tapped.
Basing the findings with objective (i) of the research, the
research has found out that a number of constraints have
hindered the tapping of rainfed agricultural potential. The
main constraints are:
(i) Pests and diseases
(ii) Inadequate farm implements and tools/lack of oxen and
plough or inability to afford these.
(iii) Inadequate agricultural extension Officers
(iv) Inadequate, erratic and unreliable rainfall and
(v ) Lack of transport and communication networks.
109
According to objective (ii) of the study, a summary of
solutions to those constraints may be applied. These are given
in (4.5).
4.5 Solutions to Rainfed Agriculture in Masongaleni Settlement
Scheme
There are several possible solutions the study came up with
as informed by the data collected from the field. The author
and the research assistants ensured what they were told by the
respondents was checked against what they saw (author and
research assistants). The author and the research assistants
cross-checked whether what the respondents suggested or said was
necessary or viable.
The first solution to rainfed agriculture is to encourage
the farmers to buy FITs for themselves. The GOK and other
agencies involved in the development of the scheme, especially
in agriculture, may be requested to assist in giving soft loans
or provision of loans in kind to the farmers. This would enable
the farmers acquire ploughs and oxen for ploughing. The farmers
can also be sensitized on the importance of sharing ploughs and
oxen. For instance, if a farmer has a plough and the other
neighbouring farmer has a bull, then the two farmers may combine
to plough together. This is a viable solution because the
farmers' farms are small in size. Even if the farmers combined
in ploughing, they will still finish ploughing their farms when
the rains are still adequate for the different crops. In other
1 1 0
words, the community needs to be sensitized on the importance of
Community Based Organisations (CBOs) in ploughing. This
solution accounted for 27.5% of the responses from the
interviewed farmers.
The other second solution is for the farmers through
assistance from the GOK and other agencies to make sure they
have their Community Own Resource Persons (CORPs). These CORPs
will act as the farmers' own technical Officers in agriculture
and therefore eradicate over-reliance on government and other
agencies' technical Officers. Besides government extension
officers may not be as sustainable as the CORPs in the long run.
This solution accounted for 27% of the responses.
The third solution is to advice the farmers to grow
drought, pest and disease resistant crops such as Katumani
composite B maize, sorghum, millet, green grams, cow peas and
pigeon peas among others. These drought resistant crops would
contribute to food security. This solution accounted for 13.8%.
The fourth solution is to eradicate mosquitoes that cause
malaria to the farmers especially during the rainy season.
During the field survey, those interviewed by the author and the
research assistants complained that malaria caused shortage of
labour to the households during the farm activities' peak
season. This contributed to late planting, weeding and
harvesting of the crops hence low agricultural yields. The
mosquitoes are mostly harboured in the stagnant water around the
farmers' compounds. The farmers should be sensitized on the
1 1 1
importance of draining stagnant water around their compounds.
This solution accounted for 12.5% of the responses from those
farmers who were interviewed.
Other solutions are to sensitize the farmers on the
importance of timely planting, weeding and harvesting of their
crops and provision of 2 main all weather murram rural access
roads. These two solutions accounted for 6.2% and 5%
respectively. The provision of the access roads will enable the
farmers market their farm produce. The author recommends that
the provision of the rural access roads be accompanied by the
formation of a co-operative society charged with the
responsibility of transporting and marketing of the farmers'
agricultural produce. This co-operative will eradicate the
exploitation of farmers by middle men who offer low prices for
the farmers' produce. If those solutions for rainfed
agriculture are implemented, the farmers will tap the
potentials in rainfed agriculture.
4.6 Irrigated Agriculture
Irrigated agriculture is possible if the waters of Kibwezi,
Athi, Mukange, Thange rivers and Umanyi spring was tapped for
irrigation. Irrigated agriculture would be made possible by
constructing large sub-surface dams along the rivers and the
spring. Canal irrigation would be viable from these dams. One
°f the advantages is that after getting the water from the dams,
can be supplied from a central point through canals (furrow
1 1 2
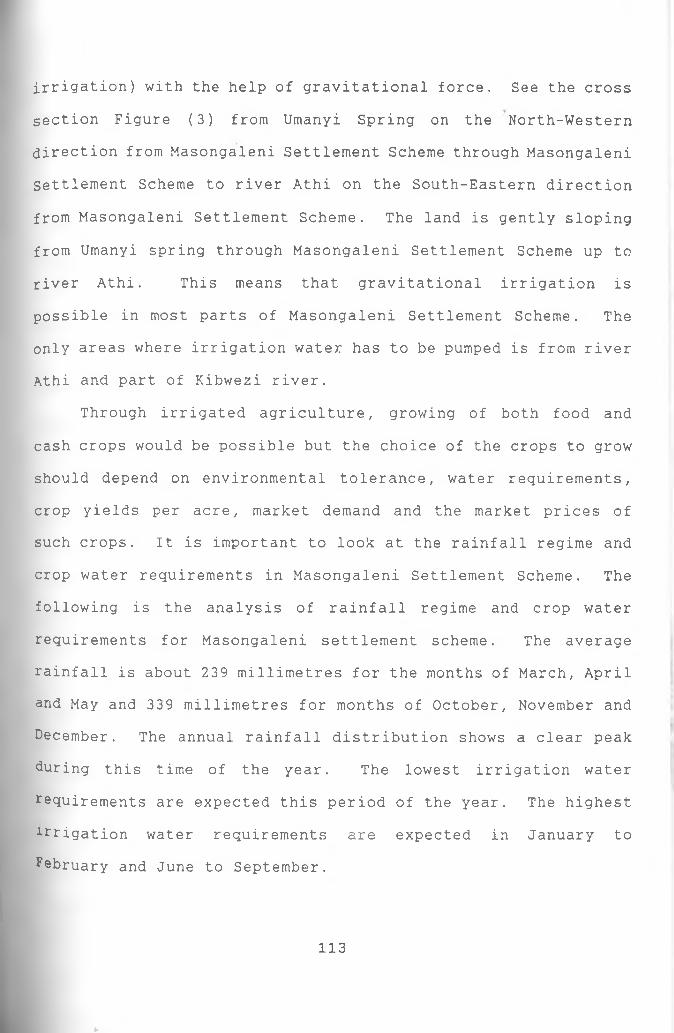
irrigation) with the help of gravitational force. See the cross
section Figure (3) from Umanyi Spring on the North-Western
direction from Masongaleni Settlement Scheme through Masongaleni
Settlement Scheme to river Athi on the South-Eastern direction
from Masongaleni Settlement Scheme. The land is gently sloping
from Umanyi spring through Masongaleni Settlement Scheme up to
river Athi. This means that gravitational irrigation is
possible in most parts of Masongaleni Settlement Scheme. The
only areas where irrigation water has to be pumped is from river
Athi and part of Kibwezi river.
Through irrigated agriculture, growing of both food and
cash crops would be possible but the choice of the crops to grow
should depend on environmental tolerance, water requirements,
crop yields per acre, market demand and the market prices of
such crops. It is important to look at the rainfall regime and
crop water requirements in Masongaleni Settlement Scheme. The
following is the analysis of rainfall regime and crop water
requirements for Masongaleni settlement scheme. The average
rainfall is about 239 millimetres for the months of March, April
and May and 339 millimetres for months of October, November and
December. The annual rainfall distribution shows a clear peak
during this time of the year. The lowest irrigation water
requirements are expected this period of the year. The highest
irrigation water requirements are expected in January to
February and June to September.
113
*■
4.7 Water Demand in Masongaleni Settlement Scheme.
It is important to analyze the water demand in Masongaleni
Settlement Scheme because if the water supply from the various
sources is not adequate to meet the water demand in the Scheme,
then irrigated agriculture which takes about 73% of the
available water supply according to Habitat would not be
possible.
The study classifies water demand in Masongaleni settlement
scheme into three main categories, namely: irrigated
agriculture, human consumption and livestock water demand.
The total amount of water from the various rivers' minimum flow
is 86,416,530 cubic metres per day. It should be noted that
this amount of water is the one that may be harvested directly
from the rivers without having to construct reservoirs.
Therefore, once the water is harvested from the constructed
reservoirs, then the amount of water available for different
uses will be more.
The total amount of water that would be available from the
11 boreholes and/or shallow wells including the existing ones is
791.1 cubic metres per day. Roof catchment will yield 0.631
cubic metres of water per square metre of an iron sheet thatched
house. Rain water harvesting can also be used for irrigation.
The rain water can be tapped by use of underground tanks and the
water can be used for irrigation purposes among other domestic
water uses. The farmers need to be trained by the technical
114
officers from concerned agencies on how to do this type of rain
water catchment.
Irrigated agriculture will consume 423,360 cubic metres of
water per day. This amount of water will be able to irrigate 2
acres per day per household. The 2 acres irrigated by each
household if the irrigation water is provided by the Government
in conjunction with the other agencies will provide enough
employment opportunities to the farmers. The farmers should
keep 1 cow of the Boran type or cross-bred and small tolerant
animals like 5 goats, 5 sheep and a number of rabbits and
poultry. Poultry and rabbits take negligible amount of water,
therefore, their water demand is not a critical issue. The
author therefore, computes water demand for 1 cow, 5 sheep and
5 goats.
The farmers need to practise zero grazing or near zero
grazing by feeding the livestock from the agricultural by
products like maize stalk etc. A cow is more economical to keep
than a bull because of a variety of reasons. The cow is able to
give protein from its milk and its related by-products. The
milk products may be sold to earn the farmer incomes. This
contributes to the diversification of the farmer's sources of
income. Keeping a bull will not be economical to the farmers in
Masongaleni because it requires high amounts of dry matter
annually while it is able to provide fewer uses to the farmer.
F°r example, it can provide animal power for ploughing. The
farmer may hire animal power for ploughing his farm or join CBOs
115
concerned with ploughing activities in the Scheme. The
formation of these farming CBOs will mean that each farmer may
not need to have a bull.
However, irrigated agriculture will consume 423,360 cubic
metres of water per day. Cattle (1 cow) will consume 0.5 cubic
metres per day. The 5 goats and 5 sheep will consume 0.1 cubic
metres of water per day. The 10,190 human population will
consume 254.8 cubic metres of water per day. Total potential
water supply from the rivers is 86,416,530 cubic metres per
day.Total water demand from all the above sectors is (423,618
cubic metres per day). This water demand will leave a water
balance of 85992912 cubic metres of water per day. If loss of
water through evapotranspiration and other ways during the
irrigation process is taken to be equivalent to the amount of
water used for the irrigated agriculture i.e 423,360 cubic
metres of water per day, a water balance of 85,569,555 cubic
metres per day will be left. This water balance will be used in
future and will take care of water demand for various sectors in
future. The same amount of water balance will take care of the
neighbouring areas of Masongaleni Settlement Scheme and its
environs. To calculate the water demand for the human
Population in the Scheme, the author assumed that a half of the
Population will have their own water points and the other half
will be drawing water from communal ones. However, water for
^inking may be fetched from boreholes as they can provide
116
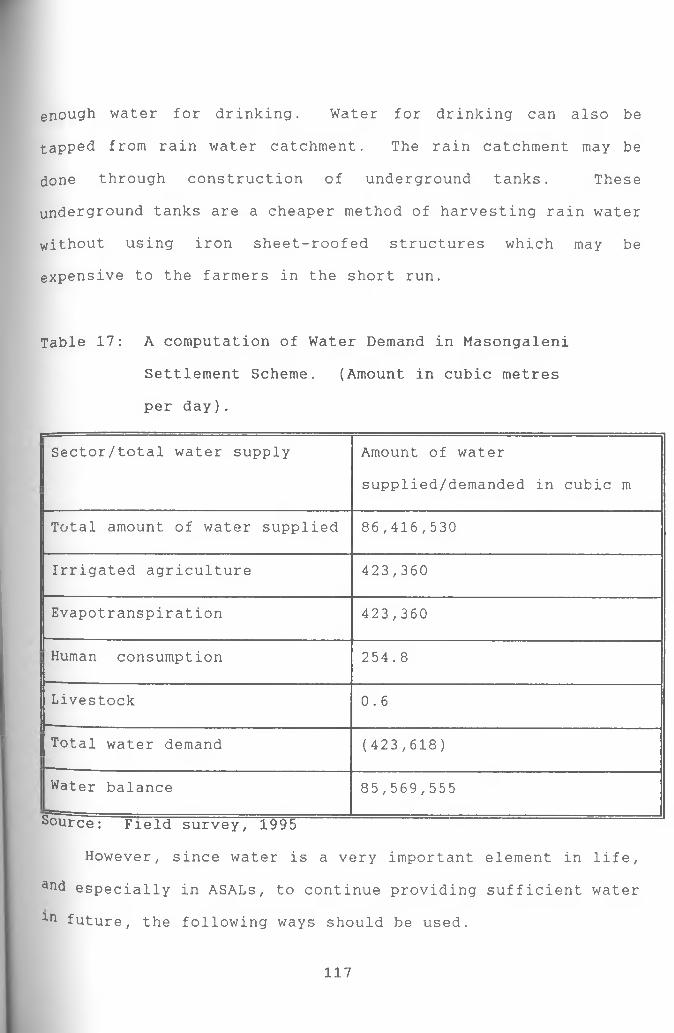
enough water for drinking. Water for drinking can also be
tapped from rain water catchment. The rain catchment may be
done through construction of underground tanks. These
underground tanks are a cheaper method of harvesting rain water
without using iron sheet-roofed structures which may be
expensive to the farmers in the short run.
Table 17: A computation of Water Demand in Masongaleni
Settlement Scheme. (Amount in cubic metres
per day).
Sector/total water supply Amount of water
supplied/demanded in cubic m
Total amount of water supplied 86,416,530
Irrigated agriculture 423,360
Evapotranspiration 423,360
Human consumption 254.8
Livestock 0.6
| Total water demand (423,618)
Water balance 85,569,555
Source: Field survey, 1995
However, since water is a very important element in life,
and especially in ASALs, to continue providing sufficient water
ln future, the following ways should be used.
117
(i) Roof catchment. It is assumed that with the
introduction of irrigated agriculture the farmers will
be able to get enough incomes to have iron sheet-
roofed houses or any other roofing materials that are
safe for tapping safe drinking water.
(ii) Potential for shallow wells should be investigated in
all the sub-locations of the scheme.
(iii) Where there are perennial springs, the water should be
protected and enhanced to serve communities in the
immediate surrounding.
(iv) The available community-run piped water systems in the
neighbouring areas and those to be in the scheme in
future should be extended to serve more people in
the scheme.
(v) Water should be provided in schools and other
institutions by constructing adequate tanks in schools
and other institutions. This should be extended to
cover almost every school or institution in all the
areas in Masongaleni settlement scheme.
118
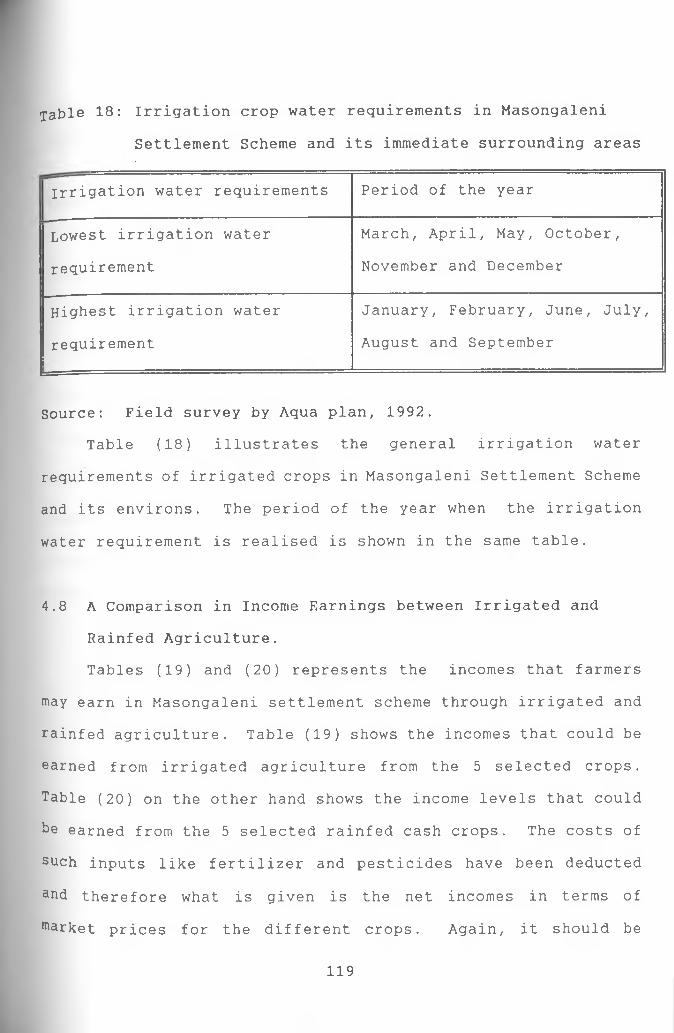
Table 18: Irrigation crop water requirements in Masongaleni
Settlement Scheme and its immediate surrounding areas
Irrigation water requirements Period of the year—Lowest irrigation water March, April, May, October,
requirement November and December
Highest irrigation water January, February, June, July,
requirement— —
August and September
Source: Field survey by Aqua plan, 1992.
Table (18) illustrates the general irrigation water
requirements of irrigated crops in Masongaleni Settlement Scheme
and its environs. The period of the year when the irrigation
water requirement is realised is shown in the same table.
4.8 A Comparison in Income Earnings between Irrigated and
Rainfed Agriculture.
Tables (19) and (20) represents the incomes that farmers
may earn in Masongaleni settlement scheme through irrigated and
rainfed agriculture. Table (19) shows the incomes that could be
earned from irrigated agriculture from the 5 selected crops.
Table (20) on the other hand shows the income levels that could
ke earned from the 5 selected rainfed cash crops. The costs of
such inputs like fertilizer and pesticides have been deducted
aud therefore what is given is the net incomes in terms of
Market prices for the different crops. Again, it should be
119
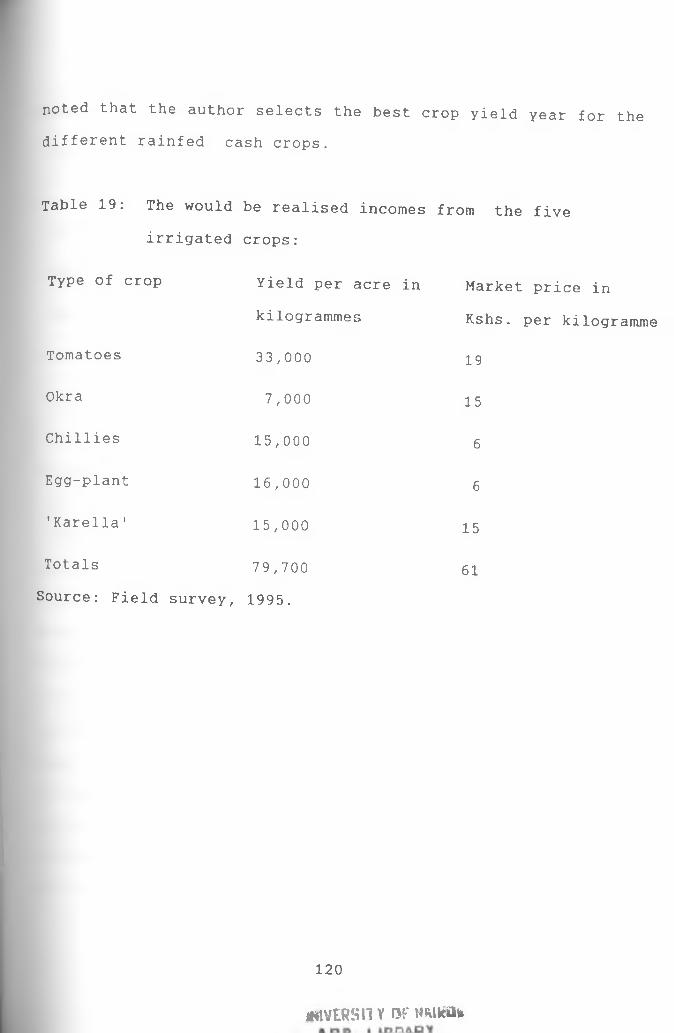
noted that the author selects the best crop yield year for the different rainfed cash crops.
Table 19: The would be realised incomes from the
irrigated crops:
Type of crop Yield per acre in Marketkilogrammes Kshs.
Tomatoes 33,000 19
Okra 7,000 15
Chillies 15,000 6
Egg-plant 16,000 6
'Karelia' 15,000 15
Totals 79,700 61Source: Field survey, 1995.
five
price in
per kilogramme
120
Ml VERS 11V W MMKDk
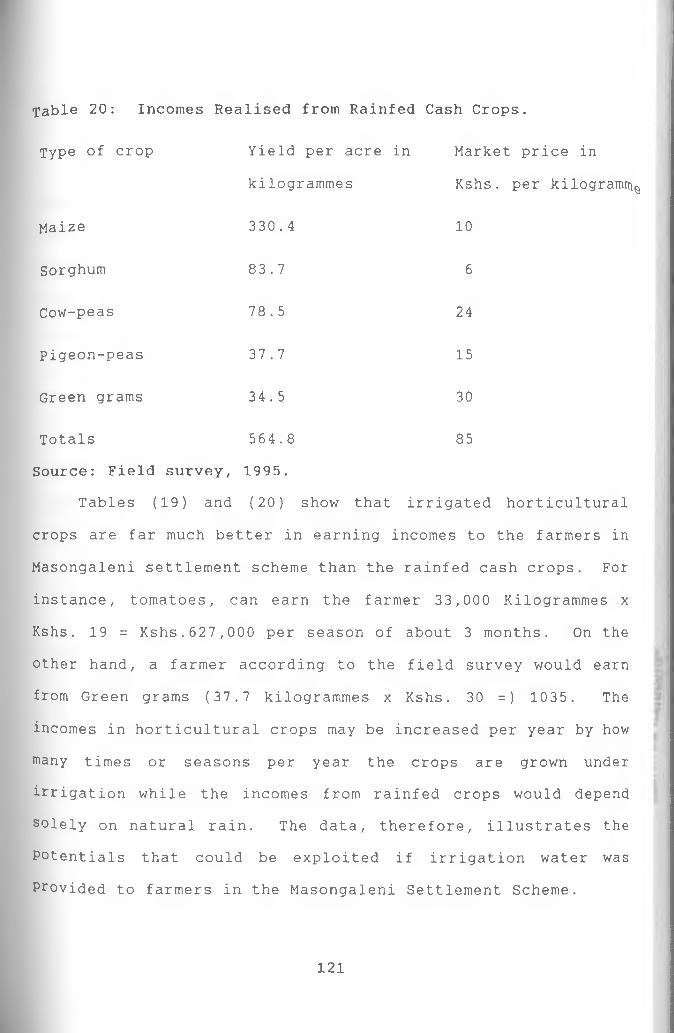
Table 20: Incomes Realised from Rainfed Cash Crops.
Type of crop Yield per acre in Market price in
kilogrammes Kshs. per kilogrami^
Maize 330.4 10
Sorghum 83.7 6
Cow-peas 78.5 24
pigeon-peas 37.7 15
Green grams 34.5 30
Totals 564.8 85
Source: Field survey, 1995.
Tables (19) and (20) show that irrigated horticultural
crops are far much better in earning incomes to the farmers in
Masongaleni settlement scheme than the rainfed cash crops. For
instance, tomatoes, can earn the farmer 33,000 Kilogrammes x
Kshs. 19 = Kshs.627,000 per season of about 3 months. On the
other hand, a farmer according to the field survey would earn
from Green grams (37.7 kilogrammes x Kshs. 30 =) 1035. The
incomes in horticultural crops may be increased per year by how
roany times or seasons per year the crops are grown under
irrigation while the incomes from rainfed crops would depend
solely on natural rain. The data, therefore, illustrates the
Potentials that could be exploited if irrigation water was
Provided to farmers in the Masongaleni Settlement Scheme.
1 2 1
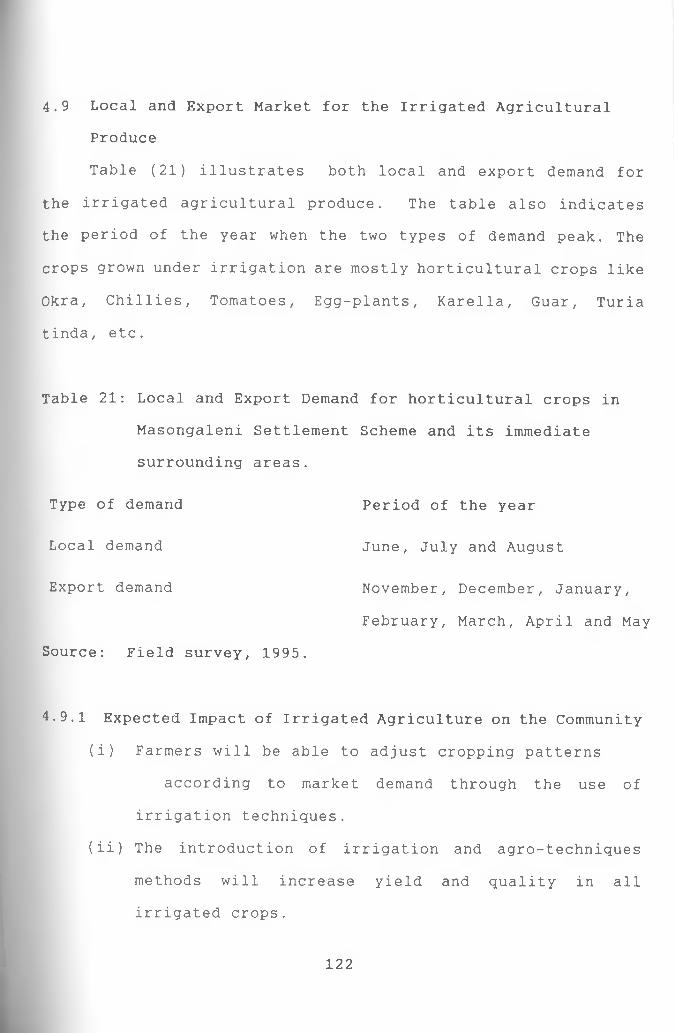
4.9 Local and Export Market for the Irrigated Agricultural
Produce
Table (21) illustrates both local and export demand for
the irrigated agricultural produce. The table also indicates
the period of the year when the two types of demand peak. The
crops grown under irrigation are mostly horticultural crops like
Okra, Chillies, Tomatoes, Egg-plants, Karelia, Guar, Turia
tinda, etc.
Table 21: Local and Export Demand for horticultural crops in
Masongaleni Settlement Scheme and its immediate
surrounding areas.
Type of demand Period of the year
Local demand June, July and August
Export demand November, December, January,
February, March, April and May
Source: Field survey, 1995.
4.9.1 Expected Impact of Irrigated Agriculture on the Community
(i) Farmers will be able to adjust cropping patterns
according to market demand through the use of
irrigation techniques.
(ii) The introduction of irrigation and agro-techniques
methods will increase yield and quality in all
irrigated crops.
1 2 2
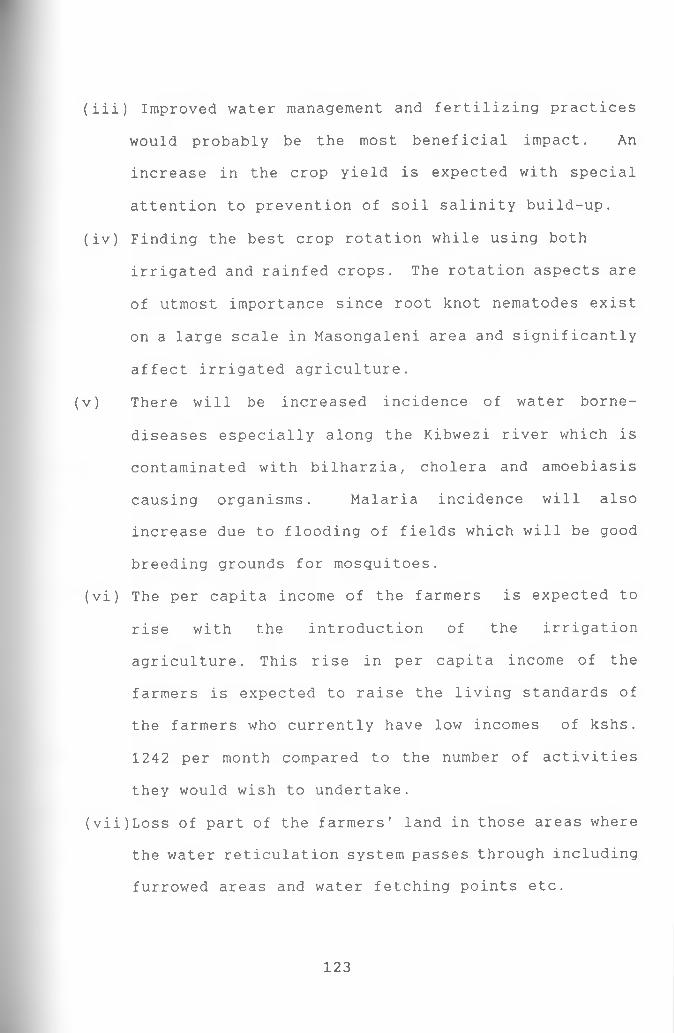
(iii) Improved water management and fertilizing practices
would probably be the most beneficial impact. An
increase in the crop yield is expected with special
attention to prevention of soil salinity build-up.
(iv) Finding the best crop rotation while using both
irrigated and rainfed crops. The rotation aspects are
of utmost importance since root knot nematodes exist
on a large scale in Masongaleni area and significantly
affect irrigated agriculture.
(v) There will be increased incidence of water borne-
diseases especially along the Kibwezi river which is
contaminated with bilharzia, cholera and amoebiasis
causing organisms. Malaria incidence will also
increase due to flooding of fields which will be good
breeding grounds for mosquitoes.
(vi) The per capita income of the farmers is expected to
rise with the introduction of the irrigation
agriculture. This rise in per capita income of the
farmers is expected to raise the living standards of
the farmers who currently have low incomes of kshs.
1242 per month compared to the number of activities
they would wish to undertake.
(vii) Loss of part of the farmers' land in those areas where
the water reticulation system passes through including
furrowed areas and water fetching points etc.
123
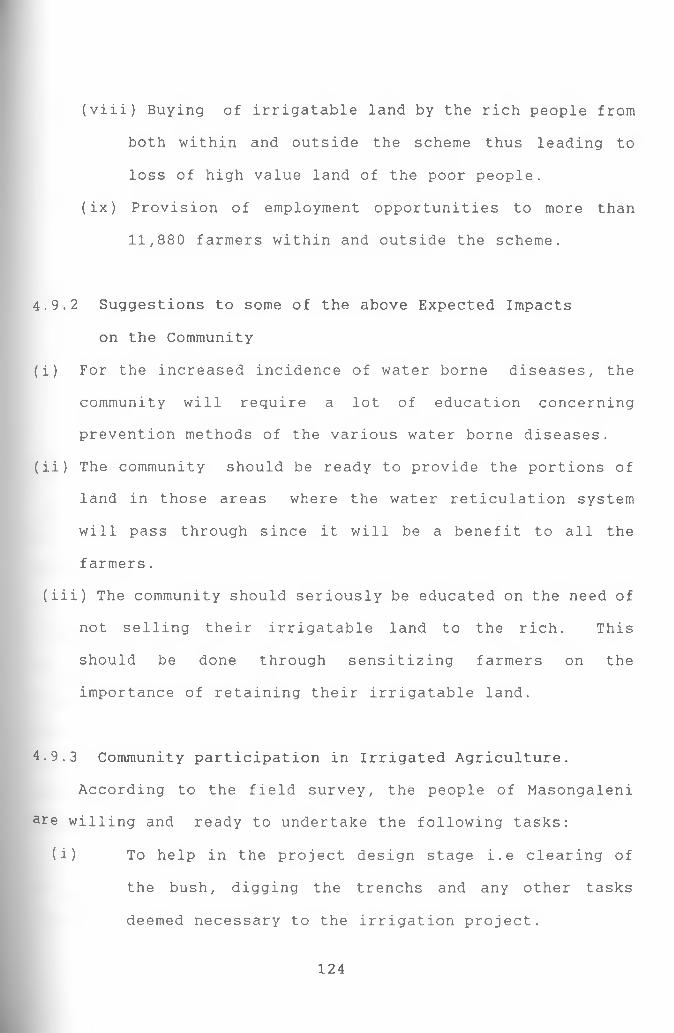
(viii) Buying of irrigatable land by the rich people from
both within and outside the scheme thus leading to
loss of high value land of the poor people.
(ix) Provision of employment opportunities to more than
11,880 farmers within and outside the scheme.
4.9.2 Suggestions to some of the above Expected Impacts
on the Community
(i) For the increased incidence of water borne diseases, the
community will require a lot of education concerning
prevention methods of the various water borne diseases.
(ii) The community should be ready to provide the portions of
land in those areas where the water reticulation system
will pass through since it will be a benefit to all the
farmers.
(iii) The community should seriously be educated on the need of
not selling their irrigatable land to the rich. This
should be done through sensitizing farmers on the
importance of retaining their irrigatable land.
4.9.3 Community participation in Irrigated Agriculture.
According to the field survey, the people of Masongaleni
are willing and ready to undertake the following tasks:
(i) To help in the project design stage i.e clearing of
the bush, digging the trenchs and any other tasks
deemed necessary to the irrigation project.
124
(ii) The community is ready and prepared to help in the
project implementation stages especially the labour
aspect.
(iii) After the project completion, the farmers will have
monthly contributions for the maintenance and upkeep
of the project.
(iv) The farmers will form a marketing body to help market
their crops and also purchase fertilizers and
pesticides in bulk and pass on the discount benefit to
the individual farmers.
4.9.4 Summary of Findings in Irrigated Agriculture
Referring to the general objective and assumption (iii) of
the research, it is evident from the data analysis on irrigated
agriculture that Masongaleni Settlement Scheme has a potential
in irrigated agriculture. The data analysis portrays that
irrigated agriculture is not fully exploited in Masongaleni
Settlement Scheme. From the analysis on water demand in the
Scheme, the study finds that there is adequate water to cater
for irrigation water after water demand in human and livestock
sectors has been met adequately. Also, the study finds that
incomes from irrigated agriculture are far much higher than
those incomes realised from rainfed agriculture.
However, basing the findings on objective (i) of the study,
a number of constraints to irrigated agriculture have been
identified. These constraints include among others:
125
(i) Pests and diseases of the various horticultural crops.
(ii) Inadequate agricultural inputs such as farm implements
and tools, fertilizers, pesticides and seeds.
(iii) Lack of irrigation water.
(iv) Lack of farming and irrigation technology.
(v) Competition among a number of horticultural crops against
small plot size.
(vi) Competition between rainfed and irrigated crops.
(vii) Crop irrigation water requirements during the course of
the year.
(viii) Difficulty in tapping fully both the local and export
markets without interfering with irrigated crops or
rainfed agriculture.
Using objective (ii) of the study, a summary of strategies
and/or solutions may be applied to give possible opportunities
for agricultural development in Masongaleni Settlement Scheme.
4.9.5 Solutions to Irrigated Agriculture
A number of strategies could be applied to offer possible
solutions to the constraints in irrigated agriculture, with one
strategy being used to provide multiple solutions.
The constraint of pests and diseases can be solved by
aPPlying a variety of appropriate pesticides and proper crop
r°tation. The farmers need to be exposed to the demonstration
ahd training services like those conducted by Kibwezi Irrigation
r°ject (KIP). KIP is a University of Nairobi project through
126
its IDRDU in conjunction with USAID (an American agency) and
CINADO (an Israeli agency). The project is involved in
demonstration and training of farmers on horticultural farming
through small group owned plots. These groups involve farmers
from different areas in Kibwezi Division including Masongaleni
Settlement Scheme. The same technical services, if extended to
cover all the farmers in Masongaleni Settlement Scheme would
eradicate the problem of lack of knowledge for the appropriate
agrochemicals and other horticultural technical services in the
Scheme.
Also, when growing these crops a plot size equal to the one
grown with these crops should be set aside for proper crop
rotation.
Early and timely, planting, weeding and harvesting of the
horticultural crops are also possible solutions.
Inadequate agricultural inputs like farm implements,
tools, fertilizers and seeds can be solved by farmers own
purchase of these inputs.
The farmers can also be accessed to credit facilities.
One important way through which the government can assist the
farmers in getting agricultural credit from possible credit
institutions is to encourage the farmers to complete paying
their land allocation dues. This will enable the farmers get
title deeds for their land and hence the collateral required by
credit agencies.
127
Lack of irrigation water can be solved by choosing those
horticultural crops with lower irrigation water requirements and
growing them (that is the crops) under the natural rainfall.
The deficit in water requirements during the rain season may be
compensated by irrigation from the potential irrigation water
sources in the Scheme. For example, during the rainy months of
March, April and May, horticultural crops may be grown and the
deficit in water requirements compensated by irrigation. The
irrigation water may be abstracted from constructed sub-surface
dams along the various river basins. This means that for the
irrigated crops the only period when there is a high irrigation
water requirements is June, July and August. It should be noted
that the 4 rivers suggested by the author according to the
analysis of the data have adequate water for irrigation. If the
water is tapped, then the problem of lack of water will be
solved. For irrigation crops, one of the criteria used to
select the horticultural crops to grow should be low irrigation
water requirement.
For the irrigation technology to be sustainable,
gravitational water flow through furrow irrigation is
necessary. Gravitational irrigation is viable especially if the
irrigation water is tapped from Umanyi Spring, Kibwezi and
Thange rivers because the landscape slopes gently from those
irrigation water sources to the irrigatable areas of the Scheme.
Figure (3) is on the cross section of Masongaleni Settlement
Scheme from Umanyi spring to river Athi. Sprinkler and drip
1 2 8
irrigation technologies may be unsustainable and expensive to
maintain in the short run.
Competition among a variety of horticultural crops for
small plot sizes could be solved by choosing to grow crops
occupying smaller land units but with high yields per unit area
and higher market prices. Tomatoes are a good example in this
case. One acre of tomatoes yields 33,000 kilogrammes of
tomatoes and sells at Kshs.19 per Kilogram compared to egg-plant
which yields 15,000 kilogrammes in an acre and sells at Kshs.6
per Kilogramme.Competition between rainfed and irrigated crops can be
solved. For instance, irrigated crops could be grown as from
15th of march to end of September annually.
The preparation to grow rainfed crops in Ukambani normally
starts at around September and by mid March the following year,
most of the annual crops are harvested and stored. Therefore,
by mid March, land preparation for irrigated crops should
start. This strategy would ensure that each of the two types of
farming is taken care of and thus food security is realised.
Lastly, both the local and export markets can be tapped
without interfering with food and cash crop security. For
instance, the highest demand in the local market is in June,
July and August. Planting of the selected horticultural crops
need to start in March through April and May so that by June,
those crops taking about 90 days to mature are ready for
marketing. Crops requiring fewer days to mature need to be
129
planted closer to the period when the local market is being
realized. For instance, a crop that matures 2 months after
planting needs to be planted at the beginning of April so that
by June, it is ready for sale in the local market.
The long rains experienced between March and May are not
reliable in Masongaleni and therefore, this is the time when
irrigated crops should be grown.
However, for the export market, land preparation for these
horticultural crops need to start in mid March every year so
that by the end of April, the crops maturing 45 days after
planting are harvested and marketed in May, November, December,
January, February and half of March the following year.
Although there is a high demand for these crops in the export
market, they should not be grown at the expense of food crops.
Perennial crops like pigeon peas need to be planted in
separation with horticultural crops to avoid inconvenience to
other crops. Crop rotation can be done where the horticultural
crops may occupy that plot the following season. This would
prevent diseases in horticultural crops like root-node caused by
nematodes in tomatoes.
The horticultural crops to be grown should be selected on
the basis of their tolerance in terms of pests, diseases and
drought. They should also be selected on the basis of yields
per acre and market prices of the various crops. The crops
should also be selected on the basis of the length of their
growing period. This is because, the shorter the growing period
130
for the particular horticultural crop, the more intensive
labour is required and therefore more employment opportunities
created for the people within and without the settlement scheme.
4.9.6 Livestock Keeping
4.9.6.1 Animal Rearing
Animal rearing is one of the agricultural potentials in
Masongaleni Settlement Scheme. This would involve keeping
animals tolerant to the local environment. These include
poultry, rabbitry, goats, sheep and the local Zebu/Boran.
According to the research findings, virtually all the settlers'
animals died immediately they were introduced in Masongaleni
Settlement Scheme. The most affected animals were cattle.
According to the study, sheep, goats, and poultry were the most
common. However, referring to the general and assumption (iii)
of the research, the research found that Masongaleni Settlement
Scheme has a potential for animal rearing. The area's tolerant
animals are the Zebu/Boran and others are sheep, goats, poultry,
and rabbitry. Masongaleni Settlement Scheme therefore, has a
potential of supporting such types of farming. However, a
number of constraints have been identified by the research as
facing animal production in the Scheme.
131
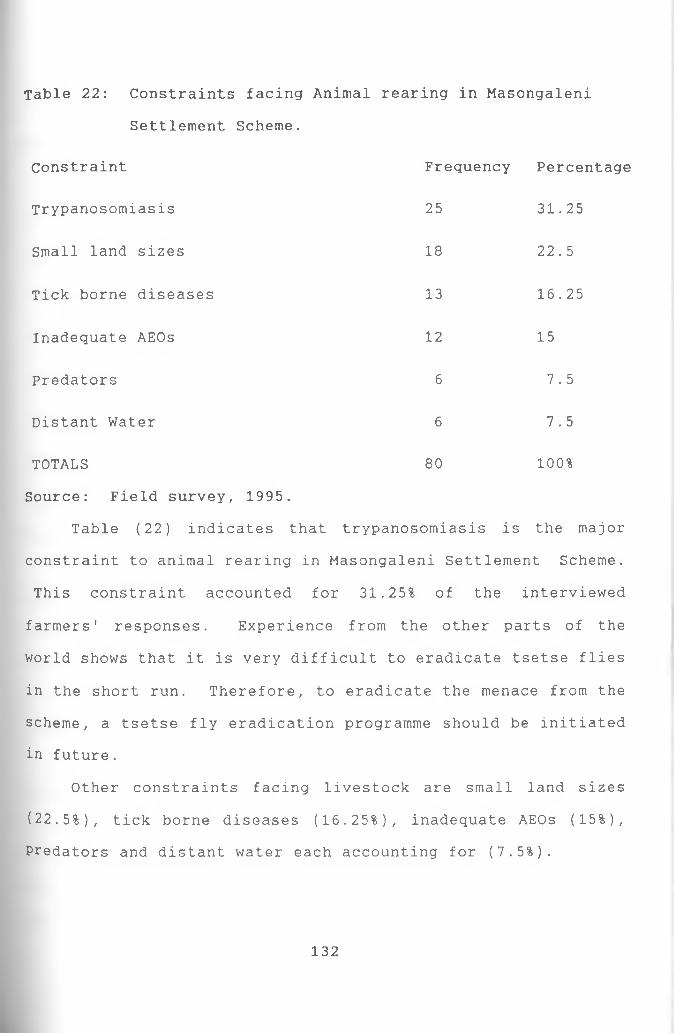
Table 22: Constraints facing Animal
Settlement Scheme.
rearing in Masongaleni
Constraint Frequency Percentage
Trypanosomiasis 25 31.25
Small land sizes 18 22.5
Tick borne diseases 13 16.25
Inadequate AEOs 12 15
Predators 6 7 . 5
Distant Water 6 7 . 5
TOTALS
Source: Field survey, 1995.
80 100%
Table (22) indicates that trypanosomiasis is the major
constraint to animal rearing in Masongaleni Settlement Scheme.
This constraint accounted for 31.25% of the interviewed
farmers' responses. Experience from the other parts of the
world shows that it is very difficult to eradicate tsetse flies
in the short run. Therefore, to eradicate the menace from the
scheme, a tsetse fly eradication programme should be initiated
in future.
Other constraints facing livestock are small land sizes
(22.5%), tick borne diseases (16.25%), inadequate AEOs (15%),
Predators and distant water each accounting for (7.5%).
132
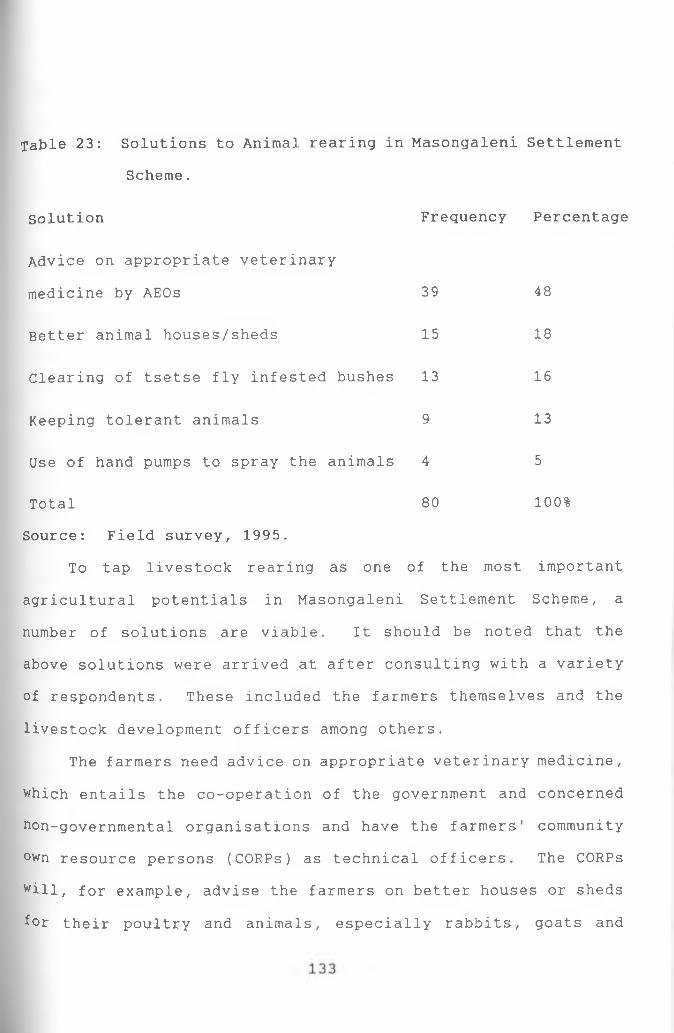
Table 23: Solutions to Animal rearing in Masongaleni SettlementScheme.
Solution Frequency Percentage
Advice on appropriate veterinary
medicine by AEOs 39 48
Better animal houses/sheds 15 18
Clearing of tsetse fly infested bushes 13 16
Keeping tolerant animals 9 13
Use of hand pumps to spray the animals 4 5
Total 80 100%
Source: Field survey, 1995.
To tap livestock rearing as one of the most important
agricultural potentials in Masongaleni Settlement Scheme, a
number of solutions are viable. It should be noted that the
above solutions were arrived at after consulting with a variety
of respondents. These included the farmers themselves and the
livestock development officers among others.
The farmers need advice on appropriate veterinary medicine,
which entails the co-operation of the government and concerned
non-governmental organisations and have the farmers' community
own resource persons (CORPs) as technical officers. The CORPS
will, for example, advise the farmers on better houses or sheds
ior their poultry and animals, especially rabbits, goats and
sheep which according to the study findings face the problem of
predators.
Clearing of bushes could also eradicate tsetse flies that
cause trypanosomiasis to the livestock. This solution is not
very effective, therefore, a tsetse fly eradication programme
should be started in future as an alternative method.
Keeping of animals tolerant to the environment can also
help to tap the livestock potential. The farmers interviewed
expressed preference for poultry, goats and sheep because of
their environmental tolerance. Their food and water
requirements are less compared to cattle. They are also disease
resistant animals compared to cattle that was wiped out by
tsetse fly and tick borne diseases immediately the farmers
settled in the settlement scheme in 1992.
During an interview, the Kibwezi Livestock Development
Officer suggested that in order to tap the livestock potential
in the scheme, the settlers should buy animals (livestock) from
the neighbouring areas because they are tolerant to tsetse fly
and tick borne diseases. It is viable to keep cross breed or
better quality cattle. For example, Boran cattle should be
encouraged in the scheme since they are better than the Zebu in
terms of quantity and quality of both meat and milk .
If the government had carried out an Environmental Impact
Assessment before the farmers settled in the Scheme, the farmers
would have been advised to sell their animals before settling in
the area and afterwards buy others from the neighbouring areas.
134
The use of hand pumps to spray the livestock is also a
viable solution. This can save the farmers and the government
the high costs involved in the construction of cattle dips.
This can solve disease causing vectors like ticks, among others.
The constraint of small land sizes and hence inadequate
grazing land for the animals did not have any solution from the
respondents. However, this constraint can be solved by advising
the farmers on the advantages of maintaining the land carrying
capacity for different animals. The farmers, need to keep those
animals that require less food and water, are environmentally
tolerant and those with more uses to them. The author suggests
that the farmers keep one cross bred cow or the Boran type, a
few number of goats and sheep. Poultry and rabbitry are
viable to keep in big numbers even on the small plots since they
can be kept indoors. It is also viable to practise zero grazing
for the different animals. In the long run, the farmers can
also feed their animals on industrial animal feeds. The farmers
incomes will have increased in the long run to afford these
industrial animal feeds.
The constraint of distant water can be solved by
establishment of sub-surface dams along the rivers.
4.9.6.2 Summary of Findings on the Constraints and Solutions to
Animal Rearing
A summary of 6 major constraints have been identified by
the author as facing animal husbandry in Masongaleni Settlement
135
Scheme. These have been found out in relation to objective (i)
and assumption (ii) of the research. These constraints are:
(i) Trypanosomiasis
(ii) Small plot sizes
(iii) Tick born diseases
(iv) Inadequate Agricultural Extension Officers
(v) Predators of goats, sheep and poultry due to lack of
proper housing.
(vi) Distant watering places for the livestock.
The summary of the solutions to animal keeping include:
(i) Advising the farmers on the appropriate veterinary
medicine by Agricultural Extension Officers.
(ii) Construction of proper houses for the small animals to
avoid predation during the night.
(iii) Clearing of tsetse fly infested bushes
(iv) Keeping tolerant poultry and animals (i.e local zebu/boran
cattle, sheep, goats and rabbits).
(v) Use of hand pumps to spray animals against pests and
diseases.
Although maintenance of land carrying capacity was not
suggested by the farmers and other interviewed respondents, the
study recommends the maintenance of the land carrying capacity
for the different preferred animals to solve the small plot size
constraint.
136
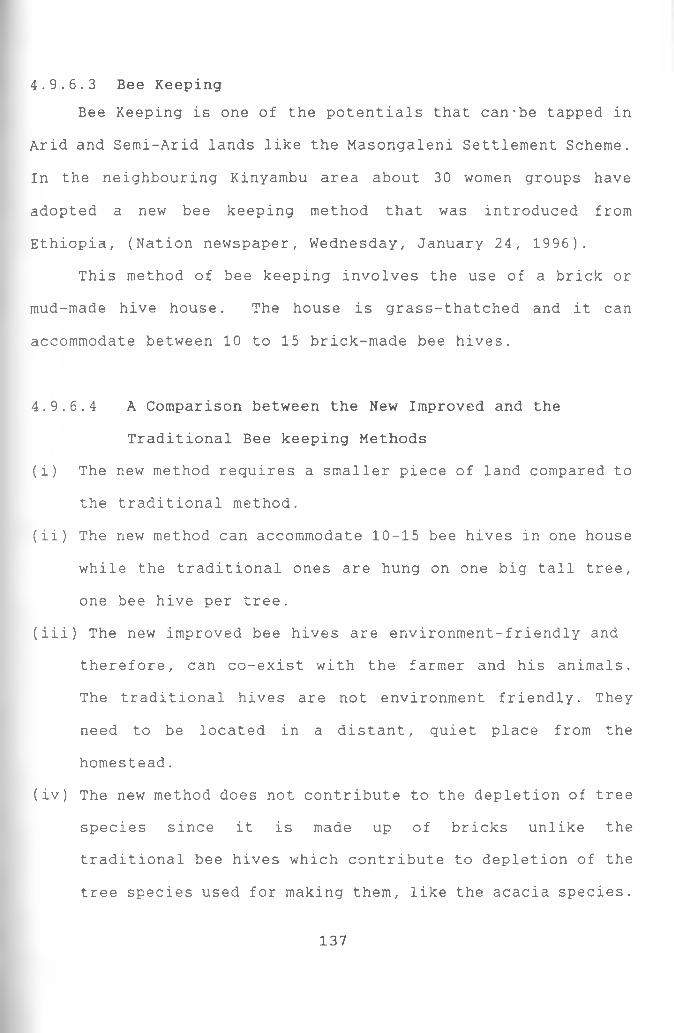
4.9.6.3 Bee KeepingBee Keeping is one of the potentials that can'be tapped in
Arid and Semi-Arid lands like the Masongaleni Settlement Scheme.
In the neighbouring Kinyambu area about 30 women groups have
adopted a new bee keeping method that was introduced from
Ethiopia, (Nation newspaper, Wednesday, January 24, 1996).
This method of bee keeping involves the use of a brick or
mud-made hive house. The house is grass-thatched and it can
accommodate between 10 to 15 brick-made bee hives.
4.9.6.4 A Comparison between the New Improved and the
Traditional Bee keeping Methods
(i) The new method requires a smaller piece of land compared to
the traditional method.
(ii) The new method can accommodate 10-15 bee hives in one house
while the traditional ones are hung on one big tall tree,
one bee hive per tree.
(iii) The new improved bee hives are environment-friendly and
therefore, can co-exist with the farmer and his animals.
The traditional hives are not environment friendly. They
need to be located in a distant, quiet place from the
homestead.
(iv) The new method does not contribute to the depletion of tree
species since it is made up of bricks unlike the
traditional bee hives which contribute to depletion of the
tree species used for making them, like the acacia species.
137
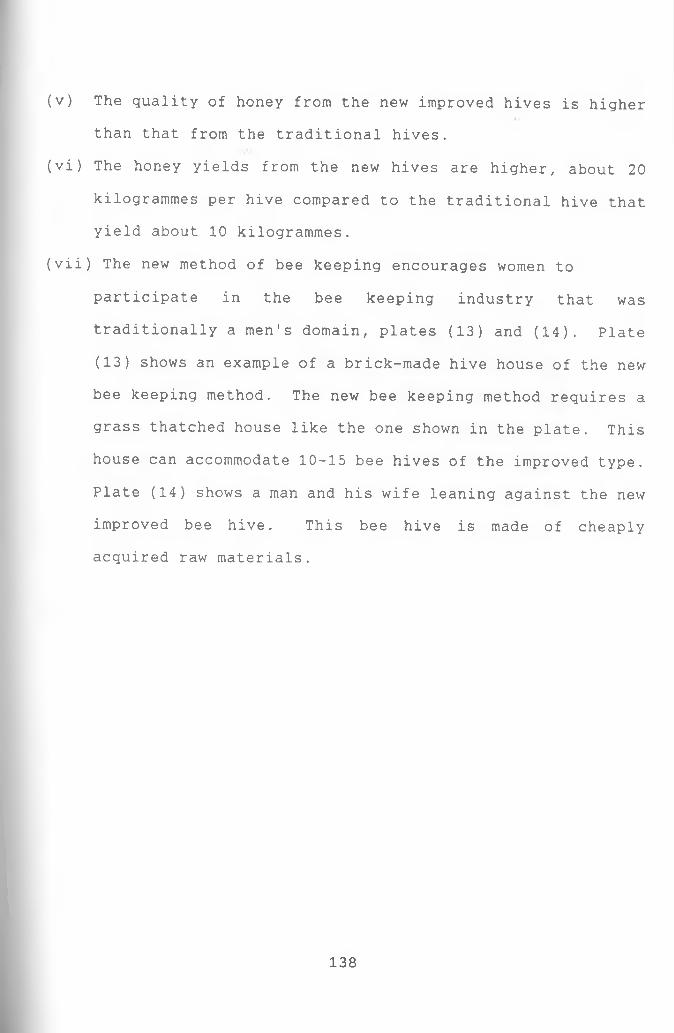
(v) The quality of honey from the new improved hives is higher
than that from the traditional hives.
(vi) The honey yields from the new hives are higher, about 20
kilogrammes per hive compared to the traditional hive that
yield about 10 kilogrammes.
(vii) The new method of bee keeping encourages women to
participate in the bee keeping industry that was
traditionally a men's domain, plates (13) and (14). Plate
(13) shows an example of a brick-made hive house of the new
bee keeping method. The new bee keeping method requires a
grass thatched house like the one shown in the plate. This
house can accommodate 10-15 bee hives of the improved type.
Plate (14) shows a man and his wife leaning against the new
improved bee hive. This bee hive is made of cheaply
acquired raw materials.
138
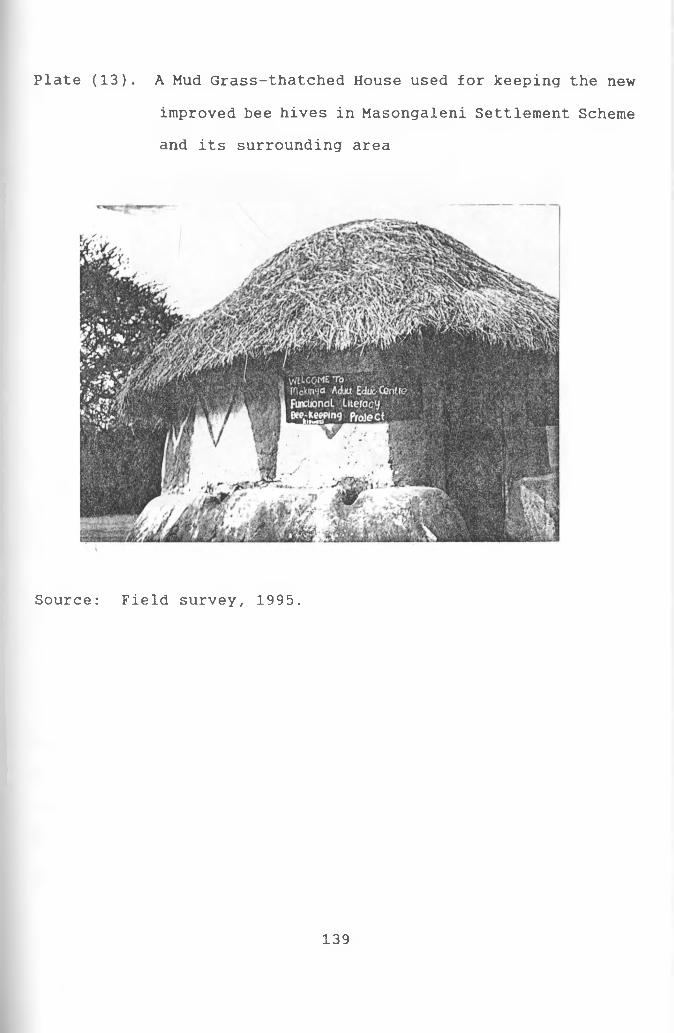
Plate (13). A Mud Grass-thatched House used for keeping the new
improved bee hives in Masongaleni Settlement Scheme
and its surrounding area
Source: Field survey, 1995.
139
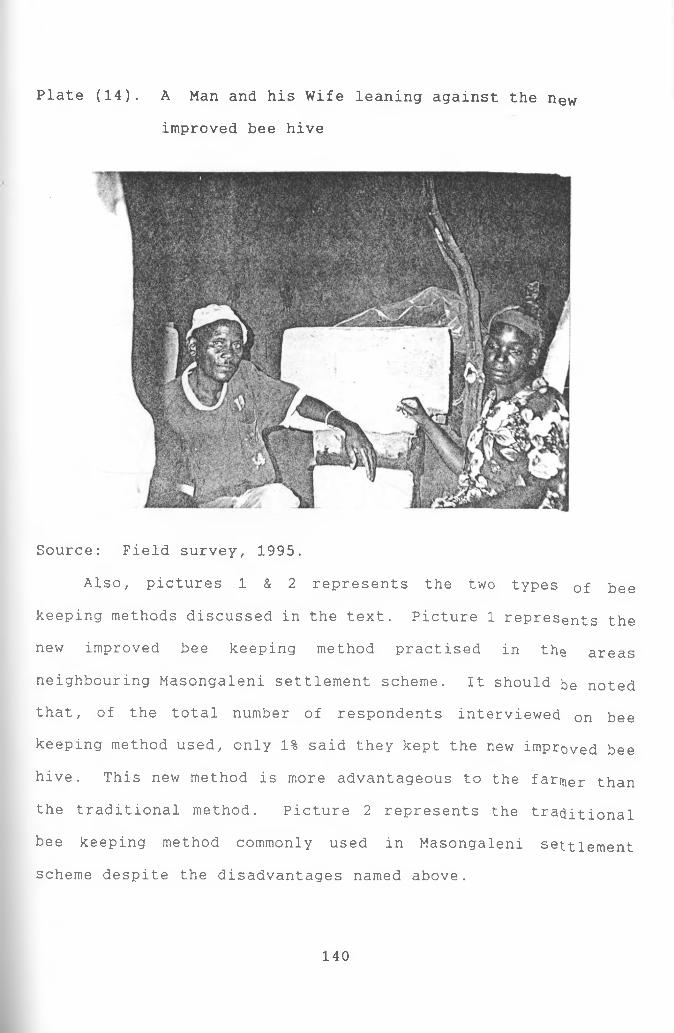
Plate (14). A Man and his Wife leaning against the new
improved bee hive
Source: Field survey, 1995.
Also, pictures 1 & 2 represents the two types Qf bee
keeping methods discussed in the text. Picture 1 represents the
new improved bee keeping method practised in the areas
neighbouring Masongaleni settlement scheme. It should be noted
that, of the total number of respondents interviewed on bee
keeping method used, only 1% said they kept the new improved bee
hive. This new method is more advantageous to the farmer than
the traditional method. Picture 2 represents the traditional
bee keeping method commonly used in Masongaleni settlement
scheme despite the disadvantages named above.
140
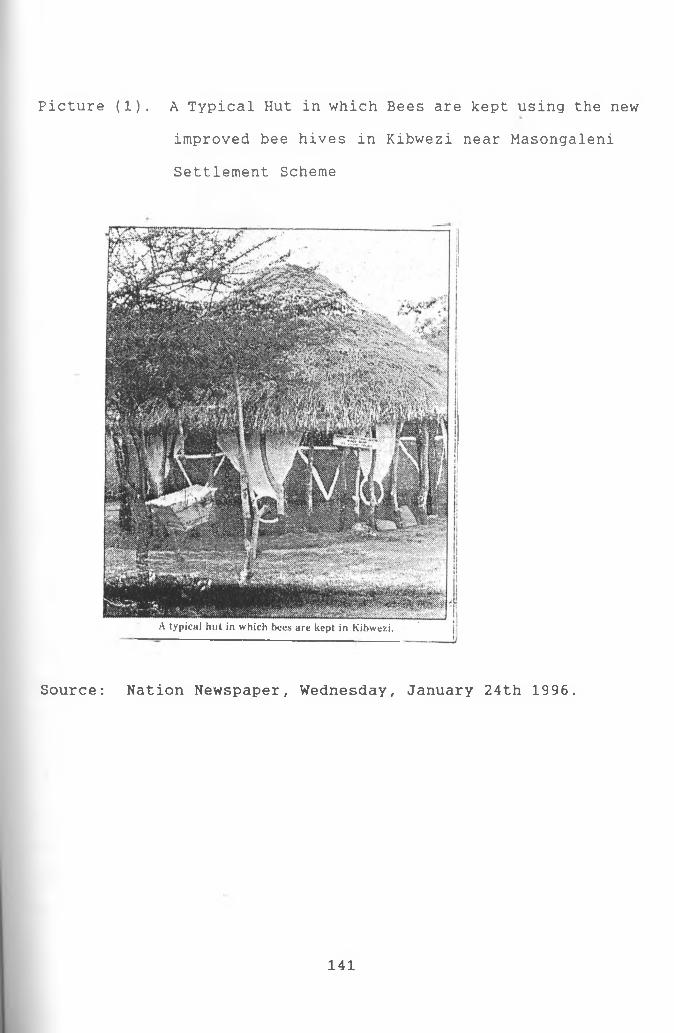
Picture (1) . A Typical Hut in which Bees are kept using the new
improved bee hives in Kibwezi near Masongaleni
Settlement Scheme
A typical hut in which bees are kept in Kibwezi.
Source: Nation Newspaper, Wednesday, January 24th 1996.
141
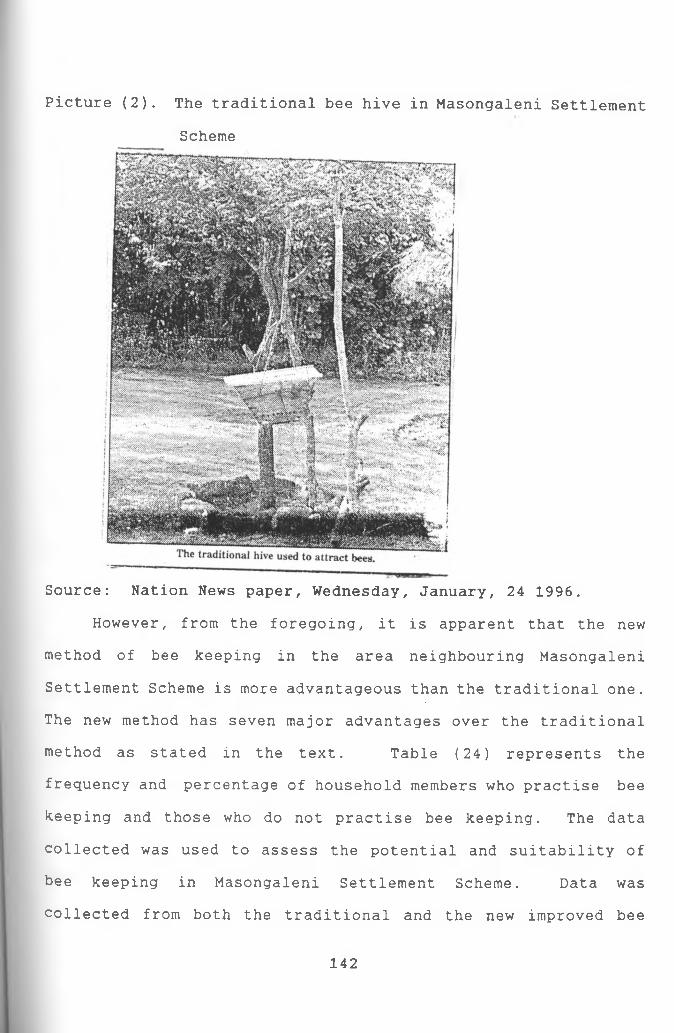
Picture (2). The traditional bee hive in Masongaleni Settlement
Scheme
Source: Nation News paper, Wednesday, January, 24 1996.
However, from the foregoing, it is apparent that the new
method of bee keeping in the area neighbouring Masongaleni
Settlement Scheme is more advantageous than the traditional one.
The new method has seven major advantages over the traditional
method as stated in the text. Table (24) represents the
frequency and percentage of household members who practise bee
keeping and those who do not practise bee keeping. The data
collected was used to assess the potential and suitability of
bee keeping in Masongaleni Settlement Scheme. Data was
collected from both the traditional and the new improved bee
142
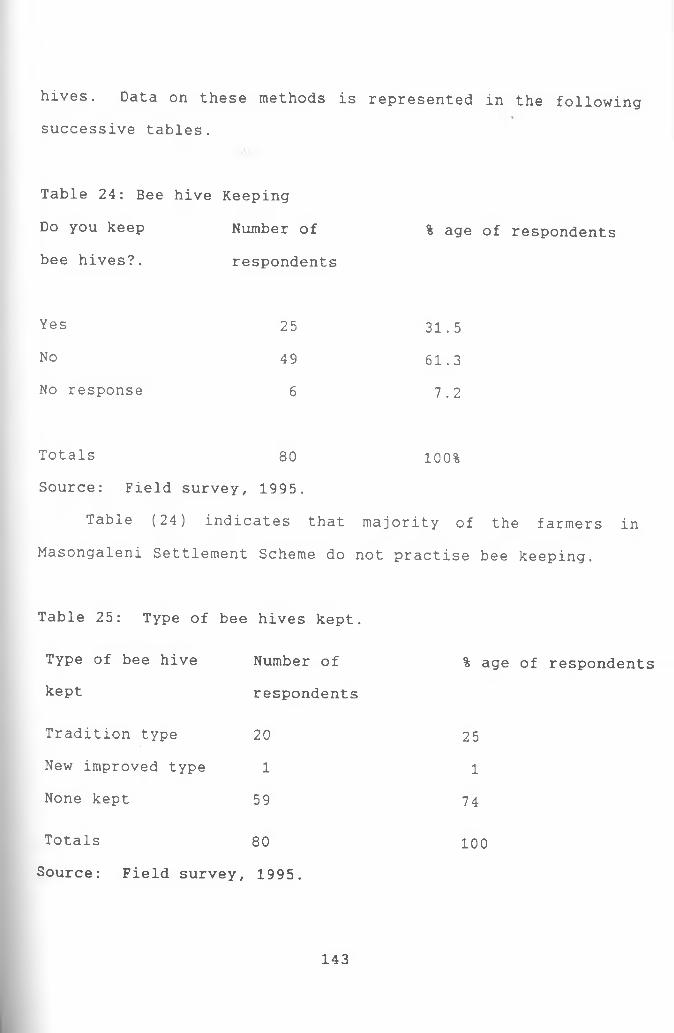
hives. Data on these methods is represented in the following successive tables.
Table 24: Bee hive Keeping
Do you keep Number of % age of respondentsbee hives?. respondents
Yes 25 31.5No 49 61.3No response 6 7.2
Totals 80 100%Source: Field survey, 1995.
Table (24) indicates that majority of the farmers inMasongaleni Settlement Scheme do not practise bee keeping.
Table 25: Type of bee hives kept.
Type of bee hive Number of % age of respondents
kept respondents
Tradition type 20 25
New improved type 1 1
None kept 59 74
Totals 80 100
Source: Field survey, 1995.
143
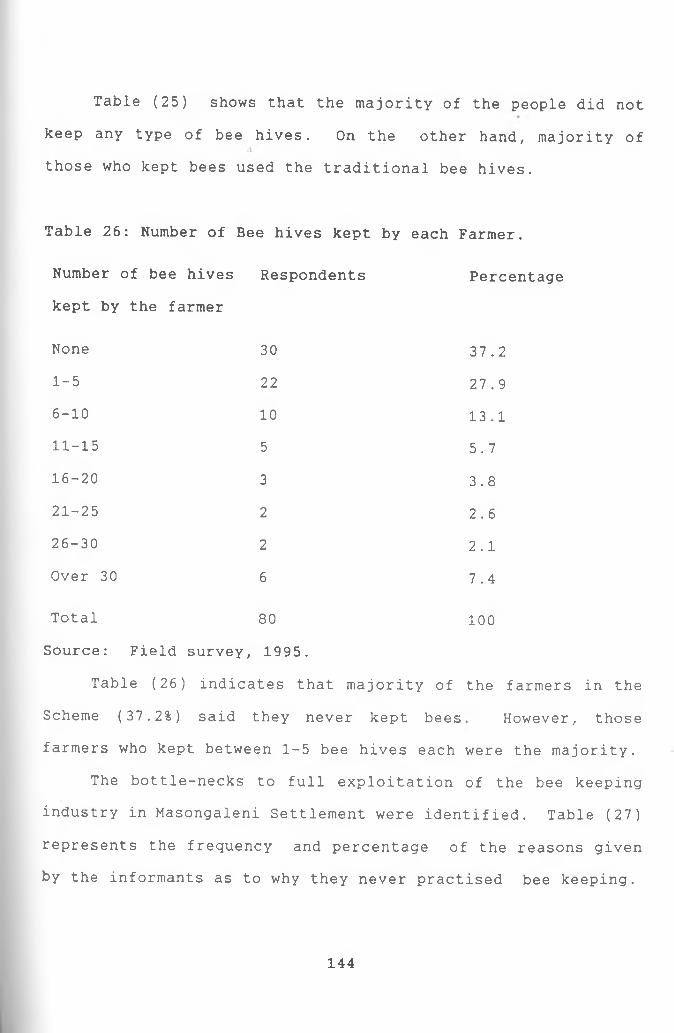
Table (25) shows that the majority of the people did not
keep any type of bee hives. On the other hand, majority of
those who kept bees used the traditional bee hives.
Table 26: Number of Bee hives kept by each Farmer.
Number of bee hives Respondents Percentagekept by the farmer
None 30 37.21-5 22 27.96-10 10 13.111-15 5 5.716-20 3 3.821-25 2 2.626-30 2 2.1Over 30 6 7.4
Total 80 100Source: Field survey , 1995.
Table (26) indicates that majority of the farmers in theScheme (37.2%) said they never kept bees However, those
farmers who kept between 1-5 bee hives each were the majority.
The bottle-necks to full exploitation of the bee keeping
industry in Masongaleni Settlement were identified. Table (27)
represents the frequency and percentage of the reasons given
by the informants as to why they never practised bee keeping.
144
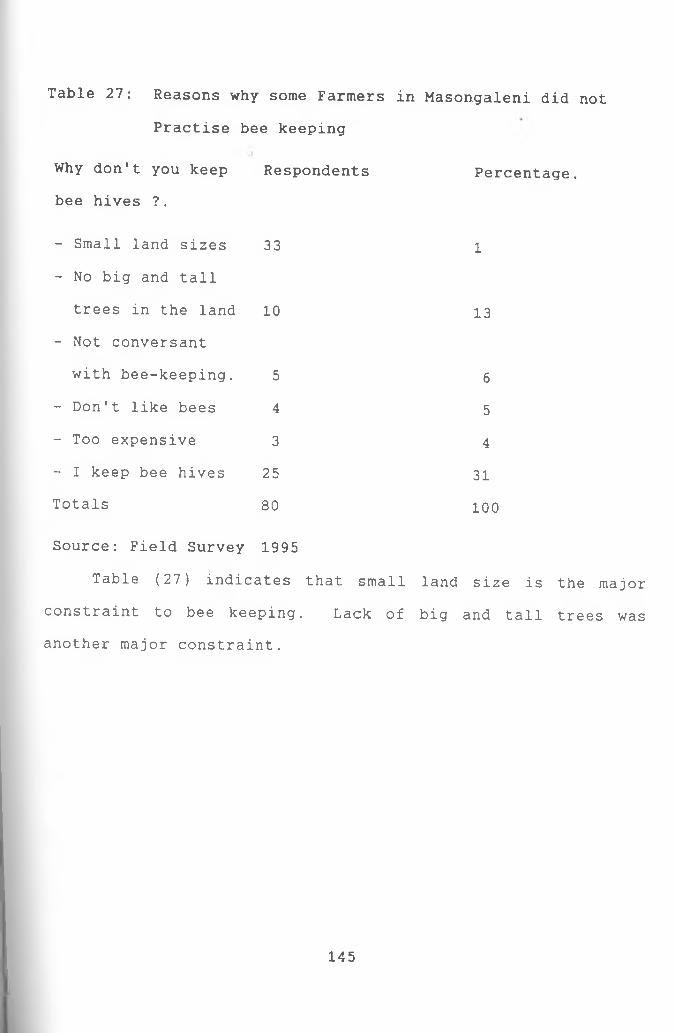
Table 27: Reasons why some Farmers in Masongaleni did not
Practise bee keeping
Why don't you keep Respondents Percentage,bee hives ?.
- Small land sizes 33 1
- No big and tall
trees in the land 10 13
- Not conversant
with bee-keeping. 5 6
- Don't like bees 4 5
- Too expensive 3 4
- I keep bee hives 25 31
Totals 80 100
Source: Field Survey 1995
Table (27) indicates that small land size is the major
constraint to bee keeping. Lack of big and tall trees was
another major constraint.
1 4 5
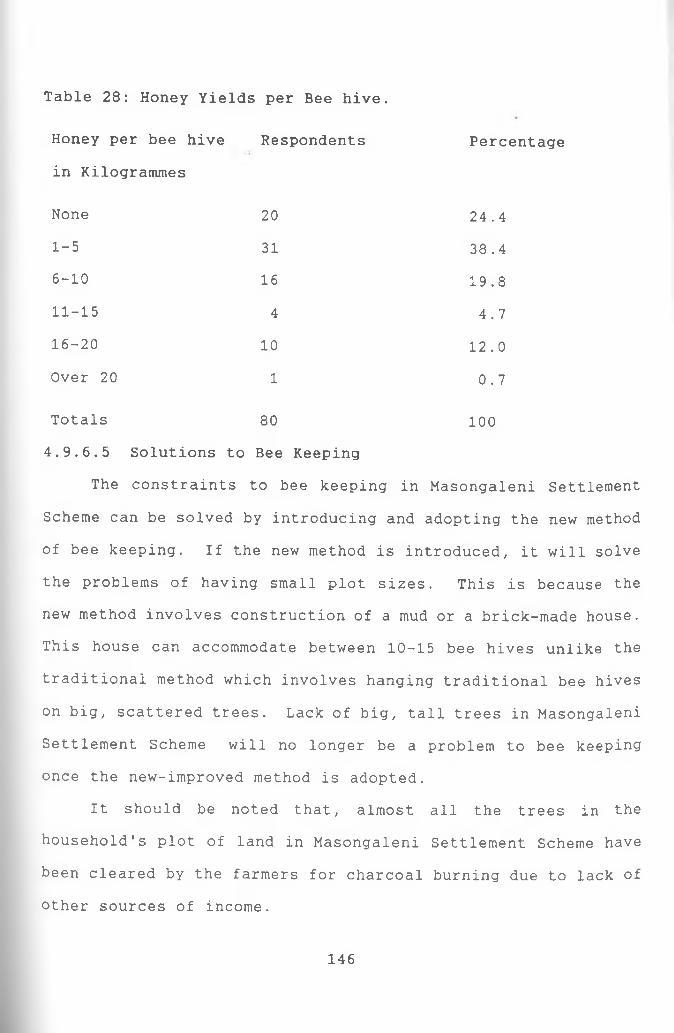
Table 28: Honey Yields per Bee hive.
Honey per bee hive
in Kilogrammes
Respondents Percentage
None 20 24.41-5 31 38.46-10 16 19.811-15 4 4.716-20 10 12.0Over 20 1 0.7
Totals 80 1004.9.6.5 Solutions to Bee Keeping
The constraints to bee keeping in Masongaleni Settlement
Scheme can be solved by introducing and adopting the new method
of bee keeping. If the new method is introduced, it will solve
the problems of having small plot sizes. This is because the
new method involves construction of a mud or a brick-made house.
This house can accommodate between 10-15 bee hives unlike the
traditional method which involves hanging traditional bee hives
on big, scattered trees. Lack of big, tall trees in Masongaleni
Settlement Scheme will no longer be a problem to bee keeping
once the new-improved method is adopted.
It should be noted that, almost all the trees in the
household's plot of land in Masongaleni Settlement Scheme have
been cleared by the farmers for charcoal burning due to lack of
other sources of income.
146
The new bee keeping method would also arrest the depletion
of the tree species used to make the traditional bee hives. But
it should be noted that, even if there were big, tall trees in
the Scheme, it is far much better to adopt the new improved bee
keeping method because of its many advantages.
The problem of not being conversant with bee keeping by the
farmers in Masongaleni Settlement Scheme can be solved by
having more agricultural extension officers.
The government in conjunction with concerned NGOs
operating in Masongaleni Settlement Scheme should train locals
as technical officers. This is better than relying on government
or private agencies to provide technical officers.
Also, the constraint of the farmers saying they do not like
bees/bees sting, can be solved by convincing the farmers that
the new improved method of bee keeping is environment friendly.
Bees in the new improved hives can comfortably exist with man
and his animals. Again, the farmers should be sensitised on the
importance of bee keeping industry as a way of diversifying
their sources of income. The constraint of the traditional
bee hives being expensive is possible to solve because the new
improved method requires cheap, locally available raw materials
to implement.
- It requires bricks which can be made of the local soil in
the plots.
- It also requires a constructed house which can be made of
bricks made locally.
147
- Almost all the raw-materials used in the improved bee hives
are found locally and cheaply.
The new improved bee hives are able to give more yields of
honey per bee hive (about 20 killogrammes compared to about 5
kilogrammes from the traditional bee hive).
The bee keeping industry can achieve more honey through the new
improved method because it allows participation of women in the
bee keeping industry unlike the traditional bee hive keeping
which was and is the domain of men only. Incomes realised from
the sale of the more kilogrammes of honey and its products will
improve the farmers living standards.
4.9.6.6 Summary of Findings on Bee keeping in Masongaleni
Settlement Scheme.
According to the general objective and assumption (iii) of
the study, the study would summarise that Masongaleni Settlement
Scheme has untapped potential in bee keeping. This potential is
identified in the new improved bee keeping method that has not
been adopted in the Scheme. According to the results of the
study, only 1% of the interviewed farmers said they practised
the new bee keeping method. The results of the data analysis on
bee keeping reveals that the new and improved bee keeping method
has seven advantages over the traditional bee keeping method.
On the other hand, basing the study's summary on objective
(i) of the study, a summary of major constraints to tapping of
148
the bee keeping industry may be given. According to the results
of the data analysis, these are:
(i) Small land sizes
(ii) Lack of big, tall trees in the Scheme
(iii) Some farmers are not conversant with bee keeping
(iv) Some farmers do not like bees/bees sting and
(v) Bee hives are expensive to afford
Using objective (ii) of the study, the study uses the
results of the data analysis to come up with solutions and
strategies to develop the bee keeping industry in the scheme.
A summary of the solutions to bee keeping constraints in
the Scheme is to introduce and adopt the new and improved bee
keeping method that is advantageous to practise than the
traditional bee keeping method. When the new bee keeping method
is adopted, the farmers need to have Community Own Resource
Persons (CORPs) in the Scheme. These CORPS will be part and
parcel of the farmers and they will be providing bee keeping
demonstration and training services to the farmers. These CORPs
will be sensitizing the farmers on the importance of adopting
the new improved bee keeping method.
149
CHAPTER FIVE
CONCLUSION AND RECOMMENDATIONS OF THE STUDY:
5.1 Introduction
The objective of this chapter is to present results
obtained from this study in the form of general conclusions and
recommendations informed by the research findings. Besides, an
attempt is made to make recommendations to be considered in any
future research and development programmes in Masongaleni
Settlement Scheme.
5.2 Conclusion of the study Findings
From the experience gained from the study and from the data
analysis about the agricultural potentials in Masongaleni
Settlement Scheme, the study concludes that:
i) There are a variety of untapped agricultural potentials in
Masongaleni Settlement scheme, both in crop and livestock
production. In the crop production, there are rainfed and
irrigated agricultural potentials. In livestock
production, there are animal rearing and bee keeping
production potentials.
ii) There is need to exploit fully these untapped agricultural
potentials for Masongaleni to have sustainable
development.
150
lii) To tap these agricultural potentials, the identified major
constraints should be overcome through the various
strategies suggested by the research. The solutions and
opportunities identified should also be applied to attain
sustainable development in the area,
iv) The introduction of an integrated rainfed, irrigated
agriculture and livestock production is the main strategy
to adopt for sustainable development in Masongaleni
settlement Scheme.
5.3 General Recommendations
As a long term plan, the study recommends integration of
irrigated, rainfed agriculture and livestock production. The
irrigated agriculture needs to involve vegetable/horticultural
crop production. As noted earlier, irrigated agriculture has
the advantages of creating employment, raising of the farmers'
incomes and producing multiple crops even when there is no
natural rainfall etc.
One of the most important recommendation for a long term
implementation is that an efficient management system should be
initiated to run the scheme's irrigation project. The system
should be responsible for the following:
i) Entering into agreement with the farmers on water use and
irrigation on credit.
li) Determine the section of the farm (0.8 hectares) to be
irrigated for the prescribed horticultural crop growing.
151
iii) Organise water supply and its maintenance.
iv) Provision of seeds, fertilizers and agrochemicals on credit where necessary.
v) Ensure that operations delegated to the farmers are carried
out according to plan.
vi) Collecting, sorting, grading and marketing of the produce.
This body should be a strong market-supporting body to
avoid exploitation of the farmers by middlemen.
vii) Central organised transportation system, preparation and
sale of the horticultural produce.
viii) It should recover all debts from the farmers produce
delivery.
ix) The management is to have direct interaction with the
farmers for the organisation of production, sale and
payment of the produce.
x) The management should relate the farmer to the Government
which should be the main supporting agency and collect
taxes on behalf of the central and local Government.
xi) The farmers are to be responsible for all the manual work,
seeding,weeding harvesting etc.
xii) The farmers should surrender to the scheme management the
horticultural produce grown on the irrigated plots.
xiii) The farmers should join such co-operative bodies as the
Masongaleni Irrigation Farmers Co-operative Society (MIFCS)
to represent their interests at the scheme level through an
elected committee.
152
xiv) The farmers should continue growing other non-irrigated
crops in the non-irrigated areas of their holding as was
the case before the introduction of the irrigation project.
Thus except the production of the prescribed crops on the
irrigated areas according to plan, the production pattern
in the rest of the holding should not be interfered with.
Also the study recommends that KIP’s horticultural farming
technology should be sought by way of training farmers and
basing extension services on research findings from Kibwezi
Irrigation Project (KIP). KIP's demonstration and training on
horticultural farming should be based on the traditional set up
of the communities to enable the farmers to be exposed to
appropriate modern or traditional farming technology.
Again there is need for co-operation between the
agricultural extension officers, farmers and researchers so that
knowledge on appropriate farming and environment friendly
strategies are imparted to the farmers for sustainable living.
For example, in order to effectively introduce the new method of
bee keeping in the scheme, there is need to have more
agricultural extension officers in Masongaleni settlement
scheme. More emphasis should be put on CORPS because they are
more sustainable than the GOK's provided technical officers.
These CORPs will train the community on modern or traditional
appropriate technologies in farming, including the new bee
keeping method, among other agricultural techniques.
The study recommends maintaining of land carrying capacity
153
by farmers. Since there is a serious constraint of small land
sizes, it is advisable for the farmers to keep poultry, rabbits,
dairy goats, sheep and at least one Boran or cross bred cow.
The idea is to encourage rearing of animals that are
environment-friendly.
The number kept should be based on the land carrying
capacity of the area. Again the choice to keep certain animals
should be based on the number of uses or advantages they provide
to the farmer. For example, sheep, goats, poultry and rabbits
were found to be tolerant to drought, pests and diseases in
Masongaleni settlement Scheme unlike cattle, which died enmasse
due to pests and diseases as well as drought.
The small animals require little food and water unlike the
big ones like bulls and cows. The small animals like goats will
provide the farmers with meat, milk, bride wealth and skins.
Poultry will provide the farmer with meat, eggs and income. In
short, small animals are more advantageous to keep in the low
potential areas of the Masongaleni Settlement Scheme.
In connection to cattle rearing, the study recommends
keeping of one cow, preferably a cross-bred, which is better
than a bull because a cow will provide milk for household
consumption and a surplus for sale. This will consequently
diversify the farmers' incomes. The cow has also the advantage
of contributing to the increase of the stock over and above its
low food and water requirements.
1 5 4
The study forecasts that the farmers will depend on hired
labour in the long run because it is uneconomical for farmers to
keep bulls for ploughing small farms and only during ploughing
season. The farmers can also form CBOs for ploughing. This
would involve combining farm implements and sharing the few
bulls among a number of neighbours. However, keeping of the
recommended animals should be based on zero grazing or near zero
grazing.
The study also recommends rain catchment in the scheme
through establishment of underground wells to collect water for
domestic purposes including livestock purposes. This is a
cheaper method that involves digging of underground pits or rock
catchment. It is viable because it will save the funds the poor
farmers would have used to buy iron sheets for rain harvesting
structures and expensive tanks.
But it should be noted that in the long run the farmers may
have rain catchment structures by the use of incomes realised
from agricultural development.
From the data collected from the 11 sample boreholes,
there is potential of shallow well/borehole water in the Scheme.
These shallow wells can be dug manually and therefore they are
cheap sources of domestic water.
Alot of campaign and sensitization programmes on agro
forestry, reafforestation and afforestation should be initiated
in Masongaleni Settlement Scheme. This is because by the time
the research was being conducted, the author and the research
1 5 5
assistants established that there was an alarming rate of
deforestation to the extent that there was a serious scarcity of
building materials such as poles and grass. In fact, thebuilding materials are so scarce that most of the responses
given by the farmers about the supply of the materials indicated
that the materials were of poor quality, were unavailable within
their own plots or were far away and could only be bought.
Fuel-wood constitutes another acute constraint. The
firewood available is of poor quality and the distance to get it
has been increasing over time. The cause of this problem has
been largely due to high rates of charcoal burning which is the
second high ranked source of income after farming. This of
course, means that, faced with no other gainful means of
incomes especially during the dry season, majority of the
population engage in charcoal burning for survival. Therefore,
reafforestation, agro-forestry and afforestation programmes need
to be seriously encouraged at the governmental and Non-
Governmental levels. Such programmes should however, aim at
promoting those tree species that are able to provide most uses
to the farmers and their animals. For example, provision of
food in form of fruits, provision of shades, soil fertility,
building poles, ornamental and medicinal value, high calorific
value for fuel wood, conservation of soil and water among
others.
There should also be a mixture of both fast and slow
maturing tree species to avoid scarcity cf the raw materials or
156
their provision during particular times of the year. The study
also recommends sensitization of farmers to plant such
indigenous tree species as Acacia and the Neem tree.
To curb scarcity of fuel wood, use of alternative energy
sources should be encouraged such as agricultural by- products
like millet husks, sorghum husks, maize cobs and stalks. Use of
energy saving devices like the energy saving jikos should also
be introduced. A good example of tree species with many uses
is the neem tree, "Muarobami", famed to cure over forty (40)
diseases. Farmers should be encouraged to plant such
multipurpose tree species.
The settlers need to be encouraged to pay their land
allocation dues so that they may be issued with title deeds upon
completion of payment. The settlers are supposed to pay Ksh.
500 per acre to the Ministry of Lands and settlement's
headquarters. The government should establish an office at the
divisional headquarters at Kibwezi so that the constraint of a
long distance in paying the land allocation dues is overcome.
Once these dues are paid, the settlers may have on their plots
of land permanent establishments. During an interview with the
settlers, majority of them said they would get a loan using the
title deed if they had it.
To diversify the farmers' sources of incomes, the study
recommends that farmers engage themselves in off-farm income
generating activities. A good example of such income generating
activities is to have an integrated, multi-purpose income
157
generating activities. The viable income generating activities
in Masongaleni Settlement Scheme would be:
(i) Brick making for sale
(ii) Honey refinery undertaking
(iii) Small-scale income generating businesses like shop
keeping etc.
This type of integrated, multipurpose off-farm income
generating activities have been and are being undertaken by a
group of Kibwezi Self-help women group and it is doing well.
Therefore, such an example should be emulated.
Again, on the administration sector, Masongaleni Settlement
Scheme needs to have more provincial administrators because by
the time this research was being conducted, there were only four
(4) assistant chiefs out of eleven sub-locations.
5.4 Recommendations for future research
The study recommends that research be done in future to
establish the cost of the proposed irrigation project. The cost
should be arrived at by considering the viable water tapping
methods depending on the sources of the irrigation water and the
cheapest and sustainable methods.
After doing the costing of the irrigation project, the
research should also establish how the cost should be shared
among the various agencies in the scheme. These agencies
include, among others: GOK through its line ministries,
parastatals (e.g TARDA and UON, CINADO,USAID), NGOs/private
158
individuals and the community through the CBOs etc. Since from
the study, the irrigated agriculture is more viable, it should
be designed, planned, implemented, monitored, evaluated and
lastly adopted. Here the study recommends that after the
irrigated agriculture is implemented, there should be alot of
sensitisation on the poor farmers not to sell their high value
horticultural farms to the rich immigrants. This is because
there might be displacement of the poor farmers by the rich and
hence loss of their high value land. Future research should also
be done on soils, forage and livestock blood to establish
whether there are any deficiencies or toxicities in any of the
trace or major essential elements. This is because
deficiencies or toxicities of these elements can lead to various
disorders, sickness or death of livestock.
Future research should also be done to have a tsetse fly
eradication programme in Masongaleni Settlement Scheme.
159
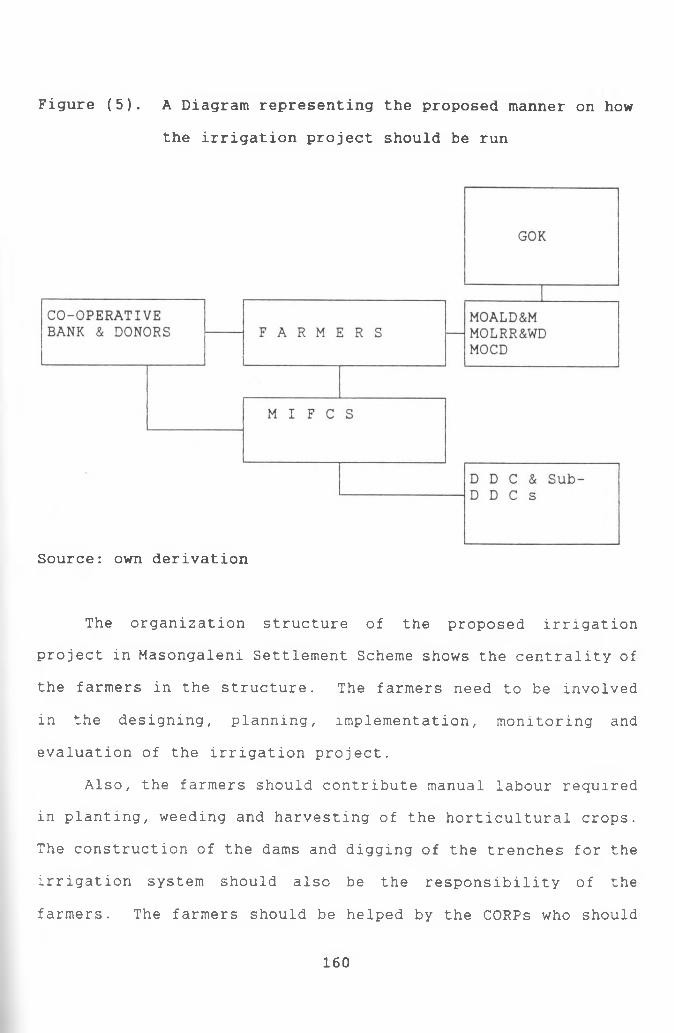
Figure (5). A Diagram representing the proposed manner on how
the irrigation project should be run
Source: own derivation
The organization structure of the proposed irrigation
project in Masongaleni Settlement Scheme shows the centrality of
the farmers in the structure. The farmers need to be involved
in the designing, planning, implementation, monitoring and
evaluation of the irrigation project.
Also, the farmers should contribute manual labour required
in planting, weeding and harvesting of the horticultural crops.
The construction of the dams and digging of the trenches for the
irrigation system should also be the responsibility of the
farmers. The farmers should be helped by the CORPS who should
160
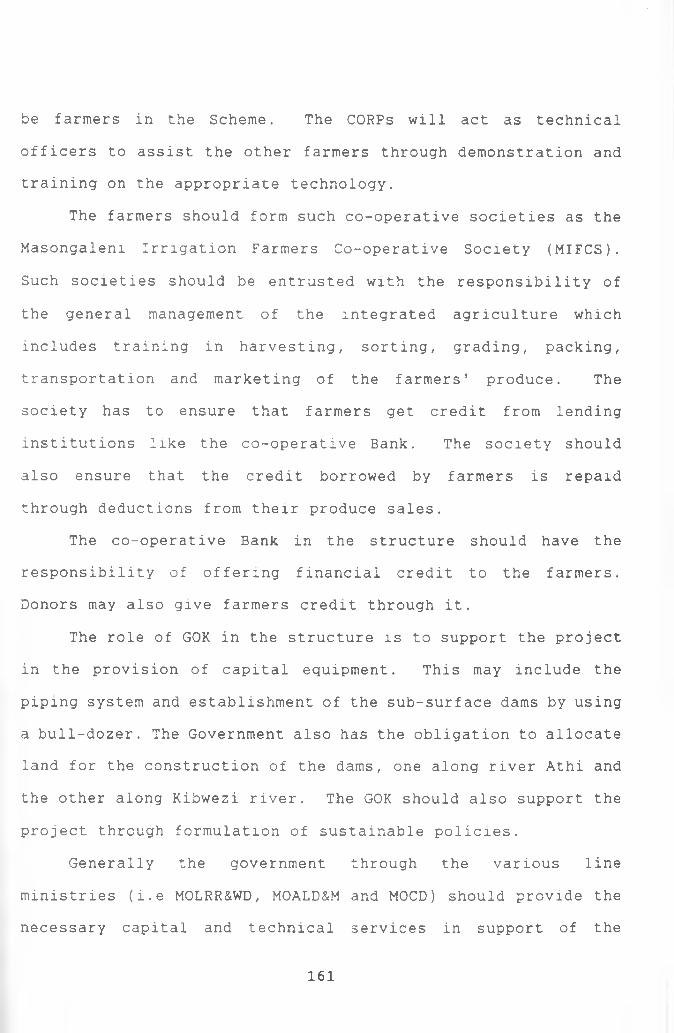
be farmers in the Scheme. The CORPS will act as technical
officers to assist the other farmers through demonstration and
training on the appropriate technology.
The farmers should form such co-operative societies as the
Masongaleni Irrigation Farmers Co-operative Society (MIFCS).
Such societies should be entrusted with the responsibility of
the general management of the integrated agriculture which
includes training in harvesting, sorting, grading, packing,
transportation and marketing of the farmers' produce. The
society has to ensure that farmers get credit from lending
institutions like the co-operative Bank. The society should
also ensure that the credit borrowed by farmers is repaid
through deductions from their produce sales.
The co-operative Bank in the structure should have the
responsibility of offering financial credit to the farmers.
Donors may also give farmers credit through it.
The role of GOK in the structure is to support the project
in the provision of capital equipment. This may include the
piping system and establishment of the sub-surface dams by using
a bull-dozer. The Government also has the obligation to allocate
land for the construction of the dams, one along river Athi and
the other along Kibwezi river. The GOK should also support the
project through formulation of sustainable policies.
Generally the government through the various line
ministries (i.e MOLRR&WD, MOALD&M and MOCD) should provide the
necessary capital and technical services in support of the
161
project. The GOK through the DDCs and the various sub-DDCs
should assist in policy formulation among other types of
assistance.
Lastly, the author proposes that all the costs incurred in
the provision of infrastructure should be shared among the
various agencies concerned with development in the settlement
scheme. With the introduction of irrigated agriculture and with
the assistance from the various development institutions found
within and without the scheme, all the costs of providing
infrastructure is likely to be provided.
162
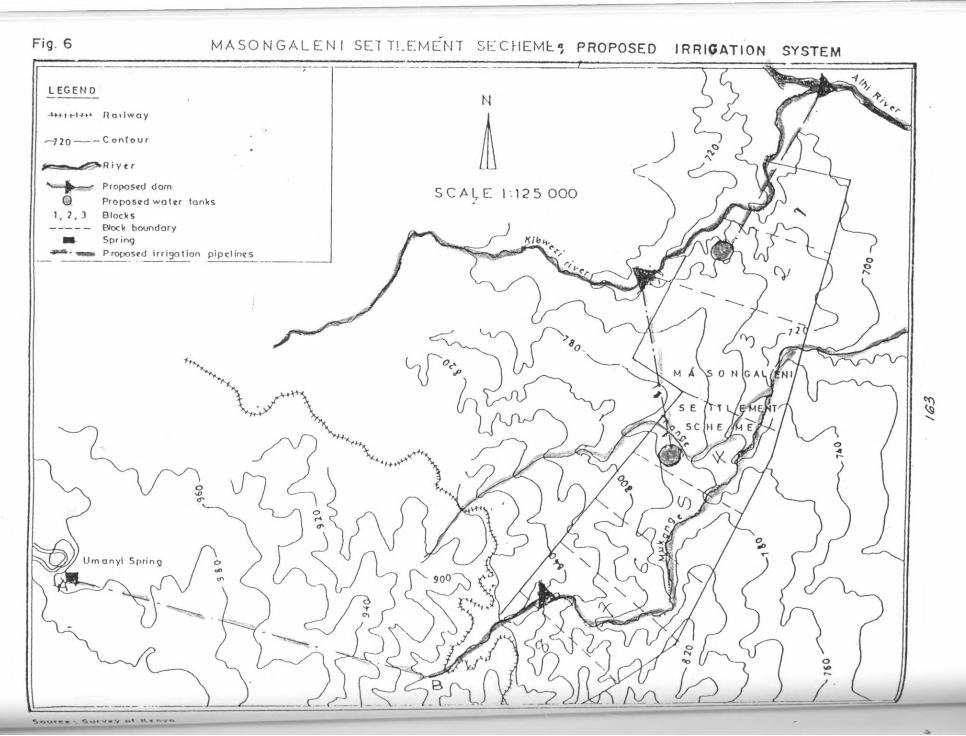
5.5 General Conclusion
In conclusion, the author feels that if the strategies,
solutions, opportunities and recommendations suggested by the
study are adopted, the Masongaleni Settlement Scheme will
achieve sustainable development.
164
BIBLIOGRAPHYAkungo, B.D.O. (1980): " Constraints to agricultural
Development and their implications to rural Planning: A case study of Mbita Division,South Nyanza District, Kenya. M . A . Planning (unpublished Thesis) UON
Aquafield Consultants, 1992: Hydrogeological investigation,Kibwezi Rural Development Area (RDA).
Ng'ethe, N. et al, (1979): Arid and Semi-arid land pre--investment study (1979), Kitui, Embu and Meru Vol. Ill, Statistical Appendix IDS (UON).
Campbell, J.K. (1990): Dibble Sticks, Donkeys, and Diesels:Machines in crop production.International Rice Research Institute New York U.S.A.
D.W.A. Estate Meteorological Data
Deonanan, 0. and Udoe, S. ( 1992); Poverty and SustainableDevelopment: Science Centre, Berlin.
KARI (1984): Dryland Farming Research in Kenya. East African Agricultural and Forestry Journal Special IssueVol. 44. KARI Proceedings of the Symposium on Dryland Farming Research in Kenya.
Habitat, (1990): Coastal management, Desert afforestation andEcological Farming. Striving for Sustainable Development. Exchange of Environmental Experience. Series Book Three, Nairobi(1990)
Kangangi, G. M. (1982): " The role of small scale irrigationschemes in rural development: A casestudy of Kibirigwi irrigation scheme". M .A Planning (unpublished Thesis) UON.
KARI, 1991: Detailed soil Survey, Report No.D57.
Agency for International Development,(1979):Kenya Arid and Semi-Arid Lands Development Project Project paper 615- 0172, Washington D.C 20523.
165
Mary,T . et al ( 1994 ) : More people, Less erosion: Environmental recovery in Kenya:ACTS press, Nairobi
Ministry of Agriculture, Livestock Development and Marketing (1993): Makueni District
Annual Report.
Ministry of Agriculture, Livestock Developmentand Marketing,(1993): Kitui District Annual Report.
Ministry of Agriculture, Livestock Development & Marketing (1994): Department of agriculture
- Eastern Province annual Report.
MOLRR&WD (1975): Kikumbulyu rural water supply scheme: Pre-Development study report by Carl Brothers Roughton and partners consulting engineers.Government printer, Nairobi
.......... (1982): Kikumbulyu rural water supply scheme 2draft. Baseline report vol 2 : Hydrological study by Carl Brothers Roughton and partners consulting engineers, Government printer, Nairobi
........... (1983) Kikumbulyu rural water supply scheme 2:Preliminary baseline report vol.l general: Government printer, Nairobi
Nation Newspaper (1995): More Action Needed to Save theCountry's Forests: October, 20, 1995pp. IX and XVIII.
Ogur, J.A & Onyango, F.N.( 1992): Investigation of fuel-woodenergy content from certain indigenous trees in Kenya: unpublished paper Department of physics and chemistry, UON.
Ray, K. L. 1987: Water resources Engineering.
Republic of Kenya, (1992): Kanu Manifesto and Policy DocumentGovernment Printers, Nairobi.
Republic of Kenya (1986): Sessional Paper No. 1 of 1986 onEconomic Management and Renewal Growth:Government Printers, Nairobi.
Republic of Kenya, (1994): National Development Plan 1994 -1996: Government Printers, Nairobi.
166
Republic of Kenya (1993): National Development Plan 1989-1993:Government printer, Nairobi
Republic of Kenya(1972): Arid and Semi-arid lands development inKenya. The framework for implementation programme planning, and evaluation GOKprudential printers Ltd.
Republic of Kenya (1994): Makueni District Development Plan1994-1996:Government Printers,Nairobi.
Saggerson, E.P. 1963: Geology of the Simba-Kibwezi Area.Geological Survey of Kenya, Report No. 58.
Stiles,D. (1995): Social Aspects of Sustainable DrylandManagement. John Willey & Sons, New york (1995)
TARDA: Farm records
FAO,(1971): Tillage and seeding practices and machines for crop production in semi-arid areas. Organization of the United Nations Rome.
University of Nairobi, 1990: Proposal for establishing anirrigation project in Kibwezi Rural Development Area.
Walsh, J. 1963: Geology of the Ikutha Area. Geological Survey ofKenya, Report No. 56
167
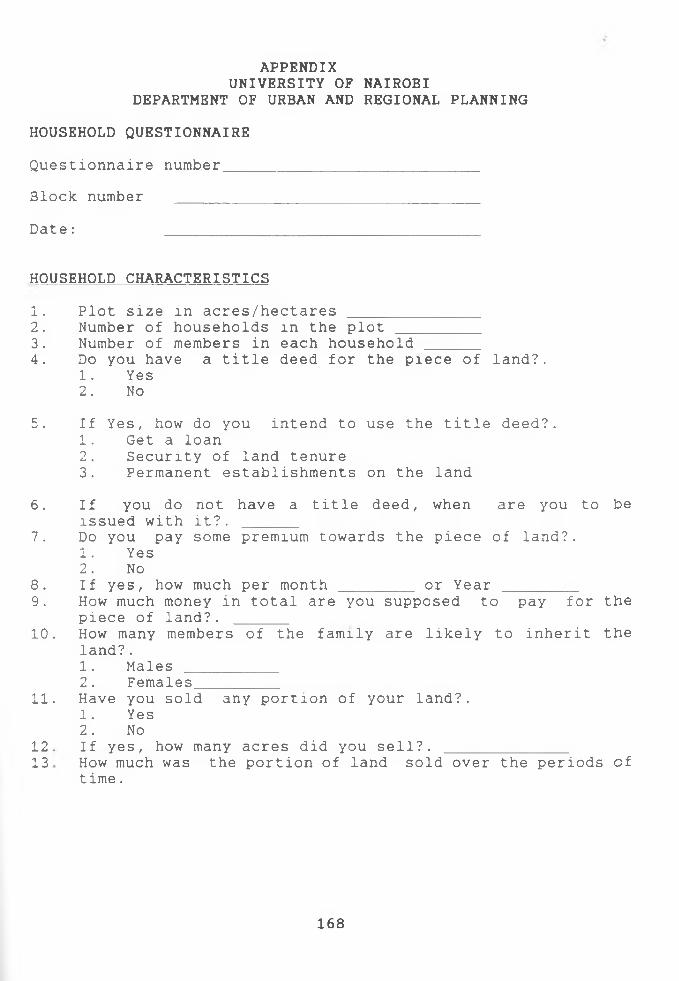
APPENDIXUNIVERSITY OF NAIROBI
DEPARTMENT OF URBAN AND REGIONAL PLANNINGHOUSEHOLD QUESTIONNAIREQuestionnaire number_____________________________
Block number ___________________________________
Date: ____________________________________
HOUSEHOLD CHARACTERISTICSA1 . 2 .3.4.
5.
6 .7 .
8 .9.
1 0 .
11 .1213
Plot size in acres/hectares _______________Number of households in the plot _________Number of members in each household ______Do you have a title deed for the piece of land?.1. Yes2. No
If Yes, how do you intend to use the title deed?.1. Get a loan2. Security of land tenure3. Permanent establishments on the land
If you do not have a title deed, when are you to be issued with it?. ______Do you pay some premium towards the piece of land?.1. Yes2. NoIf yes, how much per month ________ or Year ________How much money in total are you supposed to pay for the piece of land?. ______How many members of the family are likely to inherit the land?.1. Males __________2. Females_________Have you sold any portion of your land?.1. Yes2. NoIf yes, how many acres did you sell?. ______________How much was the portion of land sold over the periods of time.
1 6 8
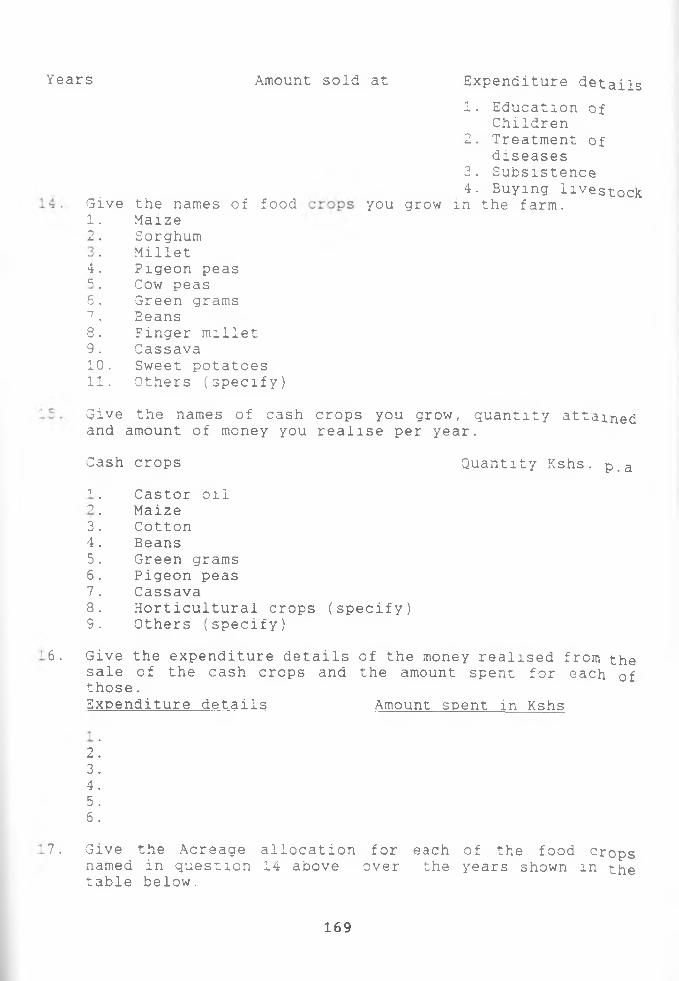
Years Amount sold at Expenditure details
Give the names of food1-i. • Maize9— • Sorghumw/ • Millet4. Pigeon peasC.
• Cow peas6 . Green grams7 # Beans8. Finger millet9 . Cassava10. Sweet potatoes11. Others (specify)
1. Education of Children
2. Treatment of diseases
3. Subsistence4. Buying livestock
you grow in the farm.
Give the names of cash crops you grow, quantity attained and amount of money you realise per year.
Cash crops Quantity Kshs. p.aio"3• J
45678 9
Castor oil Maize Cotton BeansGreen grams Pigeon peas CassavaHorticultural crops (specify) Others (specify)
6 . Give the expenditure details of the money realised from the sale of the cash crops and the amount spent for each of those.Expenditure details Amount spent in Kshs
23456
7 . Give the Acreage named in question table below.
allocation for 14 above over
each of the food crops the years shown m the
169
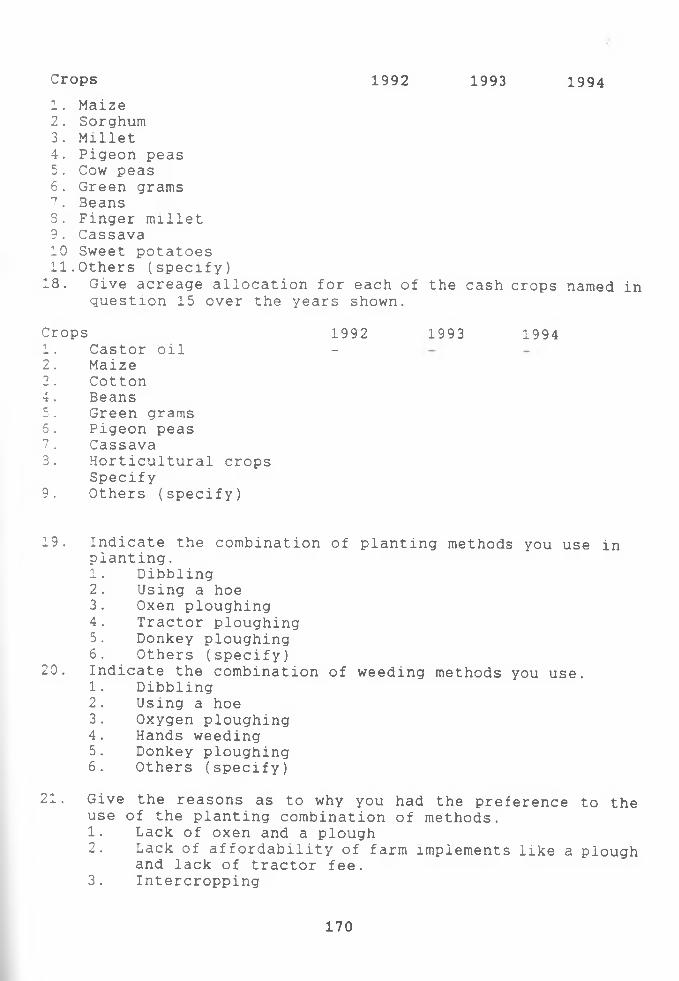
Crops 1992 1993 19941. Maize2. Sorghum3. Millet4. Pigeon peas5. Cow peas6. Green grams7. BeansS. Finger millet 9. Cassava 10 Sweet potatoes 11.Others (specify)18. Give acreage allocation for each of the cash crops named in
question 15 over the years shown.
Crops 1992 1993 19941. Castor oil -2. Maize2. Cotton4. Beans5. Green grams5. Pigeon peas7. Cassava3. Horticultural crops
Specify9. Others (specify)
19. Indicate the combination of planting methods you use in planting.1. Dibbling2. Using a hoe3. Oxen ploughing4. Tractor ploughing5. Donkey ploughing6. Others (specify)
20. Indicate the combination of weeding methods you use.1. Dibbling2. Using a hoe3. Oxygen ploughing4. Hands weeding5. Donkey ploughing6. Others (specify)
21. Give the reasons as to why you had the preference to the use of the planting combination of methods.1. Lack of oxen and a plough2. Lack of affordability of farm implements like a plough
and lack of tractor fee.3. Intercropping
170
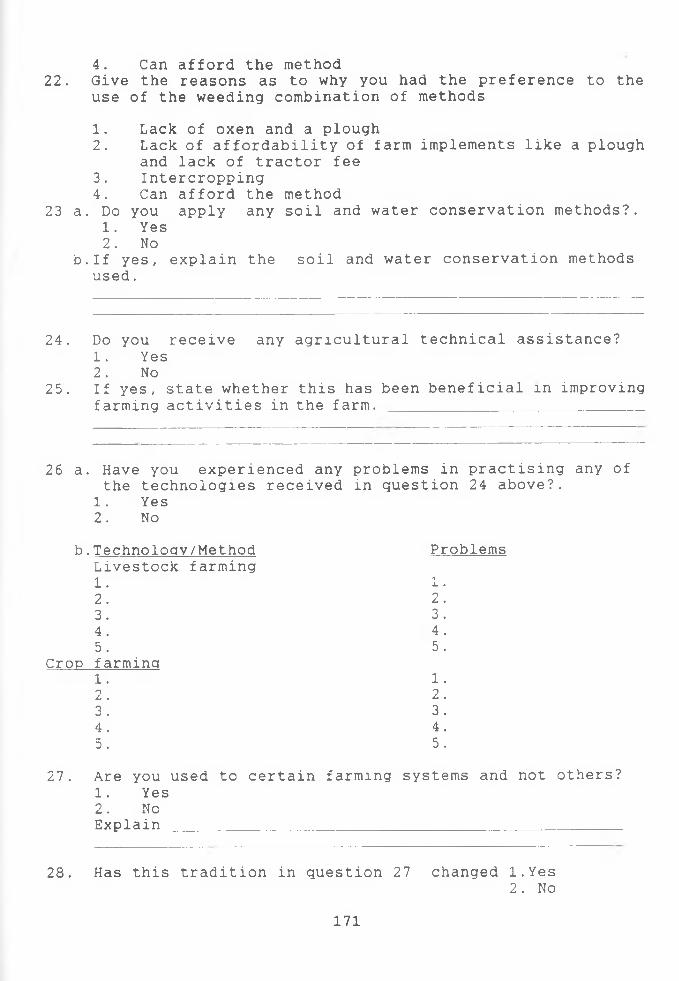
4. Can afford the method22. Give the reasons as to why you had the preference to the
use of the weeding combination of methods
1. Lack of oxen and a plough2. Lack of affordability of farm implements like a plough
and lack of tractor fee3. Intercropping4. Can afford the method
23 a. Do you apply any soil and water conservation methods?.1. Yes2. No
b.If yes, explain the soil and water conservation methods used.
24. Do you receive any agricultural technical assistance?1 . Yes2. No
25. If yes, state whether this has been beneficial in improvingfarming activities in the farm.
26 a. Have you experienced any problems in practising any of the technologies received in question 24 above?.
1. Yes2. No
b .Technology/Method Livestock farming1.2 .3.4 .5.
Crop farming1 .2.3.4.5 .
Problems
1.2 .3 .4 .5 .
1.2 .3 .4.5 .
27. Are you used to certain farming systems and not others?1. Yes2. NoExplain ___________________________________________________
28. Has this tradition in question 27 changed l.Yes2. No
171
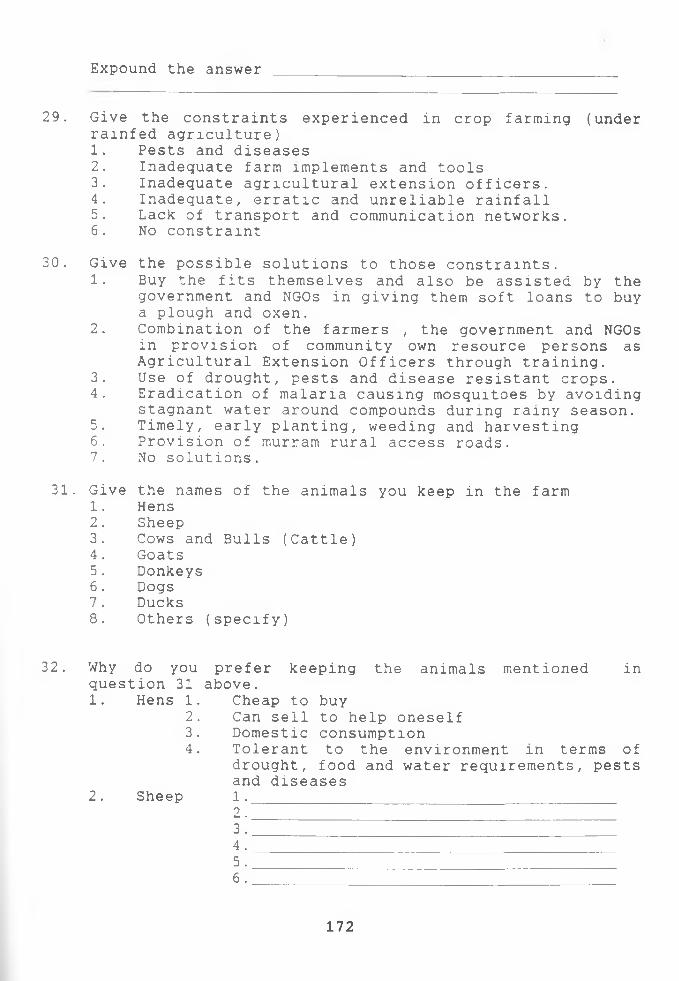
Expound the answer
29. Give the constraints experienced in crop farming (under rainfed agriculture)1. Pests and diseases2. Inadequate farm implements and tools3. Inadequate agricultural extension officers.4. Inadequate, erratic and unreliable rainfall5. Lack of transport and communication networks.6. No constraint
30. Give the possible solutions to those constraints.1. Buy the fits themselves and also be assisted by the
government and NGOs in giving them soft loans to buy a plough and oxen.
2. Combination of the farmers , the government and NGOs in provision of community own resource persons as Agricultural Extension Officers through training.
3. Use of drought, pests and disease resistant crops.4. Eradication of malaria causing mosquitoes by avoiding
stagnant water around compounds during rainy season.5. Timely, early planting, weeding and harvesting6. Provision of murram rural access roads.7. No solutions.
31. Give 1.2 .3 .4 .5.6 .7 .8 .
the names of the animals you keep in the farmHensSheepCows and Bulls (Cattle)GoatsDonkeysDogsDucksOthers (specify)
32 . Why do you question 31 1. Hens 1.
2 .3.4.
2. Sheep
prefer keeping the animals mentioned in above.
Cheap to buyCan sell to help oneself Domestic consumptionTolerant to the environment in terms of drought, food and water requirements, pests and diseases1._________________________________________2 .3.4. ________________________________________5. ________________________________________6 .________ ______
172
3. Goats 1.2 .3.4.5.6 .
4. Ducks 1.2.3.4.
5. Cattle 1.Ploughing2. Provision of meat and milk3. Can sell to help oneself4. Tolerant to the environment in terms of
food and water requirements drought, pests and diseases.
5. Bride price6. symbol of status.
6.Donkeys
7. Dogs
1. Ploughing2. Beast of burden3. Tolerant to the environment in terms of
water requirements, drought, pests and diseases.
1. Security at night2. Tolerant to the environment in terms of
food and water requirements, drought, pests and diseases.
3. Others (specify)
33. For each of the above seven named animals you keep in the farm, name the cause of their death immediately you settled in the area or currently.
1. Hens 1. ________________2. 3. ________________4. ________________
2. Sheepl. ________________2. 3. ________________4. ________________
173
3. Goatsl.2.3.4.
4. Ducks 1.2 .3.4.
5. Cattlel.2 .3 .4.
6. Donkeysl.2 .3.4.
7. Dogs 1.2 .3 .4.
34. Enumerate in order of seriousness the major problems facing animal rearing in the farm.
1. Trypanosomiasis2. Lack of food/inadequate land3. Tick borne diseases4.Inadequate agricultural extension officers5. Predators6. Distant water7.Others (Specify)
35. Possible solutions to solve the constraints facing animal rearing.1. Advice on appropriate drugs by agricultural extension
officers.2. Construction of better animal houses.3. Clearing of tsetse fly infested business4. Keeping, drought, pests and disease tolerant animals.5. Use of hand pumps to spray the animals.6. Maintain land carrying capacities of the types of
animals preferred to keep7. Keep those animals providing more uses to the farmer
and also with little food and water requirements/8. Others (specify)
36. Do you keep bees?1 Yes2. No
174
37. If yes in question 36 above, types of bee-hives kept.
Types of bee-hive kept Number of % age ofrespondent respondent
1. Traditional type2. New improved type3. None keptTotals
38. Number of bee hives kept by each farmer
Number of % age ofrespondents respondents
1. None2. 1-53. 6-104. 11-155. 16-206. 21-257. 26-308. over 30Totals
Number of bee hives kept by the farmer
39. Average productivity of bee hives in killogrammes.Honey yield per bee hive in Number of % age ofkilogrammes respondents respondents1. None2. 1-53. 6-104. 11-155. 16-206. over 20Totals
40. Uses of Honey after its harvest.
Use Number of respondents % age ofrespondents
1. Consume at Home2. Sell to traders3. Sell to co-operatives4. Make honey beer5. No honey
175
41-L • 2. 3.
5.
42.
1.
43 .
44.
45 .
Constraints to bee keeping Small piece of land Lack of tall, big trees Not conversant with bee-keeping Do not like bee / bees stingToo expensive / bee-hive prices too high to afford.
Possible solutions to overcome the constraints to bee keeping.Introduction of the new improved bee keeping methods Provision of more agricultural extension officers in terms of community own resource persons.Sensitise the farmers on the importance of bee keeping and tell them that the new method of bee keeping is environment friendly.
IRRIGATED AGRICULTURE (To be filled by those who practise irrigated agriculture)
Do you practise irrigated agriculture?.1. Yes2. No
If yes in question 43 above, What crops do you grow ?.1.2 .3 .4.5.6 .7.8.
Give the acreage allocation for each of the above mentioned crops in question 44 for the years 1992, 1993, 1994 and 1995 .
Crops 1.2 .
3 .4 .5 .6 .7 .
A C R E A1992 1993 1994
G E1995
176
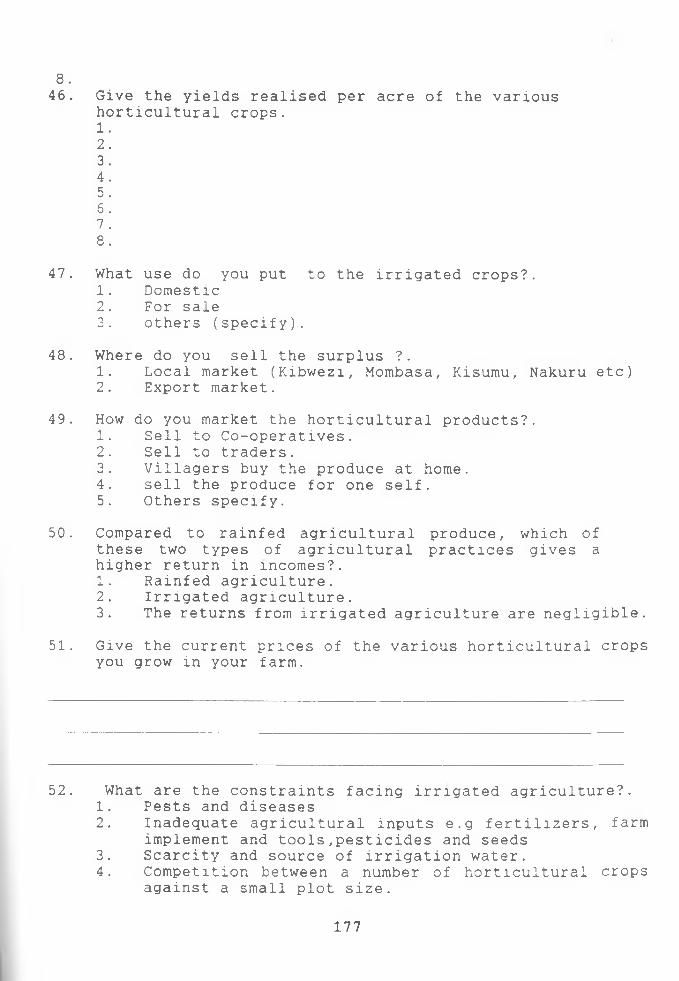
46. Give the yields realised per acre of the various horticultural crops.1.2 .3 .4.5.6 .7 .8 .
47. What use do you put to the irrigated crops?.1. Domestic2. For sale3. others (specify).
48. Where do you sell the surplus ?.1. Local market (Kibwezi, Mombasa, Kisumu, Nakuru etc)2. Export market.
49. How do you market the horticultural products?.1. Sell to Co-operatives.2. Sell to traders.3. Villagers buy the produce at home.4. sell the produce for one self.5. Others specify.
50. Compared to rainfed agricultural produce, which of these two types of agricultural practices gives a higher return in incomes?.1. Rainfed agriculture.2. Irrigated agriculture.3. The returns from irrigated agriculture are negligible.
51. Give the current prices of the various horticultural crops you grow in your farm.
8 .
52. What are the constraints facing irrigated agriculture?.1. Pests and diseases2. Inadequate agricultural inputs e.g fertilizers, farm
implement and tools,pesticides and seeds3. Scarcity and source of irrigation water.4. Competition between a number of horticultural crops
against a small plot size.
177
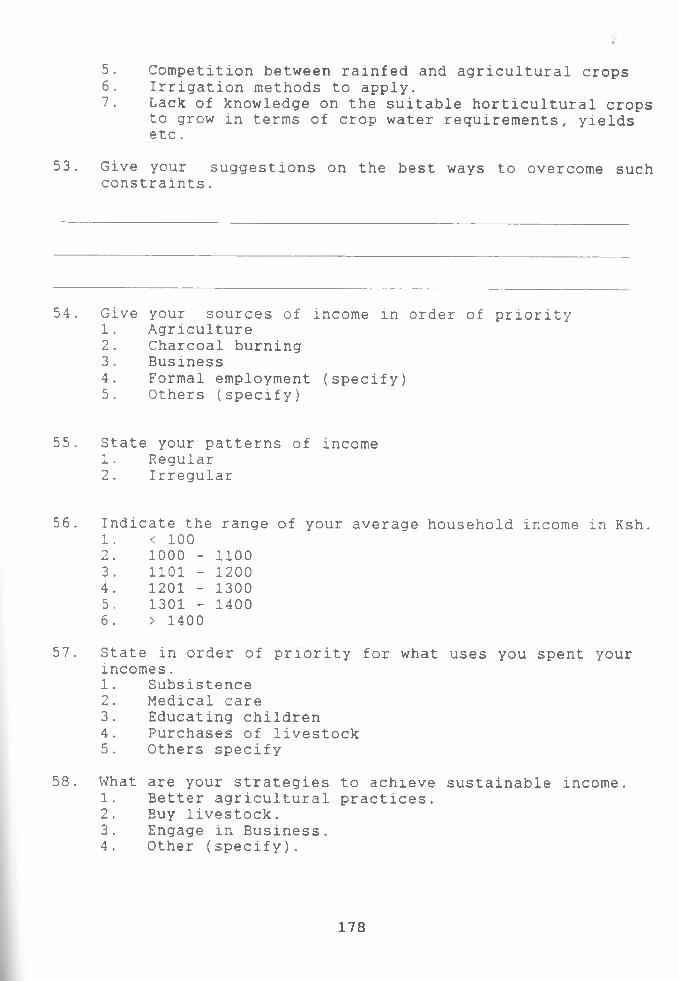
5. Competition between ramfed and agricultural crops6. Irrigation methods to apply.7. Lack of knowledge on the suitable horticultural crops
to grow in terms of crop water requirements, yields etc.
53. Give your suggestions on the best ways to overcome such constraints.
54. Give your sources of income in order of priority1. Agriculture2. Charcoal burning3. Business4. Formal employment (specify)5. Others (specify)
55. State your patterns of income1. Regular2. Irregular
56. Indicate the range of your average household income in Ksh.1. < 1002 . 1000 - 11003. 1101 - 12004. 1201 - 13005 . 1301 - 14006 . > 1400
57. State in order of priority for what uses you spent your incomes.1. Subsistence2. Medical care3. Educating children4. Purchases of livestock5. Others specify
58. What are your strategies to achieve sustainable income.1. Better agricultural practices.2. Buy livestock.3. Engage in Business.4. Other (specify).
178
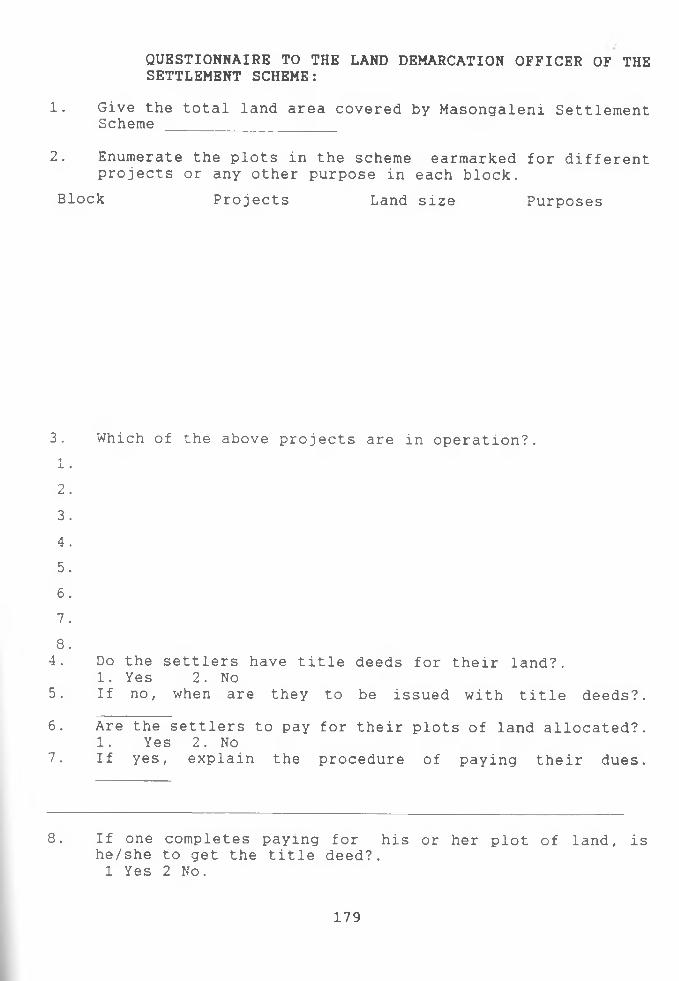
1. Give the total land area covered by Masongaleni SettlementScheme ___________________
2. Enumerate the plots in the scheme earmarked for different projects or any other purpose in each block.
Block Projects Land size Purposes
QUESTIONNAIRE TO THE LAND DEMARCATION OFFICER OF THESETTLEMENT SCHEME:
3 .1. 2 .3 .4 . 5. 6 . 7 .8.4.
5.
6 .7 .
Which of the above projects are in operation?.
Do the settlers have title deeds for their land?.1. Yes 2. NoIf no, when are they to be issued with title deeds?.
Are the settlers to pay for their plots of land allocated?. 1. Yes 2. NoIf yes, explain the procedure of paying their dues.
8. If one completes paying for his or her plot of land, is he/she to get the title deed?.1 Yes 2 No.
179
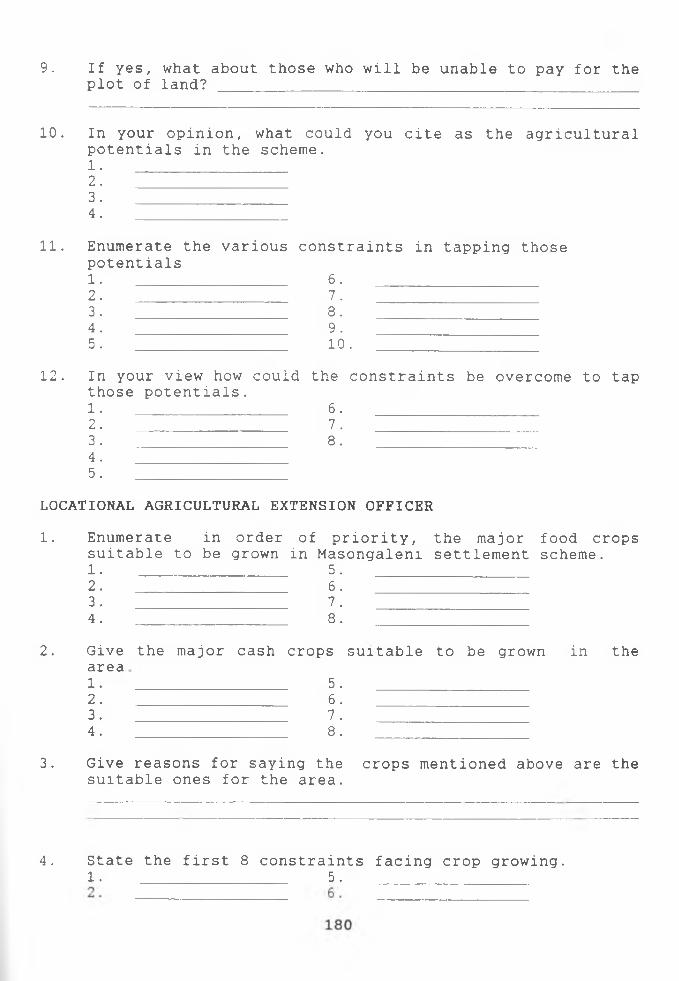
9. If yes, what about those who will be unable to pay for the plot of land? _________________________________________ _
10. In your opinion, potentials in the 1.
what could you cite as the scheme.
agricultural
2.3.4.
11. Enumerate the various constraints in tapping thosepotentials1. _________________ 6.2. 7 .3 . 8.4. 9.5. 10.
12. In your view how could the constraints those potentials.1. 6.
be overcome to tap
2. 7 .3. 8.4.5.
LOCATIONAL AGRICULTURAL EXTENSION OFFICER
1. Enumerate in order of priority, the major food cropssuitable to be grown in Masongaleni settlement scheme.1. _________________ 5.2. 6 .3. 7 .4. 8.
2. Give area, 1.
the major cash crops
5.
suitable to be grown in the
2. 6.3. 7 .4. 8.
3. Give reasons for saying the suitable ones for the area.
crops mentioned above are the
4. State the first 8 constraints facing crop growing.1. _________________ 5. ________________
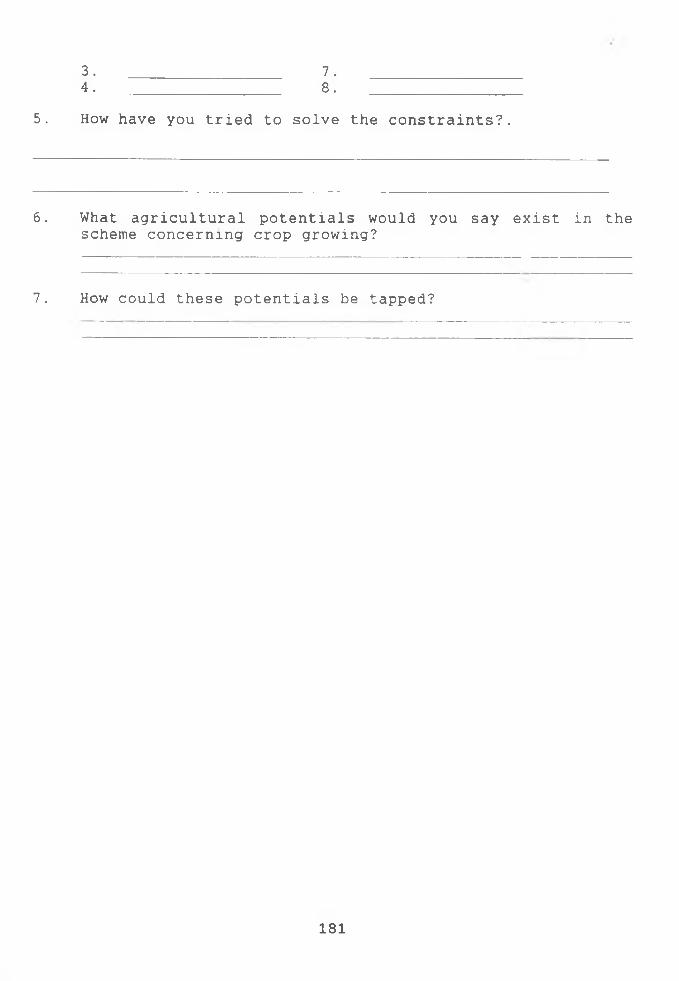
3. _________________ 7. ________________4. _________________ 8. ________________
5. How have you tried to solve the constraints?.
6. What agricultural potentials would you say exist in the scheme concerning crop growing?
7. How could these potentials be tapped?
181
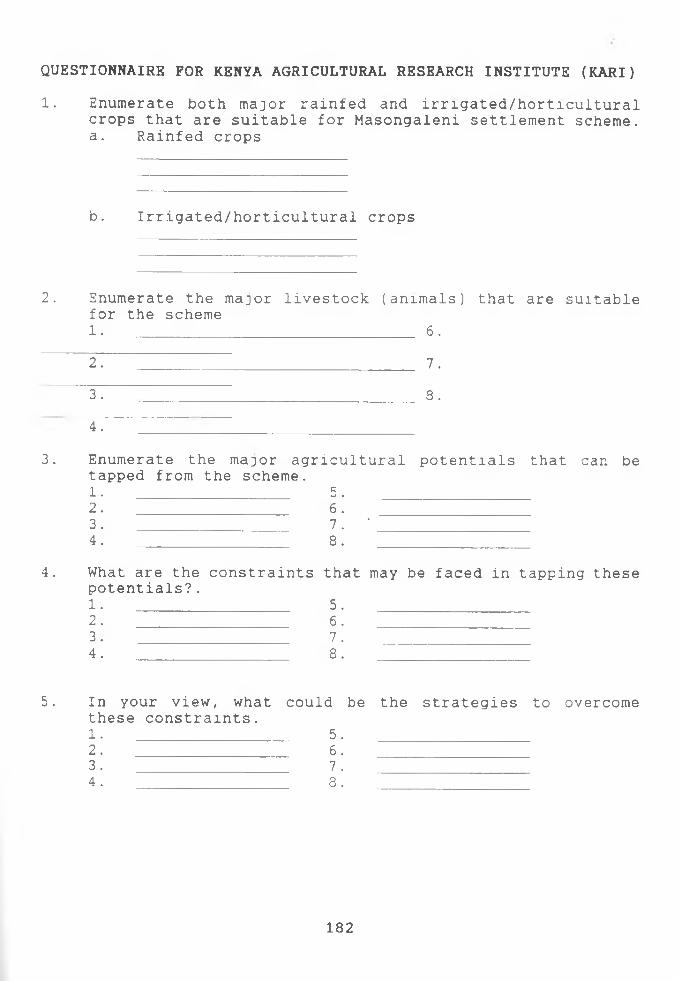
1. Enumerate both major rainfed and irrigated/horticultural crops that are suitable for Masongaleni settlement scheme, a. Rainfed crops
QUESTIONNAIRE FOR KENYA AGRICULTURAL RESEARCH INSTITUTE (KARI)
b. Irrigated/horticultural crops
2. Enumerate the major livestock (animals) that are suitable for the scheme1. _______________________________ 6.
2 . _______________________________ 7.
3 . _______________________________ 8.
4.
3. Enumerate the major agricultural potentials that can be tapped from the scheme.1. _________________ 5. _________________2 . _________________________________ 6 . _________________________________
3. _________________ 7. *_________________4. _________________ 8. _________
4. What are the constraints potentials? .1. _________________2. _________________3. _________________4. ______________
that may be faced in tapping these
5. _________________6. _________________7. _________________8 . ____________
5 . In your view, what could be the strategies to these constraints.1. _________________ 5. _________________2 . _______________________ 6 . _______________________3. _________________ 7. _________________4. _________________ 8. ____________
overcome
182
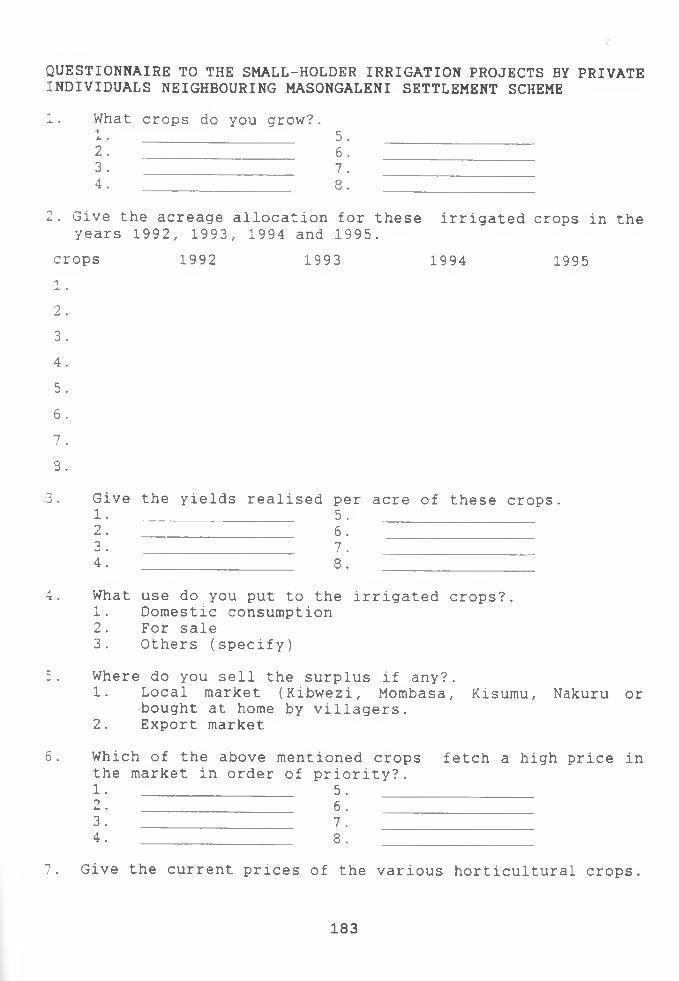
1. What crops do you grow?.1. _________________ 5. _________________2 . __________________ 6 . __________________3. _________________ 7. _________________4. ________________ 8. ____
QUESTIONNAIRE TO THE SMALL-HOLDER IRRIGATION PROJECTS BY PRIVATEINDIVIDUALS NEIGHBOURING MASONGALENI SETTLEMENT SCHEME
2. Give the acreage allocation for these irrigated crops in the years 1992, 1993, 1994 and 1995.
crops 1992 1993 1994 19951. 2 .3.4 .56.7 .3.
3. Give the yields realised per acre of these crops.1. _________________ 5. _________________2 . ________________ 6 . ________________3. _________________ 7. _________________4. _________________ 8. ____
4. What use do you put to the irrigated crops?.1. Domestic consumption2. For sale3. Others (specify)
5. Where do you sell the surplus if any?.1. Local market (Kibwezi, Mombasa, Kisumu, Nakuru or
bought at home by villagers.2. Export market
6. Which of the above mentioned crops fetch a high price in the market in order of priority?.1. _________________ 5. _________________2 . _______________ 6 . _______________3. _________________ 7. _________________4. _________________ 8. ____________
7. Give the current prices of the various horticultural crops.
183
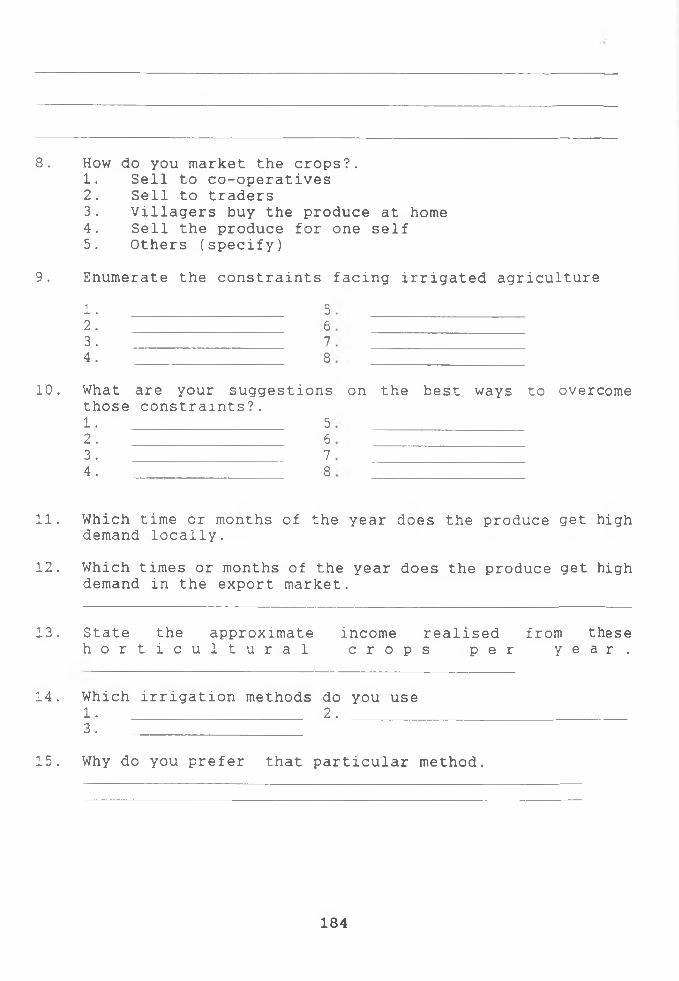
8. How do you market the crops?.1. Sell to co-operatives2. Sell to traders3. Villagers buy the produce at home4. Sell the produce for one self5. Others (specify)
9. Enumerate the constraints facing irrigated agriculture1a- • 52. 63 . 74 . 8
10. What are your suggestions those constraints?.1. 52. 63. 74. 8
on the best ways to overcome
11. Which time or months of the year does the produce get high demand locally.
12. Which times or months of the year does the produce get high demand in the export market.
13. State the approximate income realised from these h o r t i c u l t u r a l c r o p s p e r y e a r .
14. Which irrigation methods do you use1 . _________________ 2 . ______3. ________________
15. Why do you prefer that particular method.
184
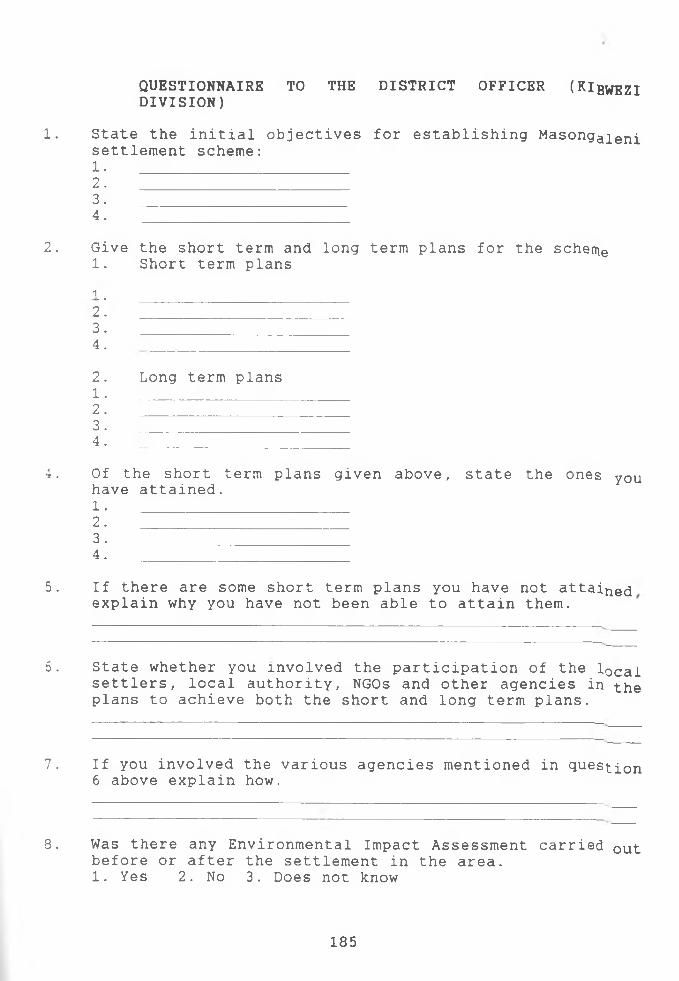
1. State the initial objectives for establishing Masongaient settlement scheme:1. 2. ________________________3. ________________________4 . _______________________
QUESTIONNAIRE TO THE DISTRICT OFFICER (KlgvtEZIDIVISION)
2. Give the short term and long term plans for the schen^1. Short term plansi_ #
2. izzzzzz^zzz:3. ________________________4 . _______________
2. Long term plans1. ________________2. ________________3. ________________4. ________________
4. Of the short term plans given above, state the ones you have attained.1. 2. 3. ________________________4. _______________
5. If there are some short term plans you have not attaine(} explain why you have not been able to attain them.
6. State whether you involved the participation of the local settlers, local authority, NGOs and other agencies in the plans to achieve both the short and long term plans.
7. If you involved the various agencies mentioned in question 6 above explain how.
8. Was there any Environmental Impact Assessment carried out before or after the settlement in the area.1. Yes 2. No 3. Does not know
185
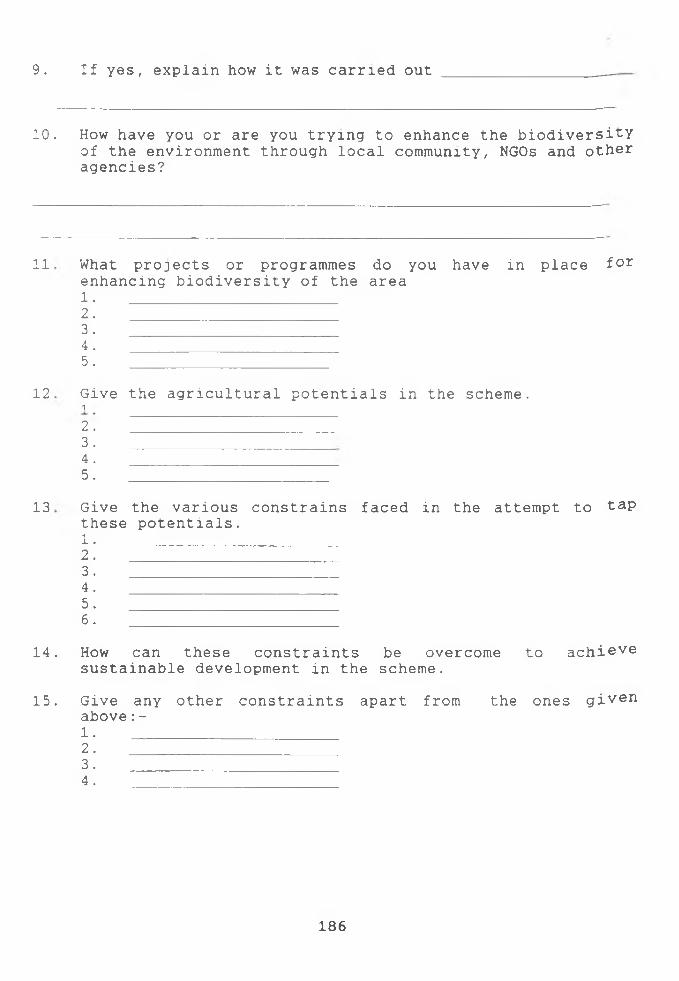
9. If yes, explain how it was carried out
10. How have you or are you trying to enhance the biodiversity of the environment through local community, NGOs and other agencies?
11 What projects or programmes do you have in place f°r enhancing biodiversity of the area1 2345
12
13
Give the agricultural potentials in the scheme.12345
Give the various constrains faced in the attempt to tap these potentials.1. 2. 3. ________________________4. ________________________5. ________________________6 .
14. How can these constraints be overcome to achi©ve sustainable development in the scheme.
15. Give any other constraints apart from the ones given above:-1. ________________________2. ________________________3. ________________________4. ___________________
186
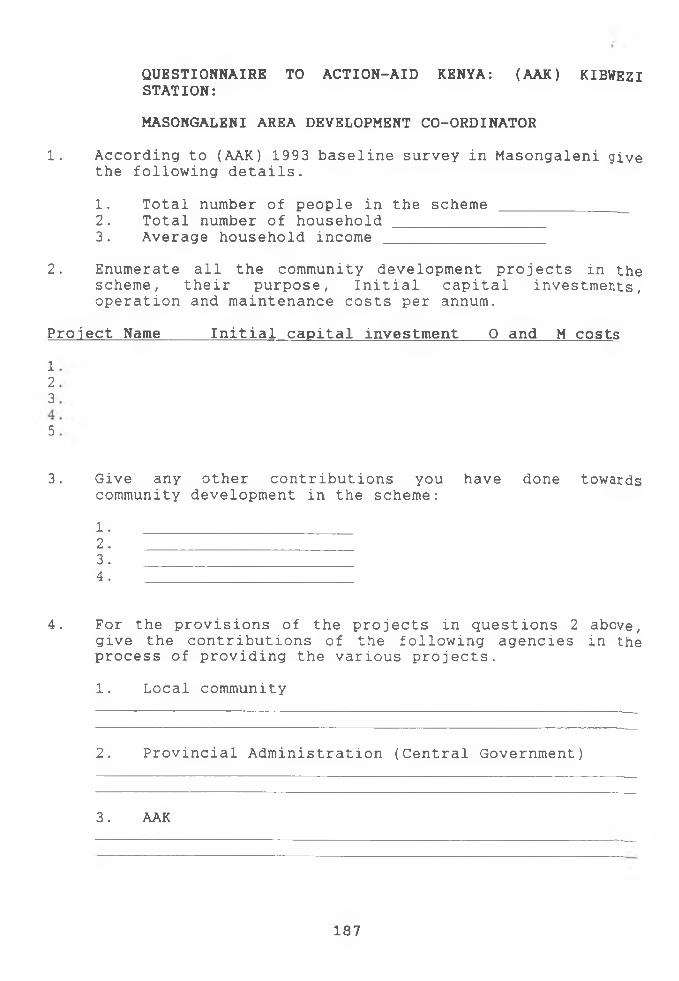
H CM ro
in
MASONGALENI AREA DEVELOPMENT CO-ORDINATOR1. According to (AAK) 1993 baseline survey in Masongaleni give
the following details.
1. Total number of people in the scheme _______________2. Total number of household _________________3. Average household income __________________
2. Enumerate all the community development projects in the scheme, their purpose, Initial capital investments, operation and maintenance costs per annum.
Project Name_____ Initial capital investment 0 and M costs
QUESTIONNAIRE TO ACTION-AID KENYA: (AAK) KIBWEZISTATION:
3. Give any other contributions you have done towards community development in the scheme:
1. ________________________2. 3. ________________________4. ________________________
4. For the provisions of the projects in questions 2 above, give the contributions of the following agencies in the process of providing the various projects.
1. Local community
2. Provincial Administration (Central Government)
3. AAK
187
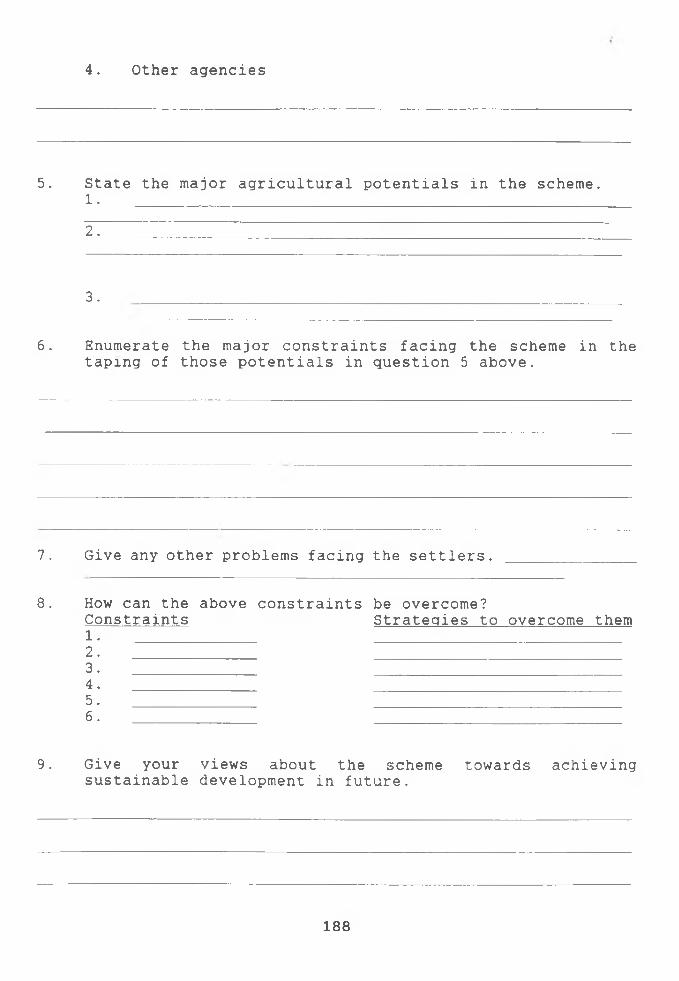
4. Other agencies
5. State the major agricultural potentials in the scheme.1. _______________________________________________
2 .
3.
6. Enumerate the major constraints facing the scheme in the taping of those potentials in question 5 above.
7. Give any other problems facing the settlers.
8. How can the above constraints be overcome?Constraints Strategies to overcome them1. ______________ ____________________________2. ______________ ____________________________3. ______________ ____________________________4. ______________ ____________________________5. ______________ ____________________________6 . ____________
9. Give your views about the scheme towards achieving sustainable development in future.
188
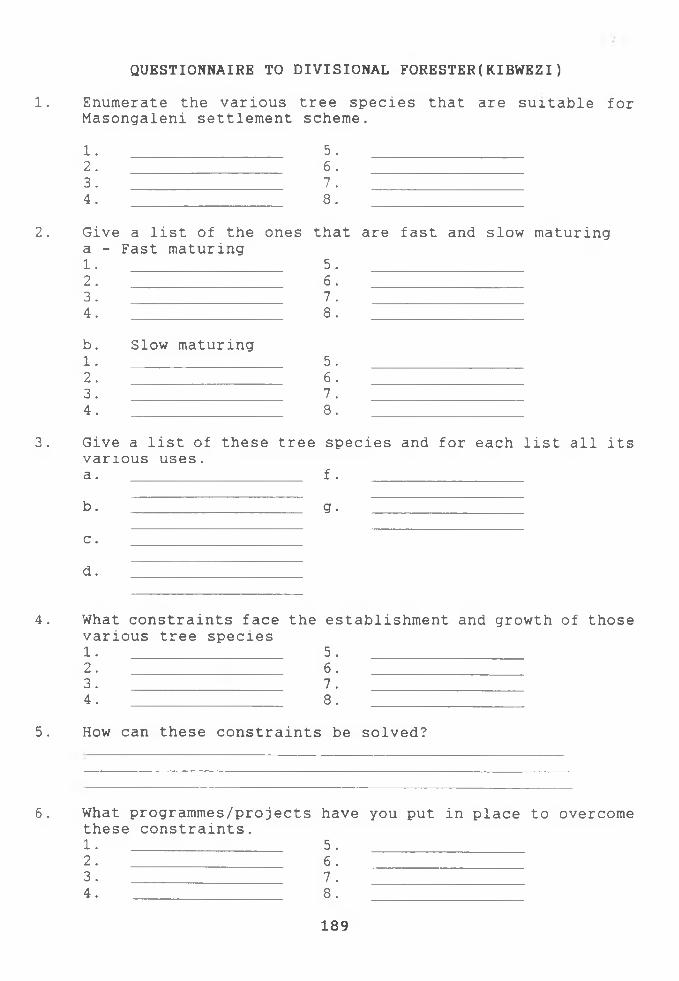
QUESTIONNAIRE TO DIVISIONAL FORESTER(KIBWEZI)1. Enumerate the various tree species that are suitable for
Masongaleni settlement scheme.
1. _________________ 5. _________________2 . _______________ 6 . _______________3. _________________ 7. _________________4. _________________ 8. __________
2. Give a list of the ones a - Fast maturing 1. _________________2. _________________3. _________________4. _________________
b. Slow maturing1. ______________2 . _____________3. ______________4. ______________
that are fast and slow maturing
5. _________________6. _________________7. _________________8. _________________
5.6 . 7 . 8 .
3. Give a list of these tree species and for each list all its various uses.a. ___________________ f. _________________
b. ___________________ g.
c .
d.
4. What constraints face the establishment and growth of those various tree species1. _________________ 5. _________________2 . ________________ 6 . ________________3. _________________ 7. _________________4. _________________ 8. _________________
5. How can these constraints be solved?
6. What programmes/projects have you put in place to overcome these constraints.1. _________________ 5. _________________2 . _______________ 6 . _______________3. _________________ 7. _________________4. _________________ 8. __________
189
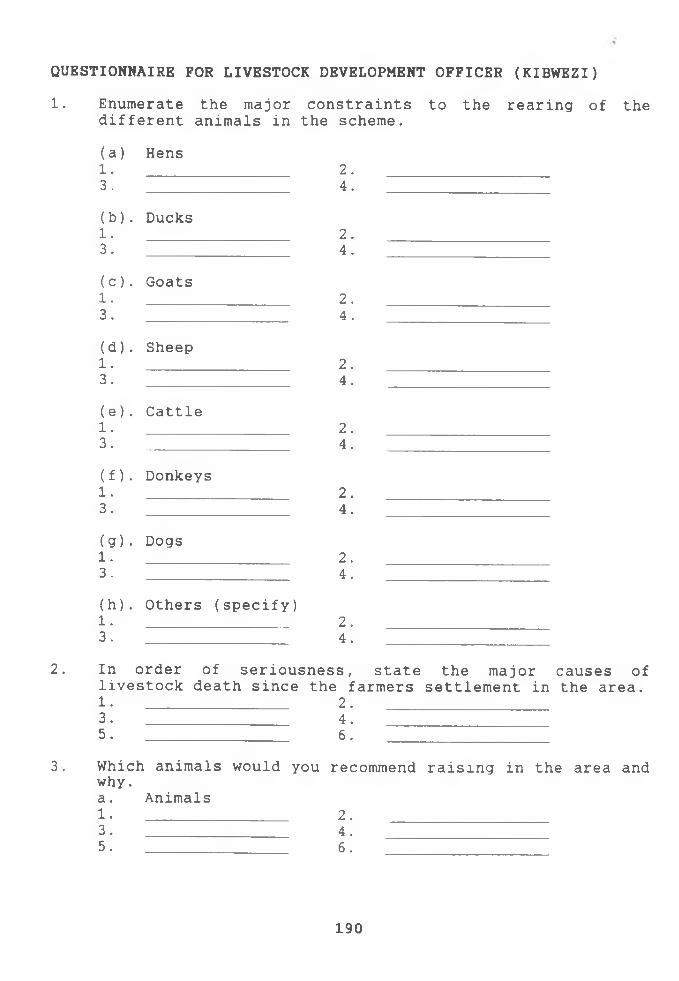
1. Enumerate the major constraints to the rearing of the different animals in the scheme.
QUESTIONNAIRE FOR LIVESTOCK DEVELOPMENT OFFICER (KIBWEZI)
(a) Hens1. 2.3 . 4.
(b) . Ducks1. 2.3. 4.
(c) . Goats1. 2.3. 4.
(d) . Sheep1. 2.3 . 4.(e) . Cattle1. 2.3. 4.
(f ). Donkeys1. 2.3. 4.
(g) . Dogsl. 2.3 . 4.(h) . Others (specify)1. 2.3. 4.
In order of seriousness,2. In order of seriousness, state the major causes of livestock death since the farmers settlement in the area.1 . ___________________________ 2 . ______________________________3. ________________ 4. __________________5. ________________ 6.
3. Which animals would why.a. Animals1. 3. 5 .
you recommend raising in the area and
2 .4.6 .
190
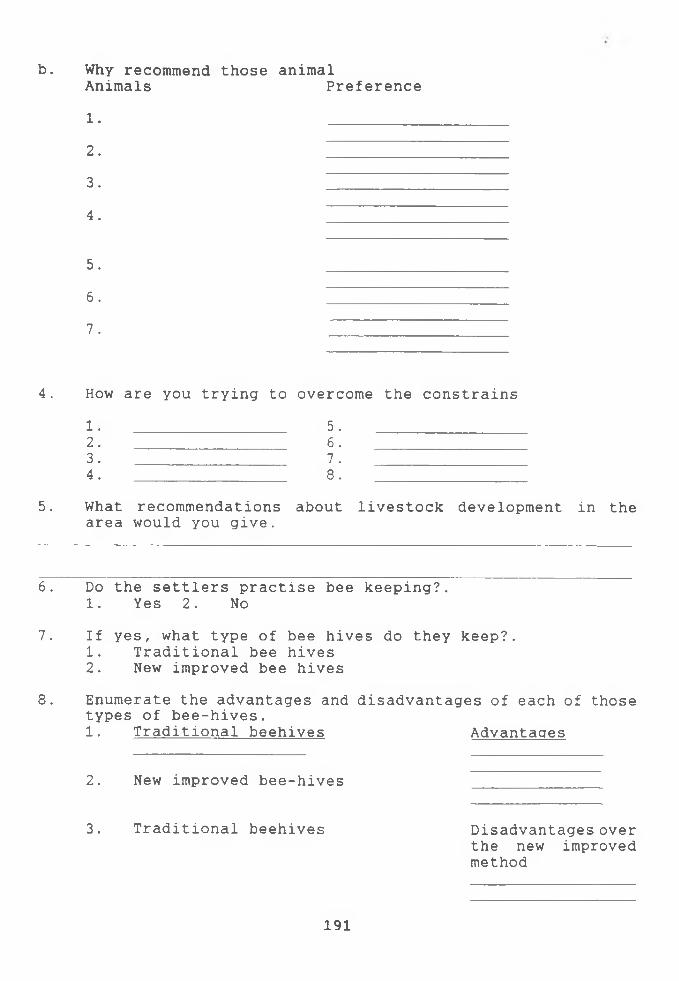
b. Why recommend those animalAnimals Preference
1. ___________
2 . ~
3.
4. ~
5. ___________
6. ~
7. ~
4. How are you trying to overcome the constrains
1. _________________ 5. ________________2 . __________________ 6 . _________________3. _________________ 7. ________________4. _________________ 8. ________________
5. What recommendations about livestock development in the area would you give.
6. Do the settlers practise bee keeping?. 1. Yes 2. No
7. If yes, what type of bee hives do they keep?.1. Traditional bee hives2. New improved bee hives
8. Enumerate the advantages and disadvantages of each of those types of bee-hives.1. Traditional beehives Advantages
2. New improved bee-hives
3. Traditional beehives Disadvantages overthe new improved method
191
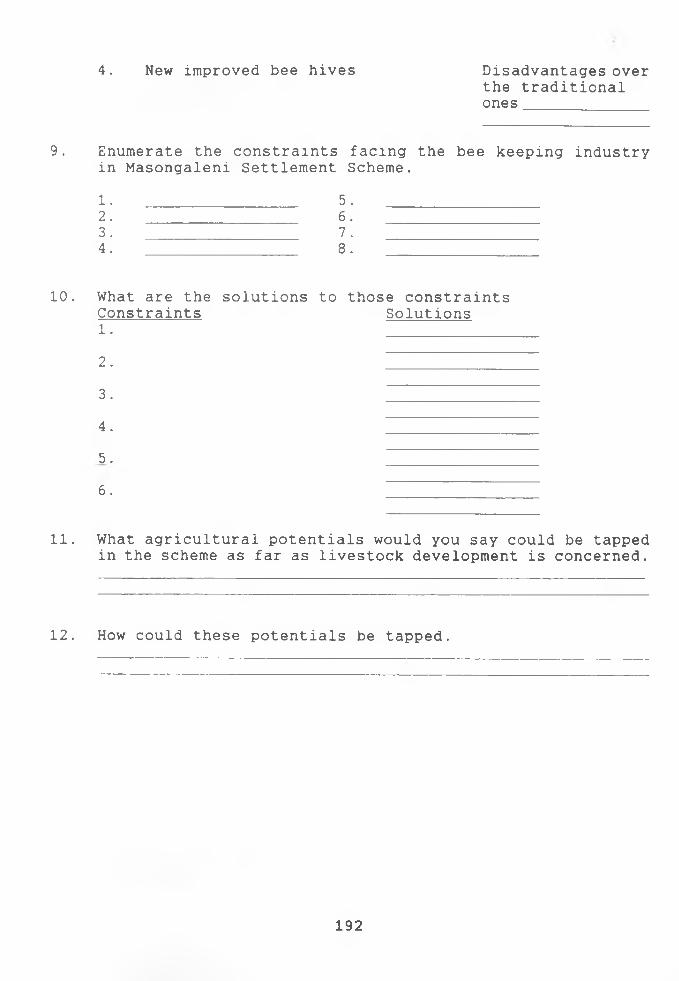
4. New improved bee hives Disadvantages over the traditional ones
9. Enumerate the constraints facing the bee keeping industry in Masongaleni Settlement Scheme.
1. _________________ 5. _________________2 . _______________ 6 . _______________3. _________________ 7. _________________4. _________________ 8. _____________
10. What are the solutions to those constraintsConstraints Solutions1. ______________
2. ZZH ZH Z13. i^ zzzz:4 . HZZZZZH5. H Z ZU ZZ6 .
11. What agricultural potentials would you say could be tapped in the scheme as far as livestock development is concerned.
12. How could these potentials be tapped.
192
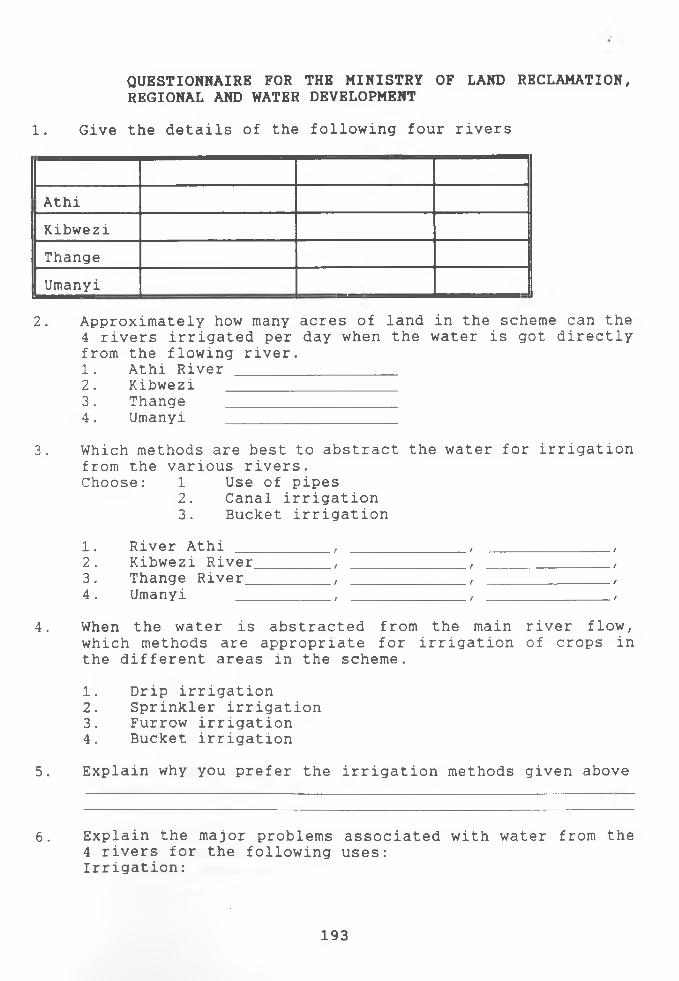
QUESTIONNAIRE FOR THE MINISTRY OF LAND RECLAMATION, REGIONAL AND WATER DEVELOPMENT
1. Give the details of the following four rivers
AthiKibweziThangeUmanyi
2. Approximately how many acres of land in the scheme can the 4 rivers irrigated per day when the water is got directly from the flowing river.1. Athi River __________________2. Kibwezi ___________________3. Thange ___________________4. Umanyi ___________________
3. Which methods are best to abstract the water for irrigation from the various rivers.Choose: 1 Use of pipes
2. Canal irrigation3. Bucket irrigation
1. River Athi ___________, , ,2. Kibwezi River_________ , , ,3. Thange River__________ , , ,4. Umanyi , , ,
4. When the water is abstracted from the main river flow, which methods are appropriate for irrigation of crops in the different areas in the scheme.
1. Drip irrigation2. Sprinkler irrigation3. Furrow irrigation4. Bucket irrigation
5. Explain why you prefer the irrigation methods given above
6. Explain the major problems associated with water from the 4 rivers for the following uses:Irrigation:
193
a. 1._________________________2._________________________3. ________________________4. ________________________5. ________________________6. ________________________
b. Animal drinking1._________________________2._________________________3. ________________________4. ________________________5. ________________________
c. Human drinking and bathing
1._________________________2._________________________3. ________________________4. ________________________5. ________________________
7. In your view, explain how the above problems can be solved.
8. How is the geological status for ground water in the scheme?1. Poor 2. Fair2. Good 4. Very good
9. Give the average water yield from boreholes in the scheme
10. Give the average cost of establishing a borehole in the area from its drilling stage to putting up a pump
11. Enumerate the problems or constraints faced in having ground water.
12. How can these constraints be overcome to have sustainable domestic safe ground water?
13. Give the average rain water volume that can be realised in one metre squared of an iron sheet roofed house.
194
14.
15.
What are the major constraints experienced in getting rai*1 water?
How can these constraints be overcome?
f<rf«C i i — 1
.Voi»*L
195