Embed Size (px)
Citation preview
The Agricultural Productivity Gap
in Developing Countries
Douglas GollinOxford University
David LagakosArizona State University
Michael WaughNew York University
World Bank-GWU Conference on Urbanization and Poverty ReductionWashington, DC13 May 2013
Gollin, Lagakos, & Waugh (2013) Agricultural Productivity Gap WB-GWU Conferrence 1 / 40

The Agricultural Productivity Gap
in Developing Countries
Douglas GollinOxford University
David LagakosArizona State University
Michael WaughNew York University
World Bank-GWU Conference on Urbanization and Poverty ReductionWashington, DC13 May 2013
Gollin, Lagakos, & Waugh (2013) Agricultural Productivity Gap WB-GWU Conferrence 2 / 40

Background
In much of sub-Saharan Africa (and in many of the world's poorestcountries), large fractions of the population live in rural areas andwork in quasi-subsistence agriculture.
Productivity levels in this sector appear to be very low � both inabsolute terms and relative to the non-agricultural sector.
By contrast, in rich countries, productivity appears to beapproximately equal across sectors.
Ricardian comparative advantage suggests that countries shouldspecialize in sectors that are relatively most productive, compared tothe rest of the world.
Why are so many people in poor countries working in a sector wherethey appear to be relatively so unproductive?
Gollin, Lagakos, & Waugh (2013) Agricultural Productivity Gap WB-GWU Conferrence 3 / 40

Does Mismeasurement Explain the Puzzle?
One view is that we simply cannot believe the data.
This paper attempts to measure the productivity gaps using the bestavailable theory and data.
I Are sectoral productivity di�erences merely illusory?
I Can we improve measurement of productivity di�erences?
I Do unexplained di�erences remain?
Gollin, Lagakos, & Waugh (2013) Agricultural Productivity Gap WB-GWU Conferrence 4 / 40

Agriculture Sector in Developing Countries
Agriculture's share of employment high
Share of value added systematically lower than share of employment
Gollin, Lagakos, & Waugh (2013) Agricultural Productivity Gap WB-GWU Conferrence 5 / 40

Agriculture Sector in Developing Countries
ALB
DZAARG
ARM
AZE
BGD
BLR BLZ
BEN
BTN
BOL
BWA BRABGR
BFA
BDI
KHM
CMR
CPV
CAF
TCD
CHL
CHNCOLCRI
CIV
CUB
DMA
DOMECU
EGYSLV
ETH
FJI
GAB
GMB
GEO
GHA
GRDGTM
GIN
GUY
HND
IND
IDNIRNIRQ
JAMJOR
KAZ
KENKGZ
LAO
LBN
LSO
LBR
LTU
MKD
MDG
MWI
MYSMDV
MLI
MHLMUSMEX
MDAMNG
MNE
MAR
MYA
NAM
NPL
NIC
NGA
PAK
PAN
PNG
PRY
PER
PHL
POL
ROM
RUS
RWA
LCA
WSMSTP
SENSRB
SLE
ZAF
LKAVCG
SDN
SUR
SWZSYR
TJK
TZA
THA
TON
TUNTUR
UGA
UKRURY
UZB
VEN
VNMYEM
ZMBZWE
020
4060
8010
0
VA
sha
re o
f Agr
icul
ture
0 20 40 60 80 100
Empoyment Share of Agriculture
Gollin, Lagakos, & Waugh (2013) Agricultural Productivity Gap WB-GWU Conferrence 6 / 40

Agriculture Sector in Developing Countries
Agriculture's share of employment high
Share of value added systematically lower than share of employment
Implies that VA/L lower in agriculture than non-agricultural sector
Gollin, Lagakos, & Waugh (2013) Agricultural Productivity Gap WB-GWU Conferrence 7 / 40

The Agricultural Productivity Gap in Developing Countries
We de�ne the Agricultural Productivity Gap (APG) to be:
APG ≡ VAn/LnVAa/La
.
Under some moderately restrictive assumptions, APG should be closeto 1; this is a useful benchmark.
Typical developing country has APG of 4. Some have 8 or more!
But can we trust these highly aggregate numbers?
Gollin, Lagakos, & Waugh (2013) Agricultural Productivity Gap WB-GWU Conferrence 8 / 40

The Agricultural Productivity Gap in Developing Countries
In a mechanical sense, the di�erences in sectoral productivity can�explain" a great deal of cross-country di�erences in GDP per worker.(Caselli, 2005; Restuccia et al, 2008; Vollrath, 2009)
Taken at face value, gaps suggest misallocation.
Policy debate: Encourage movement out of agriculture? Targetagricultural sector for investments?
This paper: re�ne the measurement of productivity gaps.
Gollin, Lagakos, & Waugh (2013) Agricultural Productivity Gap WB-GWU Conferrence 9 / 40

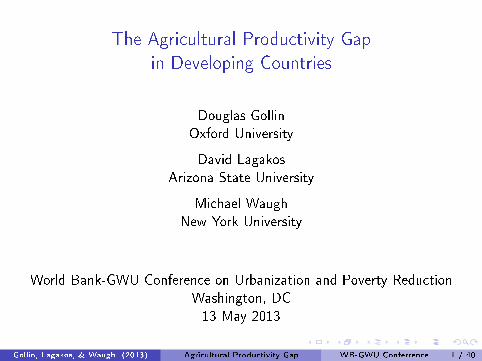
Possible Sources of Measurement Error
Sector di�erences in hours worked per worker?
Construct measures of hours worked by sector for 51 countries
Sector di�erences in human capital per worker?
Construct measures of human capital by sector for 98 countries
Shortcomings of national accounts data?
Use household income/expenditure surveys from 10+ countries
Gollin, Lagakos, & Waugh (2013) Agricultural Productivity Gap WB-GWU Conferrence 10 / 40
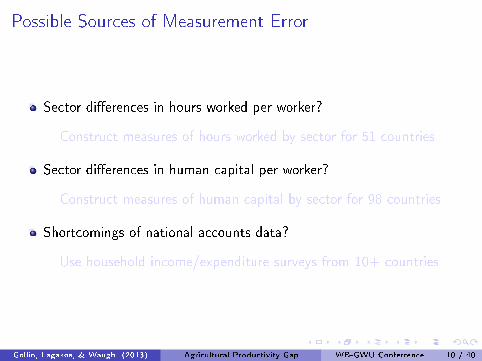
Preview of Results
After adjustments, APG in average developing country reduced from 4to 2.
Gaps are present in micro data as well as macro aggregates.
Needed: better understanding of why residual gaps so large.
Gollin, Lagakos, & Waugh (2013) Agricultural Productivity Gap WB-GWU Conferrence 11 / 40

Simple Two-Sector Model
Technologies:Ya = AaL
θaK
1−θa and Yn = AnL
θnK
1−θn
Households can supply labor to either sector.
Competitive labor markets, i.e. workers paid their marginal product.
Equilibrium: APG ≡ VAn/LnVAa/La
= Yn/LnpaYa/La
= 1.
Gollin, Lagakos, & Waugh (2013) Agricultural Productivity Gap WB-GWU Conferrence 12 / 40

Computing �Raw� Agricultural Productivity Gaps
Measures of VAa and VAn.
Value added as de�ned in 1993 System of National Accounts (SNA).
Source: World Bank, via country national accounts data.
Measures of La and Ln: "economically active population" by sector.
Employed or unemployed persons who are working (or seeking work)in the production of some good or service recognized by the 1993 SNA.
Source: World Bank, via population censuses or labor force surveys.
Gollin, Lagakos, & Waugh (2013) Agricultural Productivity Gap WB-GWU Conferrence 13 / 40

Summary Statistics of Raw Agricultural Productivity Gaps
Measure Weighted Unweighted
5th Percentile 1.7 1.1
Median 3.7 3.0
Mean 4.0 3.6
95th Percentile 5.4 8.8
Number of Countries 113 113
Gollin, Lagakos, & Waugh (2013) Agricultural Productivity Gap WB-GWU Conferrence 14 / 40

�Simple� Measurement Error in National Accounts Data?
Understate agricultural VA by excluding output produced for ownconsumption?
No in principle: it is included as per SNA.
No in practice: output of particular crop = area planted x yield
Overstate agricultural employment, by including all rural persons?
No in principle: only economically active persons included per SNA.
No in practice: national accounts consistent with household surveys.
Gollin, Lagakos, & Waugh (2013) Agricultural Productivity Gap WB-GWU Conferrence 15 / 40

Sector Di�erences in Hours Worked
Average hours worked per worker might di�er across sectors.
We construct average hours worked per worker by sector for 51countries.
- Population census micro data or labor force surveys.
- All employed or unemployed persons 15+ years old.
- Industry of primary employment (employed); industry of previousemployment or rural/urban status (unemployed).
- Hours worked in reference period (usually one week).
Gollin, Lagakos, & Waugh (2013) Agricultural Productivity Gap WB-GWU Conferrence 16 / 40

Sector Di�erences in Hours Worked
ALBARG
ARM
BGDBTN
BOL
BWA
BRA
KHMCHL
CRICIV
DOM
ECU
ETH
FJI
GHA
GTM
IDNIRQ
JAM
JOR
KEN
LSO
LBR
MWI
MYS
MUS
MEXNPL
NGA
PAKPAN
PERPHL
ROM
RWA
LCA
SLE
ZAF
LKA
SWZ
SYR
TZATON
TUR
UGA
VEN
VNM
ZMB
ZWE
1.01.52.020
3040
5060
Hou
rs W
orke
d in
Non
−A
gric
ultu
re
20 30 40 50 60
Hours Worked in Agriculture
Gollin, Lagakos, & Waugh (2013) Agricultural Productivity Gap WB-GWU Conferrence 17 / 40

Sector Di�erences in Hours Worked: Summary
Explains on average a factor 1.2.
Only a few countries above 1.5.
Unlikely to be the main cause of APGs in developing countries.
Gollin, Lagakos, & Waugh (2013) Agricultural Productivity Gap WB-GWU Conferrence 18 / 40

Sector Di�erences in Human Capital
Average human capital per worker could di�er across sectors.(Caselli & Coleman, 2001; Vollrath, 2009)
We construct human capital per worker by sector for 97 countries.
- Years of schooling measured directly when available.
- Impute years of schooling using educational attainment otherwise.
- Baseline: assume 10% rate of return on year of schooling.(Psacharoplous & Patrinos 2002; Banerjee & Du�o, 2005)
hj ,i = exp(sj ,i · 0.10)
Gollin, Lagakos, & Waugh (2013) Agricultural Productivity Gap WB-GWU Conferrence 19 / 40

Sector Di�erences in Human Capital
ALBARG
ARM
AZE
BGD
BLR
BLZ
BEN
BTN
BOL
BWABRA
BFA
BDIKHM
CMR
CAF
TCD
CHL
CHNCOLCRI
CIV
CUB
DOM
ECU
EGYSLV
ETH
FJI
GAB
GMB
GEO
GHAGTM
GIN
GUY
HNDIND
IDNIRN
IRQ
JAM
JOR
KAZ
KEN
KGZ
LAO
LSO
LBR
LTUMKD
MDGMWIMYS
MDV
MLI
MHL
MEX
MDAMNG
MAR
NAM
NPL
NIC
NGA
PAK
PAN
PNGPRY
PERPHL
ROM
RWALCA
STP
SEN
SRB
SLE
ZAF
LKA
SDN
SUR
SWZ
SYR
TJK
TZA
THA
TON
TUR
UGA
UKR
UZB
VEN VNM
YEM
ZMBZWE
1.01.52.01
23
4
Hum
an C
apita
l in
Non
−A
gric
ultu
re
1 2 3 4
Human Capital in Agriculture
Gollin, Lagakos, & Waugh (2013) Agricultural Productivity Gap WB-GWU Conferrence 20 / 40

Quality Di�erences in Schooling
Rural schools often of lower quality than urban schools .(Williams, 2005; Zhang, 2006)
Potentially overestimate human capital among agriculture workers.
We use literacy data to adjust for schooling quality.
Gollin, Lagakos, & Waugh (2013) Agricultural Productivity Gap WB-GWU Conferrence 21 / 40

Uganda: Literacy by Years of Schooling Completed
!"
!#$"
!#%"
!#&"
!#'"
("
!" $" %" &" '" (!"
Lit
erac
y R
ate
Years of Schooling
)*)+,-".*/01/2" ,-".*/01/2"
Gollin, Lagakos, & Waugh (2013) Agricultural Productivity Gap WB-GWU Conferrence 22 / 40

Measuring Quality Di�erences in Schooling
Given literacy rates by years of schooling: `ni (s) and `ai (s) fors = 1, 2, ...
Assume that each year in rural school is worth γ years in urban school
For each country i , solve for γi that solves
minγ
s̄∑s=1
(˜̀ni (γs)− ˜̀a
i (s))2
where ˜̀ni (·), ˜̀a
i (·) are polynomial interpolations of `ni (·), `ai (·) fors ∈ [0, s̄].
Gollin, Lagakos, & Waugh (2013) Agricultural Productivity Gap WB-GWU Conferrence 23 / 40
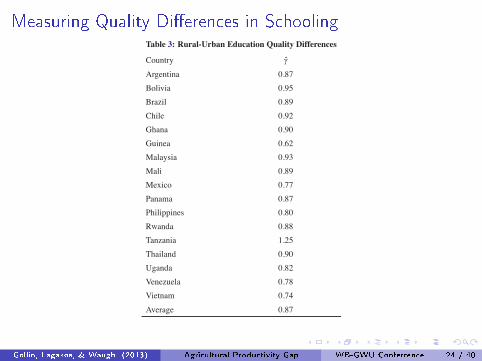
Measuring Quality Di�erences in SchoolingTable 3: Rural-Urban Education Quality Differences
Country γ̂
Argentina 0.87
Bolivia 0.95
Brazil 0.89
Chile 0.92
Ghana 0.90
Guinea 0.62
Malaysia 0.93
Mali 0.89
Mexico 0.77
Panama 0.87
Philippines 0.80
Rwanda 0.88
Tanzania 1.25
Thailand 0.90
Uganda 0.82
Venezuela 0.78
Vietnam 0.74
Average 0.87
shows a histogram of the ratio of cost of living in urban areas to rural areas. As can be seen in
Gollin, Lagakos, & Waugh (2013) Agricultural Productivity Gap WB-GWU Conferrence 24 / 40
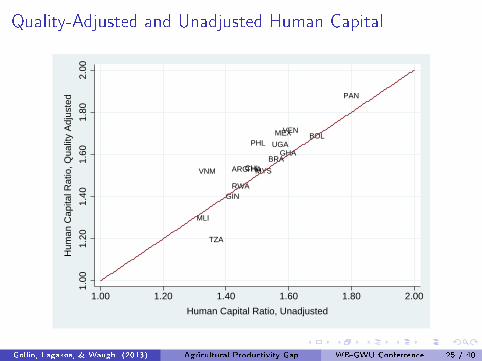
Quality-Adjusted and Unadjusted Human Capital
ARG
BOL
BRACHL
GHA
GIN
MYS
MLI
MEX
PAN
PHL
RWA
TZA
THA
UGA
VEN
VNM
1.00
1.20
1.40
1.60
1.80
2.00
Hum
an C
apita
l Rat
io, Q
ualit
y A
djus
ted
1.00 1.20 1.40 1.60 1.80 2.00
Human Capital Ratio, Unadjusted
Gollin, Lagakos, & Waugh (2013) Agricultural Productivity Gap WB-GWU Conferrence 25 / 40
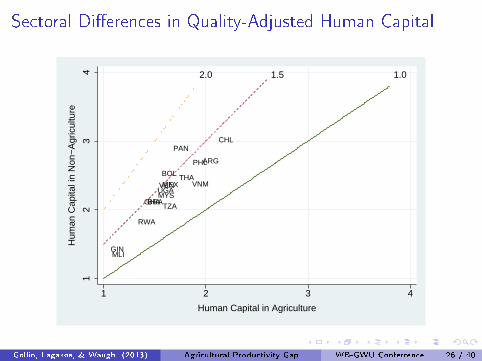
Sectoral Di�erences in Quality-Adjusted Human Capital
ARG
BOL
BRA
CHL
GHA
GIN
MYS
MLI
MEX
PAN
PHL
RWA
TZA
THA
UGAVEN VNM
1.01.52.01
23
4
Hum
an C
apita
l in
Non
−A
gric
ultu
re
1 2 3 4
Human Capital in Agriculture
Gollin, Lagakos, & Waugh (2013) Agricultural Productivity Gap WB-GWU Conferrence 26 / 40

Adjusting the Raw APG numbers
Recap:
Di�erences in hours worked contribute a factor of 1.2.
Di�erences in human capital contribute a factor of 1.4.
Now, put them all together and construct �adjusted� APGs.
Gollin, Lagakos, & Waugh (2013) Agricultural Productivity Gap WB-GWU Conferrence 27 / 40

Adjusted Agricultural Productivity Gaps
Measure Complete Data All Countries
5th Percentile 0.8 0.7
Median 2.2 1.9
Mean 2.1 2.1
95th Percentile 3.9 3.9
Number of Countries 50 113
Gollin, Lagakos, & Waugh (2013) Agricultural Productivity Gap WB-GWU Conferrence 28 / 40
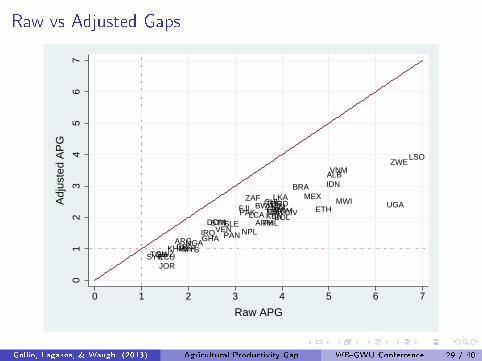
Raw vs Adjusted Gaps
ALB
ARG
ARM
BGD
BTNBOL
BWA
BRA
KHM
CHL
CRI
CIVDOM
ECU
ETHFJI
GHA
GTM
IDN
IRQ
JAM
JOR
KEN
LSO
LBRMWI
MYS
MEX
NPLNGA
PAK
PAN
PER
PHL
ROMLCASLE
ZAF LKA
SWZSYR
TZA
TON
TUR UGA
VEN
VNMZWE
01
23
45
67
Adj
uste
d A
PG
0 1 2 3 4 5 6 7
Raw APG
Gollin, Lagakos, & Waugh (2013) Agricultural Productivity Gap WB-GWU Conferrence 29 / 40

Comparing Macro and Micro Data on Sector Value Added
The idea:
Cross check �macro� value added data (from national accounts) with�micro� data from household income/expenditure surveys.
The data:
Use World Bank's Living Standards Measurement Surveys (LSMS)
Explicit goal of LSMS: household income and expenditure measures
Gollin, Lagakos, & Waugh (2013) Agricultural Productivity Gap WB-GWU Conferrence 30 / 40

Measuring Value Added from Micro Data
Agriculture:
VAa =∑i
ySEa,i +∑i
yLa,i +∑i
yKa,i ,
ySEa,i =J∑
j=1
pj
(xhomei ,j + xmarket
i ,j + x investi ,j
)− COSTSa,i ,
Non-agriculture:
VAn =∑i
ySEn,i +∑i
yLn,i +∑i
yKn,i ,
ySEn,i = REVn,i − COSTSn,i .
i = household and j = agriculture commodity.
Gollin, Lagakos, & Waugh (2013) Agricultural Productivity Gap WB-GWU Conferrence 31 / 40

Comparison of Macro and Micro APG
Agriculture Share of
Employment Value Added APG
Country Micro Macro Micro Macro Micro
Armenia (1996) 34.2 36.8 32.8 0.9 1.1
Bulgaria (2003) 14.1 11.7 18.4 1.2 0.7
Cote d'Ivoire (1988) 74.3 32.0 42.1 4.7 4.0
Guatemala (2000) 40.2 15.1 18.7 3.8 2.9
Ghana (1998) 53.9 36.0 33.3 2.2 2.3
Kyrgyz Republic (1998) 56.9 39.5 39.3 2.0 2.0
Pakistan (2001) 46.9 25.8 22.6 2.5 3.0
Panama (2003) 27.0 7.8 11.8 4.4 2.7
South Africa (1993) 11.0 5.0 7.0 2.3 1.7
Tajikistan (2009) 41.0 24.7 30.1 2.1 1.6Gollin, Lagakos, & Waugh (2013) Agricultural Productivity Gap WB-GWU Conferrence 32 / 40
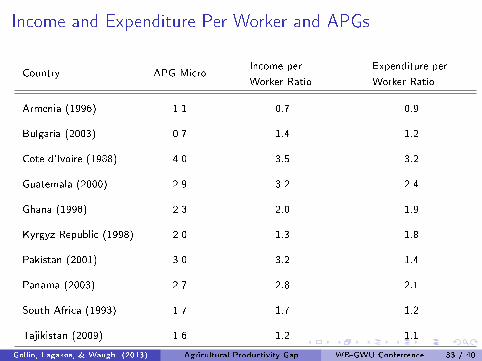
Income and Expenditure Per Worker and APGs
Country APG MicroIncome per
Worker Ratio
Expenditure per
Worker Ratio
Armenia (1996) 1.1 0.7 0.9
Bulgaria (2003) 0.7 1.4 1.2
Cote d'Ivoire (1988) 4.0 3.5 3.2
Guatemala (2000) 2.9 3.2 2.4
Ghana (1998) 2.3 2.0 1.9
Kyrgyz Republic (1998) 2.0 1.3 1.8
Pakistan (2001) 3.0 3.2 1.4
Panama (2003) 2.7 2.8 2.1
South Africa (1993) 1.7 1.7 1.2
Tajikistan (2009) 1.6 1.2 1.1
Gollin, Lagakos, & Waugh (2013) Agricultural Productivity Gap WB-GWU Conferrence 33 / 40
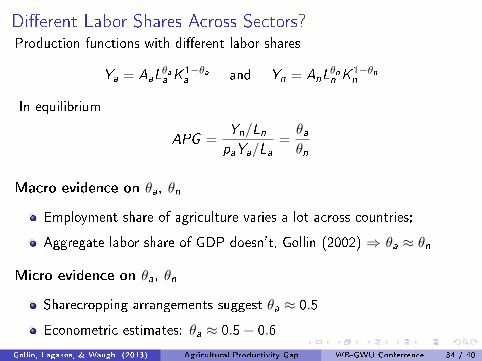
Di�erent Labor Shares Across Sectors?Production functions with di�erent labor shares
Ya = AaLθaa K 1−θa
a and Yn = AnLθnn K 1−θn
n
In equilibrium
APG =Yn/LnpaYa/La
=θaθn
Macro evidence on θa, θn
Employment share of agriculture varies a lot across countries;
Aggregate labor share of GDP doesn't, Gollin (2002) ⇒ θa ≈ θn
Micro evidence on θa, θn
Sharecropping arrangements suggest θa ≈ 0.5
Econometric estimates: θa ≈ 0.5− 0.6
Gollin, Lagakos, & Waugh (2013) Agricultural Productivity Gap WB-GWU Conferrence 34 / 40
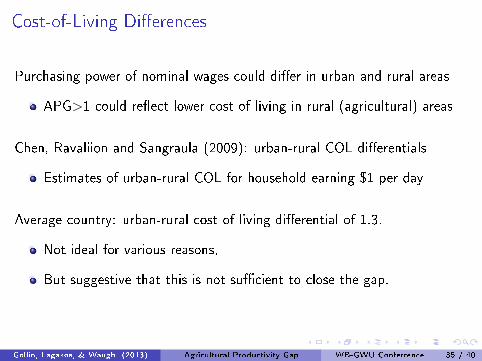
Cost-of-Living Di�erences
Purchasing power of nominal wages could di�er in urban and rural areas
APG>1 could re�ect lower cost of living in rural (agricultural) areas
Chen, Ravaliion and Sangraula (2009): urban-rural COL di�erentials
Estimates of urban-rural COL for household earning $1 per day
Average country: urban-rural cost of living di�erential of 1.3.
Not ideal for various reasons,
But suggestive that this is not su�cient to close the gap.
Gollin, Lagakos, & Waugh (2013) Agricultural Productivity Gap WB-GWU Conferrence 35 / 40

Cost-of-Living Di�erences
010
2030
Num
ber
of C
ount
ries
0.9 1.0 1.1 1.2 1.3 1.4 1.5 1.6 1.7 1.8
Urban/Rural Cost of Living
Gollin, Lagakos, & Waugh (2013) Agricultural Productivity Gap WB-GWU Conferrence 36 / 40
Conclusion
Typical developing country has large agricultural productivity gap
Better measurement reduces gap from around 4 to around 2
Large gaps also present in household survey data
Needed: better understanding of why residual gaps so large
Gollin, Lagakos, & Waugh (2013) Agricultural Productivity Gap WB-GWU Conferrence 37 / 40

Why are Residual Gaps So Large?
Yet more measurement error � Herrendorf and Schoellman (2011)
Selection of more productive workers out of agriculture� Lagakos and Waugh (2012)
Risk of migrating?� Harris and Todaro (1971), Bryan, Mubarak, Chowdhury (2011),others
Other disutility of urban areas (social alienation? crime? pollution?decline in relative social status?)� Dercon et al (2012)
Gollin, Lagakos, & Waugh (2013) Agricultural Productivity Gap WB-GWU Conferrence 38 / 40

Individual Hours Worked By Sector
Hours Worked: A Further Breakdown
Sector of Hours Worked
Country Worker Classi�cation Agriculture Non-agriculture
Cote d'Ivoire (1988) Agriculture 35.1 1.0
Non-agriculture 0.7 49.2
Ghana (1998) Agriculture 28.8 3.7
Non-agriculture 2.0 30.6
Guatemala (2000) Agriculture 47.6 1.3
Non-agriculture 0.8 49.1
Malawi (2005) Agriculture 26.4 1.4
Non-agriculture 2.3 38.2
Tajikistan (2009) Agriculture 39.5 0.1
Non-agriculture 0.1 39.3
Note: Workers are classi�ed by sector according to their primary sector of
employment. Hours are classi�ed by sector of job for each of the workers' jobs.Gollin, Lagakos, & Waugh (2013) Agricultural Productivity Gap WB-GWU Conferrence 39 / 40
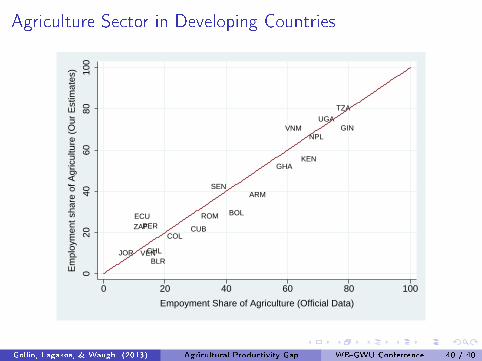
Agriculture Sector in Developing Countries
ARM
BLR
BOL
CHL
COLCUB
ECU
GHA
GIN
JOR
KEN
NPL
PERROM
SEN
ZAF
TZA
UGA
VEN
VNM
020
4060
8010
0
Em
ploy
men
t sha
re o
f Agr
icul
ture
(O
ur E
stim
ates
)
0 20 40 60 80 100
Empoyment Share of Agriculture (Official Data)
Gollin, Lagakos, & Waugh (2013) Agricultural Productivity Gap WB-GWU Conferrence 40 / 40


![PROMOTING INNOVATION IN DEVELOPING COUNTRIESsiteresources.worldbank.org/KFDLP/Resources/0-3097AubertPaper[1].pdf · PROMOTING INNOVATION IN DEVELOPING COUNTRIES: A CONCEPTUAL FRAMEWORK](https://img.pdfslide.net/doc/110x75/5e4fb44eeaf20704692ca61e/promoting-innovation-in-developing-co-1pdf-promoting-innovation-in-developing.jpg)


![fJi)uEZíg j s5 - OAK Centralcentral.oak.go.kr/repository/journal/13228/BBROBV_2014_v...^ t½{ v \ fJi)uEZíg j s5 \ fJu)fI Iv Eh]{ v \ fJi)uEz¡Z±uîue Zíg j s5u1gµf E\ tñ a`Ñu9ZéZu-sÝ[Yj](https://img.pdfslide.net/doc/110x75/5b1bc6487f8b9a1e258f280a/fjiuezig-j-s5-oak-t-v-fjiuezig-j-s5-fjufi-iv-eh-v-fjiuezzuiue.jpg)