Embed Size (px)
Citation preview

NBER WORKING PAPER SERIES
THE ALCHEMY OF CDO CREDIT RATINGS
Efraim BenmelechJennifer Dlugosz
Working Paper 14878http://www.nber.org/papers/w14878
NATIONAL BUREAU OF ECONOMIC RESEARCH1050 Massachusetts Avenue
Cambridge, MA 02138April 2009
This paper has being prepared for the Carnegie-Rochester conference series. We are grateful for commentsfrom Adam Ashcraft, Amit Seru, Andrei Shleifer, Jeremy Stein, The Editors (Marvin Goodfriend andBennett McCallum), and seminar participants at the Carnegie-Rochester November 2008 conference,Harvard University and the Stockholm Institute for Financial Research. We thank Shaunak Vankudre,Alex Radu, Daniel Oshima, and Akilah Crichlow for excellent research assistance. All remaining errorsare our own. The views expressed herein are those of the author(s) and do not necessarily reflect theviews of the National Bureau of Economic Research.
NBER working papers are circulated for discussion and comment purposes. They have not been peer-reviewed or been subject to the review by the NBER Board of Directors that accompanies officialNBER publications.
© 2009 by Efraim Benmelech and Jennifer Dlugosz. All rights reserved. Short sections of text, notto exceed two paragraphs, may be quoted without explicit permission provided that full credit, including© notice, is given to the source.

The Alchemy of CDO Credit RatingsEfraim Benmelech and Jennifer DlugoszNBER Working Paper No. 14878April 2009JEL No. G01,G24,G28
ABSTRACT
Collateralized Loan Obligations (CLOs) were one of the largest and fastest growing segments of thestructured finance market, fueling the 2003-2007 boom in syndicated loans and leveraged buyouts.The credit crisis brought CLO issuance to a halt, and as a result the leveraged loan market dried up.Similar to other structured finance products, investors in CLOs rely heavily on credit rating providedby the rating agencies, yet little is known about CLO rating practices. This paper attempts to fill thatgap. Using novel hand-collected data on 3,912 tranches of Collateralized Loan Obligations (CLO)we document the rating practices of CLOs and analyze their existing structures.
Efraim BenmelechHarvard UniversityDepartment of EconomicsLittauer 233Cambridge, MA 02138and [email protected]
Jennifer DlugoszHarvard UniversityDepartment of Economics and HBSLittauer 233Cambridge, MA [email protected]
Benmelech and Dlugosz: The Alchemy of CDO Credit Ratings
2
1. Introduction
Collateralized Loan Obligations (CLOs) are Collateralized Debt Obligations (CDOs)
backed predominantly by loans. CLOs played a key role in financing billions of dollars of private
equity firms’ leveraged buyouts around the world. As of 2006, Standard & Poor’s Loan
Syndications and Trading Association (S&P LSTA) estimated that structured investment
vehicles like CLOs represented 60% of institutional participation in the syndicated loan market.
The influx of capital from these investment vehicles was so extraordinary that the amount of
capital committed to private equity in 2006 and 2007 reached record levels, surpassing the
leverage buyout wave of the late 1980s (Kaplan and Stromberg (2008)). However, following the
subprime mortgage crisis, investors lost confidence in structured finance credit ratings and CLO
issuance virtually dried up. CLO issuance in the first quarter of 2008 was down 85% from the
previous year’s level.3 Leveraged loan originations followed suit, falling 74% in the first quarter
of 2008 compared to same period in 2007. Leverage buyout (LBO) lending slowed down to a
near standstill in 2008 with issuance levels being the lowest in almost a decade. The rise and fall
(and potential resurrection) of the CLO market has important implications for private equity and
leveraged loans lending.
One important aspect of structured finance markets in general, and of the CLO market in
particular, is the extent to which investor demand is driven by credit ratings. CDOs contain
hundreds of underlying assets and modeling the payoffs to these securities requires sophisticated
cash flow models. Investors rely on credit ratings as a focal point, yet there is little public
information on how these ratings are calculated, and how ratings on CDO securities relate to the
underlying collateral quality. While there is a growing body of literature that studies the credit
3 SIFMA Global CDO Issuance Tables: http://www.sifma.org/research/pdf/CDO_Data2008-Q4.pdf
Benmelech and Dlugosz: The Alchemy of CDO Credit Ratings
3
ratings of residential-mortgage backed securities and CDOs,4 less is known about the credit
ratings of CLOs. Our paper attempts to fill this gap by studying the relation between CLO credit
ratings and the quality of the underlying collateral backing these securities. Using novel hand-
collected data on 3,912 tranches of collateralized loan obligations (CLOs) we document the
structure of CLO tranches and the credit quality of the underlying collateral supporting these
tranches.
Collateralized Loan Obligations are interesting for several reasons. CLOs are the second
largest segment of the CDO market, accounting for 30% of the dollar volume of securities
issued.5 While CLOs have not yet suffered downgrades or impairments as dramatic as those
experienced by asset-backed CDOs and mortgage-backed securities, there is concern that the
deepening recession may lead to deterioration in the credit quality of CLOs portfolios. We
provide detailed information on underlying structures of CLOs to further the understanding of
these securities, their structures, and credit ratings.
Similar to other structured finance products, a large fraction of the securities issued by
CLOs are AAA rated. 70.7% of the value of securities issued by CLOs in our sample is rated
AAA. Excluding unrated equity tranches, AAA tranches account for 79.2% of the dollar value
of securities issued. In contrast to mortgage-backed securities, the assets in the collateral pools of
CLOs are rated on the same scale as the liabilities, which facilitates an examination of the credit
enhancement achieved through structuring. There is a large gap between the rating of CLO
tranches and the credit quality of the underlying assets supporting these tranches. We find that
85% of the CLOs in our sample have collateral pools with a weighted average credit rating of B,
8% have a weighted average credit rating of BB, and for 7% the information is missing. We use 4 See for example, Ashcraft and Schuermann (2008), Coval, Jurek, and Stafford (2008a) Coval, Jurek, and Stafford (2008b), and Mason and Rosner (2007). 5 Between 2005-2008, only structured finance CDOs (CDOs backed by structured securities like RMBS, ABS, other CDOs, or CDS) accounted for a larger share of issuance (56%). See SIFMA Global CDO Issuance statistics.
Benmelech and Dlugosz: The Alchemy of CDO Credit Ratings
4
the term “alchemy” to describe the mismatch between the credit ratings of CLO securities and
the credit quality of the underlying collateral. We also document a large degree of uniformity
among cash-flow CLOs; 63% of the CLOs in our sample had one of four major liability
structures or deal types. Moreover, there is very little variation in the required composition of the
collateral pools in the CLOs. We speculate that the uniformity of CLO structures is driven by a
boiler-plate model that was used to rate CLOs targeting the highest possible credit rating at the
lowest cost, while catering to investor demand.
The rest of our paper is organized as follows. In Section 2 we describe the market for
CDOs, presenting statistics on global issuance and the economic motivation for CDO issuance.
Section 3 describes our data. Section 4 presents our empirical analysis of the structure of CDOs
and their credit ratings. Section 5 discusses the demand for highly rated structured products
tranches. Section 6 concludes.
2. The Market for Collateralized Debt Obligations
Collateralized debt obligations (CDOs) are special-purpose vehicles that buy portfolios of
assets and issue securities backed by the cash flows from those assets. The collateral assets, in
turn, are sold to a special-purpose entity, often located in the Cayman Islands or Ireland, to
ensure bankruptcy remoteness from the issuer. While the first CDOs were created in the 1980s,
global issuance remained low, under $100 billion annually, until the mid-1990s.6 Since 2002,
CDOs have been the fastest growing sector of the asset-backed securities market.
2.1. The Economics of CDOs
6 See Fabozzi (2006), p. 3.
Benmelech and Dlugosz: The Alchemy of CDO Credit Ratings
5
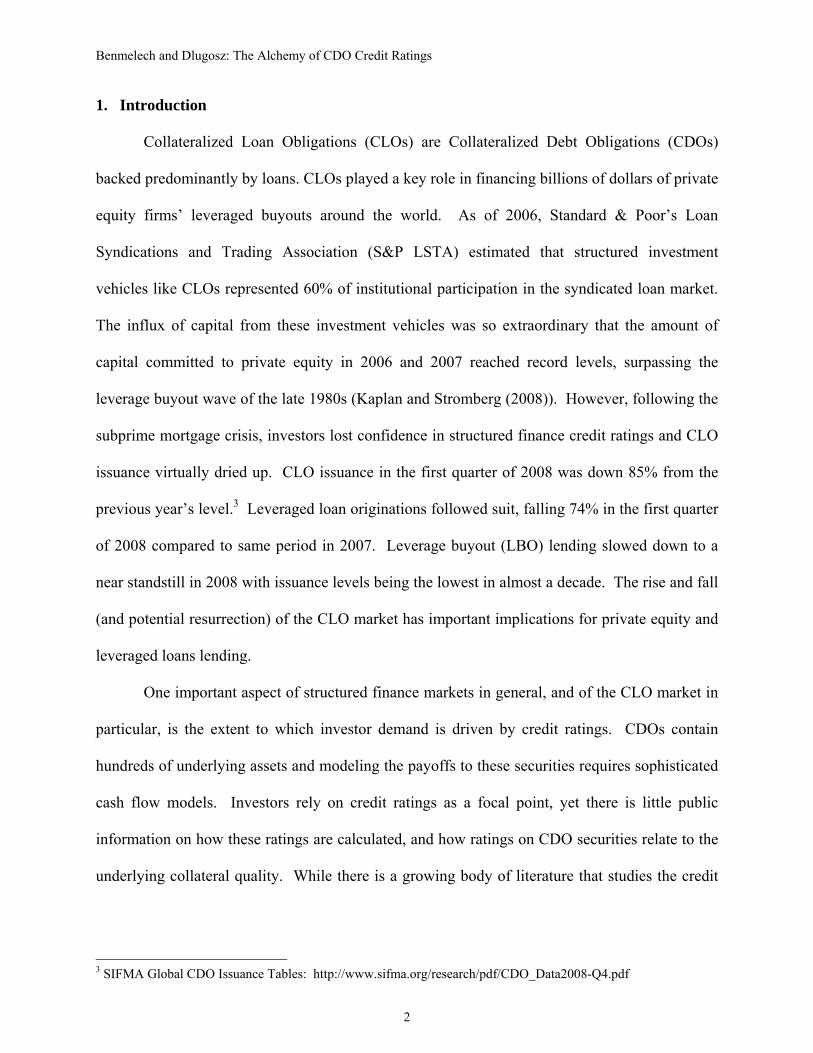
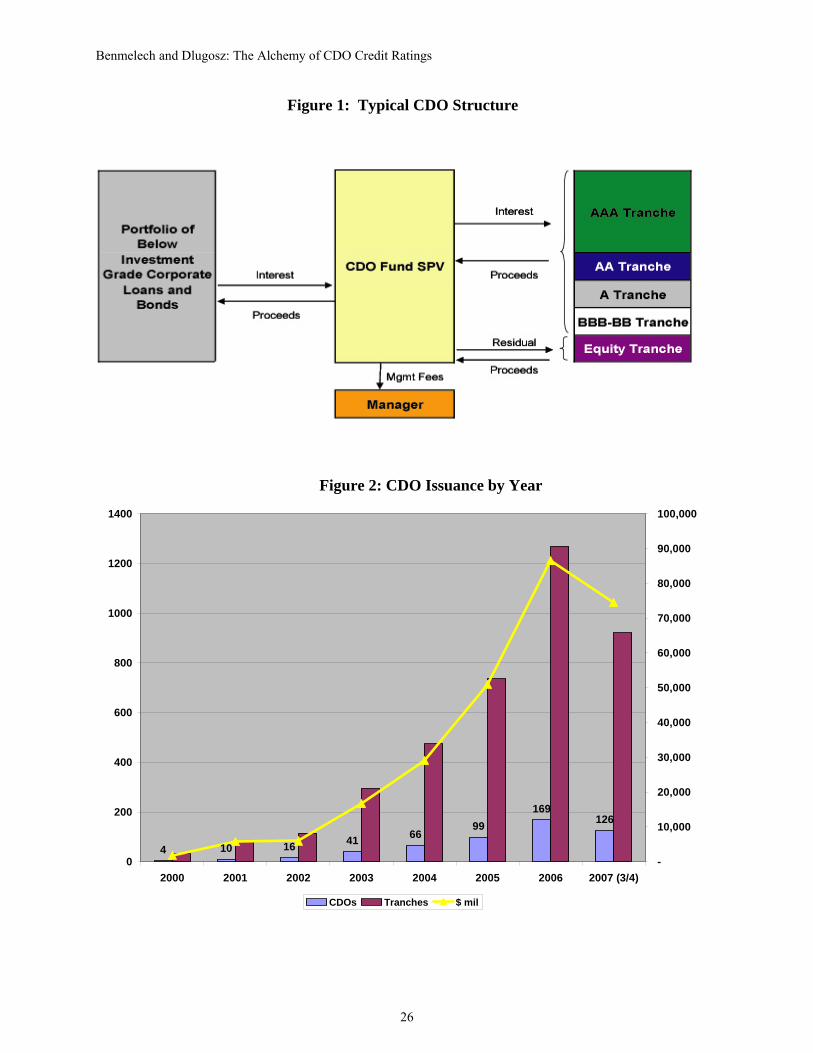
The defining feature of CDOs and CLOs is their multi-tiered liability structure (see
Figure 1). CDOs and CLOs issue multiple classes of financial claims with differing levels of
seniority against diversified pool of assets. When assets in the collateral pool miss payments or
default, subordinate tranches absorb losses first. More senior tranches only suffer losses once the
cushion below them has been depleted.
The process of pooling of assets achieves diversification as long as the assets are not
perfectly correlated, while structuring of tranches with different levels of seniority reallocates
risk across different securities. In a Modigliani-Miller world with perfect markets, there would
be no benefit to this kind of repackaging by tranching, however in the presence of various market
imperfections, gains from tranching may exist. DeMarzo (2005) lists three types of market
frictions that are important in explaining securitization: (i) transactions costs, (ii) market
incompleteness, and (iii) asymmetric information. According to DeMarzo and Duffie (1999) and
DeMarzo (2005), asymmetric information plays a key role in explaining the existence of
tranched securities. DeMarzo (2005) notes that market incompleteness cannot explain the
existence of pass-through pools or most CLOs because they do not augment the span of tradeable
claims; additionally, transactions costs explain why pooling is valuable but not tranching.
DeMarzo (2005) presents a model of a financial intermediary that would like to sell assets about
which it has superior information. When the number of assets is large and their returns are
imperfectly correlated, the intermediary maximizes his revenue from the sale by pooling and
tranching, as opposed to simply pooling or selling the assets individually. Similar to the intuition
in Myers and Majluf (1984), tranching allows the intermediary to concentrate the default risk in
one part of the capital structure, resulting in a large share of the liabilities being almost riskless
which in turn reduces the overall lemons discount that buyers demand. In order to create a large
share of safe securities from a pool of very risky assets the issuer of a typical CLO needs to
Benmelech and Dlugosz: The Alchemy of CDO Credit Ratings
6
enhance the creditworthiness of the most senior tranches of the deal. We illustrate the credit
enhancement mechanisms in CLOs using a representative deal in the next subsection.
2.2 CLO Structure and Credit Enhancement: A Representative Deal
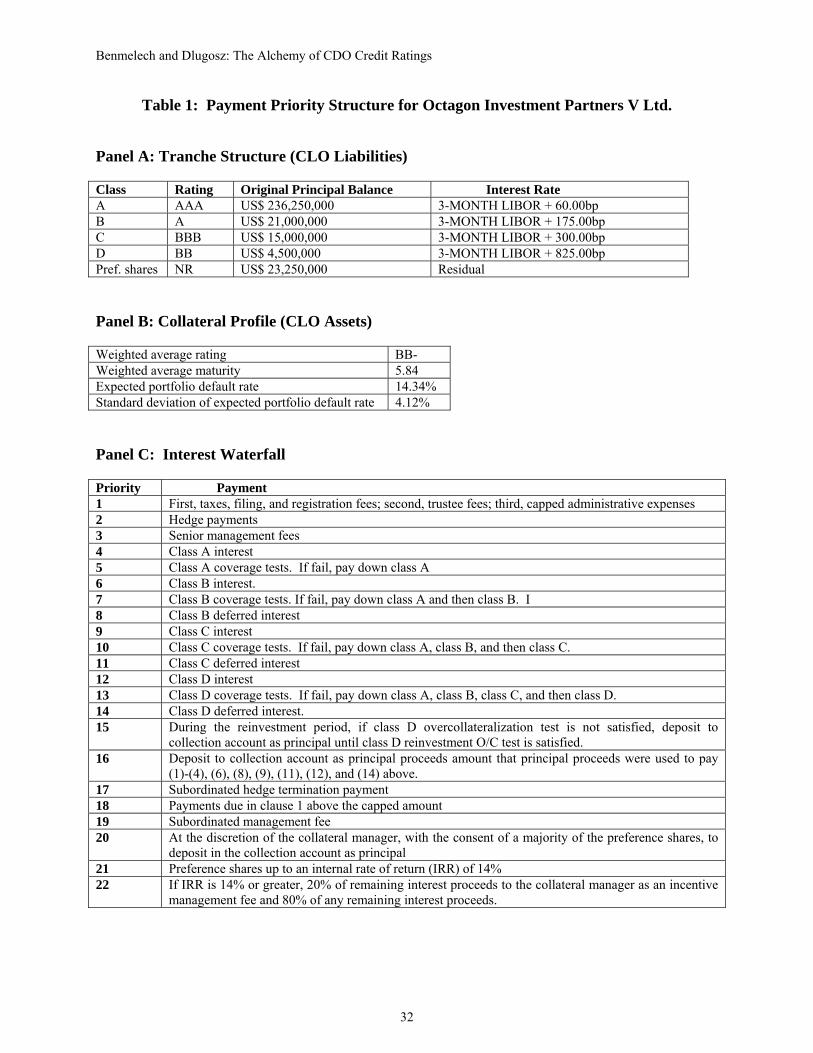
Table 1 illustrates the sources of credit enhancement in CLOs and the transformation of
B-rated loans into AAA securities using a representative deal from our sample, Octagon
Investment Partners V Ltd. Octagon Investment Partners V was a $300 million deal that closed
on January 14, 2003, with a portfolio consists primarily of non-investment grade loans as well as
a limited amount of high-yield bonds and structured finance securities.7 The weighted average
rating of the underlying collateral is BB-. The CLO financed the purchase of these assets with a
mix of tranched liabilities: out of which 79% is AAA, 7% A, 5% BBB, 2% BB, and 8% unrated.
There are several sources of credit enhancement in CLO structures, which support the
creation of investment grade claims backed by speculative grade assets: (a) diversification (b)
overcollateralization and subordination (c) excess spread, and (d) the active management of the
pool. The collateral guidelines of Octagon V indicate that the manager must maintain a
minimum level of diversification in his portfolio. The maximum allowable concentration in
securities from a single issuer is 2% ($6 million).8 When losses do occur, investors in the higher-
rated tranches are insulated from loss by the tranches subordinate to them. All of the rated
noteholders benefit from the ‘overcollateralization’ provided by the equity tranche. Octagon V
purchased assets with an aggregate principal balance of $300 million, issuing $276.75 million
worth of rated notes. The difference, $23.25 million (8%) of the asset purchase, was financed by
equity investors in the deal, who receive payments from interest and principal cash flows only
7 Although 50% of deals in our sample were issued between 2004 and 2006, we describe a deal from 2003 because information about the spread on assets in the CLO portfolio is largely missing from S&P reports after 2003. 8 Many deals also limit concentration within an industry to 8-12% of the portfolio, although this deal does not have that requirement.
Benmelech and Dlugosz: The Alchemy of CDO Credit Ratings
7
after rated noteholders have been paid. Additionally, investors in the senior tranches of Octagon
V are protected from loss by the mezzanine tranches of the deal. In Octagon V, 21% of the
capital structure serves as a cushion against loss for those investors.
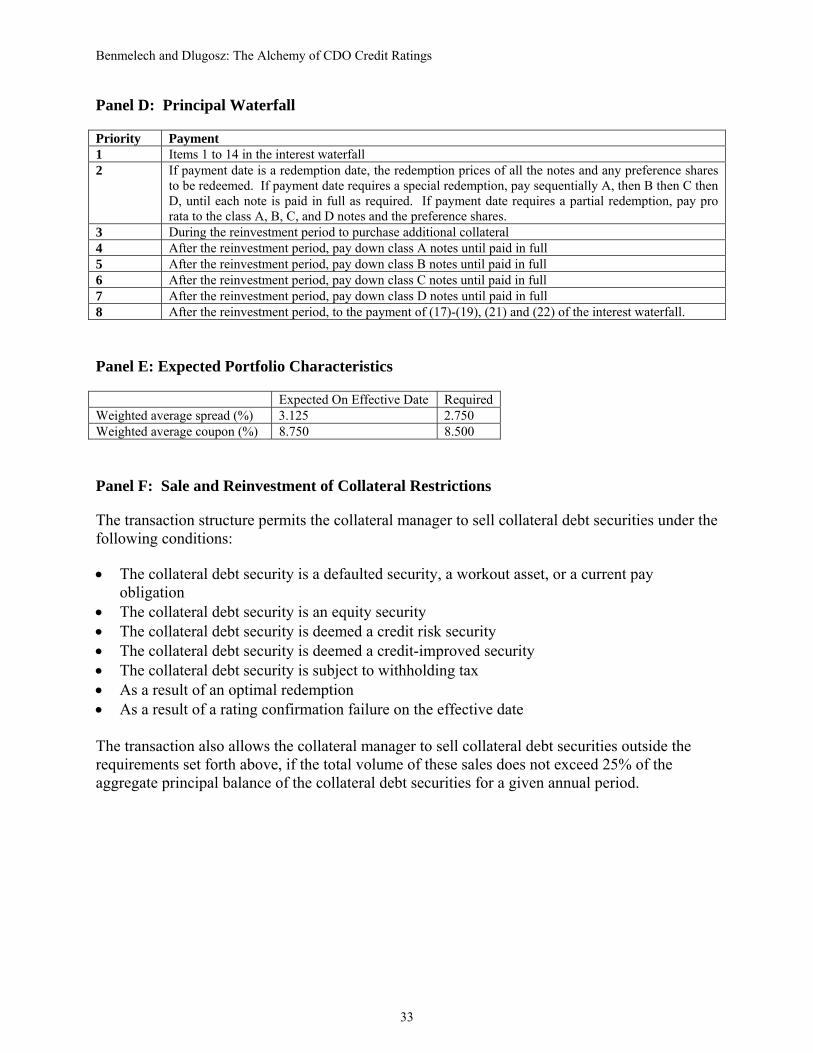
In cash-flow CLOs, subordination is achieved by distributing cash flows from the assets
to investors in order of seniority. Panels C and D of Table 1 show the ‘waterfalls’ that govern
how interest and principal cash flows from the collateral are allocated to investors in the deal.
After taxes and administrative fees have been paid, interest receipts are used to pay CLO
investors in the most senior class, A. As long as par coverage and interest coverage ratios meet
their required levels (specified in the CLO indenture), interest flows down the capital structure to
the next most senior class, B.9 If the ratios are not met, proceeds must be used to pay down class
A, and restore compliance before subordinate investors receive any payments. Preferred
shareholders collect the residual interest after all the classes senior to them have been paid. In
Octagon V, the manager has an incentive to make sure that the equityholders will receive a
minimum IRR of 14% because his incentive fee is conditional on it.10
Another source of credit enhancement is excess spread. The weighted average spread on
a CLO’s assets typically exceeds the weighted average spread on its liabilities. In Octagon V,
the weighted average spread on the assets expected at the time the portfolio is fully ramped is
3.125%11 (Table 1, Panel E) while the weighted average spread on its liabilities is 87 basis points
(Table 1, Panel A). Expected excess spread at the time of deal close is 2.26%. The deal requires
the manager to maintain a minimum weighted average spread on assets of 2.75%, or excess
spread of at least 1.88%. Octagon V, like most CLOs, is a revolving deal. The notes issued by
9 Par coverage for a class = [total par of collateral assets + cash + defaulted securities at lower of MV or recovery] / [par value of securities outstanding in class & all classes senior]; Interest coverage for a class = [interest received during period + net swap payments]/[total amount of interest payable on the tranche] 10 Not all structures have this feature. Another common setup is, after the interest-paying classes have been paid, the manager takes 50% of the residual as an incentive fee and the rest goes to equity. 11 This calculation assumes 100% of the portfolio assets are floating rate for simplicity, although 10% of the portfolio can be fixed rate securities.
Benmelech and Dlugosz: The Alchemy of CDO Credit Ratings
8
the CLO mature in November 2014. For the first five years of the deal (the ‘reinvestment
period’), the manager may use principal proceeds to reinvest in additional assets; after the
reinvestment period, proceeds must be used to pay down notes. During the reinvestment period,
the manager may also engage in limited trading, under certain conditions (Table 1, Panel F).
Octagon V’s manager can trade assets that decline or improve in credit quality and may also
make discretionary sales, as long as those sales do not exceed 25% of the aggregate principal
balance of the portfolio.12 After sales and purchases, the issuer must run Standard & Poor’s
CDO Monitor to confirm that the portfolio satisfies coverage tests (overcollateralization and
interest coverage limits by tranche) and collateral quality tests (portfolio concentration limits,
weighted average spread tests, etc). If, at any point, overcollateralization or interest coverage
tests are not satisfied, investors in the rated notes may force redemption in order of seniority.
Octagon V also provides the issuer with the option to redeem the notes in full after a three-year
non-call period, subject to the approval of more than 50% of the preferred shareholders
2.3. Collateralized Debt Obligation Types and Issuer Motivation
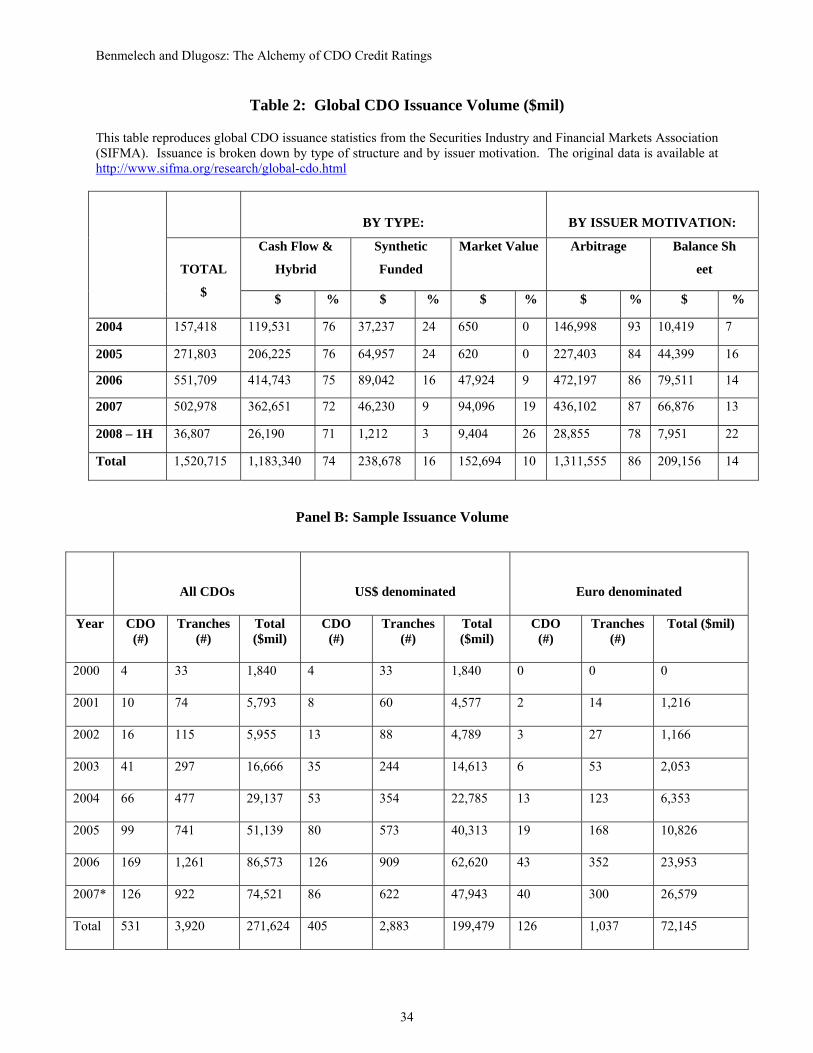
Table 2 presents summary statistics on global issuance of al types of CDOs for the period 2004-
2008.13 Issuance is broken down by type of structure and by issuer motivation. There are three
main types of CDO structures: (i) cash-flow, (ii) synthetic, and (iii) market-value. Cash-flow
structures are the most common (74%), with synthetic (14%) and market-value (10%) structures
accounting for a much smaller share of issuance. A cash-flow CDO issues notes to investors
and uses the proceeds to invest in primary financial assets such as loans, mortgages, bonds, etc.
As interest and principal are generated by the underlying collateral, proceeds are distributed to
12 A 25% limit for discretionary sales is relatively high; most CLOs limit this to 10-15% of the aggregate principal balance. 13 The information in Table 2 is reproduction of data from the Securities Industry and Financial Markets Association (SIFMA) and Thomson Financial reports.
Benmelech and Dlugosz: The Alchemy of CDO Credit Ratings
9
the CDO investors in a pre-specified way, in order of seniority. In contrast, synthetic CDOs
obtain their credit exposure through derivatives contracts instead of assets purchases. A
synthetic CDO issues notes to investors, invests the proceeds in risk-free securities, and enters
into a series of credit default swaps (selling protection). Investors in a synthetic CDO receive
periodic payments from swap premiums, and their principal is written down if the reference
entities on the swaps default.14 Market-value CDOs account for a growing share of the market.
They are similar to cash-flow CDOs except the amount of liabilities the CDO can issue is
determined by advance rates for each asset in the pool and collateral is marked-to-market
frequently. When the liabilities outstanding exceed the advance rates, the manager must sell
collateral and pay down notes until compliance is restored. While cash-flow CDOs can alter the
credits in their collateral pools, trading is less frequent in cash-flow CDOs than in a market-
value CDO.15
Table 2 also decomposes CDO issuance by issuer motivation. 86 percent of CDOs issued
from 2004 through the first half of 2008 were arbitrage-motivated, rather than balance-sheet
motivated. Arbitrage CDOs are typically sponsored by an investment manager or hedge fund
that acquires assets on the open market and packages them into a CDO to earn management fees
on the deal. Balance-sheet CDOs are motivated by a financial institution’s desire to achieve
relief from regulatory capital requirements or to free up capital for lending. Balance-sheet
issuers are typically lending institutions. The arbitrage versus balance-sheet label is provided to
Thomson Financial by the underwriter. We were unable to get any further details from Thomson
about how the distinction is made, but an examination of the transactions labeled as balance-
14 In contrast, investors in an unfunded synthetic CDO do not make any upfront payments. The CDO enters into default swaps and investors are required to post funds on-demand when reference entities default. 15 Most managed cash-flow CDOs limit trading to certain types of securities (e.g. – defaulted securities, credit-risk securities for which the mark has widened by 100bp) and/or limit discretionary trading to 10-20% over the life of the CDO or annually.
Benmelech and Dlugosz: The Alchemy of CDO Credit Ratings
10
sheet deals by S&P reveals that these transactions typically contain assets from a single
originator.
3. Data and Sample Construction
Collateralized Loan Obligations are largely sold in private markets (registered under 144A or
Reg S), hence data on their structures is not publicly available. The SDC Platinum New Issues
database tracks issuance in these markets but assembling a sample of CDOs from these data is
difficult due to inconsistencies in SDC’s classification of CDOs.16 Moreover, SDC Platinum only
provides information on the liability side of the CDO (the notes that have been issued), but does
not contain detailed information about the underlying collateral that supports the notes.
3.1. Sample Construction
We construct our sample of CLOs using Standard & Poor’s RatingsDirect database, by
hand-collecting micro-level data on the structure of a large sample of CLOs. The S&P data
allows us to observe both the asset side and the liability side of a CLO, in addition to a host of
information about the ratings decision. RatingsDirect provides real-time access to S&P’s credit
research and ratings for currently-rated fixed income securities. At the time we gathered the data,
October 2007, the database contained 3,237 CLOs (1,704 cash-flow, 970 synthetic, and 563
market-value or hybrids). We focus on cash-flow CLOs for which the collateral is primarily
corporate loans. There are 744 such transactions in the database, comprising 44% of cash-flow
CLOs and 23% of all CLOs by number. This is the largest single category of CDO in Ratings
Direct, by number.
16 For example, SDC alternatively labels CDO tranches as floating rate notes, collateral bonds, preferred shares, and collateralized loan obligations.
Benmelech and Dlugosz: The Alchemy of CDO Credit Ratings
11
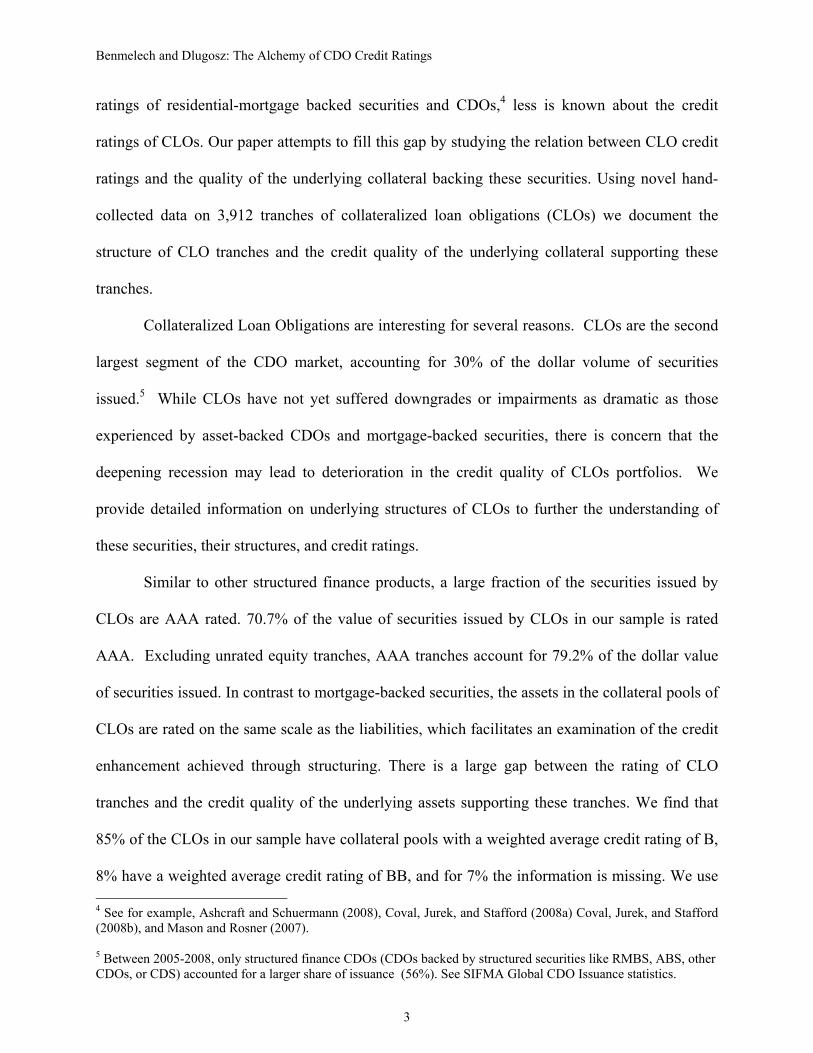
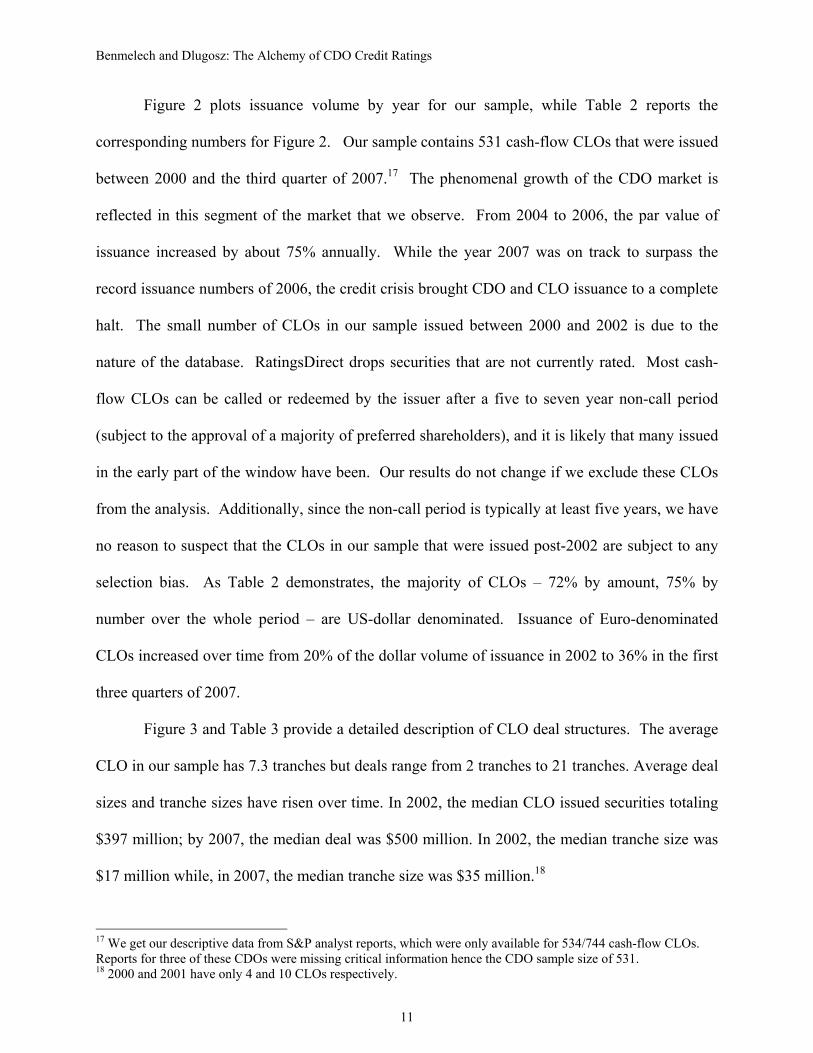
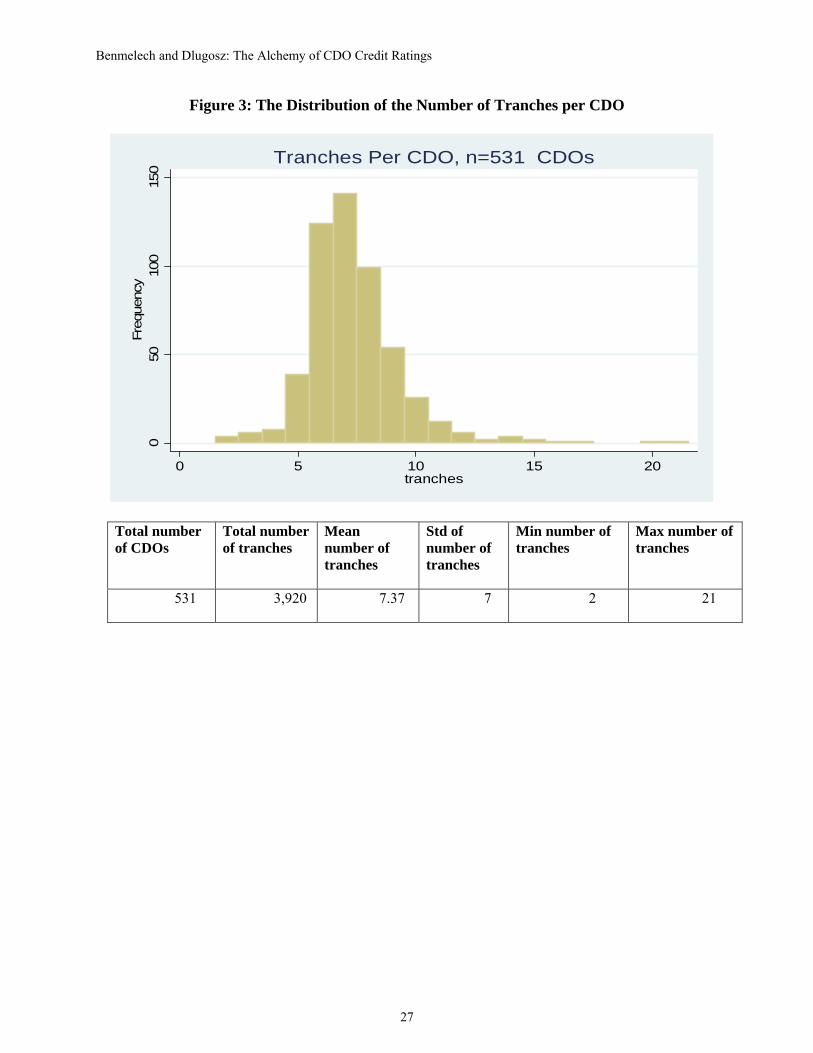
Figure 2 plots issuance volume by year for our sample, while Table 2 reports the
corresponding numbers for Figure 2. Our sample contains 531 cash-flow CLOs that were issued
between 2000 and the third quarter of 2007.17 The phenomenal growth of the CDO market is
reflected in this segment of the market that we observe. From 2004 to 2006, the par value of
issuance increased by about 75% annually. While the year 2007 was on track to surpass the
record issuance numbers of 2006, the credit crisis brought CDO and CLO issuance to a complete
halt. The small number of CLOs in our sample issued between 2000 and 2002 is due to the
nature of the database. RatingsDirect drops securities that are not currently rated. Most cash-
flow CLOs can be called or redeemed by the issuer after a five to seven year non-call period
(subject to the approval of a majority of preferred shareholders), and it is likely that many issued
in the early part of the window have been. Our results do not change if we exclude these CLOs
from the analysis. Additionally, since the non-call period is typically at least five years, we have
no reason to suspect that the CLOs in our sample that were issued post-2002 are subject to any
selection bias. As Table 2 demonstrates, the majority of CLOs – 72% by amount, 75% by
number over the whole period – are US-dollar denominated. Issuance of Euro-denominated
CLOs increased over time from 20% of the dollar volume of issuance in 2002 to 36% in the first
three quarters of 2007.
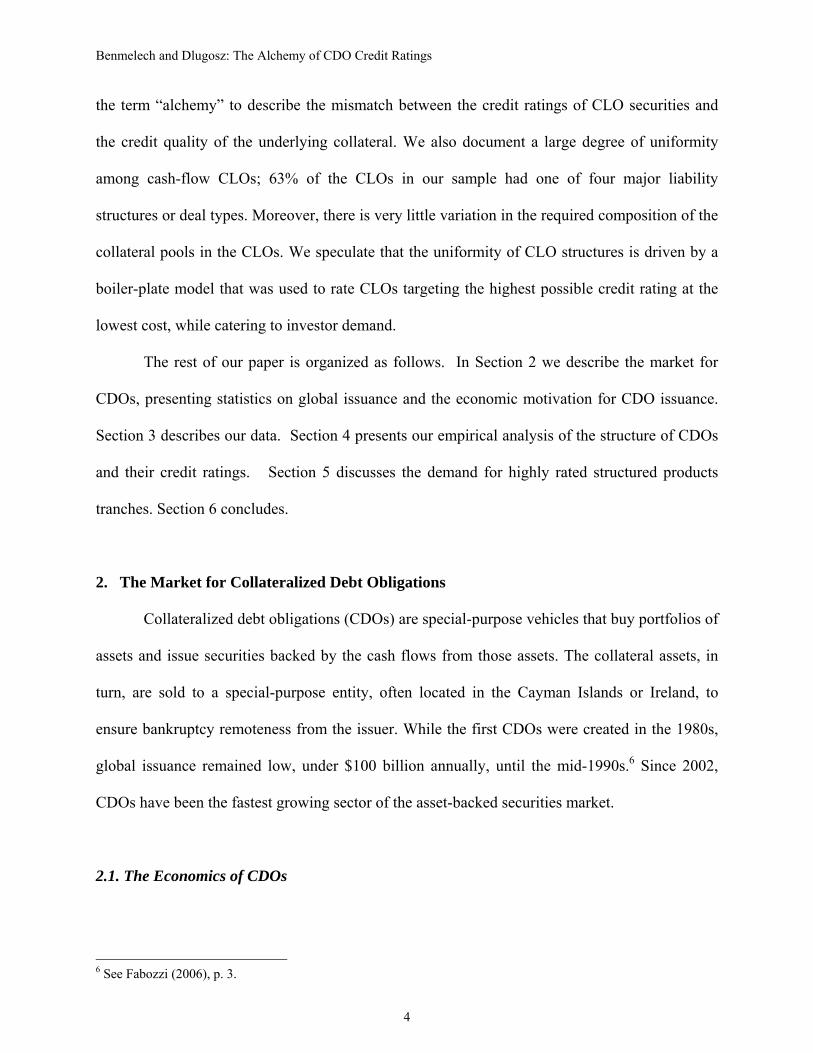
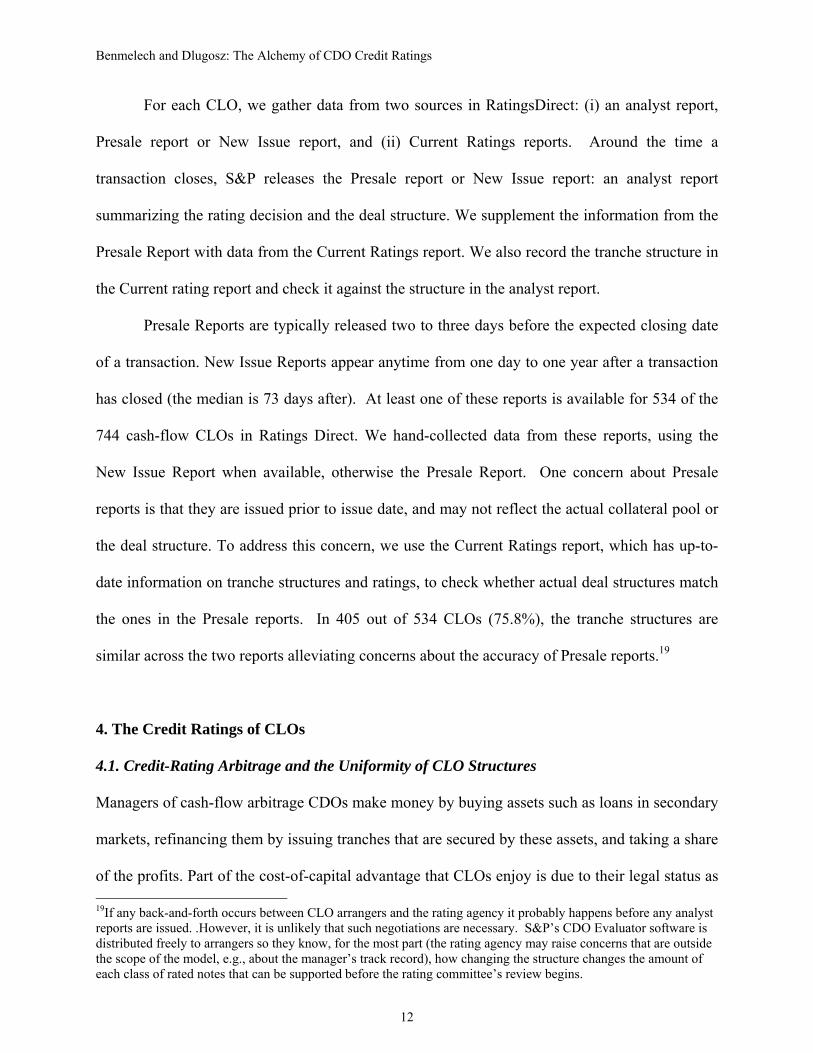
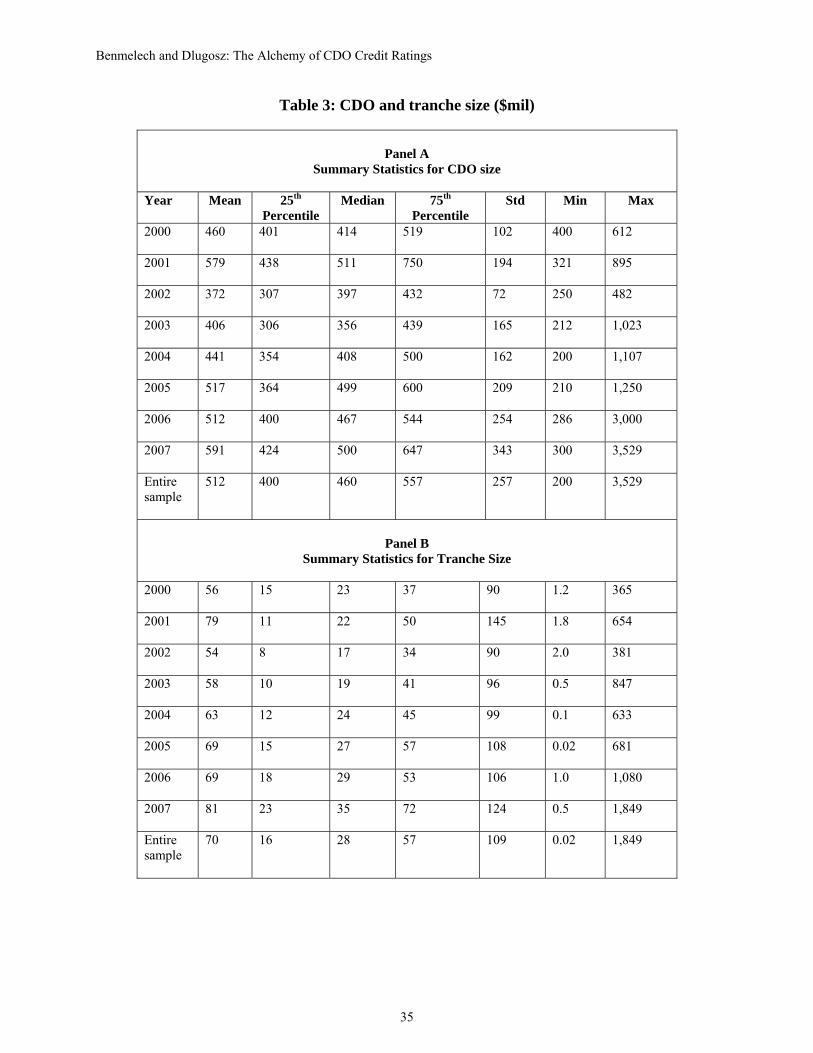
Figure 3 and Table 3 provide a detailed description of CLO deal structures. The average
CLO in our sample has 7.3 tranches but deals range from 2 tranches to 21 tranches. Average deal
sizes and tranche sizes have risen over time. In 2002, the median CLO issued securities totaling
$397 million; by 2007, the median deal was $500 million. In 2002, the median tranche size was
$17 million while, in 2007, the median tranche size was $35 million.18
17 We get our descriptive data from S&P analyst reports, which were only available for 534/744 cash-flow CLOs. Reports for three of these CDOs were missing critical information hence the CDO sample size of 531. 18 2000 and 2001 have only 4 and 10 CLOs respectively.
Benmelech and Dlugosz: The Alchemy of CDO Credit Ratings
12
For each CLO, we gather data from two sources in RatingsDirect: (i) an analyst report,
Presale report or New Issue report, and (ii) Current Ratings reports. Around the time a
transaction closes, S&P releases the Presale report or New Issue report: an analyst report
summarizing the rating decision and the deal structure. We supplement the information from the
Presale Report with data from the Current Ratings report. We also record the tranche structure in
the Current rating report and check it against the structure in the analyst report.
Presale Reports are typically released two to three days before the expected closing date
of a transaction. New Issue Reports appear anytime from one day to one year after a transaction
has closed (the median is 73 days after). At least one of these reports is available for 534 of the
744 cash-flow CLOs in Ratings Direct. We hand-collected data from these reports, using the
New Issue Report when available, otherwise the Presale Report. One concern about Presale
reports is that they are issued prior to issue date, and may not reflect the actual collateral pool or
the deal structure. To address this concern, we use the Current Ratings report, which has up-to-
date information on tranche structures and ratings, to check whether actual deal structures match
the ones in the Presale reports. In 405 out of 534 CLOs (75.8%), the tranche structures are
similar across the two reports alleviating concerns about the accuracy of Presale reports.19
4. The Credit Ratings of CLOs
4.1. Credit-Rating Arbitrage and the Uniformity of CLO Structures
Managers of cash-flow arbitrage CDOs make money by buying assets such as loans in secondary
markets, refinancing them by issuing tranches that are secured by these assets, and taking a share
of the profits. Part of the cost-of-capital advantage that CLOs enjoy is due to their legal status as 19If any back-and-forth occurs between CLO arrangers and the rating agency it probably happens before any analyst reports are issued. .However, it is unlikely that such negotiations are necessary. S&P’s CDO Evaluator software is distributed freely to arrangers so they know, for the most part (the rating agency may raise concerns that are outside the scope of the model, e.g., about the manager’s track record), how changing the structure changes the amount of each class of rated notes that can be supported before the rating committee’s review begins.
Benmelech and Dlugosz: The Alchemy of CDO Credit Ratings
13
special-purpose entities,20 but most of it is the result of structuring, which produces highly-rated
securities. As their name suggests, cash-flow arbitrage CLOs exploit credit-rating arbitrage; in
the process of pooling and tranching, low-rated securities are transformed into highly rated
tranches.
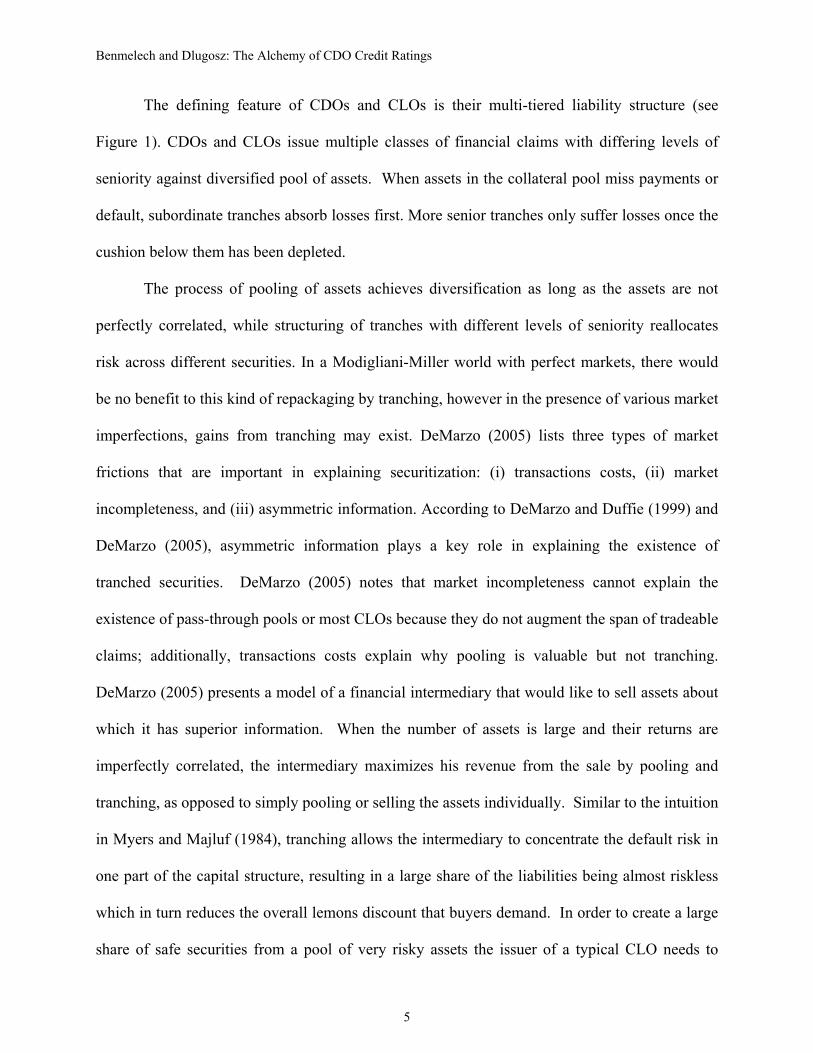
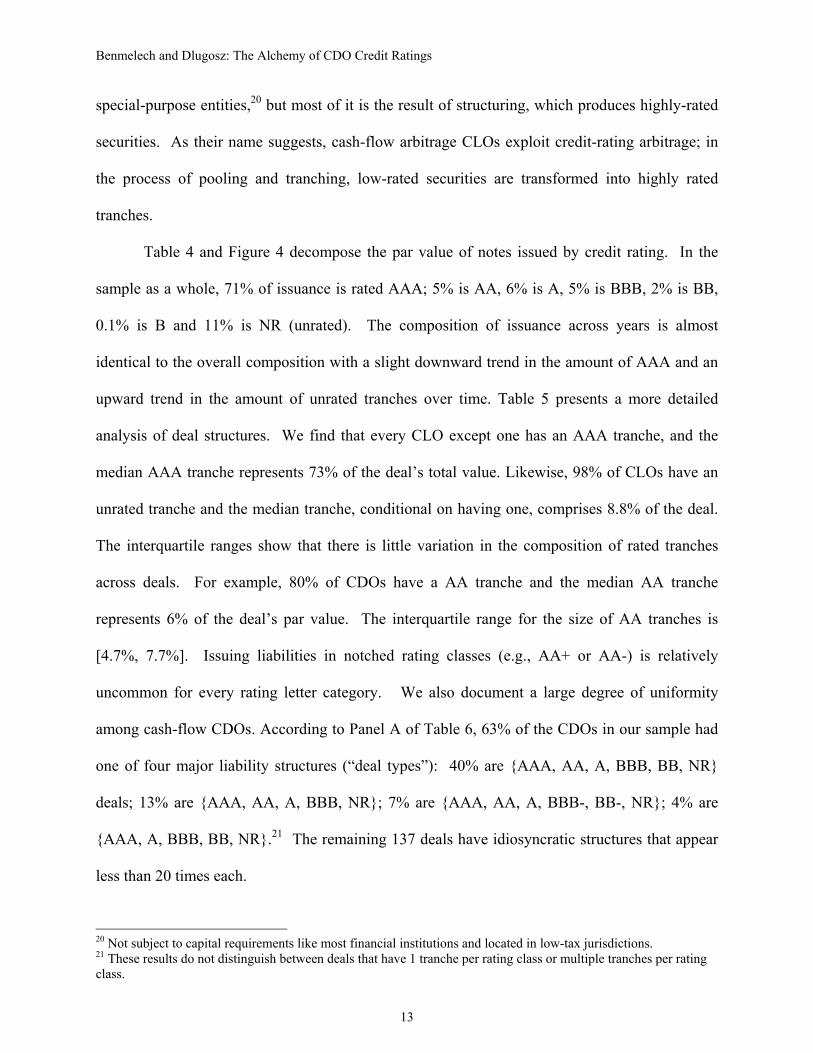
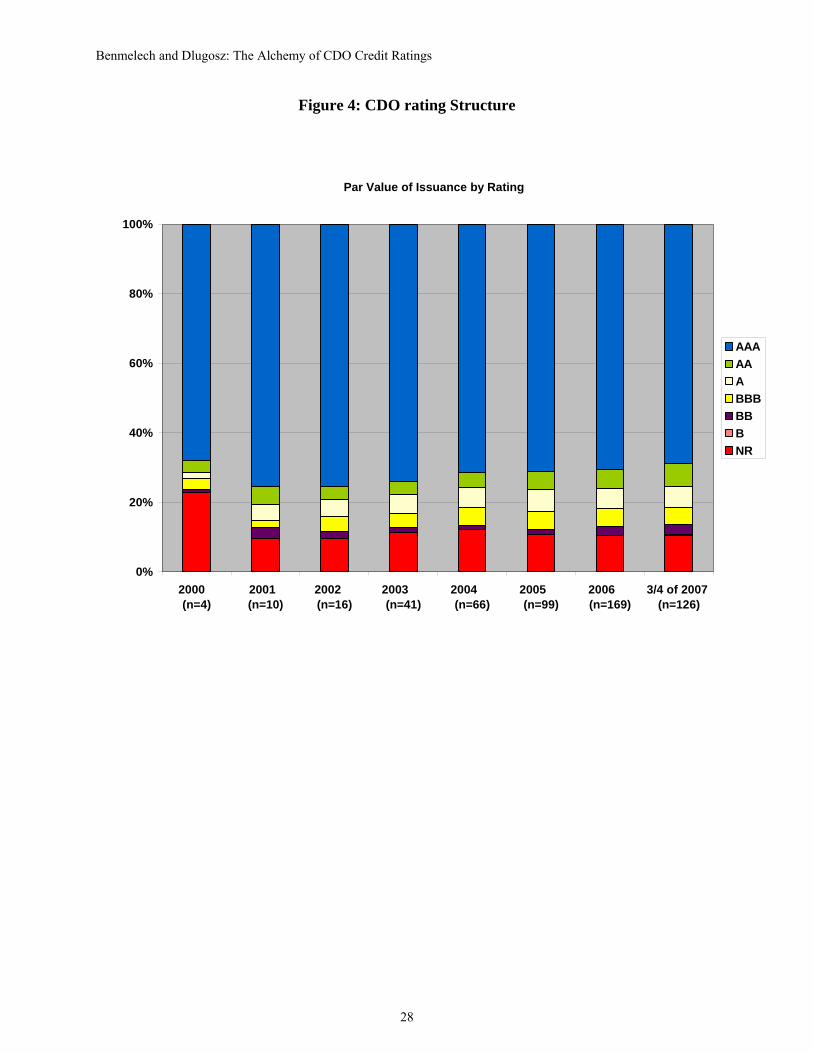
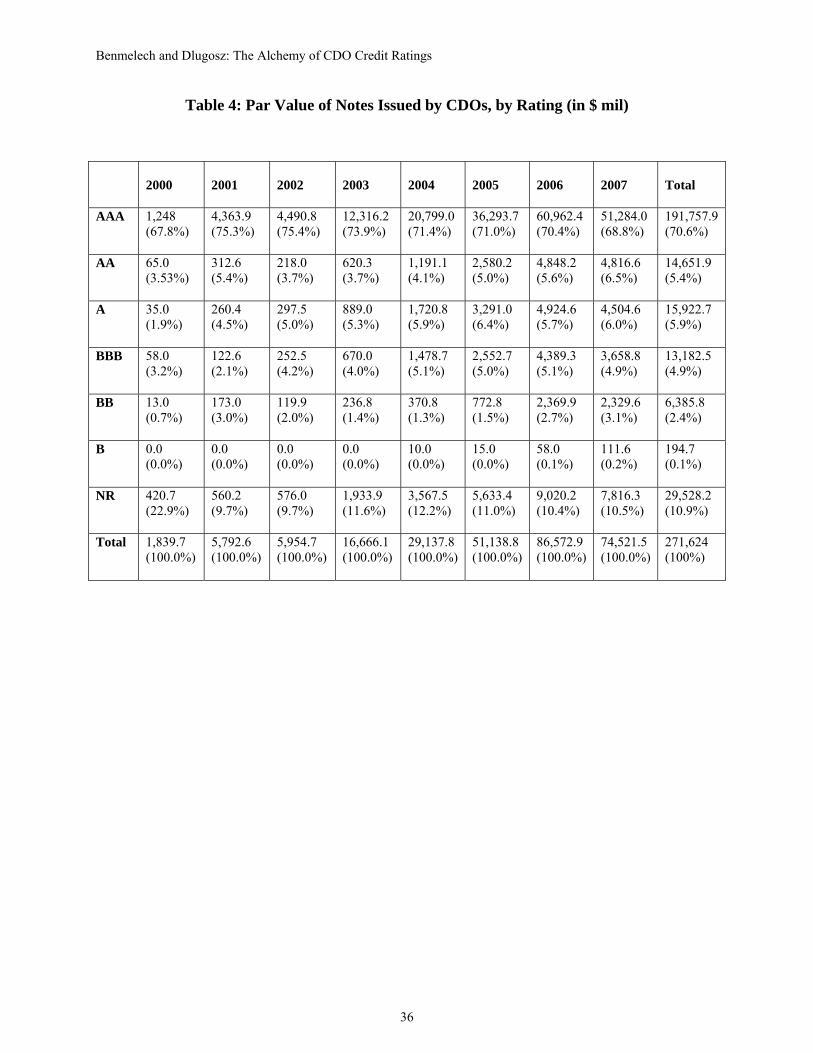
Table 4 and Figure 4 decompose the par value of notes issued by credit rating. In the
sample as a whole, 71% of issuance is rated AAA; 5% is AA, 6% is A, 5% is BBB, 2% is BB,
0.1% is B and 11% is NR (unrated). The composition of issuance across years is almost
identical to the overall composition with a slight downward trend in the amount of AAA and an
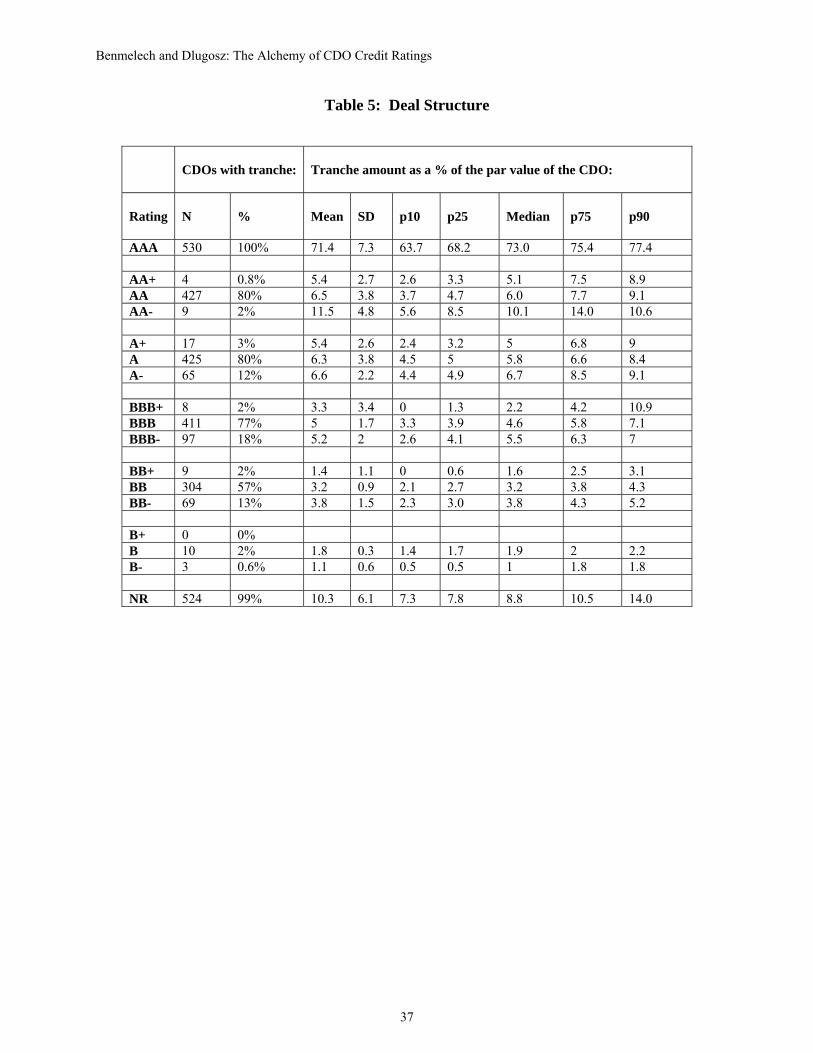
upward trend in the amount of unrated tranches over time. Table 5 presents a more detailed
analysis of deal structures. We find that every CLO except one has an AAA tranche, and the
median AAA tranche represents 73% of the deal’s total value. Likewise, 98% of CLOs have an
unrated tranche and the median tranche, conditional on having one, comprises 8.8% of the deal.
The interquartile ranges show that there is little variation in the composition of rated tranches
across deals. For example, 80% of CDOs have a AA tranche and the median AA tranche
represents 6% of the deal’s par value. The interquartile range for the size of AA tranches is
[4.7%, 7.7%]. Issuing liabilities in notched rating classes (e.g., AA+ or AA-) is relatively
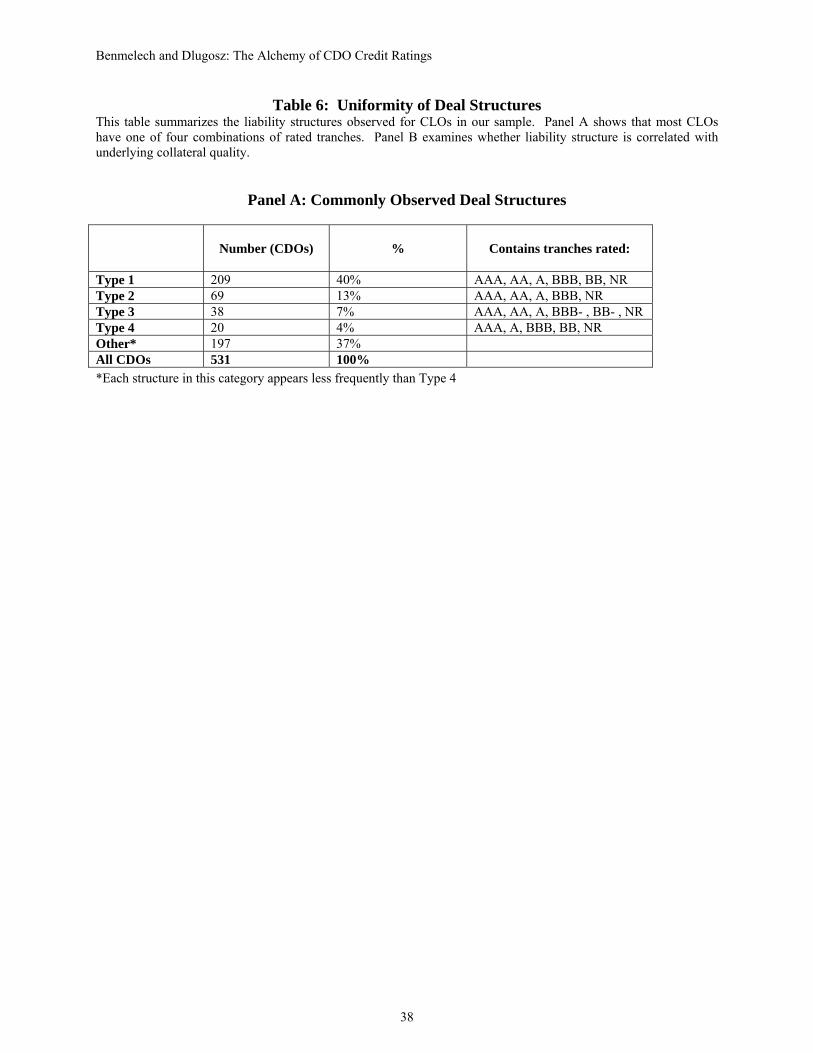
uncommon for every rating letter category. We also document a large degree of uniformity
among cash-flow CDOs. According to Panel A of Table 6, 63% of the CDOs in our sample had
one of four major liability structures (“deal types”): 40% are {AAA, AA, A, BBB, BB, NR}
deals; 13% are {AAA, AA, A, BBB, NR}; 7% are {AAA, AA, A, BBB-, BB-, NR}; 4% are
{AAA, A, BBB, BB, NR}.21 The remaining 137 deals have idiosyncratic structures that appear
less than 20 times each.
20 Not subject to capital requirements like most financial institutions and located in low-tax jurisdictions. 21 These results do not distinguish between deals that have 1 tranche per rating class or multiple tranches per rating class.
Benmelech and Dlugosz: The Alchemy of CDO Credit Ratings
14
4.2. The Uniformity of Collateral Restrictions
The majority of the CLOs in our sample are managed, that is collateral managers can
engage in limited trading over the designated ‘reinvestment period’, typically the first 5-7 years
of a 12-year CDO.22 In managed CLOs, the credit quality of the pool is controlled by covenants
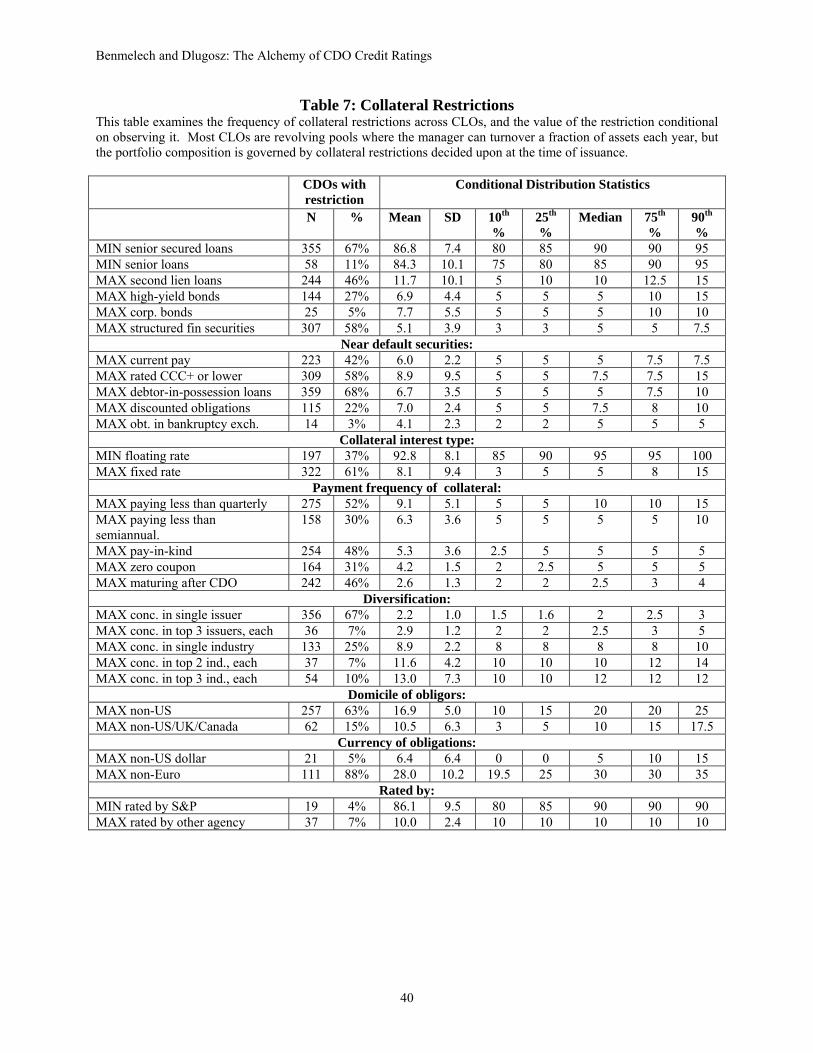
in the deal that constrain the manager’s asset allocation. Table 7 summarizes the frequency and
nature of collateral composition restrictions in our sample. These restrictions fall into a few
broad categories: (1) Restrictions on asset type, (2) Restrictions on the fraction of near-default
securities in the pool, (3) Restrictions on the mix of fixed/floating rate securities and the payment
frequency of the collateral, (4) Diversification requirements by industry and issuer, (5) Currency
and domicile restrictions on collateral, (6) Rating restrictions.
Conditioning on the presence of any given restriction, there is very little variation in the
magnitude of the restriction. For example, nearly 70% of the CDOs in our sample require a
minimum fraction of the collateral pool be invested in senior secured loans. When this restriction
is present, in 40% of the cases it takes the value of 90%, and the interquartile range is [85%,
90%]. Furthermore, 46% of CDOs restrict the amount of second lien loans as a percentage of
total asset par; the median limit is 10% and the interquartile range is [10%, 12.5%]. Likewise,
60% of CDOs limit the amount of structured finance collateral as a percent of total asset par; the
median limit is 5% and the interquartile range is [3%, 5%]. We find similar clustering on all
other types of restrictions. According to S&P, collateral constraints “are specified by the
sponsor, banker, and collateral manager based on their perceptions of what the investor
community wants and can be comfortable with” (Global Cash Flow & Synthetic CDO Criteria,
p. 19-21). In the rating process, and as ratings are monitored during the life of the CDO,
collateral restrictions only affect tranche ratings insofar as default, correlation, and recovery rates
22 Typically 10-15% of the par value of assets may be traded per year in addition to securities defaulted securities or credit-risk securities.
Benmelech and Dlugosz: The Alchemy of CDO Credit Ratings
15
assumed for individual assets depend on asset class, rating, maturity, and domicile. (We explain
the details of the rating model in Section 5.1). That is, there is no additional penalty vis-à-vis the
rating agencies for including for example more than 5% of structured finance collateral. The
uniformity in collateral restrictions suggests that investors may to some extent rely on simple
rules to judge the riskiness of these complex and idiosyncratic structures. Additionally, there is
reason to believe that rating agencies influence investor perceptions of what constitutes an
acceptable allocation of collateral. S&P’s Presale and New Issue reports have a ‘Strengths,
Weaknesses, and Concerns’ section where they highlight collateral characteristics that they deem
unusually risky; often this involves pointing out when allocations to certain baskets (e.g., rated
below CCC+, structure finance securities, etc) exceed levels seen in Table 7.
4.3. The Alchemy of CDO Credit Ratings
We now turn to analyze the relation between the underlying collateral quality, and the
credit rating of the secured tranches. Our main measure of collateral quality is the weighted
average rating (WAR) of all the assets in the pool. The WAR is reported in the Presale reports
and is calculated as a weighted-average of all the loans, bonds and securities in the collateral
pool. S&P requires that every asset in the pool will have either an actual or assessed credit rating.
One concern about weighted-average rating as a measure of collateral quality is that it does not
sufficiently describe the riskiness of the collateral pools. Two portfolios with the same WAR
could have very different loss distributions. Consider, for example, a portfolio that contains only
B-rated securities versus a portfolio that contains some AA securities pooled together with many
CCC-rated securities or near-default loans. However, based on the collateral restrictions we
Benmelech and Dlugosz: The Alchemy of CDO Credit Ratings
16
observe, it seems likely that most of the collateral in a CDO with a WAR of B is probably, in
fact, B-rated.23
We find that 85% of the CLOs in our sample have collateral pools with a WAR of B, 8%
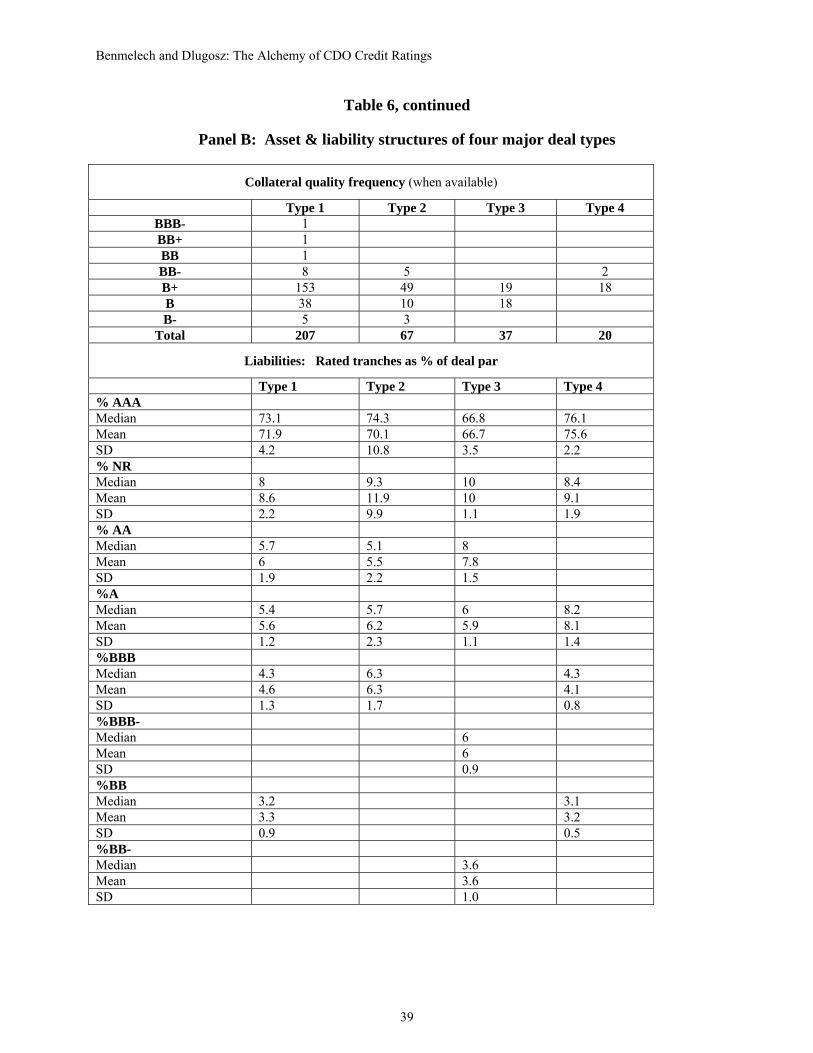
have a WAR of BB, and for 7% the information about WAR is missing.24 As Panel B of Table 6
demonstrates, we do not find any correlation between deal type and WAR of the collateral pool;
each type of deal is more likely to be backed by collateral with an average rating of B than BB. It
is interesting to note that there is a trend in weighted-average collateral quality over time: with
BB-backed CDOs all but disappearing by 2006-2007. This deterioration in average collateral
quality over time implies that debt or equity investments in later CDOs are potentially riskier.
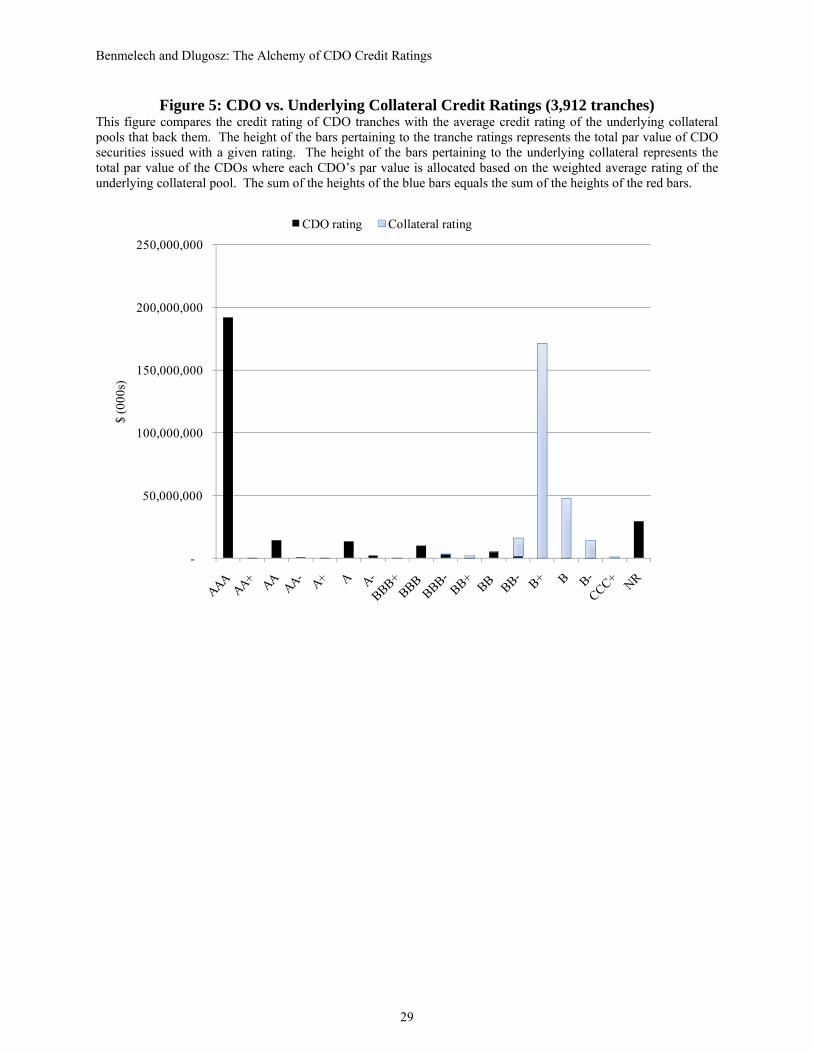
As is typical in structured finance products, there is a gap between the credit ratings on
the notes issued by CDOs and the credit quality of the underlying collateral. Figure 5 quantifies
the ratings transformation that takes place in our sample of CDOs. Cash-flow CLOs finance the
purchase of junk-rated assets (typically B+) largely with AAA-rated borrowings. While 70.7% of
the dollar amount of CDOs in our sample was initially rated as AAA, the collateral that supports
these issues had an average credit rating of B+.
4.4. How Does the CLO Credit Rating Model Work?
In this subsection we review the process that S&P uses to determine credit ratings for CLO
tranches. The rating process for cash-flow CLOs involves two steps. In the first stage, an
expected loss distribution for the underlying collateral pool is estimated. In the second stage,
cash flow simulations are used to determine whether a tranche can withstand the necessary level
of defaults to earn a given rating. The model requires many assumptions about default
23 Sixty percent of CDOs restrict the amount of collateral that can be rated CCC+ or lower to five to seven percent of the portfolio. 24 These are compressed ratings. The full WAR distribution is: 0.2% BBB-, 0.6% BB+, 0.4 BB, 7% BB-, 65% B+, 16% B, 4% B-, 0.2% CCC+, 7% missing data.
Benmelech and Dlugosz: The Alchemy of CDO Credit Ratings
17
probabilities, correlation, interest rate movements, and more. The model generates two key
statistics that determine the level of credit enhancement of each of the tranches in a CLO deal.
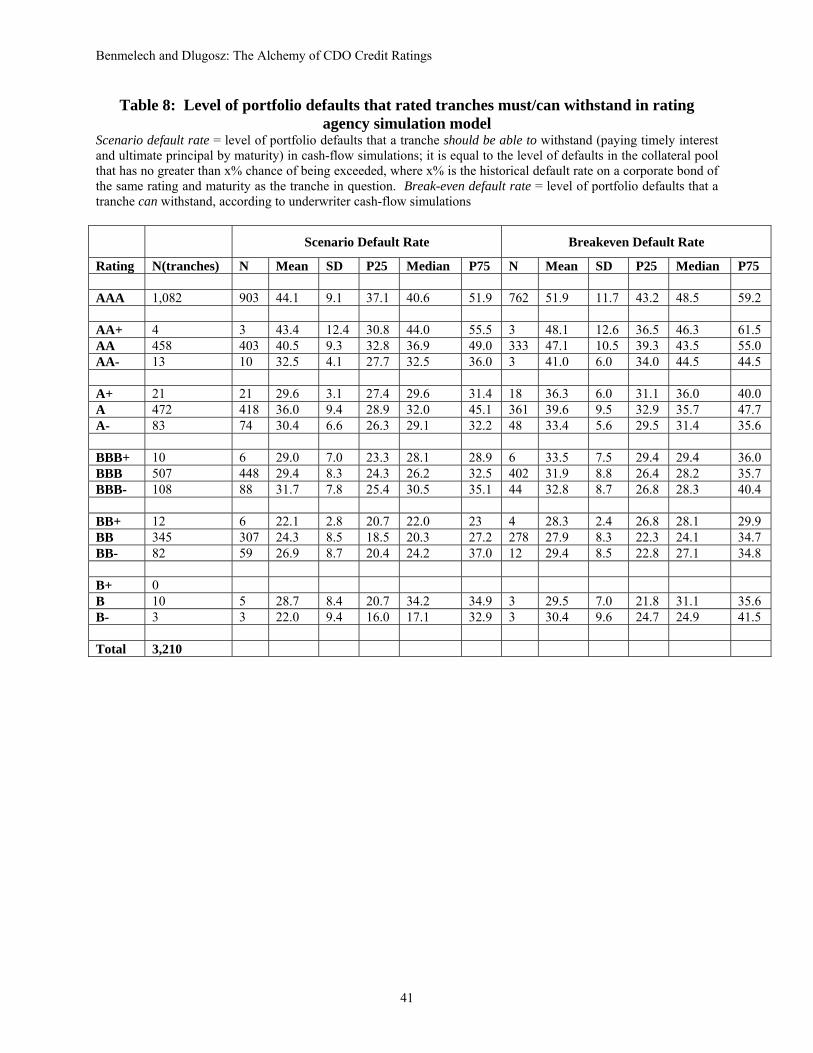
The first statistic, calculated for each tranche, is S&P’s ‘scenario default rate’ (SDR). The
‘scenario default rate’ is the level of default in the collateral pool that a tranche must be able to
withstand to earn its rating. SDRs allow us to characterize, at least partially, the loss distribution
that was estimated in the rating process for each collateral pool. The second statistic – ‘break-
even default rate’ (BEDR) indicates the level of portfolio defaults that each tranche can
withstand, according to the underwriter’s cash-flow models
To estimate an expected loss distribution for a CLO’s collateral, S&P uses historical data
on rating transitions from its CreditPro database (1981-present).25 Each asset in the collateral
pool is assigned an expected default probability based on asset class (corporates, ABS,
sovereigns, etc), rating, and maturity.26 Some simple assumptions are made about default
correlation. For example, two corporate securities in the same sector are assigned a 0.15
correlation; while corporate securities from different sectors obtain a correlation of 0.05.27
Monte Carlo simulation is used to generate the distribution of portfolio losses. S&P then uses
this loss distribution to generate a “scenario default rate” (SDR) for each tranche – this is the
level of portfolio losses that a tranche must be able to withstand in cash flow simulations to earn
its rating.28 There are two steps in calculating the SDR. First, S&P identifies the default rate on
25 Calculations may be based on the expected composition of the asset pool to some extent because only 50-70% is typically ramped up at the closing date. 26 According to the CDO Evaluator Technical Document, p. 5-6, S&P calculates a one-year transition matrix from historical data and generates predicted default rates by raising it to higher powers. Appendix 1 of this document shows the one-year transition matrix and the predicted default rates (up to 30yrs). This methodology implicitly assumes that current rating is the only determinant of the likelihood of default. 27 Standard & Poor’s “CDO Evaluator 3.0: Technical Document”, p.22. This document describes version 3.0 of the CDO Evaluator Model which was released in December 2005. In previous versions, correlation assumptions for corporates were 0.30 within industry and 0.00 across industries (Standard & Poor’s “Global Cash Flow and Synthetic CDO Criteria, p. 46 and Standard & Poor’s “S&P Launches Latest Version of CDO Evaluator Modeling Tool”, p. 2). 28 According to S&P “withstand” means to pay timely interest and ultimate principal by the final legal maturity of the notes.
Benmelech and Dlugosz: The Alchemy of CDO Credit Ratings
18
corporate bonds that have the same rating as the one being sought for the tranche and maturity
equal to the weighted-average maturity of the CDO’s assets (“x%”). Then, using the loss
distribution generated for the collateral pool, they identify the default rate that has no greater
chance of being exceeded than x%; this is the SDR.
Consider a CDO tranche backed by collateral with a weighted-average maturity of 10
years that is being tested for an A rating. If the expected default rate of a 10-year A-rated
corporate bond is 3%, the SDR for the tranche is set equal to the level of default in the CDO’s
collateral pool that has no greater than 3% chance of being exceeded. When the underwriter runs
cash-flow simulations, he will test that the tranche can withstand cumulative defaults up to the
SDR without missing interest or final principal payments. The logic is “if the tranche can
survive defaults up to the SDR then its probability of default is no greater than 3%, as would be
appropriate for an A rating” (Global Cash Flow and Synthetic CDO Criteria, p. 42).
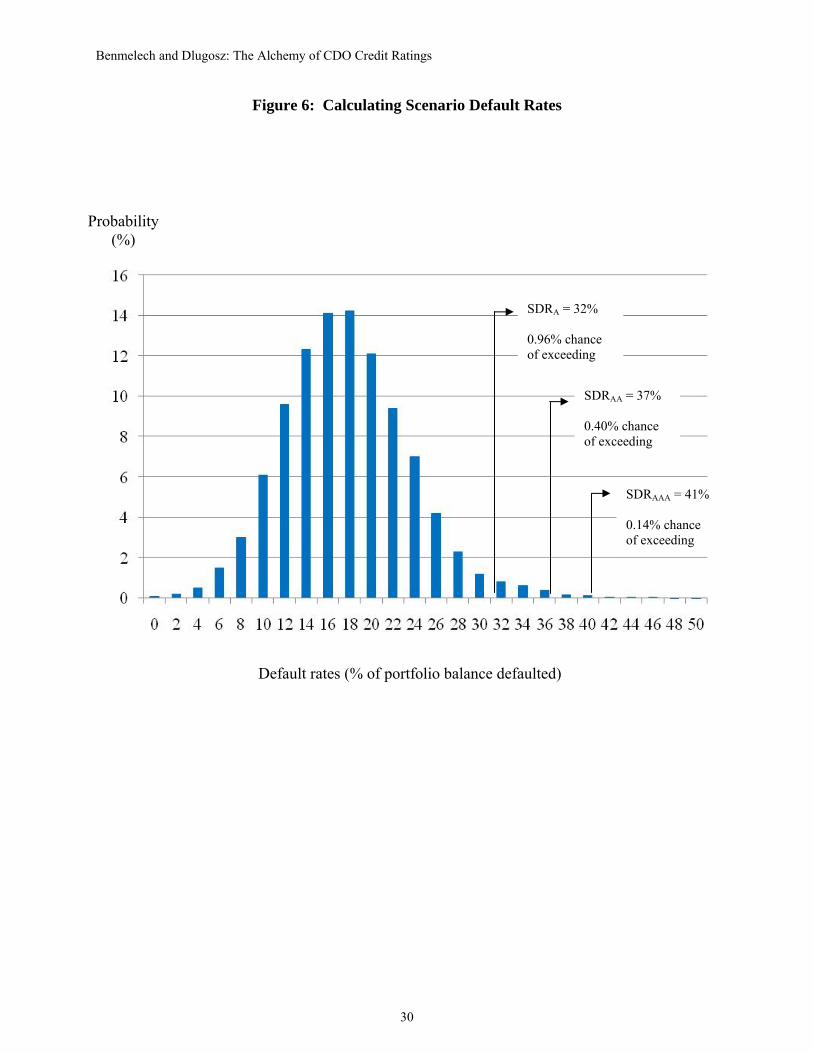
SDRs allow us to back out, partially, the loss distributions that were estimated for each
CLO’s collateral pool. For example, the loss distribution for a CLO backed by a pool of assets
with a weighted average maturity of seven years must satisfy: 29
Pr(asset defaults as % of total par > SDRAAA)≤ default rate of 7 year, AAA-rated corporate bond = 0.14%
Pr(asset defaults as % of total par > SDRAA) ≤ default rate of 7 year, AA-rated corporate bond = 0.40%
Pr(asset defaults as % of total par > SDRA) ≤ default rate of 7 year, A-rated corporate bond = 0.96%
Pr(asset defaults as % of total par > SDRBBB) ≤ default rate of 7 year, BBB-rated corporate bond = 4.6%
Pr(asset defaults as % of total par > SDRBB) ≤ default rate of 7 year, BB-rated corporate bond = 14.1%
Pr(asset defaults as % of total par > SDRB) ≤ default rate of 7 year, B-rated corporate bond = 32.2%
29 Seven-year default rates were taken from the credit curves in Appendix 1 of “CDO Evaluator Version 3.0: Technical Document”, which are calculated by repeated application of a 1-yr transition matrix. It is unclear whether these are the correct figures, because these default rates do not control for the maturity of the issue; however, we could not locate any other statistics on corporate bond default rates by maturity published by S&P. For a comparison, Moody’s default rates for corporate bonds with 7-year maturities are Aaa=0.31%, Aa=0.55%, A=0.78%, Baa=2.86%, Ba=15.32%, B=35.55% (Moody’s Default & Recovery of Corporate Bond Issuers)
Benmelech and Dlugosz: The Alchemy of CDO Credit Ratings
19
Figure 6 illustrates the relationship between the loss distribution and SDRs.
Table 8 summarizes SDRs by tranche rating for our sample. As the table shows, median SDRs
by rating class are: AAA=41%, AA=37%, A=32%, BBB=26%, BB=20%. Assuming, for
simplicity, that all CDOs have assets with a weighted-average maturity equal to the sample mean
(7-years), the typical CDO in our sample is backed by collateral that has an expected loss
distribution like the one below:
Pr (defaults as % of total asset par> 41%) ≤ 0.14%
Pr (defaults as % of total asset par>37%) ≤ 0.40%
Pr (defaults as % of total asset par>32%) ≤ 0.96%
Pr (defaults as % of total asset par>26%) ≤ 4.6%
Pr (defaults as % of total asset par>20%) ≤ 14.1%
An AAA tranche is a tranche that can withstand the cumulative default rate that has no greater
than 0.14% of being exceeded (41%). An AA tranche is one that can withstand the cumulative
default rate that has no greater than 0.40% of being exceeded (37%). Clearly this methodology
relies on estimating the loss distribution with a high degree of precision. Yet small changes in
correlation assumptions can have dramatic effects on the right tail of the loss distribution.
5. CLO Ratings and Investor Demand
Similar to many other structured finance products, most of the liabilities of CLOs are AAA-
rated. In the previous section we described the credit rating model used to generate the supply of
AAA tranches. In this section we suggest that to a large extent CDO structures - and in particular
their AAA-rated tranches - are driven by investor demand, which in turn is potentially driven by
rating-dependent regulation, asymmetric information, and investor guidelines and heuristics.
5.1. Rating-dependent Regulation
Benmelech and Dlugosz: The Alchemy of CDO Credit Ratings
20
Extensive use of credit ratings in the regulation of financial institutions created a natural clientele
for CDO and CLO securities. According to Hunt (2008), at least 44 SEC rules and forms
incorporated agency ratings as of June 2008. Minimum capital requirements at banks, insurance
companies, and broker-dealers, depend on the credit ratings of the assets on their balance
sheets.30 Pension funds, a $10 trillion source of capital in the United States, also face ratings-
based regulations. A recent survey of two hundred pension plan sponsors and investment
managers in the US and Europe (Cantor, Gwilym, and Thomas, 2007) found that 75% have
minimum rating requirements for bond purchases and 50% set limits on portfolio distribution by
rating class. Meanwhile, modifications to the Employee Retirement Income Security Act of
1974 (ERISA) over the past twenty years have gradually expanded the range of structured
finance securities that pension funds can hold.31 This matrix of regulation creates institutional
demand for highly-rated securities, yet the supply of highly-rated single-name securities is fairly
limited. For example, only five nonfinancial companies and a few sovereigns had AAA ratings
as of 2007. Thus, it is not surprising that highly rated CDO securities, especially those that are
rated AAA, are attractive to many of these financial institutions. Highly-rated CDO securities
incur smaller capital charges, may be used as collateral, and provide a higher yield than single-
name securities with the same rating. Moreover, private investors not subject to rating-based
regulation, may develop internal investment rules using credit ratings as inputs even when not
required by regulation to do so.
5.2. Heuristics and Asymmetric Information
30 Basel II allows banks to choose between two methodologies for calculating capital requirements for credit risk. The standardized approach, a modification of Basel I, is credit-rating based. The internal ratings based (IRB) approach allows banks us their internal estimates of risk components (e.g., expected default, loss given default, unexpected loss) to calculate the capital required for a given exposure. (http://www.bis.org/pubs/bcbs107b.pdf) 31 In 1989, the Department of Labor began allowing ERISA plans to invest in highly-rated asset-backed securities with the passage of Prohibited Transaction Exemption (PTE) 89-88.
Benmelech and Dlugosz: The Alchemy of CDO Credit Ratings
21
Ratings-based regulation explains some of the demand for highly-rated securities, but does not
fully explain why we see so much AAA in CDO structures, as opposed to AA or A. Behavioral
economics provides some insight as to why investors might demand AAA securities even in the
absence of rating-dependent regulation. As described above, according to DeMarzo (2005) under
asymmetric information, a CLO issuer maximizes his revenue from the sale by pooling and
tranching, which results in the concentration of the default risk in few tranches. According to
Demarzo’s model, in order to alleviate any concerns about adverse selection in the securities
issued by the CLO arranger, these securities would need to be certified as risk-. If investors use
heuristics to classify assets, as in Barberis and Shleifer (2003), and only AAA-rated securities are
perceived to be riskless then issuers would cater to investor demand by carving out large portions
of their collateral pools as AAA.
5.3. Investor Demand and the Supply of Uniform Securities
While it is difficult to quantify the extent to which regulation, heuristics, or asymmetric
information, individually drive demand for CLO securities, the uniformity of CLO structures
suggests that investor demand in general is an important determinant of their structures.
Uniformity reduces the amount of time investors must spend analyzing a new deal by making it
easy to identify deviations from commonly used practices. If some CLO structures have been
perceived as more desirable then other issuers will follow the same convention. Anecdotal
evidence suggests that the S&P rating model was known to CLO issuers and was provided to
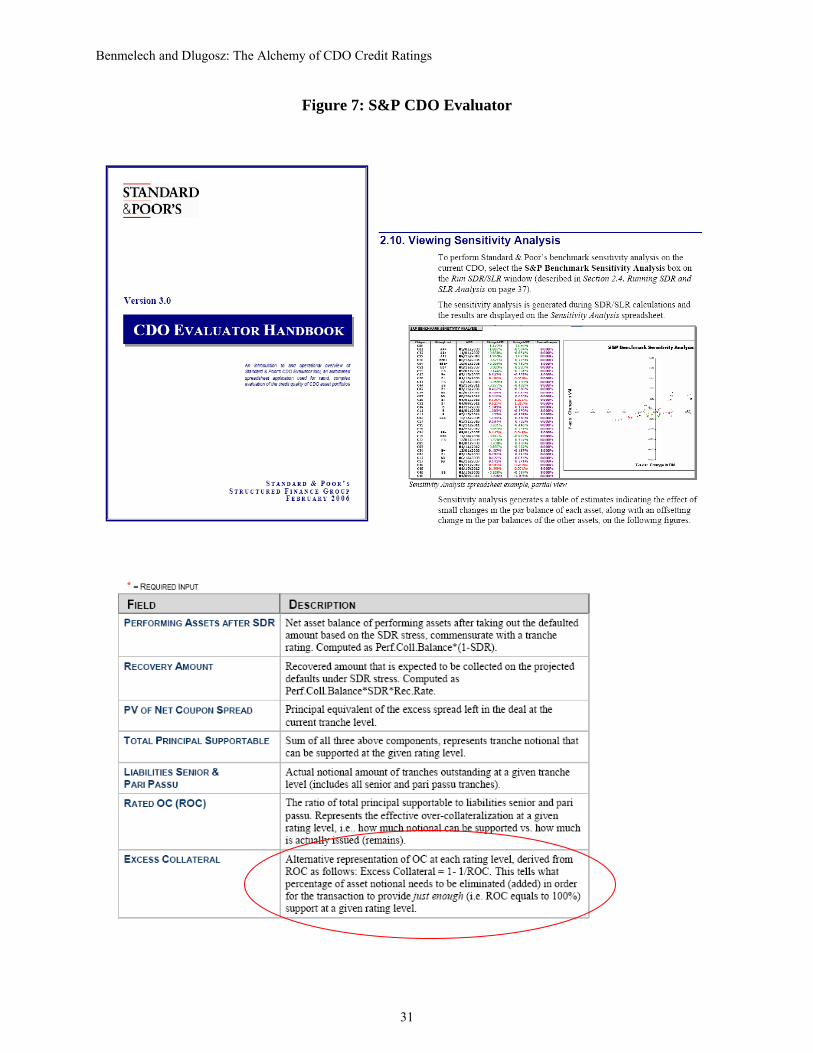
them by the rating agency. Figure 7 displays excerpts from the CDO Evaluator Manual which we
have downloaded from S&P’s website. The CDO Evaluator software enabled issuers to structure
their CDOs to achieve the highest possible credit rating at the lowest possible cost. For example,
Figure 7 shows that one of the outputs that the CDO Evaluator provides to the issuer is “excess
Benmelech and Dlugosz: The Alchemy of CDO Credit Ratings
22
collateral” which, according to S&P, “tells what percentage of assets notional needs to be
eliminated (added) in order for the transaction to provide just enough (i.e. ROC equals to
100%) support at a given rating level.”32 In other words, the model provided a sensitivity
analysis feature that made it easy for issuers to target the highest possible credit rating at the
lowest cost.
6. Conclusions
The innovation represented by Collateralized Loan Obligations has been instrumental to the
growth of the syndicated loan market. By creating highly-rated securities out of junk quality
loans, CLOs have brought new investors into the loan market - rating-constrained institutions
that would not be allowed to hold the non-investment grade loans directly – and helped to
finance a record-breaking leveraged buyout wave from 2003 to 2007. While CLOs have not yet
suffered downgrades or impairments as those experienced by asset-backed CDOs, there are some
signs that the deepening recession is causing deterioration in the quality of outstanding loans that
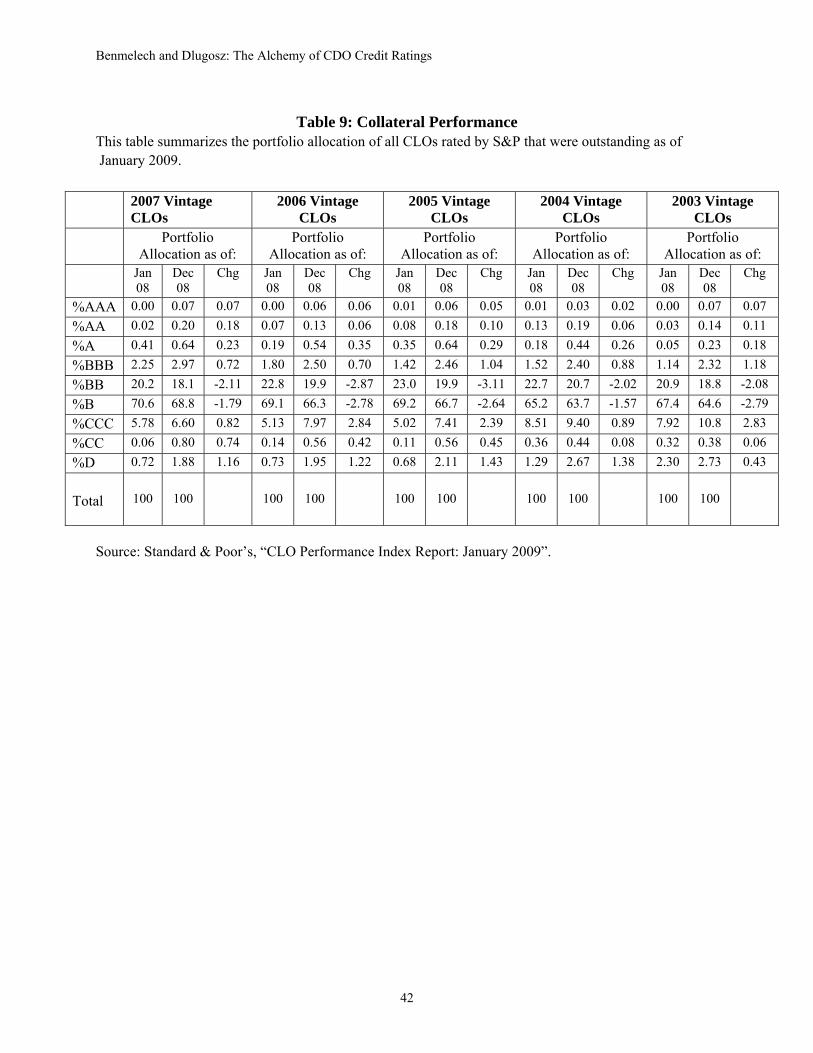
serve as collateral for CLOs. Table 9 displays collateral performance by vintage as been reported
recently by S&P. As the Table demonstrates, the fraction of assets rated BB and B has declined,
while the share of assets rated CCC or those in actual default (D) increased across most vintages.
These changes reflect the transition of assets from BB and B ratings to CCC and D within CLOs’
collateral pools as a result of the current recession and credit crisis. While most of the effect of
the decline in collateral quality led to downgrades of mezzanine tranches of CLOs rather than the
most senior tranches, if this trend continues, more senior tranches may be affected as well.33 The
32 See Rajan, Seru, and Vig (2008) who provide evidence that securitization led to loans with worse fundamentals due to the tendency to rely on statistical models and reduction in the incentives to collect soft information. 33 CLO managers may be required to sell defaulted loans if they violate collateral quality requirements, however secondary markets for loans have dried up as well, which may result in loan fire-sales.

Benmelech and Dlugosz: The Alchemy of CDO Credit Ratings
23
future of CLOs as well as the resurrection of the leveraged loan market will likely be determined
by the ability of CLOs to withstand corporate defaults.
Benmelech and Dlugosz: The Alchemy of CDO Credit Ratings
24
REFERENCES
Ashcraft, A., Schuermann, T., 2008, Understanding the securitization of subprime mortgage credit, Working paper, Federal Reserve Bank of New York. Bank for International Settlements, 2005, Basel II: International convergence of capital measurement and capital standards: A revised framework, http://www.bis.org/publ/bcbsca.htm. Bentham, M., Albulescu, H., 2008, CDO spotlight: reviewing A decade of U.S. CLO performance and equity returns, Standard & Poor’s. Cantor, R., Packer, F., 1994, The credit rating industry, Federal Reserve Bank of New York Quarterly Review. Cantor, R., Gwilym, O. A., and S., Thomas, 2007, The use of credit ratings in investment management in the US and Europe, Working Paper. Coval, J., Jurek, J., and E., Stafford, 2008a, Economic catastrophe bonds, American Economic Review (forthcoming). Coval, J., Jurek, J., and E., Stafford, 2008b, The economics of structured finance, Journal of Economic Perspectives (forthcoming). DeMarzo, P., 2005, The pooling and tranching of securities: A model of informed intermediation, Review of Financial Studies, 18(1) 1-35. DeMarzo, P., and Duffie, D., 1999, A Liquidity-based model of security design, Econometrica 67, 65–99. Fabozzi, F. J., Goodman, L., and D., Lucas, 2006, Collateralized debt obligations, John Wiley & Sons, Inc. Hu, J., 2007, Assessing the credit risk of CDOs backed by structured finance securities: rating analysts’ challenges and solutions, Moody’s Investors Service. Hunt, J. P., 2008, Credit rating agencies and the “worldwide credit crisis” the limits of reputation, the insufficiency of reform, and a proposal for improvement, Working paper. Mason, J., Rosner, J., 2007, Where did the risk go? How misapplied bond ratings cause mortgage backed securities and collateralized debt obligation market disruptions, Working paper. Myers, S., Majluf, N., 1984, Corporate financing and investment decisions when firms have information that investors do not have", Journal of Financial Economics, 13(2) 187-221. Rajan, Uday, Seru, A., and Vig, V., 2008, The failure of models that predict failure: distance, incentives and defaults, Working paper University of Chicago. Shleifer, A., Barberis, N., 2003, Style investing, Journal of Financial Economics 68, 161-199.

Benmelech and Dlugosz: The Alchemy of CDO Credit Ratings
25
Standard & Poor’s. Global Cash Flow and Synthetic CDO Criteria. 2002. Standard & Poor’s. CDO Evaluator Version 3.0: Technical Document. December 2005. Standard & Poor’s. CDO Evaluator Handbook. February 2006.
Benmelech and Dlugosz: The Alchemy of CDO Credit Ratings
26
Figure 1: Typical CDO Structure
Figure 2: CDO Issuance by Year
4 10 16 41 6699
169126
0
200
400
600
800
1000
1200
1400
2000 2001 2002 2003 2004 2005 2006 2007 (3/4)-
10,000
20,000
30,000
40,000
50,000
60,000
70,000
80,000
90,000
100,000
CDOs Tranches $ mil
Benmelech and Dlugosz: The Alchemy of CDO Credit Ratings
27
Figure 3: The Distribution of the Number of Tranches per CDO
050
100
150
Freq
uenc
y
0 5 10 15 20tranches
Tranches Per CDO, n=531 CDOs
Total number of CDOs
Total number of tranches
Mean number of tranches
Std of number of tranches
Min number of tranches
Max number of tranches
531 3,920 7.37 7 2 21
Benmelech and Dlugosz: The Alchemy of CDO Credit Ratings
28
Figure 4: CDO rating Structure
Par Value of Issuance by Rating
0%
20%
40%
60%
80%
100%
2000 (n=4)
2001 (n=10)
2002 (n=16)
2003 (n=41)
2004 (n=66)
2005 (n=99)
2006 (n=169)
3/4 of 2007 (n=126)
AAAAAABBBBBBNR
Benmelech and Dlugosz: The Alchemy of CDO Credit Ratings
29
Figure 5: CDO vs. Underlying Collateral Credit Ratings (3,912 tranches) This figure compares the credit rating of CDO tranches with the average credit rating of the underlying collateral pools that back them. The height of the bars pertaining to the tranche ratings represents the total par value of CDO securities issued with a given rating. The height of the bars pertaining to the underlying collateral represents the total par value of the CDOs where each CDO’s par value is allocated based on the weighted average rating of the underlying collateral pool. The sum of the heights of the blue bars equals the sum of the heights of the red bars.
-
50,000,000
100,000,000
150,000,000
200,000,000
250,000,000
$ (0
00s)
CDO rating Collateral rating
Benmelech and Dlugosz: The Alchemy of CDO Credit Ratings
30
Figure 6: Calculating Scenario Default Rates
Default rates (% of portfolio balance defaulted)
Probability (%)
SDRAAA = 41% 0.14% chance of exceeding
SDRAA = 37% 0.40% chance of exceeding
SDRA = 32% 0.96% chance of exceeding
Benmelech and Dlugosz: The Alchemy of CDO Credit Ratings
31
Figure 7: S&P CDO Evaluator
Benmelech and Dlugosz: The Alchemy of CDO Credit Ratings
32
Table 1: Payment Priority Structure for Octagon Investment Partners V Ltd.
Panel A: Tranche Structure (CLO Liabilities)
Class Rating Original Principal Balance Interest Rate A AAA US$ 236,250,000 3-MONTH LIBOR + 60.00bp B A US$ 21,000,000 3-MONTH LIBOR + 175.00bp C BBB US$ 15,000,000 3-MONTH LIBOR + 300.00bp D BB US$ 4,500,000 3-MONTH LIBOR + 825.00bp Pref. shares NR US$ 23,250,000 Residual
Panel B: Collateral Profile (CLO Assets)
Weighted average rating BB- Weighted average maturity 5.84 Expected portfolio default rate 14.34% Standard deviation of expected portfolio default rate 4.12%
Panel C: Interest Waterfall
Priority Payment 1 First, taxes, filing, and registration fees; second, trustee fees; third, capped administrative expenses 2 Hedge payments 3 Senior management fees 4 Class A interest 5 Class A coverage tests. If fail, pay down class A 6 Class B interest. 7 Class B coverage tests. If fail, pay down class A and then class B. I 8 Class B deferred interest 9 Class C interest 10 Class C coverage tests. If fail, pay down class A, class B, and then class C. 11 Class C deferred interest 12 Class D interest 13 Class D coverage tests. If fail, pay down class A, class B, class C, and then class D. 14 Class D deferred interest. 15 During the reinvestment period, if class D overcollateralization test is not satisfied, deposit to
collection account as principal until class D reinvestment O/C test is satisfied. 16 Deposit to collection account as principal proceeds amount that principal proceeds were used to pay
(1)-(4), (6), (8), (9), (11), (12), and (14) above. 17 Subordinated hedge termination payment 18 Payments due in clause 1 above the capped amount 19 Subordinated management fee 20 At the discretion of the collateral manager, with the consent of a majority of the preference shares, to
deposit in the collection account as principal 21 Preference shares up to an internal rate of return (IRR) of 14% 22 If IRR is 14% or greater, 20% of remaining interest proceeds to the collateral manager as an incentive
management fee and 80% of any remaining interest proceeds.
Benmelech and Dlugosz: The Alchemy of CDO Credit Ratings
33
Panel D: Principal Waterfall
Priority Payment 1 Items 1 to 14 in the interest waterfall 2 If payment date is a redemption date, the redemption prices of all the notes and any preference shares
to be redeemed. If payment date requires a special redemption, pay sequentially A, then B then C then D, until each note is paid in full as required. If payment date requires a partial redemption, pay pro rata to the class A, B, C, and D notes and the preference shares.
3 During the reinvestment period to purchase additional collateral 4 After the reinvestment period, pay down class A notes until paid in full 5 After the reinvestment period, pay down class B notes until paid in full 6 After the reinvestment period, pay down class C notes until paid in full 7 After the reinvestment period, pay down class D notes until paid in full 8 After the reinvestment period, to the payment of (17)-(19), (21) and (22) of the interest waterfall.
Panel E: Expected Portfolio Characteristics
Expected On Effective Date Required Weighted average spread (%) 3.125 2.750 Weighted average coupon (%) 8.750 8.500 Panel F: Sale and Reinvestment of Collateral Restrictions
The transaction structure permits the collateral manager to sell collateral debt securities under the following conditions:
• The collateral debt security is a defaulted security, a workout asset, or a current pay obligation
• The collateral debt security is an equity security • The collateral debt security is deemed a credit risk security • The collateral debt security is deemed a credit-improved security • The collateral debt security is subject to withholding tax • As a result of an optimal redemption • As a result of a rating confirmation failure on the effective date
The transaction also allows the collateral manager to sell collateral debt securities outside the requirements set forth above, if the total volume of these sales does not exceed 25% of the aggregate principal balance of the collateral debt securities for a given annual period.
Benmelech and Dlugosz: The Alchemy of CDO Credit Ratings
34
Table 2: Global CDO Issuance Volume ($mil)
This table reproduces global CDO issuance statistics from the Securities Industry and Financial Markets Association (SIFMA). Issuance is broken down by type of structure and by issuer motivation. The original data is available at http://www.sifma.org/research/global-cdo.html
BY TYPE:
BY ISSUER MOTIVATION:
TOTAL
$
Cash Flow &
Hybrid
Synthetic
Funded
Market Value Arbitrage Balance Sh
eet
$ % $ % $ % $ % $ %
2004 157,418 119,531 76 37,237 24 650 0 146,998 93 10,419 7
2005 271,803 206,225 76 64,957 24 620 0 227,403 84 44,399 16
2006 551,709 414,743 75 89,042 16 47,924 9 472,197 86 79,511 14
2007 502,978 362,651 72 46,230 9 94,096 19 436,102 87 66,876 13
2008 – 1H 36,807 26,190 71 1,212 3 9,404 26 28,855 78 7,951 22
Total 1,520,715 1,183,340 74 238,678 16 152,694 10 1,311,555 86 209,156 14
Panel B: Sample Issuance Volume
All CDOs
US$ denominated
Euro denominated
Year CDO (#)
Tranches (#)
Total ($mil)
CDO (#)
Tranches (#)
Total ($mil)
CDO (#)
Tranches (#)
Total ($mil)
2000 4 33 1,840 4 33 1,840 0 0 0
2001 10 74 5,793 8 60 4,577 2 14 1,216
2002 16 115 5,955 13 88 4,789 3 27 1,166
2003 41 297 16,666 35 244 14,613 6 53 2,053
2004 66 477 29,137 53 354 22,785 13 123 6,353
2005 99 741 51,139 80 573 40,313 19 168 10,826
2006 169 1,261 86,573 126 909 62,620 43 352 23,953
2007* 126 922 74,521 86 622 47,943 40 300 26,579
Total 531 3,920 271,624 405 2,883 199,479 126 1,037 72,145
Benmelech and Dlugosz: The Alchemy of CDO Credit Ratings
35
Table 3: CDO and tranche size ($mil)
Panel A
Summary Statistics for CDO size
Year Mean 25th Percentile
Median 75th Percentile
Std Min Max
2000
460 401 414 519 102 400 612
2001
579 438 511 750 194 321 895
2002
372 307 397 432 72 250 482
2003
406 306 356 439 165 212 1,023
2004
441 354 408 500 162 200 1,107
2005
517 364 499 600 209 210 1,250
2006
512 400 467 544 254 286 3,000
2007
591 424 500 647 343 300 3,529
Entire sample
512 400 460 557 257 200 3,529
Panel B
Summary Statistics for Tranche Size
2000
56 15 23 37 90 1.2 365
2001
79 11 22 50 145 1.8 654
2002
54 8 17 34 90 2.0 381
2003
58 10 19 41 96 0.5 847
2004
63 12 24 45 99 0.1 633
2005
69 15 27 57 108 0.02 681
2006
69 18 29 53 106 1.0 1,080
2007
81 23 35 72 124 0.5 1,849
Entire sample
70 16 28 57 109 0.02 1,849
Benmelech and Dlugosz: The Alchemy of CDO Credit Ratings
36
Table 4: Par Value of Notes Issued by CDOs, by Rating (in $ mil)
2000
2001
2002
2003
2004
2005
2006
2007
Total
AAA
1,248 (67.8%)
4,363.9 (75.3%)
4,490.8 (75.4%)
12,316.2 (73.9%)
20,799.0 (71.4%)
36,293.7 (71.0%)
60,962.4 (70.4%)
51,284.0 (68.8%)
191,757.9 (70.6%)
AA
65.0 (3.53%)
312.6 (5.4%)
218.0 (3.7%)
620.3 (3.7%)
1,191.1 (4.1%)
2,580.2 (5.0%)
4,848.2 (5.6%)
4,816.6 (6.5%)
14,651.9 (5.4%)
A
35.0 (1.9%)
260.4 (4.5%)
297.5 (5.0%)
889.0 (5.3%)
1,720.8 (5.9%)
3,291.0 (6.4%)
4,924.6 (5.7%)
4,504.6 (6.0%)
15,922.7 (5.9%)
BBB
58.0 (3.2%)
122.6 (2.1%)
252.5 (4.2%)
670.0 (4.0%)
1,478.7 (5.1%)
2,552.7 (5.0%)
4,389.3 (5.1%)
3,658.8 (4.9%)
13,182.5 (4.9%)
BB
13.0 (0.7%)
173.0 (3.0%)
119.9 (2.0%)
236.8 (1.4%)
370.8 (1.3%)
772.8 (1.5%)
2,369.9 (2.7%)
2,329.6 (3.1%)
6,385.8 (2.4%)
B
0.0 (0.0%)
0.0 (0.0%)
0.0 (0.0%)
0.0 (0.0%)
10.0 (0.0%)
15.0 (0.0%)
58.0 (0.1%)
111.6 (0.2%)
194.7 (0.1%)
NR
420.7 (22.9%)
560.2 (9.7%)
576.0 (9.7%)
1,933.9 (11.6%)
3,567.5 (12.2%)
5,633.4 (11.0%)
9,020.2 (10.4%)
7,816.3 (10.5%)
29,528.2 (10.9%)
Total
1,839.7 (100.0%)
5,792.6 (100.0%)
5,954.7 (100.0%)
16,666.1 (100.0%)
29,137.8 (100.0%)
51,138.8 (100.0%)
86,572.9 (100.0%)
74,521.5 (100.0%)
271,624 (100%)
Benmelech and Dlugosz: The Alchemy of CDO Credit Ratings
37
Table 5: Deal Structure
CDOs with tranche:
Tranche amount as a % of the par value of the CDO:
Rating
N
%
Mean
SD
p10
p25
Median
p75
p90
AAA 530 100% 71.4 7.3 63.7 68.2 73.0 75.4 77.4 AA+ 4 0.8% 5.4 2.7 2.6 3.3 5.1 7.5 8.9 AA 427 80% 6.5 3.8 3.7 4.7 6.0 7.7 9.1 AA- 9 2% 11.5 4.8 5.6 8.5 10.1 14.0 10.6 A+ 17 3% 5.4 2.6 2.4 3.2 5 6.8 9 A 425 80% 6.3 3.8 4.5 5 5.8 6.6 8.4 A- 65 12% 6.6 2.2 4.4 4.9 6.7 8.5 9.1 BBB+ 8 2% 3.3 3.4 0 1.3 2.2 4.2 10.9 BBB 411 77% 5 1.7 3.3 3.9 4.6 5.8 7.1 BBB- 97 18% 5.2 2 2.6 4.1 5.5 6.3 7 BB+ 9 2% 1.4 1.1 0 0.6 1.6 2.5 3.1 BB 304 57% 3.2 0.9 2.1 2.7 3.2 3.8 4.3 BB- 69 13% 3.8 1.5 2.3 3.0 3.8 4.3 5.2 B+ 0 0% B 10 2% 1.8 0.3 1.4 1.7 1.9 2 2.2 B- 3 0.6% 1.1 0.6 0.5 0.5 1 1.8 1.8 NR 524 99% 10.3 6.1 7.3 7.8 8.8 10.5 14.0
Benmelech and Dlugosz: The Alchemy of CDO Credit Ratings
38
Table 6: Uniformity of Deal Structures This table summarizes the liability structures observed for CLOs in our sample. Panel A shows that most CLOs have one of four combinations of rated tranches. Panel B examines whether liability structure is correlated with underlying collateral quality.
Panel A: Commonly Observed Deal Structures
Number (CDOs)
%
Contains tranches rated:
Type 1 209 40% AAA, AA, A, BBB, BB, NR Type 2 69 13% AAA, AA, A, BBB, NR Type 3 38 7% AAA, AA, A, BBB- , BB- , NR Type 4 20 4% AAA, A, BBB, BB, NR Other* 197 37% All CDOs 531 100% *Each structure in this category appears less frequently than Type 4
Benmelech and Dlugosz: The Alchemy of CDO Credit Ratings
39
Table 6, continued
Panel B: Asset & liability structures of four major deal types
Collateral quality frequency (when available)
Type 1 Type 2 Type 3 Type 4 BBB- 1 BB+ 1 BB 1 BB- 8 5 2 B+ 153 49 19 18 B 38 10 18 B- 5 3
Total 207 67 37 20
Liabilities: Rated tranches as % of deal par
Type 1 Type 2 Type 3 Type 4 % AAA Median 73.1 74.3 66.8 76.1 Mean 71.9 70.1 66.7 75.6 SD 4.2 10.8 3.5 2.2 % NR Median 8 9.3 10 8.4 Mean 8.6 11.9 10 9.1 SD 2.2 9.9 1.1 1.9 % AA Median 5.7 5.1 8 Mean 6 5.5 7.8 SD 1.9 2.2 1.5 %A Median 5.4 5.7 6 8.2 Mean 5.6 6.2 5.9 8.1 SD 1.2 2.3 1.1 1.4 %BBB Median 4.3 6.3 4.3 Mean 4.6 6.3 4.1 SD 1.3 1.7 0.8 %BBB- Median 6 Mean 6 SD 0.9 %BB Median 3.2 3.1 Mean 3.3 3.2 SD 0.9 0.5 %BB- Median 3.6 Mean 3.6 SD 1.0
Benmelech and Dlugosz: The Alchemy of CDO Credit Ratings
40
Table 7: Collateral Restrictions This table examines the frequency of collateral restrictions across CLOs, and the value of the restriction conditional on observing it. Most CLOs are revolving pools where the manager can turnover a fraction of assets each year, but the portfolio composition is governed by collateral restrictions decided upon at the time of issuance.
CDOs with restriction
Conditional Distribution Statistics
N % Mean SD 10th %
25th %
Median 75th %
90th %
MIN senior secured loans 355 67% 86.8 7.4 80 85 90 90 95 MIN senior loans 58 11% 84.3 10.1 75 80 85 90 95 MAX second lien loans 244 46% 11.7 10.1 5 10 10 12.5 15 MAX high-yield bonds 144 27% 6.9 4.4 5 5 5 10 15 MAX corp. bonds 25 5% 7.7 5.5 5 5 5 10 10 MAX structured fin securities 307 58% 5.1 3.9 3 3 5 5 7.5
Near default securities: MAX current pay 223 42% 6.0 2.2 5 5 5 7.5 7.5 MAX rated CCC+ or lower 309 58% 8.9 9.5 5 5 7.5 7.5 15 MAX debtor-in-possession loans 359 68% 6.7 3.5 5 5 5 7.5 10 MAX discounted obligations 115 22% 7.0 2.4 5 5 7.5 8 10 MAX obt. in bankruptcy exch. 14 3% 4.1 2.3 2 2 5 5 5
Collateral interest type: MIN floating rate 197 37% 92.8 8.1 85 90 95 95 100 MAX fixed rate 322 61% 8.1 9.4 3 5 5 8 15
Payment frequency of collateral:MAX paying less than quarterly 275 52% 9.1 5.1 5 5 10 10 15 MAX paying less than semiannual.
158 30% 6.3 3.6 5 5 5 5 10
MAX pay-in-kind 254 48% 5.3 3.6 2.5 5 5 5 5 MAX zero coupon 164 31% 4.2 1.5 2 2.5 5 5 5 MAX maturing after CDO 242 46% 2.6 1.3 2 2 2.5 3 4
Diversification: MAX conc. in single issuer 356 67% 2.2 1.0 1.5 1.6 2 2.5 3 MAX conc. in top 3 issuers, each 36 7% 2.9 1.2 2 2 2.5 3 5 MAX conc. in single industry 133 25% 8.9 2.2 8 8 8 8 10 MAX conc. in top 2 ind., each 37 7% 11.6 4.2 10 10 10 12 14 MAX conc. in top 3 ind., each 54 10% 13.0 7.3 10 10 12 12 12
Domicile of obligors: MAX non-US 257 63% 16.9 5.0 10 15 20 20 25 MAX non-US/UK/Canada 62 15% 10.5 6.3 3 5 10 15 17.5
Currency of obligations: MAX non-US dollar 21 5% 6.4 6.4 0 0 5 10 15 MAX non-Euro 111 88% 28.0 10.2 19.5 25 30 30 35
Rated by: MIN rated by S&P 19 4% 86.1 9.5 80 85 90 90 90 MAX rated by other agency 37 7% 10.0 2.4 10 10 10 10 10
Benmelech and Dlugosz: The Alchemy of CDO Credit Ratings
41
Table 8: Level of portfolio defaults that rated tranches must/can withstand in rating agency simulation model
Scenario default rate = level of portfolio defaults that a tranche should be able to withstand (paying timely interest and ultimate principal by maturity) in cash-flow simulations; it is equal to the level of defaults in the collateral pool that has no greater than x% chance of being exceeded, where x% is the historical default rate on a corporate bond of the same rating and maturity as the tranche in question. Break-even default rate = level of portfolio defaults that a tranche can withstand, according to underwriter cash-flow simulations Scenario Default Rate Breakeven Default Rate
Rating N(tranches) N Mean SD P25 Median P75 N Mean SD P25 Median P75 AAA 1,082 903 44.1 9.1 37.1 40.6 51.9 762 51.9 11.7 43.2 48.5 59.2 AA+ 4 3 43.4 12.4 30.8 44.0 55.5 3 48.1 12.6 36.5 46.3 61.5 AA 458 403 40.5 9.3 32.8 36.9 49.0 333 47.1 10.5 39.3 43.5 55.0 AA- 13 10 32.5 4.1 27.7 32.5 36.0 3 41.0 6.0 34.0 44.5 44.5 A+ 21 21 29.6 3.1 27.4 29.6 31.4 18 36.3 6.0 31.1 36.0 40.0 A 472 418 36.0 9.4 28.9 32.0 45.1 361 39.6 9.5 32.9 35.7 47.7 A- 83 74 30.4 6.6 26.3 29.1 32.2 48 33.4 5.6 29.5 31.4 35.6 BBB+ 10 6 29.0 7.0 23.3 28.1 28.9 6 33.5 7.5 29.4 29.4 36.0 BBB 507 448 29.4 8.3 24.3 26.2 32.5 402 31.9 8.8 26.4 28.2 35.7 BBB- 108 88 31.7 7.8 25.4 30.5 35.1 44 32.8 8.7 26.8 28.3 40.4 BB+ 12 6 22.1 2.8 20.7 22.0 23 4 28.3 2.4 26.8 28.1 29.9 BB 345 307 24.3 8.5 18.5 20.3 27.2 278 27.9 8.3 22.3 24.1 34.7 BB- 82 59 26.9 8.7 20.4 24.2 37.0 12 29.4 8.5 22.8 27.1 34.8 B+ 0 B 10 5 28.7 8.4 20.7 34.2 34.9 3 29.5 7.0 21.8 31.1 35.6 B- 3 3 22.0 9.4 16.0 17.1 32.9 3 30.4 9.6 24.7 24.9 41.5 Total 3,210
Benmelech and Dlugosz: The Alchemy of CDO Credit Ratings
42
Table 9: Collateral Performance
This table summarizes the portfolio allocation of all CLOs rated by S&P that were outstanding as of January 2009.
Source: Standard & Poor’s, “CLO Performance Index Report: January 2009”.
2007 Vintage CLOs
2006 Vintage CLOs
2005 Vintage CLOs
2004 Vintage CLOs
2003 Vintage CLOs
Portfolio Allocation as of:
Portfolio Allocation as of:
Portfolio Allocation as of:
Portfolio Allocation as of:
Portfolio Allocation as of:
Jan 08
Dec 08
Chg Jan 08
Dec 08
Chg Jan 08
Dec 08
Chg Jan 08
Dec 08
Chg Jan 08
Dec 08
Chg
%AAA 0.00 0.07 0.07 0.00 0.06 0.06 0.01 0.06 0.05 0.01 0.03 0.02 0.00 0.07 0.07 %AA 0.02 0.20 0.18 0.07 0.13 0.06 0.08 0.18 0.10 0.13 0.19 0.06 0.03 0.14 0.11 %A 0.41 0.64 0.23 0.19 0.54 0.35 0.35 0.64 0.29 0.18 0.44 0.26 0.05 0.23 0.18 %BBB 2.25 2.97 0.72 1.80 2.50 0.70 1.42 2.46 1.04 1.52 2.40 0.88 1.14 2.32 1.18 %BB 20.2 18.1 -2.11 22.8 19.9 -2.87 23.0 19.9 -3.11 22.7 20.7 -2.02 20.9 18.8 -2.08 %B 70.6 68.8 -1.79 69.1 66.3 -2.78 69.2 66.7 -2.64 65.2 63.7 -1.57 67.4 64.6 -2.79 %CCC 5.78 6.60 0.82 5.13 7.97 2.84 5.02 7.41 2.39 8.51 9.40 0.89 7.92 10.8 2.83 %CC 0.06 0.80 0.74 0.14 0.56 0.42 0.11 0.56 0.45 0.36 0.44 0.08 0.32 0.38 0.06 %D 0.72 1.88 1.16 0.73 1.95 1.22 0.68 2.11 1.43 1.29 2.67 1.38 2.30 2.73 0.43 Total
100
100
100
100
100
100
100
100
100
100