Embed Size (px)
Citation preview


The Alliance Group
September 12, 2008

Best “sandbox” results in new jobs Major initiatives since 2005 aimed at improving Indiana’s competitiveness:
• Major Moves –Ten-year fully funded $12 billion highway plan that includes more than 200 new construction and 200 major preservation projects
• Telecommunications Reform - Indiana’s Telecommunications Deregulation Act has brought increased competition, leading to new investments and jobs
• Single Factor Sales Apportionment - Eliminates the tax penalty associated with companies adding jobs and investing in new capital equipment in Indiana
• R&D Tax Credit – Provides a tax credit equal to 15% of a company’s first $1 million of qualifying R&D expenditures, giving Indiana one of the highest R&D tax credit percentages in the country
• Patent Income Exemption - Exempts certain income derived from qualified patents from the calculation of a company’s tax liability
• Buy Indiana – Pumps up to $1.2 billion back into the Indiana economy by directing state agencies to purchase goods from Indiana businesses
• Health Care Plan – Provides insurance for up to 130,000 low-income Hoosiers annually and encourages Hoosiers to stop smoking

1st in the Midwest & 6th nationally
Source: Forbes Best States for Business Index 2008
Indiana Ranks Best in Midwest for Cost of Doing Business

1st in the Midwest and 12th nationally• Illinois (28th), Kentucky (36th), Michigan (29th), Ohio(46th)• Fifth consecutive year of top competitiveness award
Source: Tax Foundation’s 2008 Business Tax Climate Index
Foundation Ranks Indiana Best in Midwest for Low Taxes

CNBC Names Indiana “Most Improved State for Business”
1st in the Midwest and 13th nationally• 3rd Nationally for overall “business friendliness”• 4th Nationally for strength in transportation infrastructure
Source: CNBC, July 2008

1st in the Midwest and 8th nationally• Best Places for Business Survey• 605 top CEOs Source: Chief Executive Magazine, Jan. 2008
Executives Rank Indiana Best in Midwest
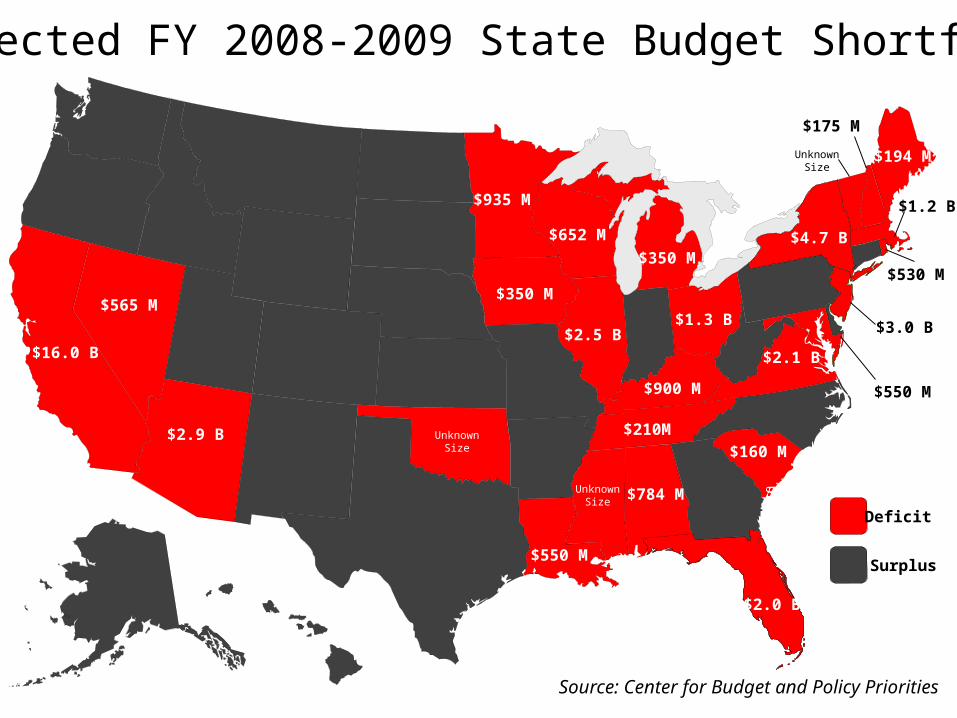
$784 M
$2.9 B
$16.0 B
Projected FY 2008-2009 State Budget Shortfalls
$2.0 B
$350 M
UnknownSize
$550 M
$2.5 B
$350 M
$900 M
$194 M
$550 M
$1.2 B$935 M
$565 M
$175 M
$3.0 B
$4.7 B
$530 M
$160 M
$2.1 B
$652 M
$1.3 B
UnknownSize
UnknownSize
$210M
Source: Center for Budget and Policy Priorities
Surplus
Deficit

‘Diversifying Economy’ Helps Earn Indiana Best Credit Rating in History
One of 10 States with AAA rating• S&P cited state’s diversifying economy, budgeting,
property tax reform and low debt as rationale for upgrade

Record-breaking Commitments for New Jobs, Investment
New Capital Investment
* As of 9/02/08
• Since its creation, the IEDC has worked with more than 590 businesses who have committed to create more than 72K new jobs and invest more than $17.9B
• The average wage for new jobs committed in 2008 is $20.87/hour –
well above state average of $18/hour.
0
5,000
10,000
15,000
20,000
25,000
7,726 8,519
15,523
21,995 22,627
12,870 *
New Job Commitments
2003 2004 2005 2006 2007 2008
0
1
2
3
4
5
6
7
8
9
2.771
8.442
3.382 3.327 *
2005 2006 2007 2008
Bill
ion
s

• Projects located in 76 counties
• Nearly 80% within 10 miles of interstate
• More than half from existing Indiana companies
• Approx. half in cities/towns of < 25K
Record Success, World-Class Infrastructure

Diversifying Indiana’s Economy Indiana Economic Development Corporation Competitive Projects
2005 to Present*
(9,329)
(447)
(1,753)
(16,155)
(14,193)
(7,136)
(11,934)
(6,602)(3,509)
(1,495)
As of Aug. 11, 2008

13
• More than 13,800 new jobs & $6.4 Billion investment from FDI since 2005
• First in North America for attraction of production jobs through FDI
• Focus on Asia, Europe creating new jobs for Hoosiers
In-Sourcing Jobs

Top Ten Counties – Jobs per Capita
Indiana Economic Development Corporation Competitive Projects
2005 to Present*
• Tipton• Decatur• Boone• Starke• Newton• Clark• Hendricks• Whitley • Blackford• Noble

Top Ten Counties – Deals per Capita
Indiana Economic Development Corporation Competitive Projects
2005 to Present*
• Steuben• Blackford • Noble• Starke• Newton• Whitley• Hendricks• DeKalb• Randolph• Jay

Increasing Hoosier Income

$37,652
$11,699 $11,805 $8,469 $6,816 *0
5000
10000
15000
20000
25000
30000
35000
40000
2004 2005 2006 2007 2008* As of 9/2/08
• Direct state incentives include tax credits, training grants and infrastructure assistance
• Tax credits are performance-based linked to IEDC certification of new jobs• Average time of return on investment: approximately 2.5 years
Low cost of incentives yields quicker return