Embed Size (px)
Citation preview
1
Waterborne Energy, Inc.
The Americas Waterborne LNG Report
25 Aug 2011
Vol. 8, Week 34
2323 S. Shepherd Dr. Suite 1010 Houston, Texas
77019 713/526-1555 www.waterbornelng.com
2
Waterborne Energy, Inc.
2323 S. Shepherd Dr. Suite 1010 Houston, Texas
77019 713/526-1555 www.waterborneenergy.com
25 Aug 2011
Vol. 8, Week 34
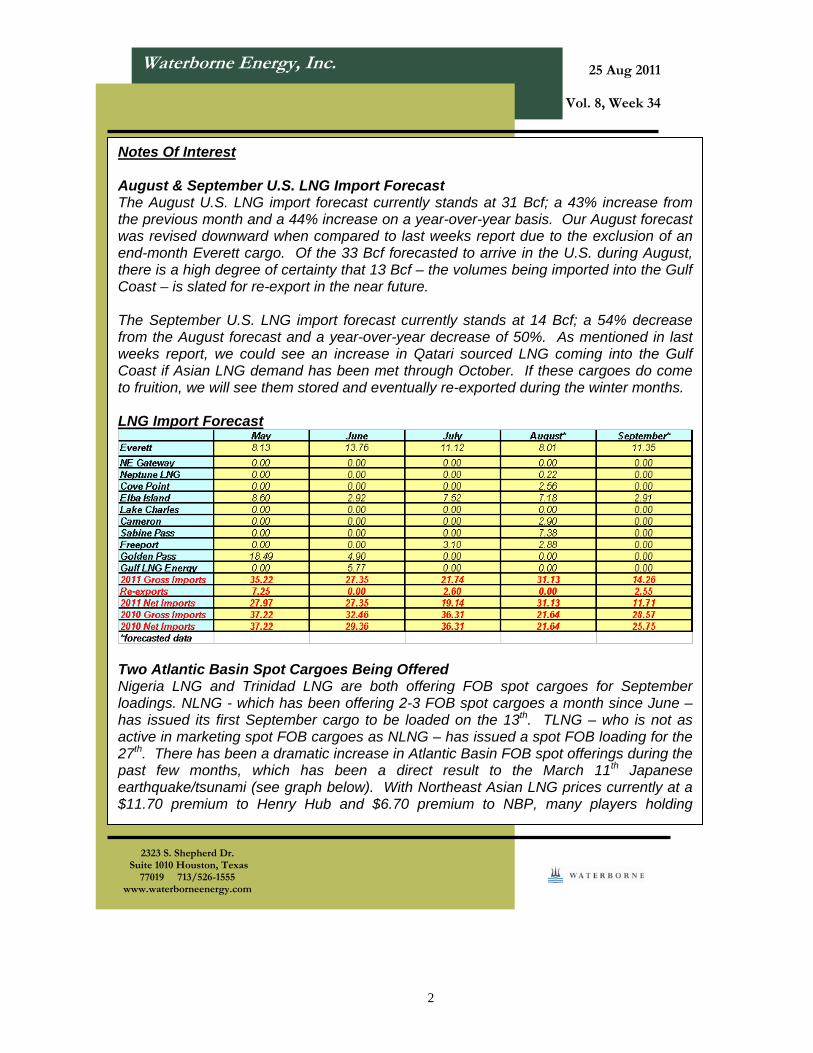
Notes Of Interest August & September U.S. LNG Import Forecast The August U.S. LNG import forecast currently stands at 31 Bcf; a 43% increase from the previous month and a 44% increase on a year-over-year basis. Our August forecast was revised downward when compared to last weeks report due to the exclusion of an end-month Everett cargo. Of the 33 Bcf forecasted to arrive in the U.S. during August, there is a high degree of certainty that 13 Bcf – the volumes being imported into the Gulf Coast – is slated for re-export in the near future. The September U.S. LNG import forecast currently stands at 14 Bcf; a 54% decrease from the August forecast and a year-over-year decrease of 50%. As mentioned in last weeks report, we could see an increase in Qatari sourced LNG coming into the Gulf Coast if Asian LNG demand has been met through October. If these cargoes do come to fruition, we will see them stored and eventually re-exported during the winter months. LNG Import Forecast
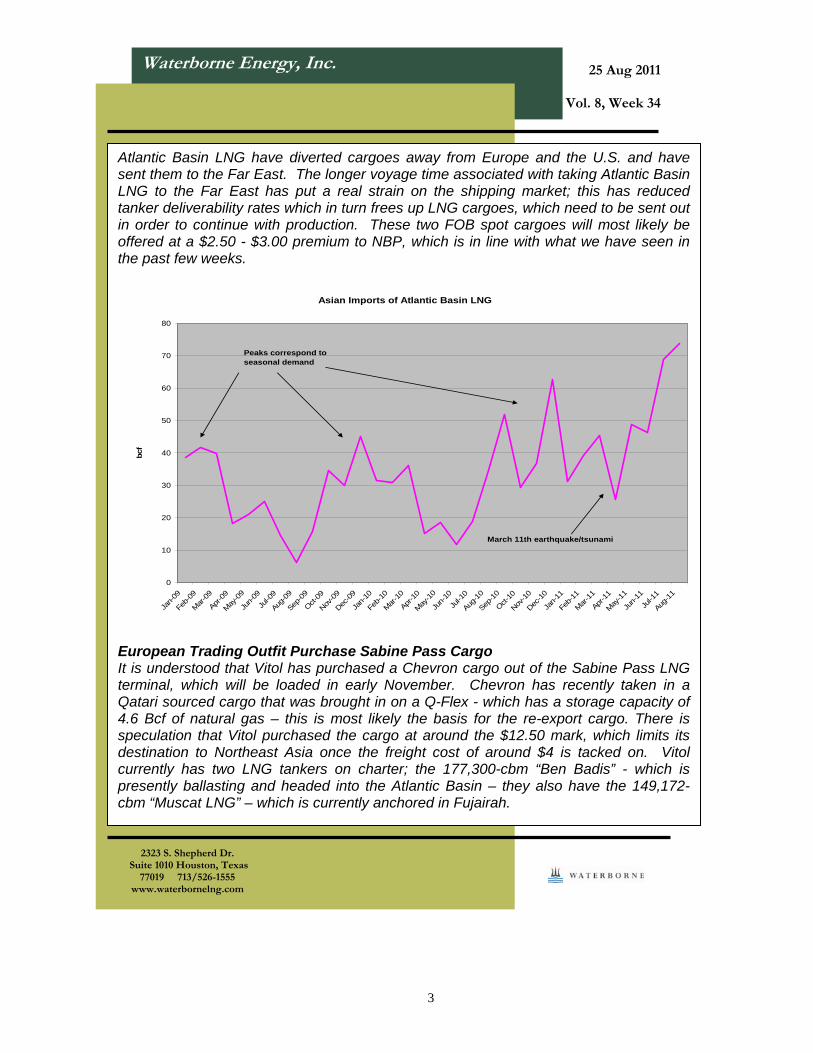
Two Atlantic Basin Spot Cargoes Being Offered Nigeria LNG and Trinidad LNG are both offering FOB spot cargoes for September loadings. NLNG - which has been offering 2-3 FOB spot cargoes a month since June – has issued its first September cargo to be loaded on the 13th. TLNG – who is not as active in marketing spot FOB cargoes as NLNG – has issued a spot FOB loading for the 27th. There has been a dramatic increase in Atlantic Basin FOB spot offerings during the past few months, which has been a direct result to the March 11th Japanese earthquake/tsunami (see graph below). With Northeast Asian LNG prices currently at a $11.70 premium to Henry Hub and $6.70 premium to NBP, many players holding
3
Waterborne Energy, Inc.
2323 S. Shepherd Dr. Suite 1010 Houston, Texas
77019 713/526-1555 www.waterbornelng.com
25 Aug 2011
Vol. 8, Week 34
Atlantic Basin LNG have diverted cargoes away from Europe and the U.S. and have sent them to the Far East. The longer voyage time associated with taking Atlantic Basin LNG to the Far East has put a real strain on the shipping market; this has reduced tanker deliverability rates which in turn frees up LNG cargoes, which need to be sent out in order to continue with production. These two FOB spot cargoes will most likely be offered at a $2.50 - $3.00 premium to NBP, which is in line with what we have seen in the past few weeks.
Asian Imports of Atlantic Basin LNG
0
10
20
30
40
50
60
70
80
Jan-
09
Feb-
09
Mar
-09
Apr-0
9
May
-09
Jun-
09
Jul-0
9
Aug-0
9
Sep-0
9
Oct-0
9
Nov-0
9
Dec-0
9
Jan-
10
Feb-
10
Mar
-10
Apr-1
0
May
-10
Jun-
10
Jul-1
0
Aug-1
0
Sep-1
0
Oct-1
0
Nov-1
0
Dec-1
0
Jan-
11
Feb-
11
Mar
-11
Apr-1
1
May
-11
Jun-
11
Jul-1
1
Aug-1
1
bcf
Peaks correspond to seasonal demand
March 11th earthquake/tsunami
European Trading Outfit Purchase Sabine Pass Cargo It is understood that Vitol has purchased a Chevron cargo out of the Sabine Pass LNG terminal, which will be loaded in early November. Chevron has recently taken in a Qatari sourced cargo that was brought in on a Q-Flex - which has a storage capacity of 4.6 Bcf of natural gas – this is most likely the basis for the re-export cargo. There is speculation that Vitol purchased the cargo at around the $12.50 mark, which limits its destination to Northeast Asia once the freight cost of around $4 is tacked on. Vitol currently has two LNG tankers on charter; the 177,300-cbm “Ben Badis” - which is presently ballasting and headed into the Atlantic Basin – they also have the 149,172-cbm “Muscat LNG” – which is currently anchored in Fujairah.
4
Waterborne Energy, Inc.
2323 S. Shepherd Dr. Suite 1010 Houston, Texas
77019 713/526-1555 www.waterbornelng.com
25 Aug 2011
Vol. 8, Week 34
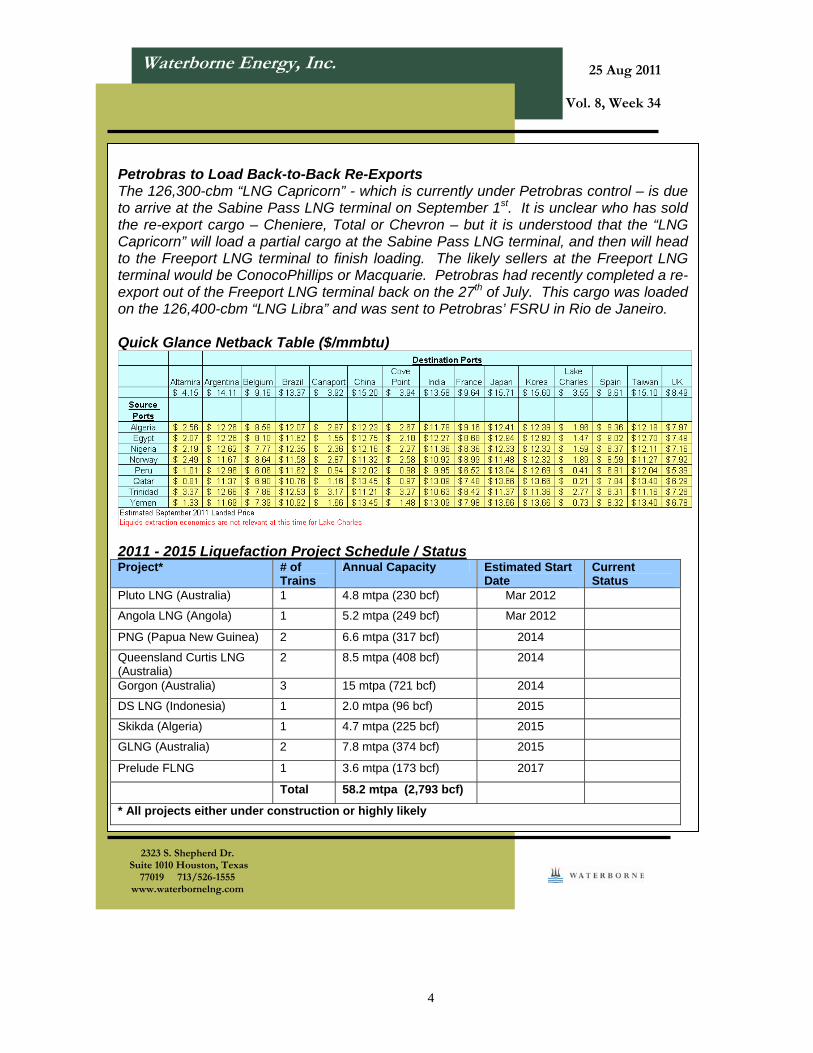
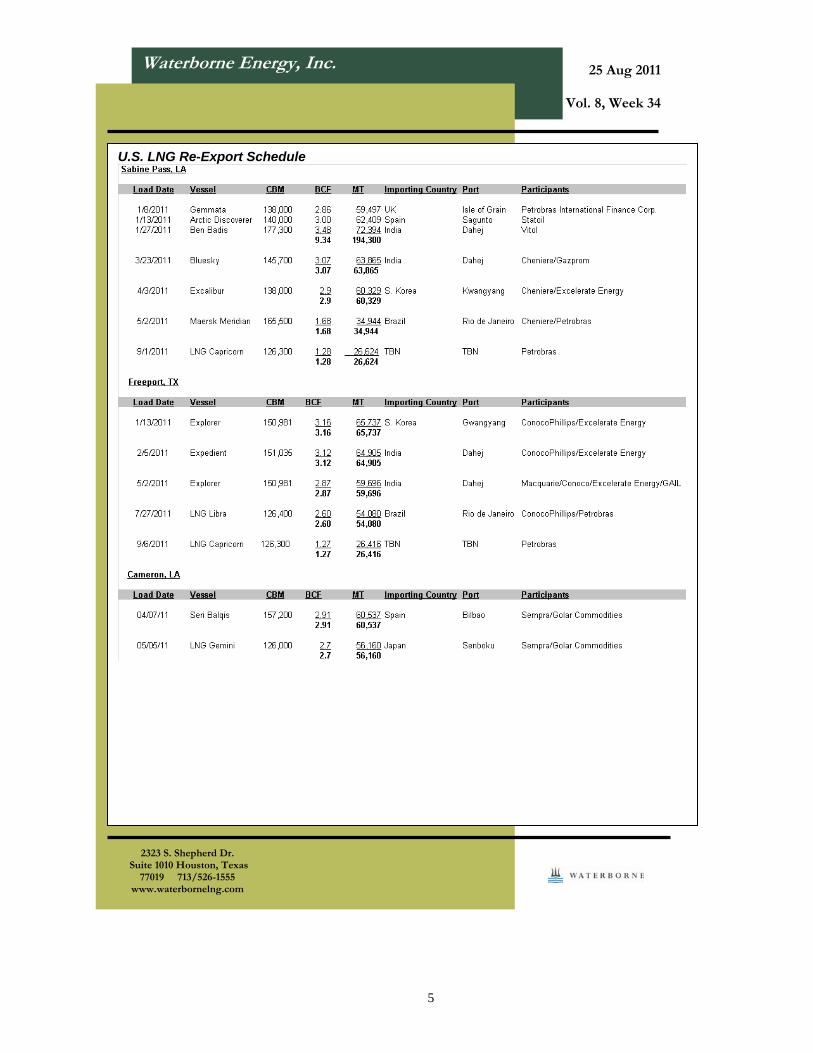
Petrobras to Load Back-to-Back Re-Exports The 126,300-cbm “LNG Capricorn” - which is currently under Petrobras control – is due to arrive at the Sabine Pass LNG terminal on September 1st. It is unclear who has sold the re-export cargo – Cheniere, Total or Chevron – but it is understood that the “LNG Capricorn” will load a partial cargo at the Sabine Pass LNG terminal, and then will head to the Freeport LNG terminal to finish loading. The likely sellers at the Freeport LNG terminal would be ConocoPhillips or Macquarie. Petrobras had recently completed a re-export out of the Freeport LNG terminal back on the 27th of July. This cargo was loaded on the 126,400-cbm “LNG Libra” and was sent to Petrobras’ FSRU in Rio de Janeiro. Quick Glance Netback Table ($/mmbtu)
2011 - 2015 Liquefaction Project Schedule / Status Project* # of
Trains Annual Capacity Estimated Start
Date Current Status
Pluto LNG (Australia) 1 4.8 mtpa (230 bcf) Mar 2012
Angola LNG (Angola) 1 5.2 mtpa (249 bcf) Mar 2012
PNG (Papua New Guinea) 2 6.6 mtpa (317 bcf) 2014
Queensland Curtis LNG (Australia)
2 8.5 mtpa (408 bcf) 2014
Gorgon (Australia) 3 15 mtpa (721 bcf) 2014
DS LNG (Indonesia) 1 2.0 mtpa (96 bcf) 2015
Skikda (Algeria) 1 4.7 mtpa (225 bcf) 2015
GLNG (Australia) 2 7.8 mtpa (374 bcf) 2015
Prelude FLNG 1 3.6 mtpa (173 bcf) 2017
Total 58.2 mtpa (2,793 bcf)
* All projects either under construction or highly likely
5
Waterborne Energy, Inc.
2323 S. Shepherd Dr. Suite 1010 Houston, Texas
77019 713/526-1555 www.waterbornelng.com
25 Aug 2011
Vol. 8, Week 34
U.S. LNG Re-Export Schedule
6
Waterborne Energy, Inc.
2323 S. Shepherd Dr. Suite 1010 Houston, Texas
77019 713/526-1555 www.waterbornelng.com
25 Aug 2011
Vol. 8, Week 34
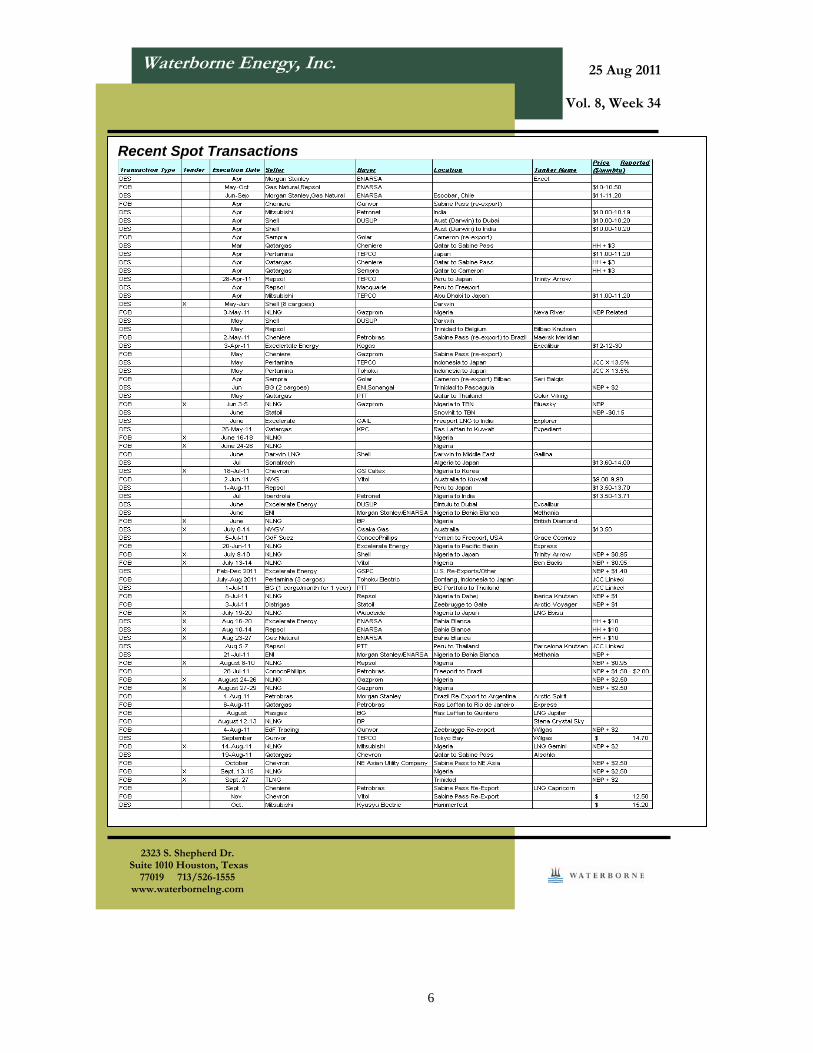
Recent Spot Transactions
7
Waterborne Energy, Inc.
2323 S. Shepherd Dr. Suite 1010 Houston, Texas
77019 713/526-1555 www.waterbornelng.com
25 Aug 2011
Vol. 8, Week 34
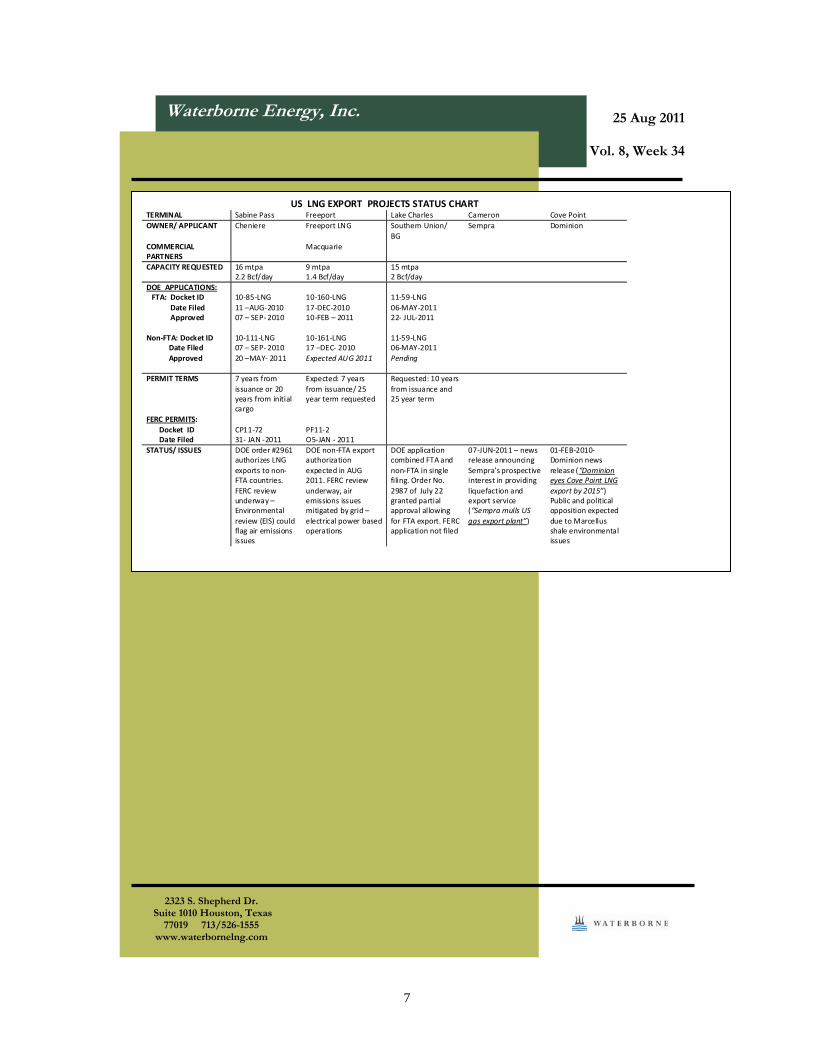
US LNG EXPORT PROJECTS STATUS CHART TERMINAL Sabine Pass Freeport Lake Charles Cameron Cove Point
OWNER/ APPLICANT Cheniere
Freeport LNG
Southern Union/
BG
Sempra Dominion
COMMERCIAL PARTNERS
Macquarie
CAPACITY REQUESTED 16 mtpa 2.2 Bcf/day
9 mtpa 1.4 Bcf/day
15 mtpa 2 Bcf/day
DOE APPLICATIONS: FTA: Docket ID
Date Filed Approved
Non‐FTA: Docket ID Date Filed
Approved
10‐85‐LNG
11 –AUG‐2010 07 – SEP‐ 2010
10‐111‐LNG 07 – SEP‐ 2010
20 –MAY‐ 2011
10‐160‐LNG
17‐DEC‐2010 10‐FEB – 2011
10‐161‐LNG 17 –DEC‐ 2010
Expected AUG 2011
11‐59‐LNG
06‐MAY‐2011 22‐ JUL‐2011
11‐59‐LNG 06‐MAY‐2011
Pending
PERMIT TERMS 7 years from
issuance or 20 years from initial cargo
Expected: 7 years
from issuance/ 25 year term requested
Requested: 10 years
from issuance and 25 year term
FERC PERMITS:
Docket ID Date Filed
CP11‐72 31‐ JAN ‐2011
PF11‐2 O5‐JAN ‐ 2011
STATUS/ ISSUES DOE order #2961 authorizes LNG
exports to non‐FTA countries.
FERC review underway – Environmental
review (EIS) could flag air emissions issues
DOE non‐FTA export authorization
expected in AUG 2011. FERC review
underway, air emissions issues mitigated by grid –
electrical power based operations
DOE application combined FTA and
non‐FTA in single filing. Order No.
2987 of July 22 granted partial approval allowing
for FTA export. FERC application not filed
07‐JUN‐2011 – news release announcing
Sempra’s prospective interest in providing
liquefaction and export service (“Sempra mulls US
gas export plant”)
01‐FEB‐2010‐ Dominion news
release (“Dominion eyes Cove Point LNG
export by 2015”) Public and political opposition expected
due to Marcellus shale environmental issues
8
9
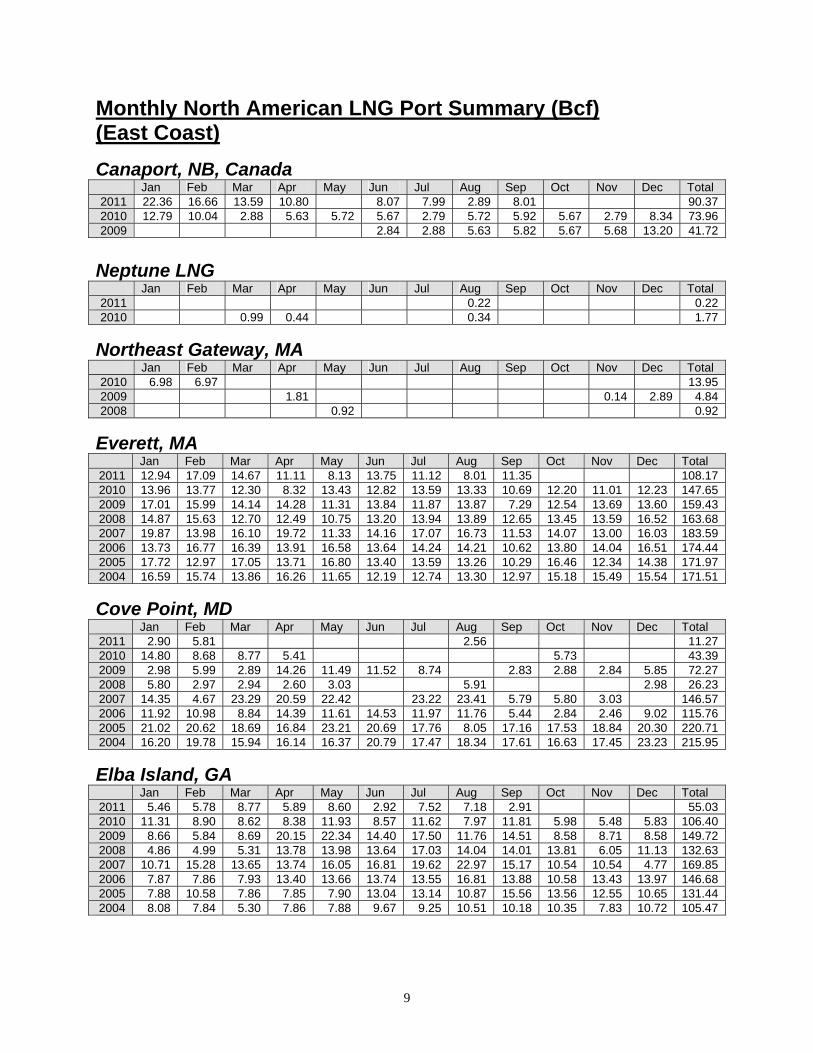
Monthly North American LNG Port Summary (Bcf) (East Coast)
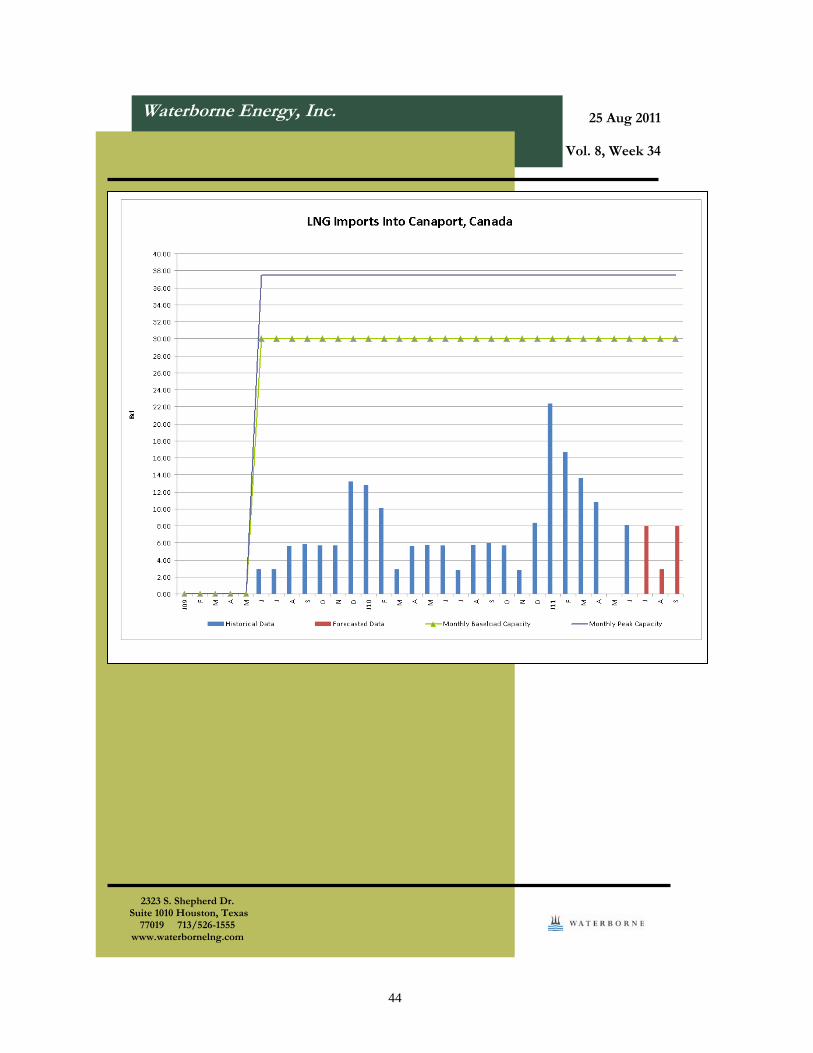
Canaport, NB, Canada Jan Feb Mar Apr May Jun Jul Aug Sep Oct Nov Dec Total 2011 22.36 16.66 13.59 10.80 8.07 7.99 2.89 8.01 90.37 2010 12.79 10.04 2.88 5.63 5.72 5.67 2.79 5.72 5.92 5.67 2.79 8.34 73.96 2009 2.84 2.88 5.63 5.82 5.67 5.68 13.20 41.72
Neptune LNG Jan Feb Mar Apr May Jun Jul Aug Sep Oct Nov Dec Total 2011 0.22 0.22 2010 0.99 0.44 0.34 1.77
Northeast Gateway, MA Jan Feb Mar Apr May Jun Jul Aug Sep Oct Nov Dec Total 2010 6.98 6.97 13.95 2009 1.81 0.14 2.89 4.84 2008 0.92 0.92
Everett, MA Jan Feb Mar Apr May Jun Jul Aug Sep Oct Nov Dec Total 2011 12.94 17.09 14.67 11.11 8.13 13.75 11.12 8.01 11.35 108.17 2010 13.96 13.77 12.30 8.32 13.43 12.82 13.59 13.33 10.69 12.20 11.01 12.23 147.65 2009 17.01 15.99 14.14 14.28 11.31 13.84 11.87 13.87 7.29 12.54 13.69 13.60 159.43 2008 14.87 15.63 12.70 12.49 10.75 13.20 13.94 13.89 12.65 13.45 13.59 16.52 163.68 2007 19.87 13.98 16.10 19.72 11.33 14.16 17.07 16.73 11.53 14.07 13.00 16.03 183.59 2006 13.73 16.77 16.39 13.91 16.58 13.64 14.24 14.21 10.62 13.80 14.04 16.51 174.44 2005 17.72 12.97 17.05 13.71 16.80 13.40 13.59 13.26 10.29 16.46 12.34 14.38 171.97 2004 16.59 15.74 13.86 16.26 11.65 12.19 12.74 13.30 12.97 15.18 15.49 15.54 171.51
Cove Point, MD Jan Feb Mar Apr May Jun Jul Aug Sep Oct Nov Dec Total 2011 2.90 5.81 2.56 11.27 2010 14.80 8.68 8.77 5.41 5.73 43.39 2009 2.98 5.99 2.89 14.26 11.49 11.52 8.74 2.83 2.88 2.84 5.85 72.27 2008 5.80 2.97 2.94 2.60 3.03 5.91 2.98 26.23 2007 14.35 4.67 23.29 20.59 22.42 23.22 23.41 5.79 5.80 3.03 146.57 2006 11.92 10.98 8.84 14.39 11.61 14.53 11.97 11.76 5.44 2.84 2.46 9.02 115.76 2005 21.02 20.62 18.69 16.84 23.21 20.69 17.76 8.05 17.16 17.53 18.84 20.30 220.71 2004 16.20 19.78 15.94 16.14 16.37 20.79 17.47 18.34 17.61 16.63 17.45 23.23 215.95
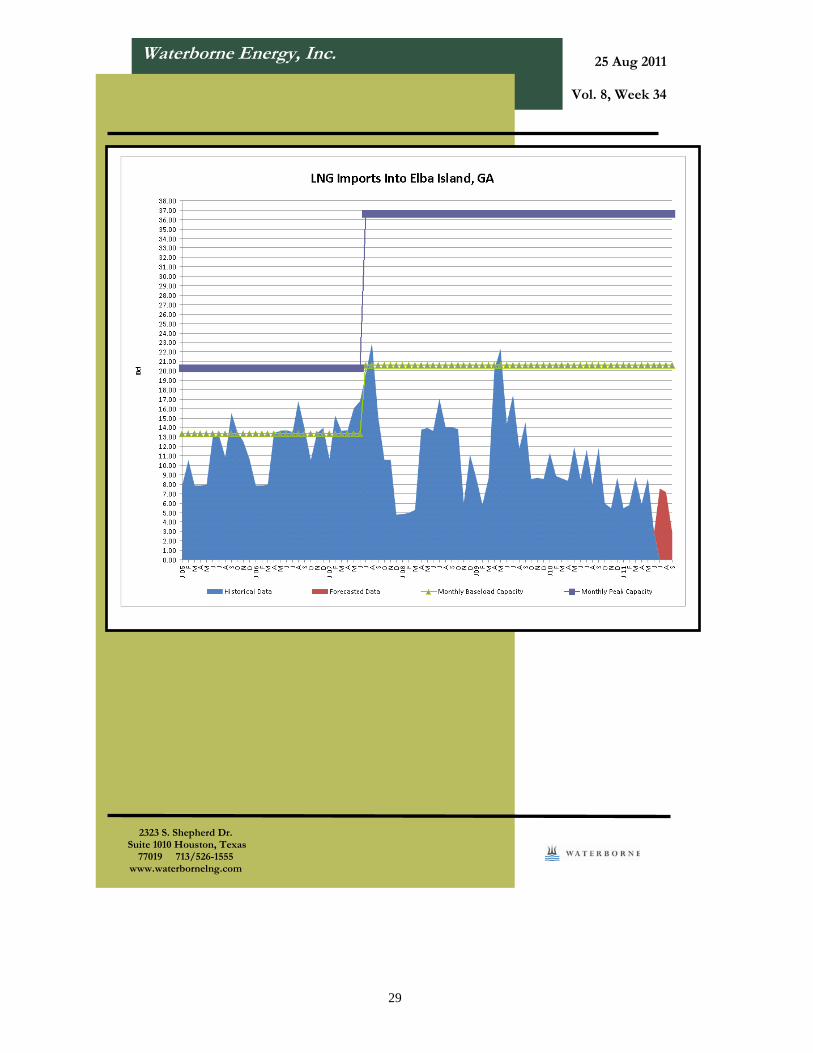
Elba Island, GA Jan Feb Mar Apr May Jun Jul Aug Sep Oct Nov Dec Total 2011 5.46 5.78 8.77 5.89 8.60 2.92 7.52 7.18 2.91 55.03 2010 11.31 8.90 8.62 8.38 11.93 8.57 11.62 7.97 11.81 5.98 5.48 5.83 106.40 2009 8.66 5.84 8.69 20.15 22.34 14.40 17.50 11.76 14.51 8.58 8.71 8.58 149.72 2008 4.86 4.99 5.31 13.78 13.98 13.64 17.03 14.04 14.01 13.81 6.05 11.13 132.63 2007 10.71 15.28 13.65 13.74 16.05 16.81 19.62 22.97 15.17 10.54 10.54 4.77 169.85 2006 7.87 7.86 7.93 13.40 13.66 13.74 13.55 16.81 13.88 10.58 13.43 13.97 146.68 2005 7.88 10.58 7.86 7.85 7.90 13.04 13.14 10.87 15.56 13.56 12.55 10.65 131.44 2004 8.08 7.84 5.30 7.86 7.88 9.67 9.25 10.51 10.18 10.35 7.83 10.72 105.47
10
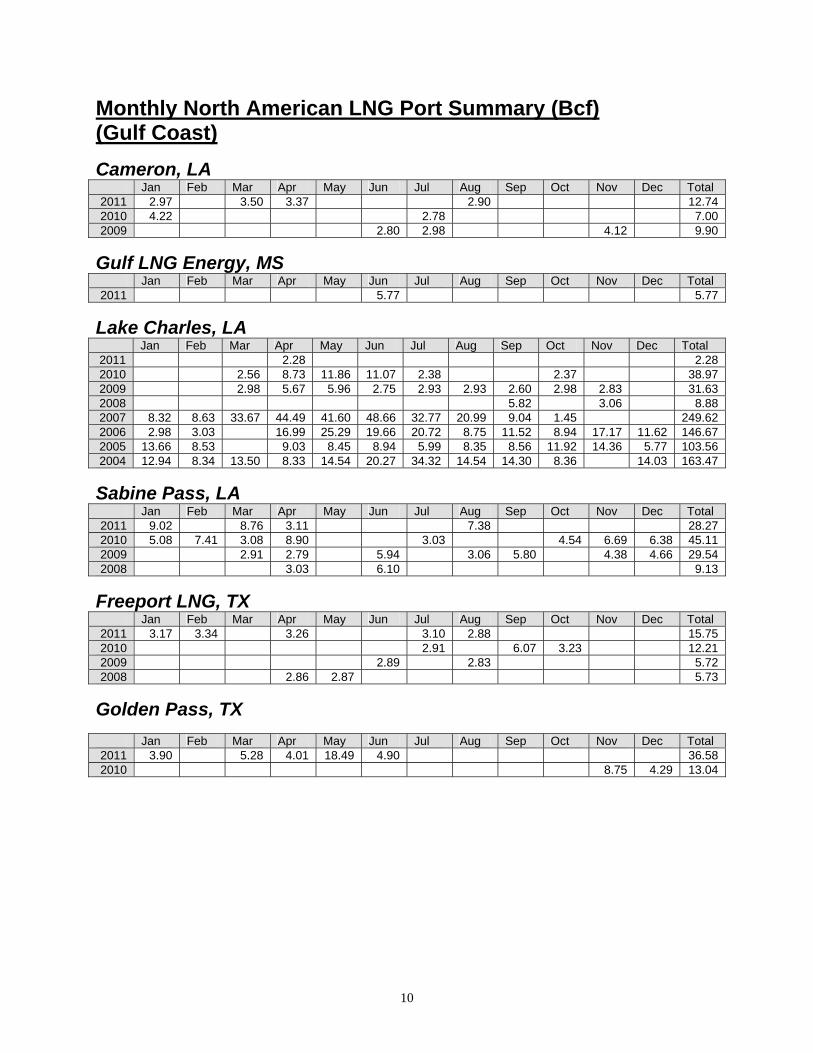
Monthly North American LNG Port Summary (Bcf) (Gulf Coast)
Cameron, LA Jan Feb Mar Apr May Jun Jul Aug Sep Oct Nov Dec Total 2011 2.97 3.50 3.37 2.90 12.74 2010 4.22 2.78 7.00 2009 2.80 2.98 4.12 9.90
Gulf LNG Energy, MS Jan Feb Mar Apr May Jun Jul Aug Sep Oct Nov Dec Total 2011 5.77 5.77
Lake Charles, LA Jan Feb Mar Apr May Jun Jul Aug Sep Oct Nov Dec Total 2011 2.28 2.28 2010 2.56 8.73 11.86 11.07 2.38 2.37 38.97 2009 2.98 5.67 5.96 2.75 2.93 2.93 2.60 2.98 2.83 31.63 2008 5.82 3.06 8.88 2007 8.32 8.63 33.67 44.49 41.60 48.66 32.77 20.99 9.04 1.45 249.62 2006 2.98 3.03 16.99 25.29 19.66 20.72 8.75 11.52 8.94 17.17 11.62 146.67 2005 13.66 8.53 9.03 8.45 8.94 5.99 8.35 8.56 11.92 14.36 5.77 103.56 2004 12.94 8.34 13.50 8.33 14.54 20.27 34.32 14.54 14.30 8.36 14.03 163.47
Sabine Pass, LA Jan Feb Mar Apr May Jun Jul Aug Sep Oct Nov Dec Total 2011 9.02 8.76 3.11 7.38 28.27 2010 5.08 7.41 3.08 8.90 3.03 4.54 6.69 6.38 45.11 2009 2.91 2.79 5.94 3.06 5.80 4.38 4.66 29.54 2008 3.03 6.10 9.13
Freeport LNG, TX Jan Feb Mar Apr May Jun Jul Aug Sep Oct Nov Dec Total 2011 3.17 3.34 3.26 3.10 2.88 15.75 2010 2.91 6.07 3.23 12.21 2009 2.89 2.83 5.72 2008 2.86 2.87 5.73
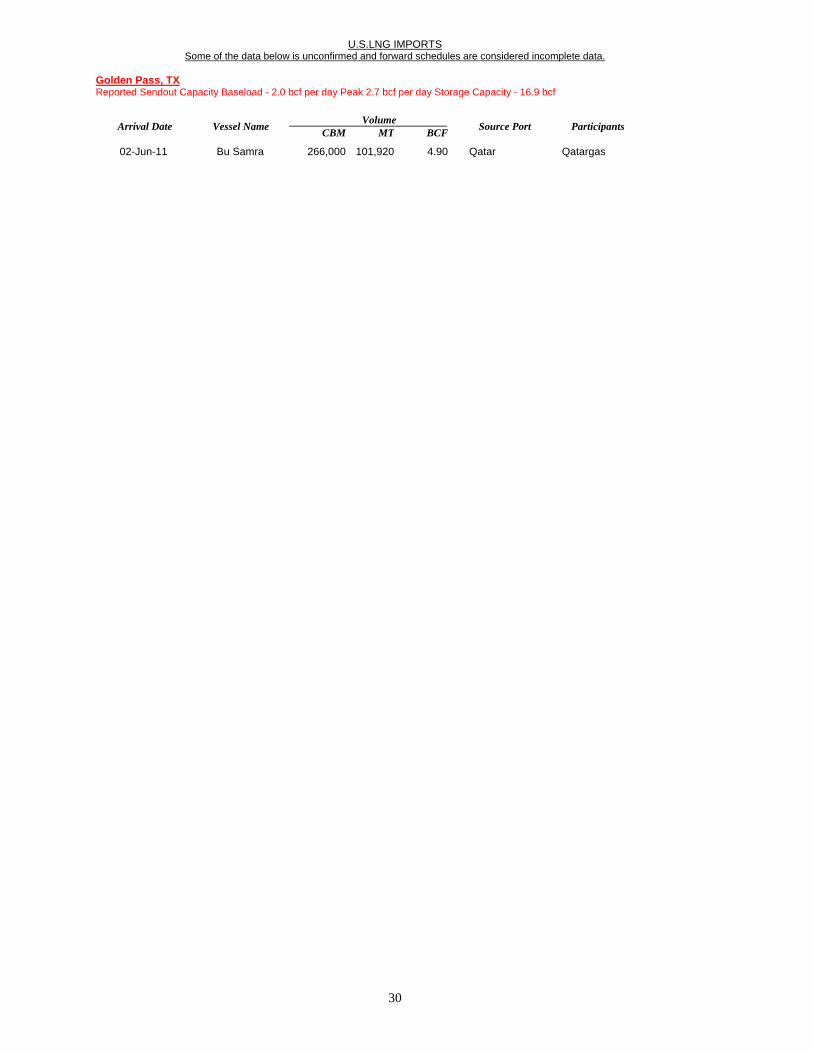
Golden Pass, TX Jan Feb Mar Apr May Jun Jul Aug Sep Oct Nov Dec Total 2011 3.90 5.28 4.01 18.49 4.90 36.58 2010 8.75 4.29 13.04
11
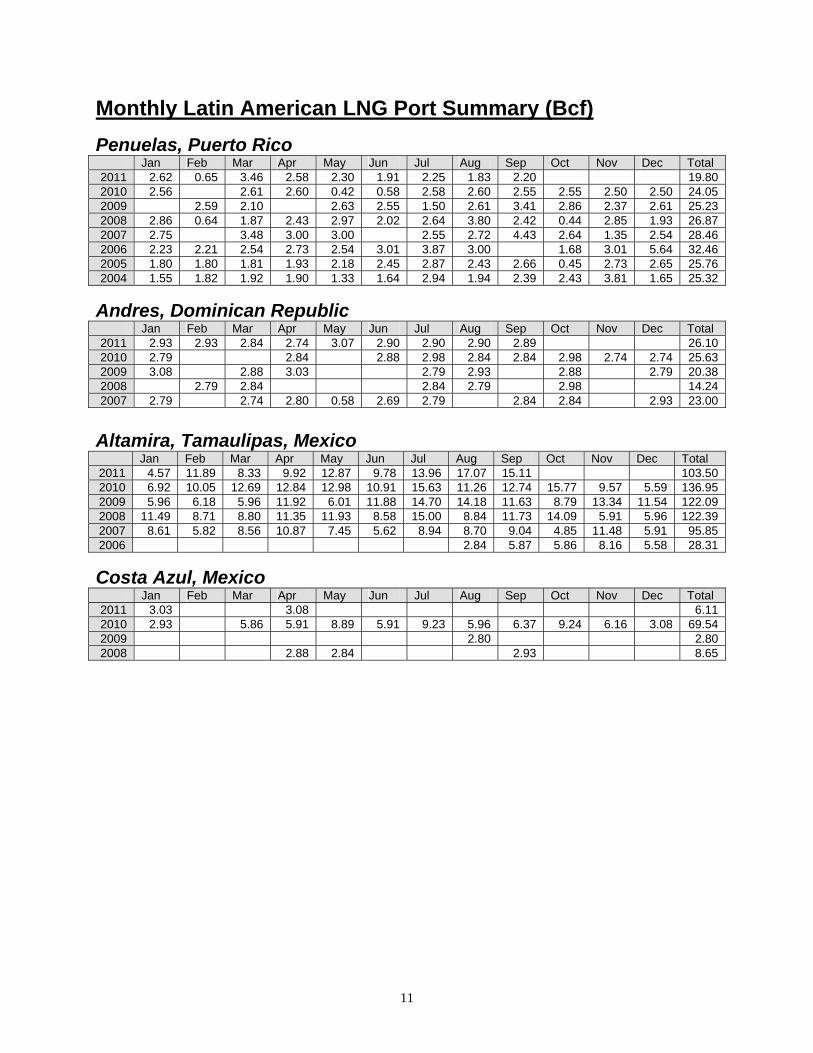
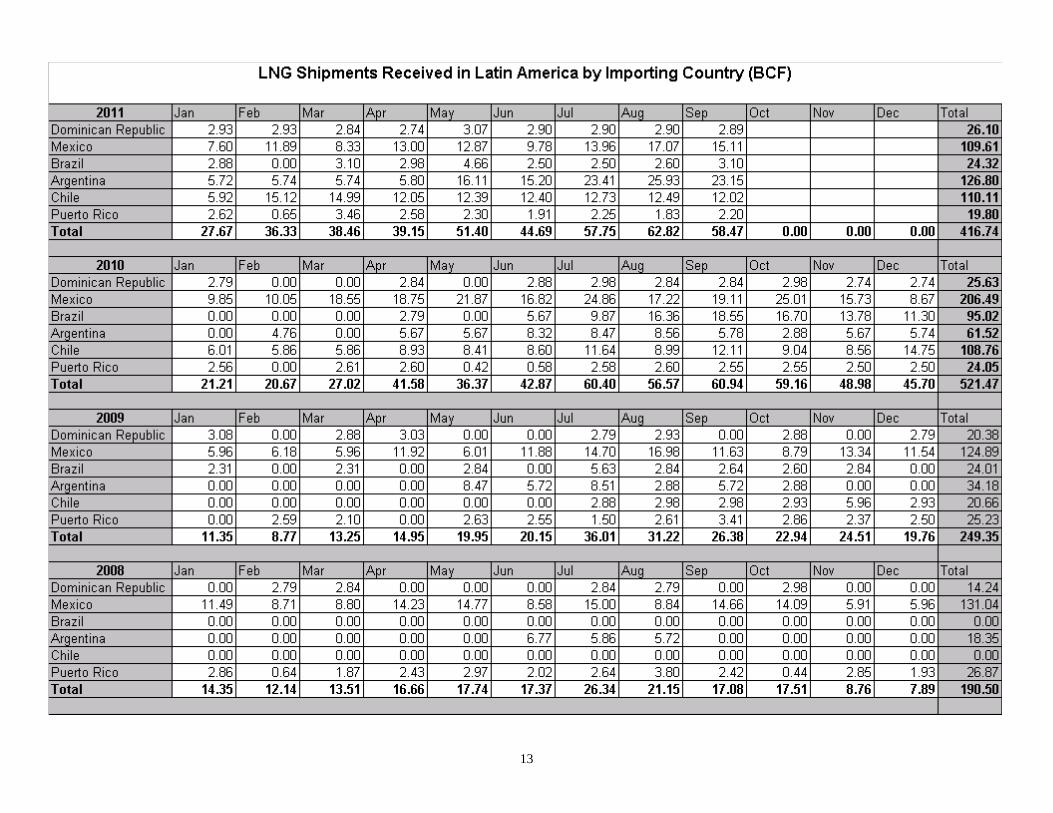
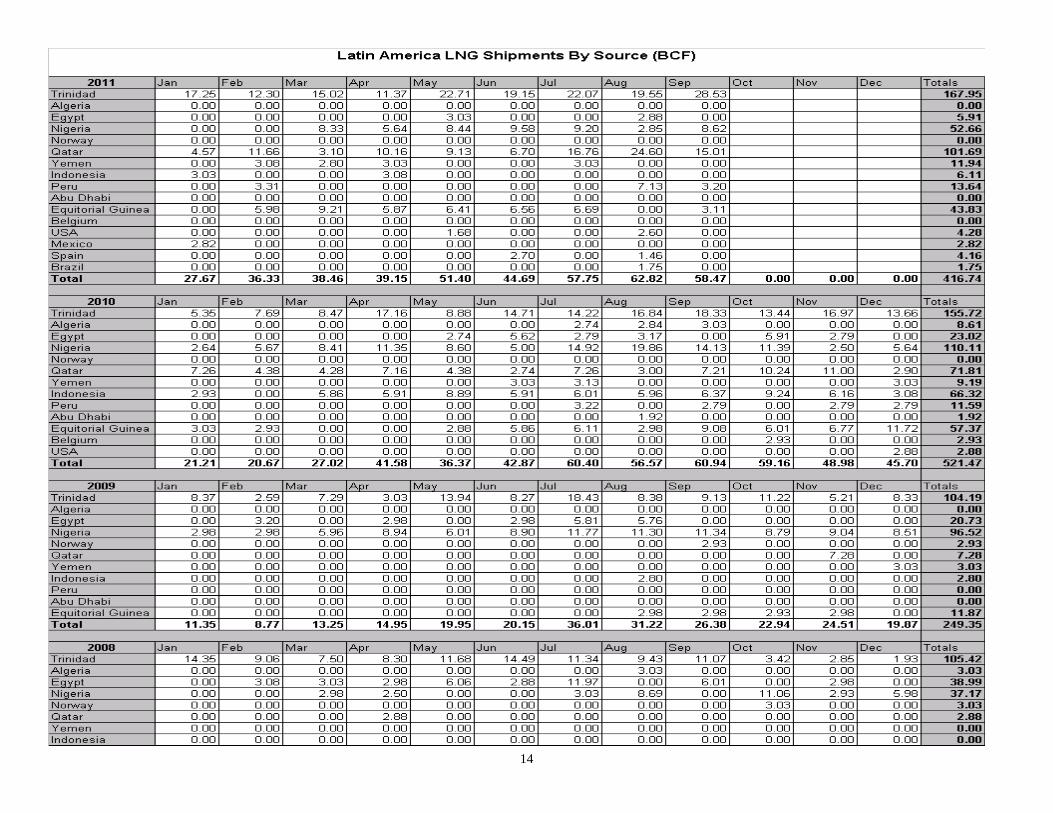
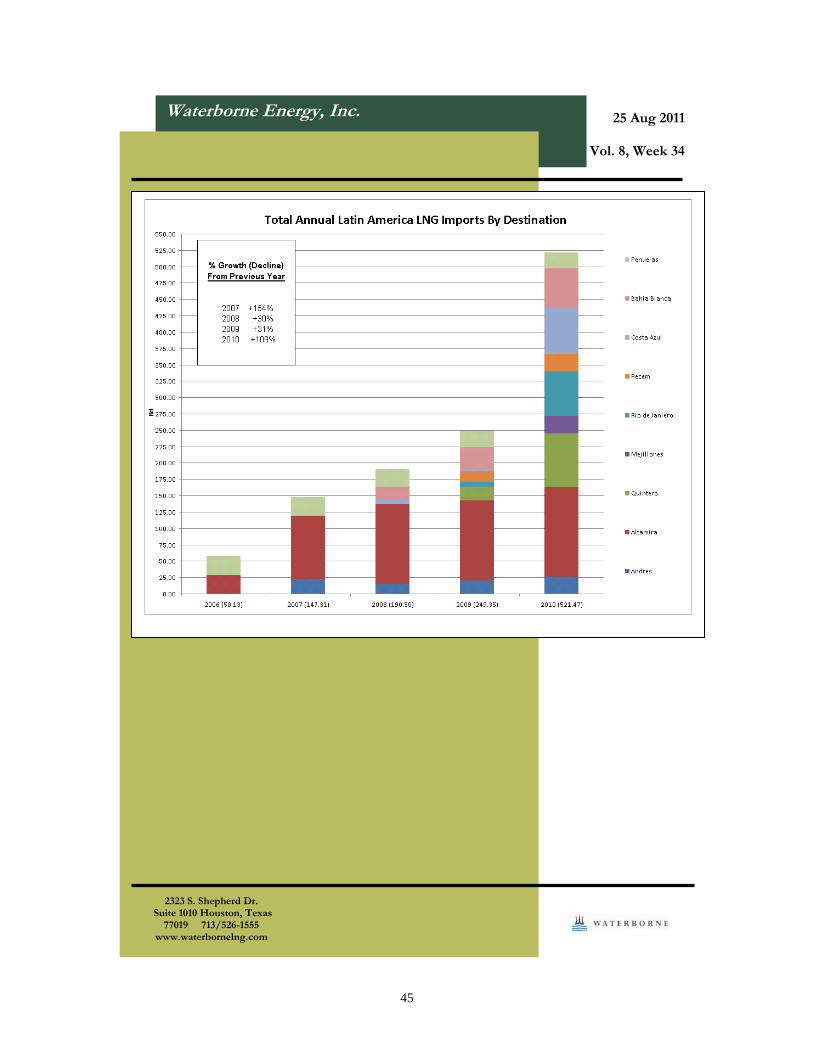
Monthly Latin American LNG Port Summary (Bcf)
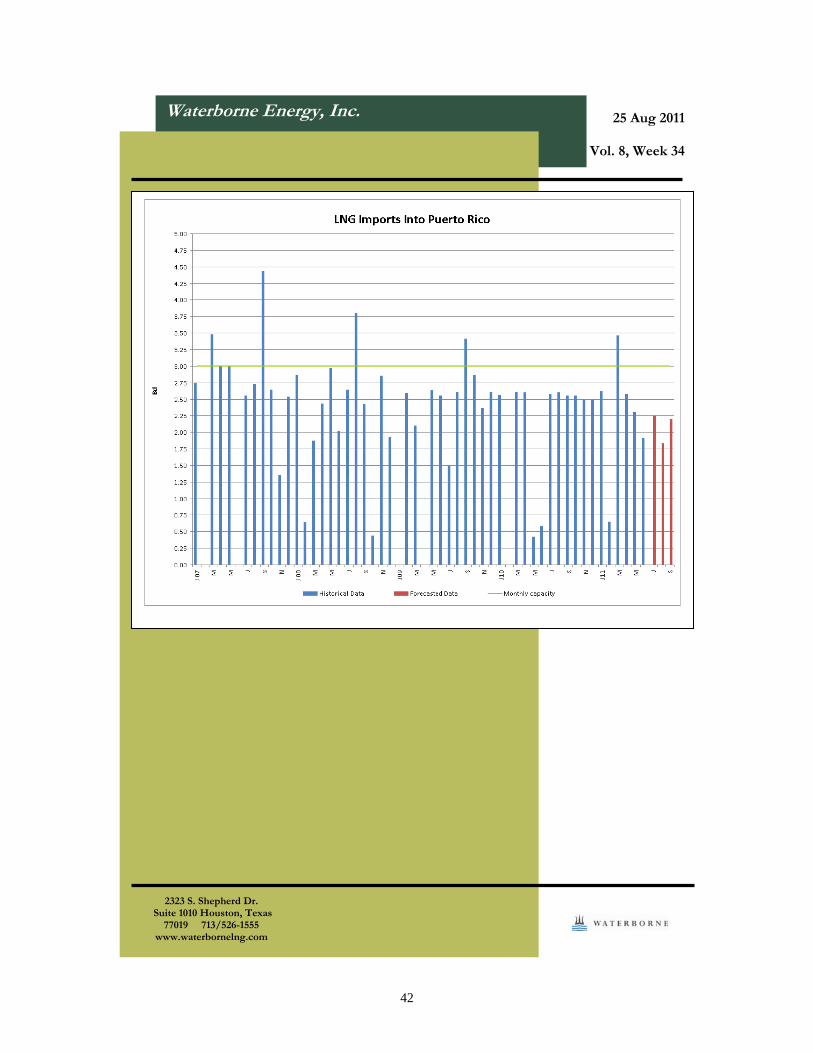
Penuelas, Puerto Rico Jan Feb Mar Apr May Jun Jul Aug Sep Oct Nov Dec Total 2011 2.62 0.65 3.46 2.58 2.30 1.91 2.25 1.83 2.20 19.80 2010 2.56 2.61 2.60 0.42 0.58 2.58 2.60 2.55 2.55 2.50 2.50 24.05 2009 2.59 2.10 2.63 2.55 1.50 2.61 3.41 2.86 2.37 2.61 25.23 2008 2.86 0.64 1.87 2.43 2.97 2.02 2.64 3.80 2.42 0.44 2.85 1.93 26.87 2007 2.75 3.48 3.00 3.00 2.55 2.72 4.43 2.64 1.35 2.54 28.46 2006 2.23 2.21 2.54 2.73 2.54 3.01 3.87 3.00 1.68 3.01 5.64 32.46 2005 1.80 1.80 1.81 1.93 2.18 2.45 2.87 2.43 2.66 0.45 2.73 2.65 25.76 2004 1.55 1.82 1.92 1.90 1.33 1.64 2.94 1.94 2.39 2.43 3.81 1.65 25.32
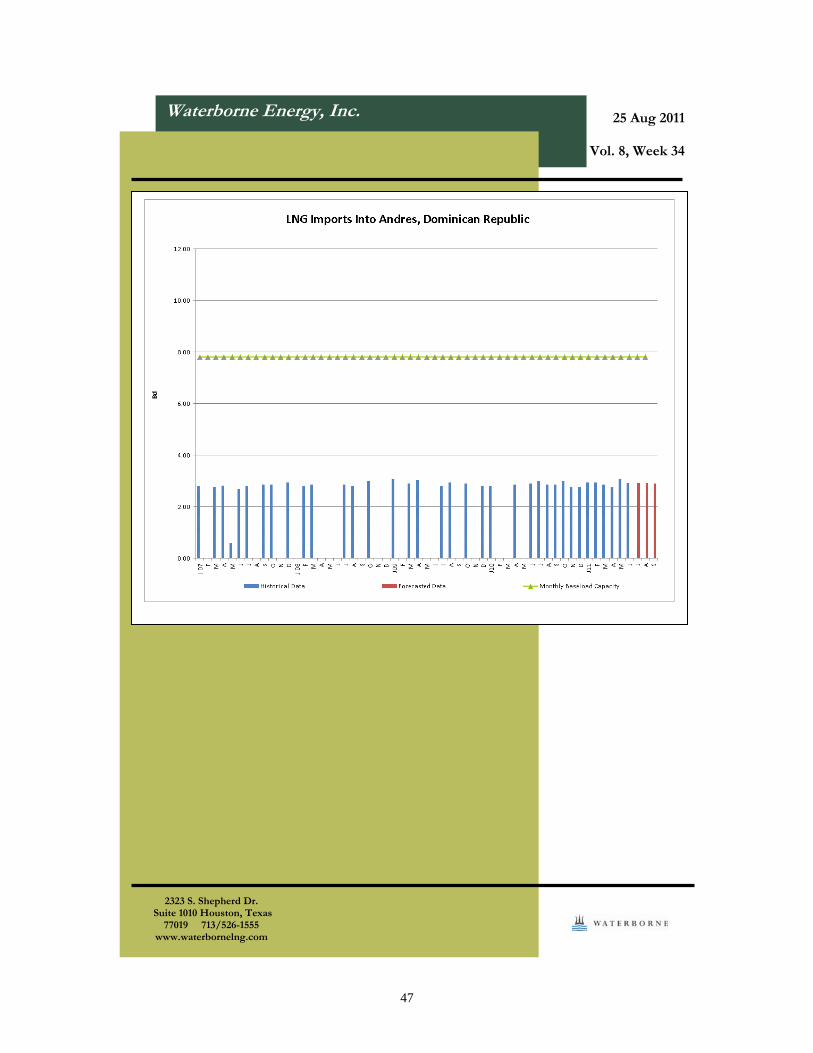
Andres, Dominican Republic Jan Feb Mar Apr May Jun Jul Aug Sep Oct Nov Dec Total 2011 2.93 2.93 2.84 2.74 3.07 2.90 2.90 2.90 2.89 26.10 2010 2.79 2.84 2.88 2.98 2.84 2.84 2.98 2.74 2.74 25.63 2009 3.08 2.88 3.03 2.79 2.93 2.88 2.79 20.38 2008 2.79 2.84 2.84 2.79 2.98 14.24 2007 2.79 2.74 2.80 0.58 2.69 2.79 2.84 2.84 2.93 23.00
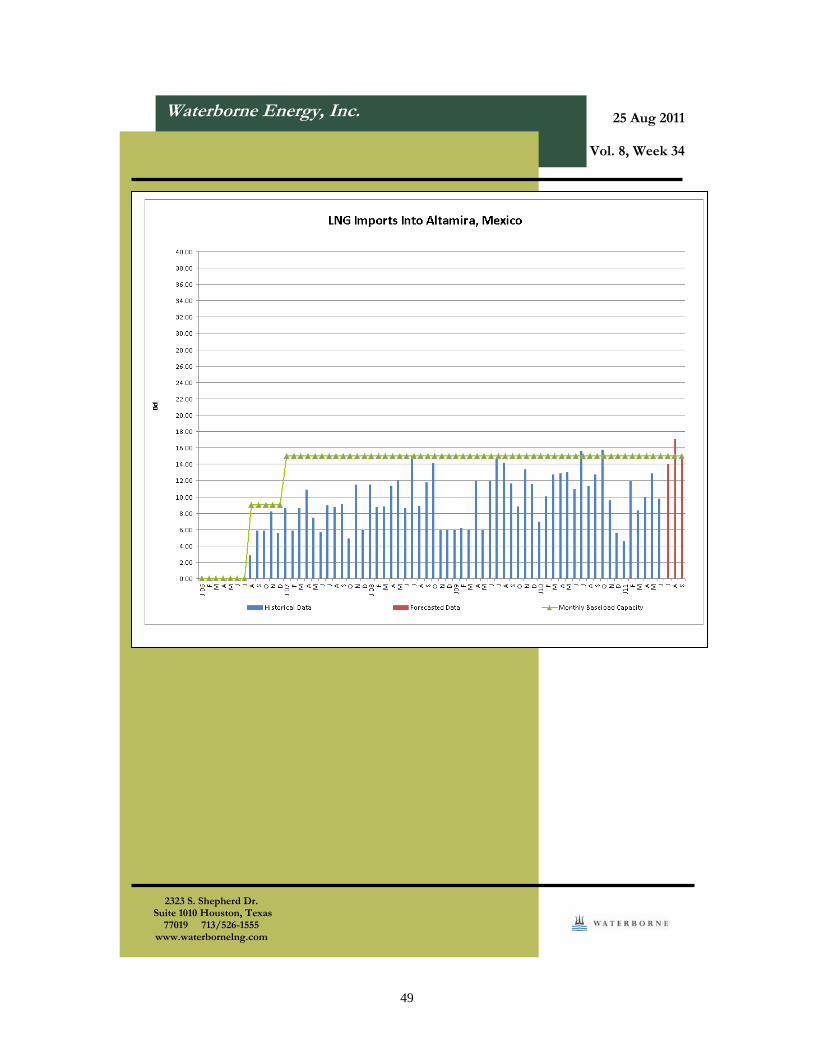
Altamira, Tamaulipas, Mexico Jan Feb Mar Apr May Jun Jul Aug Sep Oct Nov Dec Total 2011 4.57 11.89 8.33 9.92 12.87 9.78 13.96 17.07 15.11 103.50 2010 6.92 10.05 12.69 12.84 12.98 10.91 15.63 11.26 12.74 15.77 9.57 5.59 136.95 2009 5.96 6.18 5.96 11.92 6.01 11.88 14.70 14.18 11.63 8.79 13.34 11.54 122.09 2008 11.49 8.71 8.80 11.35 11.93 8.58 15.00 8.84 11.73 14.09 5.91 5.96 122.39 2007 8.61 5.82 8.56 10.87 7.45 5.62 8.94 8.70 9.04 4.85 11.48 5.91 95.85 2006 2.84 5.87 5.86 8.16 5.58 28.31
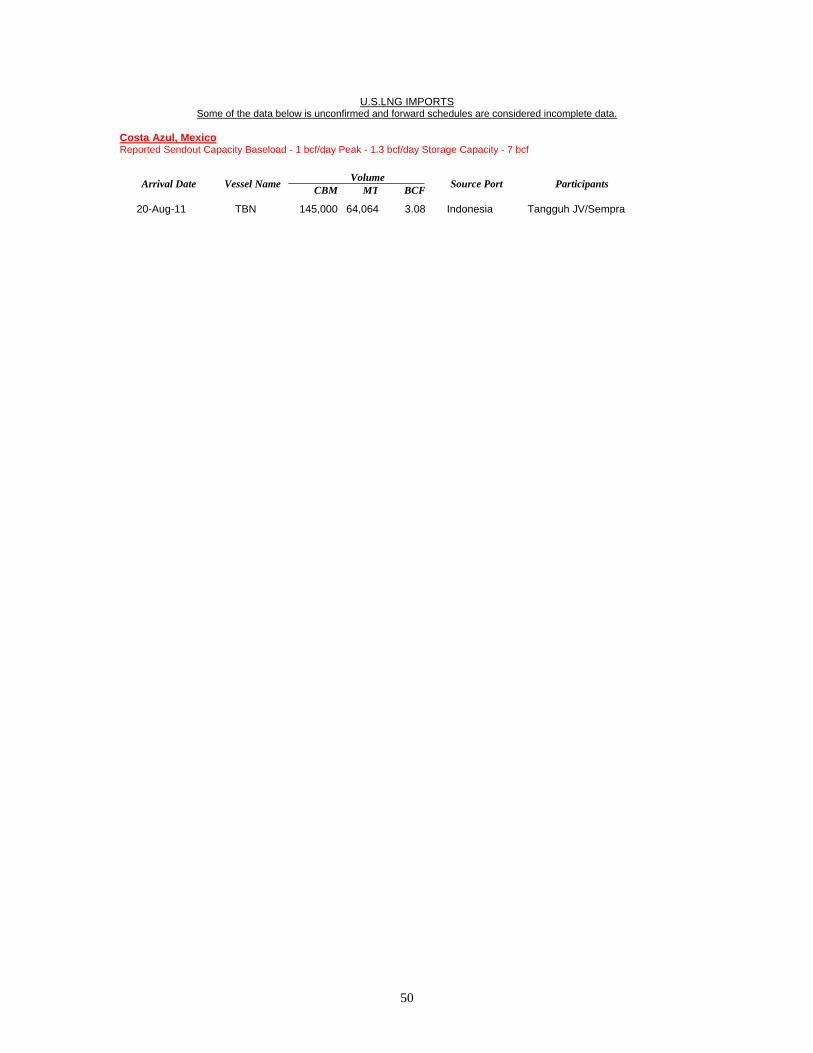
Costa Azul, Mexico Jan Feb Mar Apr May Jun Jul Aug Sep Oct Nov Dec Total 2011 3.03 3.08 6.11 2010 2.93 5.86 5.91 8.89 5.91 9.23 5.96 6.37 9.24 6.16 3.08 69.54 2009 2.80 2.80 2008 2.88 2.84 2.93 8.65
12
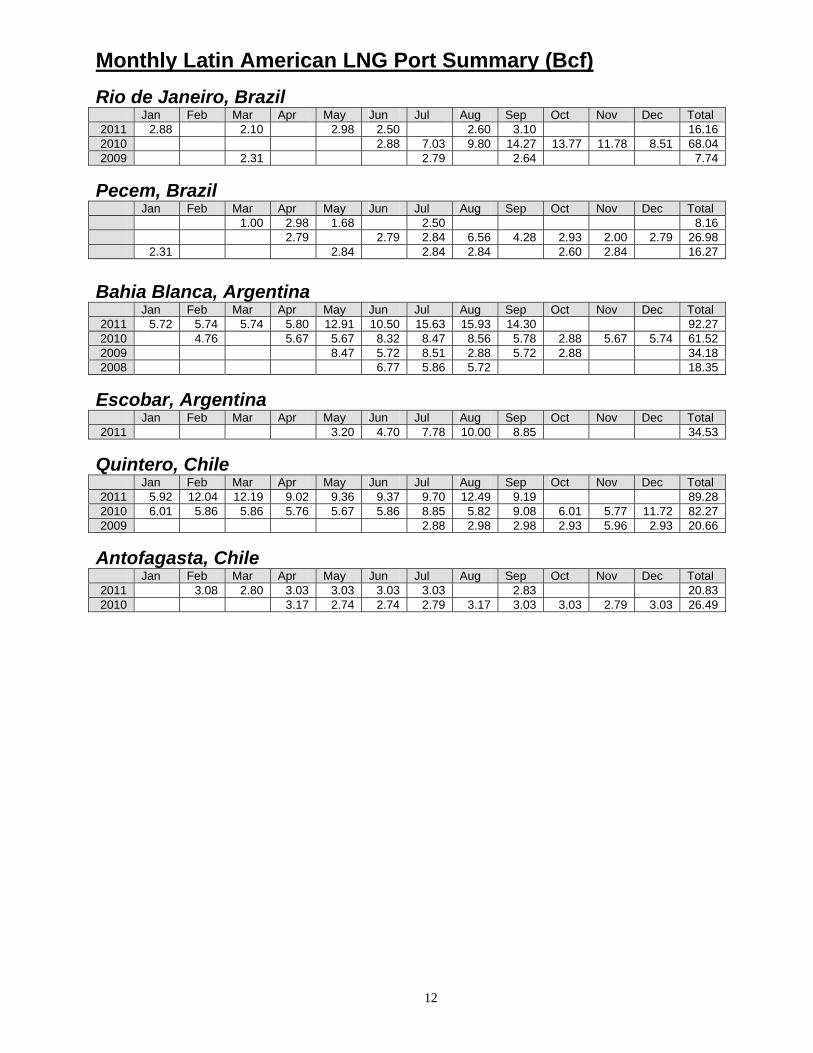
Monthly Latin American LNG Port Summary (Bcf)
Rio de Janeiro, Brazil Jan Feb Mar Apr May Jun Jul Aug Sep Oct Nov Dec Total 2011 2.88 2.10 2.98 2.50 2.60 3.10 16.16 2010 2.88 7.03 9.80 14.27 13.77 11.78 8.51 68.04 2009 2.31 2.79 2.64 7.74
Pecem, Brazil Jan Feb Mar Apr May Jun Jul Aug Sep Oct Nov Dec Total
1.00 2.98 1.68 2.50 8.16 2.79 2.79 2.84 6.56 4.28 2.93 2.00 2.79 26.98 2.31 2.84 2.84 2.84 2.60 2.84 16.27
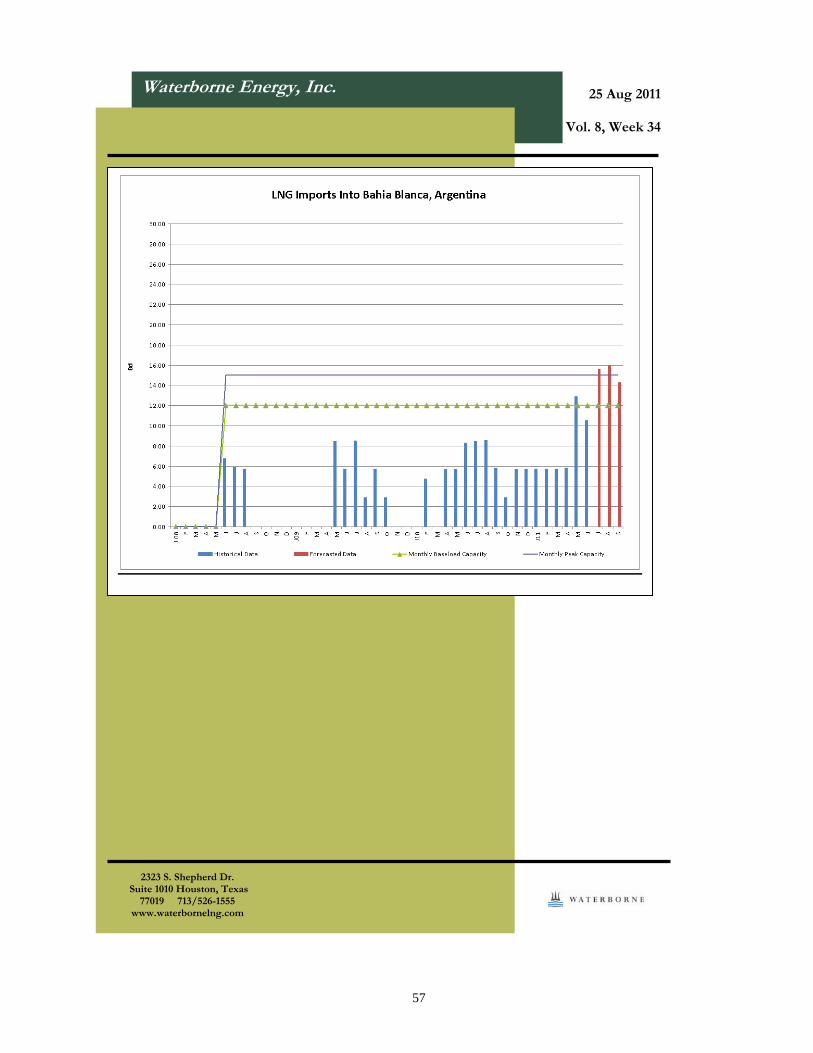
Bahia Blanca, Argentina Jan Feb Mar Apr May Jun Jul Aug Sep Oct Nov Dec Total 2011 5.72 5.74 5.74 5.80 12.91 10.50 15.63 15.93 14.30 92.27 2010 4.76 5.67 5.67 8.32 8.47 8.56 5.78 2.88 5.67 5.74 61.52 2009 8.47 5.72 8.51 2.88 5.72 2.88 34.18 2008 6.77 5.86 5.72 18.35
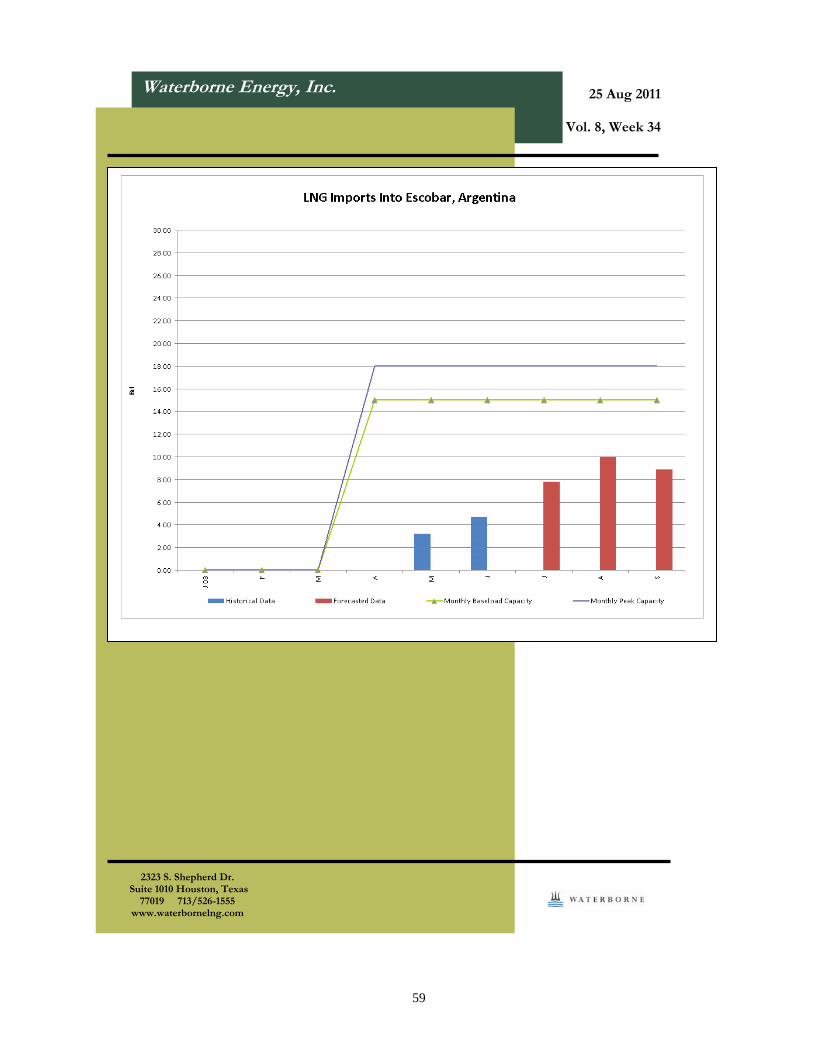
Escobar, Argentina Jan Feb Mar Apr May Jun Jul Aug Sep Oct Nov Dec Total 2011 3.20 4.70 7.78 10.00 8.85 34.53
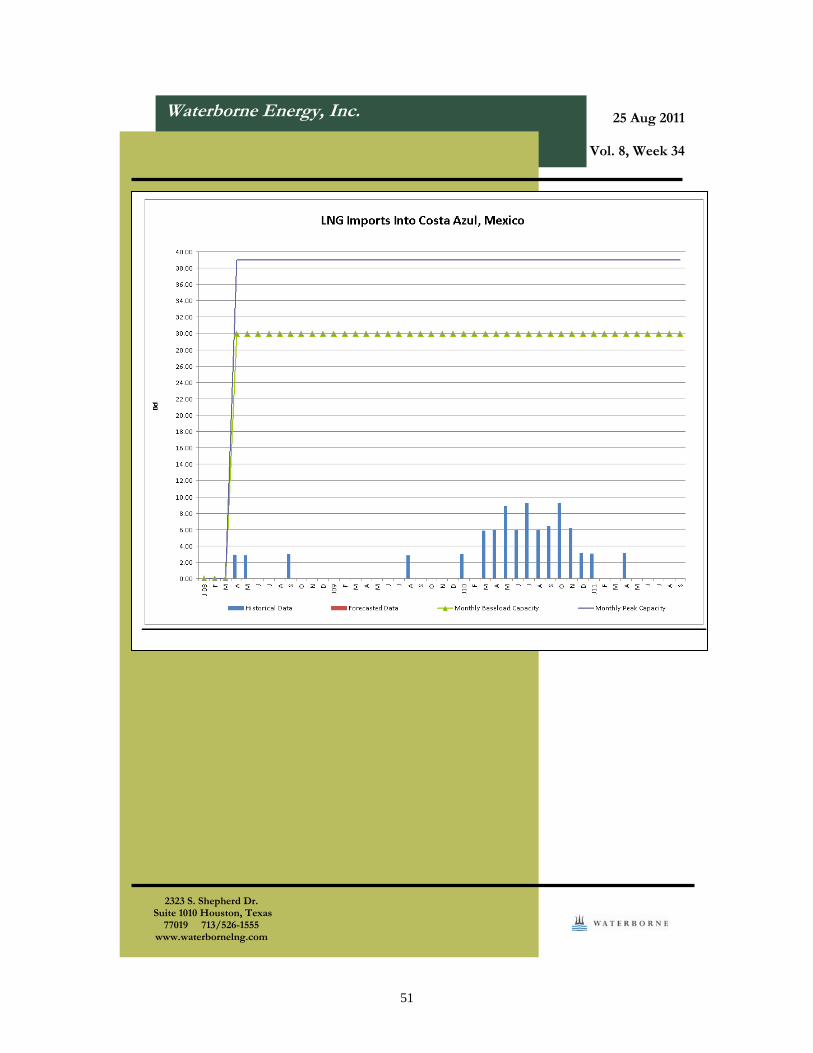
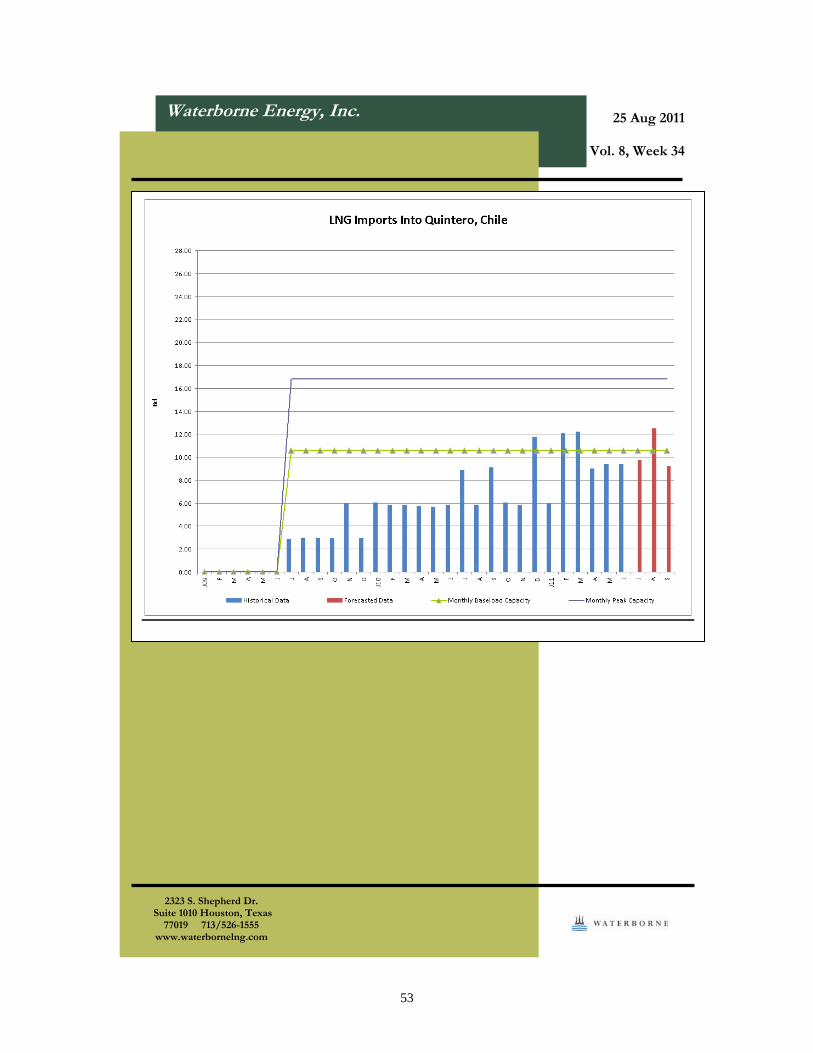
Quintero, Chile Jan Feb Mar Apr May Jun Jul Aug Sep Oct Nov Dec Total 2011 5.92 12.04 12.19 9.02 9.36 9.37 9.70 12.49 9.19 89.28 2010 6.01 5.86 5.86 5.76 5.67 5.86 8.85 5.82 9.08 6.01 5.77 11.72 82.27 2009 2.88 2.98 2.98 2.93 5.96 2.93 20.66
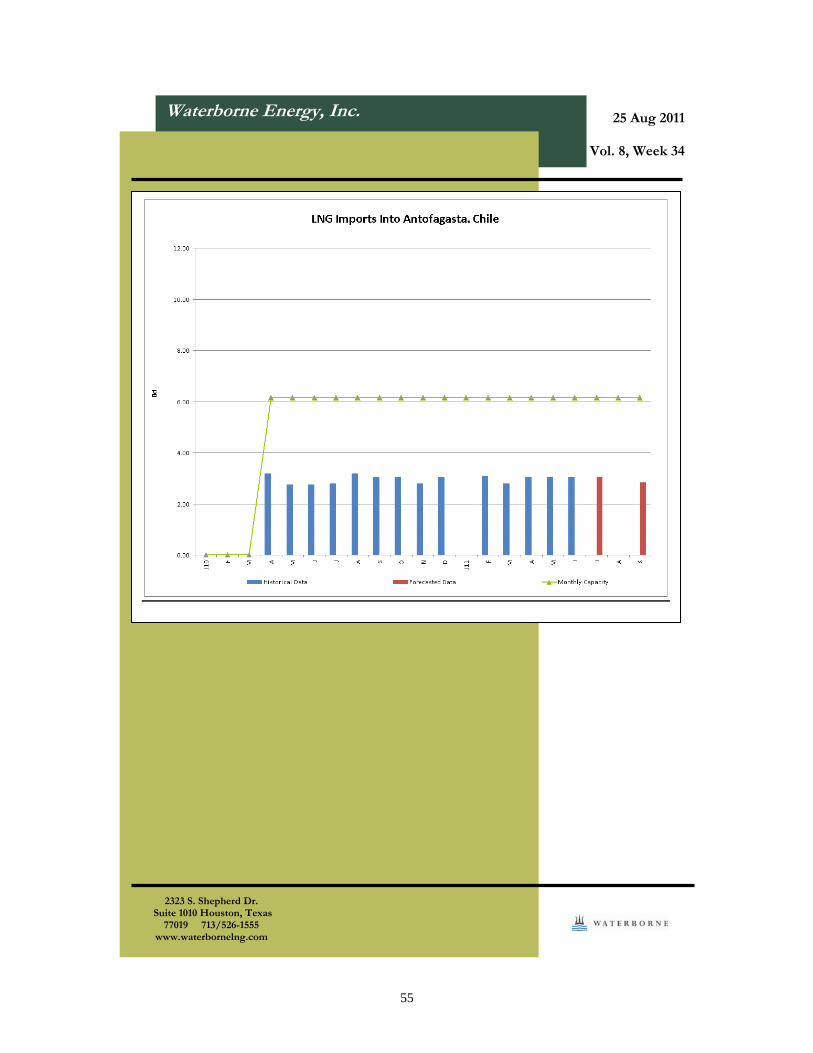
Antofagasta, Chile Jan Feb Mar Apr May Jun Jul Aug Sep Oct Nov Dec Total 2011 3.08 2.80 3.03 3.03 3.03 3.03 2.83 20.83 2010 3.17 2.74 2.74 2.79 3.17 3.03 3.03 2.79 3.03 26.49
13
14
15
Waterborne Energy, Inc.
25 Aug 2011
Vol. 8, Week 34
16
Waterborne Energy, Inc.
2323 S. Shepherd Dr. Suite 1010 Houston, Texas
77019 713/526-1555 www.waterbornelng.com
25 Aug 2011
Vol. 8, Week 34
17
Waterborne Energy, Inc.
25 Aug 2011
Vol. 8, Week 34
18
Waterborne Energy, Inc.
25 Aug 2011
Vol. 8, Week 34
19
Waterborne Energy, Inc.
25 Aug 2011
Vol. 8, Week 34
20
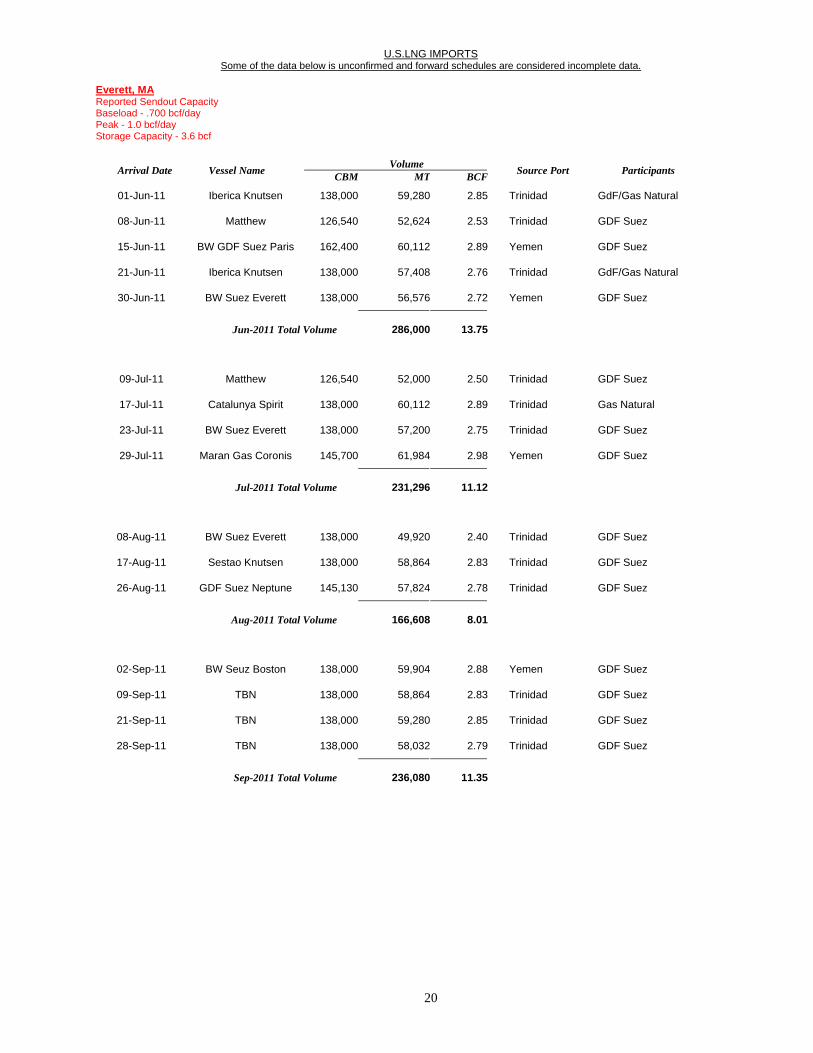
U.S.LNG IMPORTS Some of the data below is unconfirmed and forward schedules are considered incomplete data.
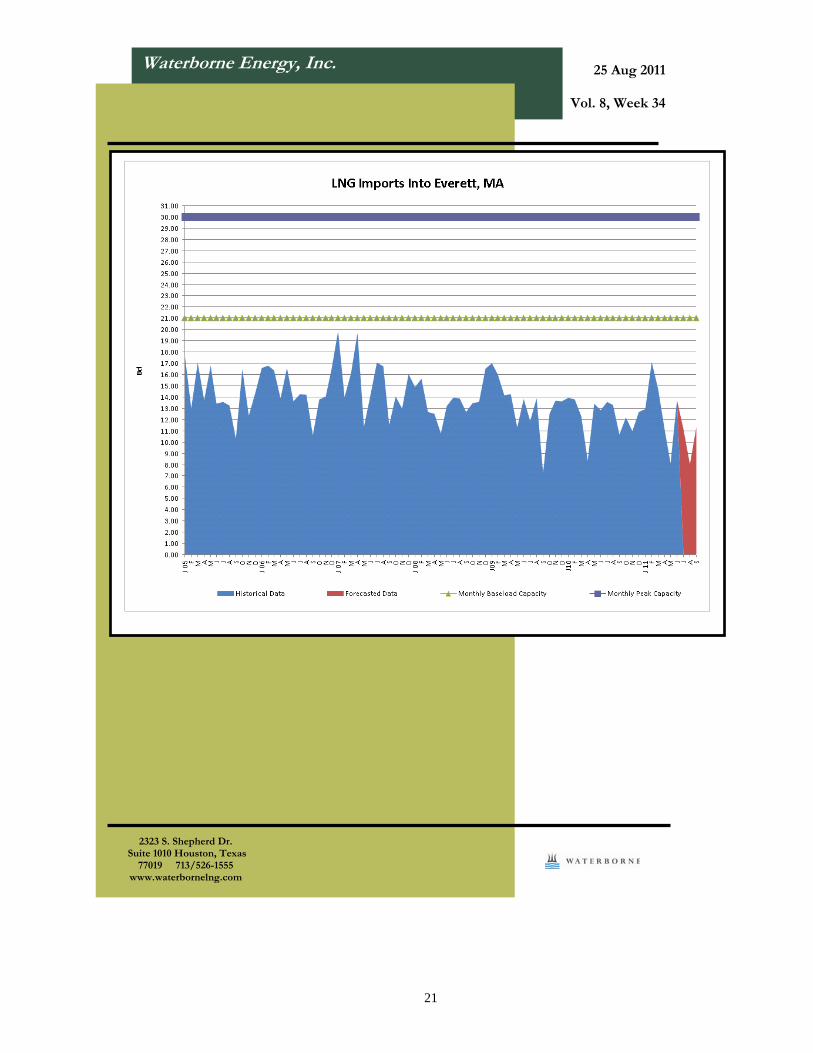
Everett, MA Reported Sendout Capacity Baseload - .700 bcf/day Peak - 1.0 bcf/day Storage Capacity - 3.6 bcf
Volume Arrival Date Vessel Name
CBM MT BCFSource Port Participants
01-Jun-11 Iberica Knutsen 138,000 59,280 2.85 Trinidad GdF/Gas Natural
08-Jun-11 Matthew 126,540 52,624 2.53 Trinidad GDF Suez
15-Jun-11 BW GDF Suez Paris 162,400 60,112 2.89 Yemen GDF Suez
21-Jun-11 Iberica Knutsen 138,000 57,408 2.76 Trinidad GdF/Gas Natural
30-Jun-11 BW Suez Everett 138,000 56,576 2.72 Yemen GDF Suez
Jun-2011 Total Volume
286,000 13.75
09-Jul-11 Matthew 126,540 52,000 2.50 Trinidad GDF Suez
17-Jul-11 Catalunya Spirit 138,000 60,112 2.89 Trinidad Gas Natural
23-Jul-11 BW Suez Everett 138,000 57,200 2.75 Trinidad GDF Suez
29-Jul-11 Maran Gas Coronis 145,700 61,984 2.98 Yemen GDF Suez
Jul-2011 Total Volume
231,296 11.12
08-Aug-11 BW Suez Everett 138,000 49,920 2.40 Trinidad GDF Suez
17-Aug-11 Sestao Knutsen 138,000 58,864 2.83 Trinidad GDF Suez
26-Aug-11 GDF Suez Neptune 145,130 57,824 2.78 Trinidad GDF Suez
Aug-2011 Total Volume
166,608 8.01
02-Sep-11 BW Seuz Boston 138,000 59,904 2.88 Yemen GDF Suez
09-Sep-11 TBN 138,000 58,864 2.83 Trinidad GDF Suez
21-Sep-11 TBN 138,000 59,280 2.85 Trinidad GDF Suez
28-Sep-11 TBN 138,000 58,032 2.79 Trinidad GDF Suez
Sep-2011 Total Volume
236,080 11.35
21
Waterborne Energy, Inc.
2323 S. Shepherd Dr. Suite 1010 Houston, Texas
77019 713/526-1555 www.waterbornelng.com
25 Aug 2011
Vol. 8, Week 34
22
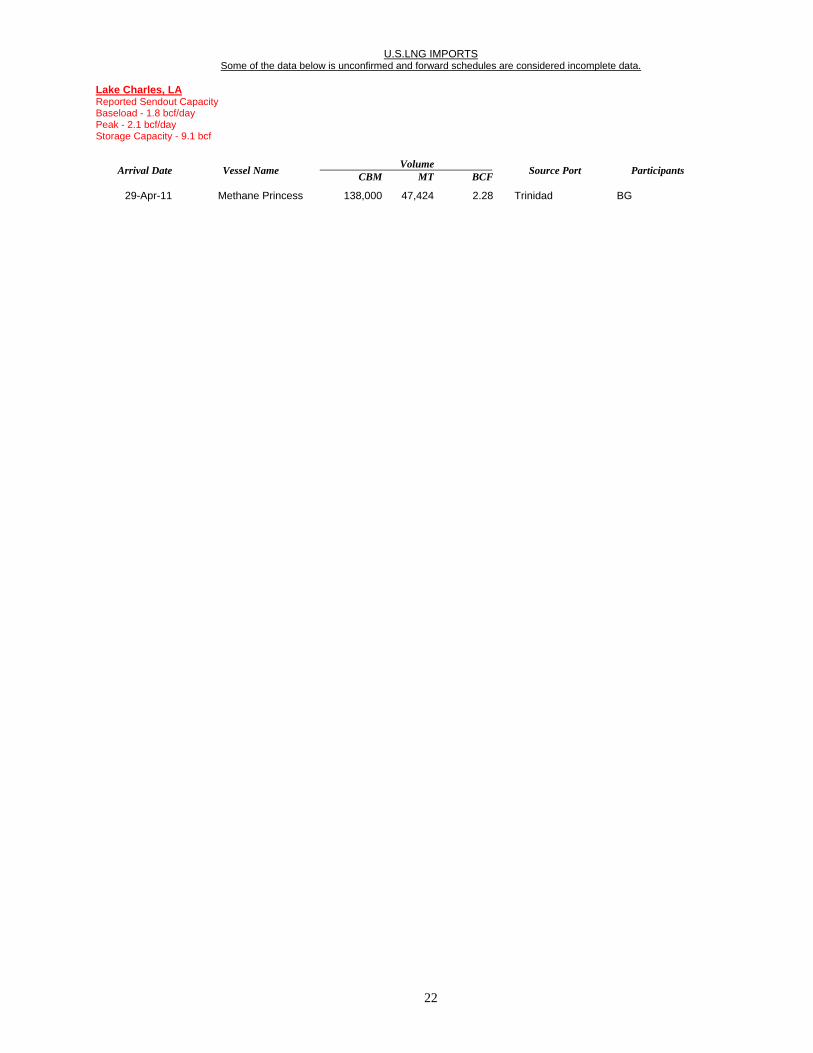
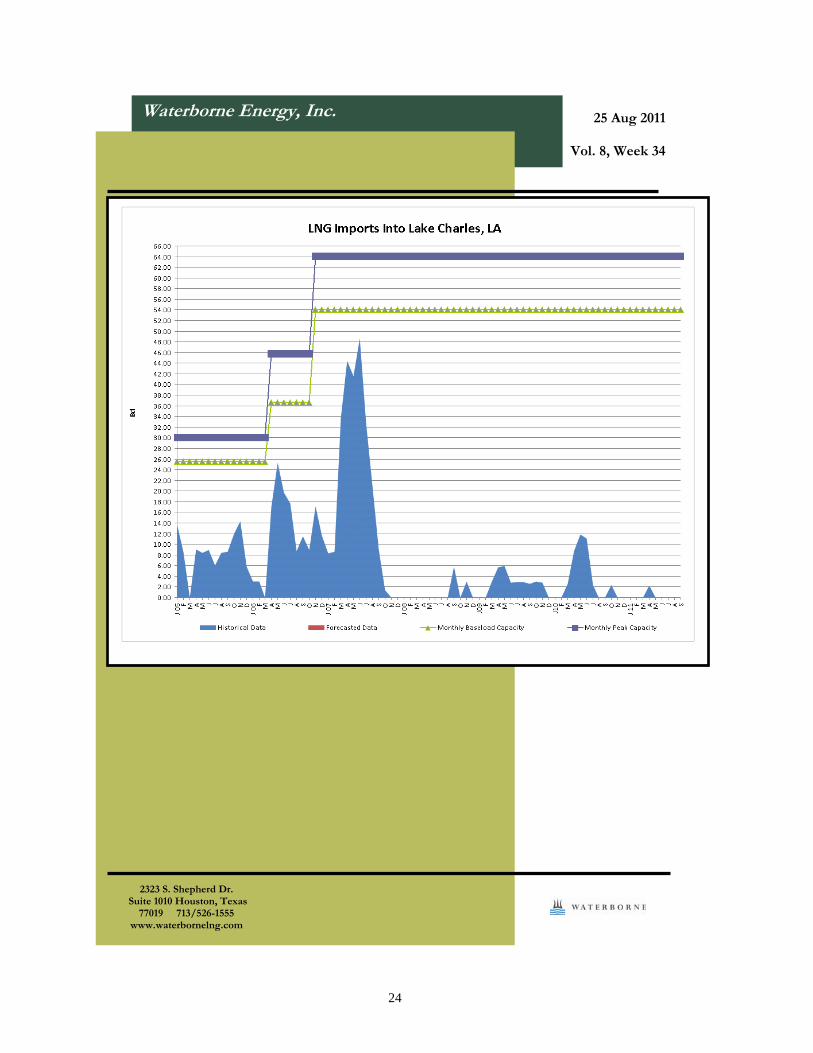
U.S.LNG IMPORTS Some of the data below is unconfirmed and forward schedules are considered incomplete data.
Lake Charles, LA Reported Sendout Capacity Baseload - 1.8 bcf/day Peak - 2.1 bcf/day Storage Capacity - 9.1 bcf
Volume Arrival Date Vessel Name
CBM MT BCFSource Port Participants
29-Apr-11 Methane Princess 138,000 47,424 2.28 Trinidad BG
23
Waterborne Energy, Inc.
2323 S. Shepherd Dr. Suite 1010 Houston, Texas
77019 713/526-1555 www.waterbornelng.com
25 Aug 2011
Vol. 8, Week 34
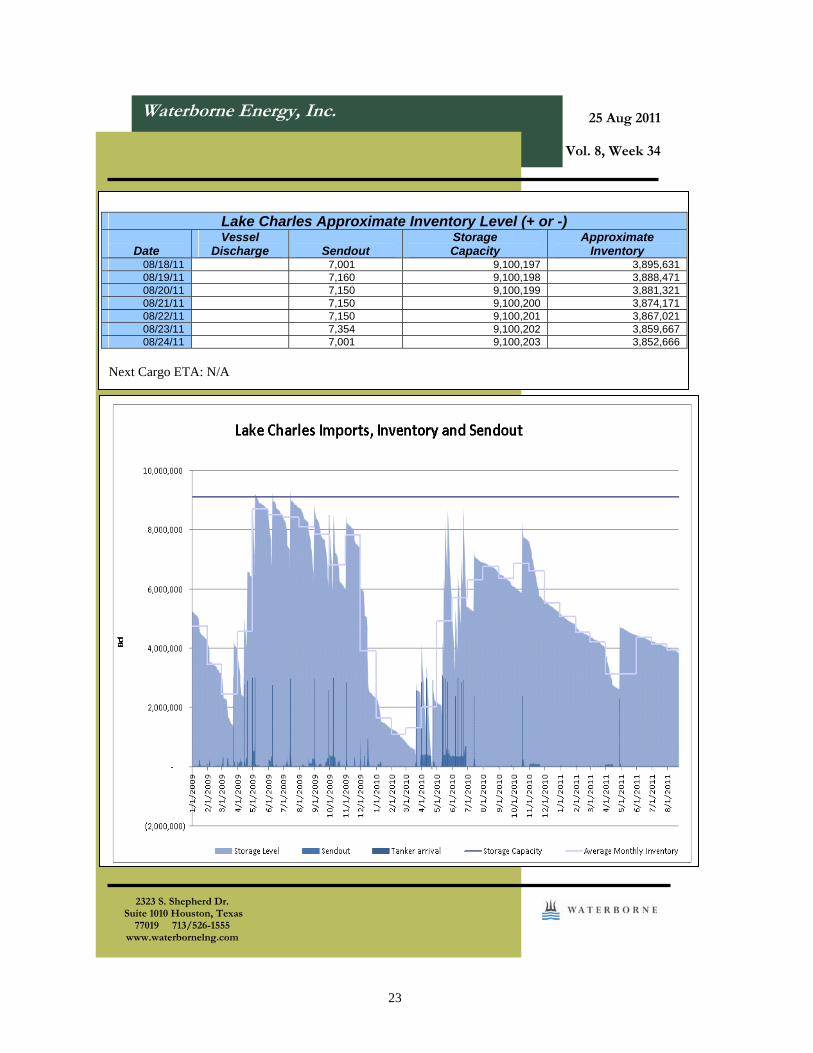
Lake Charles Approximate Inventory Level (+ or -)
Date
Vessel Discharge
Sendout
Storage Capacity
Approximate Inventory
08/18/11 7,001 9,100,197 3,895,631 08/19/11 7,160 9,100,198 3,888,471 08/20/11 7,150 9,100,199 3,881,321 08/21/11 7,150 9,100,200 3,874,171 08/22/11 7,150 9,100,201 3,867,021 08/23/11 7,354 9,100,202 3,859,667 08/24/11 7,001 9,100,203 3,852,666
Next Cargo ETA: N/A
24
Waterborne Energy, Inc.
2323 S. Shepherd Dr. Suite 1010 Houston, Texas
77019 713/526-1555 www.waterbornelng.com
25 Aug 2011
Vol. 8, Week 34
25
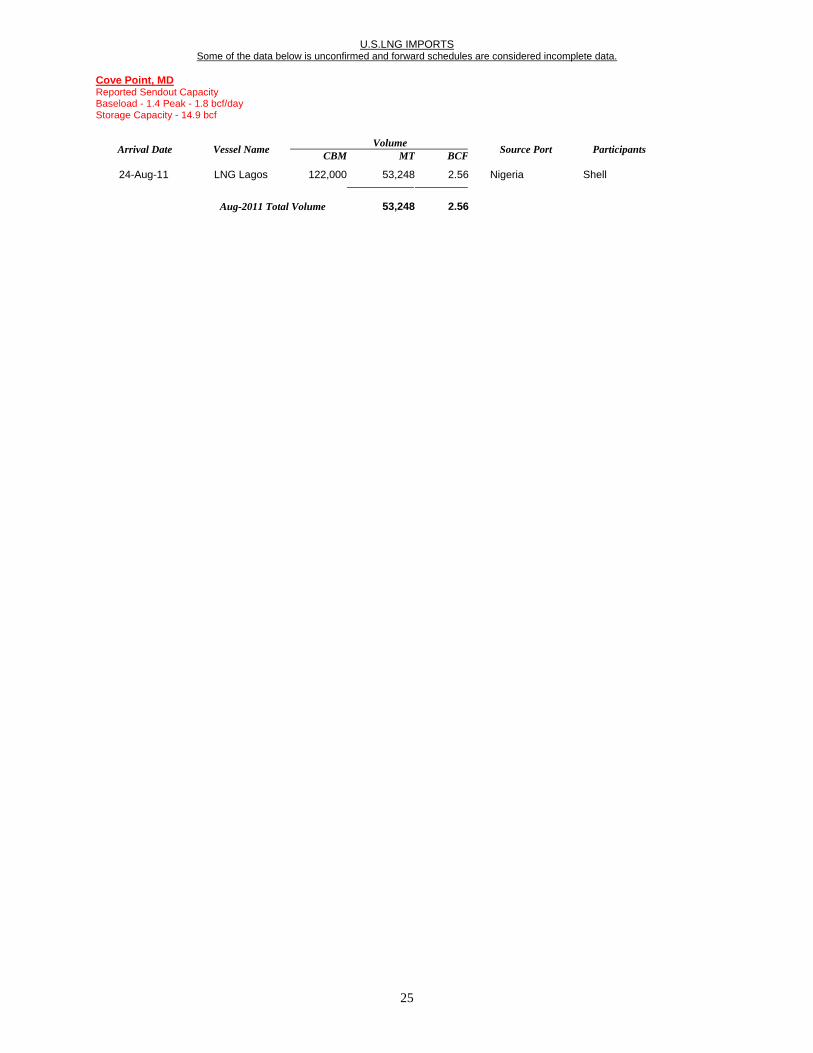
U.S.LNG IMPORTS Some of the data below is unconfirmed and forward schedules are considered incomplete data.
Cove Point, MD Reported Sendout Capacity Baseload - 1.4 Peak - 1.8 bcf/day Storage Capacity - 14.9 bcf
Volume Arrival Date Vessel Name
CBM MT BCFSource Port Participants
24-Aug-11 LNG Lagos 122,000 53,248 2.56 Nigeria Shell
Aug-2011 Total Volume
53,248 2.56
26
Waterborne Energy, Inc.
2323 S. Shepherd Dr. Suite 1010 Houston, Texas
77019 713/526-1555 www.waterbornelng.com
25 Aug 2011
Vol. 8, Week 34
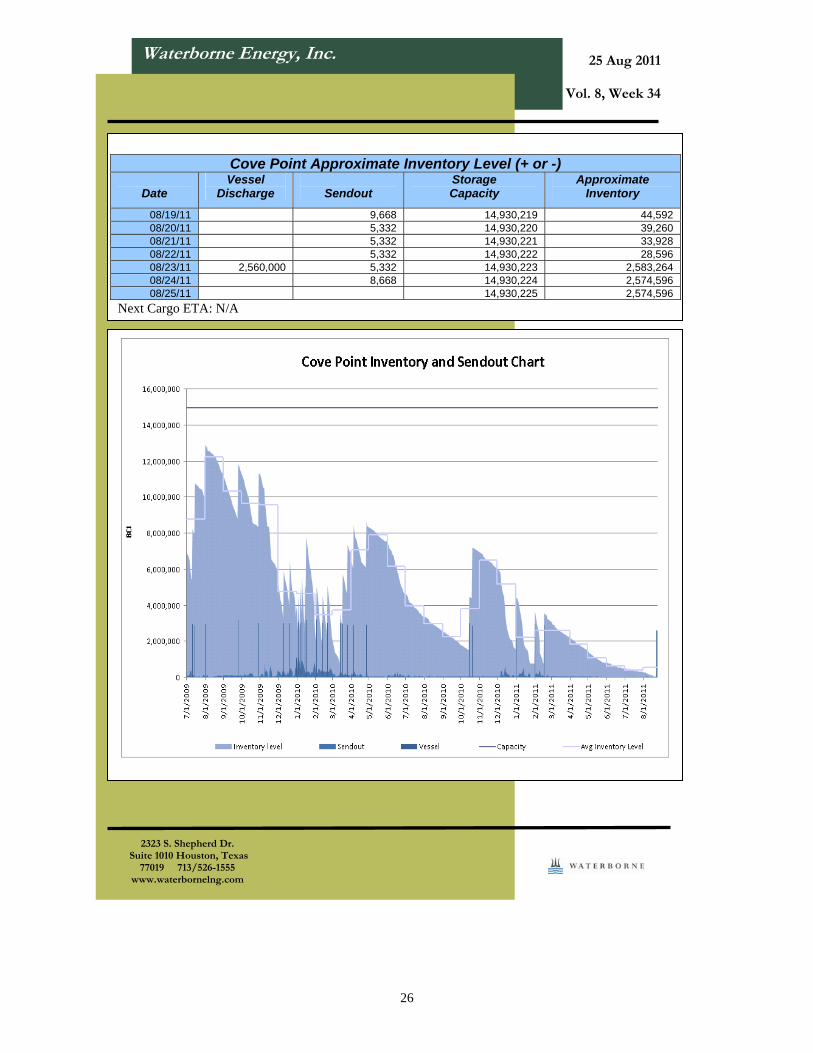
Cove Point Approximate Inventory Level (+ or -)
Date
Vessel Discharge
Sendout
Storage Capacity
Approximate Inventory
08/19/11 9,668 14,930,219 44,592 08/20/11 5,332 14,930,220 39,260 08/21/11 5,332 14,930,221 33,928 08/22/11 5,332 14,930,222 28,596 08/23/11 2,560,000 5,332 14,930,223 2,583,264 08/24/11 8,668 14,930,224 2,574,596 08/25/11 14,930,225 2,574,596
Next Cargo ETA: N/A
27
Waterborne Energy, Inc.
2323 S. Shepherd Dr. Suite 1010 Houston, Texas
77019 713/526-1555 www.waterbornelng.com
25 Aug 2011
Vol. 8, Week 34
28
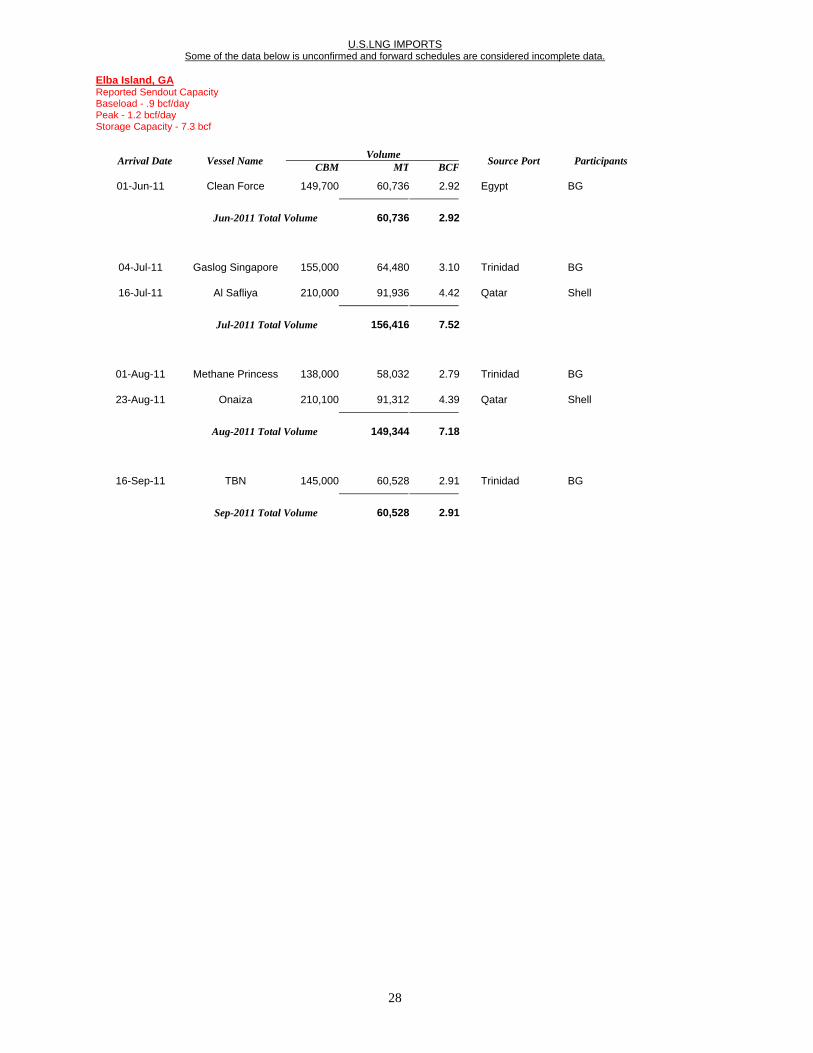
U.S.LNG IMPORTS Some of the data below is unconfirmed and forward schedules are considered incomplete data.
Elba Island, GA Reported Sendout Capacity Baseload - .9 bcf/day Peak - 1.2 bcf/day Storage Capacity - 7.3 bcf
Volume Arrival Date Vessel Name
CBM MT BCFSource Port Participants
01-Jun-11 Clean Force 149,700 60,736 2.92 Egypt BG
Jun-2011 Total Volume
60,736 2.92
04-Jul-11 Gaslog Singapore 155,000 64,480 3.10 Trinidad BG
16-Jul-11 Al Safliya 210,000 91,936 4.42 Qatar Shell
Jul-2011 Total Volume
156,416 7.52
01-Aug-11 Methane Princess 138,000 58,032 2.79 Trinidad BG
23-Aug-11 Onaiza 210,100 91,312 4.39 Qatar Shell
Aug-2011 Total Volume
149,344 7.18
16-Sep-11 TBN 145,000 60,528 2.91 Trinidad BG
Sep-2011 Total Volume
60,528 2.91
29
Waterborne Energy, Inc.
2323 S. Shepherd Dr. Suite 1010 Houston, Texas
77019 713/526-1555 www.waterbornelng.com
25 Aug 2011
Vol. 8, Week 34
30
U.S.LNG IMPORTS Some of the data below is unconfirmed and forward schedules are considered incomplete data.
Golden Pass, TX Reported Sendout Capacity Baseload - 2.0 bcf per day Peak 2.7 bcf per day Storage Capacity - 16.9 bcf
Volume Arrival Date Vessel Name
CBM MT BCFSource Port Participants
02-Jun-11 Bu Samra 266,000 101,920 4.90 Qatar Qatargas
31
Waterborne Energy, Inc.
2323 S. Shepherd Dr. Suite 1010 Houston, Texas
77019 713/526-1555 www.waterbornelng.com
25 Aug 2011
Vol. 8, Week 34
32
Waterborne Energy, Inc.
2323 S. Shepherd Dr. Suite 1010 Houston, Texas
77019 713/526-1555 www.waterbornelng.com
25 Aug 2011
Vol. 8, Week 34
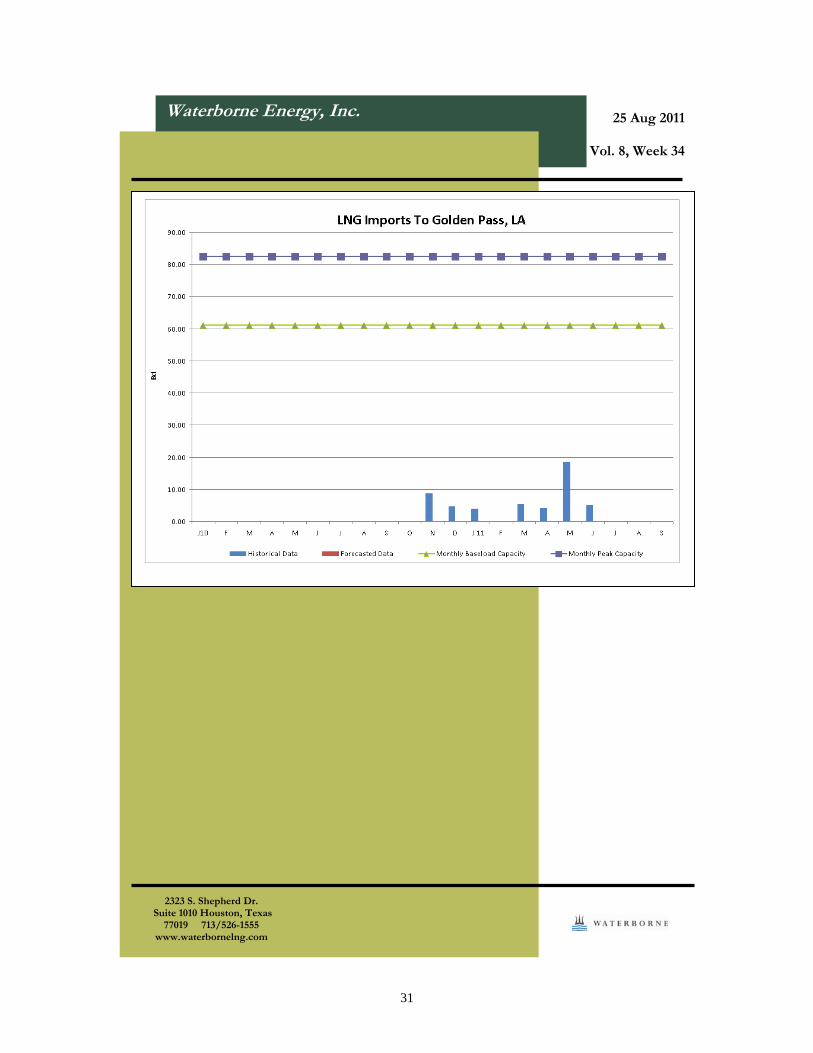
Golden Pass Approximate Inventory Level (+ or -)
Date
Vessel Discharge
Sendout
Storage Capacity
Approximate Inventory
08/19/11 17,480 16,701,340 8,748,776 08/20/11 17,480 16,701,341 8,731,296 08/21/11 17,480 16,701,342 8,713,816 08/22/11 17,480 16,701,343 8,696,336 08/23/11 17,480 16,701,344 8,678,856 08/24/11 17,480 16,701,345 8,661,376 08/25/11 13,800 16,701,346 8,647,576
33
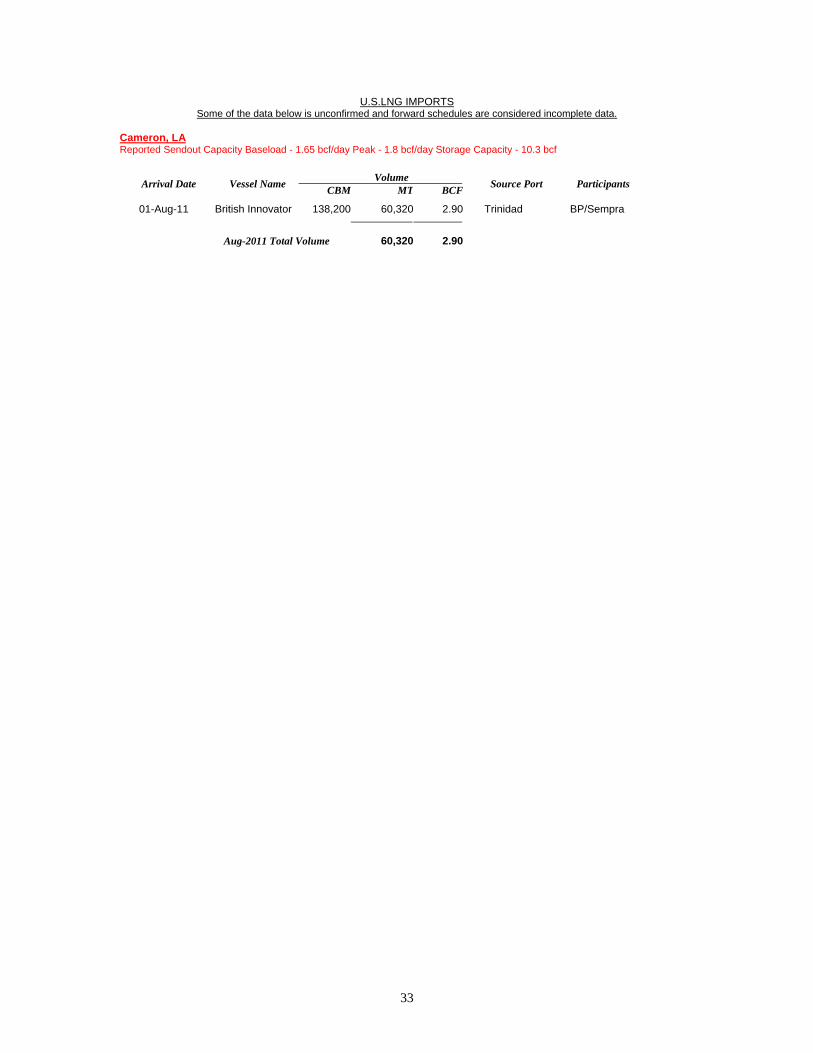
U.S.LNG IMPORTS Some of the data below is unconfirmed and forward schedules are considered incomplete data.
Cameron, LA Reported Sendout Capacity Baseload - 1.65 bcf/day Peak - 1.8 bcf/day Storage Capacity - 10.3 bcf
Volume Arrival Date Vessel Name
CBM MT BCFSource Port Participants
01-Aug-11 British Innovator 138,200 60,320 2.90 Trinidad BP/Sempra
Aug-2011 Total Volume
60,320 2.90
34
Waterborne Energy, Inc.
2323 S. Shepherd Dr. Suite 1010 Houston, Texas
77019 713/526-1555 www.waterbornelng.com
25 Aug 2011
Vol. 8, Week 34
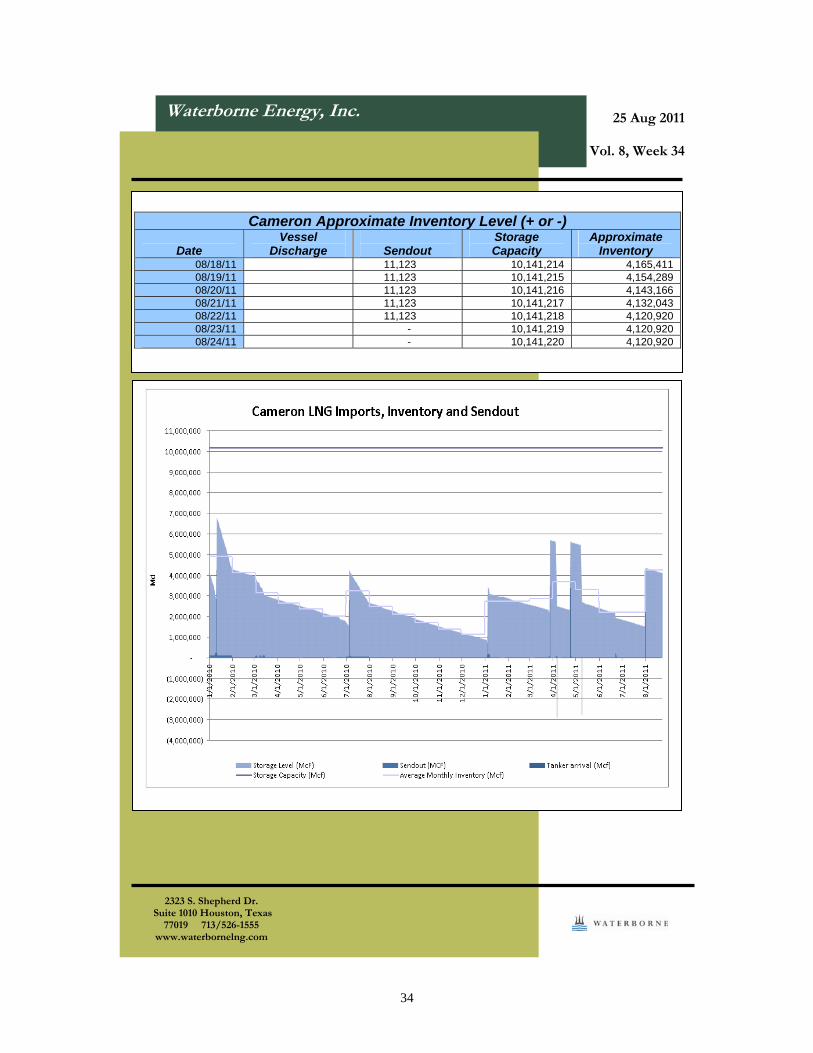
Cameron Approximate Inventory Level (+ or -)
Date
Vessel Discharge
Sendout
Storage Capacity
Approximate Inventory
08/18/11 11,123 10,141,214 4,165,411 08/19/11 11,123 10,141,215 4,154,289 08/20/11 11,123 10,141,216 4,143,166 08/21/11 11,123 10,141,217 4,132,043 08/22/11 11,123 10,141,218 4,120,920 08/23/11 - 10,141,219 4,120,920 08/24/11 - 10,141,220 4,120,920
35
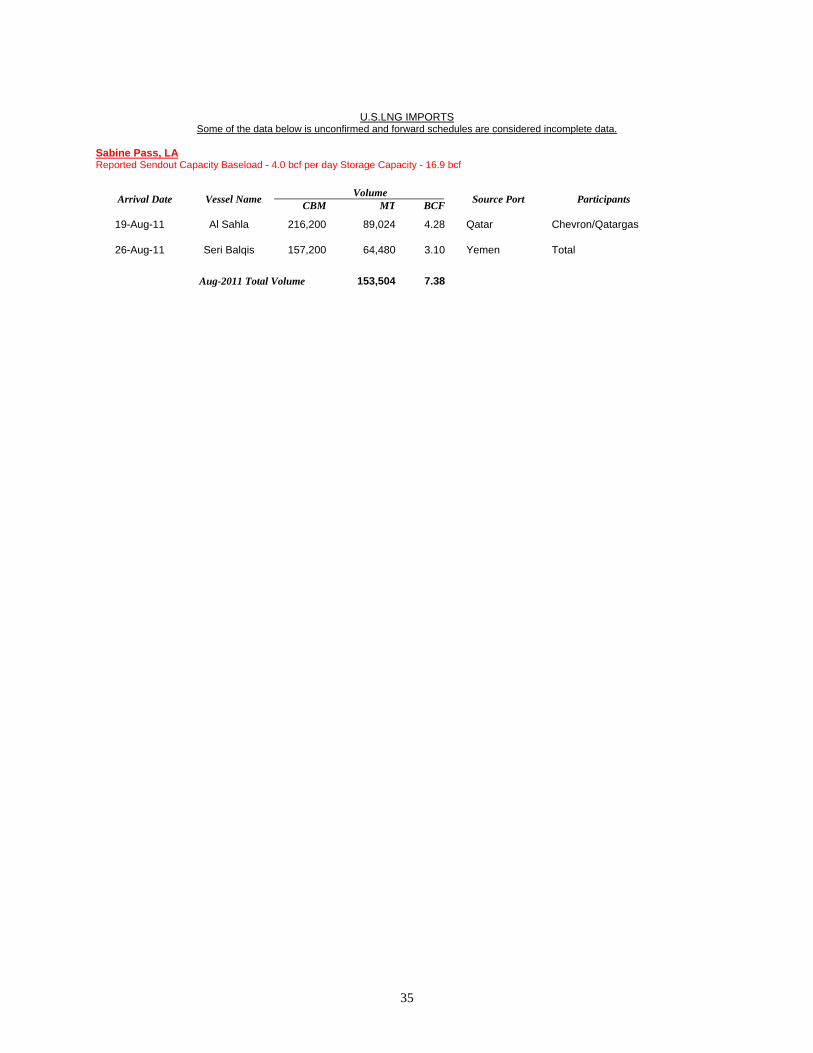
U.S.LNG IMPORTS
Some of the data below is unconfirmed and forward schedules are considered incomplete data. Sabine Pass, LA Reported Sendout Capacity Baseload - 4.0 bcf per day Storage Capacity - 16.9 bcf
Volume Arrival Date Vessel Name
CBM MT BCFSource Port Participants
19-Aug-11 Al Sahla 216,200 89,024 4.28 Qatar Chevron/Qatargas
26-Aug-11 Seri Balqis 157,200 64,480 3.10 Yemen Total
Aug-2011 Total Volume
153,504 7.38
36
Waterborne Energy, Inc.
2323 S. Shepherd Dr. Suite 1010 Houston, Texas
77019 713/526-1555 www.waterbornelng.com
25 Aug 2011
Vol. 8, Week 34
37
Waterborne Energy, Inc.
2323 S. Shepherd Dr. Suite 1010 Houston, Texas
77019 713/526-1555 www.waterbornelng.com
25 Aug 2011
Vol. 8, Week 34
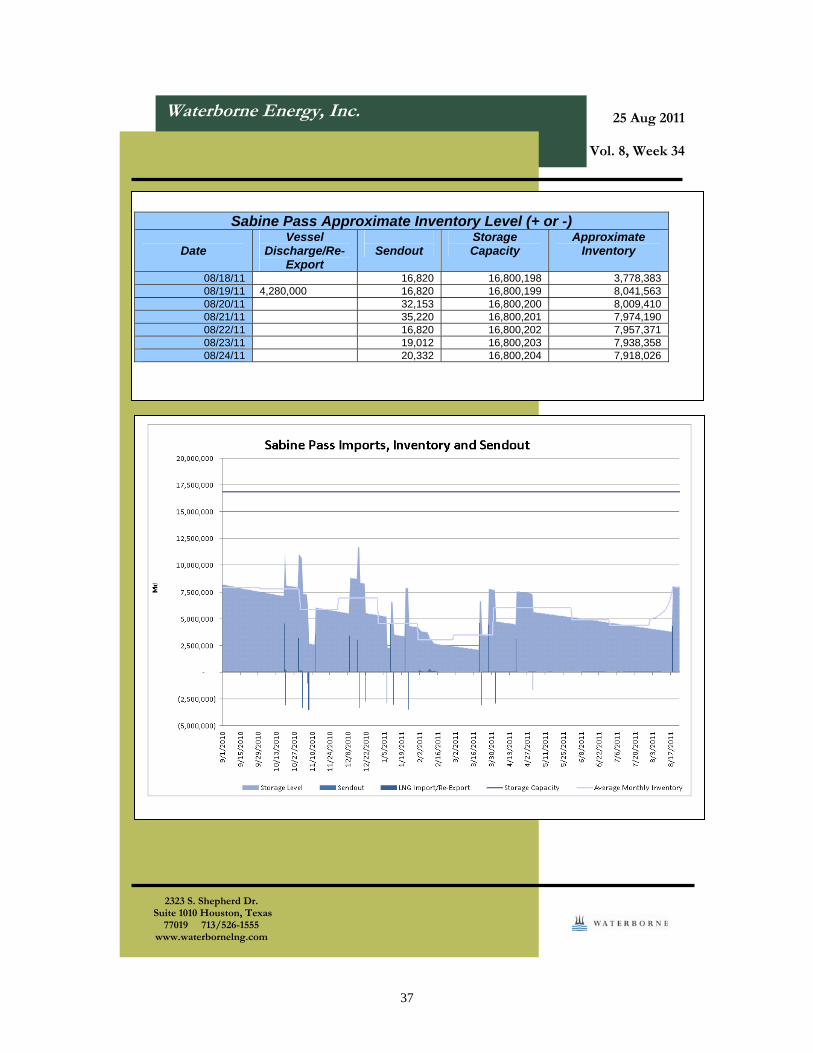
Sabine Pass Approximate Inventory Level (+ or -)
Date
Vessel Discharge/Re-
Export
Sendout
Storage Capacity
Approximate Inventory
08/18/11 16,820 16,800,198 3,778,383 08/19/11 4,280,000 16,820 16,800,199 8,041,563 08/20/11 32,153 16,800,200 8,009,410 08/21/11 35,220 16,800,201 7,974,190 08/22/11 16,820 16,800,202 7,957,371 08/23/11 19,012 16,800,203 7,938,358 08/24/11 20,332 16,800,204 7,918,026
38
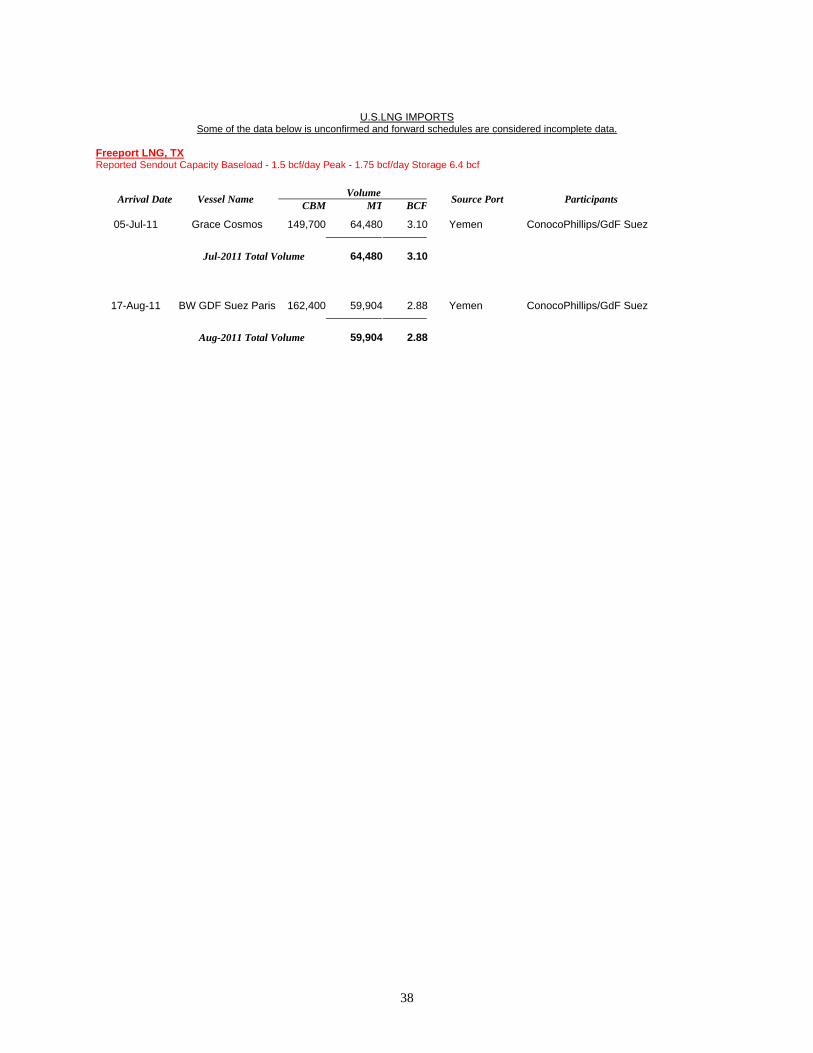
U.S.LNG IMPORTS Some of the data below is unconfirmed and forward schedules are considered incomplete data.
Freeport LNG, TX Reported Sendout Capacity Baseload - 1.5 bcf/day Peak - 1.75 bcf/day Storage 6.4 bcf
Volume Arrival Date Vessel Name
CBM MT BCFSource Port Participants
05-Jul-11 Grace Cosmos 149,700 64,480 3.10 Yemen ConocoPhillips/GdF Suez
Jul-2011 Total Volume
64,480 3.10
17-Aug-11 BW GDF Suez Paris 162,400 59,904 2.88 Yemen ConocoPhillips/GdF Suez
Aug-2011 Total Volume
59,904 2.88
39
Waterborne Energy, Inc.
2323 S. Shepherd Dr. Suite 1010 Houston, Texas
77019 713/526-1555 www.waterbornelng.com
25 Aug 2011
Vol. 8, Week 34
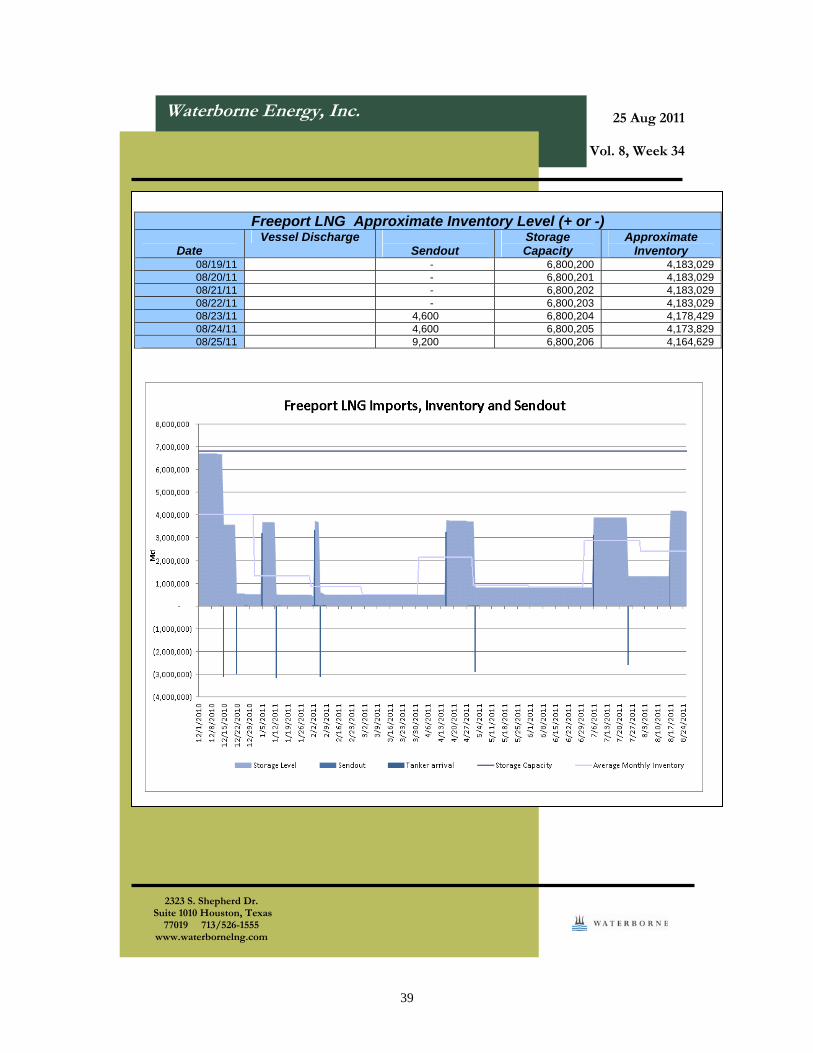
Freeport LNG Approximate Inventory Level (+ or -)
Date
Vessel Discharge Sendout
Storage Capacity
Approximate Inventory
08/19/11 - 6,800,200 4,183,029 08/20/11 - 6,800,201 4,183,029 08/21/11 - 6,800,202 4,183,029 08/22/11 - 6,800,203 4,183,029 08/23/11 4,600 6,800,204 4,178,429 08/24/11 4,600 6,800,205 4,173,829 08/25/11 9,200 6,800,206 4,164,629
40
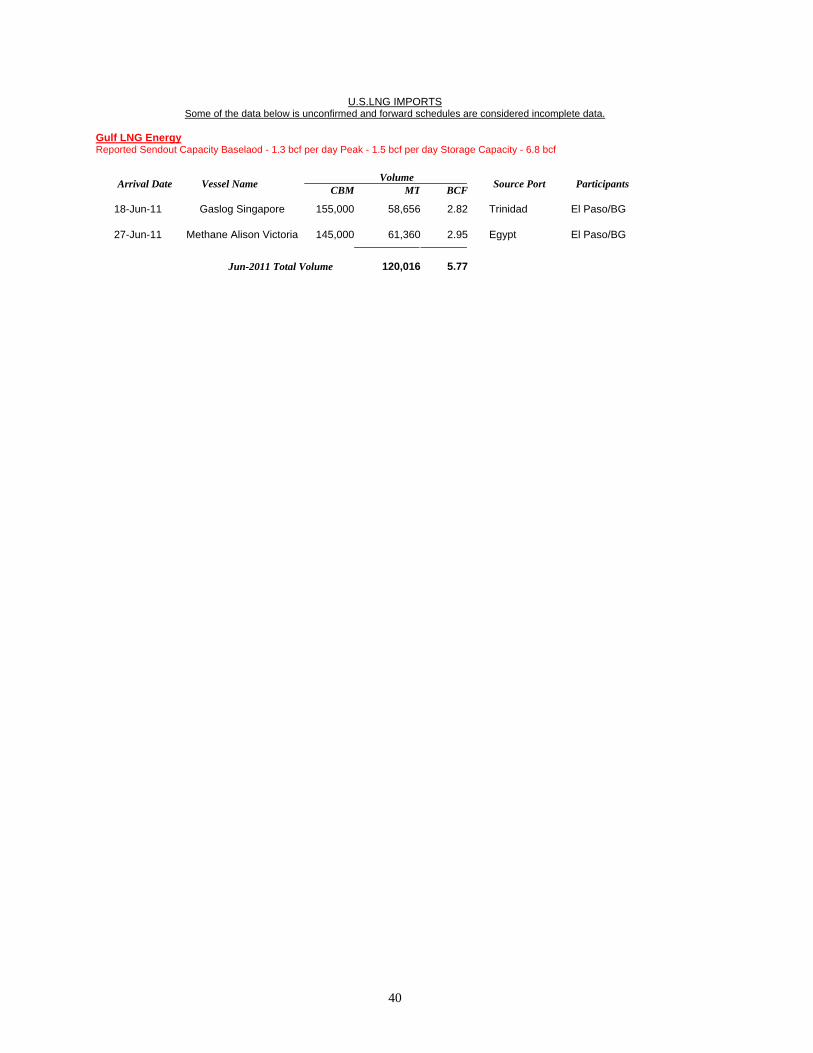
U.S.LNG IMPORTS Some of the data below is unconfirmed and forward schedules are considered incomplete data.
Gulf LNG Energy Reported Sendout Capacity Baselaod - 1.3 bcf per day Peak - 1.5 bcf per day Storage Capacity - 6.8 bcf
Volume Arrival Date Vessel Name
CBM MT BCFSource Port Participants
18-Jun-11 Gaslog Singapore 155,000 58,656 2.82 Trinidad El Paso/BG
27-Jun-11 Methane Alison Victoria 145,000 61,360 2.95 Egypt El Paso/BG
Jun-2011 Total Volume
120,016 5.77
41
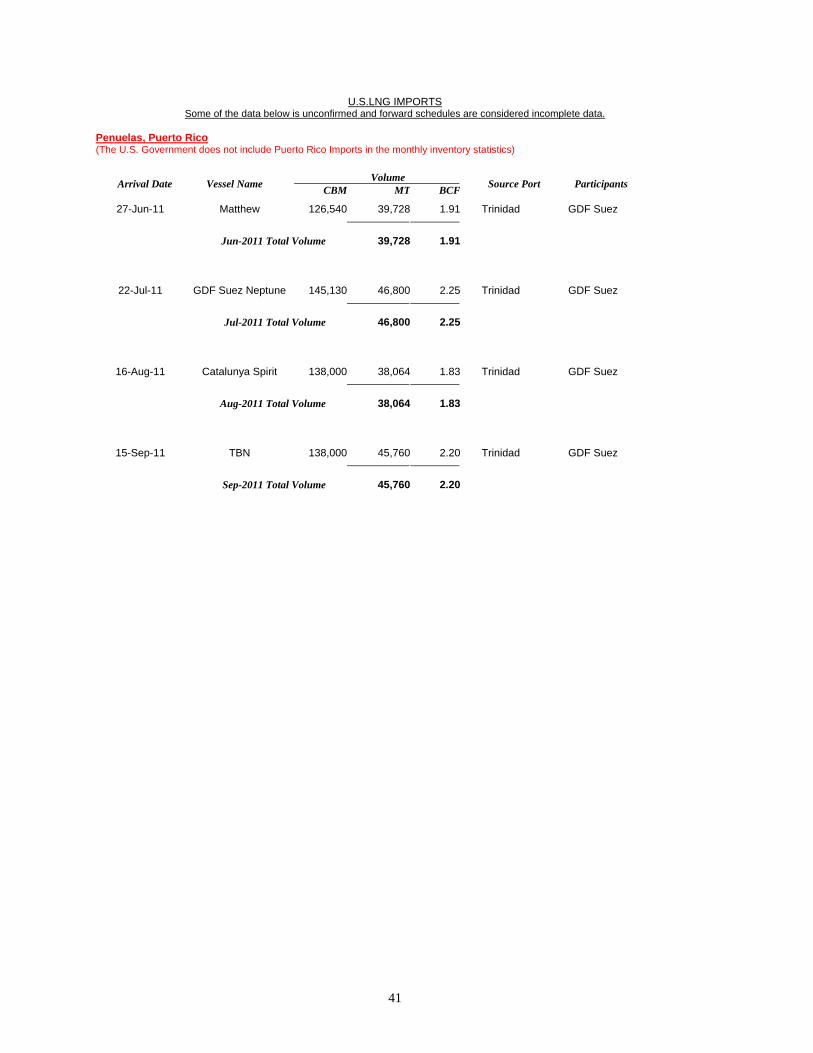
U.S.LNG IMPORTS Some of the data below is unconfirmed and forward schedules are considered incomplete data.
Penuelas, Puerto Rico (The U.S. Government does not include Puerto Rico Imports in the monthly inventory statistics)
Volume Arrival Date Vessel Name
CBM MT BCFSource Port Participants
27-Jun-11 Matthew 126,540 39,728 1.91 Trinidad GDF Suez
Jun-2011 Total Volume
39,728 1.91
22-Jul-11 GDF Suez Neptune 145,130 46,800 2.25 Trinidad GDF Suez
Jul-2011 Total Volume
46,800 2.25
16-Aug-11 Catalunya Spirit 138,000 38,064 1.83 Trinidad GDF Suez
Aug-2011 Total Volume
38,064 1.83
15-Sep-11 TBN 138,000 45,760 2.20 Trinidad GDF Suez
Sep-2011 Total Volume
45,760 2.20
42
Waterborne Energy, Inc.
2323 S. Shepherd Dr. Suite 1010 Houston, Texas
77019 713/526-1555 www.waterbornelng.com
25 Aug 2011
Vol. 8, Week 34
43
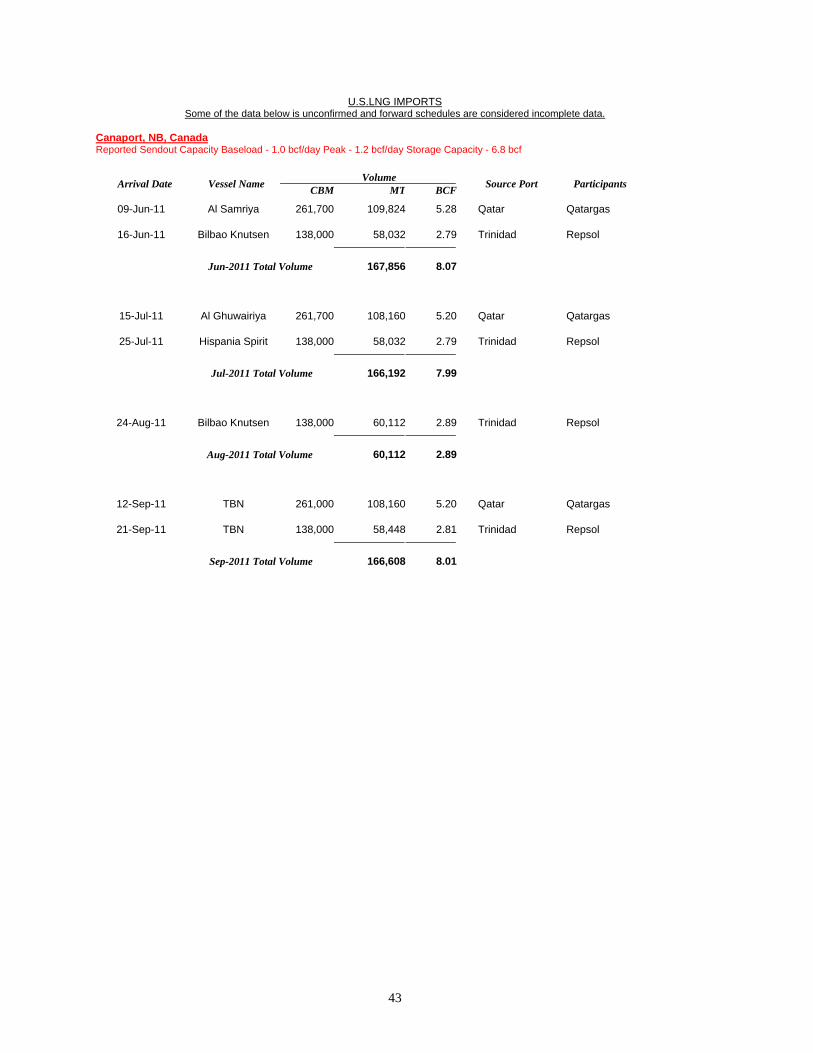
U.S.LNG IMPORTS Some of the data below is unconfirmed and forward schedules are considered incomplete data.
Canaport, NB, Canada Reported Sendout Capacity Baseload - 1.0 bcf/day Peak - 1.2 bcf/day Storage Capacity - 6.8 bcf
Volume Arrival Date Vessel Name
CBM MT BCFSource Port Participants
09-Jun-11 Al Samriya 261,700 109,824 5.28 Qatar Qatargas
16-Jun-11 Bilbao Knutsen 138,000 58,032 2.79 Trinidad Repsol
Jun-2011 Total Volume
167,856 8.07
15-Jul-11 Al Ghuwairiya 261,700 108,160 5.20 Qatar Qatargas
25-Jul-11 Hispania Spirit 138,000 58,032 2.79 Trinidad Repsol
Jul-2011 Total Volume
166,192 7.99
24-Aug-11 Bilbao Knutsen 138,000 60,112 2.89 Trinidad Repsol
Aug-2011 Total Volume
60,112 2.89
12-Sep-11 TBN 261,000 108,160 5.20 Qatar Qatargas
21-Sep-11 TBN 138,000 58,448 2.81 Trinidad Repsol
Sep-2011 Total Volume
166,608 8.01
44
Waterborne Energy, Inc.
2323 S. Shepherd Dr. Suite 1010 Houston, Texas
77019 713/526-1555 www.waterbornelng.com
25 Aug 2011
Vol. 8, Week 34
45
Waterborne Energy, Inc.
2323 S. Shepherd Dr. Suite 1010 Houston, Texas
77019 713/526-1555 www.waterbornelng.com
25 Aug 2011
Vol. 8, Week 34
46
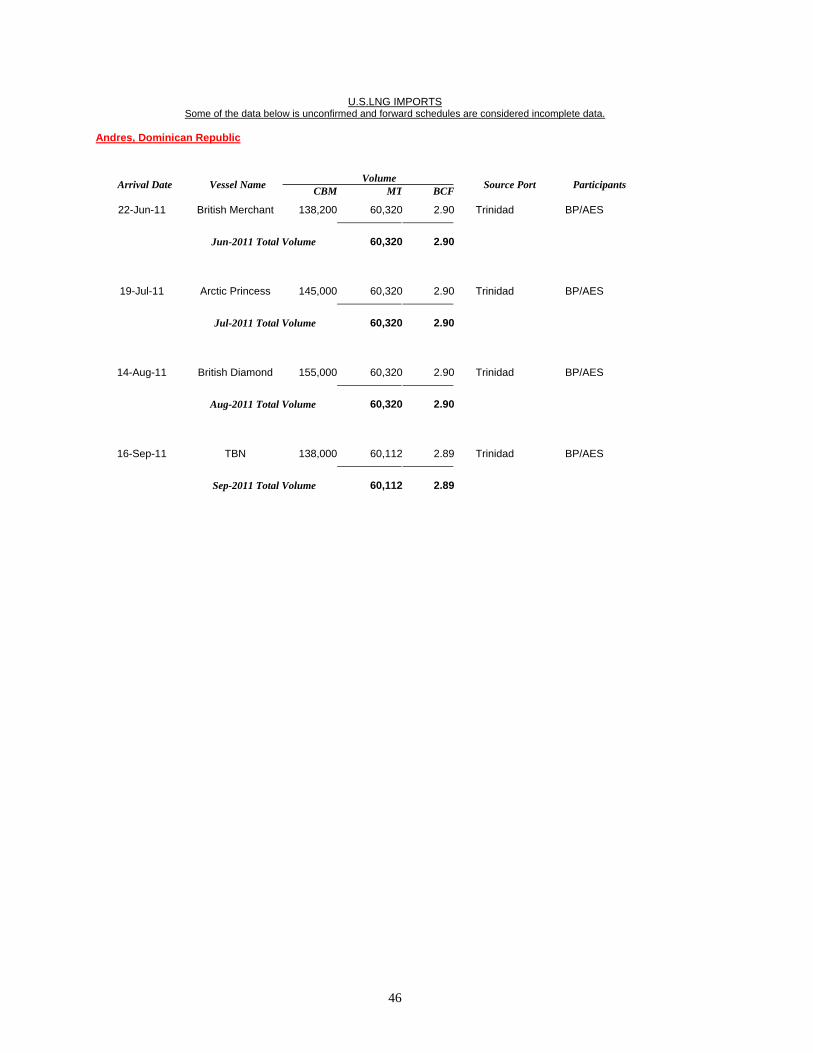
U.S.LNG IMPORTS Some of the data below is unconfirmed and forward schedules are considered incomplete data.
Andres, Dominican Republic
Volume Arrival Date Vessel Name
CBM MT BCFSource Port Participants
22-Jun-11 British Merchant 138,200 60,320 2.90 Trinidad BP/AES
Jun-2011 Total Volume
60,320 2.90
19-Jul-11 Arctic Princess 145,000 60,320 2.90 Trinidad BP/AES
Jul-2011 Total Volume
60,320 2.90
14-Aug-11 British Diamond 155,000 60,320 2.90 Trinidad BP/AES
Aug-2011 Total Volume
60,320 2.90
16-Sep-11 TBN 138,000 60,112 2.89 Trinidad BP/AES
Sep-2011 Total Volume
60,112 2.89
47
Waterborne Energy, Inc.
2323 S. Shepherd Dr. Suite 1010 Houston, Texas
77019 713/526-1555 www.waterbornelng.com
25 Aug 2011
Vol. 8, Week 34
48
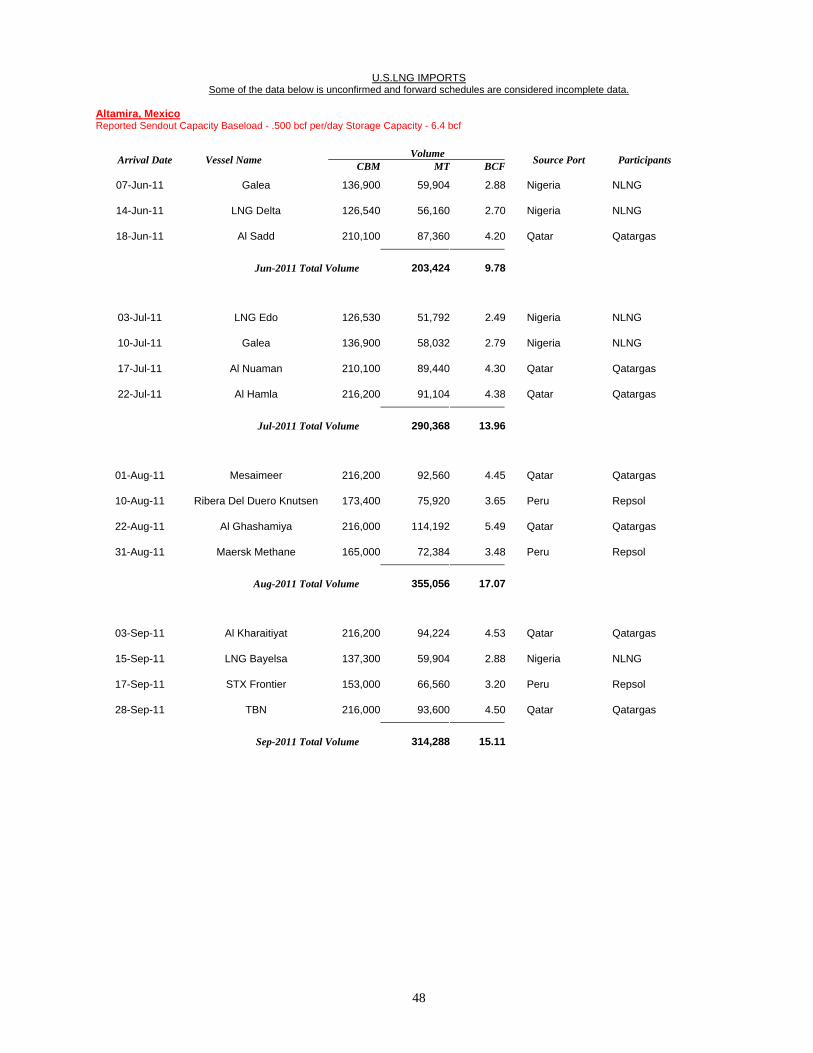
U.S.LNG IMPORTS Some of the data below is unconfirmed and forward schedules are considered incomplete data.
Altamira, Mexico Reported Sendout Capacity Baseload - .500 bcf per/day Storage Capacity - 6.4 bcf
Volume Arrival Date Vessel Name
CBM MT BCFSource Port Participants
07-Jun-11 Galea 136,900 59,904 2.88 Nigeria NLNG
14-Jun-11 LNG Delta 126,540 56,160 2.70 Nigeria NLNG
18-Jun-11 Al Sadd 210,100 87,360 4.20 Qatar Qatargas
Jun-2011 Total Volume
203,424 9.78
03-Jul-11 LNG Edo 126,530 51,792 2.49 Nigeria NLNG
10-Jul-11 Galea 136,900 58,032 2.79 Nigeria NLNG
17-Jul-11 Al Nuaman 210,100 89,440 4.30 Qatar Qatargas
22-Jul-11 Al Hamla 216,200 91,104 4.38 Qatar Qatargas
Jul-2011 Total Volume
290,368 13.96
01-Aug-11 Mesaimeer 216,200 92,560 4.45 Qatar Qatargas
10-Aug-11 Ribera Del Duero Knutsen 173,400 75,920 3.65 Peru Repsol
22-Aug-11 Al Ghashamiya 216,000 114,192 5.49 Qatar Qatargas
31-Aug-11 Maersk Methane 165,000 72,384 3.48 Peru Repsol
Aug-2011 Total Volume
355,056 17.07
03-Sep-11 Al Kharaitiyat 216,200 94,224 4.53 Qatar Qatargas
15-Sep-11 LNG Bayelsa 137,300 59,904 2.88 Nigeria NLNG
17-Sep-11 STX Frontier 153,000 66,560 3.20 Peru Repsol
28-Sep-11 TBN 216,000 93,600 4.50 Qatar Qatargas
Sep-2011 Total Volume
314,288 15.11
49
Waterborne Energy, Inc.
2323 S. Shepherd Dr. Suite 1010 Houston, Texas
77019 713/526-1555 www.waterbornelng.com
25 Aug 2011
Vol. 8, Week 34
50
U.S.LNG IMPORTS Some of the data below is unconfirmed and forward schedules are considered incomplete data.
Costa Azul, Mexico Reported Sendout Capacity Baseload - 1 bcf/day Peak - 1.3 bcf/day Storage Capacity - 7 bcf
Volume Arrival Date Vessel Name
CBM MT BCFSource Port Participants
20-Aug-11 TBN 145,000 64,064 3.08 Indonesia Tangguh JV/Sempra
51
Waterborne Energy, Inc.
2323 S. Shepherd Dr. Suite 1010 Houston, Texas
77019 713/526-1555 www.waterbornelng.com
25 Aug 2011
Vol. 8, Week 34
52
U.S.LNG IMPORTS Some of the data below is unconfirmed and forward schedules are considered incomplete data.
Quintero, Chile
Volume Arrival Date Vessel Name
CBM MT BCFSource Port Participant
s 06-Jun-11 Methane Julia Louise 170,000 68,224 3.28
Equatorial Guinea BG
10-Jun-11 Methane Patricia Camila 170,000 68,224 3.28
Equatorial Guinea BG
24-Jun-11 Methane Princess 138,000 58,448 2.81 Trinidad BG
Jun-2011 Total Volume
194,896 9.37
04-Jul-11 Clean Force 149,700 62,608 3.01 Trinidad BG
14-Jul-11 Methane Julia Louise 170,000 68,224 3.28Equatorial Guinea BG
26-Jul-11 Methane Patricia Camila 170,000 70,928 3.41
Equatorial Guinea BG
Jul-2011 Total Volume
201,760 9.70
07-Aug-11 Clean Force 149,700 64,480 3.10 Trinidad BG
13-Aug-11 Seri Bijaksana 145,000 65,520 3.15 Qatar BG
23-Aug-11 LNG Jupiter 145,000 64,480 3.10 Qatar BG
30-Aug-11 Methane Julia Louise 170,000 65,312 3.14 Trinidad BG
Aug-2011 Total Volume
259,792 12.49
03-Sep-11 British Diamond 155,000 61,984 2.98 Trinidad BP/BG
15-Sep-11 TBN 145,000 64,688 3.11Equatorial Guinea BG
25-Sep-11 TBN 145,000 64,480 3.10 Trinidad BG
Sep-2011 Total Volume
191,152 9.19
53
Waterborne Energy, Inc.
2323 S. Shepherd Dr. Suite 1010 Houston, Texas
77019 713/526-1555 www.waterbornelng.com
25 Aug 2011
Vol. 8, Week 34
54
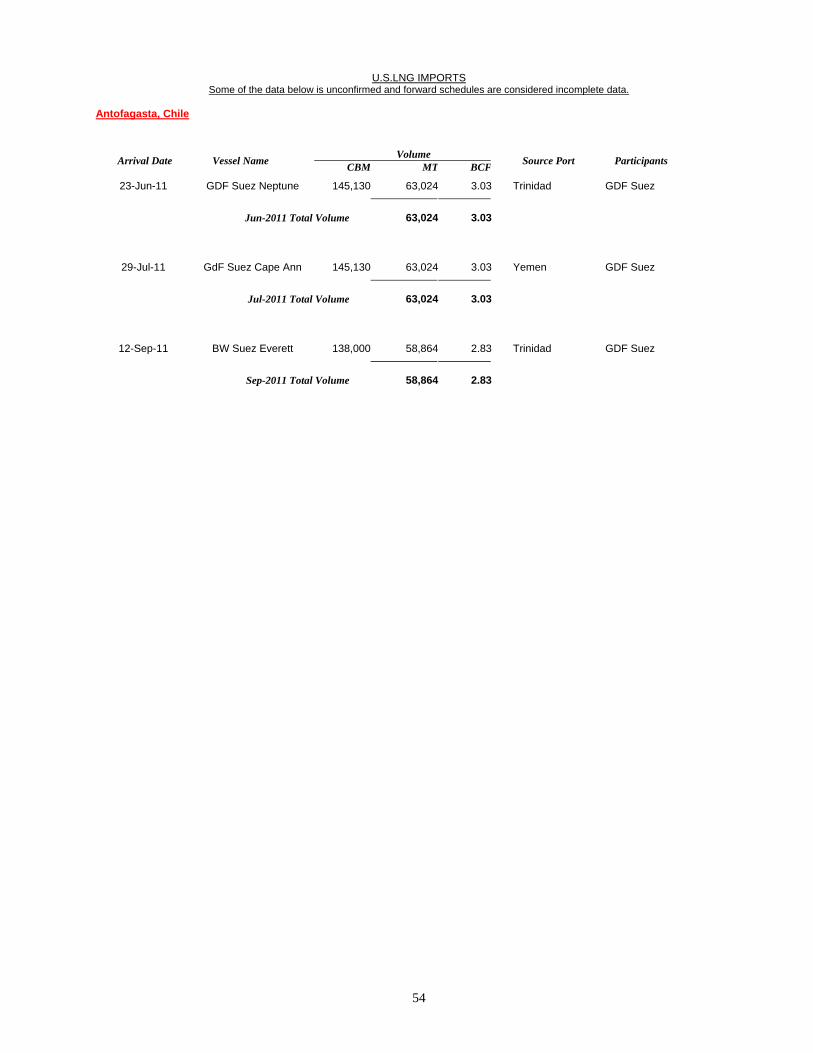
U.S.LNG IMPORTS Some of the data below is unconfirmed and forward schedules are considered incomplete data.
Antofagasta, Chile
Volume Arrival Date Vessel Name
CBM MT BCFSource Port Participants
23-Jun-11 GDF Suez Neptune 145,130 63,024 3.03 Trinidad GDF Suez
Jun-2011 Total Volume
63,024 3.03
29-Jul-11 GdF Suez Cape Ann 145,130 63,024 3.03 Yemen GDF Suez
Jul-2011 Total Volume
63,024 3.03
12-Sep-11 BW Suez Everett 138,000 58,864 2.83 Trinidad GDF Suez
Sep-2011 Total Volume
58,864 2.83
55
Waterborne Energy, Inc.
2323 S. Shepherd Dr. Suite 1010 Houston, Texas
77019 713/526-1555 www.waterbornelng.com
25 Aug 2011
Vol. 8, Week 34
56
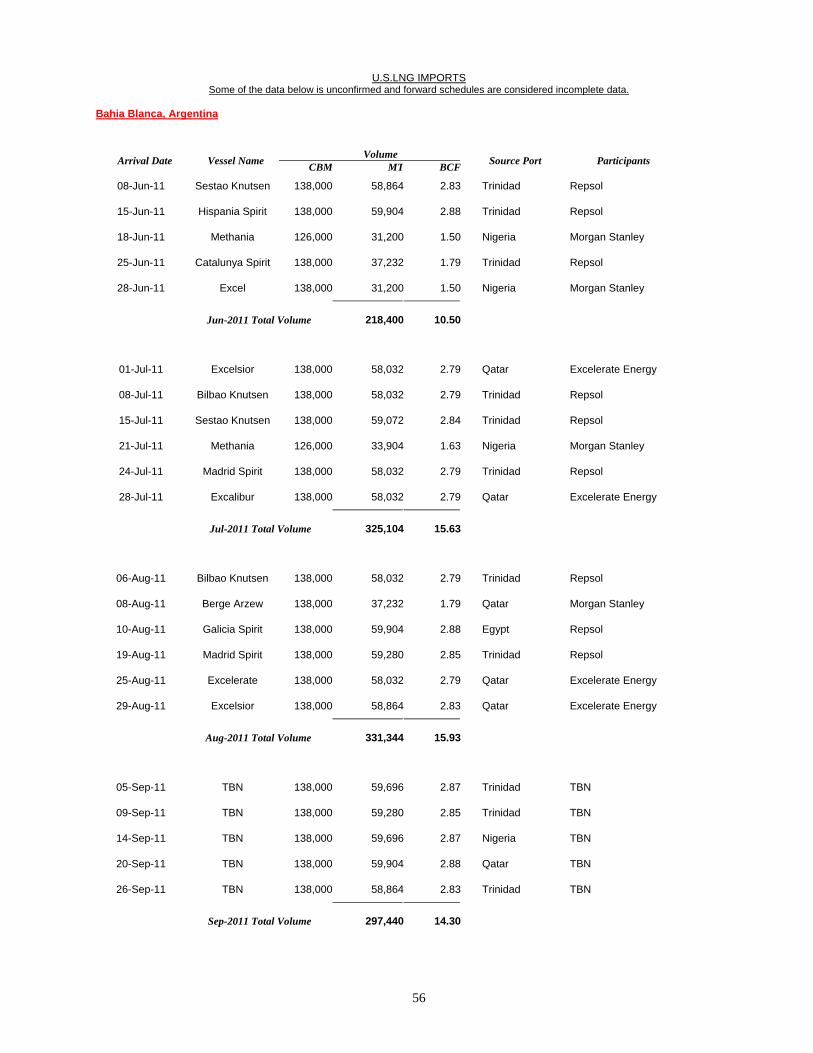
U.S.LNG IMPORTS Some of the data below is unconfirmed and forward schedules are considered incomplete data.
Bahia Blanca, Argentina
Volume Arrival Date Vessel Name
CBM MT BCFSource Port Participants
08-Jun-11 Sestao Knutsen 138,000 58,864 2.83 Trinidad Repsol
15-Jun-11 Hispania Spirit 138,000 59,904 2.88 Trinidad Repsol
18-Jun-11 Methania 126,000 31,200 1.50 Nigeria Morgan Stanley
25-Jun-11 Catalunya Spirit 138,000 37,232 1.79 Trinidad Repsol
28-Jun-11 Excel 138,000 31,200 1.50 Nigeria Morgan Stanley
Jun-2011 Total Volume
218,400 10.50
01-Jul-11 Excelsior 138,000 58,032 2.79 Qatar Excelerate Energy
08-Jul-11 Bilbao Knutsen 138,000 58,032 2.79 Trinidad Repsol
15-Jul-11 Sestao Knutsen 138,000 59,072 2.84 Trinidad Repsol
21-Jul-11 Methania 126,000 33,904 1.63 Nigeria Morgan Stanley
24-Jul-11 Madrid Spirit 138,000 58,032 2.79 Trinidad Repsol
28-Jul-11 Excalibur 138,000 58,032 2.79 Qatar Excelerate Energy
Jul-2011 Total Volume
325,104 15.63
06-Aug-11 Bilbao Knutsen 138,000 58,032 2.79 Trinidad Repsol
08-Aug-11 Berge Arzew 138,000 37,232 1.79 Qatar Morgan Stanley
10-Aug-11 Galicia Spirit 138,000 59,904 2.88 Egypt Repsol
19-Aug-11 Madrid Spirit 138,000 59,280 2.85 Trinidad Repsol
25-Aug-11 Excelerate 138,000 58,032 2.79 Qatar Excelerate Energy
29-Aug-11 Excelsior 138,000 58,864 2.83 Qatar Excelerate Energy
Aug-2011 Total Volume
331,344 15.93
05-Sep-11 TBN 138,000 59,696 2.87 Trinidad TBN
09-Sep-11 TBN 138,000 59,280 2.85 Trinidad TBN
14-Sep-11 TBN 138,000 59,696 2.87 Nigeria TBN
20-Sep-11 TBN 138,000 59,904 2.88 Qatar TBN
26-Sep-11 TBN 138,000 58,864 2.83 Trinidad TBN
Sep-2011 Total Volume
297,440 14.30
57
Waterborne Energy, Inc.
2323 S. Shepherd Dr. Suite 1010 Houston, Texas
77019 713/526-1555 www.waterbornelng.com
25 Aug 2011
Vol. 8, Week 34
58
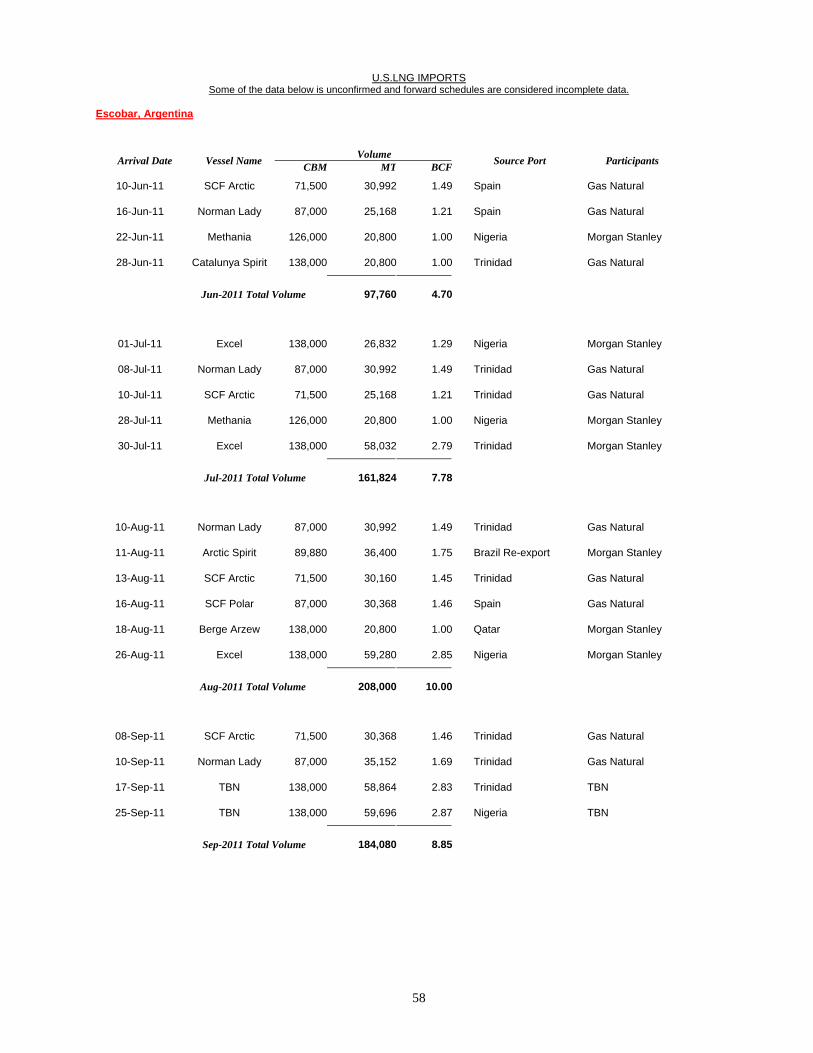
U.S.LNG IMPORTS Some of the data below is unconfirmed and forward schedules are considered incomplete data.
Escobar, Argentina
Volume Arrival Date Vessel Name
CBM MT BCFSource Port Participants
10-Jun-11 SCF Arctic 71,500 30,992 1.49 Spain Gas Natural
16-Jun-11 Norman Lady 87,000 25,168 1.21 Spain Gas Natural
22-Jun-11 Methania 126,000 20,800 1.00 Nigeria Morgan Stanley
28-Jun-11 Catalunya Spirit 138,000 20,800 1.00 Trinidad Gas Natural
Jun-2011 Total Volume
97,760 4.70
01-Jul-11 Excel 138,000 26,832 1.29 Nigeria Morgan Stanley
08-Jul-11 Norman Lady 87,000 30,992 1.49 Trinidad Gas Natural
10-Jul-11 SCF Arctic 71,500 25,168 1.21 Trinidad Gas Natural
28-Jul-11 Methania 126,000 20,800 1.00 Nigeria Morgan Stanley
30-Jul-11 Excel 138,000 58,032 2.79 Trinidad Morgan Stanley
Jul-2011 Total Volume
161,824 7.78
10-Aug-11 Norman Lady 87,000 30,992 1.49 Trinidad Gas Natural
11-Aug-11 Arctic Spirit 89,880 36,400 1.75 Brazil Re-export Morgan Stanley
13-Aug-11 SCF Arctic 71,500 30,160 1.45 Trinidad Gas Natural
16-Aug-11 SCF Polar 87,000 30,368 1.46 Spain Gas Natural
18-Aug-11 Berge Arzew 138,000 20,800 1.00 Qatar Morgan Stanley
26-Aug-11 Excel 138,000 59,280 2.85 Nigeria Morgan Stanley
Aug-2011 Total Volume
208,000 10.00
08-Sep-11 SCF Arctic 71,500 30,368 1.46 Trinidad Gas Natural
10-Sep-11 Norman Lady 87,000 35,152 1.69 Trinidad Gas Natural
17-Sep-11 TBN 138,000 58,864 2.83 Trinidad TBN
25-Sep-11 TBN 138,000 59,696 2.87 Nigeria TBN
Sep-2011 Total Volume
184,080 8.85
59
Waterborne Energy, Inc.
2323 S. Shepherd Dr. Suite 1010 Houston, Texas
77019 713/526-1555 www.waterbornelng.com
25 Aug 2011
Vol. 8, Week 34
60
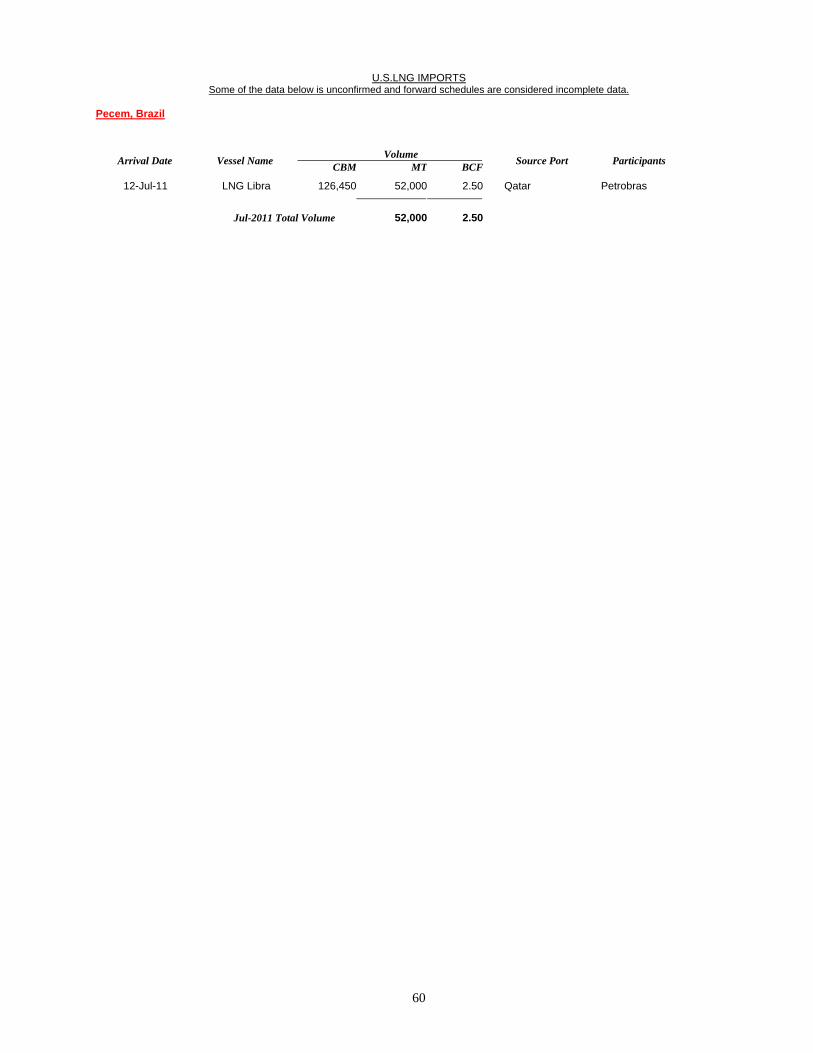
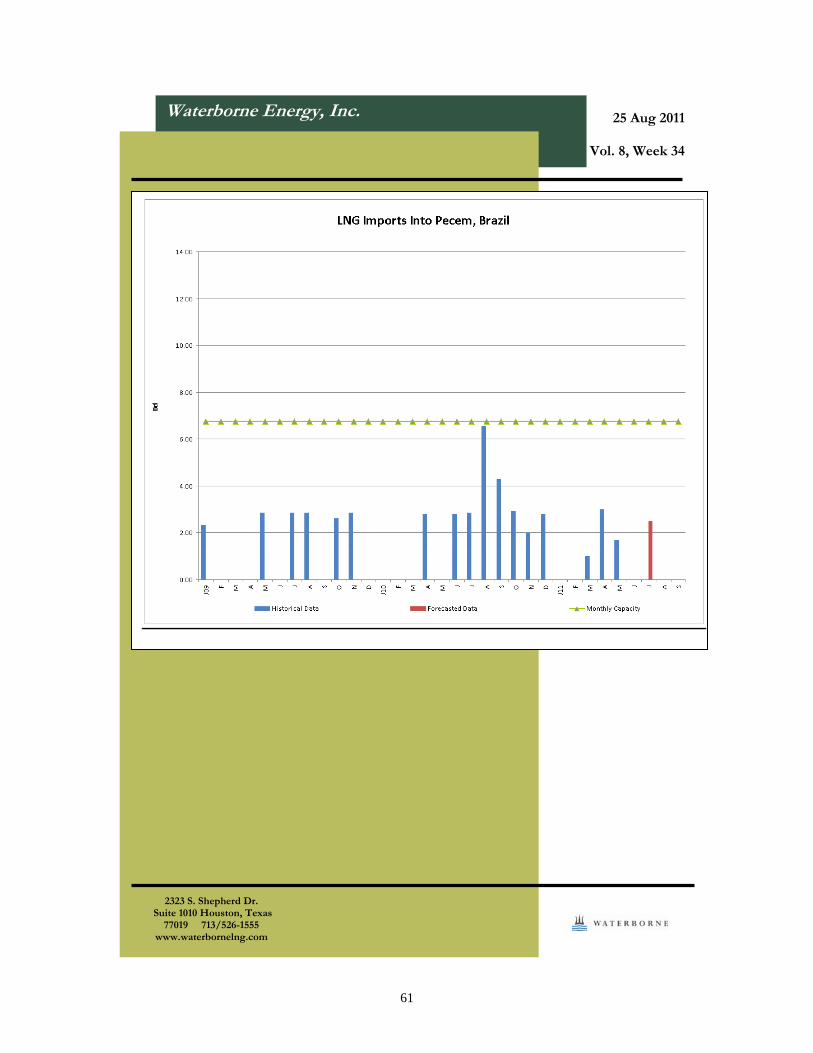
U.S.LNG IMPORTS Some of the data below is unconfirmed and forward schedules are considered incomplete data.
Pecem, Brazil
Volume Arrival Date Vessel Name
CBM MT BCFSource Port Participants
12-Jul-11 LNG Libra 126,450 52,000 2.50 Qatar Petrobras
Jul-2011 Total Volume
52,000 2.50
61
Waterborne Energy, Inc.
2323 S. Shepherd Dr. Suite 1010 Houston, Texas
77019 713/526-1555 www.waterbornelng.com
25 Aug 2011
Vol. 8, Week 34
62
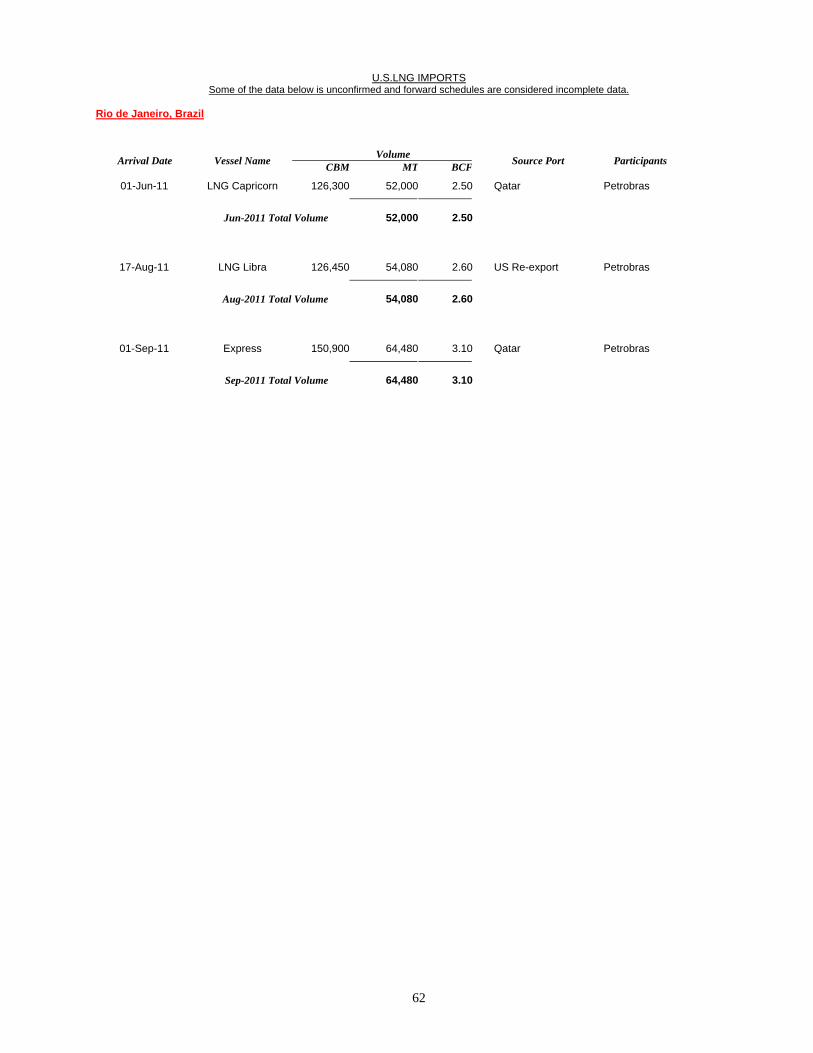
U.S.LNG IMPORTS Some of the data below is unconfirmed and forward schedules are considered incomplete data.
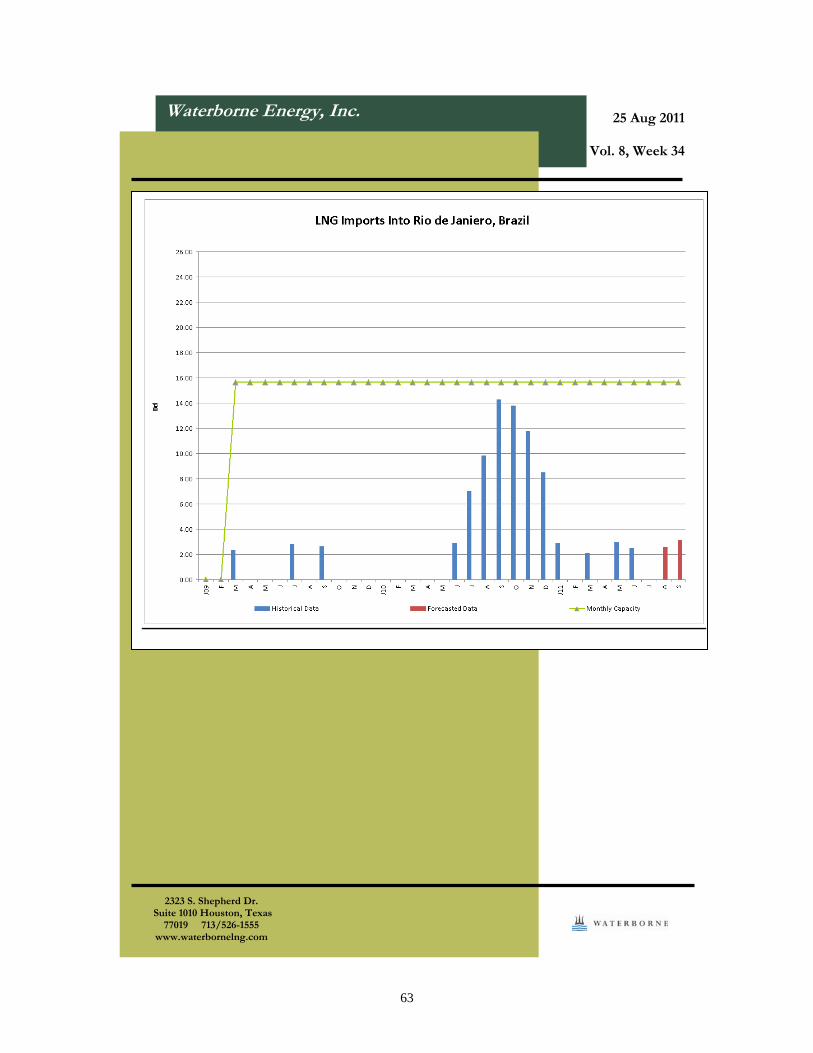
Rio de Janeiro, Brazil
Volume Arrival Date Vessel Name
CBM MT BCFSource Port Participants
01-Jun-11 LNG Capricorn 126,300 52,000 2.50 Qatar Petrobras
Jun-2011 Total Volume
52,000 2.50
17-Aug-11 LNG Libra 126,450 54,080 2.60 US Re-export Petrobras
Aug-2011 Total Volume
54,080 2.60
01-Sep-11 Express 150,900 64,480 3.10 Qatar Petrobras
Sep-2011 Total Volume
64,480 3.10
63
Waterborne Energy, Inc.
2323 S. Shepherd Dr. Suite 1010 Houston, Texas
77019 713/526-1555 www.waterbornelng.com
25 Aug 2011
Vol. 8, Week 34
64
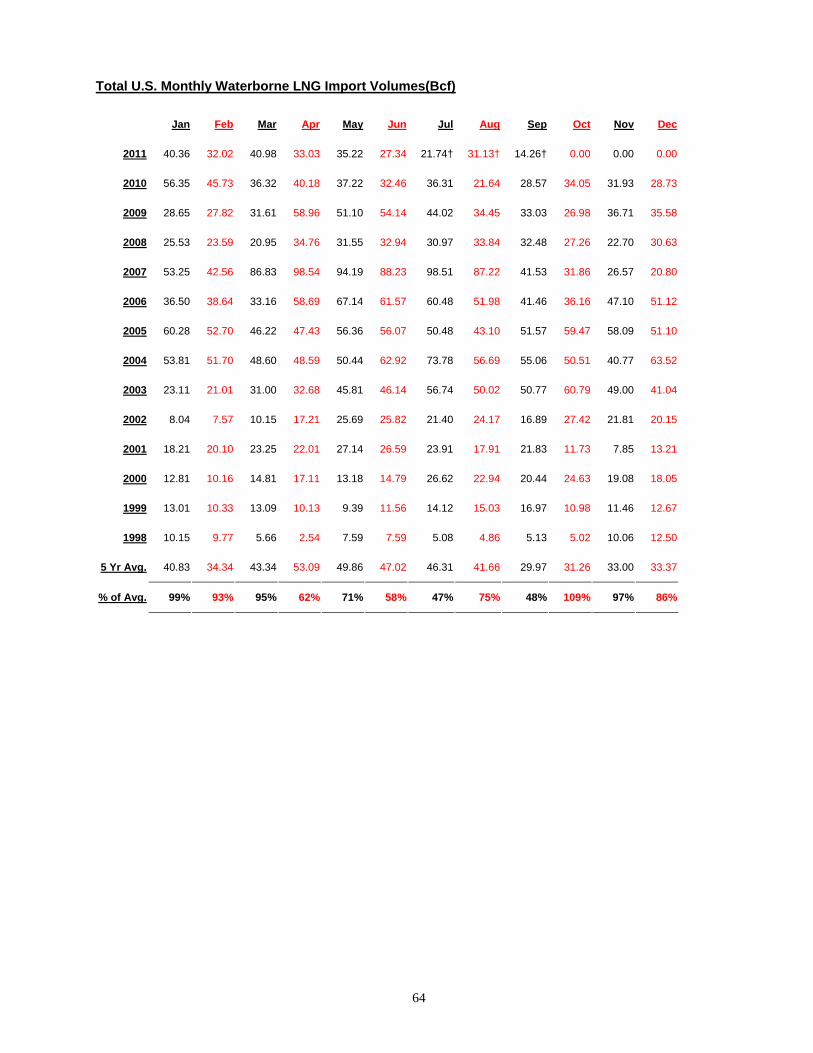
Total U.S. Monthly Waterborne LNG Import Volumes(Bcf)
Jan Feb Mar Apr May Jun Jul Aug Sep Oct Nov Dec
2011 40.36 32.02 40.98 33.03 35.22 27.34 21.74† 31.13† 14.26† 0.00 0.00 0.00
2010 56.35 45.73 36.32 40.18 37.22 32.46 36.31 21.64 28.57 34.05 31.93 28.73
2009 28.65 27.82 31.61 58.96 51.10 54.14 44.02 34.45 33.03 26.98 36.71 35.58
2008 25.53 23.59 20.95 34.76 31.55 32.94 30.97 33.84 32.48 27.26 22.70 30.63
2007 53.25 42.56 86.83 98.54 94.19 88.23 98.51 87.22 41.53 31.86 26.57 20.80
2006 36.50 38.64 33.16 58.69 67.14 61.57 60.48 51.98 41.46 36.16 47.10 51.12
2005 60.28 52.70 46.22 47.43 56.36 56.07 50.48 43.10 51.57 59.47 58.09 51.10
2004 53.81 51.70 48.60 48.59 50.44 62.92 73.78 56.69 55.06 50.51 40.77 63.52
2003 23.11 21.01 31.00 32.68 45.81 46.14 56.74 50.02 50.77 60.79 49.00 41.04
2002 8.04 7.57 10.15 17.21 25.69 25.82 21.40 24.17 16.89 27.42 21.81 20.15
2001 18.21 20.10 23.25 22.01 27.14 26.59 23.91 17.91 21.83 11.73 7.85 13.21
2000 12.81 10.16 14.81 17.11 13.18 14.79 26.62 22.94 20.44 24.63 19.08 18.05
1999 13.01 10.33 13.09 10.13 9.39 11.56 14.12 15.03 16.97 10.98 11.46 12.67
1998 10.15 9.77 5.66 2.54 7.59 7.59 5.08 4.86 5.13 5.02 10.06 12.50
5 Yr Avg. 40.83 34.34 43.34 53.09 49.86 47.02 46.31 41.66 29.97 31.26 33.00 33.37
% of Avg. 99% 93% 95% 62% 71% 58% 47% 75% 48% 109% 97% 86%
65
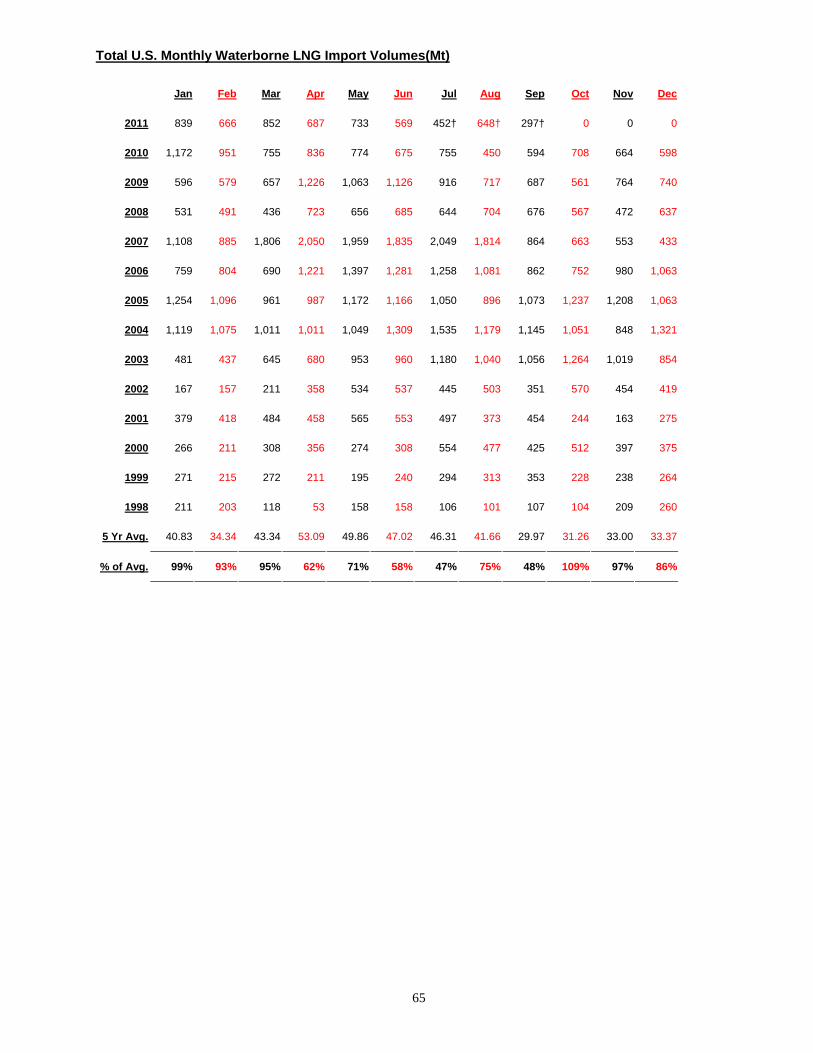
Total U.S. Monthly Waterborne LNG Import Volumes(Mt)
Jan Feb Mar Apr May Jun Jul Aug Sep Oct Nov Dec
2011 839 666 852 687 733 569 452† 648† 297† 0 0 0
2010 1,172 951 755 836 774 675 755 450 594 708 664 598
2009 596 579 657 1,226 1,063 1,126 916 717 687 561 764 740
2008 531 491 436 723 656 685 644 704 676 567 472 637
2007 1,108 885 1,806 2,050 1,959 1,835 2,049 1,814 864 663 553 433
2006 759 804 690 1,221 1,397 1,281 1,258 1,081 862 752 980 1,063
2005 1,254 1,096 961 987 1,172 1,166 1,050 896 1,073 1,237 1,208 1,063
2004 1,119 1,075 1,011 1,011 1,049 1,309 1,535 1,179 1,145 1,051 848 1,321
2003 481 437 645 680 953 960 1,180 1,040 1,056 1,264 1,019 854
2002 167 157 211 358 534 537 445 503 351 570 454 419
2001 379 418 484 458 565 553 497 373 454 244 163 275
2000 266 211 308 356 274 308 554 477 425 512 397 375
1999 271 215 272 211 195 240 294 313 353 228 238 264
1998 211 203 118 53 158 158 106 101 107 104 209 260
5 Yr Avg. 40.83 34.34 43.34 53.09 49.86 47.02 46.31 41.66 29.97 31.26 33.00 33.37
% of Avg. 99% 93% 95% 62% 71% 58% 47% 75% 48% 109% 97% 86%
66
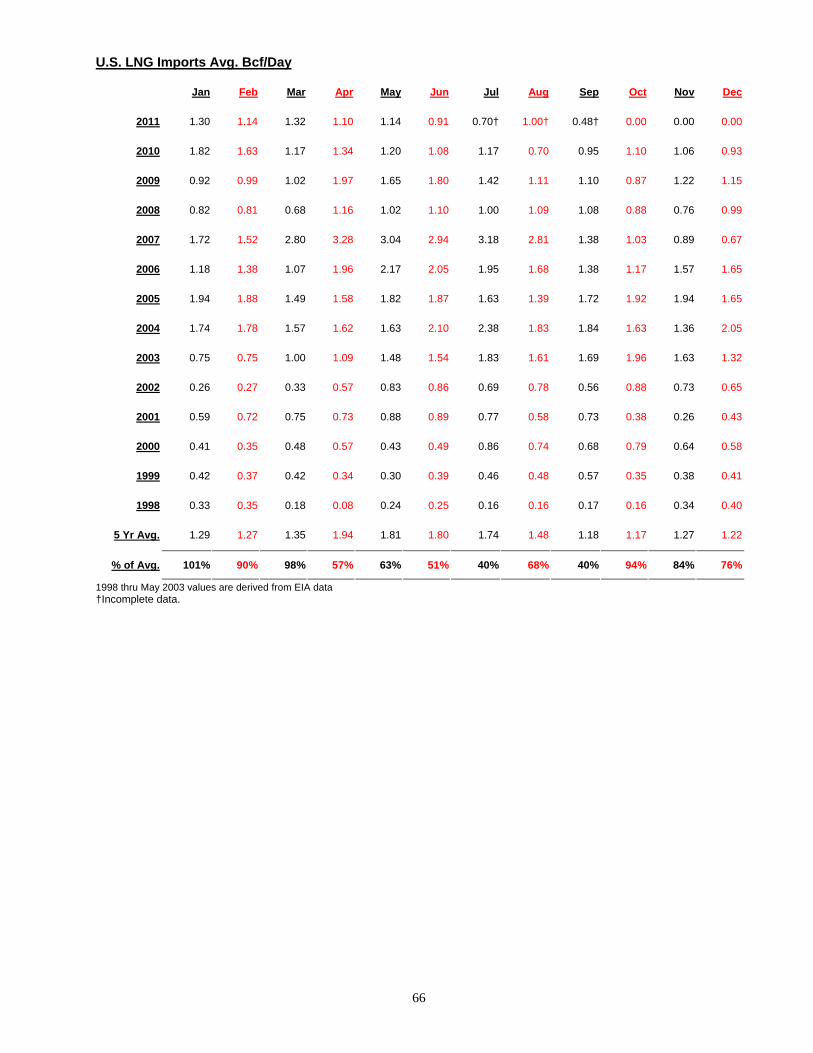
U.S. LNG Imports Avg. Bcf/Day
Jan Feb Mar Apr May Jun Jul Aug Sep Oct Nov Dec
2011 1.30 1.14 1.32 1.10 1.14 0.91 0.70† 1.00† 0.48† 0.00 0.00 0.00
2010 1.82 1.63 1.17 1.34 1.20 1.08 1.17 0.70 0.95 1.10 1.06 0.93
2009 0.92 0.99 1.02 1.97 1.65 1.80 1.42 1.11 1.10 0.87 1.22 1.15
2008 0.82 0.81 0.68 1.16 1.02 1.10 1.00 1.09 1.08 0.88 0.76 0.99
2007 1.72 1.52 2.80 3.28 3.04 2.94 3.18 2.81 1.38 1.03 0.89 0.67
2006 1.18 1.38 1.07 1.96 2.17 2.05 1.95 1.68 1.38 1.17 1.57 1.65
2005 1.94 1.88 1.49 1.58 1.82 1.87 1.63 1.39 1.72 1.92 1.94 1.65
2004 1.74 1.78 1.57 1.62 1.63 2.10 2.38 1.83 1.84 1.63 1.36 2.05
2003 0.75 0.75 1.00 1.09 1.48 1.54 1.83 1.61 1.69 1.96 1.63 1.32
2002 0.26 0.27 0.33 0.57 0.83 0.86 0.69 0.78 0.56 0.88 0.73 0.65
2001 0.59 0.72 0.75 0.73 0.88 0.89 0.77 0.58 0.73 0.38 0.26 0.43
2000 0.41 0.35 0.48 0.57 0.43 0.49 0.86 0.74 0.68 0.79 0.64 0.58
1999 0.42 0.37 0.42 0.34 0.30 0.39 0.46 0.48 0.57 0.35 0.38 0.41
1998 0.33 0.35 0.18 0.08 0.24 0.25 0.16 0.16 0.17 0.16 0.34 0.40
5 Yr Avg. 1.29 1.27 1.35 1.94 1.81 1.80 1.74 1.48 1.18 1.17 1.27 1.22
% of Avg. 101% 90% 98% 57% 63% 51% 40% 68% 40% 94% 84% 76%
1998 thru May 2003 values are derived from EIA data †Incomplete data.
67
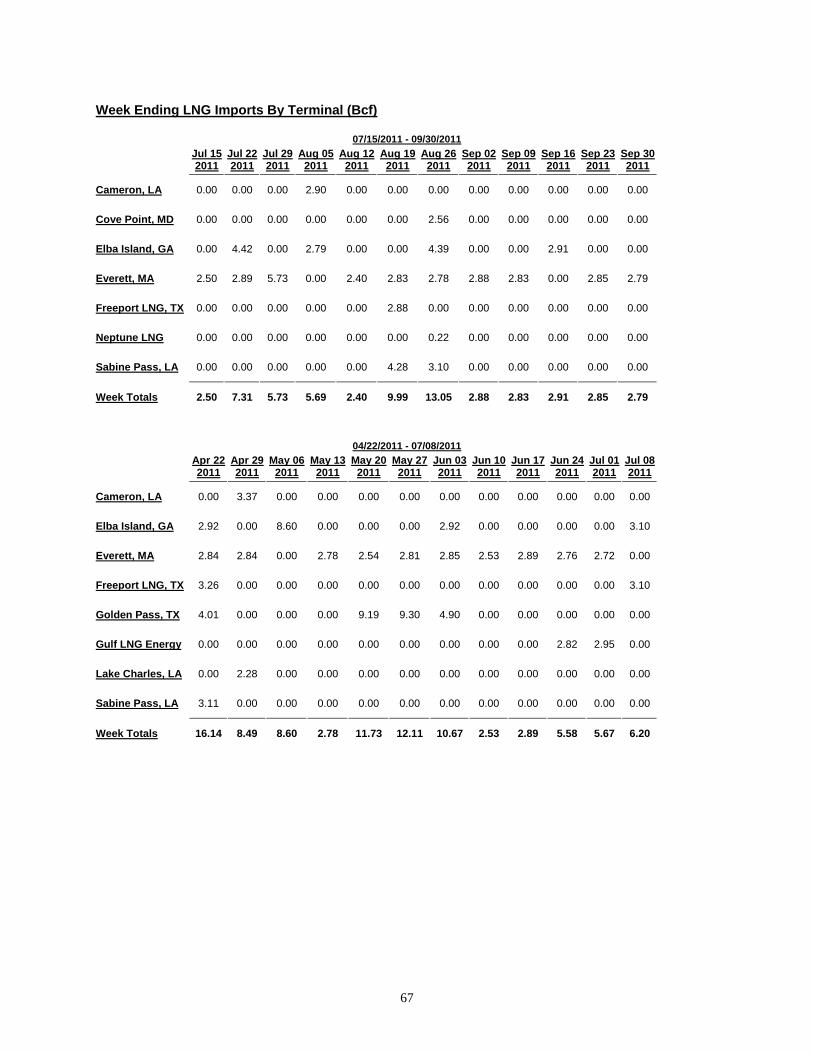
Week Ending LNG Imports By Terminal (Bcf)
07/15/2011 - 09/30/2011
Jul 15 2011
Jul 22 2011
Jul 29 2011
Aug 052011
Aug 122011
Aug 192011
Aug 262011
Sep 022011
Sep 092011
Sep 16 2011
Sep 23 2011
Sep 302011
Cameron, LA 0.00 0.00 0.00 2.90 0.00 0.00 0.00 0.00 0.00 0.00 0.00 0.00
Cove Point, MD 0.00 0.00 0.00 0.00 0.00 0.00 2.56 0.00 0.00 0.00 0.00 0.00
Elba Island, GA 0.00 4.42 0.00 2.79 0.00 0.00 4.39 0.00 0.00 2.91 0.00 0.00
Everett, MA 2.50 2.89 5.73 0.00 2.40 2.83 2.78 2.88 2.83 0.00 2.85 2.79
Freeport LNG, TX 0.00 0.00 0.00 0.00 0.00 2.88 0.00 0.00 0.00 0.00 0.00 0.00
Neptune LNG 0.00 0.00 0.00 0.00 0.00 0.00 0.22 0.00 0.00 0.00 0.00 0.00
Sabine Pass, LA 0.00 0.00 0.00 0.00 0.00 4.28 3.10 0.00 0.00 0.00 0.00 0.00
Week Totals 2.50 7.31 5.73 5.69 2.40 9.99 13.05 2.88 2.83 2.91 2.85 2.79
04/22/2011 - 07/08/2011
Apr 22 2011
Apr 29 2011
May 06 2011
May 132011
May 202011
May 272011
Jun 032011
Jun 102011
Jun 172011
Jun 24 2011
Jul 01 2011
Jul 082011
Cameron, LA 0.00 3.37 0.00 0.00 0.00 0.00 0.00 0.00 0.00 0.00 0.00 0.00
Elba Island, GA 2.92 0.00 8.60 0.00 0.00 0.00 2.92 0.00 0.00 0.00 0.00 3.10
Everett, MA 2.84 2.84 0.00 2.78 2.54 2.81 2.85 2.53 2.89 2.76 2.72 0.00
Freeport LNG, TX 3.26 0.00 0.00 0.00 0.00 0.00 0.00 0.00 0.00 0.00 0.00 3.10
Golden Pass, TX 4.01 0.00 0.00 0.00 9.19 9.30 4.90 0.00 0.00 0.00 0.00 0.00
Gulf LNG Energy 0.00 0.00 0.00 0.00 0.00 0.00 0.00 0.00 0.00 2.82 2.95 0.00
Lake Charles, LA 0.00 2.28 0.00 0.00 0.00 0.00 0.00 0.00 0.00 0.00 0.00 0.00
Sabine Pass, LA 3.11 0.00 0.00 0.00 0.00 0.00 0.00 0.00 0.00 0.00 0.00 0.00
Week Totals 16.14 8.49 8.60 2.78 11.73 12.11 10.67 2.53 2.89 5.58 5.67 6.20
68
Waterborne Energy, Inc.
2323 S. Shepherd Dr. Suite 1010 Houston, Texas
77019 713/526-1555 www.waterbornelng.com
25 Aug 2011
Vol. 8, Week 34
69
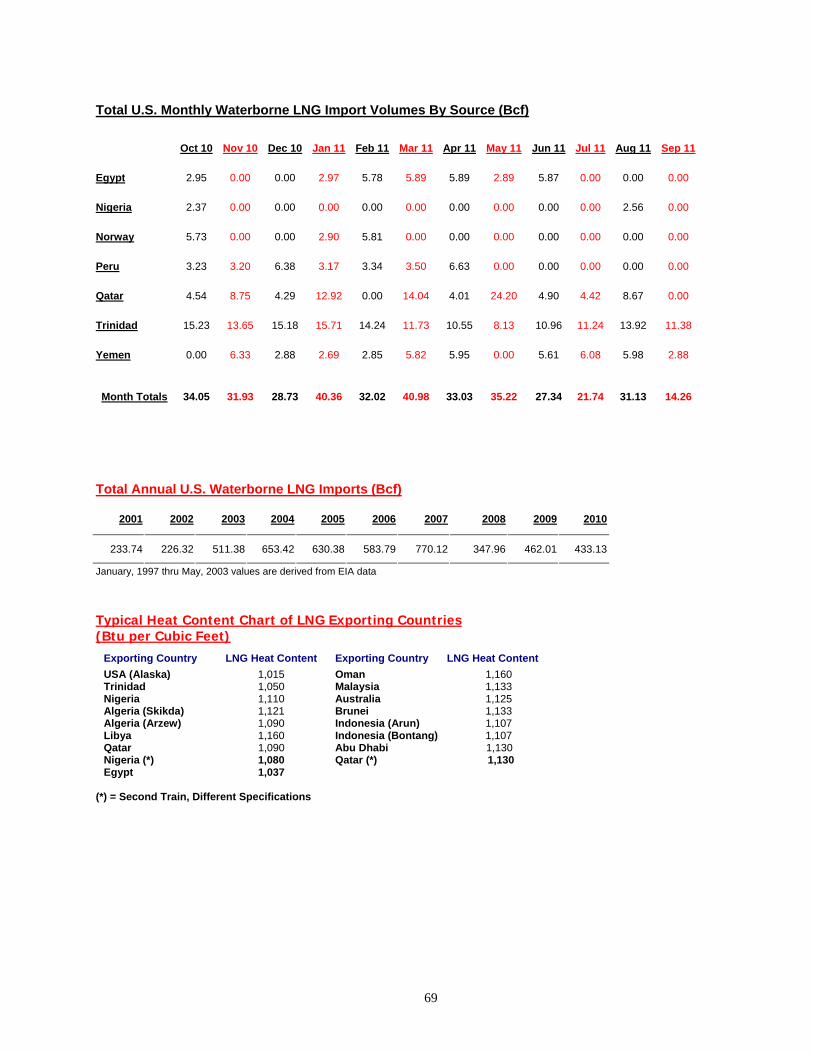
Total U.S. Monthly Waterborne LNG Import Volumes By Source (Bcf)
Oct 10 Nov 10 Dec 10 Jan 11 Feb 11 Mar 11 Apr 11 May 11 Jun 11 Jul 11 Aug 11 Sep 11
Egypt 2.95 0.00 0.00 2.97 5.78 5.89 5.89 2.89 5.87 0.00 0.00 0.00
Nigeria 2.37 0.00 0.00 0.00 0.00 0.00 0.00 0.00 0.00 0.00 2.56 0.00
Norway 5.73 0.00 0.00 2.90 5.81 0.00 0.00 0.00 0.00 0.00 0.00 0.00
Peru 3.23 3.20 6.38 3.17 3.34 3.50 6.63 0.00 0.00 0.00 0.00 0.00
Qatar 4.54 8.75 4.29 12.92 0.00 14.04 4.01 24.20 4.90 4.42 8.67 0.00
Trinidad 15.23 13.65 15.18 15.71 14.24 11.73 10.55 8.13 10.96 11.24 13.92 11.38
Yemen 0.00 6.33 2.88 2.69 2.85 5.82 5.95 0.00 5.61 6.08 5.98 2.88
Month Totals
34.05
31.93
28.73
40.36
32.02
40.98
33.03
35.22
27.34
21.74
31.13
14.26
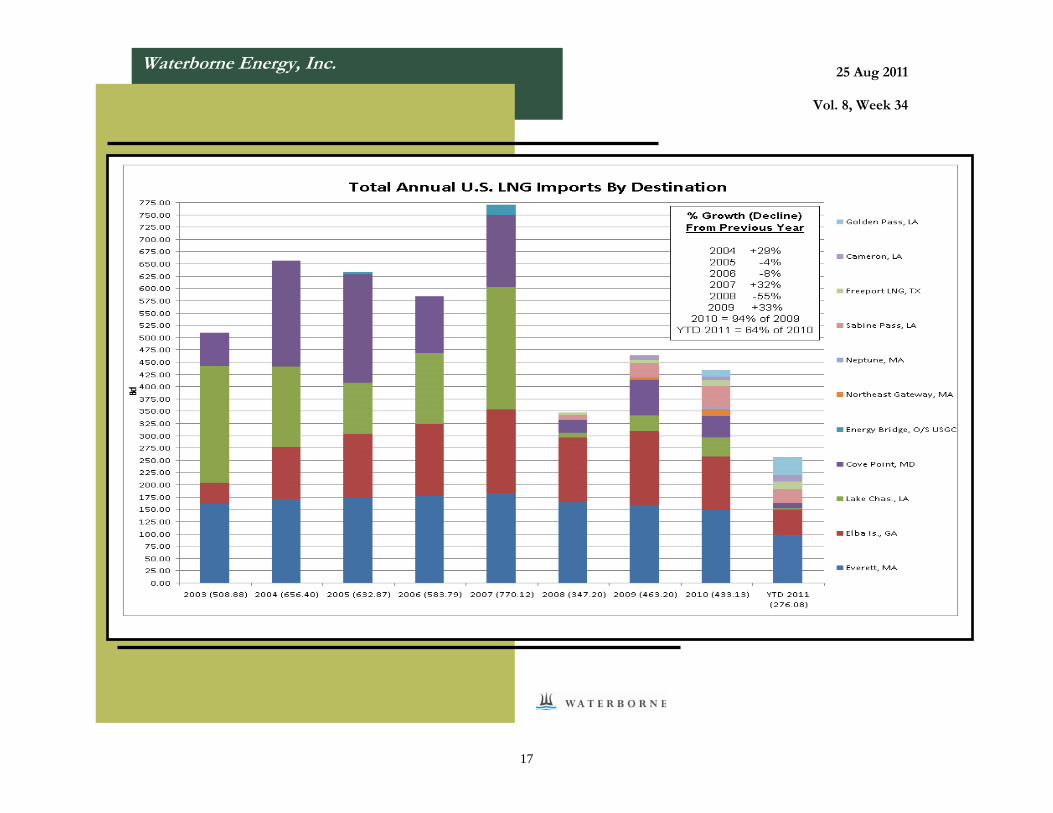
Total Annual U.S. Waterborne LNG Imports (Bcf)
2001 2002 2003 2004 2005 2006 2007 2008 2009 2010
233.74 226.32 511.38 653.42 630.38 583.79 770.12 347.96 462.01 433.13
January, 1997 thru May, 2003 values are derived from EIA data
Typical Heat Content Chart of LNG Exporting Countries (Btu per Cubic Feet) Exporting Country LNG Heat Content Exporting Country LNG Heat Content USA (Alaska) 1,015 Oman 1,160 Trinidad 1,050 Malaysia 1,133 Nigeria 1,110 Australia 1,125 Algeria (Skikda) 1,121 Brunei 1,133 Algeria (Arzew) 1,090 Indonesia (Arun) 1,107 Libya 1,160 Indonesia (Bontang) 1,107 Qatar 1,090 Abu Dhabi 1,130 Nigeria (*) 1,080 Qatar (*) 1,130 Egypt 1,037 (*) = Second Train, Different Specifications
70
Waterborne Energy, Inc.
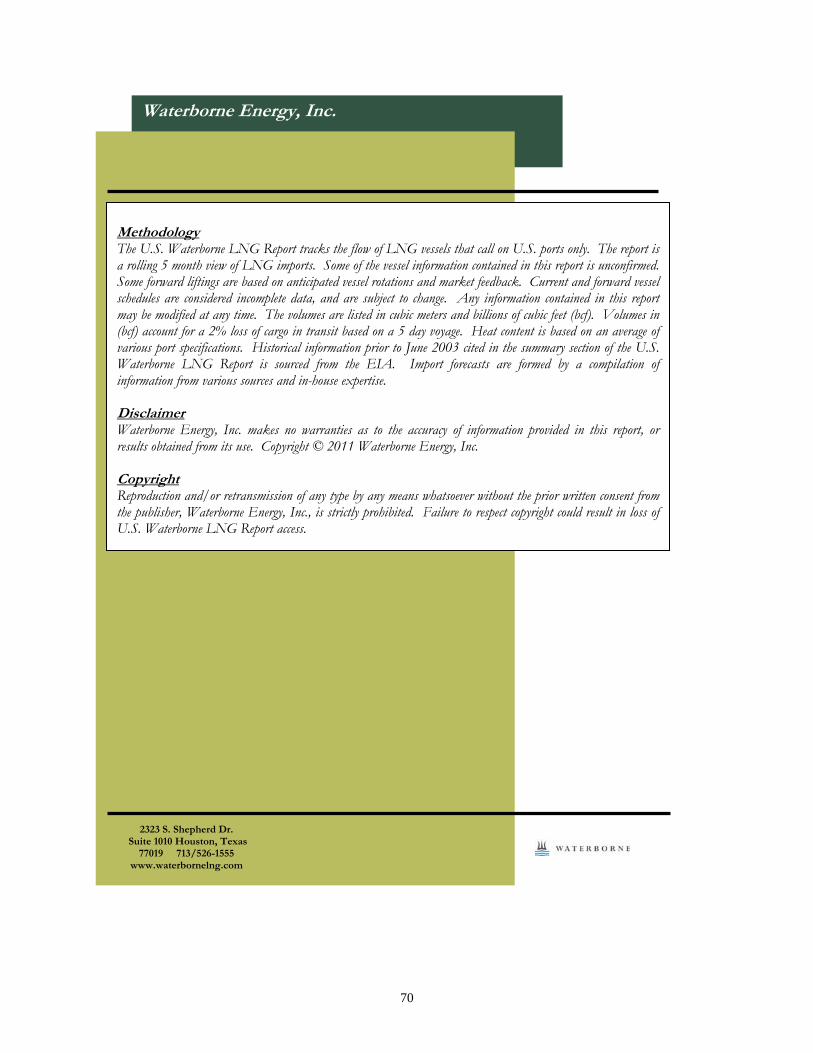
Methodology The U.S. Waterborne LNG Report tracks the flow of LNG vessels that call on U.S. ports only. The report is a rolling 5 month view of LNG imports. Some of the vessel information contained in this report is unconfirmed. Some forward liftings are based on anticipated vessel rotations and market feedback. Current and forward vessel schedules are considered incomplete data, and are subject to change. Any information contained in this report may be modified at any time. The volumes are listed in cubic meters and billions of cubic feet (bcf). Volumes in (bcf) account for a 2% loss of cargo in transit based on a 5 day voyage. Heat content is based on an average of various port specifications. Historical information prior to June 2003 cited in the summary section of the U.S. Waterborne LNG Report is sourced from the EIA. Import forecasts are formed by a compilation of information from various sources and in-house expertise. Disclaimer Waterborne Energy, Inc. makes no warranties as to the accuracy of information provided in this report, or results obtained from its use. Copyright © 2011 Waterborne Energy, Inc. Copyright Reproduction and/or retransmission of any type by any means whatsoever without the prior written consent from the publisher, Waterborne Energy, Inc., is strictly prohibited. Failure to respect copyright could result in loss of U.S. Waterborne LNG Report access.
2323 S. Shepherd Dr. Suite 1010 Houston, Texas
77019 713/526-1555 www.waterbornelng.com

71


![Waterborne Disease [FINAL]](https://img.pdfslide.net/doc/110x75/55a6e1d11a28ab9a558b4647/waterborne-disease-final.jpg)