Embed Size (px)
Citation preview
Page | 1
The Analysis of Kickpoints in Carbon
Fibre Composite Golf Shafts
By
Josh Roberts
A thesis submitted to The University of Birmingham
For the degree of MASTERS OF RESEARCH
School of Metallurgy and Materials
College of Engineering and Physical Sciences
The University of Birmingham
September 2012

University of Birmingham Research Archive
e-theses repository This unpublished thesis/dissertation is copyright of the author and/or third parties. The intellectual property rights of the author or third parties in respect of this work are as defined by The Copyright Designs and Patents Act 1988 or as modified by any successor legislation. Any use made of information contained in this thesis/dissertation must be in accordance with that legislation and must be properly acknowledged. Further distribution or reproduction in any format is prohibited without the permission of the copyright holder.

Page | 2
Contents
Abstract…………………………………………………………………...Page 5
Acknowledgements……………………………………………………….Page 6
1. Introduction……………………………………………………...Page 7
1.1. History of the Golf Shaft……………………………………...Page 7
1.2. The Role of the Golf Shaft…………………………………….Page 8
1.3. Properties of the Golf Shaft and their Assessment…………..Page 11
1.3.1. Bending Stiffness…………………………………………….Page 11
1.3.2. Torsional Stiffness…………………………………………...Page 14
1.3.3. Kickpoint…………………………………………………….Page 15
1.3.4. Mass………………………………………………………….Page 17
1.3.5. Dimensions…………………………………………………..Page 18
1.3.6. Length………………………………………………………..Page 18
1.4. Manufacturing Routes of Composite Golf Club Shafts……...Page 20
1.4.1. Composite Materials and their Properties……………………Page 20
1.4.2. Sheet Lamination…………………………………………….Page 24
1.4.3. Filament Winding……………………………………………Page 26
1.5. Summary of Literature Review……………………………...Page 27
1.6. Aims & Objectives…………………………………………..Page 28
Page | 3
2. Method………………………………………………………….Page 29
2.1. Materials & Samples…………………………………………Page 29
2.2. Statistical Analysis...................................................................Page 29
2.3. Dimensional Analysis..............................................................Page 30
2.4. Bending Stiffness Test.............................................................Page 31
2.5. Kickpoint Test.........................................................................Page 32
2.6. Assumptions for the Influence of Modulus on Bending Stiffness of
Shafts………………………………………………………...Page 36
2.7. Bending Stiffness Distribution………………………………Page 39
2.8. Frequency Testing…………………………………………...Page 41
2.9. Static Strain Analysis………………………………………...Page 42
2.10. Microstructure Analysis……………………………………...Page 43
3. Results & Discussion ………………………………………….Page 45
3.1. Length……………………………………………………….Page 45
3.2. Mass………………………………………………………….Page 46
3.3. Taper…………………………………………………………Page 48
3.4. Wall Thickness………………………………………………Page 51
3.5. Dimensional Analysis Summary…………………………....Page 53
Page | 4
3.6. Static Stiffness Analysis…………………………………….Page 54
3.7. Kickpoint Analysis………………………………………….Page 57
3.8. Static Testing Summary…………………………………….Page 58
3.9. Frequency Analysis………………………………………….Page 60
3.10. Stiffness Profile Analysis……………………………………Page 69
3.11. Strain Analysis……………………………………………….Page 73
3.12. Microstructure Analysis……………………………………...Page 75
4. Conclusions…………………………………………………….Page 84
5. Further Work………………………………………………….Page 86
6. Appendix……………………………………………………….Page 87
7. References……………………………………………………...Page 95
Page | 5
Abstract
The aim of this thesis is to characterise and quantify the construction method of carbon fibre
composite golf shafts and the subsequent kickpoint position of the shaft, for the future
manufacture and testing of shafts with specific kickpoints. For this purpose the geometrical
and material properties of commercial carbon fibre composite golf shafts were investigated
for their influence on the kickpoint position. The shafts were investigated via geometrical,
static deflection tests, quasi – static frequency and material analysis.
The static stiffness of the commercial shafts ranged between 242.1 – 563.3 N/m at a single
cantilever length. The kickpoint position in commercial golf shafts ranges from 45 – 52.9 %
of the shaft length and the position of the kickpoint is the location of the greatest strain in
static testing (1700 µm). The kickpoint position decreased as the gradient of the stiffness
profile of the shaft increased (R2 = 0.77).
The quasi – static frequency analysis presented a maximum 4.8 % variation around the
circumference of sheet laminated shafts and 0.2 % variation in filament wound shafts, the
variation around the circumference of the sheet laminated shafts is the result of “seams” due
to resin rich regions in the manufacturing process resulting in a drop of volume fraction from
the mean of 8.9 % and local wall thickness variation around the circumference (6 %).
The size of the resin rich regions in the sheet laminated shafts were the result of off-axis
fibre orientations between plies constraining fibre movement during the cure cycle. Though
the “seam” position had a measurable effect on the stiffness of the shaft, a negligible
influence of “seam” orientation on kickpoint position was analysed.

Page | 6
Acknowledgements
I would like to say thank you to my lead supervisor Dr Martin Strangwood, who gave
constant feedback, guidance, advice and encouragement during this MRes but also
throughout my Undergraduate degree too. The skills and knowledge gained throughout my
time at The University of Birmingham will be critical to my future career. Thank you is also
required for my industry supervisor Dr Steve Otto, who always brought a fresh pair of eyes
with continued ideas and input into the research.
The experimental work would not have been possible without the support of the lab
technician Mick Cunningham, from my first day as a Undergraduate to my last day as a
Postgraduate he went out of his way to support you by any means possible. A thank you to all
of my colleagues in the office, though an extended thank you must go to Carl Slater for his
advice during my thesis.
The biggest thank you goes to my family, who without their support to attend The University
of Birmingham as an undergraduate and stay on for postgraduate studies would not have been
possible. This thesis is dedicated to them for everything they have provided me with for the
past 5 years.
Page | 7
1. Introduction
1.1. History of the Golf Shaft
The manufacturing of golf clubs between the 17th
through to the 19th
century in Great Britain
relied on materials indigenous to the manufactures region, typically these materials for the
shafts were hardwoods (Dangawood, ash, lemonwood and lancewood). The golfer chose their
shaft wood from the “feel” that they received to their own preference. The early 19th
century
saw the introduction of hickory as a shaft material, hickory had a low density, high modulus,
durability and resistance to warping compared to other hardwood shafts. Although one
disadvantage of the hardwood shafts is that their low strength lead to damaged and broken
shafts, once a shaft is broken it was extremely difficult to find a shaft to duplicate the “feel”
from the previous shaft.
The late 19th
century the development of shaft technology prompting the use of metallic
alloys as shaft materials, although this technology was not fully utilised until the early 20th
century with the production of the hollow metal shaft. The manufacturing method of the
hollow metal shaft allowed variables such as taper, wall thickness and diameter to be altered,
thus allowing the engineering of various stiffness and kickpoint position for a shaft.
Composite materials were introduced to the golf shaft in the 1950’s with glass fibre shafts,
the utilisation of these materials resulted in reduced weight and no compromise of strength
compared to the steel shafts. However, by the early 1970’s glass fibre shafts were phased out
as a result of poor torsional stiffness and poor tensile strength. The carbon fibre composite
shafts (“graphite” shafts) were produced in the late 1960’s resulting in the phasing out of the
glass fibre shafts due to their increased tensile strength. The carbon fibre shafts “boomed” in
the early 1970’s and has been mass produced since.
Page | 8
1.2. The Role of the Golf Club Shaft
The role of the shaft is pivotal in the golf swing in delivering the club head to the ball for a
range of shots and club types from drivers to putters. The shaft has a club head attached with
mass ranges of 180 – 350 g and will be subjected to swing speeds of 2.2 – 62.6 ms-1
(Strangwood, 2003). The dynamic swing motions, range of head masses and swing speeds
will result in significant deformation as a result of stresses and torques during the golf swing.
The analysis of the shaft during the swing has been performed by numerous authors (Milne &
Davis, 1992; Horwood, 1994; Newman, Clay & Strickland, 1997; Mather and Jowett, 2000;
Penner, 2003). At the initiation of the downswing, the golf club is subjected to the torque
exerted by the golfer and the inertia of the golf club head resulting in the shaft being bent
backwards in the plane of swing, as the down swing continues, the shaft straightens out in the
plane of swing prior to impact, Figure. 1.1, (Penner, 2003). The recovery of the shaft is a
result of the material properties of the shaft, centrifugal and inertial forces placed on the shaft
(Horwood, 1994). The deformation to the shaft during the swing has been characterised as the
constant transformation of kinetic and strain energy and vice versa (Newman, Clay &
Strickland, 1997).
Page | 9
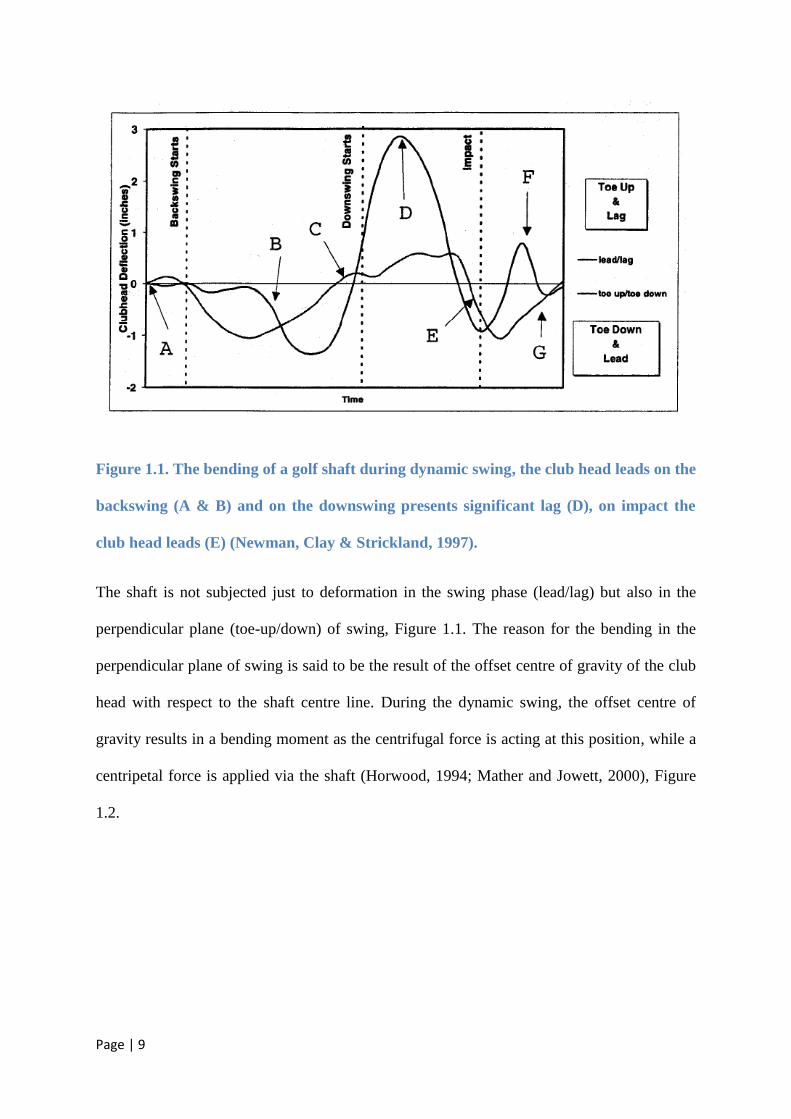
Figure 1.1. The bending of a golf shaft during dynamic swing, the club head leads on the
backswing (A & B) and on the downswing presents significant lag (D), on impact the
club head leads (E) (Newman, Clay & Strickland, 1997).
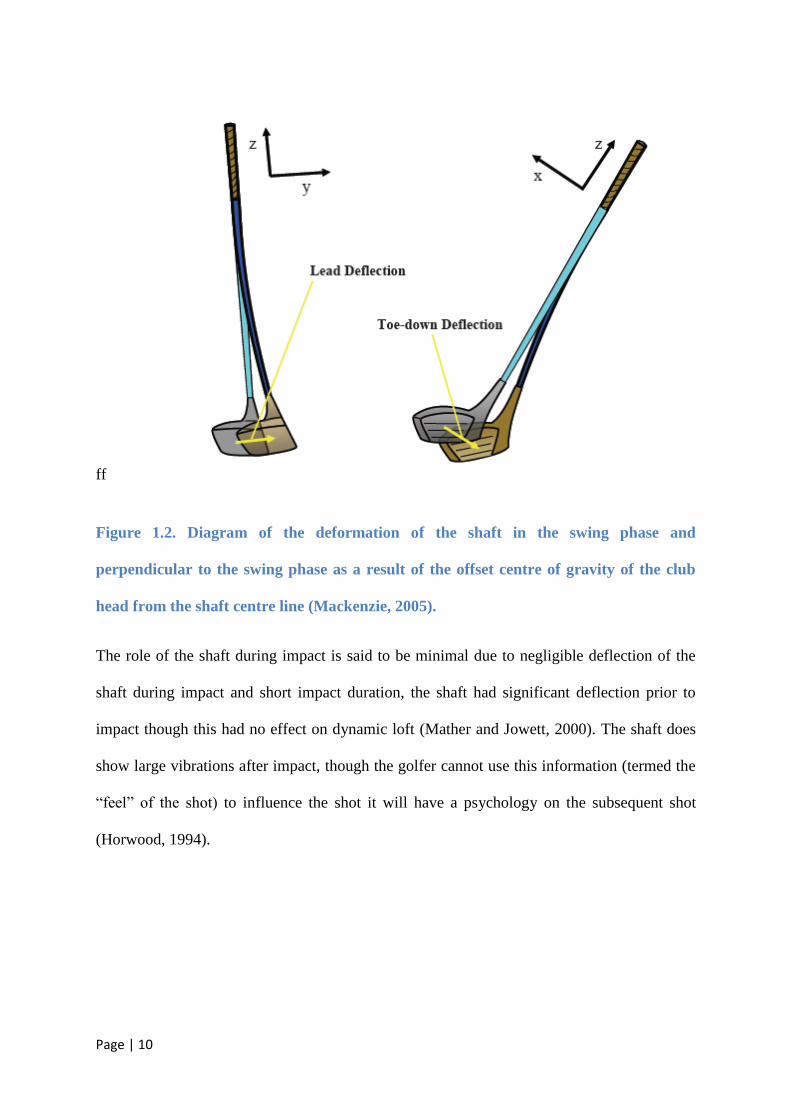
The shaft is not subjected just to deformation in the swing phase (lead/lag) but also in the
perpendicular plane (toe-up/down) of swing, Figure 1.1. The reason for the bending in the
perpendicular plane of swing is said to be the result of the offset centre of gravity of the club
head with respect to the shaft centre line. During the dynamic swing, the offset centre of
gravity results in a bending moment as the centrifugal force is acting at this position, while a
centripetal force is applied via the shaft (Horwood, 1994; Mather and Jowett, 2000), Figure
1.2.
Page | 10
ff
Figure 1.2. Diagram of the deformation of the shaft in the swing phase and
perpendicular to the swing phase as a result of the offset centre of gravity of the club
head from the shaft centre line (Mackenzie, 2005).
The role of the shaft during impact is said to be minimal due to negligible deflection of the
shaft during impact and short impact duration, the shaft had significant deflection prior to
impact though this had no effect on dynamic loft (Mather and Jowett, 2000). The shaft does
show large vibrations after impact, though the golfer cannot use this information (termed the
“feel” of the shot) to influence the shot it will have a psychology on the subsequent shot
(Horwood, 1994).
Page | 11
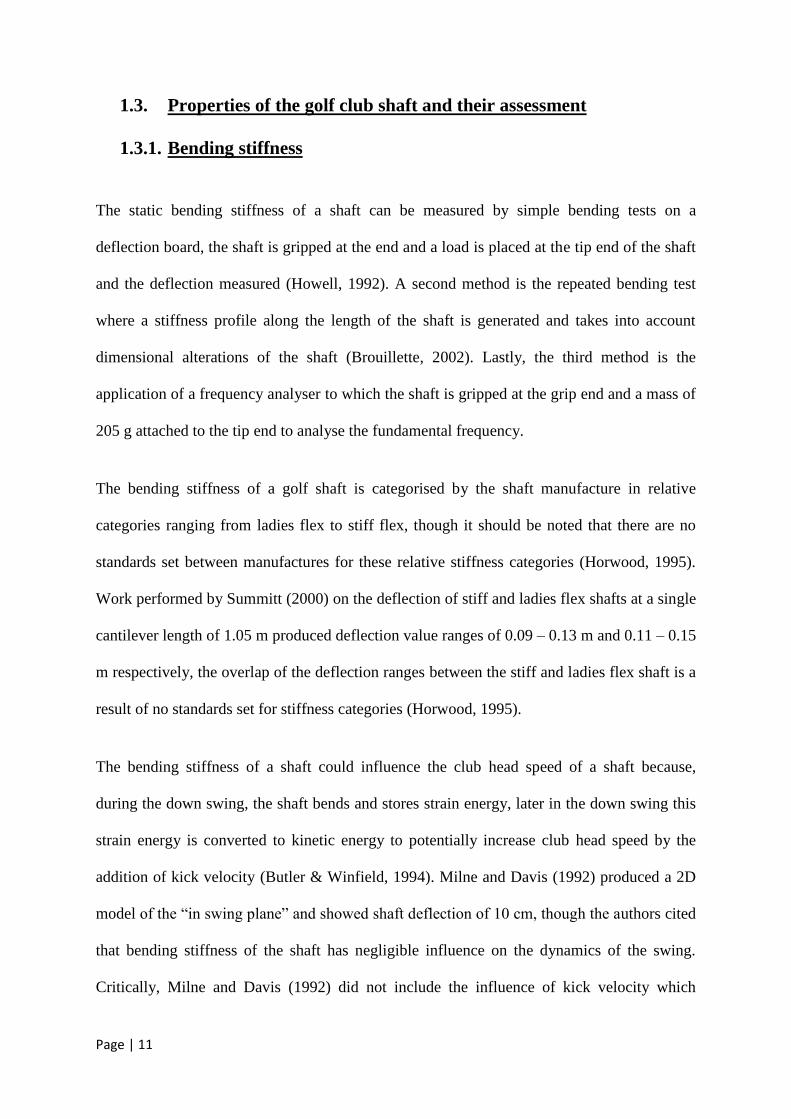
1.3. Properties of the golf club shaft and their assessment
1.3.1. Bending stiffness
The static bending stiffness of a shaft can be measured by simple bending tests on a
deflection board, the shaft is gripped at the end and a load is placed at the tip end of the shaft
and the deflection measured (Howell, 1992). A second method is the repeated bending test
where a stiffness profile along the length of the shaft is generated and takes into account
dimensional alterations of the shaft (Brouillette, 2002). Lastly, the third method is the
application of a frequency analyser to which the shaft is gripped at the grip end and a mass of
205 g attached to the tip end to analyse the fundamental frequency.
The bending stiffness of a golf shaft is categorised by the shaft manufacture in relative
categories ranging from ladies flex to stiff flex, though it should be noted that there are no
standards set between manufactures for these relative stiffness categories (Horwood, 1995).
Work performed by Summitt (2000) on the deflection of stiff and ladies flex shafts at a single
cantilever length of 1.05 m produced deflection value ranges of 0.09 – 0.13 m and 0.11 – 0.15
m respectively, the overlap of the deflection ranges between the stiff and ladies flex shaft is a
result of no standards set for stiffness categories (Horwood, 1995).
The bending stiffness of a shaft could influence the club head speed of a shaft because,
during the down swing, the shaft bends and stores strain energy, later in the down swing this
strain energy is converted to kinetic energy to potentially increase club head speed by the
addition of kick velocity (Butler & Winfield, 1994). Milne and Davis (1992) produced a 2D
model of the “in swing plane” and showed shaft deflection of 10 cm, though the authors cited
that bending stiffness of the shaft has negligible influence on the dynamics of the swing.
Critically, Milne and Davis (1992) did not include the influence of kick velocity which
Page | 12
research has shown to be 5% of the club head speed (Horwood, 1994) and a 2D model does
not depict the 3D deformation of the shaft, though research by Butler & Winfield (1994)
found that deformation in the longitudinal axis (out of swing plane) has negligible influence
on club head speed.
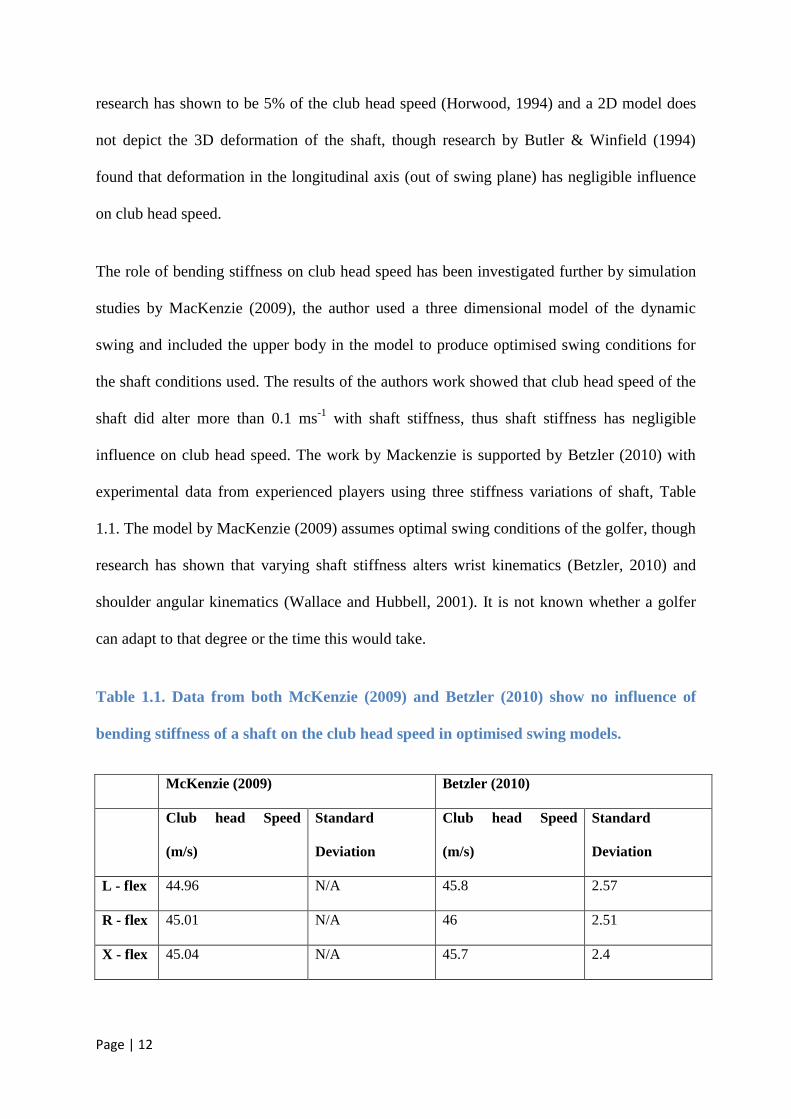
The role of bending stiffness on club head speed has been investigated further by simulation
studies by MacKenzie (2009), the author used a three dimensional model of the dynamic
swing and included the upper body in the model to produce optimised swing conditions for
the shaft conditions used. The results of the authors work showed that club head speed of the
shaft did alter more than 0.1 ms-1
with shaft stiffness, thus shaft stiffness has negligible
influence on club head speed. The work by Mackenzie is supported by Betzler (2010) with
experimental data from experienced players using three stiffness variations of shaft, Table
1.1. The model by MacKenzie (2009) assumes optimal swing conditions of the golfer, though
research has shown that varying shaft stiffness alters wrist kinematics (Betzler, 2010) and
shoulder angular kinematics (Wallace and Hubbell, 2001). It is not known whether a golfer
can adapt to that degree or the time this would take.
Table 1.1. Data from both McKenzie (2009) and Betzler (2010) show no influence of
bending stiffness of a shaft on the club head speed in optimised swing models.
McKenzie (2009) Betzler (2010)
Club head Speed
(m/s)
Standard
Deviation
Club head Speed
(m/s)
Standard
Deviation
L - flex 44.96 N/A 45.8 2.57
R - flex 45.01 N/A 46 2.51
X - flex 45.04 N/A 45.7 2.4
Page | 13
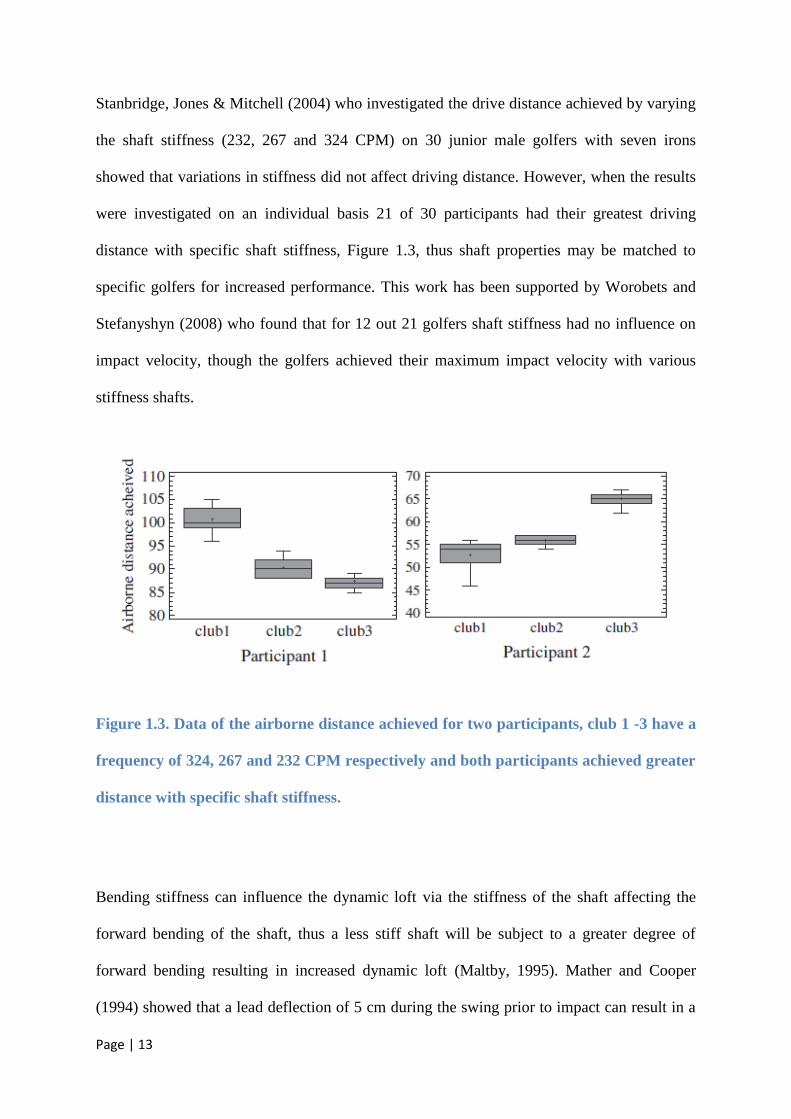
Stanbridge, Jones & Mitchell (2004) who investigated the drive distance achieved by varying
the shaft stiffness (232, 267 and 324 CPM) on 30 junior male golfers with seven irons
showed that variations in stiffness did not affect driving distance. However, when the results
were investigated on an individual basis 21 of 30 participants had their greatest driving
distance with specific shaft stiffness, Figure 1.3, thus shaft properties may be matched to
specific golfers for increased performance. This work has been supported by Worobets and
Stefanyshyn (2008) who found that for 12 out 21 golfers shaft stiffness had no influence on
impact velocity, though the golfers achieved their maximum impact velocity with various
stiffness shafts.
Figure 1.3. Data of the airborne distance achieved for two participants, club 1 -3 have a
frequency of 324, 267 and 232 CPM respectively and both participants achieved greater
distance with specific shaft stiffness.
Bending stiffness can influence the dynamic loft via the stiffness of the shaft affecting the
forward bending of the shaft, thus a less stiff shaft will be subject to a greater degree of
forward bending resulting in increased dynamic loft (Maltby, 1995). Mather and Cooper
(1994) showed that a lead deflection of 5 cm during the swing prior to impact can result in a
Page | 14
5o increase in dynamic loft. Mackenzie (2005) supported the findings of Mather and Cooper
(1994) in shaft stiffness affecting dynamic loft in an optimised three dimensional model, each
increment of 1 cm lead deflection, resulted in a 0.8o increase in dynamic loft. However
further research in the area has shown that alterations in shaft bending stiffness results in
negligible variation of dynamic loft, Tsujiuchi, Koizumi & Tomii (2002) performed a three
subject experimental study and found no influence on dynamic loft angle. Betzler (2010)
performed an experimental test on launch conditions with respect to shaft stiffness on
experienced golfers and found no relationship between shaft stiffness and launch conditions.
The modelling work by Mather and Cooper (1994) and Mackenzie (2005) represents
optimum swing conditions as stated earlier, thus why the experimental research (Tsujiuchi,
Koizumi & Tomii, 2002; Betzler, 2010) showed negligible alterations of dynamic loft with
shaft stiffness as a result of a golfer adapting to a new shaft but not to the degree of an
optimised swing in the proposed models.
1.3.2. Torsional stiffness
The torsional stiffness of a shaft is assessed by clamping the grip end of the shaft, the tip end
of the shaft has a lever arm attached with a known mass placed on the lever arm and the
subsequent twist of the shaft is measured, the torsional stiffness is expressed by Equation 1.1.
Page | 15
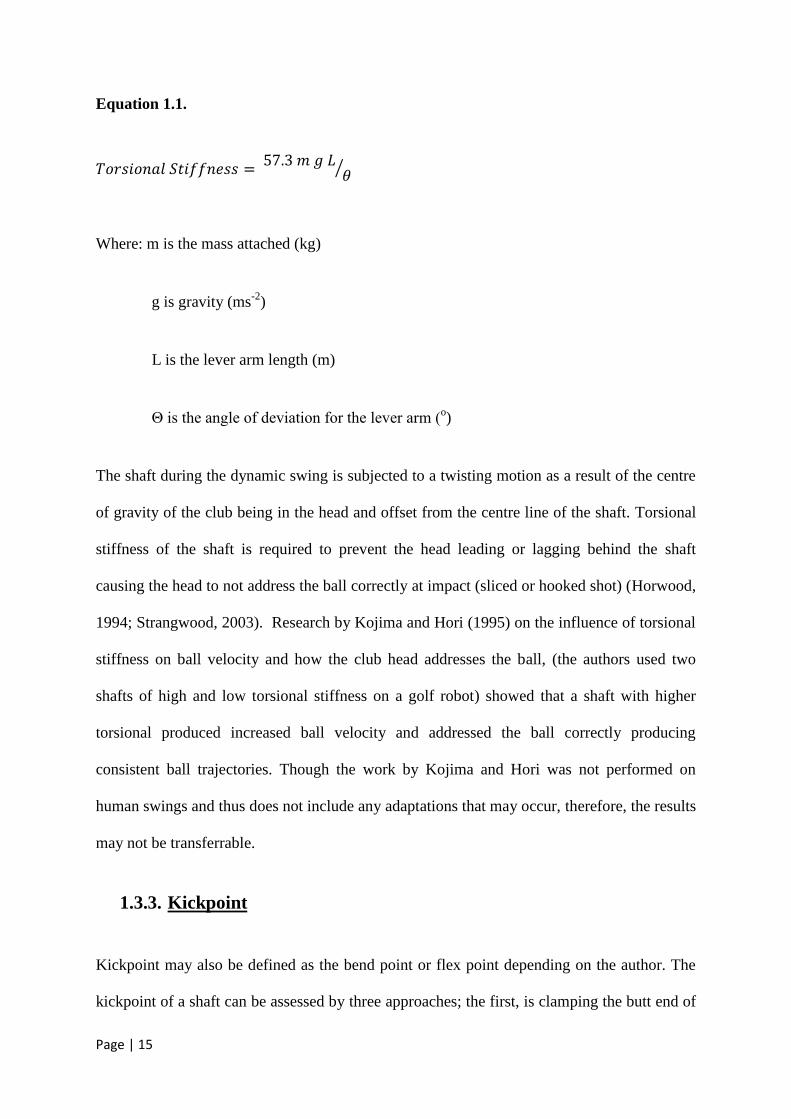
Equation 1.1.
𝑇𝑜𝑟𝑠𝑖𝑜𝑛𝑎𝑙 𝑆𝑡𝑖𝑓𝑓𝑛𝑒𝑠𝑠 = 57.3 𝑚 𝑔 𝐿
𝜃
Where: m is the mass attached (kg)
g is gravity (ms-2
)
L is the lever arm length (m)
Θ is the angle of deviation for the lever arm (o)
The shaft during the dynamic swing is subjected to a twisting motion as a result of the centre
of gravity of the club being in the head and offset from the centre line of the shaft. Torsional
stiffness of the shaft is required to prevent the head leading or lagging behind the shaft
causing the head to not address the ball correctly at impact (sliced or hooked shot) (Horwood,
1994; Strangwood, 2003). Research by Kojima and Hori (1995) on the influence of torsional
stiffness on ball velocity and how the club head addresses the ball, (the authors used two
shafts of high and low torsional stiffness on a golf robot) showed that a shaft with higher
torsional produced increased ball velocity and addressed the ball correctly producing
consistent ball trajectories. Though the work by Kojima and Hori was not performed on
human swings and thus does not include any adaptations that may occur, therefore, the results
may not be transferrable.
1.3.3. Kickpoint
Kickpoint may also be defined as the bend point or flex point depending on the author. The
kickpoint of a shaft can be assessed by three approaches; the first, is clamping the butt end of
Page | 16
the shaft and placing a load on the tip end of the shaft, a imaginary straight line is drawn
between the clamped butt end and tip end and the kickpoint is the position along the shafts
length at the greatest deviation from the straight line, it can also be expressed as the smallest
radius of curvature (Huntley, 2007). The second approach is tested in a similar fashion to that
of the first approach, except the tip is clamped and the butt end of the shaft has a load placed.
The third approach is to test the shaft in a compression test to make the shaft buckle, the
kickpoint is measured in the same fashion as the first approach and expressed as percentage
distance of the length away from the tip end (Cheong, 2005).
Research by Chou & Roberts (1994) found variations in the kickpoint results produced for
the three testing methods outlined above. The first method resulted in kickpoint results at a
greater distance from the tip end of the shaft compared to the other two methods, this is a
result of the bending moment of the shaft being greatest nearer the clamp, thus resulting in
the kickpoint being a greater distance from the tip. The same reasoning can be applied to the
second method resulting in a kickpoint closer to the tip of the shaft. The variation in results
can be attributed to the first and second methods having a section of the shaft clamped (does
not act), however the third method results in the whole shaft acting.
Two shafts tested on a deflection board may have the same bending stiffness though their
kickpoint position will vary; this is a result of the stiffness profile along the length of the
shaft, a shaft can be tip stiff resulting in a high kickpoint or butt stiff resulting in a low
kickpoint (Strangwood, 2003). The stiffness profile of the shafts is a result of the dimensions,
wall thickness and material properties of the shaft (Huntley, 2007). The range of kick points
in the modern day shafts range from 40 – 60 % (Cheong, 2005; Huntley, 2007).
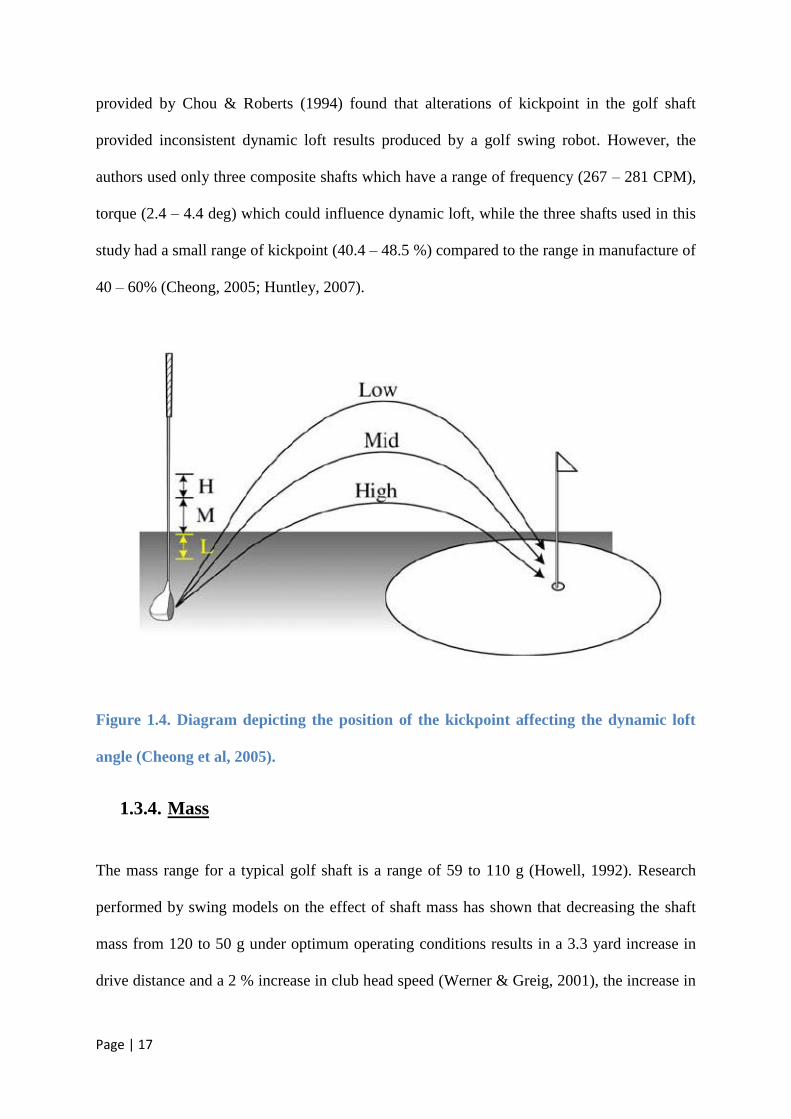
The position of the kickpoint along the length of the shaft varies the dynamic loft of the ball,
a low kickpoint producing decreased dynamic loft (Milne, 1990), Figure 1.4. While research
Page | 17
provided by Chou & Roberts (1994) found that alterations of kickpoint in the golf shaft
provided inconsistent dynamic loft results produced by a golf swing robot. However, the
authors used only three composite shafts which have a range of frequency (267 – 281 CPM),
torque (2.4 – 4.4 deg) which could influence dynamic loft, while the three shafts used in this
study had a small range of kickpoint (40.4 – 48.5 %) compared to the range in manufacture of
40 – 60% (Cheong, 2005; Huntley, 2007).
Figure 1.4. Diagram depicting the position of the kickpoint affecting the dynamic loft
angle (Cheong et al, 2005).
1.3.4. Mass
The mass range for a typical golf shaft is a range of 59 to 110 g (Howell, 1992). Research
performed by swing models on the effect of shaft mass has shown that decreasing the shaft
mass from 120 to 50 g under optimum operating conditions results in a 3.3 yard increase in
drive distance and a 2 % increase in club head speed (Werner & Greig, 2001), the increase in
Page | 18
drive distance originates from an increased impact velocity (Chen, Inoue & Shibata, 2005).
The above authors suggest that the optimum golf shaft should be as light as possible, though
shaft mass provides proprioceptive feedback which is required to produce a consistent swing
(Butler & Winfield, 1995).
1.3.5. Dimensions
The dimensions of a golf club shaft consist of shaft diameter, wall thickness and the degree of
taper (unless parallel sided). Research by Huntley (2007) on the dimensions of golf club
shafts found the diameter of a typical tapered shaft ranged from 8.2 – 8.9 mm at the tip end
and 14.8 -15.7 mm at the butt, however the shafts had a reinforced tip section and grip section
of a constant diameter. The “stiff” and “regular” flex shafts analysed showed greater diameter
at the grip section compared to “ladies” flex as a result of greater mean grip aperture of male
players. The mean wall thickness of the analysed golf club shafts by Huntley (2007)
presented a mean wall thickness of 0.7 – 1.1 mm, though the reinforced tip section of the
shaft had a greater mean wall thickness. The shafts typically showed a constant mean wall
thickness from the butt end to the tip section, in some shafts analysed the mean wall thickness
decreased between the tip and butt sections.
1.3.6. Length
The length of a golf club is limited to 1.219 m (The R&A, 2008), this length is defined as
“the distance from the cap of the grip to the intersection of the shaft centre line with the club
sole resting on the ground”.
The effect of the length of the shaft on the bending stiffness is expressed by Equation 1.2.
The bending stiffness of shafts not tested under a single cantilever length presented
Page | 19
significant overlap of stiffness ranges represented by the manufactures flex rating, though
when the shafts were tested again at a single cantilever length, the majority of shafts
produced a bending stiffness value that fell within their manufactures flex rating (Huntley,
2007; Summitt, 2000).
Equation 1.2.
𝐸𝐼 = 𝐹 𝐿3
3 𝛿
Where: E is the average shaft elastic modulus (N/m2)
I is the average second moment of area (m4)
F is the force applied to the shaft (N)
L is the cantilever length of the shaft (m)
δ is the deflection of the shaft (m)
The influence of shaft length on the dynamic swing of a golfer has been modelled and tested
experimentally. The modelling performed by Chen et al. (2005) showed that varying club
length relative to arm length (1.5 – 2 times) resulted in increased club head speed prior to
impact. Experimental testing on players of varying ability using club lengths ranging from 46
– 52” found that increasing the club length produced increased ball velocity (Wallace, Otto &
Nevill, 2007). A model by Werner and Greig (2001) on the influence of shaft length stated
that the optimum shaft length would be 1.27 m for increased club head velocity while
maintaining accuracy from the shot.
Page | 20
1.4. Manufacturing routes of golf club shafts
1.4.1. Composite Materials and their properties
Composite shafts are generally made from either CFRP (carbon fibre reinforced polymer) or
GFRP (glass fibre reinforced polymer) and their production methods will be explain in the
latter section. Composite materials are chosen for driver shafts compared to metallic alloys as
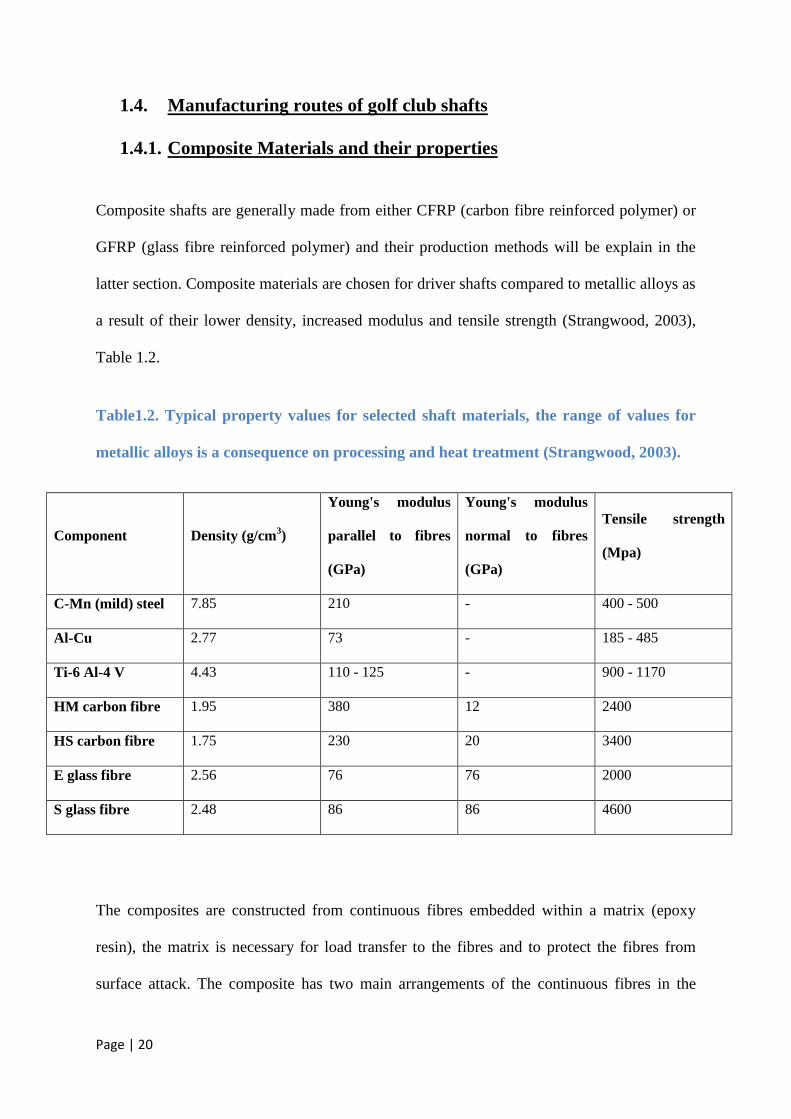
a result of their lower density, increased modulus and tensile strength (Strangwood, 2003),
Table 1.2.
Table1.2. Typical property values for selected shaft materials, the range of values for
metallic alloys is a consequence on processing and heat treatment (Strangwood, 2003).
Component Density (g/cm3)
Young's modulus
parallel to fibres
(GPa)
Young's modulus
normal to fibres
(GPa)
Tensile strength
(Mpa)
C-Mn (mild) steel 7.85 210 - 400 - 500
Al-Cu 2.77 73 - 185 - 485
Ti-6 Al-4 V 4.43 110 - 125 - 900 - 1170
HM carbon fibre 1.95 380 12 2400
HS carbon fibre 1.75 230 20 3400
E glass fibre 2.56 76 76 2000
S glass fibre 2.48 86 86 4600
The composites are constructed from continuous fibres embedded within a matrix (epoxy
resin), the matrix is necessary for load transfer to the fibres and to protect the fibres from
surface attack. The composite has two main arrangements of the continuous fibres in the

Page | 21
matrix, namely unidirectional (fibres run parallel to one another) and two - dimensional
weave / twill (fibres woven at 90o in bundles to one another). The unidirectional fibre
composite has anisotropic properties in that the modulus parallel to the fibres is based on the
volume fraction of fibres to matrix and is high, compared to a low modulus value at a right
angle to fibre direction (Hull and Clyne, 1996).
The majority of composite shafts are manufactured by sheet lamination and use unidirectional
pre-preg. plies, with several plies of composite used to produce the shaft. The plies will have
various orientations relative to the longitudinal axis of the shaft to give certain mechanical
properties. Plies at an orientation of 00 to the longitudinal axis provide bending stiffness, plies
at an orientation of 45o to will provide the shaft with torsional stiffness and 90
o plies prevent
delamination of shaft occurring. The process allows specific mechanical properties for
individual shafts to be tailored to the manufacture’s demands (Strangwood, 2003; Cheong,
2005).
The stacking sequence of the lamina in the design of the laminate for the specific mechanical
requirements must be both “balanced” and “symmetric" in design. This is achieved by off-
axis orientation lamina in the laminate are “balanced” by a lamina of negative orientation to
the same magnitude (35o
, -35o). The “symmetric” design is achieved by the lamina lay up of
the laminate being symmetric about the mid-plane of the laminate (00, 45
o, 90
o, -90
o, -45
o,
00). These design criteria are used in order to balance the residual stresses in the laminate
upon curing to retain the shape. However, in certain design aspects having an unbalanced
laminate may be beneficial, Figure 1.6, (Hull and Clyne, 1996).
Page | 22
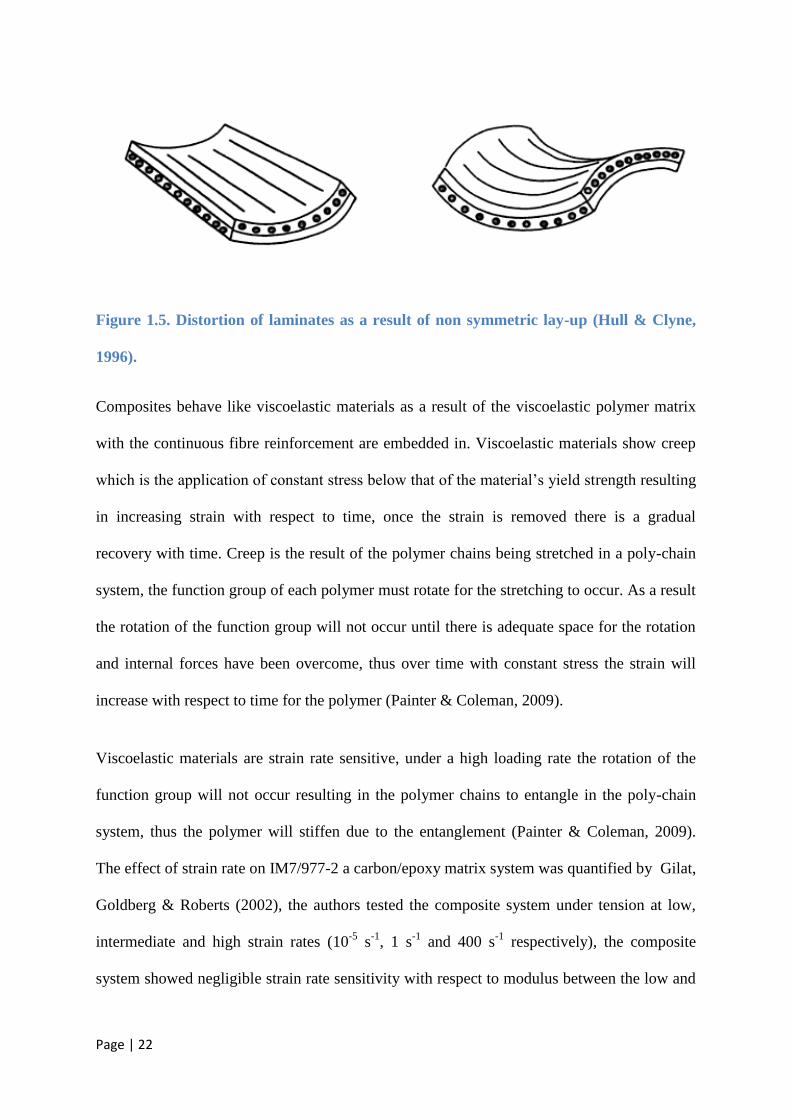
Figure 1.5. Distortion of laminates as a result of non symmetric lay-up (Hull & Clyne,
1996).
Composites behave like viscoelastic materials as a result of the viscoelastic polymer matrix
with the continuous fibre reinforcement are embedded in. Viscoelastic materials show creep
which is the application of constant stress below that of the material’s yield strength resulting
in increasing strain with respect to time, once the strain is removed there is a gradual
recovery with time. Creep is the result of the polymer chains being stretched in a poly-chain
system, the function group of each polymer must rotate for the stretching to occur. As a result
the rotation of the function group will not occur until there is adequate space for the rotation
and internal forces have been overcome, thus over time with constant stress the strain will
increase with respect to time for the polymer (Painter & Coleman, 2009).
Viscoelastic materials are strain rate sensitive, under a high loading rate the rotation of the
function group will not occur resulting in the polymer chains to entangle in the poly-chain
system, thus the polymer will stiffen due to the entanglement (Painter & Coleman, 2009).
The effect of strain rate on IM7/977-2 a carbon/epoxy matrix system was quantified by Gilat,
Goldberg & Roberts (2002), the authors tested the composite system under tension at low,
intermediate and high strain rates (10-5
s-1
, 1 s-1
and 400 s-1
respectively), the composite
system showed negligible strain rate sensitivity with respect to modulus between the low and
Page | 23
intermediate conditions, though a reported 250 % modulus increase between the intermediate
and high strain rate conditions.
The performance of a shaft is controlled by the dynamic properties of the shaft, though the
shafts are characterised by their static properties (simple bending test). Research by Betzler et
al (2011) used a range of strain rates (0.01 – 2 s-1
) on CFRP panels found that for the strain
rates in a dynamic swing (< 0.1 s-1
) no significant increase in dynamic stiffness occurs,
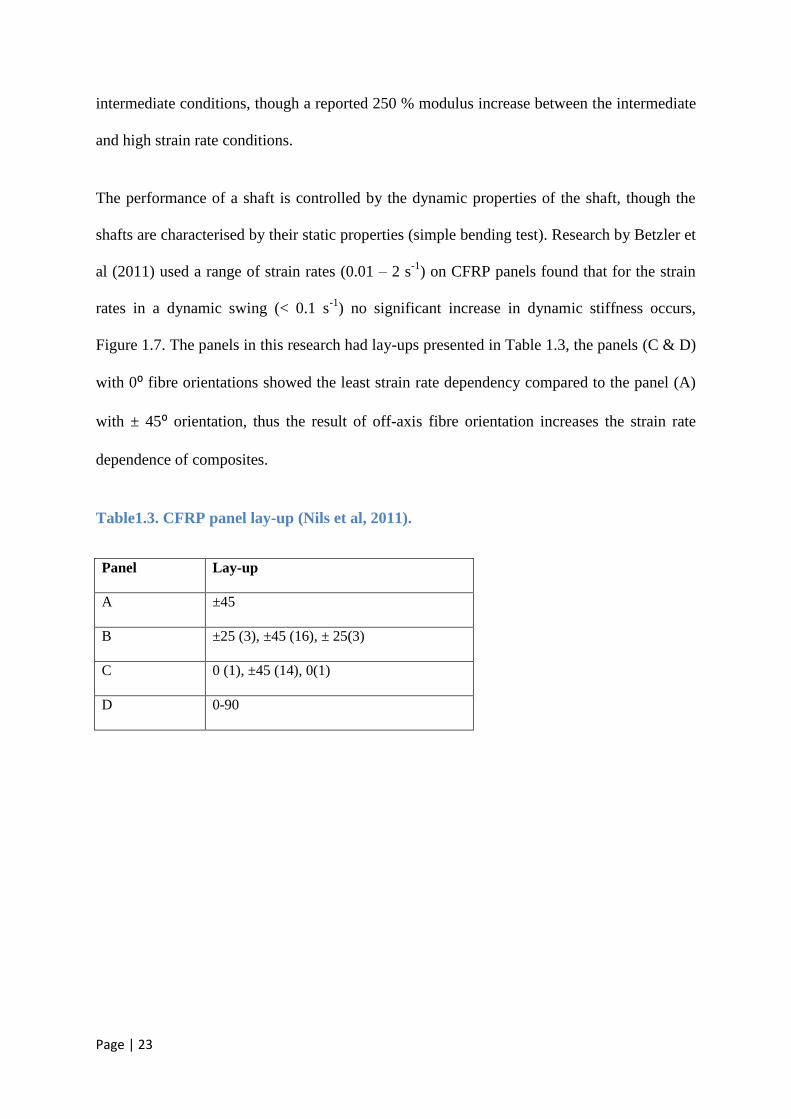
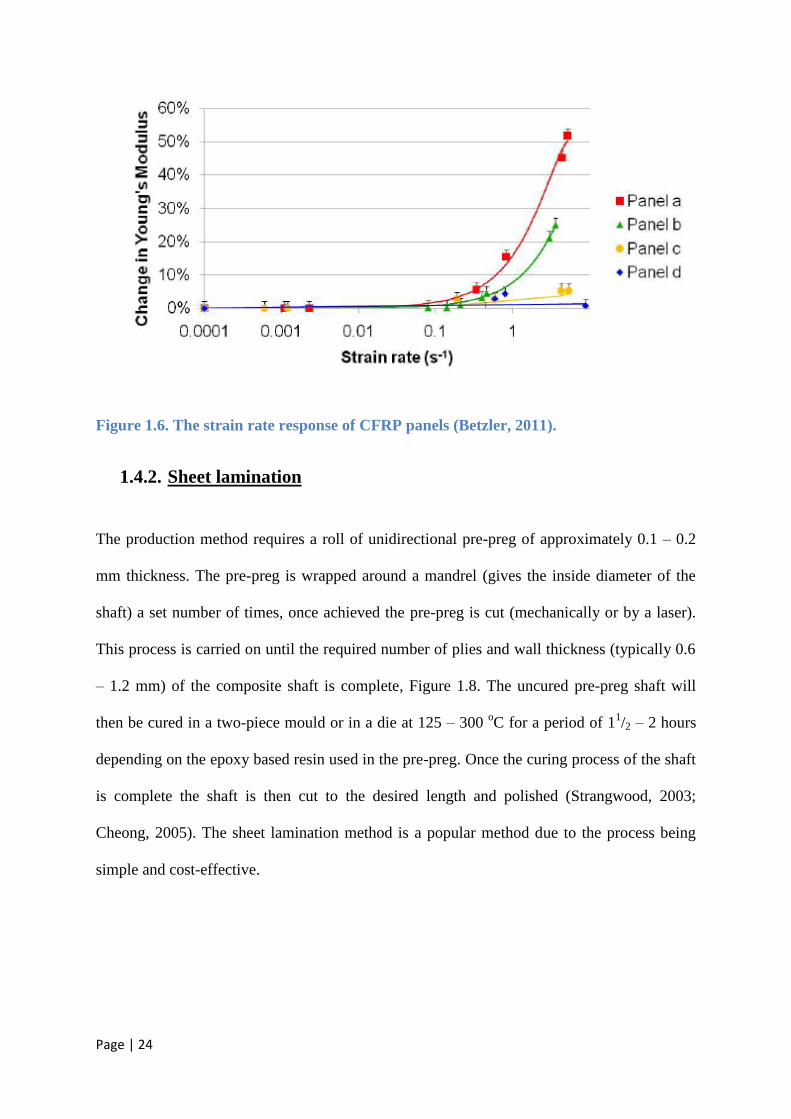
Figure 1.7. The panels in this research had lay-ups presented in Table 1.3, the panels (C & D)
with 0⁰ fibre orientations showed the least strain rate dependency compared to the panel (A)
with ± 45⁰ orientation, thus the result of off-axis fibre orientation increases the strain rate
dependence of composites.
Table1.3. CFRP panel lay-up (Nils et al, 2011).
Panel Lay-up
A ±45
B ±25 (3), ±45 (16), ± 25(3)
C 0 (1), ±45 (14), 0(1)
D 0-90
Page | 24
Figure 1.6. The strain rate response of CFRP panels (Betzler, 2011).
1.4.2. Sheet lamination
The production method requires a roll of unidirectional pre-preg of approximately 0.1 – 0.2
mm thickness. The pre-preg is wrapped around a mandrel (gives the inside diameter of the
shaft) a set number of times, once achieved the pre-preg is cut (mechanically or by a laser).
This process is carried on until the required number of plies and wall thickness (typically 0.6
– 1.2 mm) of the composite shaft is complete, Figure 1.8. The uncured pre-preg shaft will
then be cured in a two-piece mould or in a die at 125 – 300 oC for a period of 1
1/2 – 2 hours
depending on the epoxy based resin used in the pre-preg. Once the curing process of the shaft
is complete the shaft is then cut to the desired length and polished (Strangwood, 2003;
Cheong, 2005). The sheet lamination method is a popular method due to the process being
simple and cost-effective.
Page | 25
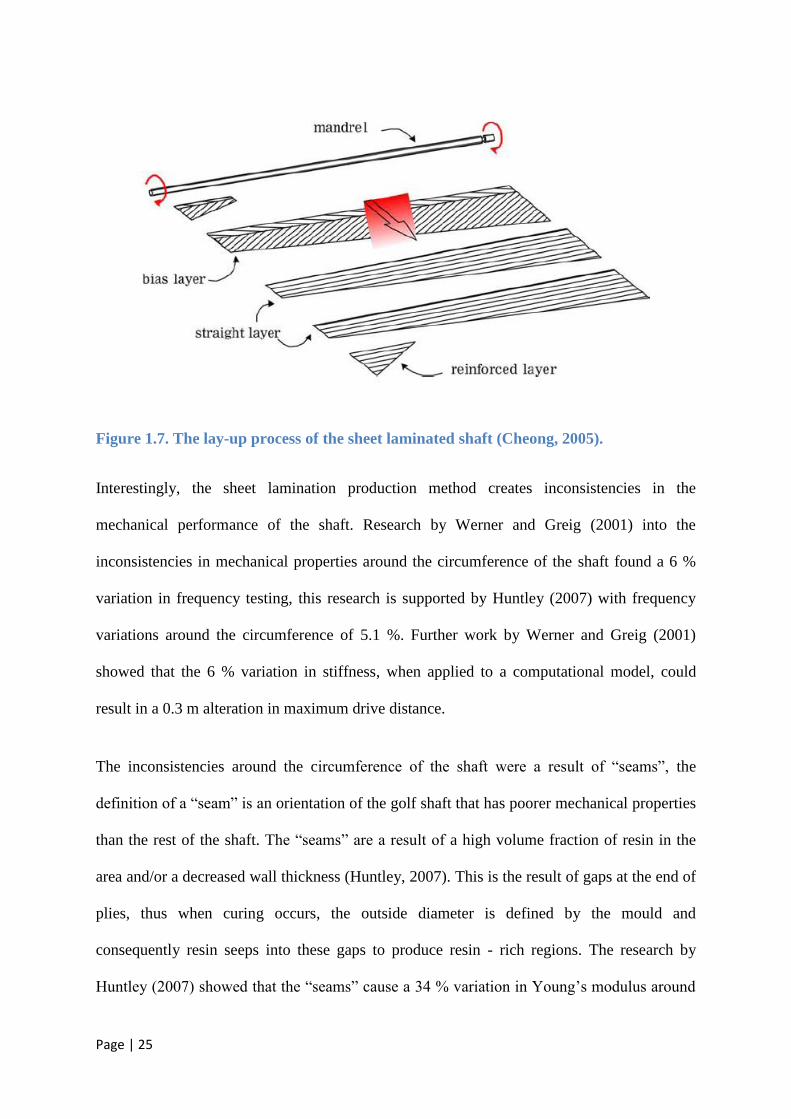
Figure 1.7. The lay-up process of the sheet laminated shaft (Cheong, 2005).
Interestingly, the sheet lamination production method creates inconsistencies in the
mechanical performance of the shaft. Research by Werner and Greig (2001) into the
inconsistencies in mechanical properties around the circumference of the shaft found a 6 %
variation in frequency testing, this research is supported by Huntley (2007) with frequency
variations around the circumference of 5.1 %. Further work by Werner and Greig (2001)
showed that the 6 % variation in stiffness, when applied to a computational model, could
result in a 0.3 m alteration in maximum drive distance.
The inconsistencies around the circumference of the shaft were a result of “seams”, the
definition of a “seam” is an orientation of the golf shaft that has poorer mechanical properties
than the rest of the shaft. The “seams” are a result of a high volume fraction of resin in the
area and/or a decreased wall thickness (Huntley, 2007). This is the result of gaps at the end of
plies, thus when curing occurs, the outside diameter is defined by the mould and
consequently resin seeps into these gaps to produce resin - rich regions. The research by
Huntley (2007) showed that the “seams” cause a 34 % variation in Young’s modulus around
Page | 26
the circumference of the shaft, though due to geometry constraints of the thickness the
specimens did not meet the ASTM D790-92 standards. ). Research by Huntley et al. (2006)
found that the static stiffness values were similar to the dynamic stiffness values for sheet
laminated shafts over a range of strain rates (0.03 – 0.065 s-1
) and the presence of seams
(orientation of the golf shaft that has poorer mechanical properties than the rest of the shaft)
had no influence of the dynamic stiffness values as seen in the static tests
1.4.3. Filament winding
The filament winding method is a manufacturing method that does not produce “seams” as
seen in the sheet lamination method. The method requires use of a reel of single or bundled
fibre(s) which is known as a filament, the filament is removed from the reel and passed
through an uncured resin bath (impregnates the fibre(s)). The filament is then wound around
the mandrel and along its length, until the dimensions and properties of the shaft are produced
(Matthews, 1994). The shaft is cured in a similar fashion to that of the sheet lamination
method by a two-piece mould or forced into a die under the parameters necessary for the
epoxy resin to cure, before being cut to length and polished.
Though the filament winding process has no “seam” there are still inconsistencies around the
circumference of the shaft, these inconsistencies are a result of resin volume fraction and wall
thickness due to the lack of control of resin content for the filament (Matthews, 1994). The
filament winding process has the ability to produce a “seamless” shaft and increased
flexibility in the design of the lay-up (Howell, 1992), though commercially the process is not
utilised to the same degree as sheet lamination due to the slow production process, resulting
in greater cost per shaft (Strangwood, 2003). However, the filament wound shafts were strain
rate sensitive and showed increased stiffness in the dynamic testing compared to static
Page | 27
testing, the increased dynamic stiffness is a result of higher resin content (greater viscoelastic
behaviour) of the shaft due to the manufacturing process (Huntley et al, 2006).
1.5. Summary of Literature Review
The literature review has presented that since the introduction of carbon fibre composite golf
shaft in the late 1960's, the shaft's mechanical properties have been analysed by static, quasi-
static and dynamic methods with relation to their fabrication process and influence on a
golfer's swing. Though the kickpoint position of a shaft has been analysed by static methods,
the position of the kickpoint has yet to be characterised by quasi-static and dynamic methods
with relation to the fabrication process.
From the literature the kickpoint position along the length of the golf shaft is the result of the
stiffness profile (Strangwood, 2003) and ranges between 40 - 60 % in commercial golf shafts
(Cheong, 2005; Huntley, 2007). However, this relationship has not been fully quantified with
respect to the material properties and dimensions of a golf shaft.
The variation of the mechanical properties around the circumference of the shaft in specific
orientations of golf shafts manufactured by sheet lamination was the result of "seams"
(Huntley, 2007). The effects of "seams" results in decreased mechanical properties and could
influence the stiffness profile in the "seam" orientation, the influence on the stiffness profile
could change the position of the kickpoint in this specific orientation.

Page | 28
1.6. Aims & Objectives
The aim of this study is to characterise and quantify the construction method of carbon fibre
composite shafts and the subsequent kickpoint position of the shaft. The objectives of this
thesis to support the aim are:
To characterise and quantify the dimensions and material properties of commercially
available shafts.
To characterise the mechanical performance of the commercially available shafts.
To investigate the influence of the manufacturing method on the mechanical
performance of the shafts.
To investigate the relationship between the dimensional and material properties of the
shafts on the subsequent mechanical properties.
Page | 29
2. Method
2.1. Materials & Samples
A range of composite golf shafts from various manufacturers with a range of mechanical
properties were used in this study, Table 6.1. The shafts used represent the range of stiffness
(ladies, regular and stiff), kickpoints (Low, regular and high) and manufacturing methods
(sheet lamination and filament winding) produced by the manufacturers.
Static analysis was performed on all of the shafts for Sections 2.4 - 2.6, this data was
analysed to identify the extremes of shaft data in the terms of bending stiffness and kickpoint
position. The shafts selected were then analysed by quasi-static and microstructure analysis to
characterise the kickpoint position with respect to geometrical and material properties of the
shafts.
2.2. Statistical Analysis
In the following sub-sections of the methodology the golf shafts are tested by static, quasi-
static and microstructural analysis in their manufacturers flex rated groups (ladies, regular
and stiff). An unpaired t-test was utilised to analyse if the geometrical and material properties
of the shafts were significant between the manufacturer's flex ratings, if the p value is < 0.05
then the variation between two of the manufacturer's flex rated shafts was stated to be
significant. Linear regression was used between dependent and explanatory variable to
analyse the variation of the data.

Page | 30
2.3. Dimensional Analysis
All the shafts tested were measured for length, mass, density and taper. The length of each
shaft was measured by a ruler to an accuracy of ± 0.5 mm. The mass was measured by digital
scales to an accuracy of ± 0.1 g. The diameter of the shaft was measured to investigate taper
at 25 mm intervals from the tip by digital callipers to an accuracy of ± 0.01 mm. The density
of each shaft was measured by sectioning a small sample from the shaft and placed in an
Electronic Densimeter ED-120 T to an accuracy of ± 0.1 gcm-3
.
The intra-batch variation analysis for shafts was analysed by Equation 2.1. (Ashby, 1999) and
was utilised to derive the subsequent Equations 2.2., 2.3. and 2.4. for the intra-batch variation
analysis of length, mass and second moment of area respectively.
Equation 2.1.
𝑓 = 3.52
2𝜋
𝐸𝐼
𝑚𝑙3
Where: f is the frequency (Hz)
m is the mass of the shaft (Kg)
l is the cantilever length of the shaft (m)
E is the modulus of the shaft (GPa)
I is the second moment of area of the shaft (m4)

Page | 31
Equation 2.2.
𝑓 ∝ 1
𝐿3
Equation 2.3.
𝑓 ∝ 1
𝑚
Equation 2.4.
𝑓 ∝ 𝐼
1
2.4. Bending stiffness Test
The bending stiffness of a shaft was determined by the use of a deflection board, in which the
shaft is clamped at the grip end and a load (24.5 N) is placed at the tip end of the shaft, Figure
2.1, the deflection of the tip end of the shaft under a given load is measured and is applied to
Equation 2.5.
The bending stiffness of the shafts was analysed at a variable cantilever length (L - 150 mm)
and single cantilever length (800 mm) as a result of previous work by Huntley (2007) and
Summit (2000) presenting more comparable data for shafts analysed at a single cantilever
length.
Page | 32
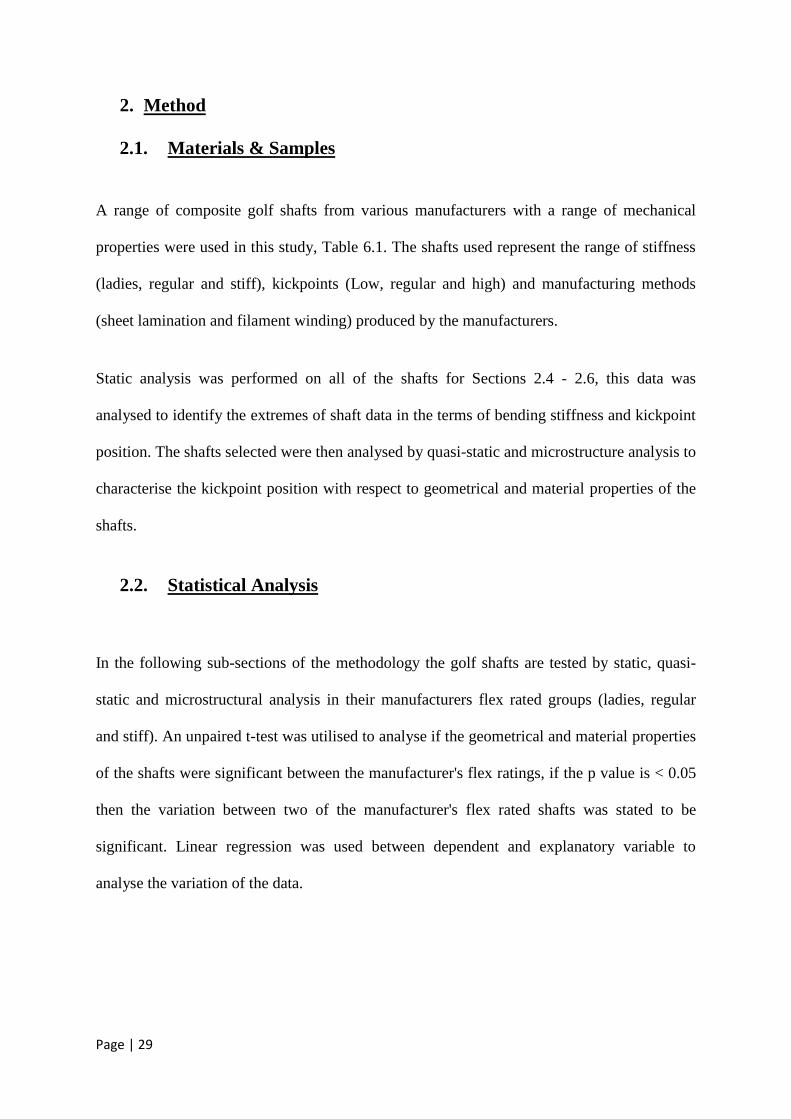
Figure 2.1. Diagram of the deflection board method used for shaft stiffness testing.
Equation 2.5.
𝑆𝑡𝑖𝑓𝑓𝑛𝑒𝑠𝑠 𝑁
𝑚 =
𝐿𝑜𝑎𝑑 (𝑁)
𝐷𝑒𝑓𝑙𝑒𝑐𝑡𝑖𝑜𝑛 (𝑚)
2.5. Kick Point Test
The kick point of a shaft is defined as the point at which the separation of a tip-loaded shaft
from a straight line from clamped region to tip (measured perpendicularly from that straight
line), Figure 2.1, is maximised.
The position of the kick point of a shaft was determined by the use of a deflection board, the
shaft was clamped at the grip end and a given load (24.5 N) placed at the tip end of the shaft

Page | 33
to produce deflection. As previously stated in Section 2.4. this analysis was performed at
single and variable cantilever lengths for more comparable data.
An image of the tip-loaded shaft was taken and coordinates (x and y) were taken along the
length of the deflected shaft from the origin defined as the clamped grip end. A straight line is
drawn between the origin and point of max deflection, the angle between the straight line and
the x axis is defined as “θ” and obtained by Equation 2.6, Figure 2.1.
Equation 2.6.
𝜃 = 𝑡𝑎𝑛−1( 𝑦 𝑚𝑎𝑥
𝑥 𝑚𝑎𝑥)
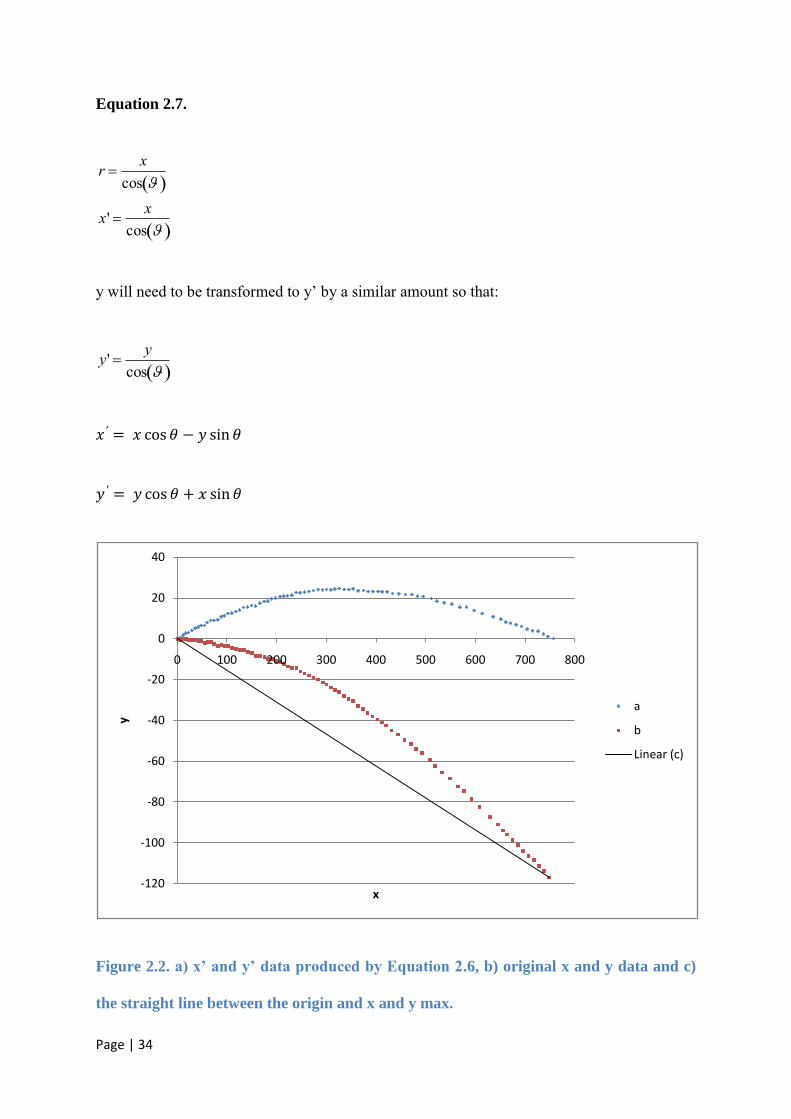
The x and y coordinates along the length of the shaft are then manipulated by Equation 2.7 to
produce x’ and y’ coordinates, this equation results in the x axis becoming the straight line
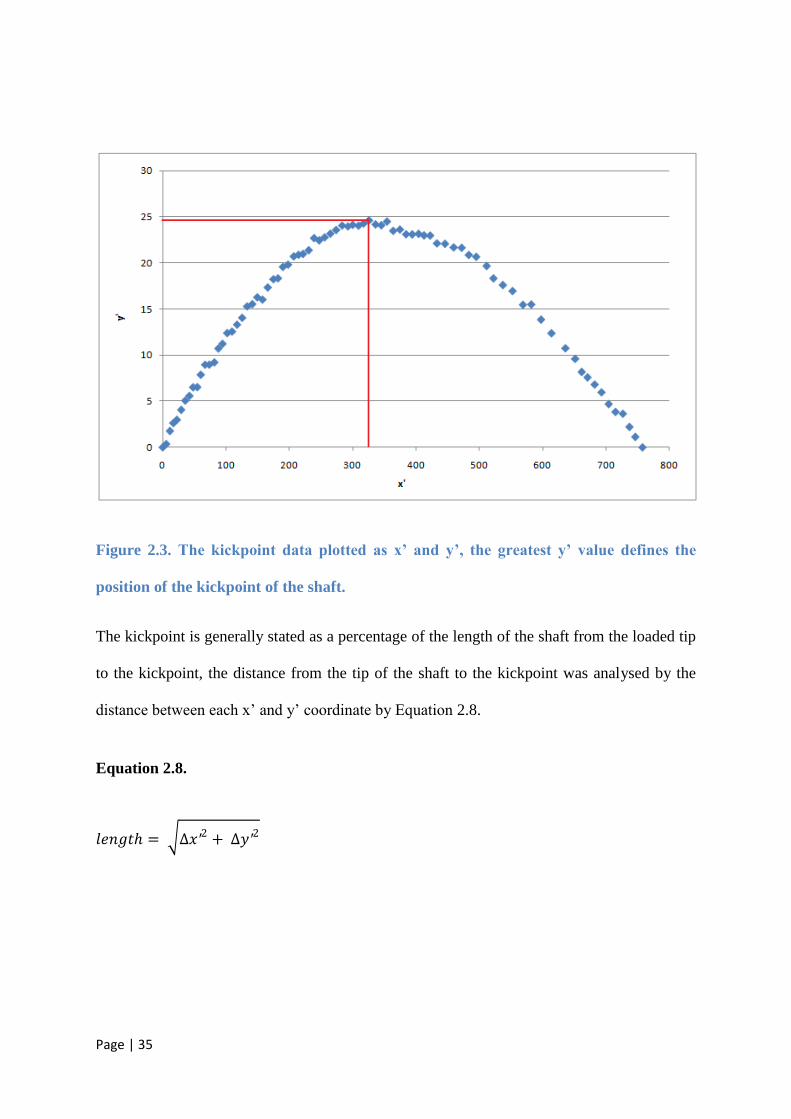
between grip and tip, Figure 2.2. The x’ and y’ data is then plotted and the greatest y’ value is
defines the position of the kickpoint, Figure 2.3.
This is a rigid body rotation so that the x’ coordinate will become the radius of the line from
the origin to (x, y). For the straight line, x refers to the horizontal axis so that:
Page | 34
Equation 2.7.
r x
cos
x' x
cos
y will need to be transformed to y’ by a similar amount so that:
y' y
cos
𝑥 ′ = 𝑥 cos 𝜃 − 𝑦 sin 𝜃
𝑦 ′ = 𝑦 cos 𝜃 + 𝑥 sin 𝜃
Figure 2.2. a) x’ and y’ data produced by Equation 2.6, b) original x and y data and c)
the straight line between the origin and x and y max.
-120
-100
-80
-60
-40
-20
0
20
40
0 100 200 300 400 500 600 700 800
y
x
a
b
Linear (c)
Page | 35
Figure 2.3. The kickpoint data plotted as x’ and y’, the greatest y’ value defines the
position of the kickpoint of the shaft.
The kickpoint is generally stated as a percentage of the length of the shaft from the loaded tip
to the kickpoint, the distance from the tip of the shaft to the kickpoint was analysed by the
distance between each x’ and y’ coordinate by Equation 2.8.
Equation 2.8.
𝑙𝑒𝑛𝑔𝑡 = ∆𝑥′2 + ∆𝑦′
2

Page | 36
2.6. Assumptions for the Influence of Modulus on Bending Stiffness of
Shafts
Assumptions were made utilising Equation 2.9, to produce constant values for second
moment of area and length (design variables) to predict the influence of modulus on shaft
stiffness.
Equation 2.9.
𝑆𝑡𝑖𝑓𝑓𝑛𝑒𝑠𝑠 = 𝐶 𝐸 𝐼𝐿3
Where: C is a constant for a cantilever test
E is the shaft modulus (GPa)
I is the second moment of area of the shaft (m4)
L is the cantilever length of the shaft (m)
The data produced from the bending stiffness deflection board test was performed at various
cantilever lengths with respect to the shaft length, a single cantilever length was used for the
shafts by manipulating Equation 2.9, to produce Equation 2.10 for single cantilever length
stiffness.
Page | 37
Equation 2.10.
𝑆𝑡𝑖𝑓𝑓𝑛𝑒𝑠𝑠2 =(𝑆𝑡𝑖𝑓𝑓𝑛𝑒𝑠𝑠1 𝑥 𝐿1
3)𝐿2
3
Where: Stiffness1 is the shaft stiffness (N/m)
Stiffness2 is the shaft stiffness independent of length (N/m)
L1 is the length of the shaft (m)
L2 is the normalised length of the shaft (m)
The I value for a shaft was produced by Equation 2.11, using the mean diameter of the
tapered shaft for the Ro (Radius Outer), the Ri (Radius inner) value was predicted by using
the grip end wall thickness and assuming a constant wall thickness of the shaft. The
assumption of a constant wall thickness is supported by previous work by Huntley (2007)
presenting constant wall thickness along the length of the shaft, though the wall thickness is
greater at the tip ~ 150 mm as a result of tip stiffening.

Page | 38
Equation 2.11.
𝐼 = 𝜋 4 (𝑅𝑜4 − 𝑅𝑖
4)
Where: I is the second moment of area of the shaft (m4)
Ro is the radius of the shaft (m)
Ri is the radius outer of the shaft (m)
The Shaft stiffness independent of dimensional variables is calculated by Equation 2.12.
Equation 2.12.
𝑆𝑡𝑖𝑓𝑓𝑛𝑒𝑠𝑠3 = 𝑆𝑡𝑖𝑓𝑓𝑛𝑒𝑠𝑠2
(𝐼1
𝐼2 )
Where: Stiffness3 is the shaft stiffness independent of length and second moment of area
(N/m)
Stiffness2 is the shaft stiffness independent of length (N/m)
I1 is the second moment of area for the shaft (m4)
I2 is the normalised second moment of area for the shaft (m4)
Page | 39
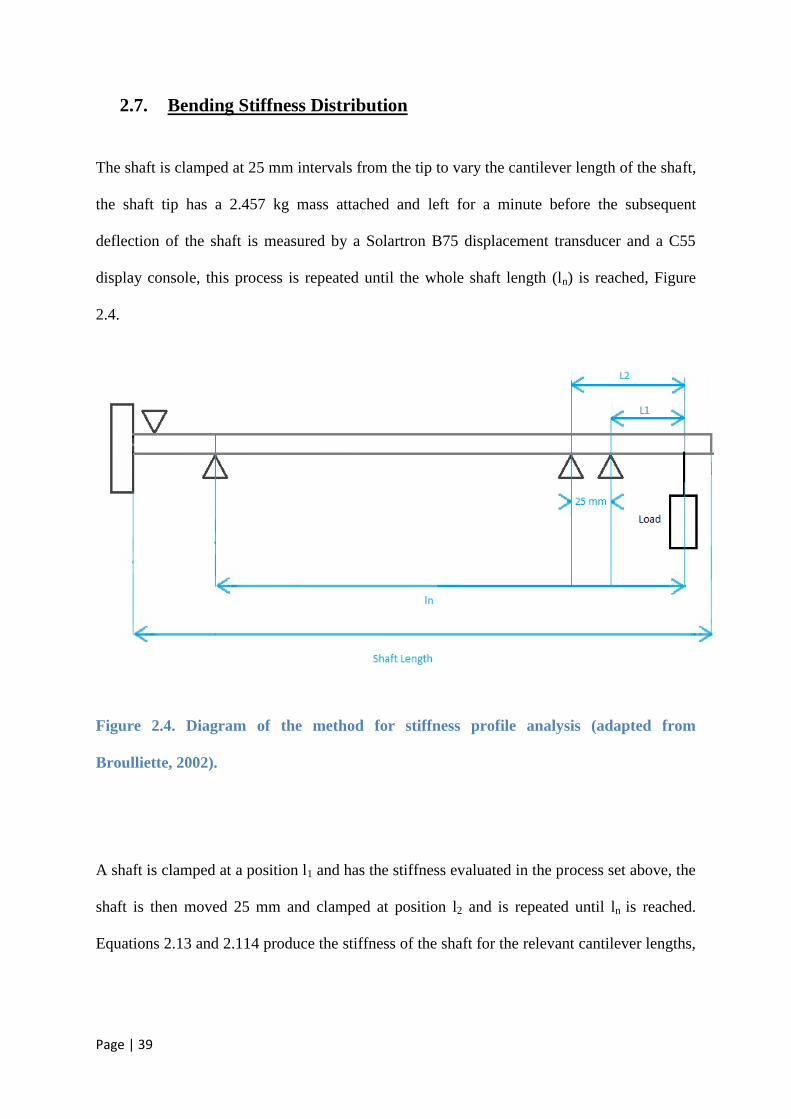
2.7. Bending Stiffness Distribution
The shaft is clamped at 25 mm intervals from the tip to vary the cantilever length of the shaft,
the shaft tip has a 2.457 kg mass attached and left for a minute before the subsequent
deflection of the shaft is measured by a Solartron B75 displacement transducer and a C55
display console, this process is repeated until the whole shaft length (ln) is reached, Figure
2.4.
Figure 2.4. Diagram of the method for stiffness profile analysis (adapted from
Broulliette, 2002).
A shaft is clamped at a position l1 and has the stiffness evaluated in the process set above, the
shaft is then moved 25 mm and clamped at position l2 and is repeated until ln is reached.
Equations 2.13 and 2.114 produce the stiffness of the shaft for the relevant cantilever lengths,

Page | 40
though Equation 2.15 can be derived to produce the stiffness of the section ln-1 – ln
(Broulliette, 2002).
Equation 2.13.
𝐸𝐼1 = 𝐹𝑙1
3
3𝑤 𝑙1
Equation 2.14.
𝐸𝐼1 = 𝐹𝑙2
3
3𝑤 𝑙2
Equation 2.15.
𝐸𝐼𝑛 =
13 𝐹 𝑙𝑛
3 − 𝑙𝑛−13
𝑤 𝑙𝑛 − 13
𝑀𝑛−1𝑙𝑛−12
𝐸𝐼𝑛−1
Where: EI is the flexural rigidity of the shaft, comprising of E the modulus of the shaft (GPa)
and I the second moment of area of the shaft (m4)
M is the bending moment of the shaft (N/m)
w is the deflection of the shaft under the applied force (m)
F is the applied force at the tip of the shaft (N)
L1 is the initial cantilever length where deflection was measured (m)
L2 is the new position along the cantilever length to measure deflection (m).
Page | 41
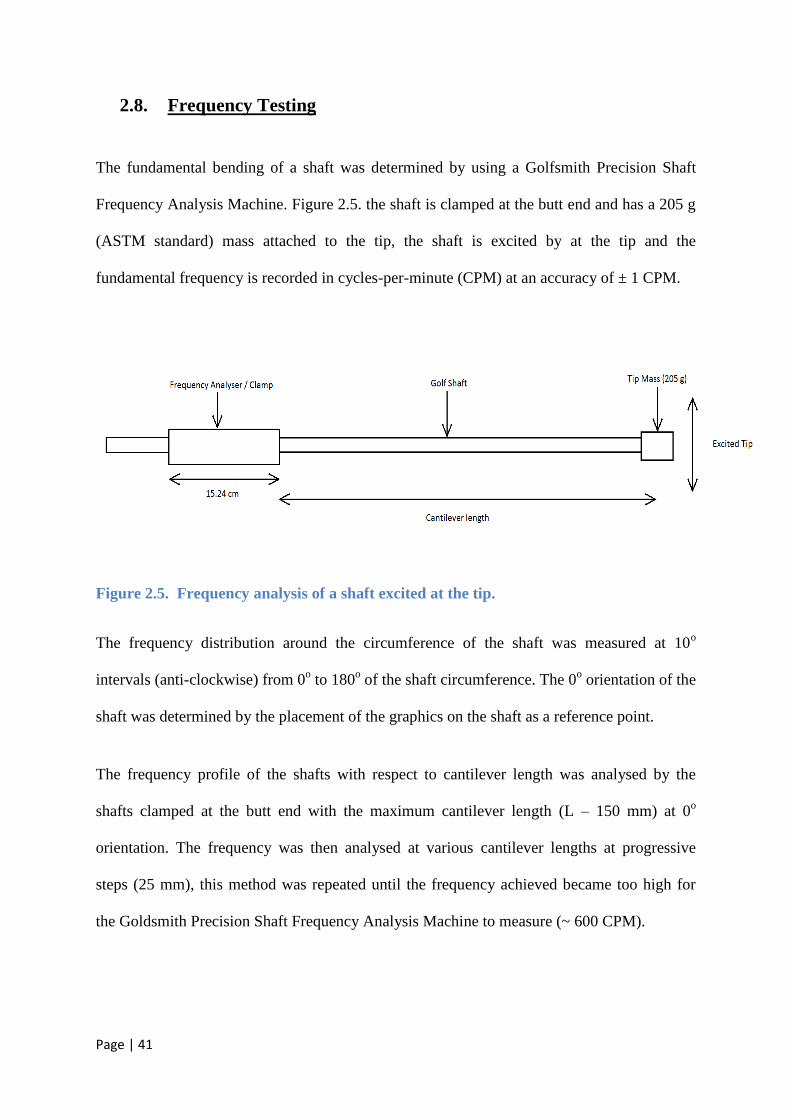
2.8. Frequency Testing
The fundamental bending of a shaft was determined by using a Golfsmith Precision Shaft
Frequency Analysis Machine. Figure 2.5. the shaft is clamped at the butt end and has a 205 g
(ASTM standard) mass attached to the tip, the shaft is excited by at the tip and the
fundamental frequency is recorded in cycles-per-minute (CPM) at an accuracy of ± 1 CPM.
Figure 2.5. Frequency analysis of a shaft excited at the tip.
The frequency distribution around the circumference of the shaft was measured at 10o
intervals (anti-clockwise) from 0o to 180
o of the shaft circumference. The 0
o orientation of the
shaft was determined by the placement of the graphics on the shaft as a reference point.
The frequency profile of the shafts with respect to cantilever length was analysed by the
shafts clamped at the butt end with the maximum cantilever length (L – 150 mm) at 0o
orientation. The frequency was then analysed at various cantilever lengths at progressive
steps (25 mm), this method was repeated until the frequency achieved became too high for
the Goldsmith Precision Shaft Frequency Analysis Machine to measure (~ 600 CPM).

Page | 42
The relationship between the frequency and stiffness was investigated by combining and
rearranging Equation 2.1 and Equation 2.16 to produce Equation 2.17.
Equation 2.16
𝐹
𝑦𝑜=
3
4𝜋
𝐸𝐼
𝑙3
Equation 2.17
𝐹
𝑦𝑜=
6𝜋2
14.08 𝑓2𝑚
Where: F is the force applied at the shaft tip (N)
yo is the displacement of the shaft tip (m)
f is the frequency of the shaft (Hz)
m is the mass of the shaft (Kg)
E is the modulus of the shaft (GPa)
I is the second moment of area of the shaft (m4)
2.9. Static Strain Analysis
Strain analysis for the shafts with the static testing methods was performed by fitting four
Kyowa uniaxial strain gauges (type KFG) to the composite shaft, they were placed at the tip
(100 mm), butt (700 mm) and either side of the kickpoint position of the shaft (maximum
bending curvature) for the assumed location of maximum strain, the strain gauges were
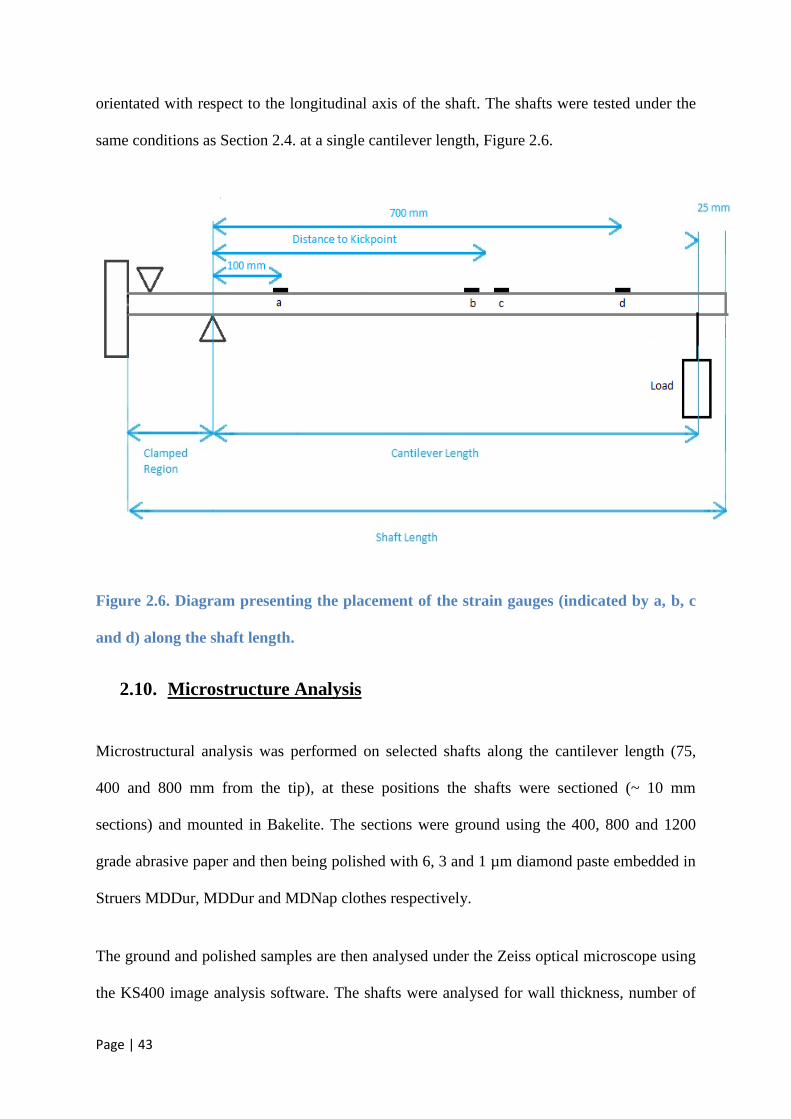
Page | 43
orientated with respect to the longitudinal axis of the shaft. The shafts were tested under the
same conditions as Section 2.4. at a single cantilever length, Figure 2.6.
Figure 2.6. Diagram presenting the placement of the strain gauges (indicated by a, b, c
and d) along the shaft length.
2.10. Microstructure Analysis
Microstructural analysis was performed on selected shafts along the cantilever length (75,
400 and 800 mm from the tip), at these positions the shafts were sectioned (~ 10 mm
sections) and mounted in Bakelite. The sections were ground using the 400, 800 and 1200
grade abrasive paper and then being polished with 6, 3 and 1 µm diamond paste embedded in
Struers MDDur, MDDur and MDNap clothes respectively.
The ground and polished samples are then analysed under the Zeiss optical microscope using
the KS400 image analysis software. The shafts were analysed for wall thickness, number of

Page | 44
plies, thickness of plies, size of fibres, aspect ratio of fibres (fibre angle) and volume fraction
of fibres. The orientation of the fibres “θ” was calculated by using the aspect ratio of the
fibres with Equation 2.18.
Equation 2.18.
𝜃 = 𝑠𝑖𝑛−1𝑙
𝑤
Where: θ is the aspect ratio of the fibres (degrees)
l is the length of the fibres (m)
w is the width of the fibres (m)
Page | 45
3. Results & Discussion
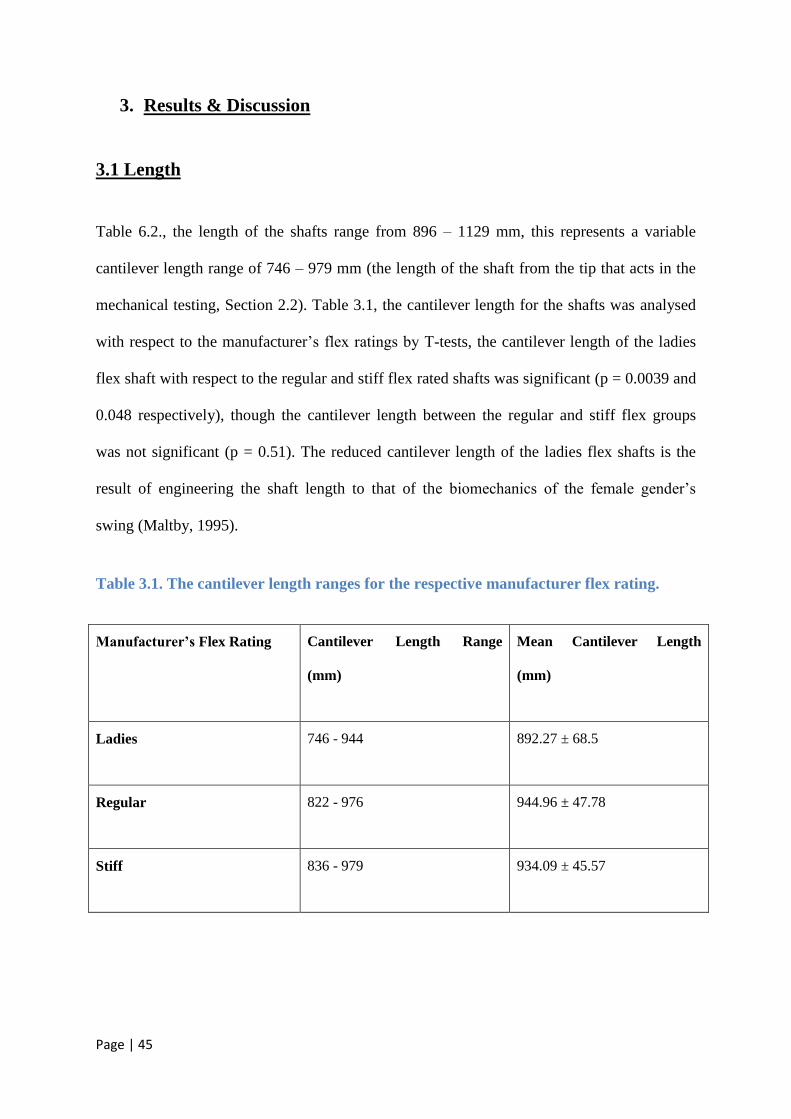
3.1 Length
Table 6.2., the length of the shafts range from 896 – 1129 mm, this represents a variable
cantilever length range of 746 – 979 mm (the length of the shaft from the tip that acts in the
mechanical testing, Section 2.2). Table 3.1, the cantilever length for the shafts was analysed
with respect to the manufacturer’s flex ratings by T-tests, the cantilever length of the ladies
flex shaft with respect to the regular and stiff flex rated shafts was significant (p = 0.0039 and
0.048 respectively), though the cantilever length between the regular and stiff flex groups
was not significant (p = 0.51). The reduced cantilever length of the ladies flex shafts is the
result of engineering the shaft length to that of the biomechanics of the female gender’s
swing (Maltby, 1995).
Table 3.1. The cantilever length ranges for the respective manufacturer flex rating.
Manufacturer’s Flex Rating Cantilever Length Range
(mm)
Mean Cantilever Length
(mm)
Ladies 746 - 944 892.27 ± 68.5
Regular 822 - 976 944.96 ± 47.78
Stiff 836 - 979 934.09 ± 45.57
Page | 46
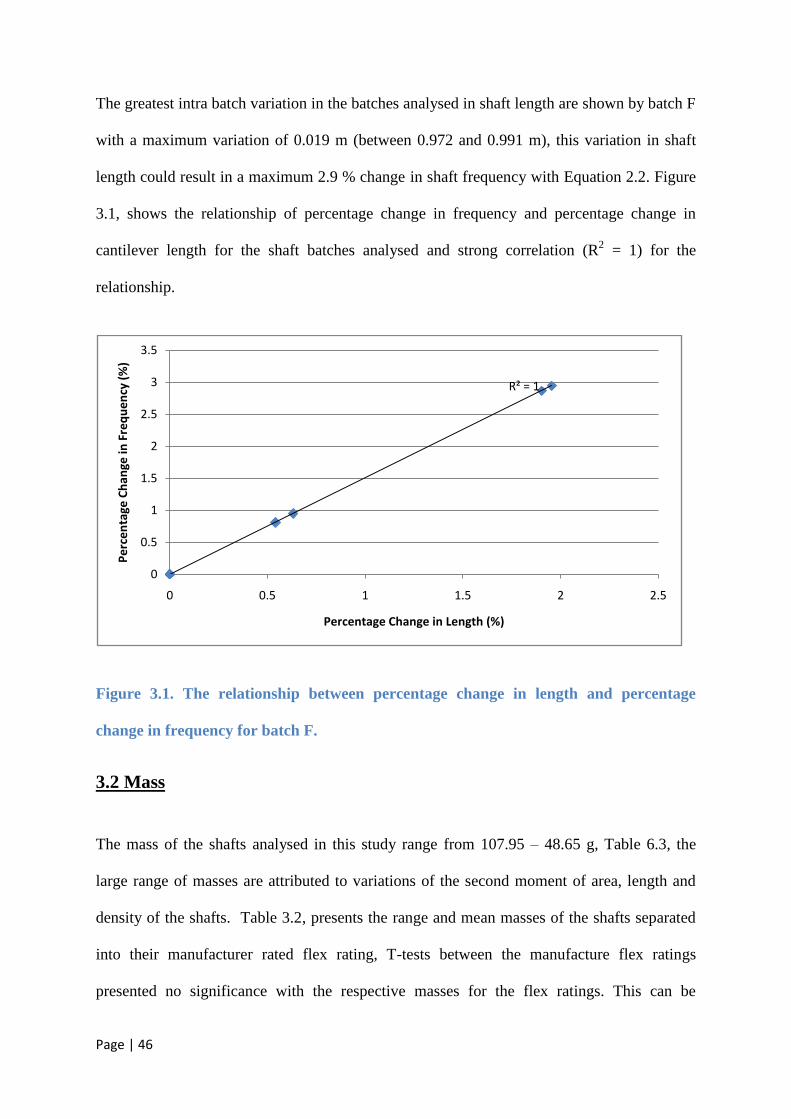
The greatest intra batch variation in the batches analysed in shaft length are shown by batch F
with a maximum variation of 0.019 m (between 0.972 and 0.991 m), this variation in shaft
length could result in a maximum 2.9 % change in shaft frequency with Equation 2.2. Figure
3.1, shows the relationship of percentage change in frequency and percentage change in
cantilever length for the shaft batches analysed and strong correlation (R2 = 1) for the
relationship.
Figure 3.1. The relationship between percentage change in length and percentage
change in frequency for batch F.
3.2 Mass
The mass of the shafts analysed in this study range from 107.95 – 48.65 g, Table 6.3, the
large range of masses are attributed to variations of the second moment of area, length and
density of the shafts. Table 3.2, presents the range and mean masses of the shafts separated
into their manufacturer rated flex rating, T-tests between the manufacture flex ratings
presented no significance with the respective masses for the flex ratings. This can be
R² = 1
0
0.5
1
1.5
2
2.5
3
3.5
0 0.5 1 1.5 2 2.5
Pe
rce
nta
ge C
han
ge in
Fre
qu
en
cy (
%)
Percentage Change in Length (%)
Page | 47
attributed to the density of carbon fibre composites varying between 1.4 and 1.5 g cm-3
(Moss, 1971 and Huntley, 2007) and the engineering of the shaft stiffness via second moment
of area and modulus.
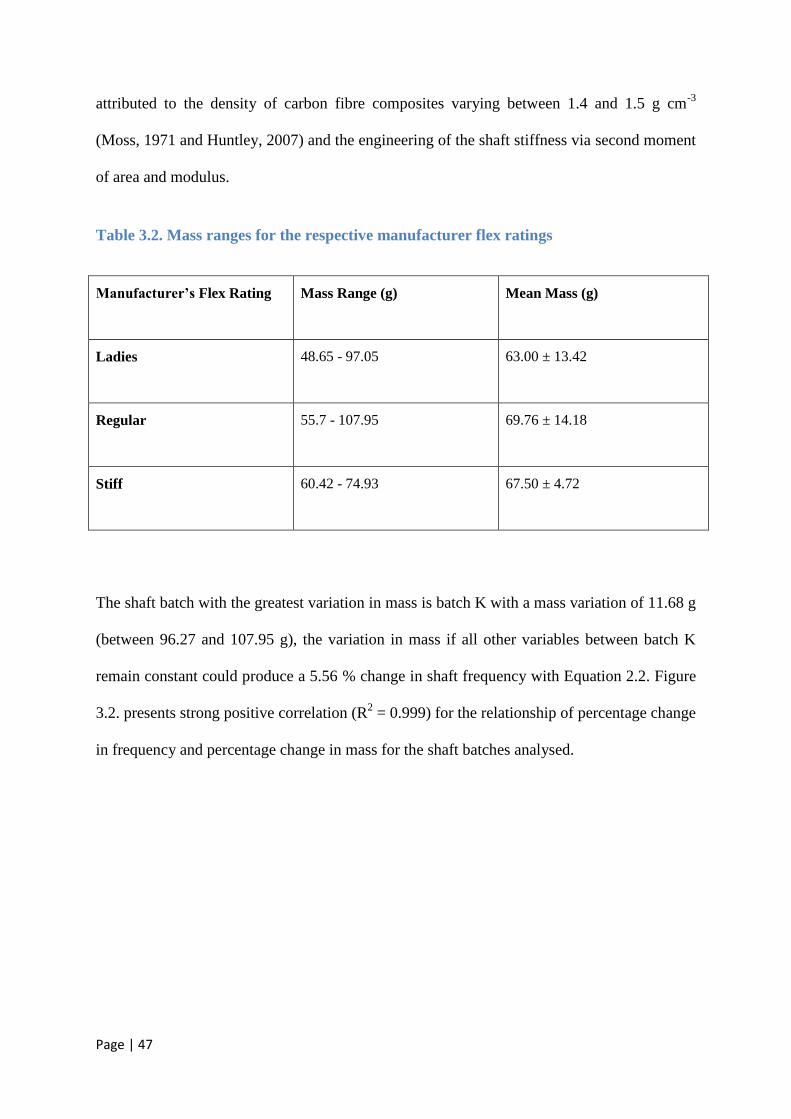
Table 3.2. Mass ranges for the respective manufacturer flex ratings
Manufacturer’s Flex Rating Mass Range (g) Mean Mass (g)
Ladies 48.65 - 97.05 63.00 ± 13.42
Regular 55.7 - 107.95 69.76 ± 14.18
Stiff 60.42 - 74.93 67.50 ± 4.72
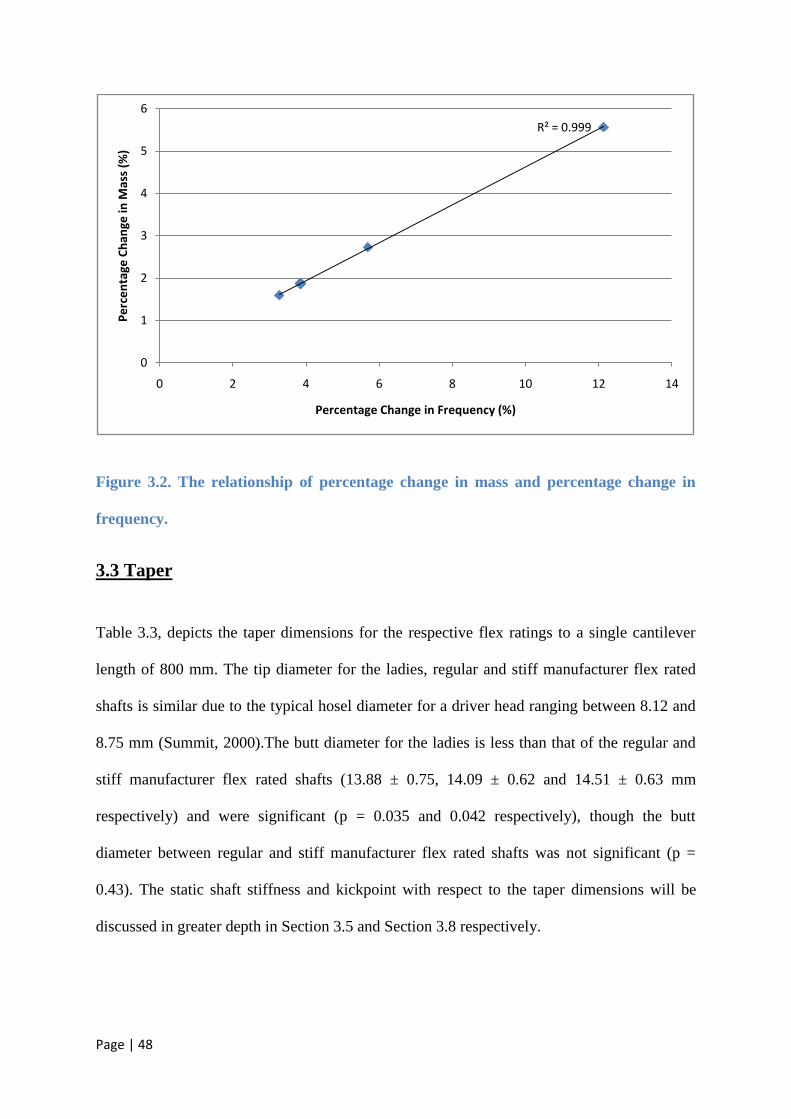
The shaft batch with the greatest variation in mass is batch K with a mass variation of 11.68 g
(between 96.27 and 107.95 g), the variation in mass if all other variables between batch K
remain constant could produce a 5.56 % change in shaft frequency with Equation 2.2. Figure
3.2. presents strong positive correlation (R2 = 0.999) for the relationship of percentage change
in frequency and percentage change in mass for the shaft batches analysed.
Page | 48
Figure 3.2. The relationship of percentage change in mass and percentage change in
frequency.
3.3 Taper
Table 3.3, depicts the taper dimensions for the respective flex ratings to a single cantilever
length of 800 mm. The tip diameter for the ladies, regular and stiff manufacturer flex rated
shafts is similar due to the typical hosel diameter for a driver head ranging between 8.12 and
8.75 mm (Summit, 2000).The butt diameter for the ladies is less than that of the regular and
stiff manufacturer flex rated shafts (13.88 ± 0.75, 14.09 ± 0.62 and 14.51 ± 0.63 mm
respectively) and were significant (p = 0.035 and 0.042 respectively), though the butt
diameter between regular and stiff manufacturer flex rated shafts was not significant (p =
0.43). The static shaft stiffness and kickpoint with respect to the taper dimensions will be
discussed in greater depth in Section 3.5 and Section 3.8 respectively.
R² = 0.999
0
1
2
3
4
5
6
0 2 4 6 8 10 12 14
Pe
rce
nta
ge C
han
ge in
Mas
s (%
)
Percentage Change in Frequency (%)
Page | 49
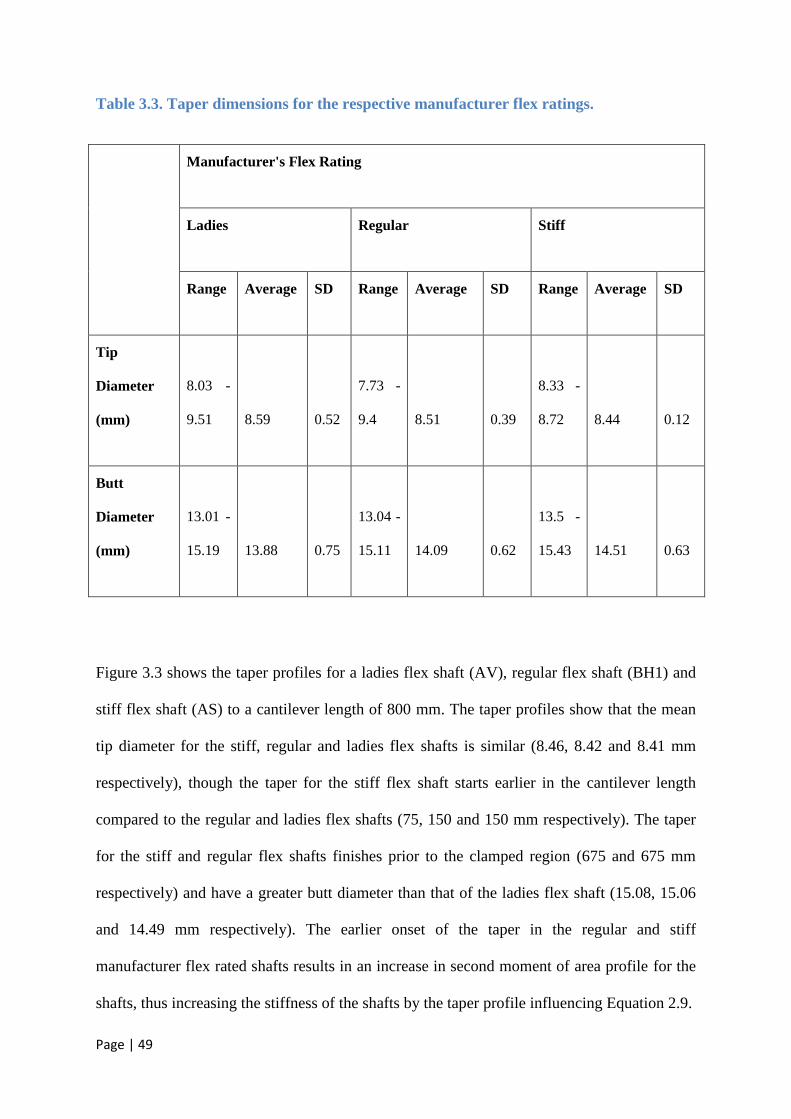
Table 3.3. Taper dimensions for the respective manufacturer flex ratings.
Manufacturer's Flex Rating
Ladies Regular Stiff
Range Average SD Range Average SD Range Average SD
Tip
Diameter
(mm)
8.03 -
9.51 8.59 0.52
7.73 -
9.4 8.51 0.39
8.33 -
8.72 8.44 0.12
Butt
Diameter
(mm)
13.01 -
15.19 13.88 0.75
13.04 -
15.11 14.09 0.62
13.5 -
15.43 14.51 0.63
Figure 3.3 shows the taper profiles for a ladies flex shaft (AV), regular flex shaft (BH1) and
stiff flex shaft (AS) to a cantilever length of 800 mm. The taper profiles show that the mean
tip diameter for the stiff, regular and ladies flex shafts is similar (8.46, 8.42 and 8.41 mm
respectively), though the taper for the stiff flex shaft starts earlier in the cantilever length
compared to the regular and ladies flex shafts (75, 150 and 150 mm respectively). The taper
for the stiff and regular flex shafts finishes prior to the clamped region (675 and 675 mm
respectively) and have a greater butt diameter than that of the ladies flex shaft (15.08, 15.06
and 14.49 mm respectively). The earlier onset of the taper in the regular and stiff
manufacturer flex rated shafts results in an increase in second moment of area profile for the
shafts, thus increasing the stiffness of the shafts by the taper profile influencing Equation 2.9.
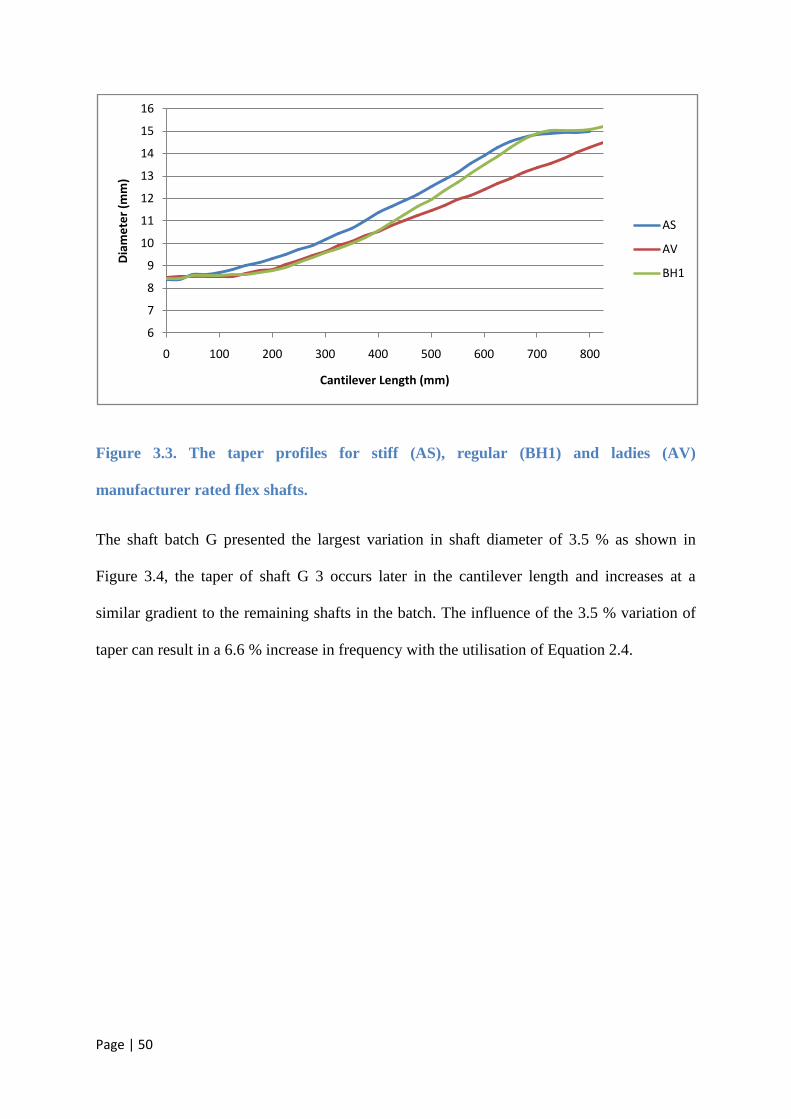
Page | 50
Figure 3.3. The taper profiles for stiff (AS), regular (BH1) and ladies (AV)
manufacturer rated flex shafts.
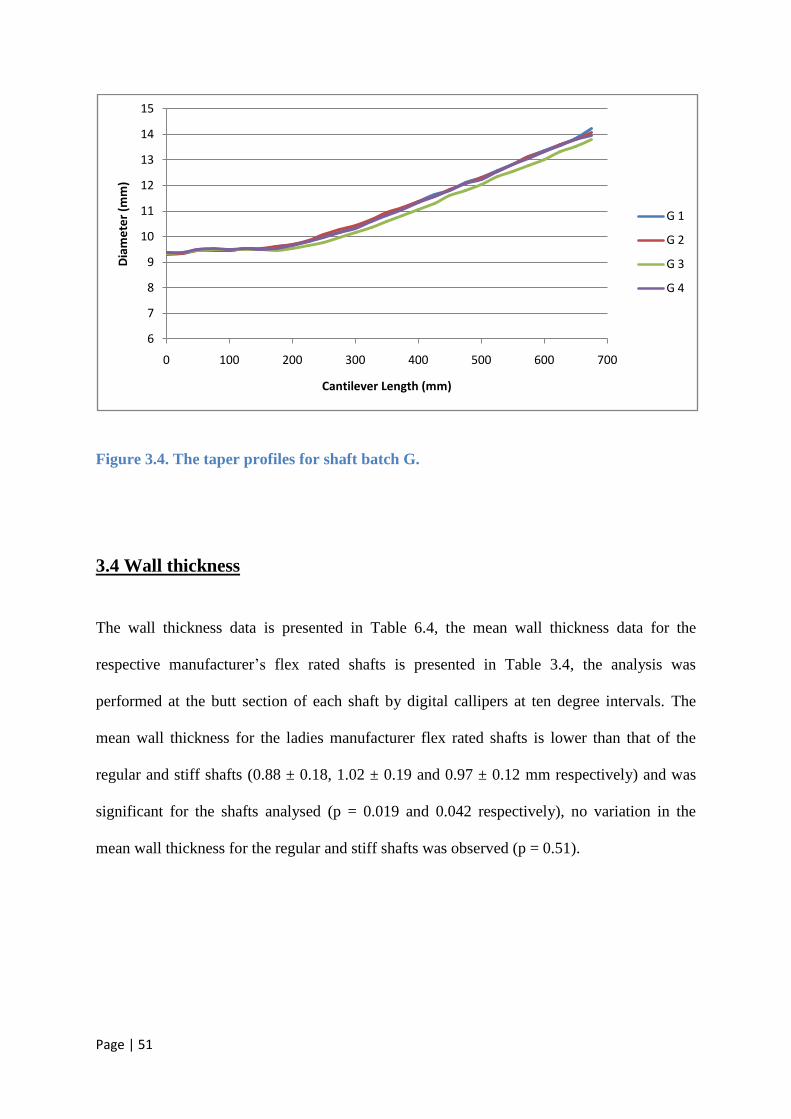
The shaft batch G presented the largest variation in shaft diameter of 3.5 % as shown in
Figure 3.4, the taper of shaft G 3 occurs later in the cantilever length and increases at a
similar gradient to the remaining shafts in the batch. The influence of the 3.5 % variation of
taper can result in a 6.6 % increase in frequency with the utilisation of Equation 2.4.
6
7
8
9
10
11
12
13
14
15
16
0 100 200 300 400 500 600 700 800
Dia
me
ter
(mm
)
Cantilever Length (mm)
AS
AV
BH1
Page | 51
Figure 3.4. The taper profiles for shaft batch G.
3.4 Wall thickness
The wall thickness data is presented in Table 6.4, the mean wall thickness data for the
respective manufacturer’s flex rated shafts is presented in Table 3.4, the analysis was
performed at the butt section of each shaft by digital callipers at ten degree intervals. The
mean wall thickness for the ladies manufacturer flex rated shafts is lower than that of the
regular and stiff shafts (0.88 ± 0.18, 1.02 ± 0.19 and 0.97 ± 0.12 mm respectively) and was
significant for the shafts analysed (p = 0.019 and 0.042 respectively), no variation in the
mean wall thickness for the regular and stiff shafts was observed (p = 0.51).
6
7
8
9
10
11
12
13
14
15
0 100 200 300 400 500 600 700
Dia
me
ter
(mm
)
Cantilever Length (mm)
G 1
G 2
G 3
G 4
Page | 52
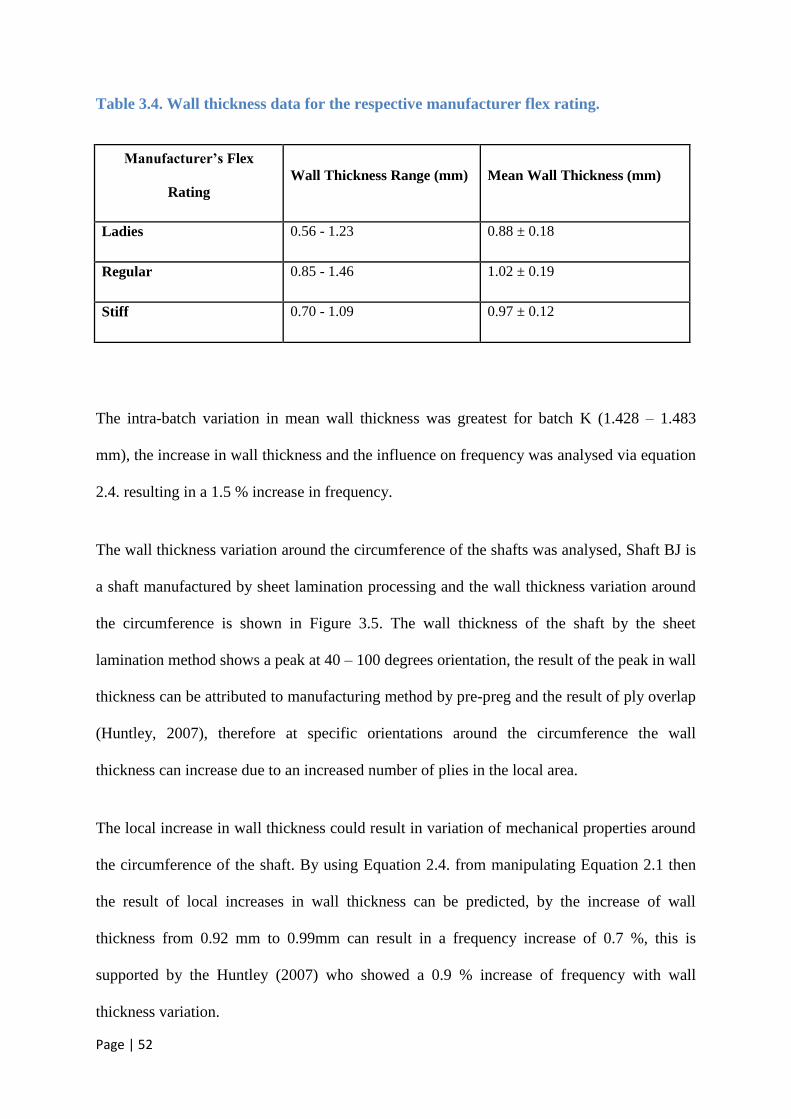
Table 3.4. Wall thickness data for the respective manufacturer flex rating.
Manufacturer’s Flex
Rating
Wall Thickness Range (mm) Mean Wall Thickness (mm)
Ladies 0.56 - 1.23 0.88 ± 0.18
Regular 0.85 - 1.46 1.02 ± 0.19
Stiff 0.70 - 1.09 0.97 ± 0.12
The intra-batch variation in mean wall thickness was greatest for batch K (1.428 – 1.483
mm), the increase in wall thickness and the influence on frequency was analysed via equation
2.4. resulting in a 1.5 % increase in frequency.
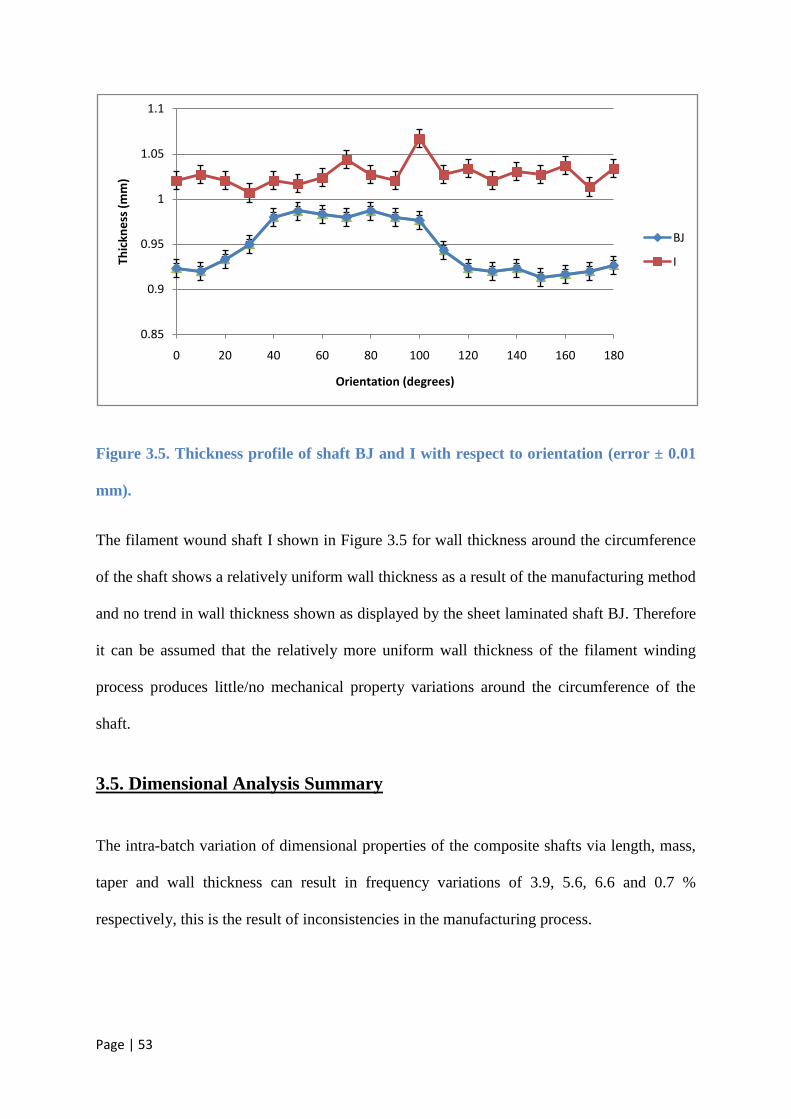
The wall thickness variation around the circumference of the shafts was analysed, Shaft BJ is
a shaft manufactured by sheet lamination processing and the wall thickness variation around
the circumference is shown in Figure 3.5. The wall thickness of the shaft by the sheet
lamination method shows a peak at 40 – 100 degrees orientation, the result of the peak in wall
thickness can be attributed to manufacturing method by pre-preg and the result of ply overlap
(Huntley, 2007), therefore at specific orientations around the circumference the wall
thickness can increase due to an increased number of plies in the local area.
The local increase in wall thickness could result in variation of mechanical properties around
the circumference of the shaft. By using Equation 2.4. from manipulating Equation 2.1 then
the result of local increases in wall thickness can be predicted, by the increase of wall
thickness from 0.92 mm to 0.99mm can result in a frequency increase of 0.7 %, this is
supported by the Huntley (2007) who showed a 0.9 % increase of frequency with wall
thickness variation.
Page | 53
Figure 3.5. Thickness profile of shaft BJ and I with respect to orientation (error ± 0.01
mm).
The filament wound shaft I shown in Figure 3.5 for wall thickness around the circumference
of the shaft shows a relatively uniform wall thickness as a result of the manufacturing method
and no trend in wall thickness shown as displayed by the sheet laminated shaft BJ. Therefore
it can be assumed that the relatively more uniform wall thickness of the filament winding
process produces little/no mechanical property variations around the circumference of the
shaft.
3.5. Dimensional Analysis Summary
The intra-batch variation of dimensional properties of the composite shafts via length, mass,
taper and wall thickness can result in frequency variations of 3.9, 5.6, 6.6 and 0.7 %
respectively, this is the result of inconsistencies in the manufacturing process.
0.85
0.9
0.95
1
1.05
1.1
0 20 40 60 80 100 120 140 160 180
Thic
kne
ss (
mm
)
Orientation (degrees)
BJ
I
Page | 54
The dimensional analysis of the shafts with respect to the manufacturer’s flex rating has
shown that the flex rating between ladies and regular flex shafts is being engineered by the
length, taper and wall thickness (p = 0.0029, 0.035 and 0.019 respectively). However, no
significant variation between the regular and stiff flex shafts was observed.
3.6 Stiffness Analysis
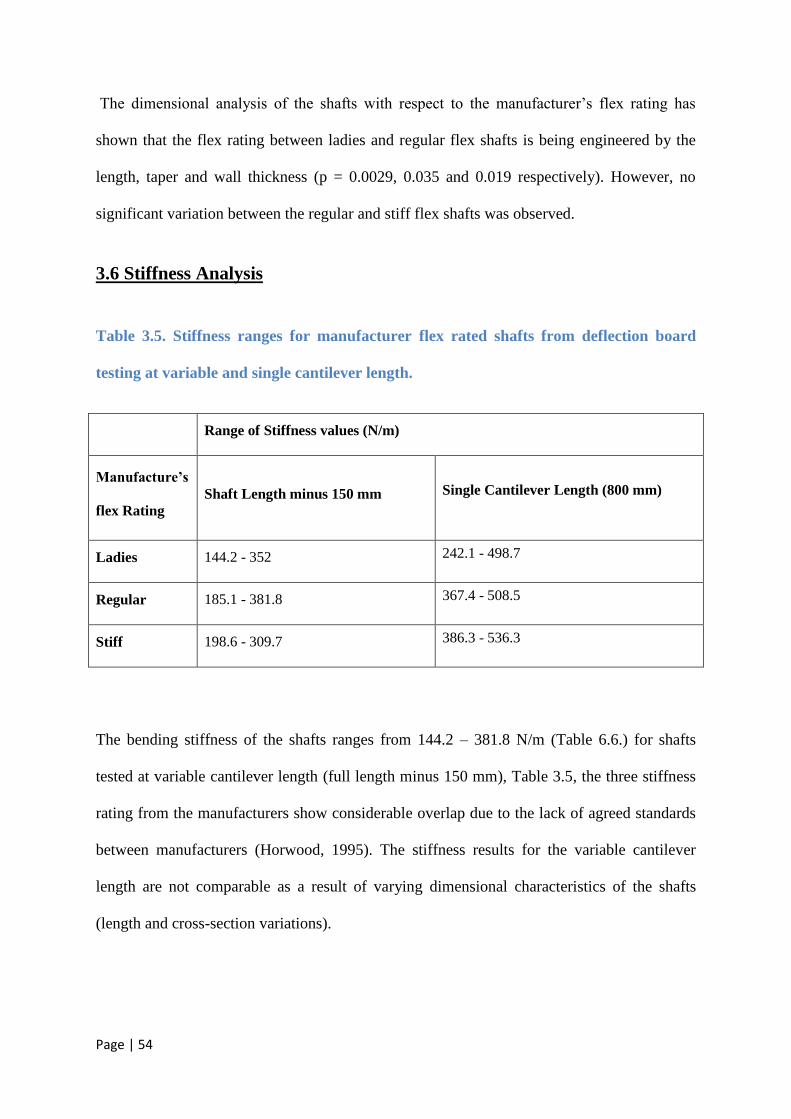
Table 3.5. Stiffness ranges for manufacturer flex rated shafts from deflection board
testing at variable and single cantilever length.
Range of Stiffness values (N/m)
Manufacture’s
flex Rating
Shaft Length minus 150 mm Single Cantilever Length (800 mm)
Ladies 144.2 - 352 242.1 - 498.7
Regular 185.1 - 381.8 367.4 - 508.5
Stiff 198.6 - 309.7 386.3 - 536.3
The bending stiffness of the shafts ranges from 144.2 – 381.8 N/m (Table 6.6.) for shafts
tested at variable cantilever length (full length minus 150 mm), Table 3.5, the three stiffness
rating from the manufacturers show considerable overlap due to the lack of agreed standards
between manufacturers (Horwood, 1995). The stiffness results for the variable cantilever
length are not comparable as a result of varying dimensional characteristics of the shafts
(length and cross-section variations).
Page | 55
The shafts tested at a single cantilever length (800 mm), Table 3.5, present greater shaft
stiffness values for the manufacturer stiffness ratings compared to the variable cantilever
length, this result is expected as the decrease in cantilever length of the shaft results in
increased stiffness, Equation 2.9. The single cantilever results represent more comparable
data, Table 3.5, though the shaft taper alters along the length of the shaft influencing the
stiffness values of the shaft, Table 3.6. The overlap of the stiffness ranges for the
manufacturer stiffness rating, Table 3.5, is supported by previous work by Summitt (2000) at
a single cantilever length of 1.05 m produced deflection value ranges of 0.09 – 0.13 m and
0.11 – 0.15 m for stiff and ladies stiffness manufacturer rated shafts respectively.
The stiffness analysis of the shafts at a single cantilever length in Table 3.6, presents the
mean shaft stiffness increasing with the manufacturer’s flex rating. Pair wise comparison of
the manufacturer’s flex ratings showed statically significant results between the ladies to
regular and ladies to stiff flex (p = 0.0059 and 0.0001 respectively), this result is attributed to
the ladies manufacturer flex rated shaft compared to the regular and stiff having decreased
wall thickness (0.88 ± 0.18, 1.02 ± 0.19 and 0.97 ± 0.12 mm respectively) and taper (13.88 ±
0.75, 14.09 ± 0.62 and 14.51 ± 0.63 mm respectively).
However, the stiffness values for the regular and stiff (231.3 ± 22.1 and 256.3 ± 20.5 N/m
respectively) manufacturer’s flex rated shafts also significantly increased (p = 0.0032) at a
single cantilever length, Table 3.6. Previously in Sections 3.1 – 3.4 no significant
dimensional variables between the regular and stiff manufacturer flex rated shafts would
result in the increased shaft stiffness, thus modulus of the carbon fibre composites would be
influencing the shaft stiffness, Equation 2.9.
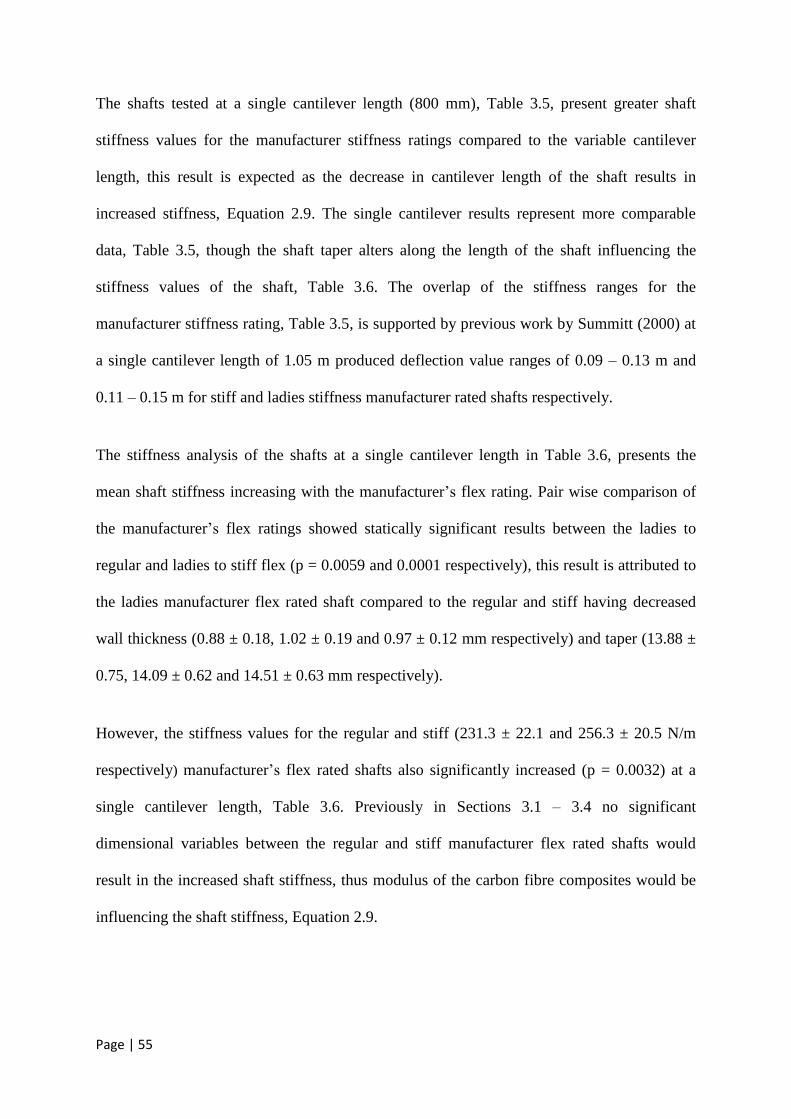
Page | 56
Table 3.6. Mean stiffness values of the shafts for their respective manufacturer flex
rating.
Mean Stiffness values (N/m)
Manufacturer’s
Flex Rating Shaft Length minus 150 mm Single Cantilever Length (800 mm)
Ladies 173.5 ± 36.6 205.9 ± 31.5
Regular 169.3 ± 22.7 231.3 ± 22.1
Stiff 178.3 ± 18.7 256.3 ± 20.5
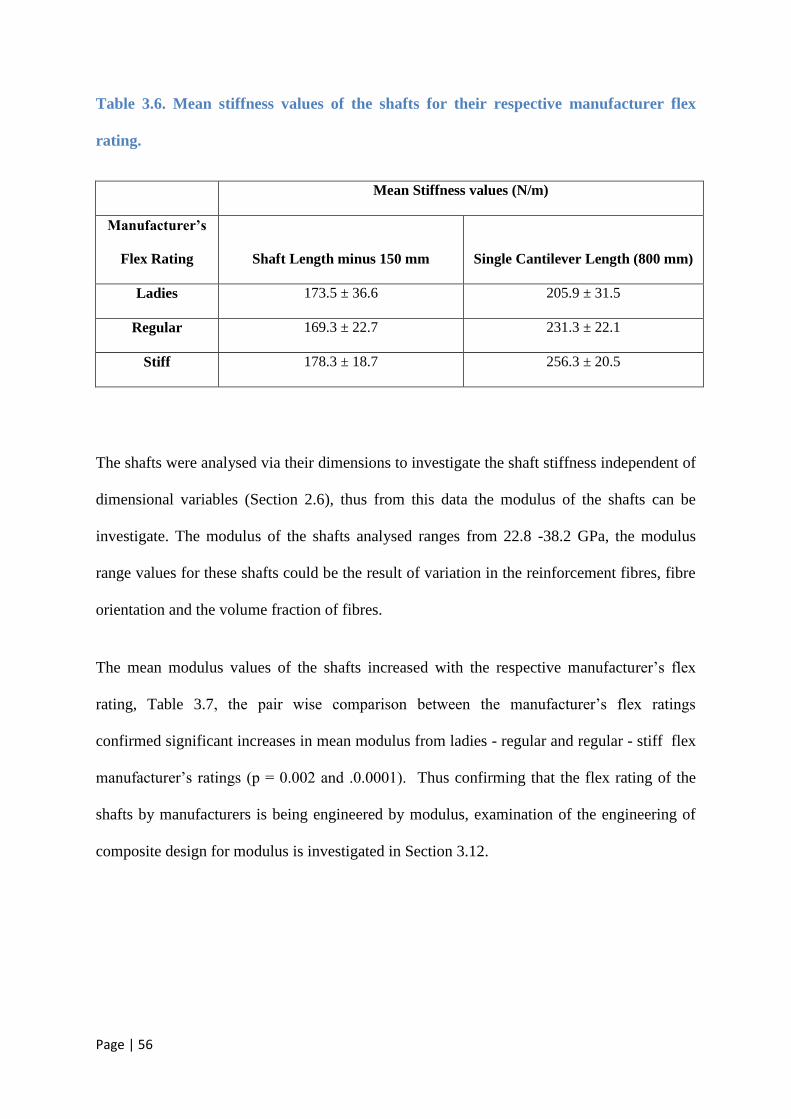
The shafts were analysed via their dimensions to investigate the shaft stiffness independent of
dimensional variables (Section 2.6), thus from this data the modulus of the shafts can be
investigate. The modulus of the shafts analysed ranges from 22.8 -38.2 GPa, the modulus
range values for these shafts could be the result of variation in the reinforcement fibres, fibre
orientation and the volume fraction of fibres.
The mean modulus values of the shafts increased with the respective manufacturer’s flex
rating, Table 3.7, the pair wise comparison between the manufacturer’s flex ratings
confirmed significant increases in mean modulus from ladies - regular and regular - stiff flex
manufacturer’s ratings (p = 0.002 and .0.0001). Thus confirming that the flex rating of the
shafts by manufacturers is being engineered by modulus, examination of the engineering of
composite design for modulus is investigated in Section 3.12.
Page | 57
Table 3.7. Modulus analysis of the shafts from the dimensional data outline in Section
2.4.
Manufacturer’s Flex Rating Modulus Range (GPa) Mean Modulus (GPa)
Ladies 22.8 – 32.8 28.8 ± 3.14
Regular 26.2 – 35.4 31.7 ± 3.73
Stiff 32.3 – 38.2 35.7 ± 2.52
3.7. Kickpoint Analysis
The accuracy of the testing method for Kickpoint was performed on an aluminium tube of
constant modulus and second moment of area (detailed in section 3.10). Research by
Strangwood (2003) stipulated that the kickpoint position is dependent on the stiffness profile
of the shaft, thus a shaft with a linear stiffness profile would have a kickpoint position of 50
% of the cantilever length. The data from the experiment for the aluminium shaft showed a
kickpoint of 49.2 ± 0.64 %, the decreased kickpoint in the experimental to the bending
moment being closet to the butt and forcing the kickpoint further down the shaft length (Chou
& Roberts, 1994).
The kickpoint data for the shafts is presented in, Table 3.9, Table 6.7 and 6.8, the data shows
a range of kickpoints from 46.5 – 53.1 % and 45 – 52.9 % for the single and variable
cantilever lengths respectively. The range of kickpoints is within that observed in previous
literature 46 – 57 % by Huntley (2007) by utilising the same testing method. The discrepancy
Page | 58
between the 40 – 60 % range observed by Cheong (2005) and results in this thesis can be
attributed to the compression test method for kickpoint position determination used by the
author, the compression test results in the whole shaft acting (Chou & Roberts, 1994).
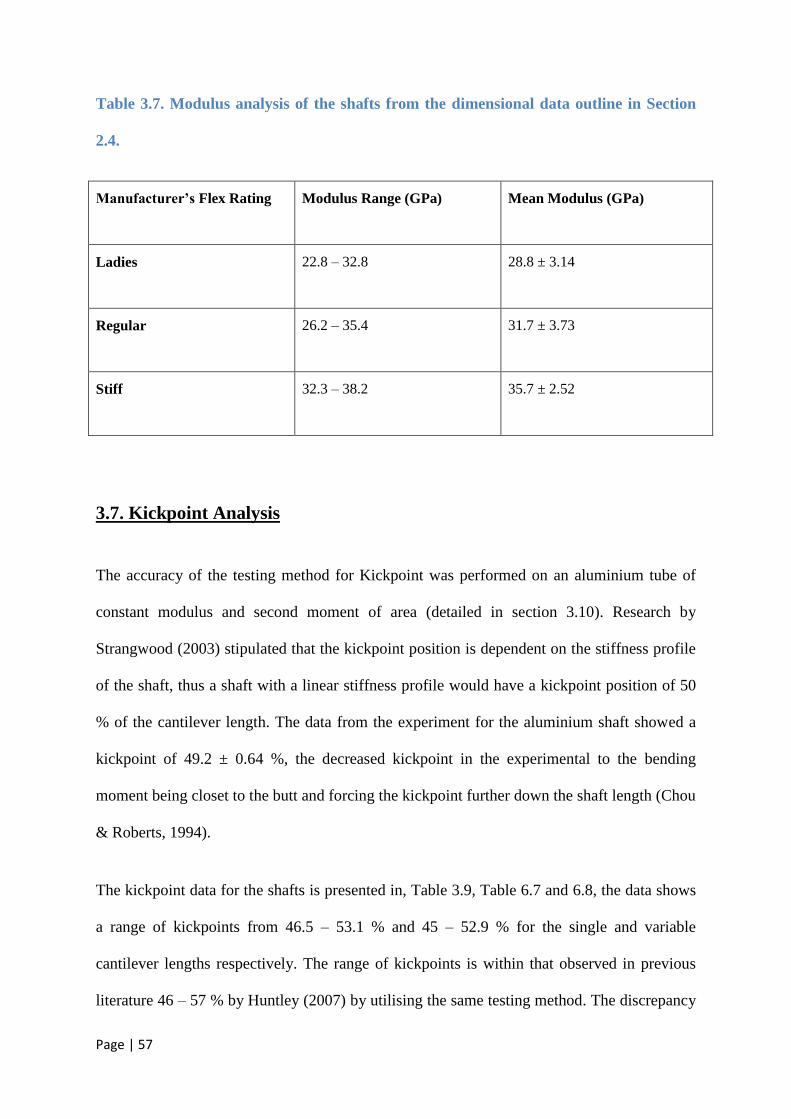
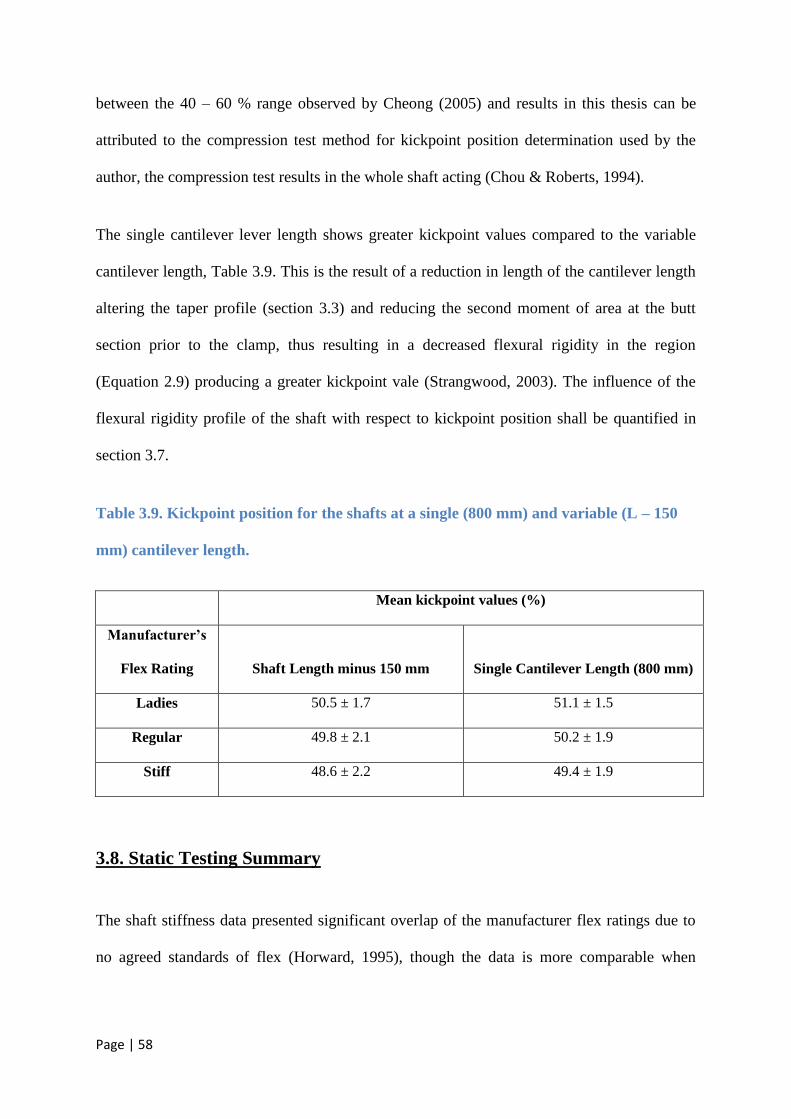
The single cantilever lever length shows greater kickpoint values compared to the variable
cantilever length, Table 3.9. This is the result of a reduction in length of the cantilever length
altering the taper profile (section 3.3) and reducing the second moment of area at the butt
section prior to the clamp, thus resulting in a decreased flexural rigidity in the region
(Equation 2.9) producing a greater kickpoint vale (Strangwood, 2003). The influence of the
flexural rigidity profile of the shaft with respect to kickpoint position shall be quantified in
section 3.7.
Table 3.9. Kickpoint position for the shafts at a single (800 mm) and variable (L – 150
mm) cantilever length.
Mean kickpoint values (%)
Manufacturer’s
Flex Rating Shaft Length minus 150 mm Single Cantilever Length (800 mm)
Ladies 50.5 ± 1.7 51.1 ± 1.5
Regular 49.8 ± 2.1 50.2 ± 1.9
Stiff 48.6 ± 2.2 49.4 ± 1.9
3.8. Static Testing Summary
The shaft stiffness data presented significant overlap of the manufacturer flex ratings due to
no agreed standards of flex (Horward, 1995), though the data is more comparable when
Page | 59
analysed at a single cantilever length and the mean stiffness values increase with the
manufacturer’s flex ratings.
The dimensional data between the regular and stiff manufacturer’s flex ratings presented no
significance in wall thickness and taper (p = 0.51 and 0.43 respectively). However, the
analysis of the stiffness of the regular and stiff flex shafts presented significance (p = 0.0032),
thus the manufacturers would be engineering the stiffness via modulus.
The Kickpoint ranged from 46.5 – 53.1 % for the shafts at a single cantilever length, the
kickpoint position from previous work by Strangwood (2003) stated that the kickpoint
position is a product of the stiffness profile of the shaft and shall be investigated in Section
3.9.
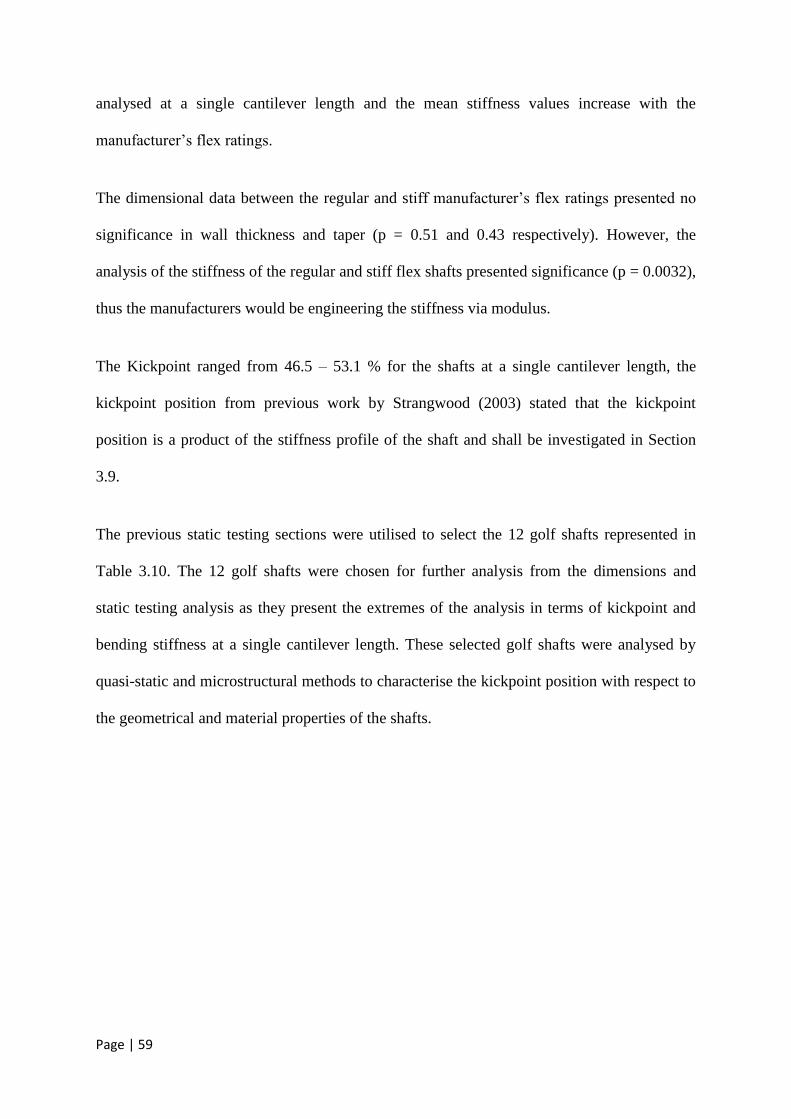
The previous static testing sections were utilised to select the 12 golf shafts represented in
Table 3.10. The 12 golf shafts were chosen for further analysis from the dimensions and
static testing analysis as they present the extremes of the analysis in terms of kickpoint and
bending stiffness at a single cantilever length. These selected golf shafts were analysed by
quasi-static and microstructural methods to characterise the kickpoint position with respect to
the geometrical and material properties of the shafts.
Page | 60
Table 3.10. Represents mechanical properties of sheet laminated (highlighted blue) and
filament wound shafts.
Single Variable
Shaft Stiffness (N/m) Kickpoint (%) Stiffness (N/m) Kickpoint (%)
1C 262.8 52.3 196.9 51.5
BJ 273.5 46.8 175.5 45.9
AK 243.4 48.7 164.9 47.5
AY 180.8 49.1 218.0 48.3
AO 268.9 48.1 201.1 48.4
D1 242.5 51.2 172.6 50.7
AV 184.2 47.3 127.8 47.8
BH2 241.0 47.1 158.4 46.4
R 284.5 48.1 191.1 47.6
I 262.3 52.9 195.1 52.5
BE 210.8 53.0 161.1 52.2
AF2 267.0 52.0 173.7 51.2
BK1 234.4 46.5 159.3 45.8
AS 265.6 47.5 176.1 47.1
3.9. Frequency Analysis
Frequency analysis is a measurement of shaft stiffness and the relationship between
frequency analysis and traditional force/deflection analysis for stiffness will be analysed. The
Page | 61
influence of cantilever length, wall thickness variation and shaft manufacturing route will be
analysed with respect to frequency.
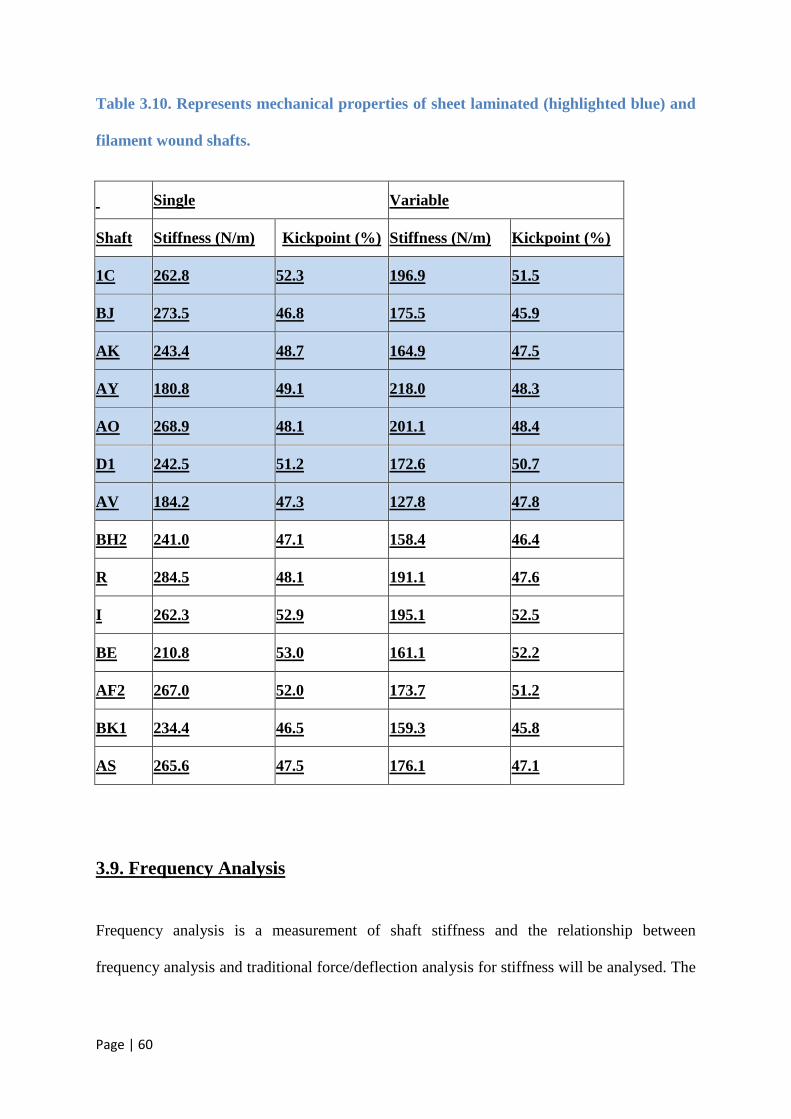
Equation 2.17. shows that shaft stiffness (F/yo) is proportional to the square of frequency. As
stated previously Equation 2.1 and Equation 2.16 are designed for tubes with a constant
second moment of area and mass per unit length (golf shafts are tapered) and thus will
provide inaccuracies, though this will not influence the relationship of stiffness to the square
of frequency. The relationship of stiffness being proportional to the square of frequency is
shown experimentally by shaft D1 at various cantilever lengths for stiffness and frequency in
figure 3.6.
Figure 3.6. Graph showing the relationship between frequency and stiffness for shaft
D1.
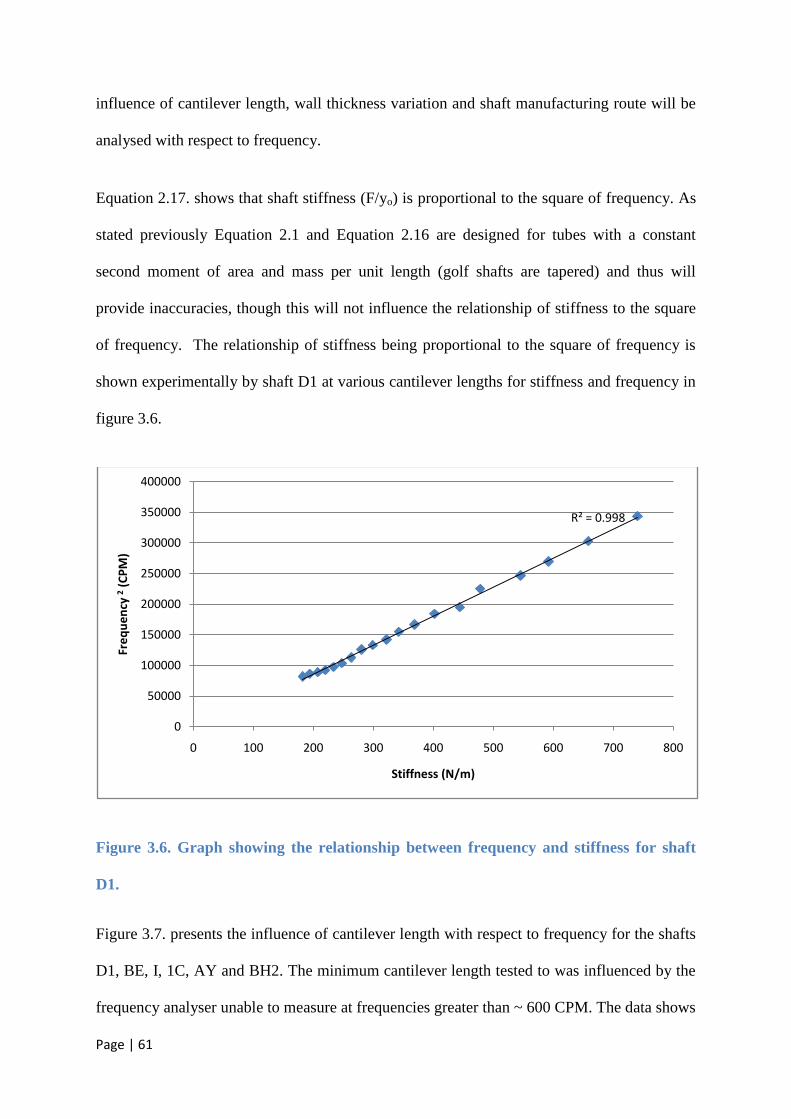
Figure 3.7. presents the influence of cantilever length with respect to frequency for the shafts
D1, BE, I, 1C, AY and BH2. The minimum cantilever length tested to was influenced by the
frequency analyser unable to measure at frequencies greater than ~ 600 CPM. The data shows
R² = 0.998
0
50000
100000
150000
200000
250000
300000
350000
400000
0 100 200 300 400 500 600 700 800
Fre
qu
en
cy 2
(CP
M)
Stiffness (N/m)
Page | 62
that frequency is more sensitive to shorter cantilever lengths by a greater gradient in the
increase in stiffness, the relationship between frequency and cantilever length is shown by
Equation 2.16 and experimentally proven by Figure 3.8.
Figure 3.7. Frequency profile with respect to cantilever length.
200
250
300
350
400
450
500
550
600
650
425 525 625 725 825 925
Fre
qu
en
cy (
CP
M)
Cantilever Length (mm)
D1
BE
I
1C
AY
BH2
Page | 63
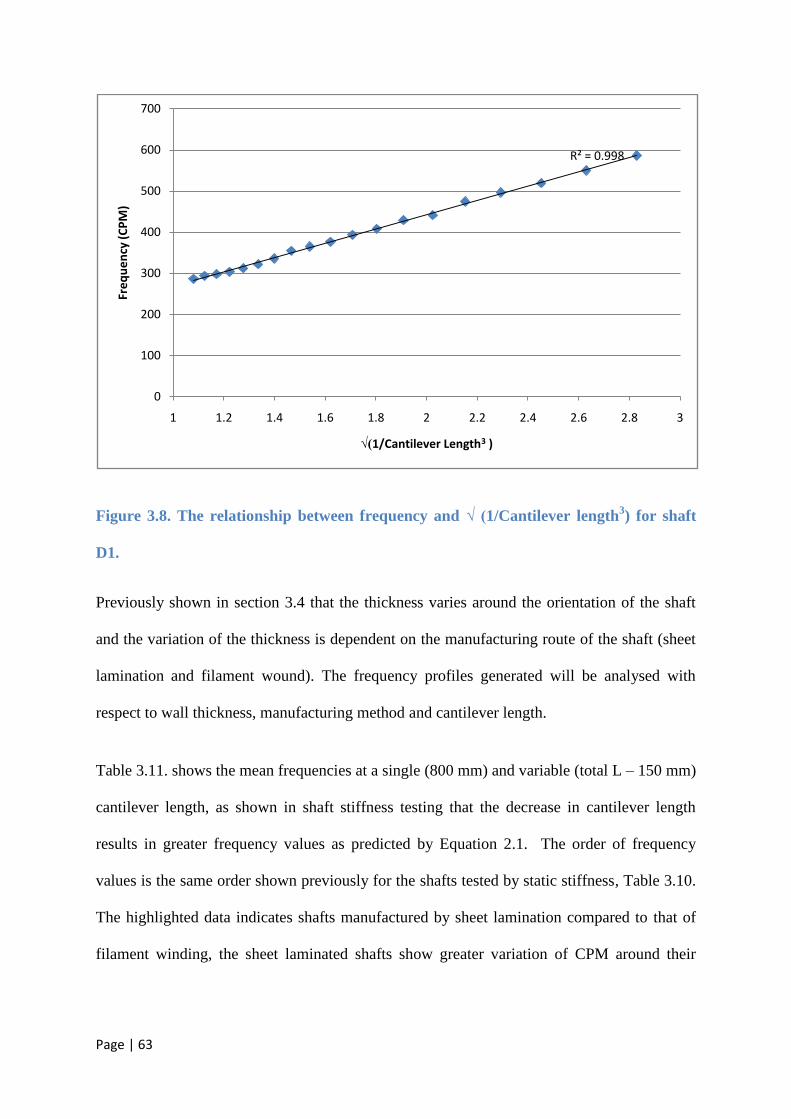
Figure 3.8. The relationship between frequency and √ (1/Cantilever length3) for shaft
D1.
Previously shown in section 3.4 that the thickness varies around the orientation of the shaft
and the variation of the thickness is dependent on the manufacturing route of the shaft (sheet
lamination and filament wound). The frequency profiles generated will be analysed with
respect to wall thickness, manufacturing method and cantilever length.
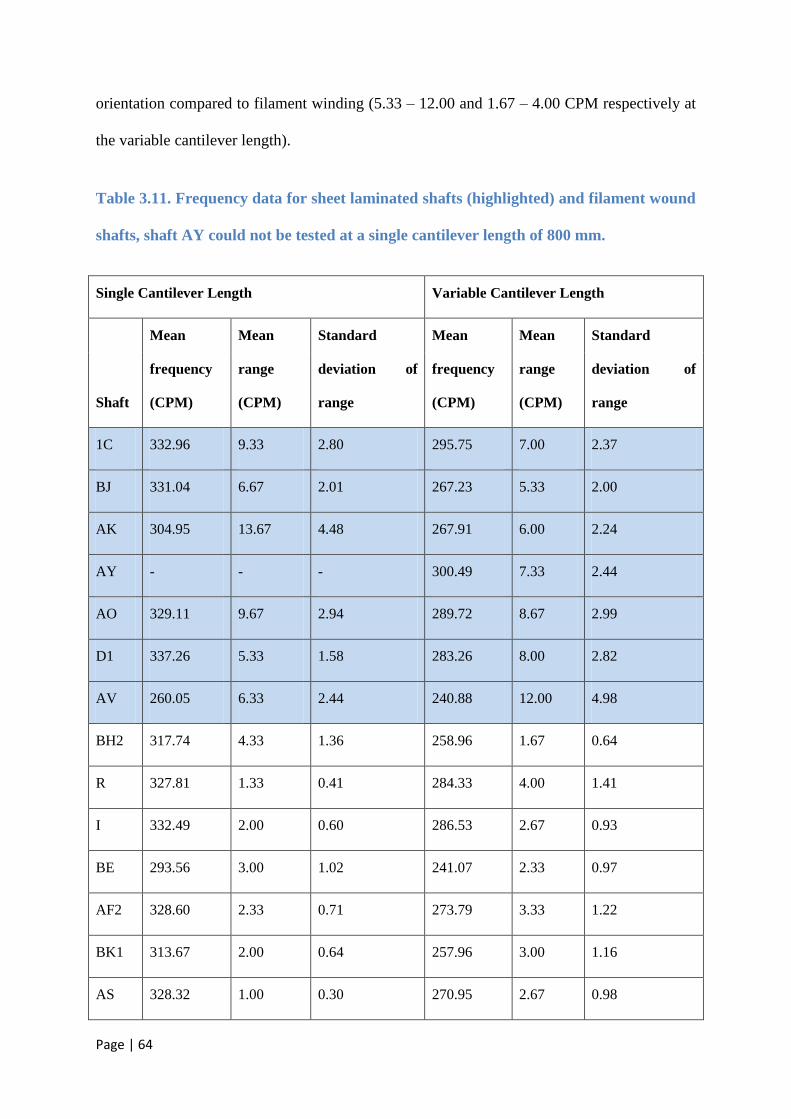
Table 3.11. shows the mean frequencies at a single (800 mm) and variable (total L – 150 mm)
cantilever length, as shown in shaft stiffness testing that the decrease in cantilever length
results in greater frequency values as predicted by Equation 2.1. The order of frequency
values is the same order shown previously for the shafts tested by static stiffness, Table 3.10.
The highlighted data indicates shafts manufactured by sheet lamination compared to that of
filament winding, the sheet laminated shafts show greater variation of CPM around their
R² = 0.998
0
100
200
300
400
500
600
700
1 1.2 1.4 1.6 1.8 2 2.2 2.4 2.6 2.8 3
Fre
qu
en
cy (
CP
M)
√(1/Cantilever Length3 )
Page | 64
orientation compared to filament winding (5.33 – 12.00 and 1.67 – 4.00 CPM respectively at
the variable cantilever length).
Table 3.11. Frequency data for sheet laminated shafts (highlighted) and filament wound
shafts, shaft AY could not be tested at a single cantilever length of 800 mm.
Single Cantilever Length Variable Cantilever Length
Shaft
Mean
frequency
(CPM)
Mean
range
(CPM)
Standard
deviation of
range
Mean
frequency
(CPM)
Mean
range
(CPM)
Standard
deviation of
range
1C 332.96 9.33 2.80 295.75 7.00 2.37
BJ 331.04 6.67 2.01 267.23 5.33 2.00
AK 304.95 13.67 4.48 267.91 6.00 2.24
AY - - - 300.49 7.33 2.44
AO 329.11 9.67 2.94 289.72 8.67 2.99
D1 337.26 5.33 1.58 283.26 8.00 2.82
AV 260.05 6.33 2.44 240.88 12.00 4.98
BH2 317.74 4.33 1.36 258.96 1.67 0.64
R 327.81 1.33 0.41 284.33 4.00 1.41
I 332.49 2.00 0.60 286.53 2.67 0.93
BE 293.56 3.00 1.02 241.07 2.33 0.97
AF2 328.60 2.33 0.71 273.79 3.33 1.22
BK1 313.67 2.00 0.64 257.96 3.00 1.16
AS 328.32 1.00 0.30 270.95 2.67 0.98
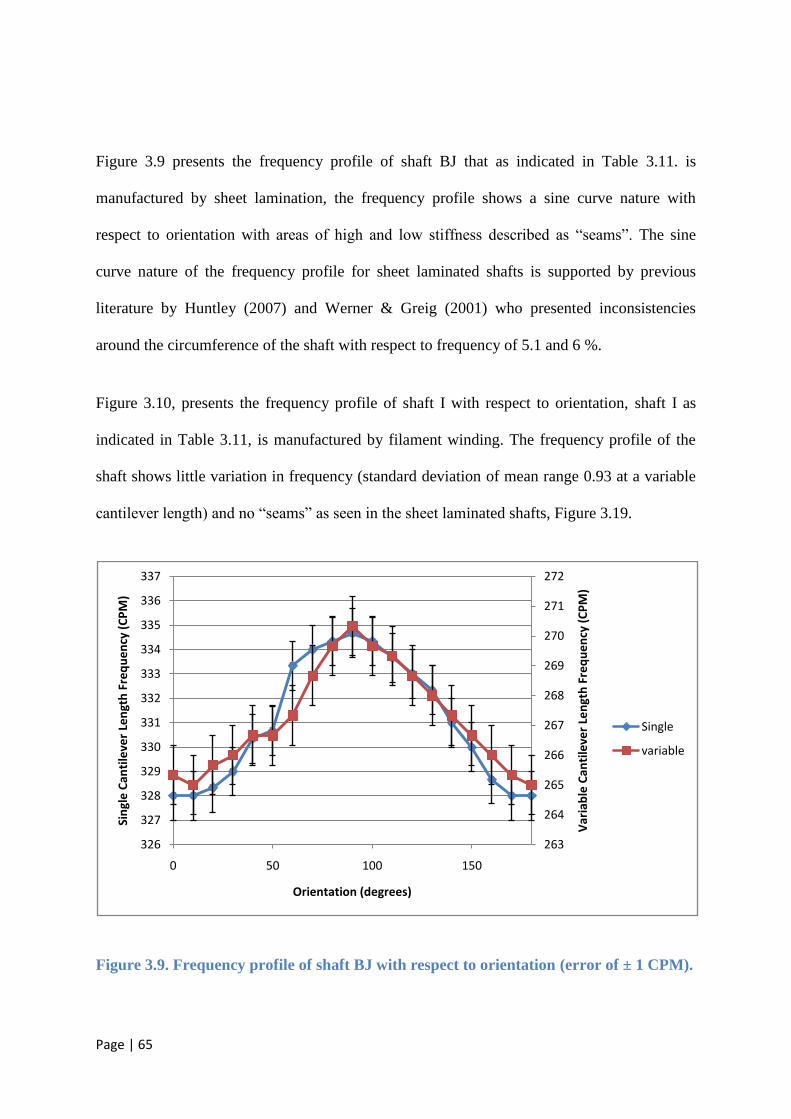
Page | 65
Figure 3.9 presents the frequency profile of shaft BJ that as indicated in Table 3.11. is
manufactured by sheet lamination, the frequency profile shows a sine curve nature with
respect to orientation with areas of high and low stiffness described as “seams”. The sine
curve nature of the frequency profile for sheet laminated shafts is supported by previous
literature by Huntley (2007) and Werner & Greig (2001) who presented inconsistencies
around the circumference of the shaft with respect to frequency of 5.1 and 6 %.
Figure 3.10, presents the frequency profile of shaft I with respect to orientation, shaft I as
indicated in Table 3.11, is manufactured by filament winding. The frequency profile of the
shaft shows little variation in frequency (standard deviation of mean range 0.93 at a variable
cantilever length) and no “seams” as seen in the sheet laminated shafts, Figure 3.19.
Figure 3.9. Frequency profile of shaft BJ with respect to orientation (error of ± 1 CPM).
263
264
265
266
267
268
269
270
271
272
326
327
328
329
330
331
332
333
334
335
336
337
0 50 100 150
Var
iab
le C
anti
leve
r Le
ngt
h F
req
ue
ncy
(C
PM
)
Sin
gle
Can
tile
ver
Len
gth
Fre
qu
en
cy (
CP
M)
Orientation (degrees)
Single
variable
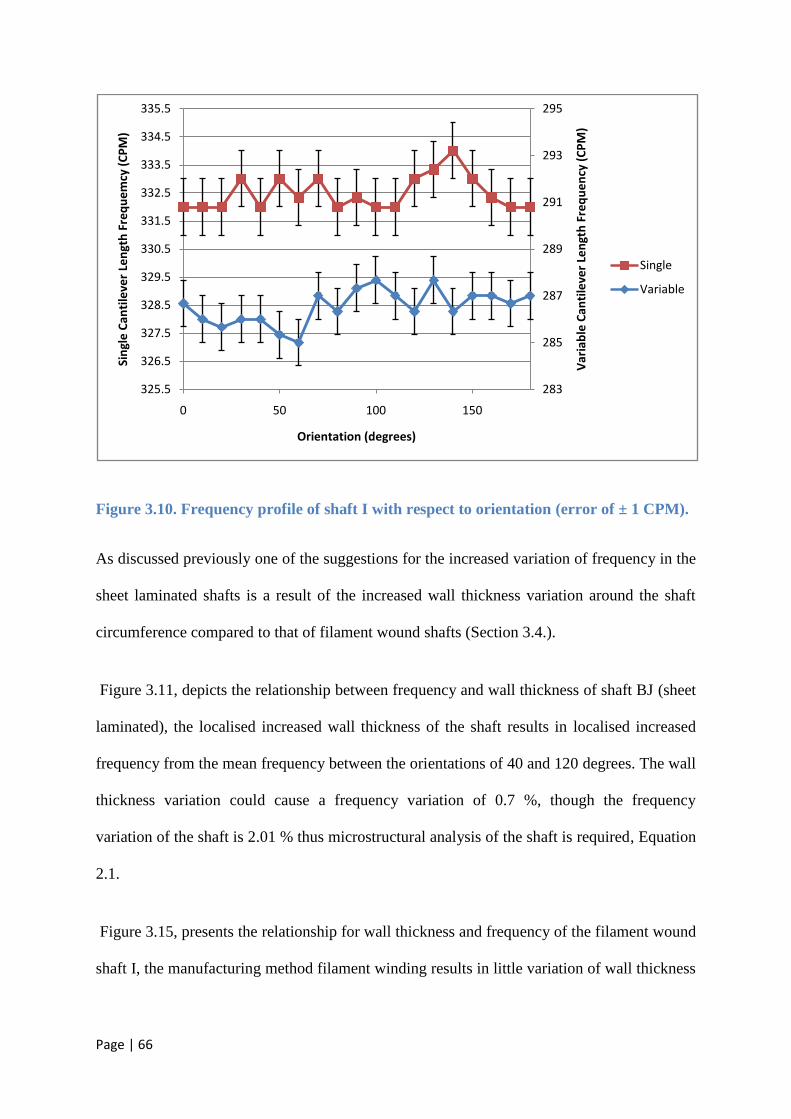
Page | 66
Figure 3.10. Frequency profile of shaft I with respect to orientation (error of ± 1 CPM).
As discussed previously one of the suggestions for the increased variation of frequency in the
sheet laminated shafts is a result of the increased wall thickness variation around the shaft
circumference compared to that of filament wound shafts (Section 3.4.).
Figure 3.11, depicts the relationship between frequency and wall thickness of shaft BJ (sheet
laminated), the localised increased wall thickness of the shaft results in localised increased
frequency from the mean frequency between the orientations of 40 and 120 degrees. The wall
thickness variation could cause a frequency variation of 0.7 %, though the frequency
variation of the shaft is 2.01 % thus microstructural analysis of the shaft is required, Equation
2.1.
Figure 3.15, presents the relationship for wall thickness and frequency of the filament wound
shaft I, the manufacturing method filament winding results in little variation of wall thickness
283
285
287
289
291
293
295
325.5
326.5
327.5
328.5
329.5
330.5
331.5
332.5
333.5
334.5
335.5
0 50 100 150
Var
iab
le C
anti
leve
r Le
ngt
h F
req
ue
ncy
(C
PM
)
Sin
gle
Can
tile
ver
Len
gth
Fre
qu
em
cy (
CP
M)
Orientation (degrees)
Single
Variable
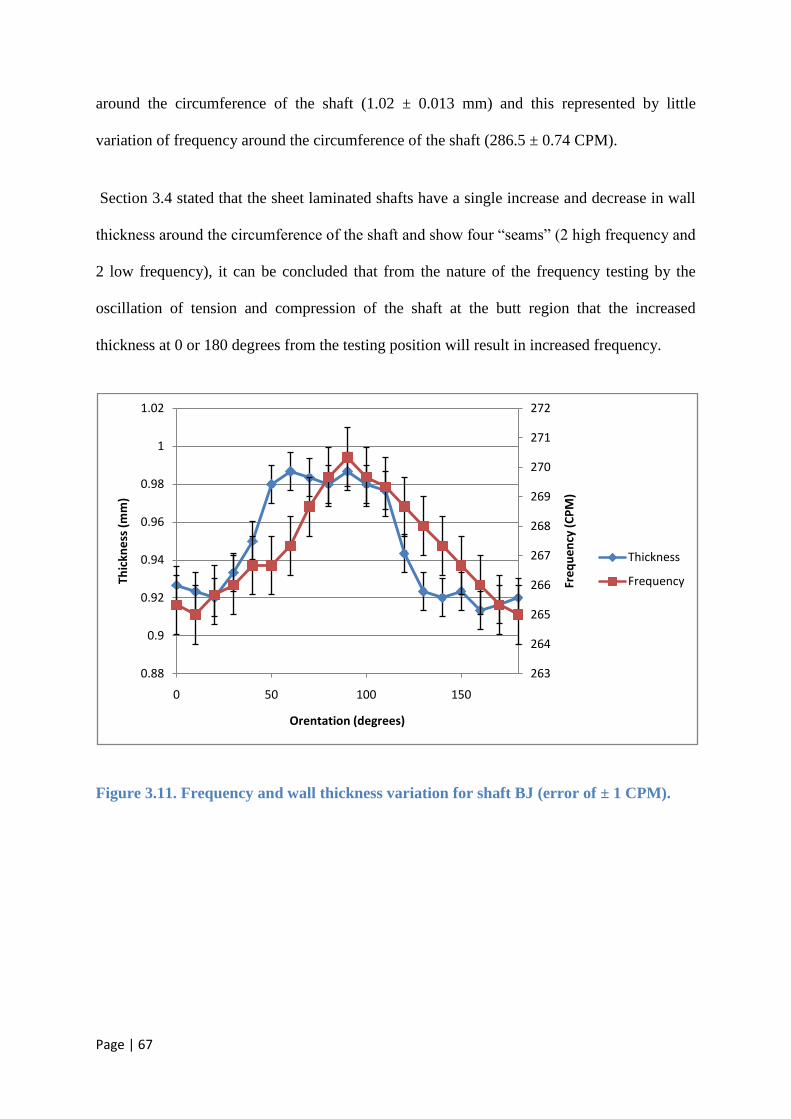
Page | 67
around the circumference of the shaft (1.02 ± 0.013 mm) and this represented by little
variation of frequency around the circumference of the shaft (286.5 ± 0.74 CPM).
Section 3.4 stated that the sheet laminated shafts have a single increase and decrease in wall
thickness around the circumference of the shaft and show four “seams” (2 high frequency and
2 low frequency), it can be concluded that from the nature of the frequency testing by the
oscillation of tension and compression of the shaft at the butt region that the increased
thickness at 0 or 180 degrees from the testing position will result in increased frequency.
Figure 3.11. Frequency and wall thickness variation for shaft BJ (error of ± 1 CPM).
263
264
265
266
267
268
269
270
271
272
0.88
0.9
0.92
0.94
0.96
0.98
1
1.02
0 50 100 150
Fre
qu
en
cy (
CP
M)
Thic
kne
ss (
mm
)
Orentation (degrees)
Thickness
Frequency
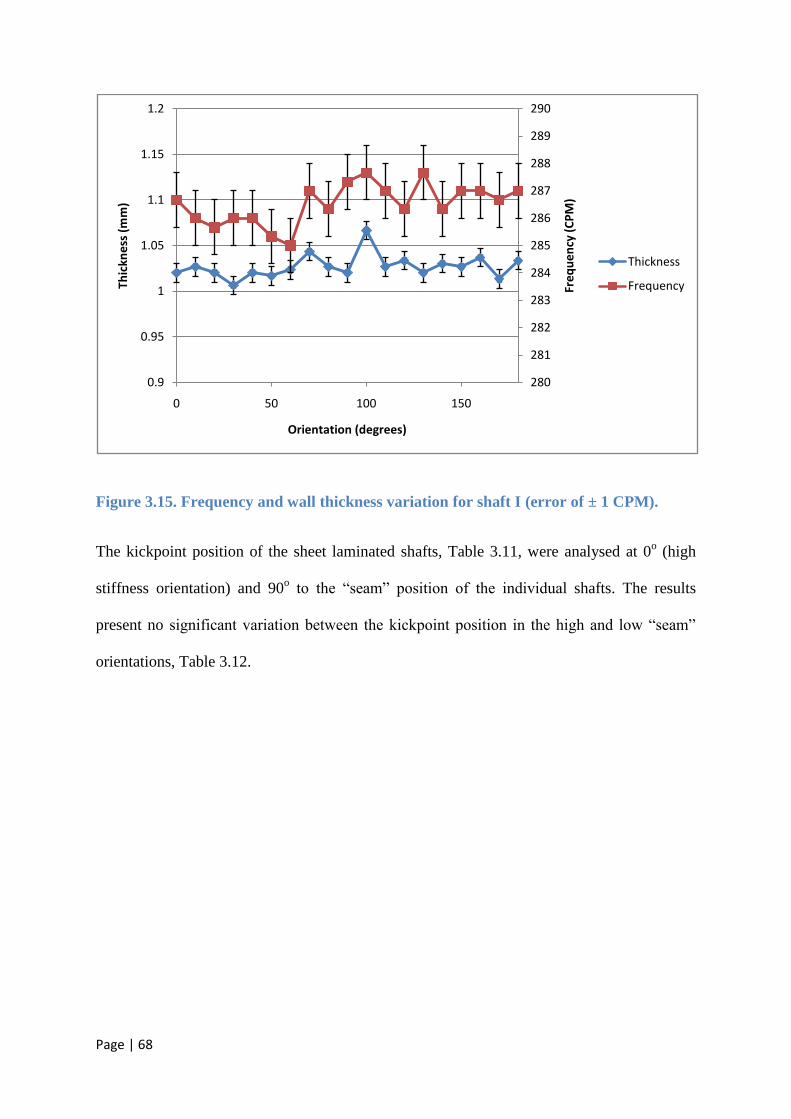
Page | 68
Figure 3.15. Frequency and wall thickness variation for shaft I (error of ± 1 CPM).
The kickpoint position of the sheet laminated shafts, Table 3.11, were analysed at 0o (high
stiffness orientation) and 90o to the “seam” position of the individual shafts. The results
present no significant variation between the kickpoint position in the high and low “seam”
orientations, Table 3.12.
280
281
282
283
284
285
286
287
288
289
290
0.9
0.95
1
1.05
1.1
1.15
1.2
0 50 100 150
Fre
qu
en
cy (
CP
M)
Thic
kne
ss (
mm
)
Orientation (degrees)
Thickness
Frequency
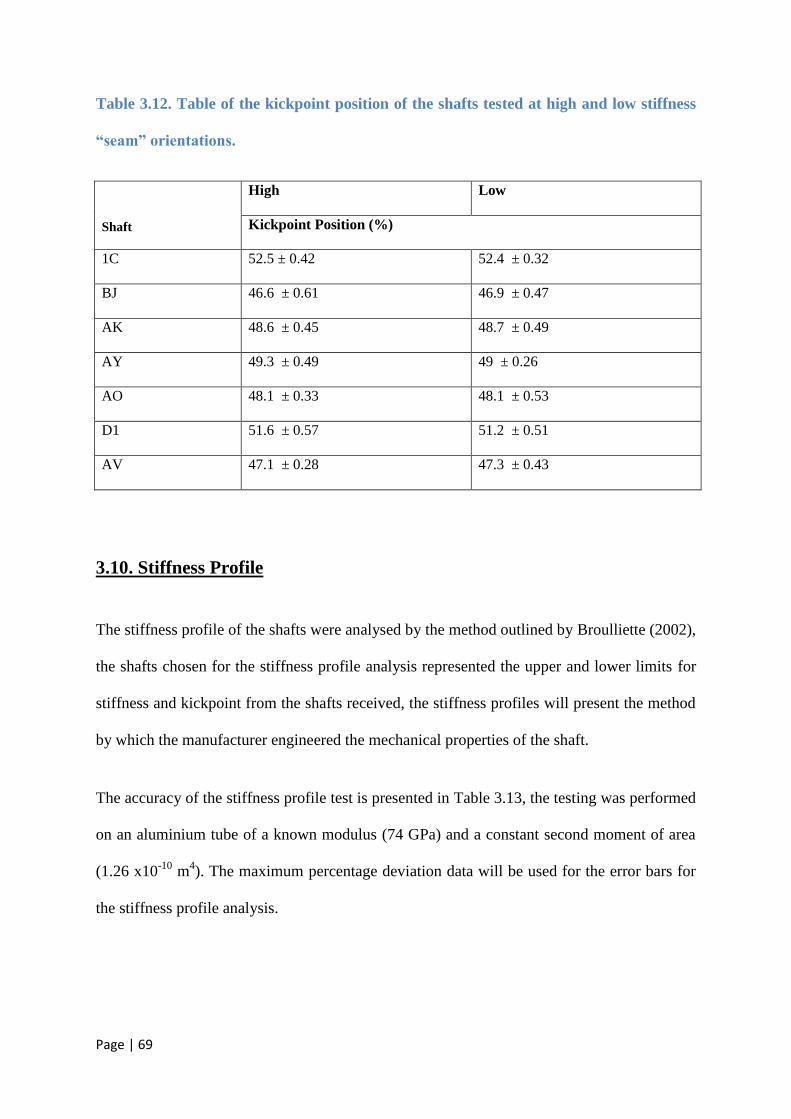
Page | 69
Table 3.12. Table of the kickpoint position of the shafts tested at high and low stiffness
“seam” orientations.
Shaft
High Low
Kickpoint Position (%)
1C 52.5 ± 0.42 52.4 ± 0.32
BJ 46.6 ± 0.61 46.9 ± 0.47
AK 48.6 ± 0.45 48.7 ± 0.49
AY 49.3 ± 0.49 49 ± 0.26
AO 48.1 ± 0.33 48.1 ± 0.53
D1 51.6 ± 0.57 51.2 ± 0.51
AV 47.1 ± 0.28 47.3 ± 0.43
3.10. Stiffness Profile
The stiffness profile of the shafts were analysed by the method outlined by Broulliette (2002),
the shafts chosen for the stiffness profile analysis represented the upper and lower limits for
stiffness and kickpoint from the shafts received, the stiffness profiles will present the method
by which the manufacturer engineered the mechanical properties of the shaft.
The accuracy of the stiffness profile test is presented in Table 3.13, the testing was performed
on an aluminium tube of a known modulus (74 GPa) and a constant second moment of area
(1.26 x10⁻¹⁰
m4). The maximum percentage deviation data will be used for the error bars for
the stiffness profile analysis.
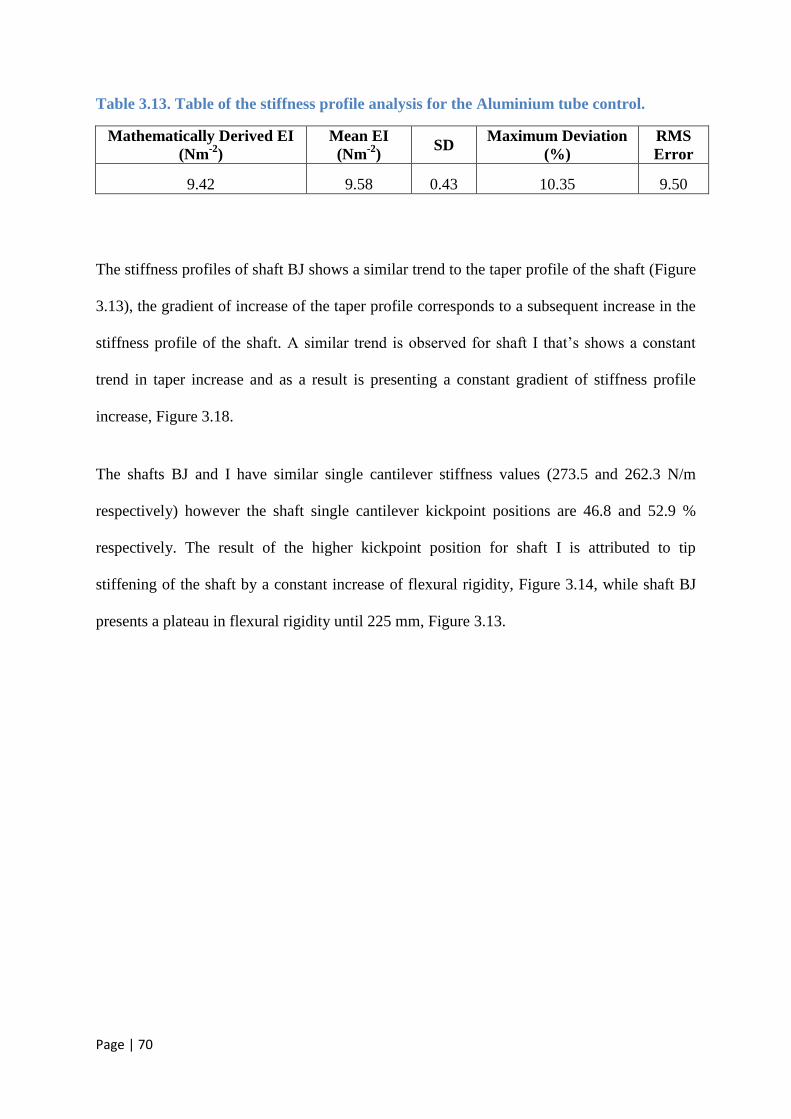
Page | 70
Table 3.13. Table of the stiffness profile analysis for the Aluminium tube control.
Mathematically Derived EI
(Nm-2
)
Mean EI
(Nm-2
) SD
Maximum Deviation
(%)
RMS
Error
9.42 9.58 0.43 10.35 9.50
The stiffness profiles of shaft BJ shows a similar trend to the taper profile of the shaft (Figure
3.13), the gradient of increase of the taper profile corresponds to a subsequent increase in the
stiffness profile of the shaft. A similar trend is observed for shaft I that’s shows a constant
trend in taper increase and as a result is presenting a constant gradient of stiffness profile
increase, Figure 3.18.
The shafts BJ and I have similar single cantilever stiffness values (273.5 and 262.3 N/m
respectively) however the shaft single cantilever kickpoint positions are 46.8 and 52.9 %
respectively. The result of the higher kickpoint position for shaft I is attributed to tip
stiffening of the shaft by a constant increase of flexural rigidity, Figure 3.14, while shaft BJ
presents a plateau in flexural rigidity until 225 mm, Figure 3.13.
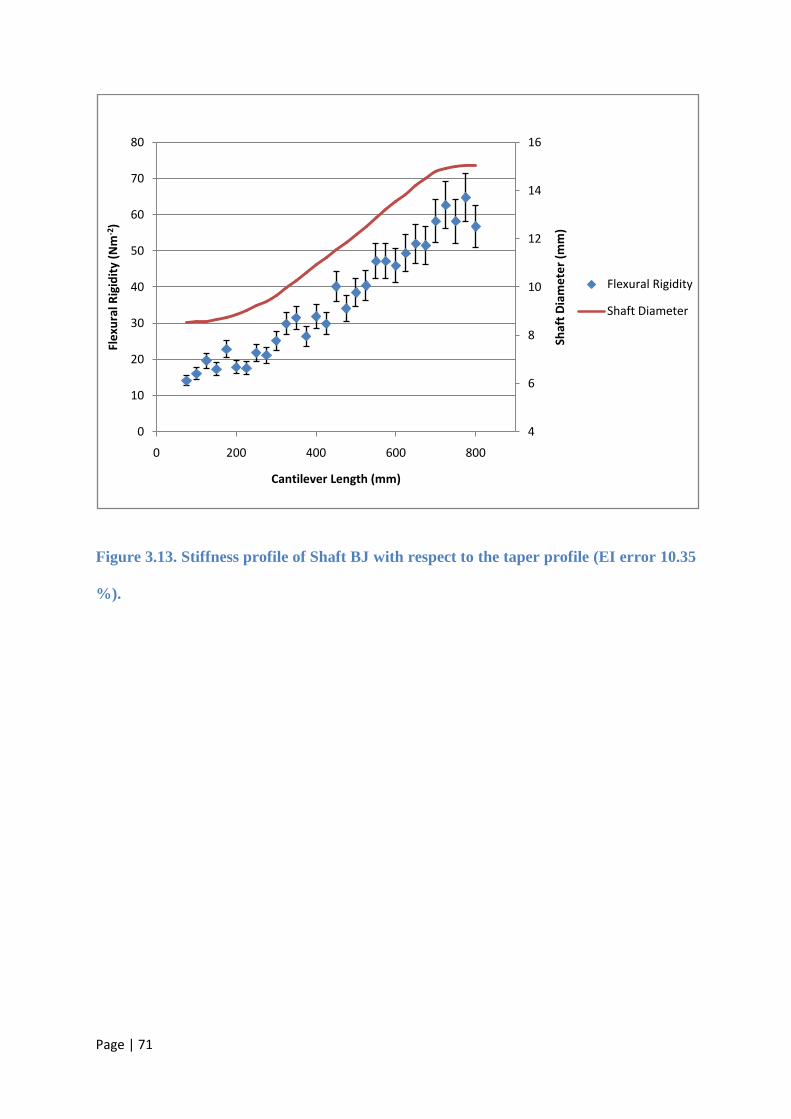
Page | 71
Figure 3.13. Stiffness profile of Shaft BJ with respect to the taper profile (EI error 10.35
%).
4
6
8
10
12
14
16
0
10
20
30
40
50
60
70
80
0 200 400 600 800
Shaf
t D
iam
ete
r (m
m)
Fle
xura
l Rig
idit
y (N
m-2
)
Cantilever Length (mm)
Flexural Rigidity
Shaft Diameter
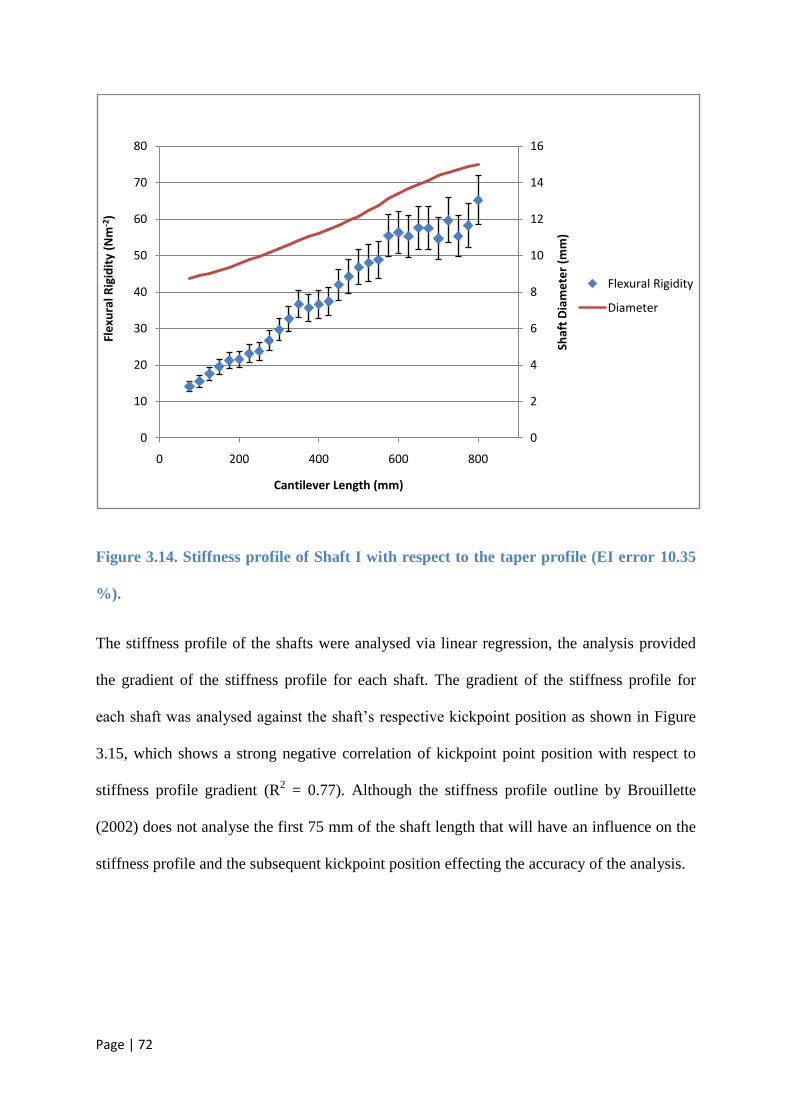
Page | 72
Figure 3.14. Stiffness profile of Shaft I with respect to the taper profile (EI error 10.35
%).
The stiffness profile of the shafts were analysed via linear regression, the analysis provided
the gradient of the stiffness profile for each shaft. The gradient of the stiffness profile for
each shaft was analysed against the shaft’s respective kickpoint position as shown in Figure
3.15, which shows a strong negative correlation of kickpoint point position with respect to
stiffness profile gradient (R2 = 0.77). Although the stiffness profile outline by Brouillette
(2002) does not analyse the first 75 mm of the shaft length that will have an influence on the
stiffness profile and the subsequent kickpoint position effecting the accuracy of the analysis.
0
2
4
6
8
10
12
14
16
0
10
20
30
40
50
60
70
80
0 200 400 600 800
Shaf
t D
iam
ete
r (m
m)
Fle
xura
l Rig
idit
y (N
m-2
)
Cantilever Length (mm)
Flexural Rigidity
Diameter
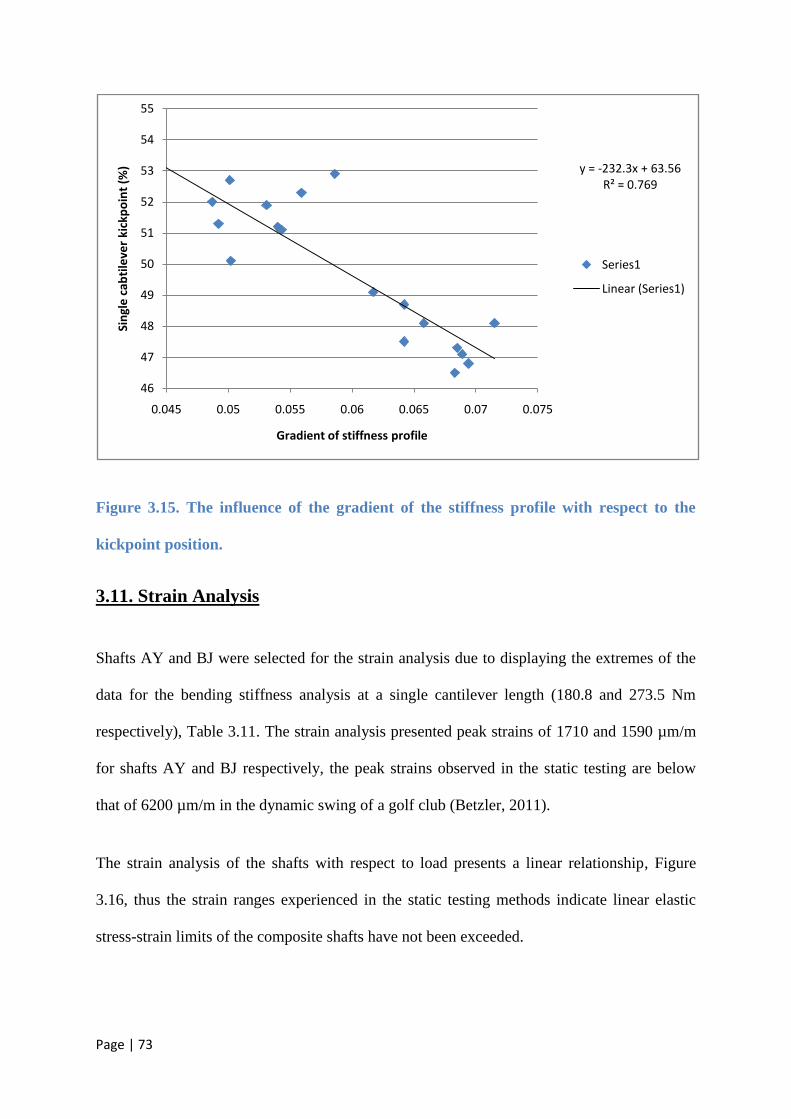
Page | 73
Figure 3.15. The influence of the gradient of the stiffness profile with respect to the
kickpoint position.
3.11. Strain Analysis
Shafts AY and BJ were selected for the strain analysis due to displaying the extremes of the
data for the bending stiffness analysis at a single cantilever length (180.8 and 273.5 Nm
respectively), Table 3.11. The strain analysis presented peak strains of 1710 and 1590 µm/m
for shafts AY and BJ respectively, the peak strains observed in the static testing are below
that of 6200 µm/m in the dynamic swing of a golf club (Betzler, 2011).
The strain analysis of the shafts with respect to load presents a linear relationship, Figure
3.16, thus the strain ranges experienced in the static testing methods indicate linear elastic
stress-strain limits of the composite shafts have not been exceeded.
y = -232.3x + 63.56R² = 0.769
46
47
48
49
50
51
52
53
54
55
0.045 0.05 0.055 0.06 0.065 0.07 0.075
Sin
gle
cab
tile
ver
kick
po
int
(%)
Gradient of stiffness profile
Series1
Linear (Series1)
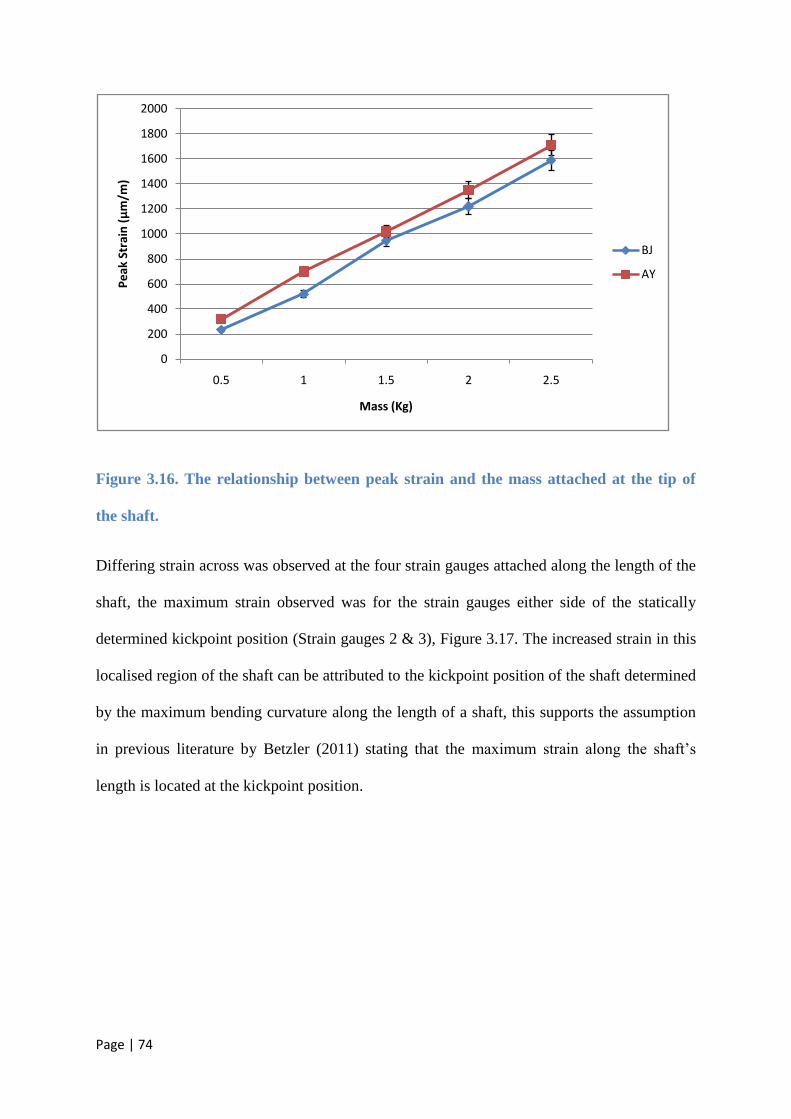
Page | 74
Figure 3.16. The relationship between peak strain and the mass attached at the tip of
the shaft.
Differing strain across was observed at the four strain gauges attached along the length of the
shaft, the maximum strain observed was for the strain gauges either side of the statically
determined kickpoint position (Strain gauges 2 & 3), Figure 3.17. The increased strain in this
localised region of the shaft can be attributed to the kickpoint position of the shaft determined
by the maximum bending curvature along the length of a shaft, this supports the assumption
in previous literature by Betzler (2011) stating that the maximum strain along the shaft’s
length is located at the kickpoint position.
0
200
400
600
800
1000
1200
1400
1600
1800
2000
0.5 1 1.5 2 2.5
Pe
ak S
trai
n (μ
m/m
)
Mass (Kg)
BJ
AY
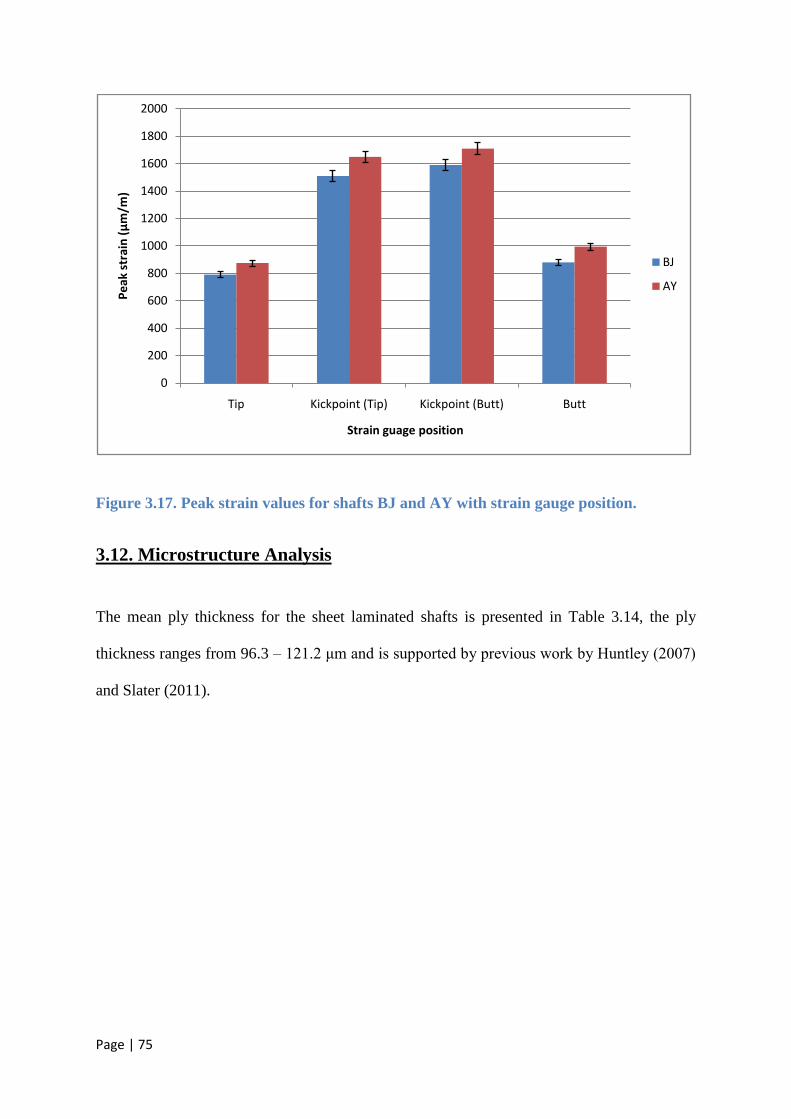
Page | 75
Figure 3.17. Peak strain values for shafts BJ and AY with strain gauge position.
3.12. Microstructure Analysis
The mean ply thickness for the sheet laminated shafts is presented in Table 3.14, the ply
thickness ranges from 96.3 – 121.2 μm and is supported by previous work by Huntley (2007)
and Slater (2011).
0
200
400
600
800
1000
1200
1400
1600
1800
2000
Tip Kickpoint (Tip) Kickpoint (Butt) Butt
Pe
ak s
trai
n (μ
m/m
)
Strain guage position
BJ
AY
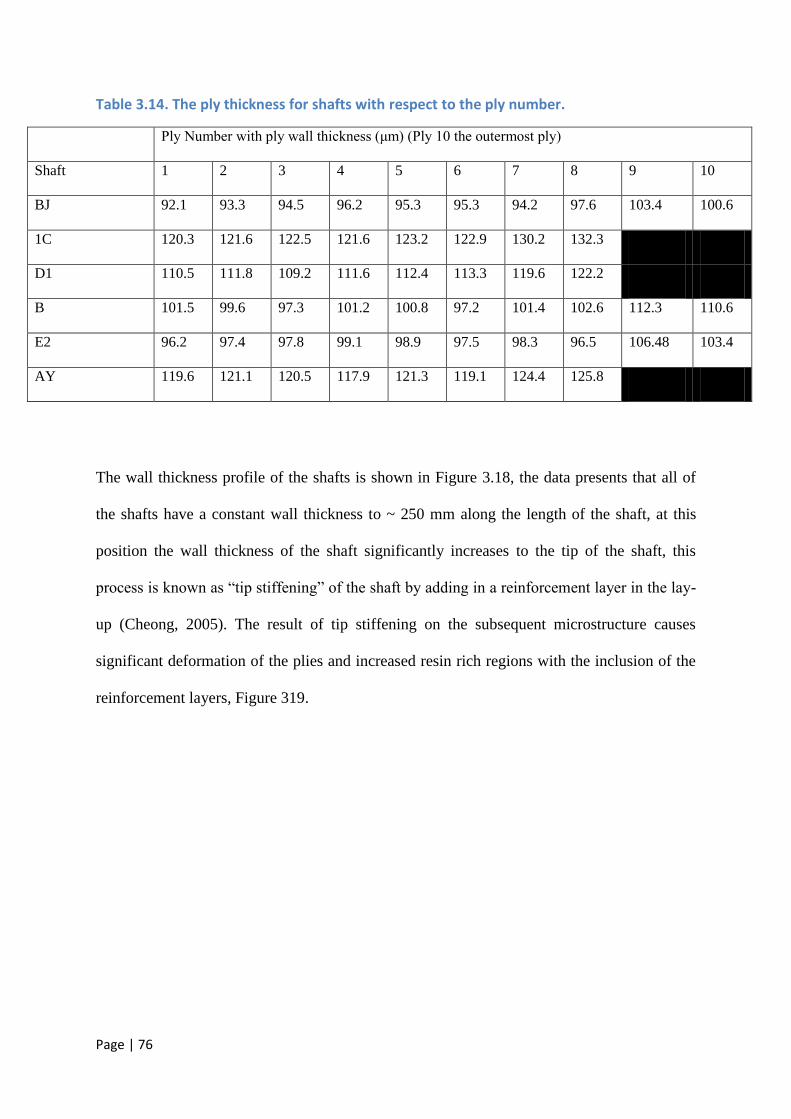
Page | 76
Table 3.14. The ply thickness for shafts with respect to the ply number.
Ply Number with ply wall thickness (μm) (Ply 10 the outermost ply)
Shaft 1 2 3 4 5 6 7 8 9 10
BJ 92.1 93.3 94.5 96.2 95.3 95.3 94.2 97.6 103.4 100.6
1C 120.3 121.6 122.5 121.6 123.2 122.9 130.2 132.3
D1 110.5 111.8 109.2 111.6 112.4 113.3 119.6 122.2
B 101.5 99.6 97.3 101.2 100.8 97.2 101.4 102.6 112.3 110.6
E2 96.2 97.4 97.8 99.1 98.9 97.5 98.3 96.5 106.48 103.4
AY 119.6 121.1 120.5 117.9 121.3 119.1 124.4 125.8
The wall thickness profile of the shafts is shown in Figure 3.18, the data presents that all of
the shafts have a constant wall thickness to ~ 250 mm along the length of the shaft, at this
position the wall thickness of the shaft significantly increases to the tip of the shaft, this
process is known as “tip stiffening” of the shaft by adding in a reinforcement layer in the lay-
up (Cheong, 2005). The result of tip stiffening on the subsequent microstructure causes
significant deformation of the plies and increased resin rich regions with the inclusion of the
reinforcement layers, Figure 319.
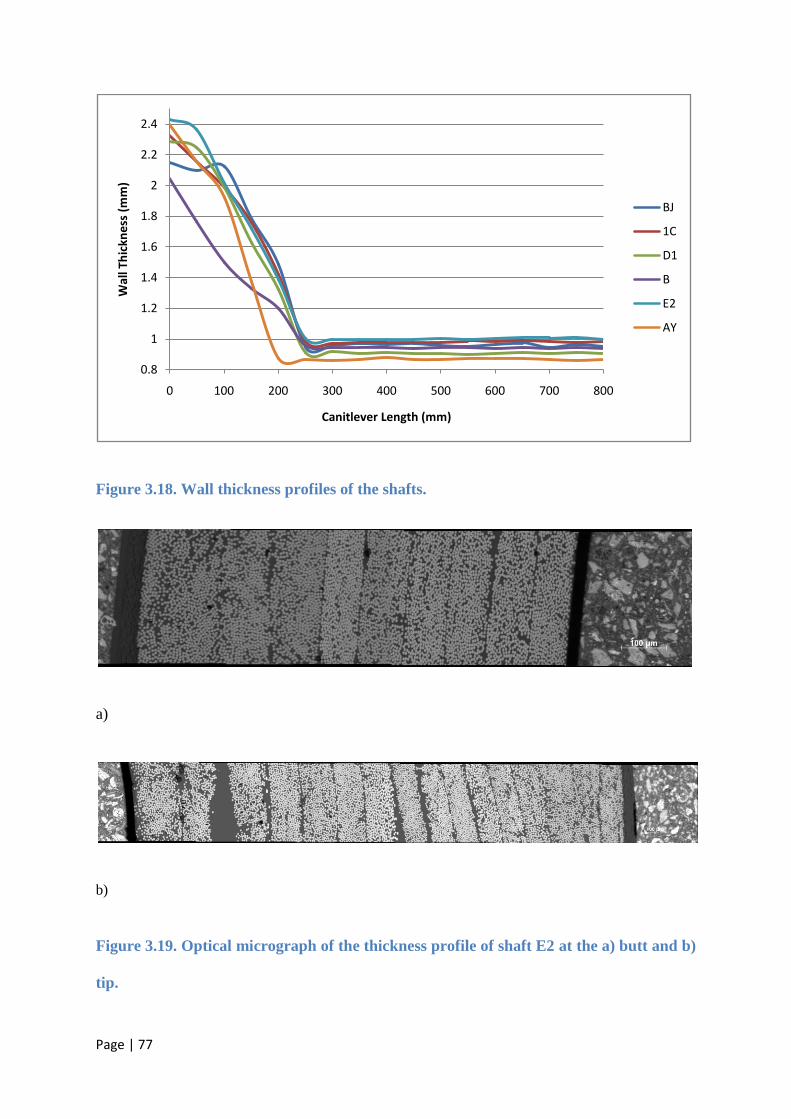
Page | 77
Figure 3.18. Wall thickness profiles of the shafts.
a)
b)
Figure 3.19. Optical micrograph of the thickness profile of shaft E2 at the a) butt and b)
tip.
0.8
1
1.2
1.4
1.6
1.8
2
2.2
2.4
0 100 200 300 400 500 600 700 800
Wal
l Th
ickn
ess
(m
m)
Canitlever Length (mm)
BJ
1C
D1
B
E2
AY
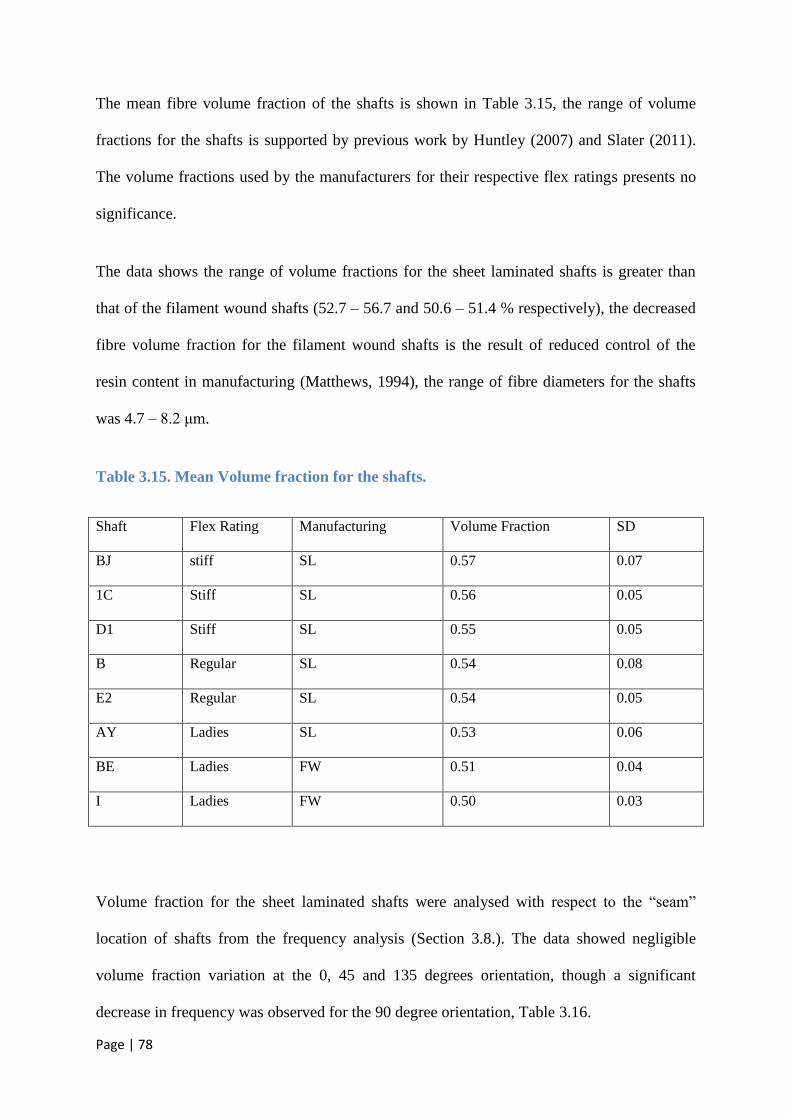
Page | 78
The mean fibre volume fraction of the shafts is shown in Table 3.15, the range of volume
fractions for the shafts is supported by previous work by Huntley (2007) and Slater (2011).
The volume fractions used by the manufacturers for their respective flex ratings presents no
significance.
The data shows the range of volume fractions for the sheet laminated shafts is greater than
that of the filament wound shafts (52.7 – 56.7 and 50.6 – 51.4 % respectively), the decreased
fibre volume fraction for the filament wound shafts is the result of reduced control of the
resin content in manufacturing (Matthews, 1994), the range of fibre diameters for the shafts
was 4.7 – 8.2 μm.
Table 3.15. Mean Volume fraction for the shafts.
Shaft Flex Rating Manufacturing Volume Fraction SD
BJ stiff SL 0.57 0.07
1C Stiff SL 0.56 0.05
D1 Stiff SL 0.55 0.05
B Regular SL 0.54 0.08
E2 Regular SL 0.54 0.05
AY Ladies SL 0.53 0.06
BE Ladies FW 0.51 0.04
I Ladies FW 0.50 0.03
Volume fraction for the sheet laminated shafts were analysed with respect to the “seam”
location of shafts from the frequency analysis (Section 3.8.). The data showed negligible
volume fraction variation at the 0, 45 and 135 degrees orientation, though a significant
decrease in frequency was observed for the 90 degree orientation, Table 3.16.
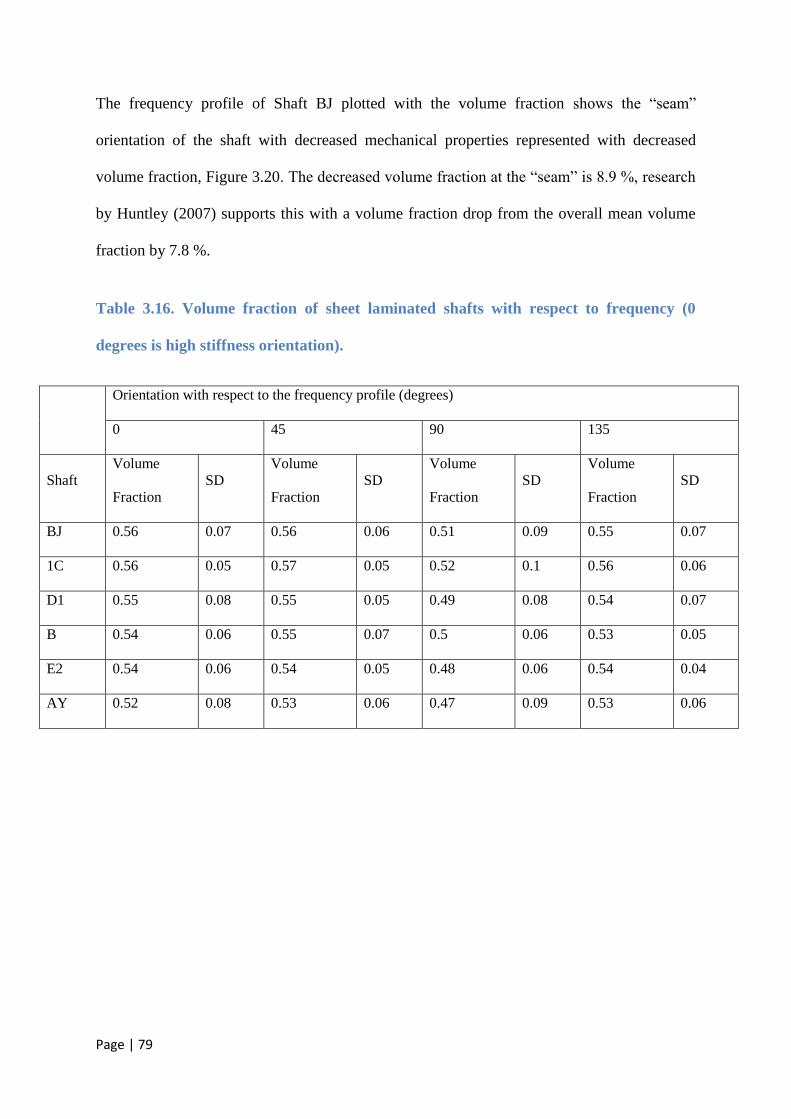
Page | 79
The frequency profile of Shaft BJ plotted with the volume fraction shows the “seam”
orientation of the shaft with decreased mechanical properties represented with decreased
volume fraction, Figure 3.20. The decreased volume fraction at the “seam” is 8.9 %, research
by Huntley (2007) supports this with a volume fraction drop from the overall mean volume
fraction by 7.8 %.
Table 3.16. Volume fraction of sheet laminated shafts with respect to frequency (0
degrees is high stiffness orientation).
Orientation with respect to the frequency profile (degrees)
0 45 90 135
Shaft
Volume
Fraction
SD
Volume
Fraction
SD
Volume
Fraction
SD
Volume
Fraction
SD
BJ 0.56 0.07 0.56 0.06 0.51 0.09 0.55 0.07
1C 0.56 0.05 0.57 0.05 0.52 0.1 0.56 0.06
D1 0.55 0.08 0.55 0.05 0.49 0.08 0.54 0.07
B 0.54 0.06 0.55 0.07 0.5 0.06 0.53 0.05
E2 0.54 0.06 0.54 0.05 0.48 0.06 0.54 0.04
AY 0.52 0.08 0.53 0.06 0.47 0.09 0.53 0.06
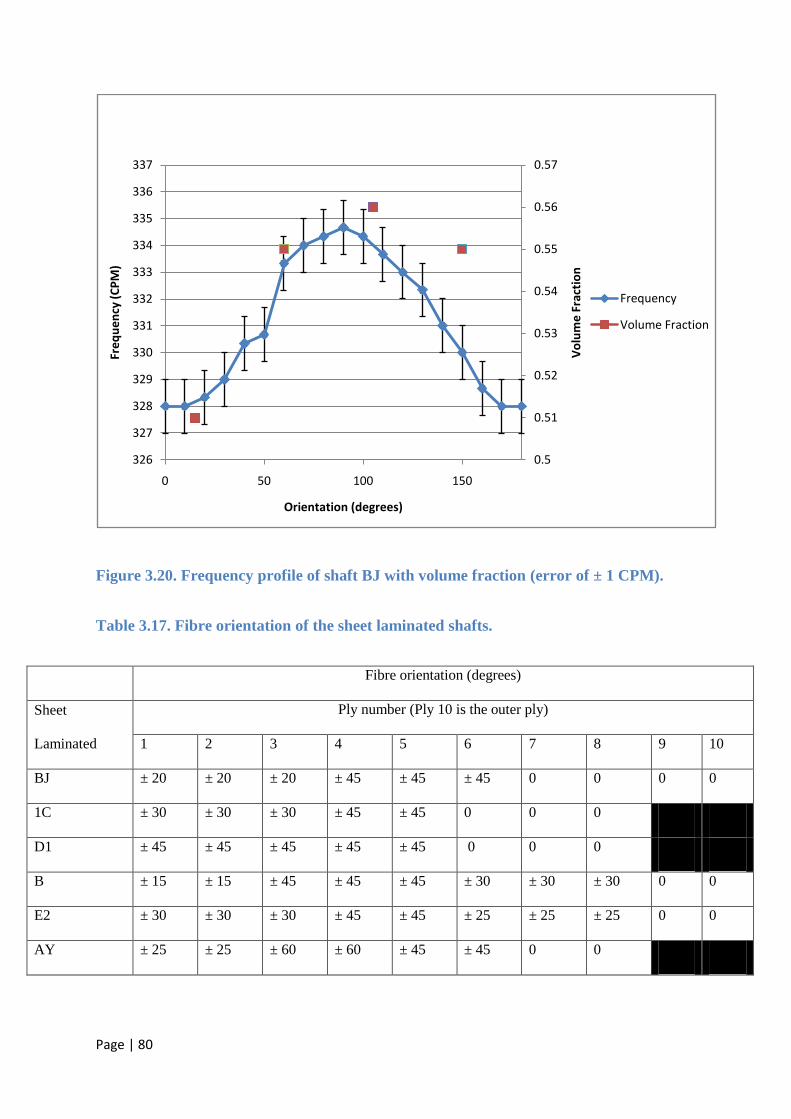
Page | 80
Figure 3.20. Frequency profile of shaft BJ with volume fraction (error of ± 1 CPM).
Table 3.17. Fibre orientation of the sheet laminated shafts.
Fibre orientation (degrees)
Sheet
Laminated
Ply number (Ply 10 is the outer ply)
1 2 3 4 5 6 7 8 9 10
BJ ± 20 ± 20 ± 20 ± 45 ± 45 ± 45 0 0 0 0
1C ± 30 ± 30 ± 30 ± 45 ± 45 0 0 0
D1 ± 45 ± 45 ± 45 ± 45 ± 45 0 0 0
B ± 15 ± 15 ± 45 ± 45 ± 45 ± 30 ± 30 ± 30 0 0
E2 ± 30 ± 30 ± 30 ± 45 ± 45 ± 25 ± 25 ± 25 0 0
AY ± 25 ± 25 ± 60 ± 60 ± 45 ± 45 0 0
0.5
0.51
0.52
0.53
0.54
0.55
0.56
0.57
326
327
328
329
330
331
332
333
334
335
336
337
0 50 100 150
Vo
lum
e F
ract
ion
Fre
qu
en
cy (
CP
M)
Orientation (degrees)
Frequency
Volume Fraction
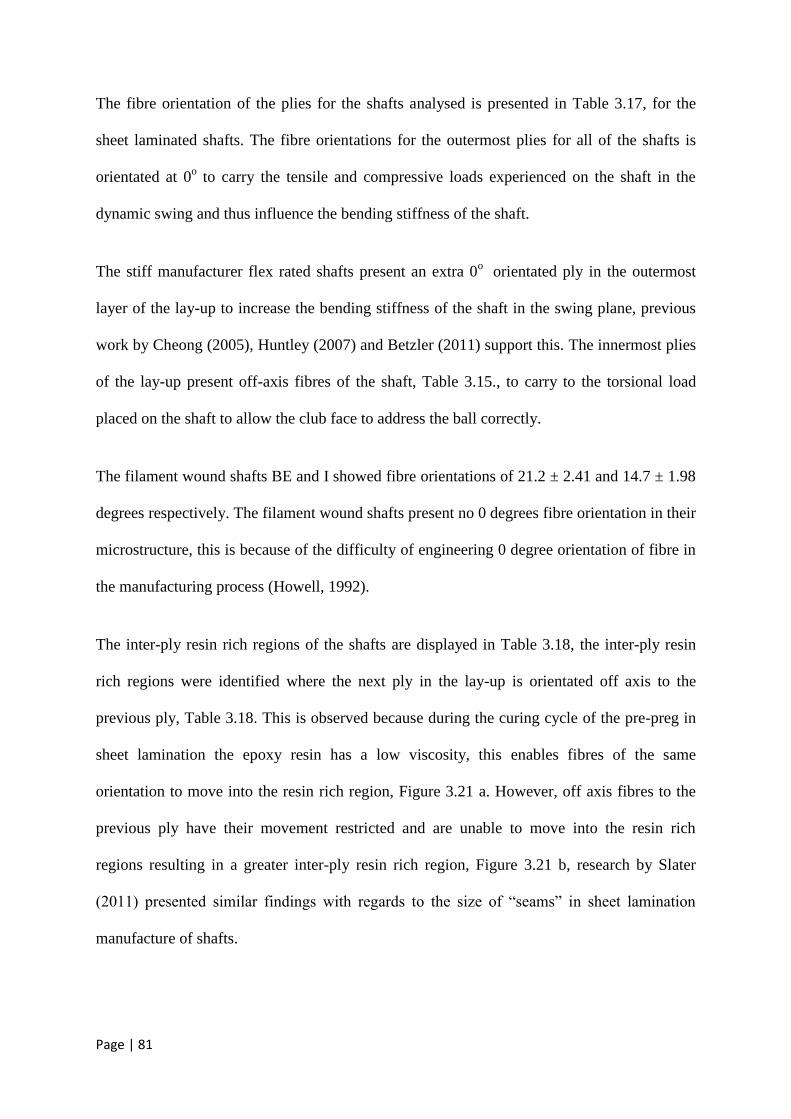
Page | 81
The fibre orientation of the plies for the shafts analysed is presented in Table 3.17, for the
sheet laminated shafts. The fibre orientations for the outermost plies for all of the shafts is
orientated at 0o to carry the tensile and compressive loads experienced on the shaft in the
dynamic swing and thus influence the bending stiffness of the shaft.
The stiff manufacturer flex rated shafts present an extra 0o
orientated ply in the outermost
layer of the lay-up to increase the bending stiffness of the shaft in the swing plane, previous
work by Cheong (2005), Huntley (2007) and Betzler (2011) support this. The innermost plies
of the lay-up present off-axis fibres of the shaft, Table 3.15., to carry to the torsional load
placed on the shaft to allow the club face to address the ball correctly.
The filament wound shafts BE and I showed fibre orientations of 21.2 ± 2.41 and 14.7 ± 1.98
degrees respectively. The filament wound shafts present no 0 degrees fibre orientation in their
microstructure, this is because of the difficulty of engineering 0 degree orientation of fibre in
the manufacturing process (Howell, 1992).
The inter-ply resin rich regions of the shafts are displayed in Table 3.18, the inter-ply resin
rich regions were identified where the next ply in the lay-up is orientated off axis to the
previous ply, Table 3.18. This is observed because during the curing cycle of the pre-preg in
sheet lamination the epoxy resin has a low viscosity, this enables fibres of the same
orientation to move into the resin rich region, Figure 3.21 a. However, off axis fibres to the
previous ply have their movement restricted and are unable to move into the resin rich
regions resulting in a greater inter-ply resin rich region, Figure 3.21 b, research by Slater
(2011) presented similar findings with regards to the size of “seams” in sheet lamination
manufacture of shafts.
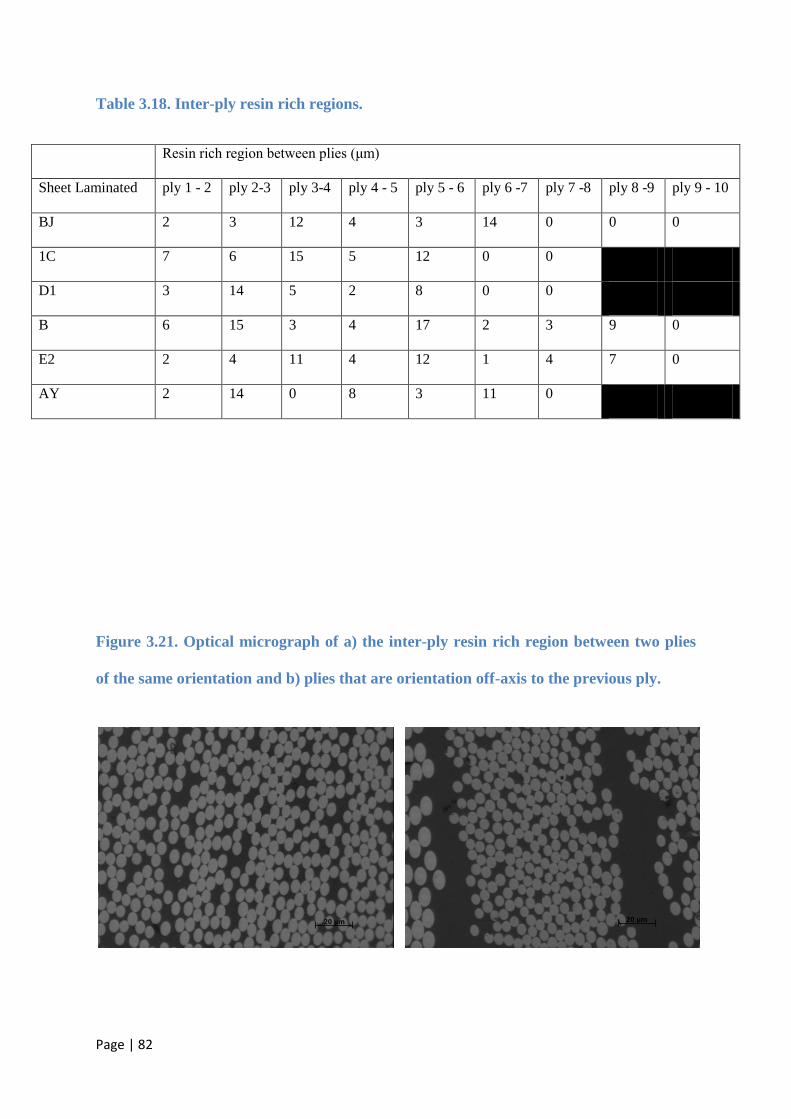
Page | 82
Table 3.18. Inter-ply resin rich regions.
Resin rich region between plies (μm)
Sheet Laminated ply 1 - 2 ply 2-3 ply 3-4 ply 4 - 5 ply 5 - 6 ply 6 -7 ply 7 -8 ply 8 -9 ply 9 - 10
BJ 2 3 12 4 3 14 0 0 0
1C 7 6 15 5 12 0 0
D1 3 14 5 2 8 0 0
B 6 15 3 4 17 2 3 9 0
E2 2 4 11 4 12 1 4 7 0
AY 2 14 0 8 3 11 0
Figure 3.21. Optical micrograph of a) the inter-ply resin rich region between two plies
of the same orientation and b) plies that are orientation off-axis to the previous ply.
20 µm 20 µm
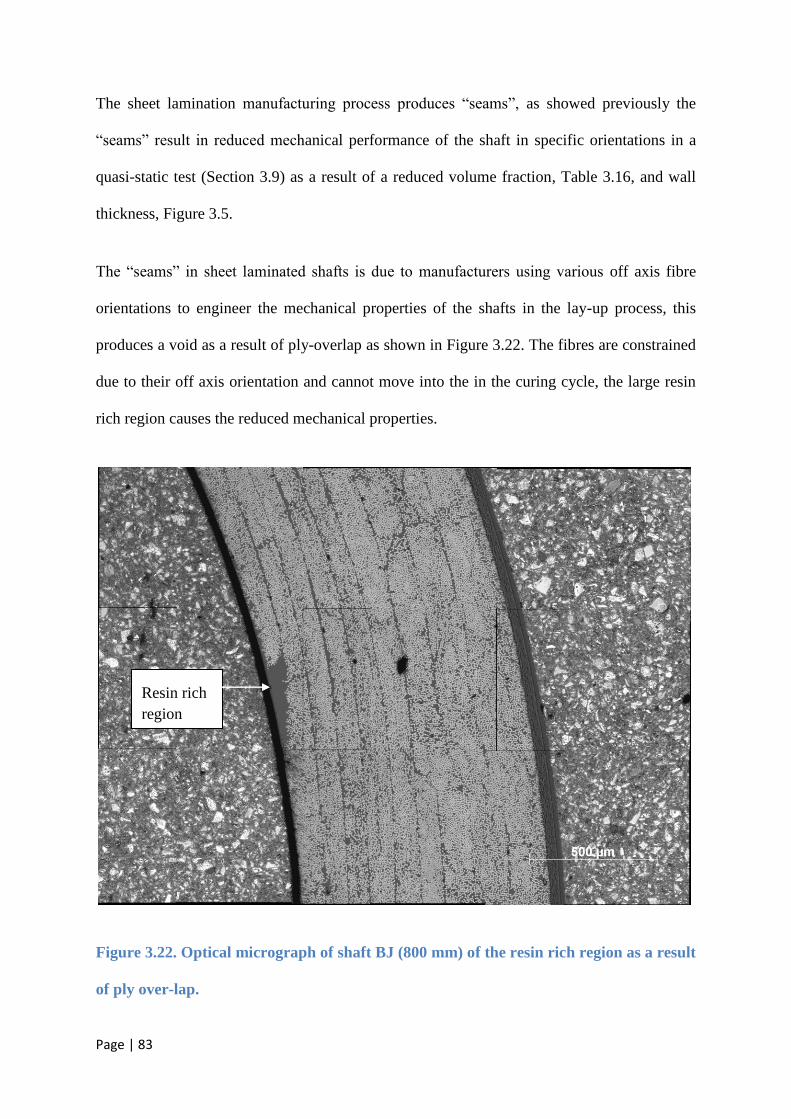
Page | 83
The sheet lamination manufacturing process produces “seams”, as showed previously the
“seams” result in reduced mechanical performance of the shaft in specific orientations in a
quasi-static test (Section 3.9) as a result of a reduced volume fraction, Table 3.16, and wall
thickness, Figure 3.5.
The “seams” in sheet laminated shafts is due to manufacturers using various off axis fibre
orientations to engineer the mechanical properties of the shafts in the lay-up process, this
produces a void as a result of ply-overlap as shown in Figure 3.22. The fibres are constrained
due to their off axis orientation and cannot move into the in the curing cycle, the large resin
rich region causes the reduced mechanical properties.
Figure 3.22. Optical micrograph of shaft BJ (800 mm) of the resin rich region as a result
of ply over-lap.
Resin rich
region
Page | 84
4. Conclusions
The dimensional intra-batch variation of the shaft during manufacture on the length,
mass, taper and wall thickness can result in a 2.9, 5.56, 6.6 and 0.7 % increase in the
frequency of the shaft respectively.
The dimensional analysis of the shafts with respect to the manufacturer’s flex rating
presented significant engineering of the length, taper and wall thickness (p = 0.0039,
0.035 and 0.019 respectively) between the ladies and regular flex. Though, no
significance was analysed between the dimension of the regular and stiff flex shafts.
The stiffness of the shafts ranged from 144.2 – 381.8 N/m and 242.1 – 536.3 N/m at a
single and variable cantilever length respectively, the manufacture’s flex rated shafts
present significant mean stiffness values between the ladies – regular and regular -
stiff flex rated shafts (p = 0.0059 and 0.0032 respectively).
Kickpoints range from 46.5 – 53.1 % and 45 – 52.9 % for the single and variable
cantilever lengths respectively, the position of the greatest strain (1710 μm) along the
shaft length is located at the kickpoint position of the shaft in a static bending test.
The frequency variation around the circumference of the shaft was greatest for shafts
manufactured by sheet lamination compared to those of filament winding (4.8 % and
0.2 % respectively), the variation of the frequency around the circumference of the
sheet laminated shafts could result in a frequency variation of 0.7 %.
Kickpoint analysis of the shafts at low stiffness orientations (00
to the “seam”
orientation) and high stiffness orientation (900
to the “seam” orientation) presented no
measurable change.
Page | 85
Stiffness profile on kickpoint of the shaft analysed via linear regression presented a
strong negative correlation with the kickpoint position along the shaft’s length (R2
=
0.77).
The size of the inter-ply resin rich regions are dependent on the fibre orientation in the
lay-up process, fibre orientations off-axis to the previous ply showed measurable resin
rich regions as a result constrained fibres in the curing process.
The “seams” caused in the manufacture process result in significant mechanical
property variation around the shaft due to a reduction of the fibre volume fraction
compared to that of the mean volume fraction by 8.9 %.
Page | 86
5. Further Work
Whilst this study has characterised the influence of parameters such as wall thickness,
diameter and modulus on the stiffness profile and the subsequent kickpoint position in
commercial shafts, the study has also identified a number of key areas for further research in
the identification and behaviour of the kickpoint in the composite golf shaft.
The commercial shafts in this study were examined via static and quasi-static analysis, yet the
golf swing is dynamic. Thus strain rate analysis of the commercial shafts over the strain rates
experienced in the dynamic swing of 0.09 s-1
(Betzler, 2009), though strain rate analysis has
been performed on the influence of strain rate on stiffness (Huntley, 207) it has yet been
confirmed the influence on the kickpoint position of the shaft.
Finite Element Modelling (FEM) of shafts with various taper designs and ply lay-up to
analyse the stiffness profile of the shaft and subsequent kickpoint position, using strain rate
analysis of the composite shafts the dynamic mechanical performance of the shaft can
predicted.
This study has shown that the kickpoint position is the result of the gradient of the stiffness
profile. Using this knowledge a range of composite shafts can be manufactured to produce
the extreme kickpoint positions for composite shafts viable for the commercial market. The
manufactured shafts could then be tested to investigate the influence of kickpoint position on
dynamic loft, club head speed and drive distance.

Page | 87
6. Appendix
Table 6.1. List of Materials.
Manufacturer Shaft Stiffness Rating Manufacturer Shaft Stiffness Rating Manufacturer Shaft Stiffness Rating
1 A1 Regular 2 I Ladies 7 AH Stiff
1 A2 Regular 2 J Regular 8 AK Stiff
1 A3 Regular 3 K1 Regular 9 AO Stiff
1 A4 Regular 3 K2 Regular 10 AS Stiff
1 B Regular 3 K3 Regular 11 AV Ladies
1 C1 Regular 3 K4 Regular 12 AY Ladies
1 C2 Regular 3 L1 Ladies 13 BE Ladies
1 C3 Regular 3 L2 Ladies 14 BH1 Regular
1 D1 Stiff 3 M1 Ladies 14 BH2 Regular
1 D2 Stiff 3 M2 Ladies 14 BH3 Regular
1 E1 Regular 3 AU1 Regular 14 BI1 Ladies
1 E2 Regular 3 AU2 Regular 14 BI2 Ladies
1 E3 Regular 4 P Stiff 14 BJ Stiff
1 F1 Regular 5 R Stiff 14 BK1 Regular
1 F2 Regular 5 T Ladies 14 BK2 Regular
1 F3 Regular 6 AB Ladies
1 F4 Regular 7 AD Ladies
1 G1 Ladies 7 AE Ladies
1 G2 Ladies 7 AF1 Stiff
1 G3 Ladies 7 AF2 Stiff
1 G4 Ladies 7 AG Regular
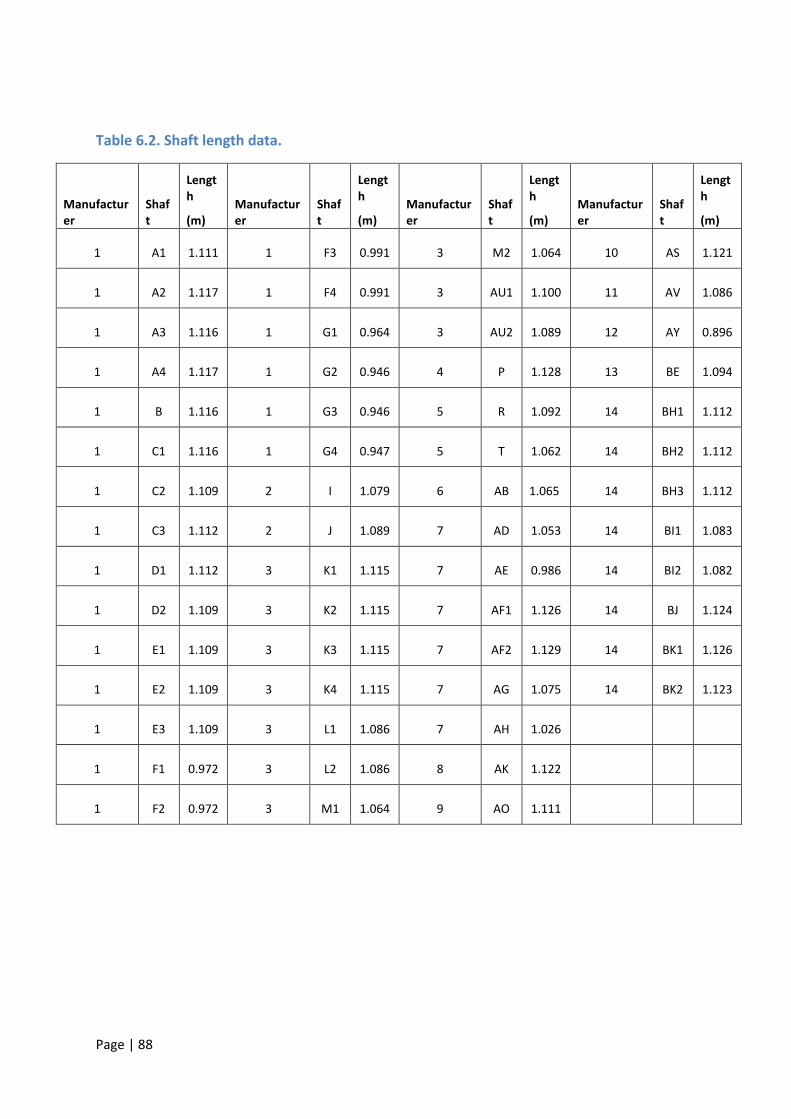
Page | 88
Table 6.2. Shaft length data.
Manufacturer
Shaft
Length
(m) Manufacturer
Shaft
Length
(m) Manufacturer
Shaft
Length
(m) Manufacturer
Shaft
Length
(m)
1 A1 1.111 1 F3 0.991 3 M2 1.064 10 AS 1.121
1 A2 1.117 1 F4 0.991 3 AU1 1.100 11 AV 1.086
1 A3 1.116 1 G1 0.964 3 AU2 1.089 12 AY 0.896
1 A4 1.117 1 G2 0.946 4 P 1.128 13 BE 1.094
1 B 1.116 1 G3 0.946 5 R 1.092 14 BH1 1.112
1 C1 1.116 1 G4 0.947 5 T 1.062 14 BH2 1.112
1 C2 1.109 2 I 1.079 6 AB 1.065 14 BH3 1.112
1 C3 1.112 2 J 1.089 7 AD 1.053 14 BI1 1.083
1 D1 1.112 3 K1 1.115 7 AE 0.986 14 BI2 1.082
1 D2 1.109 3 K2 1.115 7 AF1 1.126 14 BJ 1.124
1 E1 1.109 3 K3 1.115 7 AF2 1.129 14 BK1 1.126
1 E2 1.109 3 K4 1.115 7 AG 1.075 14 BK2 1.123
1 E3 1.109 3 L1 1.086 7 AH 1.026
1 F1 0.972 3 L2 1.086 8 AK 1.122
1 F2 0.972 3 M1 1.064 9 AO 1.111
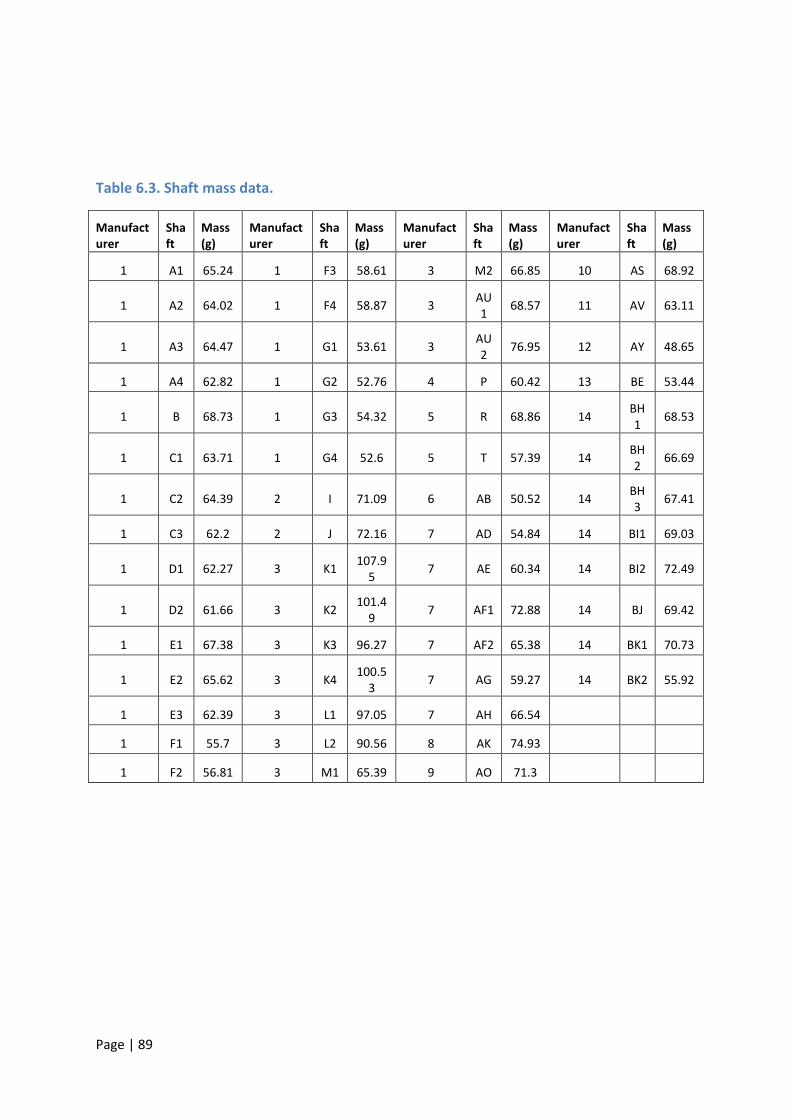
Page | 89
Table 6.3. Shaft mass data.
Manufacturer
Shaft
Mass (g)
Manufacturer
Shaft
Mass (g)
Manufacturer
Shaft
Mass (g)
Manufacturer
Shaft
Mass (g)
1 A1 65.24 1 F3 58.61 3 M2 66.85 10 AS 68.92
1 A2 64.02 1 F4 58.87 3 AU1
68.57 11 AV 63.11
1 A3 64.47 1 G1 53.61 3 AU2
76.95 12 AY 48.65
1 A4 62.82 1 G2 52.76 4 P 60.42 13 BE 53.44
1 B 68.73 1 G3 54.32 5 R 68.86 14 BH1
68.53
1 C1 63.71 1 G4 52.6 5 T 57.39 14 BH2
66.69
1 C2 64.39 2 I 71.09 6 AB 50.52 14 BH3
67.41
1 C3 62.2 2 J 72.16 7 AD 54.84 14 BI1 69.03
1 D1 62.27 3 K1 107.9
5 7 AE 60.34 14 BI2 72.49
1 D2 61.66 3 K2 101.4
9 7 AF1 72.88 14 BJ 69.42
1 E1 67.38 3 K3 96.27 7 AF2 65.38 14 BK1 70.73
1 E2 65.62 3 K4 100.5
3 7 AG 59.27 14 BK2 55.92
1 E3 62.39 3 L1 97.05 7 AH 66.54
1 F1 55.7 3 L2 90.56 8 AK 74.93
1 F2 56.81 3 M1 65.39 9 AO 71.3
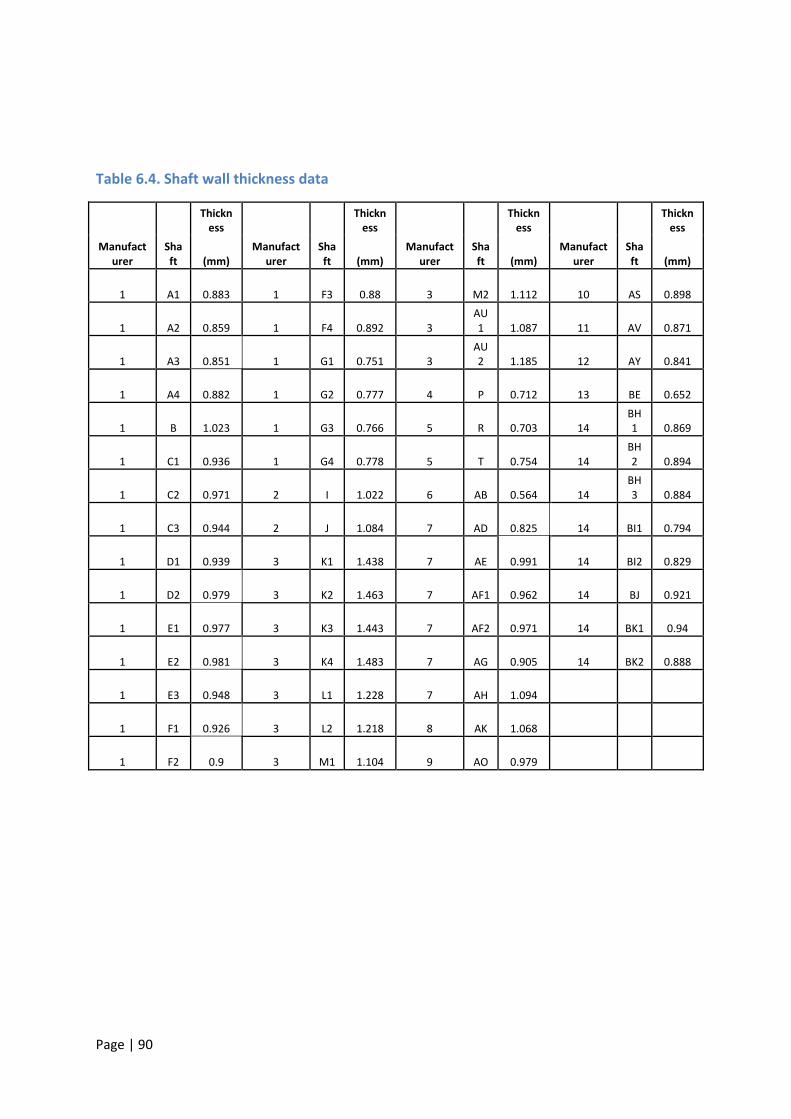
Page | 90
Table 6.4. Shaft wall thickness data
Manufacturer
Shaft
Thickness
Manufacturer
Shaft
Thickness
Manufacturer
Shaft
Thickness
Manufacturer
Shaft
Thickness
(mm) (mm) (mm) (mm)
1 A1 0.883 1 F3 0.88 3 M2 1.112 10 AS 0.898
1 A2 0.859 1 F4 0.892 3 AU1 1.087 11 AV 0.871
1 A3 0.851 1 G1 0.751 3 AU2 1.185 12 AY 0.841
1 A4 0.882 1 G2 0.777 4 P 0.712 13 BE 0.652
1 B 1.023 1 G3 0.766 5 R 0.703 14 BH1 0.869
1 C1 0.936 1 G4 0.778 5 T 0.754 14 BH2 0.894
1 C2 0.971 2 I 1.022 6 AB 0.564 14 BH3 0.884
1 C3 0.944 2 J 1.084 7 AD 0.825 14 BI1 0.794
1 D1 0.939 3 K1 1.438 7 AE 0.991 14 BI2 0.829
1 D2 0.979 3 K2 1.463 7 AF1 0.962 14 BJ 0.921
1 E1 0.977 3 K3 1.443 7 AF2 0.971 14 BK1 0.94
1 E2 0.981 3 K4 1.483 7 AG 0.905 14 BK2 0.888
1 E3 0.948 3 L1 1.228 7 AH 1.094
1 F1 0.926 3 L2 1.218 8 AK 1.068
1 F2 0.9 3 M1 1.104 9 AO 0.979
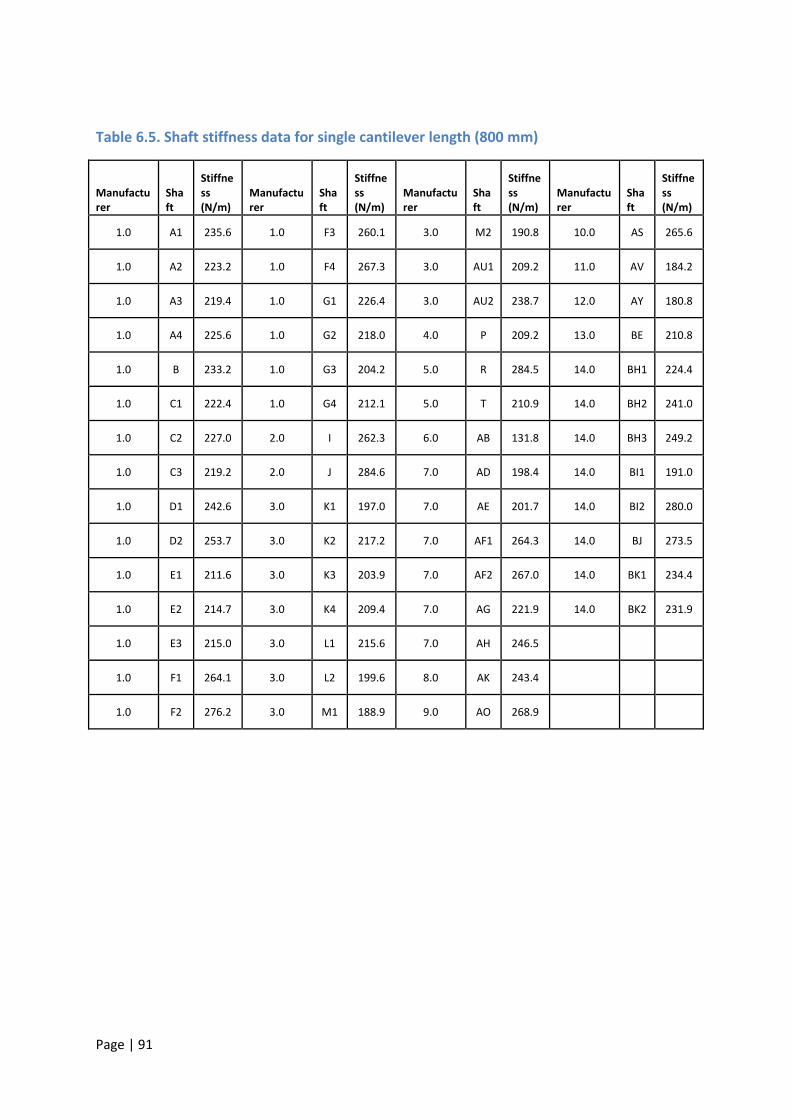
Page | 91
Table 6.5. Shaft stiffness data for single cantilever length (800 mm)
Manufacturer
Shaft
Stiffness (N/m)
Manufacturer
Shaft
Stiffness (N/m)
Manufacturer
Shaft
Stiffness (N/m)
Manufacturer
Shaft
Stiffness (N/m)
1.0 A1 235.6 1.0 F3 260.1 3.0 M2 190.8 10.0 AS 265.6
1.0 A2 223.2 1.0 F4 267.3 3.0 AU1 209.2 11.0 AV 184.2
1.0 A3 219.4 1.0 G1 226.4 3.0 AU2 238.7 12.0 AY 180.8
1.0 A4 225.6 1.0 G2 218.0 4.0 P 209.2 13.0 BE 210.8
1.0 B 233.2 1.0 G3 204.2 5.0 R 284.5 14.0 BH1 224.4
1.0 C1 222.4 1.0 G4 212.1 5.0 T 210.9 14.0 BH2 241.0
1.0 C2 227.0 2.0 I 262.3 6.0 AB 131.8 14.0 BH3 249.2
1.0 C3 219.2 2.0 J 284.6 7.0 AD 198.4 14.0 BI1 191.0
1.0 D1 242.6 3.0 K1 197.0 7.0 AE 201.7 14.0 BI2 280.0
1.0 D2 253.7 3.0 K2 217.2 7.0 AF1 264.3 14.0 BJ 273.5
1.0 E1 211.6 3.0 K3 203.9 7.0 AF2 267.0 14.0 BK1 234.4
1.0 E2 214.7 3.0 K4 209.4 7.0 AG 221.9 14.0 BK2 231.9
1.0 E3 215.0 3.0 L1 215.6 7.0 AH 246.5
1.0 F1 264.1 3.0 L2 199.6 8.0 AK 243.4
1.0 F2 276.2 3.0 M1 188.9 9.0 AO 268.9
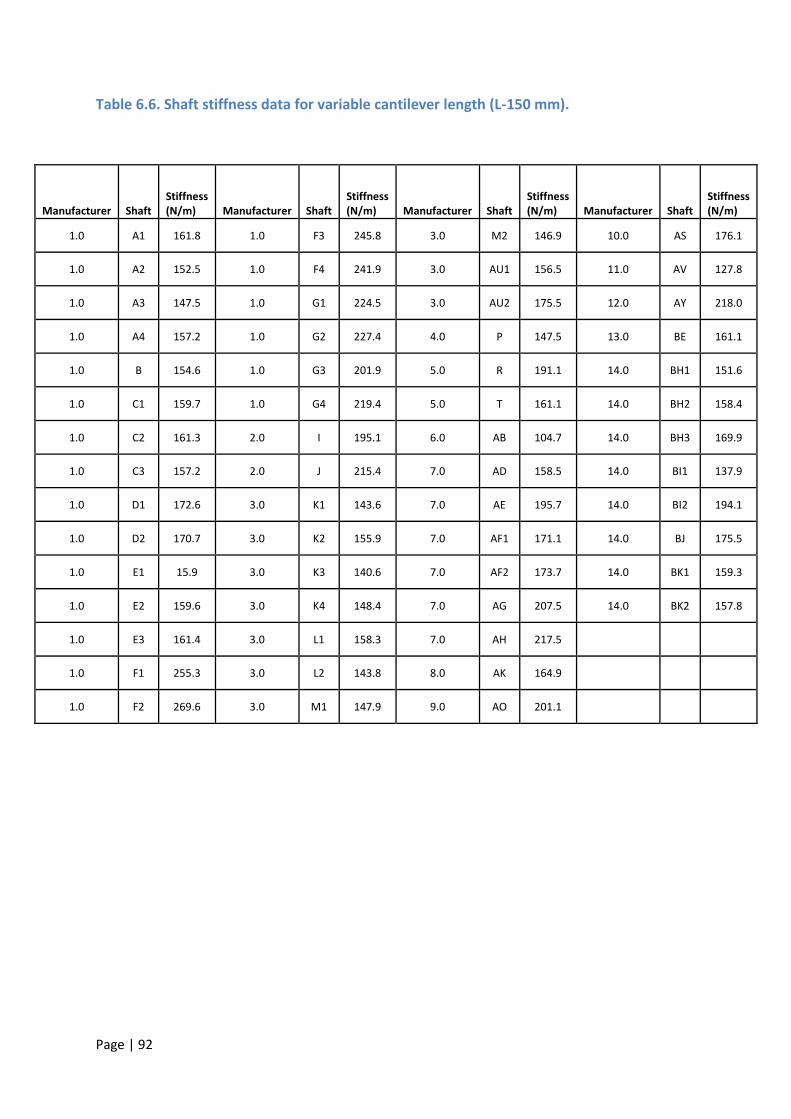
Page | 92
Table 6.6. Shaft stiffness data for variable cantilever length (L-150 mm).
Manufacturer Shaft Stiffness (N/m) Manufacturer Shaft
Stiffness (N/m) Manufacturer Shaft
Stiffness (N/m) Manufacturer Shaft
Stiffness (N/m)
1.0 A1 161.8 1.0 F3 245.8 3.0 M2 146.9 10.0 AS 176.1
1.0 A2 152.5 1.0 F4 241.9 3.0 AU1 156.5 11.0 AV 127.8
1.0 A3 147.5 1.0 G1 224.5 3.0 AU2 175.5 12.0 AY 218.0
1.0 A4 157.2 1.0 G2 227.4 4.0 P 147.5 13.0 BE 161.1
1.0 B 154.6 1.0 G3 201.9 5.0 R 191.1 14.0 BH1 151.6
1.0 C1 159.7 1.0 G4 219.4 5.0 T 161.1 14.0 BH2 158.4
1.0 C2 161.3 2.0 I 195.1 6.0 AB 104.7 14.0 BH3 169.9
1.0 C3 157.2 2.0 J 215.4 7.0 AD 158.5 14.0 BI1 137.9
1.0 D1 172.6 3.0 K1 143.6 7.0 AE 195.7 14.0 BI2 194.1
1.0 D2 170.7 3.0 K2 155.9 7.0 AF1 171.1 14.0 BJ 175.5
1.0 E1 15.9 3.0 K3 140.6 7.0 AF2 173.7 14.0 BK1 159.3
1.0 E2 159.6 3.0 K4 148.4 7.0 AG 207.5 14.0 BK2 157.8
1.0 E3 161.4 3.0 L1 158.3 7.0 AH 217.5
1.0 F1 255.3 3.0 L2 143.8 8.0 AK 164.9
1.0 F2 269.6 3.0 M1 147.9 9.0 AO 201.1
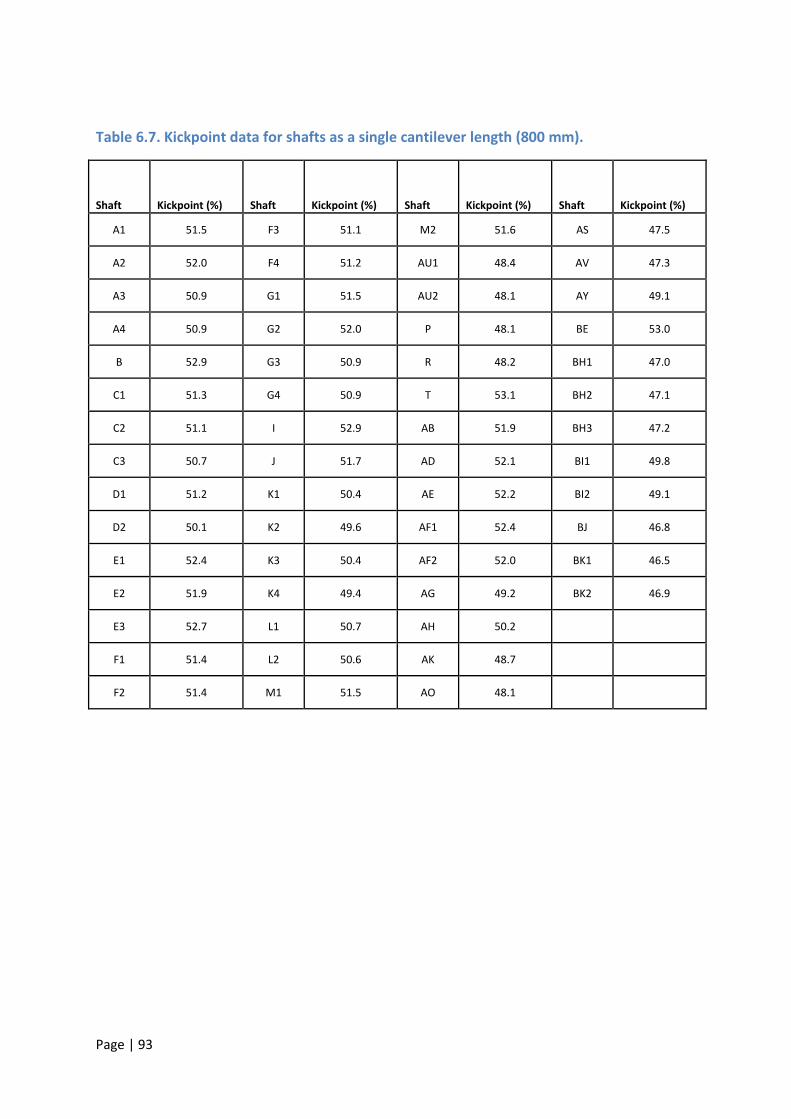
Page | 93
Table 6.7. Kickpoint data for shafts as a single cantilever length (800 mm).
Shaft Kickpoint (%) Shaft Kickpoint (%) Shaft Kickpoint (%) Shaft Kickpoint (%)
A1 51.5 F3 51.1 M2 51.6 AS 47.5
A2 52.0 F4 51.2 AU1 48.4 AV 47.3
A3 50.9 G1 51.5 AU2 48.1 AY 49.1
A4 50.9 G2 52.0 P 48.1 BE 53.0
B 52.9 G3 50.9 R 48.2 BH1 47.0
C1 51.3 G4 50.9 T 53.1 BH2 47.1
C2 51.1 I 52.9 AB 51.9 BH3 47.2
C3 50.7 J 51.7 AD 52.1 BI1 49.8
D1 51.2 K1 50.4 AE 52.2 BI2 49.1
D2 50.1 K2 49.6 AF1 52.4 BJ 46.8
E1 52.4 K3 50.4 AF2 52.0 BK1 46.5
E2 51.9 K4 49.4 AG 49.2 BK2 46.9
E3 52.7 L1 50.7 AH 50.2
F1 51.4 L2 50.6 AK 48.7
F2 51.4 M1 51.5 AO 48.1
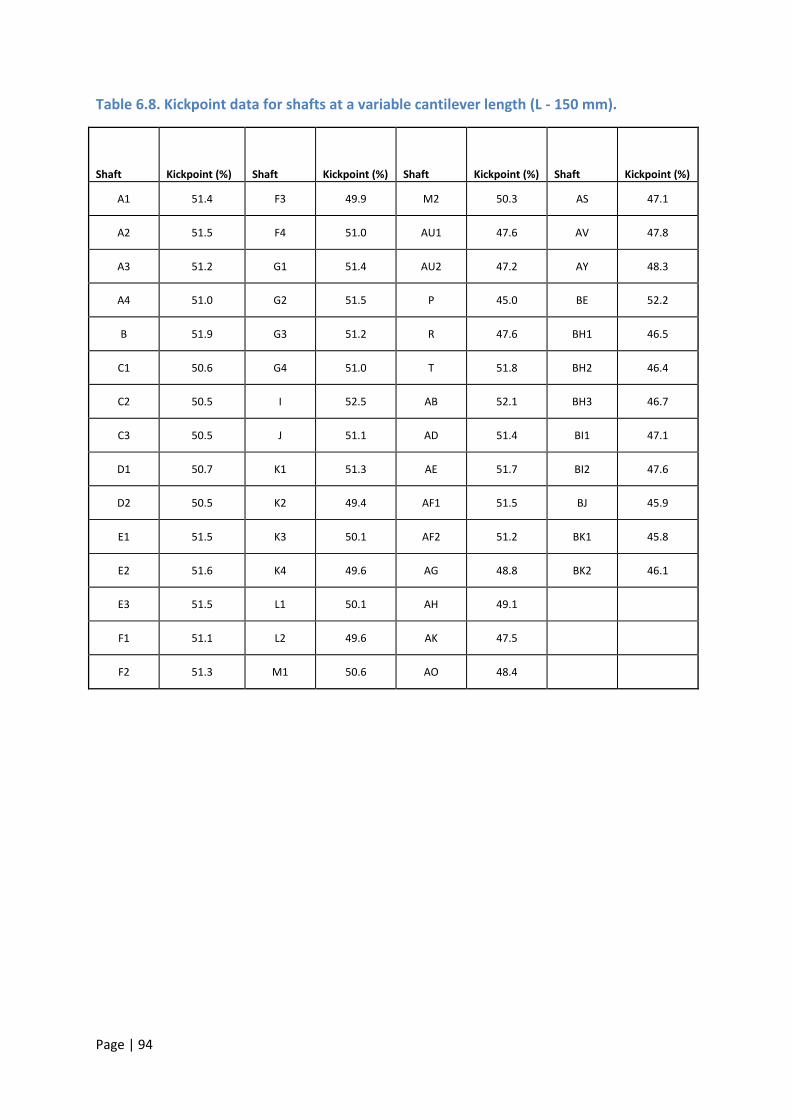
Page | 94
Table 6.8. Kickpoint data for shafts at a variable cantilever length (L - 150 mm).
Shaft Kickpoint (%) Shaft Kickpoint (%) Shaft Kickpoint (%) Shaft Kickpoint (%)
A1 51.4 F3 49.9 M2 50.3 AS 47.1
A2 51.5 F4 51.0 AU1 47.6 AV 47.8
A3 51.2 G1 51.4 AU2 47.2 AY 48.3
A4 51.0 G2 51.5 P 45.0 BE 52.2
B 51.9 G3 51.2 R 47.6 BH1 46.5
C1 50.6 G4 51.0 T 51.8 BH2 46.4
C2 50.5 I 52.5 AB 52.1 BH3 46.7
C3 50.5 J 51.1 AD 51.4 BI1 47.1
D1 50.7 K1 51.3 AE 51.7 BI2 47.6
D2 50.5 K2 49.4 AF1 51.5 BJ 45.9
E1 51.5 K3 50.1 AF2 51.2 BK1 45.8
E2 51.6 K4 49.6 AG 48.8 BK2 46.1
E3 51.5 L1 50.1 AH 49.1
F1 51.1 L2 49.6 AK 47.5
F2 51.3 M1 50.6 AO 48.4

Page | 95
References
Ashby, M. F. (1999). Materials selection in mechanical design, 2nd ed (pp. 376 - 405),
Butterworth Heinemann, London.
Betzler, N. F. (2010). The Effect of Differing Shaft Dynamics on the Biomechanics of
the Golf Swing. PhD thesis, Edinburgh Napier University.
Betzler, N. F., Slater, C., Strangwood, M., Monk, A., Otto, S., & Wallace, E. (2011). The
Static and dynamic stiffness behaviour of composite golf shafts and their constituent
materials. Sports Engineering, 14 (1), 27 – 37.
Brouillette, M. (2002). On measuring the flexural rigidity distribution of golf shafts. In
E. Thain (Ed.), Science and Golf IV: Proceedings of the World Scientific Congress of
Golf (pp. 387-401). London: Routledge.
Butler, J. H., & Winfield, D. (1994). The dynamic performance of the golf shaft during
the downswing. In: A. .J. Cochran, M. R. Farrally. Science and Golf II: Proceedings of
the world scientific congress of golf (pp. 259 – 264), 1st eden. E & F Spon, London,
UK.
Butler, J. H., & Winfield, D. (1995). What shaft is best for you? In A. J. Cochran (Ed.),
Golf - the scientific way (pp. 113-115). Hemel Hempstead: Aston.
Chen, C., Inoue, Y., & Shibata, K. (2005). Study on the interaction between human
arms and golf clubs in the golf downswing. In A. Subic & S. Ujihashi (Eds.), The impact
of technology on sport (pp. 175-180). Melbourne: Australasian technology Alliance.
Cheong, S. K., Kang, K. W., et al. (2005). Evaluation of the mechanical performance of
golf shafts. Engineering Failure Analysis.

Page | 96
Chou, A., & Roberts, O. C. (1994). Golf shaft flex point - an analysis of measurement
techniques. In A. J. Cochran & M. R. Farrally (Eds.), Science and golf II (pp. 278-283).
London: E & FN Spon
Gilat, A., Goldberg, R. K. & Roberts, G.D. (2002). Experimental study of strain-rate
dependent behaviour of carbon/epoxy composite. Composite Science and
Technology. 1469 -1476.
Horwood, G. P. (1994). Golf shafts - a technical perspective. In A. J. Cochran & M. R.
Farrally (Eds.), Science and Golf II (pp. 247-258). London: E & FN Spon.
Horwood, G. (1994). Flexes, bend points and torques. Golf The Scientific Way. A.J.
Cochran, Aston Publishing Group: 103-115.
Howell, D. D. (1992). The Design of Filament Wound Graphite/Epoxy Golf Shafts. In
G. Grimes (Ed.), Materials Working for You in the 21st Century. 37th International
SAMPE symposium (pp. 1392-1405). Anaheim: SAMPE.
Hull, D. & Clyne, T. W. (1996), An Introduction to Composite Materials, 2nd ed,
Cambridge University Press, Cambridge.
Huntley, M. P. (2007). Comparison of Static and Dynamic Carbon Fibre Composite
Golf Club Shaft Properties and their Dependence on Structure. PhD thesis, University
of Birmingham
Huntley, M. P., Davis, C. L., Strangwood, M., & Otto, S. R. (2006). Comparison of the
static and dynamic behaviour of carbon fibre composite golf club shafts. Proceedings
of the Institution of Mechanical Engineers Part LJournal of Materials-Design and
Applications, 220(L4), 229-236.
MacKenzie, S. J. (2005). Understanding the role of shaft stiffness in the golf Swing.
PhD Thesis, University of Saskatchewan.
Page | 97
Mackenzie, S. J., & Sprigings, E. J. (2009). Understanding the role of shaft stiffness in
the golf swing. Sport Engineering, 12, 13-19
Maltby, R. D. (1995). Golf club design, fitting, alteration, and repair: the principles
and procedures (Rev. 4th ed.). Newark, OH: R. Maltby Enterprises
Mather, J. S. B., & Jowett, S. (2000). Three dimensional shape of the golf club during
the swing. In A. Subic & S. Haake (Eds.), The Engineering of Sport (pp. 77-85).
London: Blackwell Science.
Matthews, F. L. And Rawlings, E. R. D. (1994). Composite materials: Engineering and
science, Woodhead publishing limited.
Milne, R. D. (1990). What is the role of the golf shaft in the golf swing? Science and
golf. (pp. 252-257). E&FN SPON.
Milne, R. D., & Davis, J. P. (1992). The role of the shaft in the golf swing. Journal of
Biomechanics, 25(9), 975-983.
Newman, S., Clay, S., & Strickland, P. (1997). The dynamic flexing of a golf club shaft
during a typical swing. In Fourth Annual Conference on Mechatronics and Machine
Vision in Practice, Proceedings (pp. 265-270).
Painter, P. C. & Coleman, M. M. (2009). The Essentials of Polymer Science and
Engineering. DEStech Publications.
Penner, A. R. (2003). The physics of golf. Reports on Progress in Physics, 66(2), 131-
171.
Stanbridge, K., Jones, R., & Mitchell, S. (2004). The effect of shaft flexibility on junior
golfers' performance. Journal of Sports Sciences, 22(5), 457-464.
Strangwood, M. (2003). PGA Technical Manual. PGA, The Belfry.
Summitt, J. (2000). The modern guide to shaft fitting. Dynacraft. Ohio.
Page | 98
Tsujiuchi, N., Koizumi, T., & Tomii, Y. (2002). Analysis of the influence of golf club
design on the golf swing. In S. Ujihashi & S. Haake (Eds.), The Engineering of Sport 4
(pp. 537-544). Oxford: Blackwell.
Wallace, E. S., & Hubbell, J. E. (2001). The effect of golf club shaft stiffness on golf
performance variables - implications for club-fitting. Paper presented at the
Materials & Science in Sports Symposium, Coronado Island Marriott Resort,
Coronado, California.
Wallace, E. S., Otto, S. R., & Nevill, A. (2007). Ball launch conditions for skilled golfers
using drivers of different lengths in an indoor testing facility. Journal of Sports
Sciences, 25(7), 731 - 737.
Werner, F. D. and Greig, R. C. (2001). Behaviour of golf club shafts. How golf clubs
really work and how to optimise their design, Origin Inc.
Worobets, J. T., & Stefanyshyn, D. J. (2008). Shaft stiffness: implications for club
fitting. In D. J. Crews & R. Lutz (Eds.), Science and Golf V (pp. 431- 437). Mesa, AZ:
Energy in Motion.