Embed Size (px)
Citation preview
1
The Analysis of Primary Aromatic Amines in Ink Using the ACQUITY UPLC H-Class System with the SQ Detector 2 and MassLynx Software Jane Cooper, Eleanor Riches, and Kate WilliamsWaters Corporation, Manchester, UK
IN T RO DU C T IO N
PAAs are widely used in high amounts as a chemical feed stock within the
chemical industry, and many of them are highly toxic to humans.1,2,3 PAAs can
be used to produce many commodities, such as pharmaceuticals, pesticides,
explosives, epoxy polymers, rubber, aromatic polyurethane products, and
azo-dyes. They can be found in final products due to incomplete reactions, as
impurities, by-products, or as degradation products. PAAs can be produced as
by-products of azo dyes, which are a diverse and widely used group of organic
dyes. Azo dyes have a wide range of uses including special paints, printing inks,
varnishes, and adhesives; and can be found in many products such as textiles,
cosmetics, plastics, and also in food contact material.
The inks and dyes industry is highly legislated and manufacturers that use these
materials must monitor and quantify various regulated parameters, such as the
presence or absence of PAAs.
Previous example methodologies for the analysis of PAAs include: GC/MS
analysis following ion-pair extraction with bis-2-ethyl phosphate followed by
derivatization with isobutyl chloroformate;4,5 UPLC® analysis following a
solid phase extraction (SPE) using cation-exchange cartridges;6 and reduction by
liquid phase sorbent trapping followed by thermal desorption GC/MS analysis.7
Many previously used methods for PAA analysis lack robustness, selectivity,
and sensitivity, and require lengthy, costly and time-consuming pre-treatments
(derivatization, SPE).
Many PAAs have either a proven or suspected carcinogenic nature and are
highly toxic, so there are a range of potential health risks that have led to strict
worldwide regulations. U.S. FDA regulations (21 CFR 74.705 and 21 CFR 74.706)
restrict the use of azo dyes that could degrade to PAAs; whereas EU regulations
(commission directive 2002/72/EC and the amendment 2007/19/EC) set
legislative limits for the release of total PAAs from food contact material.
Analytical laboratories require accurate and robust techniques to ensure
confidence and versatility in meeting these legislative requirements.
The SQ Detector 2 offers a flexible solution for the ink and dyes industry.
WAT E R S SO LU T IO NS
ACQUITY UPLC® H-Class System
SQ Detector 2
MassLynx™ Software
K E Y W O R D S
Primary Aromatic Amines, PAAs,
azo dyes, ink
A P P L I C AT IO N B E N E F I T S
This application provides improved confidence
in the identification and quantification of
Primary Aromatic Amines (PAAs) offering:
■■ Increased sample throughput and a reduction
of solvent usage due to reduced run times.
■■ Improved sensitivity, selectivity,
and robustness, compared with existing
methodologies.
■■ The ultimate in chromatographic resolution
and sensitivity.
■■ Cost-effective, reliable mass confirmation.

2The Analysis of Primary Aromatic Amines in Ink Using the ACQUITY UPLC H-Class System with the SQ Detector 2 and MassLynx Software
This application note describes the use of Waters® ACQUITY UPLC H-Class
coupled with the SQ Detector 2 for the rapid analysis of PAAs in ink.
Time (min) Flow rate (mL/min) %A %B Curve
1 Initial 0.50 95 5 -
2 1.00 0.50 95 5 6
3 3.10 0.50 75 25 6
4 6.10 0.50 59 41 6
5 8.00 0.50 0 100 6
6 9.00 0.50 0 100 6
7 9.01 0.50 95 5 6
8 10.00 0.50 95 5 6
Table 1. ACQUITY UPLC H-Class mobile phase gradient.
Variables such as cone voltages, desolvation gas (temperature and flow rate),
and cone gas flow rate were optimized using solvent standards. The list of PAAs,
associated CAS number, expected retention times, and cone voltages are
detailed in Table 2. The established SIR MS method is illustrated in Figure 1.
E X P E R IM E N TA L
Sample preparation
Ink analysis■■ Neat ink diluted 1:100
with 5% methanol/95% water.
■■ Diluted ink samples were transferred
to LC vials for analysis.
Paper analysis■■ For each experiment 10 cm x 10 cm pieces
of paper were cut up and extracted with
100 mL of water for over 24 hours.
■■ Aliquots were transferred into LC vials for analysis.
LC conditions
LC system: ACQUITY UPLC H-Class
Runtime: 10.00 min
Column: ACQUITY UPLC BEH C18,
1.7 mm, 2.1 x 50 mm
Column temp.: 40 °C
Mobile phase A: 10 mL of 1 M aqueous
ammonium acetate solution
and 990 mL water
Mobile phase B: 10 mL of 1 M aqueous
ammonium acetate solution
and 990 mL methanol
Flow rate: 0.5 mL/min
Injection volume: 10.0 µl
Mobile phase gradient is detailed in Table 1.
MS conditions
MS system: SQ Detector 2
Ionization mode: ESI positive
Capillary voltage: 3.0 kV
Source temp.: 150 °C
Desolvation temp.: 350 °C
Desolvation gas: 650 L/hr
Cone gas: 20 L/hr
Acquisition: Selected Ion Recording (SIR)
Figure 1. PAAs SIR method. 34 compounds covered over 31 channels (including 3 isomer pairs).

3The Analysis of Primary Aromatic Amines in Ink Using the ACQUITY UPLC H-Class System with the SQ Detector 2 and MassLynx Software
PAA number
Primary Aromatic Amines (PAAs) CAS Number m/zRetention
time (minutes)
Cone Voltage
(V)
1 Aniline 62-53-3 94 2.17 40
2 o-Toluidine 95-53-4 109 3.80 40
3 1,3-Phenylenediamine 108-45-2 109 0.62 40
4 1,4-Phenylenediamine 106-50-3 109 0.41 43
5 2,4-Dimethylaniline 95-68-1 122 5.58 43
6 2,6-Dimethylaniline 87-62-7 122 5.33 43
7 2,4-Toluenediamine 95-80-7 123 1.64 40
8 2,6-Toluenediamine 823-40-5 123 0.85 40
9 o-Anisidine 90-04-0 124 3.74 45
10 4-Chloroaniline 106-47-8 128 4.6 40
11 2,4,5-Trimethylaniline 137-17-7 136 7.06 40
12 2-Methoxy-5-methylaniline 120-71-8 138 5.36 40
13 4-Methoxy-m-phenylenediamine 615-05-4 139 1.51 36
14 2-Naphtylamine 91-59-8 144 6.18 40
15 3-Amino-4-methylbenzamide 19406-86-1 151 2.19 35
16 3-Chloro-4-methoxyaniline 5345-54-0 158 4.00 40
17 5-Chloro-2-methoxyaniline 95-03-4 158 6.06 40
18 1,5-Diaminonaphtalene 2243-62-1 159 2.52 40
19 2-Methoxy-4-nitroaniline 97-52-9 169 4.37 30
20 4-Aminobiphenyl 92-67-1 170 7.57 43
21 2-Aminobiphenyl 90-41-5 170 7.71 50
22 Benzidine 92-87-5 185 4.01 43
23 4-Chloro-2,5-dimethoxyaniline 6358-64-1 188 5.79 40
24 4-Aminoazobenzol 60-09-3 198 7.84 30
25 4,4'-Methylenedianiline 101-77-9 199 5.64 43
26 4,4'-Diaminodiphenylether 101-80-4 201 4.36 45
27 3,3'-Dimethylbenzidine 119-93-7 213 6.01 43
28 4,4'-Thioaniline 139-65-1 217 6.29 43
29 o-Aminoazotoluene 97-56-3 226 8.28 43
30 4,4'-Diamino-3,3'-dimethylbiphenylmethane 838-88-0 227 7.39 40
31 3-Amino-p-anisanilide 120-35-4 243 6.06 40
32 o-Dianisidine 119-90-4 245 6.00 45
33 3,3'-Dichlorobenzidine 91-94-1 253 7.76 45
34 4,4'-Diamino-3,3'-dichlorobiphenylmethane 101-14-4 267 7.90 60
Table 2. PAAs, associated CAS number, m/z, expected retention times, and cone voltages.

4The Analysis of Primary Aromatic Amines in Ink Using the ACQUITY UPLC H-Class System with the SQ Detector 2 and MassLynx Software
Instrument control, data acquisition, and result processing
MassLynx Software v.4.1 was used to control the ACQUITY UPLC H-Class and the SQ Detector 2
and also for data acquisition. Data quantitation was achieved using TargetLynx™ Application Manager.
The advantages of mass spectral detection over core detectors
Many gains can be accomplished using an ACQUITY UPLC System for chromatographic separation,
due to the reduced column particle size (sub-2 µm), which results in improvements in speed and
peak capacity, with superior sensitivity and resolution efficiently achievable over HPLC analysis.
During method development, considerations need to be given to the appropriate detector to use in order
to meet the analytical requirements. The use of mass spectral detection over core detectors (e.g. UV or
fluorescence) offers advantages in areas such as sensitivity and selectivity, especially where complex matrices
are present. Matrix effects can be greatly reduced by using mass spectral detection over DAD (UV) detection
and this can be demonstrated by considering many of the PAAs detailed within this application. Examples can
be seen considering the PAAs, 2-Aminobiphenyl and 3,3'-Dichlorobenzidine. When using the current UPLC
conditions the two compounds are not completely resolved giving retention times of 7.71 and 7.76 minutes
respectively. Using mass spectral detection, the resulting efficient selectivity is illustrated in Figure 2.
Figure 2. Extracted ion chromatograms for 2-Biphenylamine and 3,3'-Dichlorobenzidine in fortified ink (containing 4.6 µg/mL PAAs).
2-Aminobiphenyl
3,3'-Dichlorobenzidine
(4-Aminobiphenyl)
m/z
m/z 170
253

5The Analysis of Primary Aromatic Amines in Ink Using the ACQUITY UPLC H-Class System with the SQ Detector 2 and MassLynx Software
a – Individual 2 ppm solvent standards
2-AminobiphenylUV 295 nm
2-AminobiphenylUV 295 nm
3,3'-DichlorobenzidineUV 284 nm
3,3'-DichlorobenzidineUV 284 nm
b – Mixed 1 ppm solvent standard
In this example when using UV detection due to the UV absorbing nature of the solvents used, the ink
matrix, and other PAAs present this level of selectivity is very hard to achieve. This reduced selectivity can
be demonstrated by again considering the PAAs, 2-Aminobiphenyl and 3,3'-Dichlorobenzidine in solvent
standards. When considering individual solvent standards for 2-Aminobiphenyl and 3,3'-Dichlorobenzidine,
maximum UV absorbance can be found at 295 and 284 nm respectively. When comparing individual solvent
standards against mixed solvent standards, the reduction in selectivity is demonstrated in Figures 3a and 3b,
which could potentially lead to misidentification, poor integration, and false positive results.
Improvements in selectivity in this example could only be made by changing the chromatographic separation
by altering the UPLC conditions to reducing the solvent gradient, which would result in longer run times and
associated increases in solvent usage.
Figure 3. a) UV chromatograms for 2-Aminobiphenyl and 3,3'-Dichlorobenzidine in individual solvent standards; b) UV chromatograms for 2-Aminobiphenyl and 3,3'-Dichlorobenzidine in a mixed solvent standard.

6The Analysis of Primary Aromatic Amines in Ink Using the ACQUITY UPLC H-Class System with the SQ Detector 2 and MassLynx Software
R E SU LT S A N D D IS C U S S IO N
The analysis of 34 PAAs was achieved using Waters SQ Detector 2 with an electrospray ionization (ESI) source,
coupled to an ACQUITY UPLC H-Class System in SIR mode.
Optimum UPLC and SIR conditions were developed, with the elution of all compounds within a 10-minute run.
Mixed calibration standards were prepared and analyzed for all the PAAs considered. The TargetLynx Quantify
results for aniline are shown in Figure 4, and the SIR chromatograms for each PAA are shown in Figure 5.
Figure 4. TargetLynx Quantify results browser showing the calibration quantitation results, calibration curve, and example SIR chromatogram for aniline.
7The Analysis of Primary Aromatic Amines in Ink Using the ACQUITY UPLC H-Class System with the SQ Detector 2 and MassLynx Software
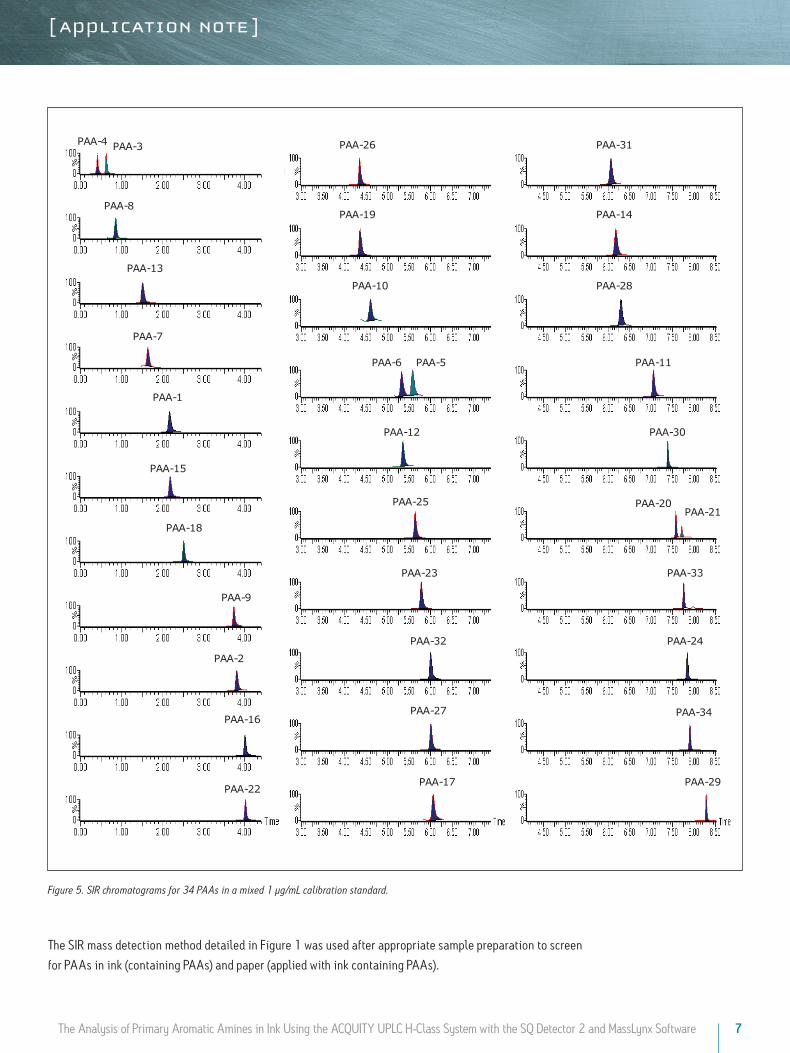
Figure 5. SIR chromatograms for 34 PAAs in a mixed 1 µg/mL calibration standard.
The SIR mass detection method detailed in Figure 1 was used after appropriate sample preparation to screen
for PAAs in ink (containing PAAs) and paper (applied with ink containing PAAs).
PAA-1
PAA-4 PAA-3
PAA-8
PAA-13
PAA-7
PAA-15
PAA-19
PAA-26
PAA-18
PAA-9
PAA-16
PAA-2
PAA-22
PAA-5PAA-6
PAA-25
PAA-23
PAA-12
PAA-32
PAA-27
PAA-17
PAA-10
PAA-31
PAA-21PAA-20
PAA-24
PAA-34
PAA-29
PAA-14
PAA-28
PAA-30
PAA-11
PAA-33

8The Analysis of Primary Aromatic Amines in Ink Using the ACQUITY UPLC H-Class System with the SQ Detector 2 and MassLynx Software
Ink analysis
Neat ink diluted 1:100 with 5% methanol/95% water was fortified at various levels with selected PAAs,
and analyzed without any further cleanup or concentration steps. The results obtained are detailed in Table 3.
Amine SampleReplicate injection results (µg/mL) Average recovery
(blank corrected) %
RSD (%)1 2 3
Aniline
Ink blank 0.0031 – – – –
Ink 0.0220 µg/mL 0.0243 0.0229 0.0238 93.5 3.4
Ink 0.135 µg/mL 0.139 0.132 0.131 97.1 3.4
Ink 4.60 µg/mL 4.66 4.61 4.61 100.5 0.6
o-Toluidine
Ink blank ND – – – –
Ink 0.0220 µg/mL 0.0221 0.0223 0.0220 100.6 0.7
Ink 0.135 µg/mL 0.137 0.140 0.136 102.0 1.5
Ink 4.60 µg/mL 4.62 4.53 4.56 99.3 1.0
2,4-Dimethylaniline
Ink blank ND – – – –
Ink 0.0220 µg/mL 0.0184 0.0190 0.0184 84.5 1.9
Ink 0.135 µg/mL 0.134 0.135 0.131 98.6 1.6
Ink 4.60 µg/mL 4.60 4.58 4.60 99.8 0.3
2,6-Dimethylaniline
Ink blank ND – – – –
Ink 0.0220 µg/mL 0.0210 0.0174 0.0208 89.7 10.3
Ink 0.135 µg/mL 0.134 0.128 0.136 98.1 3.3
Ink 4.60 µg/mL 4.55 4.46 4.62 98.8 1.7
o-Anisidine
Ink blank ND – – – –
Ink 0.0220 µg/mL 0.0207 0.0198 0.0213 93.6 3.7
Ink 0.135 µg/mL 0.144 0.140 0.139 104.4 1.7
Ink 4.60 µg/mL 4.38 4.57 4.49 97.4 2.1
4-Chloroaniline
Ink blank 0.0074 – – – –
Ink 0.0220 µg/mL 0.0277 0.0243 0.0269 85.8 9.6
Ink 0.135 µg/mL 0.137 0.134 0.134 94.4 1.4
Ink 4.60 µg/mL 4.66 4.54 4.58 99.7 1.3
2,4,5-Trimethlaniline
Ink blank ND – – – –
Ink 0.0220 µg/mL 0.0204 0.0198 0.0192 90.0 3.0
Ink 0.135 µg/mL 0.133 0.138 0.135 100.2 1.9
Ink 4.60 µg/mL 4.70 4.84 4.74 103.5 1.9
3-Chloro-4- methoxyaniline
Ink blank ND – – – –
Ink 0.0220 µg/mL 0.0189 0.0184 0.0177 83.3 3.3
Ink 0.135 µg/mL 0.127 0.135 0.131 96.8 2.9
Ink 4.60 µg/mL 4.63 4.62 4.78 101.7 1.9
5-Chloro-2-methoxyaniline
Ink blank ND – – – –
Ink 0.0220 µg/mL 0.0227 0.0204 0.0188 93.8 9.5
Ink 0.135 µg/mL 0.143 0.148 0.143 107.3 1.9
Ink 4.60 µg/mL 4.67 4.55 4.57 99.9 1.5
2-Aminobiphenyl
Ink blank ND – – – –
Ink 0.0220 µg/mL 0.0269 0.0227 0.0218 108.2 11.4
Ink 0.135 µg/mL 0.144 0.140 0.145 106.1 1.9
Ink 4.60 µg/mL 4.57 4.52 4.54 98.8 0.6
4-Chloro-2,5-
dimethoxyaniline
Ink blank ND – – – –
Ink 0.0220 µg/mL 0.0184 0.0197 0.0184 85.6 4.0
Ink 0.135 µg/mL 0.122 0.124 0.122 90.9 1.2
Ink 4.60 µg/mL 4.30 4.34 4.29 93.7 0.7
Table 3. Ink fortified with PAAs recovery data. Results quantified against mixed calibration standards.

9The Analysis of Primary Aromatic Amines in Ink Using the ACQUITY UPLC H-Class System with the SQ Detector 2 and MassLynx Software
The efficient recoveries obtained (ranging between 83% to 108%) demonstrated that minimal signal
enhancement/suppression was observed using ESI ionization for the analysis of PAAs within an ink matrix.
Paper analysis
Within the food packaging industry great efforts are made to reduce food contamination in order to guarantee
consumer safety and comply with regulations. The design of the packaging and the products used ideally afford
minimal leaching and hence reduce potential contamination of the food product. Such packaging leachables
have a large number of potential sources including PAAs from the ink used within the packaging.
In order to consider the EU regulations with regard to the release of total PAAs from food contact material,
a cold water paper extraction based on the European standard (EN 646:1993) was used.
Three pieces of paper (10 cm x 10 cm) were taken, one kept as a blank and two applied with 100 µL ink previously
fortified with selected PAAs. The paper was left to dry and then cut up and extracted in sealed containers with
100 mL of water and left for over 24 hours prior to analysis. The results obtained are detailed in Table 4.
Amine SampleReplicate injection results (µg/mL) Average µg aniline
equivalents /kg of food*
Leachability (%)
RSD (%)1 2 3
Aniline
A ND – – – – –B 0.0898 – – – 89.8 –C ND – – – – –D 0.00863 0.00970 0.00983 2.8 9.4 7.0E 0.0129 0.0144 0.0149 4.2 28.1 7.6
o-Toluidine
A ND – – – – –B 0.0985 – – – 98.5 –C ND – – – – –D 0.0110 0.00965 0.0102 2.7 10.3 6.7E 0.00896 0.00925 0.00774 2.3 17.3 9.3
2,4-Dimethylaniline
A ND – – – – –B 0.0908 – – – 90.8 –C ND – – – – –D 0.0177 0.0189 0.0177 4.2 18.1 3.7E 0.0120 0.0139 0.0113 2.9 24.8 11.0
o-Anisidine
A ND – – – – –B 0.101 – – – 101.2 –C ND – – – – –D 0.0391 0.379 0.346 57.8 37.2 6.3E 0.217 0.197 0.190 45.6 40.2 7.0
3-Chloro-4-methoxyaniline
A ND – – – – –B 0.104 – – – 103.7 –C ND – – – – –D 0.0911 0.0884 0.0898 15.9 89.8 1.5E 0.0405 0.0398 0.0405 7.1 80.5 0.9
5-Chloro-2-methoxyaniline
A ND – – – – –B 0.103 – – – 103.2 –C ND – – – – –D 0.0851 0.0870 0.0888 15.4 87.0 2.2E 0.0414 0.0424 0.0438 7.5 85.1 2.9
Table 4. Leachability results for paper previously applied with ink containing selected PAAs.
A = water blank, B = water containing 0.1 µg/mL PAAs, C = paper blank with no ink, D = paper applied with ink containing 10 µg PAAs, E = paper applied with ink containing 5 µg PAAs. *Calculated using a conventional surface area/volume conversion factor of 6 dm2/kg as established in the EU commission Directive 2007/19/EC.
Waters Corporation 34 Maple Street Milford, MA 01757 U.S.A. T: 1 508 478 2000 F: 1 508 872 1990 www.waters.com
Waters, ACQUITY UPLC, UPLC, and ACQUITY are registered trademarks of Waters Corporation. MassLynx, TargetLynx, and T he Science of What’s Possible are trademarks of Waters Corporation. All other trademarks are the property of their respective owners.
©2011 Waters Corporation. Produced in the U.S.A. December 2011 720004151en AG-PDF
References
1. Benigni R, Passerini L. Carcinogenicity of the aromatic amines: from structure-activity relationships to mechanisms of action and risk assessment. Mutation Research. 511: 191-206, 2002.
2. Anirban M P, Cote R J. Molecular Pathogenesis and Diagnosis of Bladder Cancer. Annual Review of Pathology. 4: 501-506, 2009.
3. Ward E, Carpenter A, Markowitz S, et al. Excess Cancers in Workers Exposed to Ortho-Toluidine and Aniline. National Cancer Institute. 83(7): 501-506, 1991.
4. Akyuz M, Ata S. Determination of aromatic amines in hair dye and henna samples by ion-pair extraction and gas chromatography-mass spectrometry. J Pharm Biomed Anal. 47: 68, 2008.
5. Ekladius L, King H K. A colorimetric method for the determination of aliphatic amines in the presence of ammonia. Chromatography. A. 1129(1), 2006. Epub 2006 Jul 14.
6. Aznar M, Canallas E, Nerin J. Quantitative determination of 22 primary aromatic amines by cation-exchange solid-phase extraction and liquid chromatography-mass spectrometry. J Chromatography A. 1216: 5176-5181, 2009.
7. Zhang Q, Wang C, et al. Determination of aromatic amines from azo dyes reduction by liquid-phase sorbent trapping and thermal desorption-gas chromatography-mass spectrometry. J Sep Sci. 32: 2434-2441, 2009.
Sample A results demonstrate that there were no residual PAAs in
the water used or as background within the system. Sample B shows
the efficacy of the extraction method used, as demonstrated by the
high leachability recovery values observed (90% to 104%) when
PAAs were added to the water with no paper present. The results
most relevant to the food packaging industry were obtained for
Samples C and D, which revealed the different extents to which the
selected PAAs were being absorbed and not leached from paper.
CO N C LU S IO NS■■ A fast, robust, and sensitive method has been developed
for the analysis of PAAs in ink.
■■ SQ Detector 2 linked to the ACQUITY UPLC H-Class System
offers improved confidence in identification and quantification.
■■ Business benefits include increased sample throughput
and a reduction of solvent usage with no time-consuming
derivatization or pre-concentration stages and reduced
run times.
■■ The ACQUITY UPLC H-Class System, a quarternary system
based on UPLC, offers the best in chromatographic resolution
and sensitivity.
■■ The SQ Detector 2 offers cost-effective, reliable
mass confirmation.
![OC 21.ppt [Read-Only] - Norfolk State Universitycset.nsu.edu/chm322/notes/oc_21.pdfBasicity-Aromatic Amines u Heterocyclic aromatic amines are weaker bases than heterocyclic aliphatic](https://img.pdfslide.net/doc/110x75/5eb6621c82ee5e224b67cb4e/oc-21ppt-read-only-norfolk-state-basicity-aromatic-amines-u-heterocyclic-aromatic.jpg)